Demands, resources, and work ability: A cross-national examination of health care workers
18
This article was downloaded by: [Wayne State University], [Alyssa McGonagle] On: 26 July 2013, At: 11:49 Publisher: Routledge Informa Ltd Registered in England and Wales Registered Number: 1072954 Registered office: Mortimer House, 37-41 Mortimer Street, London W1T 3JH, UK European Journal of Work and Organizational Psychology Publication details, including instructions for authors and subscription information: http://www.tandfonline.com/loi/pewo20 Demands, resources, and work ability: A cross-national examination of health care workers Alyssa K. McGonagle a , Janet L. Barnes-Farrell b , Lee Di Milia c , Frida M. Fischer d , Barbara B. B. Hobbs e , Irena Iskra-Golec f , Ljiljana Kaliterna g & Lawrence Smith h a Department of Psychology , Wayne State University , Detroit , MI , US b Department of Psychology, University of Connecticut , Storrs , CT , US c School of Business and Law, Institute for Health and Social Science Research, Central Queensland University , Rockhampton , QLD , Australia d School of Public Health, University of Sao Paulo , Sao Paulo , Brazil e South Dakota State University , Rapid City , SD , US f Institute of Applied Psychology, Jagiellonian University , Krakow , Poland g Ivo Pilar Institute of Social Sciences , Zagreb , Croatia h Institute of Psychological Sciences, University of Leeds , Leeds , UK Published online: 26 Jul 2013. To cite this article: European Journal of Work and Organizational Psychology (2013): Demands, resources, and work ability: A cross-national examination of health care workers, European Journal of Work and Organizational Psychology To link to this article: http://dx.doi.org/10.1080/1359432X.2013.819158 PLEASE SCROLL DOWN FOR ARTICLE Taylor & Francis makes every effort to ensure the accuracy of all the information (the “Content”) contained in the publications on our platform. However, Taylor & Francis, our agents, and our licensors make no representations or warranties whatsoever as to the accuracy, completeness, or suitability for any purpose of the Content. Any opinions and views expressed in this publication are the opinions and views of the authors, and are not the views of or endorsed by Taylor & Francis. The accuracy of the Content should not be relied upon and should be independently verified with primary sources of information. Taylor and Francis shall not be liable for any losses, actions, claims, proceedings, demands, costs, expenses, damages, and other liabilities whatsoever or howsoever caused arising directly or indirectly in connection with, in relation to or arising out of the use of the Content. This article may be used for research, teaching, and private study purposes. Any substantial or systematic reproduction, redistribution, reselling, loan, sub-licensing, systematic supply, or distribution in any form to anyone is expressly forbidden. Terms & Conditions of access and use can be found at http:// www.tandfonline.com/page/terms-and-conditions
Transcript of Demands, resources, and work ability: A cross-national examination of health care workers
This article was downloaded by: [Wayne State University], [Alyssa McGonagle]On: 26 July 2013, At: 11:49Publisher: RoutledgeInforma Ltd Registered in England and Wales Registered Number: 1072954 Registered office: Mortimer House,37-41 Mortimer Street, London W1T 3JH, UK
European Journal of Work and OrganizationalPsychologyPublication details, including instructions for authors and subscription information:http://www.tandfonline.com/loi/pewo20
Demands, resources, and work ability: A cross-nationalexamination of health care workersAlyssa K. McGonagle a , Janet L. Barnes-Farrell b , Lee Di Milia c , Frida M. Fischer d ,Barbara B. B. Hobbs e , Irena Iskra-Golec f , Ljiljana Kaliterna g & Lawrence Smith ha Department of Psychology , Wayne State University , Detroit , MI , USb Department of Psychology, University of Connecticut , Storrs , CT , USc School of Business and Law, Institute for Health and Social Science Research, CentralQueensland University , Rockhampton , QLD , Australiad School of Public Health, University of Sao Paulo , Sao Paulo , Brazile South Dakota State University , Rapid City , SD , USf Institute of Applied Psychology, Jagiellonian University , Krakow , Polandg Ivo Pilar Institute of Social Sciences , Zagreb , Croatiah Institute of Psychological Sciences, University of Leeds , Leeds , UKPublished online: 26 Jul 2013.
To cite this article: European Journal of Work and Organizational Psychology (2013): Demands, resources, and work ability: Across-national examination of health care workers, European Journal of Work and Organizational Psychology
To link to this article: http://dx.doi.org/10.1080/1359432X.2013.819158
PLEASE SCROLL DOWN FOR ARTICLE
Taylor & Francis makes every effort to ensure the accuracy of all the information (the “Content”) containedin the publications on our platform. However, Taylor & Francis, our agents, and our licensors make norepresentations or warranties whatsoever as to the accuracy, completeness, or suitability for any purpose of theContent. Any opinions and views expressed in this publication are the opinions and views of the authors, andare not the views of or endorsed by Taylor & Francis. The accuracy of the Content should not be relied upon andshould be independently verified with primary sources of information. Taylor and Francis shall not be liable forany losses, actions, claims, proceedings, demands, costs, expenses, damages, and other liabilities whatsoeveror howsoever caused arising directly or indirectly in connection with, in relation to or arising out of the use ofthe Content.
This article may be used for research, teaching, and private study purposes. Any substantial or systematicreproduction, redistribution, reselling, loan, sub-licensing, systematic supply, or distribution in anyform to anyone is expressly forbidden. Terms & Conditions of access and use can be found at http://www.tandfonline.com/page/terms-and-conditions

Demands, resources, and work ability: A cross-national examination ofhealth care workers
Alyssa K. McGonagle1, Janet L. Barnes-Farrell2, Lee Di Milia3, Frida M. Fischer4,Barbara B. B. Hobbs5, Irena Iskra-Golec6, Ljiljana Kaliterna7, and Lawrence Smith8
1Department of Psychology, Wayne State University, Detroit, MI, US2Department of Psychology, University of Connecticut, Storrs, CT, US3School of Business and Law, Institute for Health and Social Science Research, Central Queensland University,Rockhampton, QLD, Australia4School of Public Health, University of Sao Paulo, Sao Paulo, Brazil5South Dakota State University, Rapid City, SD, US6Institute of Applied Psychology, Jagiellonian University, Krakow, Poland7Ivo Pilar Institute of Social Sciences, Zagreb, Croatia8Institute of Psychological Sciences, University of Leeds, Leeds, UK
Understanding work ability, with the goal of promoting it, is important for individuals as well as organizations. It is especiallyimportant to study work ability in health care workers, who face many work-related challenges that may threaten work ability.We studied various job demands, job resources, and interactions of demands and resources relating to work ability using theJob Demands–Resources model as a framework. Acute care health care workers from six nations (US, Australia, UK, Brazil,Croatia, and Poland) completed a survey. Role demands related to work ability in the Australia sample only, and supervisorsupport related to work ability in the Australia sample only. Yet, high levels of supervisor support significantly moderated(buffered) negative relationships between physical demands and work ability in the US sample, along with negative relation-ships between role demands and work ability in both the Croatia and UK samples. Skill discretion related to work ability inevery nation sample, and therefore appears to be particularly important to work ability perceptions. In addition, skill discretionmoderated (buffered) a negative relationship between role demands and work ability in the Australia sample. We thereforerecommend that interventions to help preserve or improve work ability target this important job resource.
Keywords: Work ability; Health care workers; Job resources; Job demands.
Work ability refers to a worker’s capacity to sustainemployment in his or her current job, given thedemands of the job and his or her individual resources(Ilmarinen, Gould, Järvikoski, & Järvisalo, 2008;Ilmarinen et al., 1991a). The concept of work abilityis an important one for individuals as well as organiza-tions. Understanding work ability, with the goal ofpromoting it, is critical as individuals seek to remainemployed past expected or desired retirement ages andorganizations seek to retain valued workers. This studyfurthers our understanding of work ability by testing theapplication of a theoretical model (the Job Demands–Resources or JD-R model) to help understand factorsthat predict work ability and looking for cross-national
differences in the proposed relationships using healthcare worker samples from six nations.
The Finnish Institute of Occupational Health broughtwork ability to the Occupational Health literature with alarge-scale longitudinal study of factors that led to disabil-ity in ageing municipal workers (see Ilmarinen et al.,1991a, 1991b). Work ability was empirically derived; itscomponents predicted subsequent receipt of disability pen-sion. High levels of work ability are associated with posi-tive outcomes, including high quality of work, jobsatisfaction, productivity, level of activity, and life satisfac-tion (Seitsamo & Ilmarinen, 1997; Tuomi, Huuhtanen,Nykyri, & Ilmarinen, 2001), general subjective well-being (Sjögren-Rönkä, Ojanen, Esko, Mustalampi, &Mälkiä, 2002), quality of sleep (Fischer et al., 2006), and
Correspondence should be addressed to Alyssa McGonagle, Department of Psychology, Wayne State University, 5057 Woodward Ave., 7th Floor,Detroit, MI, 48202. E-mail: [email protected]
European Journal of Work and Organizational Psychology, 2013
http://dx.doi.org/10.1080/1359432X.2013.819158
© 2013 Taylor & Francis
Dow
nloa
ded
by [
Way
ne S
tate
Uni
vers
ity],
[A
lyss
a M
cGon
agle
] at
11:
49 2
6 Ju
ly 2
013
an “active and meaningful third age”, an independent andactive 10–20 years after retirement (Tuomi, Ilmarinen,Jahkola, Katajarinne, & Tulkki, 1998).
On the other hand, low levels of work ability predictearly exit from the workforce. In addition to disabilitypension (Ilmarinen et al., 1991b), low levels of workability are associated with thoughts of retirement andturnover intentions (Camerino et al., 2006; Hopsu,Leppänen, Ranta, & Louhevaara, 2005), and sick leave(Ahlstron, Grimby-Eckman, Hagberg, & Dellve, 2010).
Work ability is particularly important to study in acutecare health care workers due to a health care labourshortage in the US (e.g., Goodin, 2002; NationalCenter, 2013) and around the world (Global HealthWorkforce Alliance, 2010). Acute care health care work-ers also face workplace challenges that may threatenwork ability, including environmental concerns (radia-tion, infectious exposure), emotional demands (e.g.,dealing with sick patients and their families), and physi-cal demands (e.g., lifting patients, standing for longperiods of time).
THE CURRENT STUDY
In this study, we position work ability as an indication ofemployee well-being and examine job demands and jobresources as predicting perceived work ability in samplesof acute care health care workers. We take an integratedapproach, testing multiple factors simultaneously usingthe JD-R model (Bakker, Demerouti, & Euwema, 2005;Demerouti, Bakker, Nachreiner, & Schaufeli, 2001) as aframework to understand factors affecting the outcomeof work ability, similar to how the JD-R model has beenused to understand factors predicting burnout. Thisapproach is novel, in that the existing work abilityresearch base is largely fragmented and has not yetbeen examined using psychological theory. The currentstudy is theoretically grounded and contributes to aninductive approach to understanding work ability. Thefirst main contribution of this study is, therefore, testingthe viability of the JD-R model for understanding workability.
A second contribution of this study relates to itscross-national design. We test the model in samplesof health care workers from six nations, looking forevidence for stability or variability in relationships ofdemands and resources and work ability betweennation samples. Work ability has been studied inworker samples in several countries; yet these studiestypically exclude US workers, and focus on one sampleat a time (e.g., Finnish municipal workers: Ilmarinenet al., 1991a, 1991b; Dutch construction workers:Alavania, de Boer, van Duivenbooden, Frings-Dresen,& Burdorf, 2009; health care workers from theUkraine: Bobko & Barishpolets, 2002; Dutch employ-ees in several occupations: de Croon et al., 2005;Swedish workers in various occupations: Lindberg,
Vingard, Josephson, & Alfredsson, 2005; Finnishmetal industry and retail trade workers: Tuomi,Vanhala, Nykyri, & Janhonen, 2004). It is unclear asto whether relationships of variables with work abilityare stable across different national contexts. In otherwords, it may not be appropriate to assume that factorsrelating to work ability generalize between nations. Wetest this notion by employing health care worker sam-ples from six nations—the United States (US), theUnited Kingdom (UK), Australia, Poland, Croatia,and Brazil—to examine the stability of relationshipsof demands and resources and work ability betweennation samples.
THE JOB DEMANDS–RESOURCES MODEL
Work demands and personal and work-related resourcesinfluence work ability (e.g., Tuomi et al., 2001). Indeed,declines in work ability may be conceptualized as a formof strain (or, a long-term reaction to stress that manifestsas a detriment to well-being) that results from job-relateddemands that exceed workers’ resources. Because theJD-R model has been successfully used to predictanother form of strain—burnout (Demerouti et al.,2001)—it is well-suited to also predict work ability. Wetest this notion in the current study by examining jobdemands and job resources as relating to the outcomework ability, while controlling for personal health andage.
The basic premise of the JD-R model is that, whereevery occupation has particular risk factors associatedwith strains, all factors can be classified as either jobdemands or job resources. We first elaborate on jobdemands. Job demands are defined as “physical, socialor organizational aspects of a job that require sustainedphysical or mental effort and are therefore associatedwith certain physiological or psychological costs”(Demerouti et al., 2001, p. 501). Examples of jobdemands include work overload, emotional demands,physical demands, and work–home interference(Bakker et al., 2005). Demands contribute to the detri-ment of well-being and development of strain throughexhausting employees’ physical and mental resourceswhich leads to a depletion of energy (Bakker &Demerouti, 2007). Note that we do not assess the objec-tive presence of demands in this study, but rather psy-chological perceptions of such demands.
Demands of the job and working environment havebeen linked to work ability in both longitudinal studies(e.g., Ilmarinen et al., 1991b; Tuomi, Ilmarinen,Martikainen, Aalto, & Klockars, 1997; Tuomi,Ilmarinen, Seitsamo, et al., 1997) and cross-sectionalstudies (e.g., Tuomi et al., 2004). Types of job demandspreviously examined in relation to work ability include:physical work demands (Ilmarinen, Tuomi, & Seitsamo,2005; Lindberg et al., 2005; Tuomi et al., 2001, 2004),mental work demands (Tuomi et al., 2004),
2 MCGONAGLE ET AL.
Dow
nloa
ded
by [
Way
ne S
tate
Uni
vers
ity],
[A
lyss
a M
cGon
agle
] at
11:
49 2
6 Ju
ly 2
013

dissatisfaction with physical working conditions (Estryn-Behar et al., 2005; Fischer et al., 2006), and work envir-onment demands (i.e., concerns about noise, radiation,etc.; Barnes-Farrell et al., 2004; Fischer et al., 2006;Molinie, 2005).
We identified four specific types of perceiveddemands relevant to study in acute care health careworkers: role demands, work environment demands,emotional demands, and physical demands. Each ofthese perceived demands is a workplace stressor(Quick, Quick, Nelson, & Hurrell, 1997), and may leadto strains. In accordance with the JD-R model, each ofthese demands may serve to exhaust employees’ physi-cal and mental resources (Bakker & Demerouti, 2007).We now discuss our selection of each of these specificdemands.
Role demands include lacking time to complete work,having an excessive amount of work to do (i.e., roleoverload; Jones, Flynn, & Kelloway, 1995) and dealingwith conflicting demands from others (i.e., role conflict;Kahn, Wolfe, Quinn, Snoek, & Rosenthal, 1964).According to the JD-R model, dealing with role demandswill exhaust health care workers’ energy resources andtherefore be associated with lower levels of work ability.Research supports the association of role demands withstrain in health care workers: Piko (2006) found that roledemands contributed to burnout (emotional exhaustionand depersonalization) in a sample of Hungarian nurses.Perceived role demands are likely increasingly proble-matic for health care workers, as worker shortagesincrease worldwide and workers must tend to morepatients at once.
Work environment demands refer to concerns aboutair quality, radiation, infectious exposures, and noise. Ashealth care workers often face these types of challenges,it is important to understand how they affect work abil-ity. Similar to other workplace stressors, dealing withwork environment demands is stressful, uses workers’resources to cope, and may result in strain. Prior researchhas highlighted the importance of work environmentdemands for health care workers (Barnes-Farrell et al.,2004; Fischer et al., 2006).
Emotional demands have not previously been studiedas relating to work ability. This is a critical gap in theliterature, given that emotional demands are common inhealth care work (i.e., de Jong, Mulder, & Nijhuis, 1999;McVicar, 2003; Peeters & LeBlanc, 2001). Emotionaldemands may include a nurse dealing with his or herown sadness when a patient’s health declines, and aworker facing frustration, anger, or sadness from apatient or caregiver due to health declines. We expectthat emotional demands will negatively relate to per-ceived work ability. We expect that, similar to otherdemands, high levels of perceived emotional demandswill drain or exhaust workers’ emotional resources andwill be associated with strain and lower levels of workability.
Physical demands are common in many health carejobs, which require workers to stand for long periods oftime and lift patients, for example (e.g., McVicar, 2003).Workers may feel less confident about their abilities tocontinue working in jobs with high levels of physicaldemands. Physical demand perceptions, like other stres-sors, also exhaust workers’ energy resources and will bepositively associated with strain.
Hypothesis 1a: Perceived role demands will benegatively related to perceived work ability.
Hypothesis 1b: Perceived work environmentdemands will be negatively related to perceivedwork ability.
Hypothesis 1c: Perceived emotional demands willbe negatively related to perceived work ability.
Hypothesis 1d: Perceived physical demands willbe negatively related to perceived work ability.
According to the JD-R model, job resources contri-bute to motivation, and are defined as “those physical,psychological, social or organizational aspects of thejob that are functional in achieving work goals, reducejob demands and the associated physiological and psy-chological costs, or stimulate personal growth or devel-opment” (Demerouti et al., 2001, p. 501). Job resourcescontribute to motivation either though fostering learningand development and skill growth (intrinsic motiva-tional factors), or due to the fact that they are instru-mental in helping employees achieve work goals(extrinsic motivational factors; Bakker & Demerouti,2007). Previous studies link job resources with workability, including developmental opportunities at work(Ilmarinen et al., 2005; Tuomi et al., 2001) and super-visory support (Estryn-Behar et al., 2005; Ilmarinenet al., 2005; Tuomi et al., 2004). Note that, althoughit is feasible to conceptualize work ability as a personalresource (one that allows workers to continue working),in our study testing the Job Demands–Resources modelas a framework for studying work ability we position itas an indicator of employee well-being (similar to burn-out) and an outcome of perceived job demands andresources.
We identified two particular resources that align withthe motivational processes outlined by Bakker andDemerouti (2007): skill discretion and supervisor sup-port. Skill discretion (Karasek, 1979), which refers to thedegree to which a job allows creativity and personaldevelopment and contains variety in tasks and low levelsof repetitiveness, directly relates to intrinsic motivationalprocesses (Bakker & Demerouti, 2007) through fosteringskill development and growth. We therefore expect skilldiscretion to relate to higher levels of work ability. Socialsupport is another important resource for health careworkers. We focus on instrumental support, or supportfor getting work tasks done. This directly relates to the
DEMANDS, RESOURCES, AND WORK ABILITY 3
Dow
nloa
ded
by [
Way
ne S
tate
Uni
vers
ity],
[A
lyss
a M
cGon
agle
] at
11:
49 2
6 Ju
ly 2
013

extrinsic motivational factor identified by Bakker andDemerouti (2007): instrumental support helps workersachieve work-related goals. We therefore have reasonto expect that higher levels of supervisor support willbe associated with higher levels of work ability.
Hypothesis 2a: Supervisor support will be posi-tively related to work ability.
Hypothesis 2b: Skill discretion will be positivelyrelated to work ability.
Interaction effects
In addition to main effects of demands and resources, theJD-R model states that demands may not be negative intheir own right, but will turn into stressors and createstrains when resources are inadequate (Bakker &Demerouti, 2007). This premise is consistent with atransactional or appraisal-based model of stress(Lazarus & Folkman, 1984), which emphasizes the roleof resources in the stressor–strain process. Specifically,Lazarus and Folkman (1984) posit that stress resultswhen an event is perceived as a potential threat (primaryappraisal) and one’s resources are not adequate to miti-gate the threat (secondary appraisal). On the contrary,when resources are available to mitigate the threat, strainis prevented.
We therefore propose that interactions of perceiveddemands and (lack of) resources will predict (lowerlevels of) work ability, a form of strain. We expectthat negative relationships between demands andresources will be stronger at lower levels of resources,and weaker at higher levels of resources (when avail-able resources can prevent demands from leading tostrains). In other words, we expect resources to buffernegative relationships between demands and work abil-ity. Yet, we do not expect to see a uniform bufferingeffect of resources on all relationships betweendemands and work ability. Instead, based on the find-ings of Van der Doef and Maes (1999) that demandsshould be matched with aspects of control that canassist with that particular demand, and the findings ofde Jong and Dorman (2006) that demands, resources,and strains be matched, we first propose that supervisorinstrumental support (help getting work done) will buf-fer negative relationships between work ability and (1)perceived role demands and (2) perceived physicaldemands. Conceptually, when an individual knowsthat support is available and that he or she may receivehelp with dealing with role demands and physicaldemands, he or she will likely not experience as muchstrain as an individual who feels an absence of supportin the face of such demands. Theoretically, in line withLazarus and Folkman’s (1984) appraisal model ofstress, perceived availability of support will alter astressful appraisal, such that the demand is not
appraised as a stressor due to the presence of thisavailable helpful resource (and will not result instrains). We posit that this interaction will be observedwith role demands and physical demands, as the impactof these types of demands may be alleviated withinstrumental support. Yet, on the other hand, instrumen-tal supervisor support is not expected to buffer theimpact of either emotional demands (stress related towhich may be alleviated by socioemotional support butnot instrumental support) or work environmentdemands (the presence of which may not be alleviatedby help with getting work done).
We also proposed that skill discretion would bufferthe negative relationships between perceived roledemands and work ability. Perceptions of role demands,which include time demands, work overload, and con-flicting demands from others, may be stressful and leadto strains. Yet, in line with the Lazarus and Folkman(1984) appraisal model of stress, as a resource, skilldiscretion may serve to mitigate perceptions of stressstemming from role demands and subsequent strain,i.e., lower levels of work ability (preventing secondarystressful appraisals). Skill discretion indicates that workis nonroutine and requires a high level of skill. Skills thatare inherently required for jobs with high levels of skilldiscretion are resources that may allow individuals tomanage role demands. In addition, skill discretion indi-cates a sense of control—the ability to use one’s skills asneeded for the job. Being allowed discretion to use skillsto achieve important job priorities could feasibly miti-gate strain that comes from role demands. Therefore, weexpect workers with higher levels of skill discretion toexperience less strain (in the form of work ability decre-ments) in the presence of increasing levels of roledemands. We do not, however, expect skill discretionto mitigate possible negative effects of work environ-ment demands, emotional demands, or physical demandson work ability.
Hypothesis 3: Supervisor support will buffer nega-tive relationships between work ability and (a)perceived role demands and (b) perceived physicaldemands.
Hypothesis 4: Skill discretion will buffer the nega-tive relationships between work ability and per-ceived role demands.
Cross-national examination
In addition to hypothesizing that the preceding demandsand resources, and interactions of demands andresources, will relate to work ability, we test whetherthese relationships vary by nation sample. It is possiblethat relationships between particular demands andresources and work ability will be stronger in somenation samples than others. Therefore, we test whether
4 MCGONAGLE ET AL.
Dow
nloa
ded
by [
Way
ne S
tate
Uni
vers
ity],
[A
lyss
a M
cGon
agle
] at
11:
49 2
6 Ju
ly 2
013
relationships between demands and resources are invar-iant between nation samples. This cross-nationalresearch is exploratory. Reasons for possible differencesare speculatory in nature, but could include, for instance,where people have more of a social safety net, demandsand resources may affect their work ability more than incontexts without such a safety net (because of the per-ceived need to keep working at all costs). The presenceof patterns would necessitate research for potentialmediators.
Control variables
We identified two important variables to control for intesting relationships of demands and resources and workability. First, health is a robust predictor of work ability(e.g., Fischer et al., 2006; Ilmarinen et al., 2005; Tuomiet al., 2001), and is, arguably, part of the criterion ofperceived work ability (e.g., Tuomi et al., 1998). Yet, aswe seek to understand how demands and resourcesinfluence individuals’ perceptions of work ability (andnot work ability as assessed by a health professionalbased on burden of disease), we feel it is appropriate tocontrol for its effects. Additionally, as we seek to assessthe viability of the JD-R model for understanding workability, we need control for health, a personal resource(unaccounted for by the JD-R model) that may influenceboth how demands and work ability are perceived.Therefore, we control for personal health in all hypoth-esis testing regarding work ability. Second, because agealso likely affects both levels of work ability anddemands, we control for age in all tests of work ability.By controlling for personal health and age, we are betterable to determine unique contributions of job demandsand job resources to work ability perceptions, and there-fore have a better test of the JD-R model.
METHOD
Participants and procedure
Acute care health care workers from six nations (n =1225 total; US n = 371; Australia n = 162; Croatia n =171; Brazil n = 170; UK n = 153; Poland n = 198)voluntarily completed an anonymous survey measuringa variety of job-related issues relevant to health careworkers in 2006. Researchers in each nation obtainedethical clearance for recruiting participants and indepen-dently recruited convenience samples of health careworkers using a common survey instrument. A com-bined dataset was used for analysis. No identifyinginformation was collected from participants.
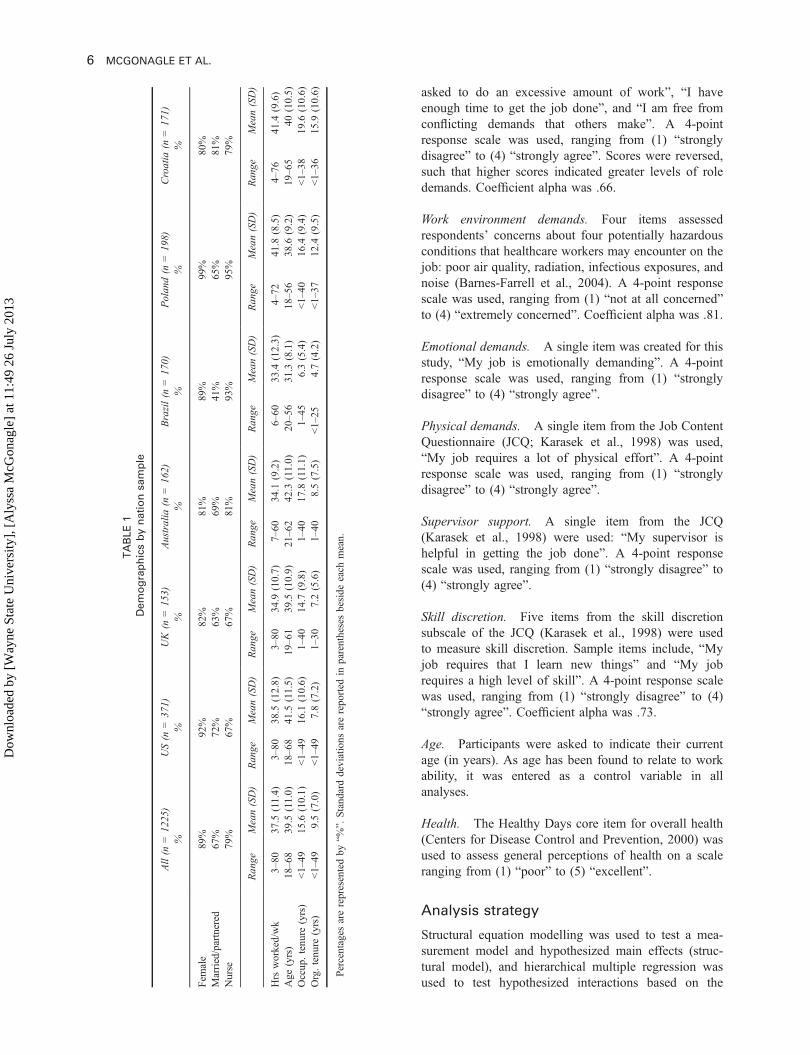
Demographic information for each nation sample ispresented in Table 1. As stated, all participants identifiedthemselves as acute care health care workers. Overall,respondents were primarily female (89%) and eithermarried or partnered (67%). The majority of respondents
were nurses or nurse aids/assistants; yet other profes-sions were included: social workers (0.3% of total sam-ple), speech pathologists (0.1%), educators or instructors(5%), administrators (1%), dentists or dental assistants(0.2%), physical therapists (1%), laboratory technicians(2%), physicians (1%), and pharmacists (0.4%). SeeTable 1 for the percentage of each sample representedby nurses: This ranged from 67% of the sample (UKsample) to 95% of the sample (Poland sample). Theaverage age of respondents was 39, and ranged from31.3 (Brazil) to 41.5 (US)
Survey translation for non-English speaking nationswas handled as follows. First, a set of the the surveyitems were translated by scholars in each country intonative languages for non-English speaking countries; thesurveys were then independently backtranslated by bilin-gual speakers in the US and any discrepancies wereresolved. Translation of a subset of survey items (roledemands and skill discretion items) were handled differ-ently: these items were translated by scholars in each ofthe non-English speaking countries, but there was nobacktranslation procedure for these items. The discre-pancy was due to the fact that the former survey itemswere included in a previous administration of the samesurvey; when the second administration of the surveyoccurred, the role demands and skill discretion itemswere added and were not subjected to backtranslationprocedures.
Measures
Work ability. Four items from the Work Ability Index(WAI; Tuomi et al., 1998) were used to assess workability. Respondents were asked to rate their currentwork ability compared to their lifetime best, on a scaleranging from (0) “cannot currently work at all” to (10)“work ability at its best”. Participants were also asked torate their current work ability with respect to (a) thephysical, (b) mental, and (c) social skills demands oftheir work. The physical and mental demands itemswere from the WAI (Tuomi et al., 1998); the social skillsitem was created for this study, in recognition of theimportant role of social interactions in the jobs of healthcare workers. A Likert-type response scale was used,ranging from (1) “very poor” to (5) “very good”. The“lifetime best” item response scale was transformed tomatch the scale of the other three items (to preventdifficulties in structural equation model convergencedue to differences in variance between items) prior toanalysis by dividing responses by two. A compositemeasure was created by taking a mean of the fouritems. Coefficient alpha, calculated using the total sam-ple was .81.
Role demands. Three items from the JCQ (Karaseket al., 1998) were used. The items were, “I am not
DEMANDS, RESOURCES, AND WORK ABILITY 5
Dow
nloa
ded
by [
Way
ne S
tate
Uni
vers
ity],
[A
lyss
a M
cGon
agle
] at
11:
49 2
6 Ju
ly 2
013
asked to do an excessive amount of work”, “I haveenough time to get the job done”, and “I am free fromconflicting demands that others make”. A 4-pointresponse scale was used, ranging from (1) “stronglydisagree” to (4) “strongly agree”. Scores were reversed,such that higher scores indicated greater levels of roledemands. Coefficient alpha was .66.
Work environment demands. Four items assessedrespondents’ concerns about four potentially hazardousconditions that healthcare workers may encounter on thejob: poor air quality, radiation, infectious exposures, andnoise (Barnes-Farrell et al., 2004). A 4-point responsescale was used, ranging from (1) “not at all concerned”to (4) “extremely concerned”. Coefficient alpha was .81.
Emotional demands. A single item was created for thisstudy, “My job is emotionally demanding”. A 4-pointresponse scale was used, ranging from (1) “stronglydisagree” to (4) “strongly agree”.
Physical demands. A single item from the Job ContentQuestionnaire (JCQ; Karasek et al., 1998) was used,“My job requires a lot of physical effort”. A 4-pointresponse scale was used, ranging from (1) “stronglydisagree” to (4) “strongly agree”.
Supervisor support. A single item from the JCQ(Karasek et al., 1998) were used: “My supervisor ishelpful in getting the job done”. A 4-point responsescale was used, ranging from (1) “strongly disagree” to(4) “strongly agree”.
Skill discretion. Five items from the skill discretionsubscale of the JCQ (Karasek et al., 1998) were usedto measure skill discretion. Sample items include, “Myjob requires that I learn new things” and “My jobrequires a high level of skill”. A 4-point response scalewas used, ranging from (1) “strongly disagree” to (4)“strongly agree”. Coefficient alpha was .73.
Age. Participants were asked to indicate their currentage (in years). As age has been found to relate to workability, it was entered as a control variable in allanalyses.
Health. The Healthy Days core item for overall health(Centers for Disease Control and Prevention, 2000) wasused to assess general perceptions of health on a scaleranging from (1) “poor” to (5) “excellent”.
Analysis strategy
Structural equation modelling was used to test a mea-surement model and hypothesized main effects (struc-tural model), and hierarchical multiple regression wasused to test hypothesized interactions based on the
TABLE1
Demographicsbynationsample
All(n
=12
25)
%US(n
=37
1)%
UK(n
=15
3)%
Australia
(n=16
2)%
Brazil(n
=17
0)%
Polan
d(n
=19
8)%
Croatia
(n=17
1)%
Fem
ale
89%
92%
82%
81%
89%
99%
80%
Married/partnered
67%
72%
63%
69%
41%
65%
81%
Nurse
79%
67%
67%
81%
93%
95%
79%
Ran
geMean(SD)
Range
Mean(SD)
Ran
geMean(SD)
Ran
geMean(SD)
Range
Mean(SD)
Ran
geMean(SD)
Ran
geMean(SD)
Hrs
worked/wk
3–80
37.5
(11.4)
3–80
38.5
(12.8)
3–80
34.9
(10.7)
7–60
34.1
(9.2)
6–60
33.4
(12.3)
4–72
41.8
(8.5)
4–76
41.4
(9.6)
Age
(yrs)
18–68
39.5
(11.0)
18–6
841
.5(11.5)
19–61
39.5
(10.9)
21–62
42.3
(11.0)
20–5
631
.3(8.1)
18–56
38.6
(9.2)
19–65
40(10.5)
Occup
.tenu
re(yrs)
<1–49
15.6
(10.1)
<1–49
16.1
(10.6)
1–40
14.7
(9.8)
1–40
17.8
(11.1)
1–45
6.3(5.4)
<1–40
16.4
(9.4)
<1–38
19.6
(10.6)
Org.tenu
re(yrs)
<1–49
9.5(7.0)
<1–49
7.8(7.2)
1–30
7.2(5.6)
1–40
8.5(7.5)
<1–25
4.7(4.2)
<1–37
12.4
(9.5)
<1–36
15.9
(10.6)
Percentages
arerepresentedby
“%”.
Standarddeviations
arereported
inparenthesesbeside
each
mean.
6 MCGONAGLE ET AL.
Dow
nloa
ded
by [
Way
ne S
tate
Uni
vers
ity],
[A
lyss
a M
cGon
agle
] at
11:
49 2
6 Ju
ly 2
013

steps by Aiken and West (1991). The measurementmodel was first tested for each nation sample separately,and then all nations simultaneously were tested for mea-surement invariance using chi square difference tests,along with changes to the CFI (Meade, Johnson, &Braddy, 2008). A structural model was then tested forinvariance between nation samples. Multiple-item scaleswere modelled as latent variables, whereas single-itemmeasures were modelled as observed variables. Model fitwas determined using three commonly used fit indices.First, the standardized root mean square residual(SRMR), was used. An SRMR value close to .08 isconsidered to be indicative of good model fit (Hu &Bentler, 1999). Second, the CFI was used, which rangesfrom 0 to 1 and indicates “good” fit at .95 or higher.Third, the Root Mean Square Error of Approximation(RMSEA; Hu & Bentler, 1999) was used; values of .06or less indicate good fit (Hu & Bentler, 1999). Missingdata was excluded from analysis using listwise deletion.
RESULTS
Means of composite variables are presented in Table 2,and statistically significant differences between nationsamples are noted. Levels of work ability were generallyhigh (the lowest was reported by the Brazil sample andwas still above the scale midpoint). Perceived workability was greater in the US sample than the othernation samples. Across nations, levels of emotionaldemands were reported to be greater than role demands,physical demands, and work environment demands. Skilldiscretion and supervisor support levels were all high(above the scale midpoints).
Correlations between study variables for the full sam-ple are illustrated in Table 3a, and correlations by nationsample are presented in Tables 3b–3g. In all samples,correlations were generally in the expected directions:work ability negatively related to role demands, workenvironment demands, and physical demands, and posi-tively related to supervisor support and skill discretion.Surprisingly, emotional demands did not relate to workability in the overall sample; an examination of correla-tions by nation sample showed that emotional demandsnegatively related to work ability in the US sample only(and, unexpectedly, positively related to work ability inthe Australia sample). Although correlations were, over-all, in the expected directions, it should be noted that themagnitudes of most correlations were smaller thananticipated. Most were in the low-to-moderate range,and the highest correlations in most nation sampleswere seen between health and work ability.
Measurement model testing
Prior to estimating structural paths, the measurementmodel was tested for fit in each nation sample separately.
TABLE2
Ranges,means,andstandard
deviationsbynationsample
US(n
=37
1)UK(n
=15
3)Australia
(n=16
2)Brazil(n
=17
0)Polan
d(n
=19
8)Croatia
(n=17
1)
Ran
geMean(SD)
Ran
geMean(SD)
Ran
geMean(SD)
Range
Mean(SD)
Range
Mean(SD)
Ran
geMean(SD)
Workability*
1.88–5
4.32
(0.62)
2.5–5
4.03
adeg
(0.69)
1–5
4.01
abc(0.68)
1.25–5
3.75
(0.69)
2.13–5
3.93
bfg(0.62)
1.25
–53.94
cdef(0.70)
Roledemands*
1–4
2.53
a(0.69)
1–4
2.25
(0.67)
1–4
2.76
bcd
(0.69)
1–4
2.75
beg
(0.68)
1–4
2.76
cfg(0.64)
1–4
2.60
adef(0.57)
Workenvironm
ent
demands*
1–4
1.72
ab(0.63)
1–3.75
1.59
ac(0.60)
1–4
1.67
bc(0.55)
1–4
2.43
df(0.71)
1–4
2.47
ef(0.79)
1–4
2.30
de(0.68)
Emotionaldemands
1–4
3.28
(0.83)
1–4
3.13
(0.80)
1–4
3.32
(0.74)
1–4
3.28
(0.75)
1–4
3.36
(0.88)
1–4
3.24
(0.71)
Phy
sicaldemands*
1–4
2.74
ab(0.95)
1–4
2.18
c(0.94)
1–4
2.69
a(0.89)
1–4
3.29
d(0.76)
1–4
3.30
d(0.82)
1–4
2.92
bc(0.83)
Sup
ervisorsupport
1–4
2.81
(0.94)
1–4
2.93
(0.87)
1–4
2.68
(0.96)
1–4
2.70
(0.99)
1–4
2.78
(0.91)
1–4
2.57
(0.99)
Skilldiscretio
n*1–4
3.46
(0.48)
1–4
3.27
afh(0.47)
1–4
3.29
abc(0.47)
1–4
3.19
bdfg(0.51)
1–4
3.20
cegh(0.56)
1–4
3.13
de(0.47)
Standarddeviations
inparentheses.*indicates
statistically
significant
omnibu
sF-testat
p<.05.
Posthoctestsdone
with
Bonferronicorrectio
n.Means
that
donotsharealetterarestatistically
significantly
differentfrom
each
otherat
p<.05.
DEMANDS, RESOURCES, AND WORK ABILITY 7
Dow
nloa
ded
by [
Way
ne S
tate
Uni
vers
ity],
[A
lyss
a M
cGon
agle
] at
11:
49 2
6 Ju
ly 2
013

All multiitem study variables were included in the mea-surement model (role demands, work environmentdemands, skill discretion, and work ability). Good fitwas demonstrated for all nation samples, and, for allnation samples, factor loadings were statistically signifi-cant and in the expected directions. See Table 4 formodel fit statistics for each nation sample. Therefore, acommon measurement model was assessed, first varying
fully between nation samples, and then constrainingparameters.
A completely unconstrained model was first tested inwhich intercepts, factor loadings, and residual varianceswere allowed to vary between groups (with the exceptionof the factor loading and intercept of the first indicator,which must be constrained to be equal across groups and1, respectively, in order to achieve model identification).
TABLE 3A
Pearson correlations and alphas for multiple-item scales (all samples combined)
1 2 3 4 5 6 7 8 9
1. Age —2. Health .08 —3. Work ability .05 .42** (.81)4. Role demands –.02 –.10** –.14** (.66)5. Environment demands –.10** –.27** –.20** .17** (.81)6. Emotional demands .01 –.10** .00 .09** .14** —7. Physical demands –.09** –.15** –.09** .17** .26** .27** —8. Supervisor support –.02 .11** .15** –.18** –.14** –.11** –.07* —9. Skill discretion .01 .13** .25** –.02 –.05 .31** .16** .18** (.73)
N = 1225.*p < .05, **p < .01.
TABLE 3B
Pearson correlations and alphas for multiple-item scales (US sample)
1 2 3 4 5 6 7 8 9
1. Age —2. Health .02 —3. Work ability .01 .21** (.76)4. Role demands .05 –.08 –.12* (.75)5. Environment demands –.07 –.13** –.11* .11* (.77)6. Emotional demands –.02 –.14* –.14* .19** .17** —7. Physical demands –.13** –.05 –.08 .10 .23** .39** —8. Supervisor support .03 .15** .08 –.20** –.18** –.18** –.07 —9. Skill discretion –.01 .07 .04 .10 .03 .25** .24** .19** (.75)
N = 371. *p < .05, **p < .01.
TABLE 3C
Pearson correlations and alphas for multiple-item scales (UK sample)
1 2 3 4 5 6 7 8 9
1. Age —2. Health .07 —3. Work ability –.08 .33** (.86)4. Role demands –.04 .04 –.01 (.73)5. Environment demands –.05 –.17* .09 –.06 (.79)6. Emotional demands –.07 –.11 .06 –.41** .16* —7. Physical demands .26** –.02 –.17* .13 –.18* –.28** —8. Supervisor support –.18* .00 .05 .29** –.23* –.03 –.11* —9. Skill discretion –.13 .04 .20* –.23** .11 .38** –.33** .08 (.70)
N = 153. *p < .05, **p < .01.
8 MCGONAGLE ET AL.
Dow
nloa
ded
by [
Way
ne S
tate
Uni
vers
ity],
[A
lyss
a M
cGon
agle
] at
11:
49 2
6 Ju
ly 2
013
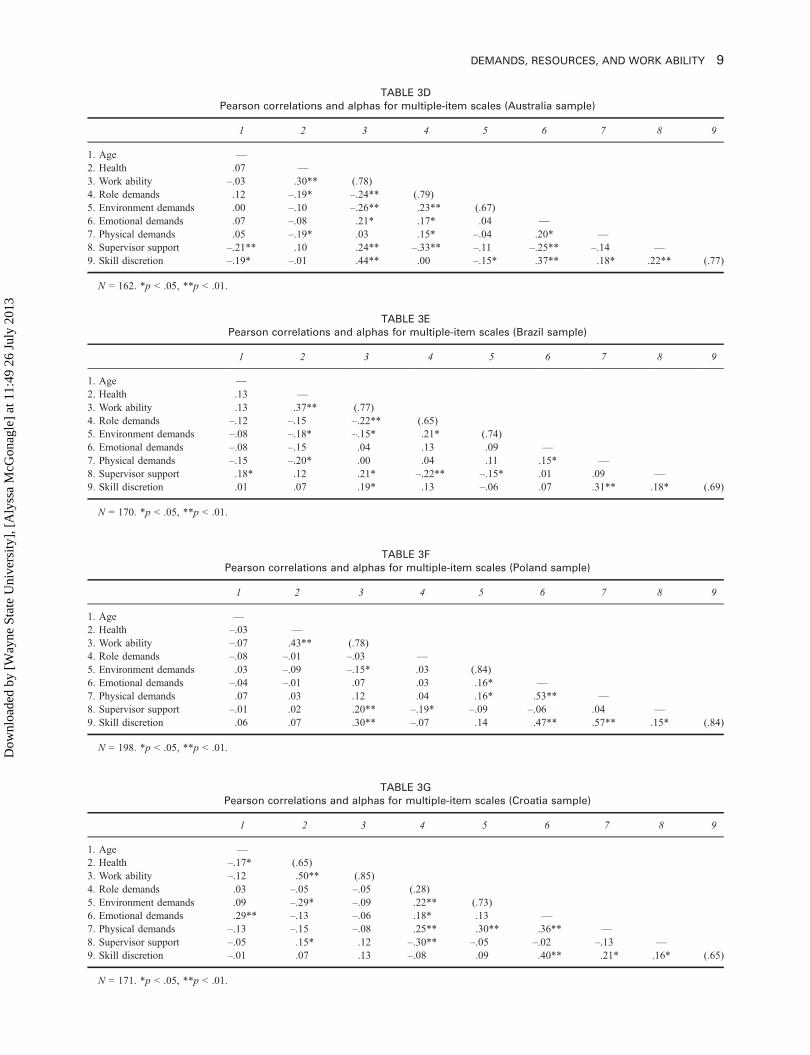
TABLE 3E
Pearson correlations and alphas for multiple-item scales (Brazil sample)
1 2 3 4 5 6 7 8 9
1. Age —2. Health .13 —3. Work ability .13 .37** (.77)4. Role demands –.12 –.15 –.22** (.65)5. Environment demands –.08 –.18* –.15* .21* (.74)6. Emotional demands –.08 –.15 .04 .13 .09 —7. Physical demands –.15 –.20* .00 .04 .11 .15* —8. Supervisor support .18* .12 .21* –.22** –.15* .01 .09 —9. Skill discretion .01 .07 .19* .13 –.06 .07 .31** .18* (.69)
N = 170. *p < .05, **p < .01.
TABLE 3D
Pearson correlations and alphas for multiple-item scales (Australia sample)
1 2 3 4 5 6 7 8 9
1. Age —2. Health .07 —3. Work ability –.03 .30** (.78)4. Role demands .12 –.19* –.24** (.79)5. Environment demands .00 –.10 –.26** .23** (.67)6. Emotional demands .07 –.08 .21* .17* .04 —7. Physical demands .05 –.19* .03 .15* –.04 .20* —8. Supervisor support –.21** .10 .24** –.33** –.11 –.25** –.14 —9. Skill discretion –.19* –.01 .44** .00 –.15* .37** .18* .22** (.77)
N = 162. *p < .05, **p < .01.
TABLE 3F
Pearson correlations and alphas for multiple-item scales (Poland sample)
1 2 3 4 5 6 7 8 9
1. Age —2. Health –.03 —3. Work ability –.07 .43** (.78)4. Role demands –.08 –.01 –.03 —5. Environment demands .03 –.09 –.15* .03 (.84)6. Emotional demands –.04 –.01 .07 .03 .16* —7. Physical demands .07 .03 .12 .04 .16* .53** —8. Supervisor support –.01 .02 .20** –.19* –.09 –.06 .04 —9. Skill discretion .06 .07 .30** –.07 .14 .47** .57** .15* (.84)
N = 198. *p < .05, **p < .01.
TABLE 3G
Pearson correlations and alphas for multiple-item scales (Croatia sample)
1 2 3 4 5 6 7 8 9
1. Age —2. Health –.17* (.65)3. Work ability –.12 .50** (.85)4. Role demands .03 –.05 –.05 (.28)5. Environment demands .09 –.29* –.09 .22** (.73)6. Emotional demands .29** –.13 –.06 .18* .13 —7. Physical demands –.13 –.15 –.08 .25** .30** .36** —8. Supervisor support –.05 .15* .12 –.30** –.05 –.02 –.13 —9. Skill discretion –.01 .07 .13 –.08 .09 .40** .21* .16* (.65)
N = 171. *p < .05, **p < .01.
DEMANDS, RESOURCES, AND WORK ABILITY 9
Dow
nloa
ded
by [
Way
ne S
tate
Uni
vers
ity],
[A
lyss
a M
cGon
agle
] at
11:
49 2
6 Ju
ly 2
013
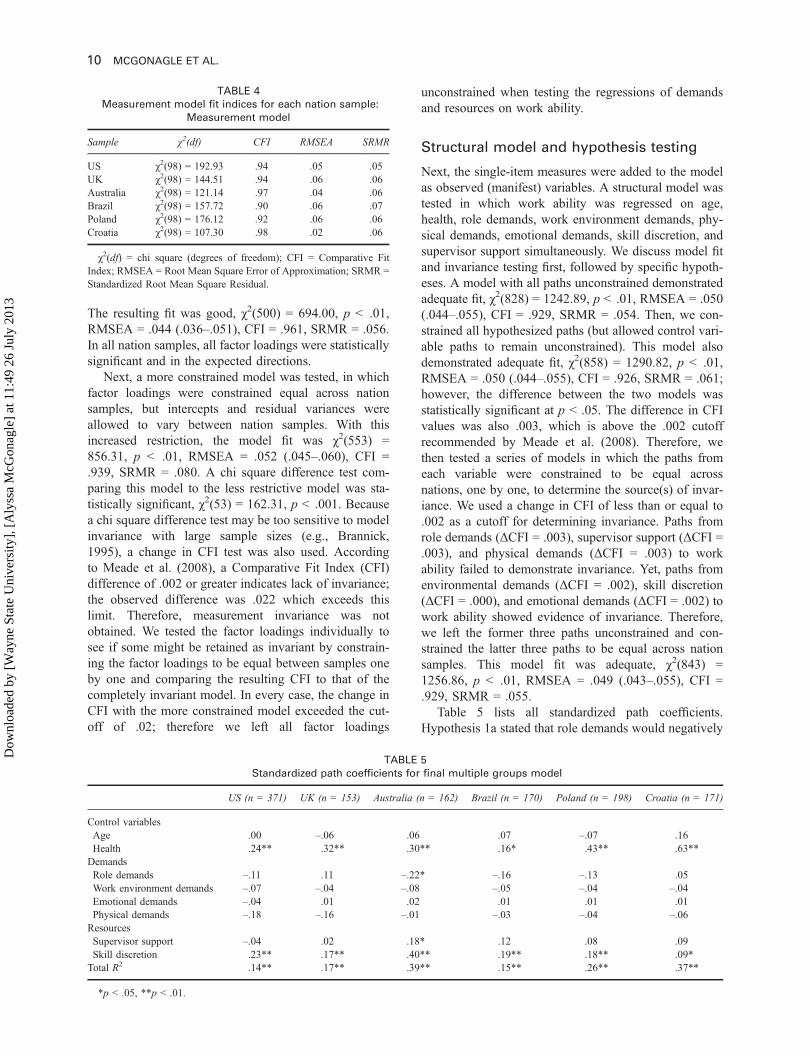
The resulting fit was good, χ2(500) = 694.00, p < .01,RMSEA = .044 (.036–.051), CFI = .961, SRMR = .056.In all nation samples, all factor loadings were statisticallysignificant and in the expected directions.
Next, a more constrained model was tested, in whichfactor loadings were constrained equal across nationsamples, but intercepts and residual variances wereallowed to vary between nation samples. With thisincreased restriction, the model fit was χ2(553) =856.31, p < .01, RMSEA = .052 (.045–.060), CFI =.939, SRMR = .080. A chi square difference test com-paring this model to the less restrictive model was sta-tistically significant, χ2(53) = 162.31, p < .001. Becausea chi square difference test may be too sensitive to modelinvariance with large sample sizes (e.g., Brannick,1995), a change in CFI test was also used. Accordingto Meade et al. (2008), a Comparative Fit Index (CFI)difference of .002 or greater indicates lack of invariance;the observed difference was .022 which exceeds thislimit. Therefore, measurement invariance was notobtained. We tested the factor loadings individually tosee if some might be retained as invariant by constrain-ing the factor loadings to be equal between samples oneby one and comparing the resulting CFI to that of thecompletely invariant model. In every case, the change inCFI with the more constrained model exceeded the cut-off of .02; therefore we left all factor loadings
unconstrained when testing the regressions of demandsand resources on work ability.
Structural model and hypothesis testing
Next, the single-item measures were added to the modelas observed (manifest) variables. A structural model wastested in which work ability was regressed on age,health, role demands, work environment demands, phy-sical demands, emotional demands, skill discretion, andsupervisor support simultaneously. We discuss model fitand invariance testing first, followed by specific hypoth-eses. A model with all paths unconstrained demonstratedadequate fit, χ2(828) = 1242.89, p < .01, RMSEA = .050(.044–.055), CFI = .929, SRMR = .054. Then, we con-strained all hypothesized paths (but allowed control vari-able paths to remain unconstrained). This model alsodemonstrated adequate fit, χ2(858) = 1290.82, p < .01,RMSEA = .050 (.044–.055), CFI = .926, SRMR = .061;however, the difference between the two models wasstatistically significant at p < .05. The difference in CFIvalues was also .003, which is above the .002 cutoffrecommended by Meade et al. (2008). Therefore, wethen tested a series of models in which the paths fromeach variable were constrained to be equal acrossnations, one by one, to determine the source(s) of invar-iance. We used a change in CFI of less than or equal to.002 as a cutoff for determining invariance. Paths fromrole demands (ΔCFI = .003), supervisor support (ΔCFI =.003), and physical demands (ΔCFI = .003) to workability failed to demonstrate invariance. Yet, paths fromenvironmental demands (ΔCFI = .002), skill discretion(ΔCFI = .000), and emotional demands (ΔCFI = .002) towork ability showed evidence of invariance. Therefore,we left the former three paths unconstrained and con-strained the latter three paths to be equal across nationsamples. This model fit was adequate, χ2(843) =1256.86, p < .01, RMSEA = .049 (.043–.055), CFI =.929, SRMR = .055.
Table 5 lists all standardized path coefficients.Hypothesis 1a stated that role demands would negatively
TABLE 4
Measurement model fit indices for each nation sample:
Measurement model
Sample χ2(df) CFI RMSEA SRMR
US χ2(98) = 192.93 .94 .05 .05UK χ2(98) = 144.51 .94 .06 .06Australia χ2(98) = 121.14 .97 .04 .06Brazil χ2(98) = 157.72 .90 .06 .07Poland χ2(98) = 176.12 .92 .06 .06Croatia χ2(98) = 107.30 .98 .02 .06
χ2(df) = chi square (degrees of freedom); CFI = Comparative FitIndex; RMSEA = Root Mean Square Error of Approximation; SRMR =Standardized Root Mean Square Residual.
TABLE 5
Standardized path coefficients for final multiple groups model
US (n = 371) UK (n = 153) Australia (n = 162) Brazil (n = 170) Poland (n = 198) Croatia (n = 171)
Control variablesAge .00 –.06 .06 .07 –.07 .16Health .24** .32** .30** .16* .43** .63**DemandsRole demands –.11 .11 –.22* –.16 –.13 .05Work environment demands –.07 –.04 –.08 –.05 –.04 –.04Emotional demands –.04 .01 .02 .01 .01 .01Physical demands –.18 –.16 –.01 –.03 –.04 –.06ResourcesSupervisor support –.04 .02 .18* .12 .08 .09Skill discretion .23** .17** .40** .19** .18** .09*Total R2 .14** .17** .39** .15** .26** .37**
*p < .05, **p < .01.
10 MCGONAGLE ET AL.
Dow
nloa
ded
by [
Way
ne S
tate
Uni
vers
ity],
[A
lyss
a M
cGon
agle
] at
11:
49 2
6 Ju
ly 2
013
relate to work ability. This was only supported in theAustralia sample, β = –.22, p < .05. Hypotheses 1b, 1c,and 1d, which stated that perceived work environmentdemands, emotional demands, and physical demands,respectively, would negatively relate to work ability,were not supported in any of the nation samples.Hypothesis 2a stated that supervisor support would posi-tively relate to work ability. Support for Hypothesis 2awas found only in the Australia sample, β = .18, p < .05.Hypothesis 2b was fully supported: Skill discretion posi-tively related to work ability in each nation sample.Significant standardized path coefficients ranged from.15 (Brazil) to .39 (Australia). Interestingly, the firstcontrol variable, age, did not relate to work ability inany of the nation samples. However, the second controlvariable, health, related significantly to work in ability inall nation samples; standardized coefficients ranged from.16 (Brazil) to .63 (Croatia). The total amount of var-iance in work ability accounted for by all study variablesranged from .14, p < .05 (US sample) to .39, p < .01(Australia sample).
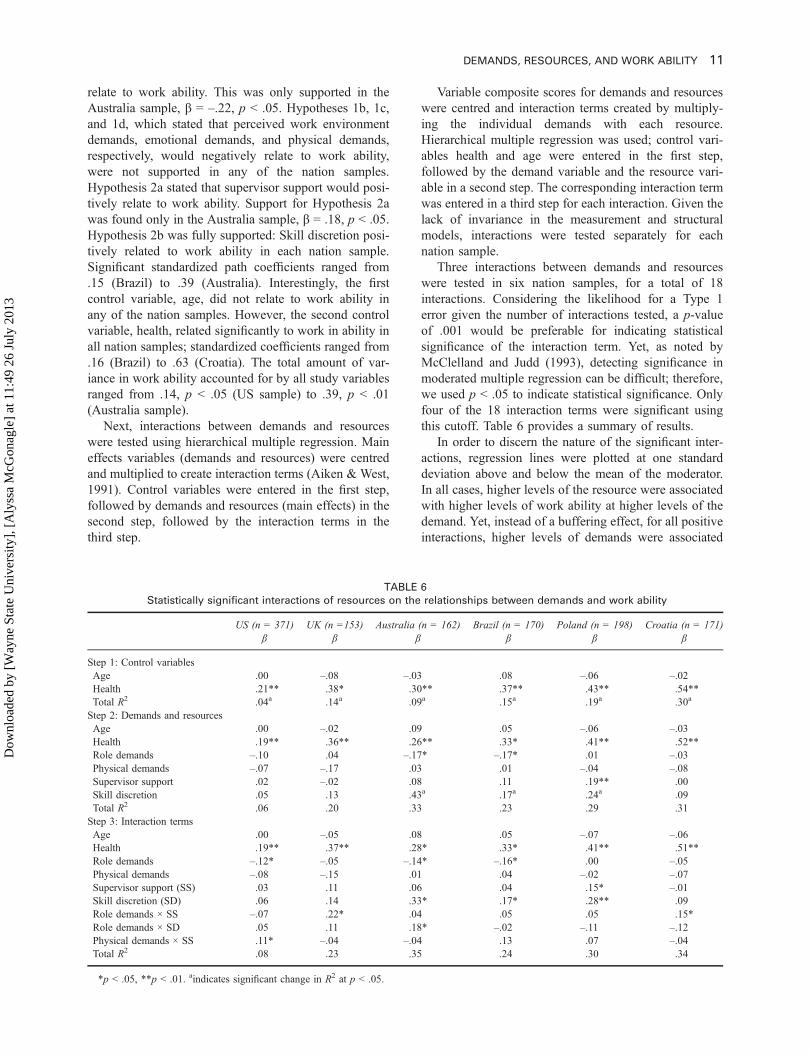
Next, interactions between demands and resourceswere tested using hierarchical multiple regression. Maineffects variables (demands and resources) were centredand multiplied to create interaction terms (Aiken & West,1991). Control variables were entered in the first step,followed by demands and resources (main effects) in thesecond step, followed by the interaction terms in thethird step.
Variable composite scores for demands and resourceswere centred and interaction terms created by multiply-ing the individual demands with each resource.Hierarchical multiple regression was used; control vari-ables health and age were entered in the first step,followed by the demand variable and the resource vari-able in a second step. The corresponding interaction termwas entered in a third step for each interaction. Given thelack of invariance in the measurement and structuralmodels, interactions were tested separately for eachnation sample.
Three interactions between demands and resourceswere tested in six nation samples, for a total of 18interactions. Considering the likelihood for a Type 1error given the number of interactions tested, a p-valueof .001 would be preferable for indicating statisticalsignificance of the interaction term. Yet, as noted byMcClelland and Judd (1993), detecting significance inmoderated multiple regression can be difficult; therefore,we used p < .05 to indicate statistical significance. Onlyfour of the 18 interaction terms were significant usingthis cutoff. Table 6 provides a summary of results.
In order to discern the nature of the significant inter-actions, regression lines were plotted at one standarddeviation above and below the mean of the moderator.In all cases, higher levels of the resource were associatedwith higher levels of work ability at higher levels of thedemand. Yet, instead of a buffering effect, for all positiveinteractions, higher levels of demands were associated
TABLE 6
Statistically significant interactions of resources on the relationships between demands and work ability
US (n = 371)β
UK (n =153)β
Australia (n = 162)β
Brazil (n = 170)β
Poland (n = 198)β
Croatia (n = 171)β
Step 1: Control variablesAge .00 –.08 –.03 .08 –.06 –.02Health .21** .38* .30** .37** .43** .54**Total R2 .04a .14a .09a .15a .19a .30a
Step 2: Demands and resourcesAge .00 –.02 .09 .05 –.06 –.03Health .19** .36** .26** .33* .41** .52**Role demands –.10 .04 –.17* –.17* .01 –.03Physical demands –.07 –.17 .03 .01 –.04 –.08Supervisor support .02 –.02 .08 .11 .19** .00Skill discretion .05 .13 .43a .17a .24a .09Total R2 .06 .20 .33 .23 .29 .31Step 3: Interaction termsAge .00 –.05 .08 .05 –.07 –.06Health .19** .37** .28* .33* .41** .51**Role demands –.12* –.05 –.14* –.16* .00 –.05Physical demands –.08 –.15 .01 .04 –.02 –.07Supervisor support (SS) .03 .11 .06 .04 .15* –.01Skill discretion (SD) .06 .14 .33* .17* .28** .09Role demands × SS –.07 .22* .04 .05 .05 .15*Role demands × SD .05 .11 .18* –.02 –.11 –.12Physical demands × SS .11* –.04 –.04 .13 .07 –.04Total R2 .08 .23 .35 .24 .30 .34
*p < .05, **p < .01. aindicates significant change in R2 at p < .05.
DEMANDS, RESOURCES, AND WORK ABILITY 11
Dow
nloa
ded
by [
Way
ne S
tate
Uni
vers
ity],
[A
lyss
a M
cGon
agle
] at
11:
49 2
6 Ju
ly 2
013

with the same or slightly higher levels of work ability aslower levels of demands (and levels of work ability athigh levels of demands were higher for those with moreresources). As demonstrated in Figure 1, work ability isslightly higher at higher levels of role demands, and thepositive relationship of demands and work ability isstronger at higher levels of supervisor support in theUK sample. The nature of the other three interactions,as illustrated in Figures 2, 3, and 4, were similar. Simpleslopes analyses were also conducted for the four signifi-cant interactions. For the interaction of role demands andsupervisor support on work ability in the UK sample, theunstandardized simple slope for individuals 1 SD abovethe mean of supervisor support was .64, t(148) = 2.04,p < .05, and for individuals 1 SD below mean was .33,t(148) = 1.96, p = .05. For the interaction of roledemands and supervisor support on work ability in theCroatia sample, the unstandardized slope for individuals1 SD above the mean of supervisor support was .55, t(166) = 3.79, p < .01, and for individuals 1 SD below themean of supervisor support was .21, t(166) = 2.04, p <.05. For the interaction of role demands and skill discre-tion on work ability in the Australia sample, the unstan-dardized slope for individuals 1 SD above the mean ofskill discretion was .92, t(157) = 2.19, p < .05, and for
individuals 1 SD below the mean of skill discretion was.66, t(157) = 2.12, p < .05. Finally, for the interaction ofphysical demands and supervisor support in the USsample, the unstandardized slope for individuals 1 SDabove the mean of supervisor support was .21, t(366) =1.73, p > .05, and for those 1 SD below the mean ofsupervisor support was .08, t(366) = 1.21, p > .05. Giventhat both of the simple slopes for the US interaction ofphysical demands and supervisor support were nonsigni-ficant, results of this interaction should be interpretedwith caution.
DISCUSSION
We examined multiple job demands and job resourcesrelating to perceived work ability in health care workersamples from six nations using the Job Demands–Resources (JD-R) model as a theoretical framework.The JD-R model, which has not been applied to under-standing work ability before, is a promising frameworkto unify existing fragmented research and provide theo-retical grounding to a construct that has been almostexclusively examined without theoretical framing. Ourresults, however, do not provide unequivocal support for
1
1.5
2
2.5
3
3.5
4
4.5
5
Low role demands High role demands
Wor
k ab
ility
Low supervisor support
High supervisor support
Figure 1. Statistically significant interaction between role demandsand supervisor support on work ability perceptions in the UK sample.Unstandardized regression weight values plotted at +1 and –1 standarddeviation from the mean of supervisor support.
1
1.5
2
2.5
3
3.5
4
4.5
5
Low role demands High role demands
Wor
k ab
ility
Low supervisor support
High supervisor support
Figure 2. Statistically significant interaction between role demandsand supervisor support on work ability perceptions in the Croatiasample. Unstandardized regression weight values plotted at +1 and –1standard deviation from the mean of supervisor support.
1
1.5
2
2.5
3
3.5
4
4.5
5
Low role demands High role demands
Wor
k ab
ility
Low skill discretion
High skill discretion
Figure 3. Statistically significant interaction between role demandsand skill discretion on work ability perceptions in the Australia sample.Unstandardized regression weight values plotted at +1 and –1 standarddeviation from the mean of skill discretion.
1
1.5
2
2.5
3
3.5
4
4.5
5
Low physical demands High physical demands
Wor
k ab
ility
Low supervisor support
High supervisor support
Figure 4. Statistically significant interaction between physicaldemands and supervisor support on work ability perceptions in theUS sample. Unstandardized regression weight values plotted at +1and –1 standard deviation from the mean of supervisor support.
12 MCGONAGLE ET AL.
Dow
nloa
ded
by [
Way
ne S
tate
Uni
vers
ity],
[A
lyss
a M
cGon
agle
] at
11:
49 2
6 Ju
ly 2
013

using the JD-R model to help understand work ability.We interpret our findings in light of the limitations of ourstudy design, discuss alternative explanations, and pro-vide suggestions for future applications of the JD-Rmodel to study work ability to help guide future workin this area.
We tested relationships of four types of job demandswith perceived work ability in six nation samples. Out of24 regression coefficients tested, only one reached sta-tistical significance (role demands relating to work abil-ity in the Australia sample). The lack of relationshipsbetween demands and work ability in these samples goesagainst prior research, which has stressed the roles ofphysical demands, psychological, and environmental jobdemands on work ability (e.g., Barnes-Farrell et al.,2004; Estryn-Behar et al., 2005; Ilmarinen et al., 2005;Tuomi et al., 2001, 2004). It is important to remember,however, that, unlike many previous studies, we exam-ined effects of all demands and resources, along withhealth and age, simultaneously. As demands, resources,age, and health are intercorrelated, it is unlikely that allwill show a significant relationship with work ability;instead, the results may indicate which variables have thestrongest relationships with work ability. In examiningthe bivariate correlations between demands and workability, we see the following significant relationships inthe full (combined) sample: role demands and workability, environment demands and work ability, and phy-sical demands and work ability. Other (single) nationsamples show significant relationships of demands andwork ability as well (see Tables 3b–3g). Overall, theresults suggest that correlations among predictors andcontrol variables account for some nonsignificant find-ings for job demands; yet, overall, demands do not relateto work ability to the extent that we would expect basedon previous research. Also, as it is unlikely that indivi-duals experience demands or resources in isolation, wefeel it is most appropriate to examine them simulta-neously. As we will discuss, resources were more impor-tant than demands in explaining work ability in this study.
Our examination of emotional demands as related towork ability was novel and important, as these types ofdemands are common for health care workers (de Jonget al., 1999; Peeters & LeBlanc, 2001). Our findings,however, indicated no relationship between emotionaldemands and work ability, which is surprising. Whenexamining zero-order correlations by nation sample,there is a negative relationship of emotional demandswith work ability in the US sample, a positive relation-ship of emotional demands with work ability in theAustralia sample, and no relationship between emotionaldemands and work ability in the other four nation sam-ples. Two points should be considered in light of thesefindings. First, it is unclear whether “emotionaldemands” has the same meaning across different nationsamples. As we used a single-item measure of emotionaldemands, we also cannot examine the stability of factor
structure between nation samples. These unexpectedresults may also be due to a selection effect; specifically,individuals who choose health care professions perhapsexpect to be confronted with emotional demands, andtherefore do not experience them as strains.Alternatively, emotional demands may be perceived aschallenges to health care workers (rather than threats). Inaccordance with a challenge appraisal, higher levels ofemotional demands (as in the death of a patient) may beinstrumental in triggering a eustress response, causingworkers to engage more with work (Nelson & Simmons,2011). As our results regarding emotional demands areinconclusive, we suggest that future work seek to betterunderstand this relationship using multiitem, cross-nationally validated measures of emotional demands. Itmay be wise to also explore the conditions under whichit may possibly trigger a eustress, rather than distressresponse.
It is also likely that demands do not uniformly relateto lower levels of work ability; indeed JD-R researchers(Bakker & Demerouti, 2007) and work ability research-ers (e.g., Gould, Martelin, Koskinen, & Sainio, 2008)alike posit that an interaction of the environment with theworkers’ resources is critical. We therefore proposedthat, although overall demands would be negativelyrelated to work ability, this negative relationship wouldbe stronger when resources were low. We tested inter-active effects of selected (matched) demands andresources on work ability. Yet, contrary to expectations,we did not find support for the notion that work ability islower with the combination of high levels of demandsand low levels of resources. The significant interactioneffects instead illustrated that greater levels of resourcesare associated with greater levels of work ability at alllevels of demands, and especially at higher levels ofdemands. This finding is more in line with the JobDemand–Control model—which posits that high levelsof demands, combined with high levels of control engen-der “active jobs” (Karasek, 1979). The ability to useskills or make decisions enhances individuals’ feelingsof self-efficacy and coping abilities, and thereforedemands are not stressors (Karasek, 1979). The differ-ence with this study, of course, is that we did not testautonomy and instead tested social support.
We must point out, however, that, in retrospect, wewere likely unable to adequately test the notion thatwork ability will be lowest when resources are lowusing the current study samples. Mean levels of skilldiscretion were high in all nation samples (exceeding 3points on a 4-point scale in all nation samples); standarddeviations for skill discretion were also low (rangingfrom 0.47 to 0.56). Means for supervisor support werelower than skill discretion, but still generally high (ran-ging from 2.57 to 2.93 on a 4-point scale). In order tomore adequately test the notion that demands lead todeclines in work ability when resources are low, amore diverse sample in terms of resource levels should
DEMANDS, RESOURCES, AND WORK ABILITY 13
Dow
nloa
ded
by [
Way
ne S
tate
Uni
vers
ity],
[A
lyss
a M
cGon
agle
] at
11:
49 2
6 Ju
ly 2
013

be obtained. For example, these relationships should betested on other worker populations besides health careworkers.
Taken together, our study results may be interpretedas illustrating a “healthy worker effect” (e.g., Sterling &Weinkam, 1986)—individuals who currently work inmore demanding situations are also more able to workin such situations. Individuals in highly demanding workcontexts with low work ability may leave their jobs. Thishealthy worker effect may help explain why, forinstance, each of our nation samples have high averagelevels of resources (skill discretion and supervisor sup-port), and why we do not see decreased work ability withincreasing levels of demands, and instead see similar orhigher levels of work ability with increasing demands.The healthy worker effect is likely to be especiallyprominent in these samples of acute care health careworkers, as they are all in demanding jobs. This isreflected in our samples: Perceived work ability is gen-erally high (ranging from 3.75 to 4.32 on a 5-pointscale), and standard deviations are generally low (ran-ging from .62 to .70). The healthy worker effect is one ofthe most complex difficulties with occupational researchon worker exposures and health (Osmotherly & Attia,2006). At this time, we can only speculate that this maybe an issue, but we suggest that work ability researchersdo more to understand the healthy worker effect, the roleit plays in interpreting work ability research, and ways tomitigate it.
Our hypotheses regarding resources relating to workability were supported by the data to a greater extentthan our hypotheses about demands. Skill discretionappears to be particularly important for work ability, asit significantly related to work ability in all nation sam-ples. This finding has practical implications for organiza-tions and individuals. For instance, skill discretion maybe increased in certain jobs to help preserve work ability.Individuals may choose to further their education inefforts to increase their skill discretion, and consequentlylevels of work ability. Instrumental supervisor supportonly directly related to work ability in the Australiasample, yet also significantly moderated relationshipsof work ability with both role demands (UK sampleand Croatia sample) and physical demands (US sample).Supervisor–employee relationships, therefore, shouldalso be targeted for intervention to help preserve workability in health care workers. We only examined instru-mental support in this study; future research should alsoexamine emotional support, and look for moderatingeffects of emotional support on the impacts of emotionaldemands on work ability.
Although age was a control variable and not hypothe-sized to relate to work ability, its relationship with workability deserves discussion. We were surprised that agedid not relate to work ability in any of the nation sam-ples. Previous research has established that work abilitygenerally declines with increasing age (Fischer et al.,
2006; Ilmarinen et al., 1991b; Tuomi et al., 1998). Thelack of relationship in these samples may indicate that,perhaps when health is considered, age does not play alarge role in work ability. If workers can preserve theirhealth, they may enjoy high levels of work ability intoold age. Because age is correlated with job tenure, it isalso possible that increasing age may also be indicativeof higher level in the organization—and less physicallydemanding work. Another factor to consider is the dif-ferences between chronological age and other concep-tualizations of age (see Barnes-Farrell & Piortrowski,1989). Examples of such constructs include personal orpsychological age, and functional age. Psychological agewas found to significantly relate to work ability in ahealth care worker samples in five nations (Barnes-Farrell et al., 2004). Functional age was found to relateto work ability in a sample of German teachers (e.g.,Seibt, Spitzer, Blank, & Scheuch, 2009). One variablenot accounted for in the current study, but which mayhave an effect on relationships between demands andresources and work ability, is hours worked per week.1
It is possible, for instance, that even the presence of veryheavy demands may not relate to work ability whenworkers do not work many hours per week. For thisreason, we reran the analyses controlling for hoursworked per week, and did not find significant differencesin results. Yet, this variable may be important to considerin future studies.
As expected, health related to work ability in allnation samples. This finding is not novel, given previousresearch linking health and well-being to work ability(e.g., Sjögren-Rönkä et al., 2002; Ilmarinen et al., 2005).Yet, it highlights its importance and underscores thenotion that interventions to promote worker health willlikely also be important in helping workers preservework ability. The use of health as a control variable instudying work ability is somewhat controversial, asmany work ability researchers consider health to bepart of the criterion space of work ability. Yet, becausewe were testing individuals’ perceptions of work ability,and we sought to disentangle this notion of perceivedwork ability from perceived health, we feel that control-ling for health was appropriate and necessary.Additionally, as health is not considered a job resourceaccording to the JD-R, we felt it was important to controlfor its effects and not examine it as another predictor ofwork ability, as other researchers have done (e.g.,Ilmarinen et al., 2005; Tuomi et al., 2001).
Finally, our overall evaluation of the usefulness ofthe JD-R model in understanding work ability must alsobe qualified by the limitations of this study’s cross-sectional design. Declines in work ability, similar tomanifestations of burnout, could be modelled longitud-inally to better determine causal direction of effects.Overall, this study underscores the importance of
1We thank an anonymous reviewer for this point.
14 MCGONAGLE ET AL.
Dow
nloa
ded
by [
Way
ne S
tate
Uni
vers
ity],
[A
lyss
a M
cGon
agle
] at
11:
49 2
6 Ju
ly 2
013

cross-national research on work ability. There is awealth of research linking different types of jobdemands and work and personal resources to workability (e.g., Ilmarinen et al., 2005; Lindberg et al.,2005; Tuomi et al., 2001, 2004); yet, these studies donot examine differences across nation samples. Ourresults suggest that it may not be appropriate to assumethat the nature and extent to which demands andresources affect work ability are consistent across dif-ferent workers sampled from different nations. Yet, asour study samples are convenience samples, we cannotdraw firm conclusions regarding cross-national differ-ences. Nationally representative samples are particu-larly needed in this regard. A nationally representativestudy of work ability has been done in Finland (seeGould et al., 2008); additional studies around the worldwill enable rigorous comparisons of work abilitybetween nations.
Limitations
The results presented should be interpreted with consid-eration of the study limitations. One limitation of thisstudy, as previously discussed in terms of its implicationsfor testing the JD-R model as applied to work ability, isits single-source, self-report design. We cannot assertcausality: Demands and resources cannot be stated tocause or precede work ability based on these researchfindings. Common method variance is also a concern.Yet, two pieces of evidence from our data suggest thatthe impact of common method variance is limited in thisstudy. First, a lack of correlated residuals in all nationsamples alleviates this concern somewhat (the model fitswere good without correlated residuals; modificationindices did not suggest the presence of highly correlatedresiduals). Second, one sign of common method varianceis the presence of uniformly high correlations amongstudy variables (e.g., Kline, Sulsky, & Rever-Moriyama, 2000; Spector, 2006). The correlationsamong study variables in the overall sample rangedfrom –.02 (role demands and skill discretion) to .31(emotional demands and skill discretion).
Another limitation of the study has to do with variablemeasurement. Two demands (emotional demands andphysical demands) and one resource (supervisor support)were measured using single items, which we are unableto assess for reliability. In addition, although alphas(indicating internal consistency reliability) were gener-ally adequate for each nation, the alpha for role demandsin the Croatia sample was quite low (.28). Therefore, wesuggest using caution when interpreting this coefficient(note that it was, perhaps not surprisingly, nonsignifi-cant). A few additional alphas were also .65–.69, whichare lower than the generally accepted rule of thumb of.70. One advantage of using structural equation model-ling is we were able to model error for each of themultiitem scales in each nation sample.
Another limitation is that we failed to find measure-ment invariance for multiitem measures between nationsamples, which suggests that people in each nation sam-ple may have interpreted the items differently. It isperhaps not surprising that different cultural contextsmay lend to different interpretations of study items; yet,it is concerning in that it is difficult to draw conclusionsabout relationships between the study variables when thefactor structures vary. Future cross-national work abilityresearch should attempt to use scales that have beenempirically found to be stable in a cross-cultural context.Finally, it should be noted that most of the effect sizeswere small to moderate. Among the significant effectsizes for demands and resources relating to work ability,the smallest was only .09 (skill discretion in the Croatiasample), and the largest was moderate (.40 for skilldiscretion in the Australia sample).
CONCLUSION
Work ability is an important concept for researchers andorganizational leaders to consider, especially as the work-force ages around the world. Work ability also has muchto contribute to psychological studies of worker well-being. This study represents one of the first applicationsof a psychological model to the study of work ability. Assuch, we provide insight and direction to other researcherslooking to do the same. Second, through testing the modelin samples of health care workers from six differentnations, we demonstrated the importance of cross-nationalwork ability research. Finally, we found evidence that skilldiscretion and supervisor support are particularly impor-tant to work ability perceptions. Interventions to helppreserve work ability, therefore, should target skill discre-tion and supervisor support. Clearly, there is a lot morework to be done, and we hope to see work in thisimportant area continue.
REFERENCES
Ahlstrom, L., Grimby-Ekman, A., Hagberg, M., & Dellve, L. (2010).The work ability index and single-item question: Associations withsick leave, symptoms, and health—a prospective study of womenon long-term sick leave. Scandinavian Journal of Work,Environment, and Health, 36(5): 404–412.
Aiken, L. A., & West, S. G. (1991). Multiple regression: Testing andinterpreting interactions. Newbury Park, CA: Sage.
Alavania, S. M., de Boer, A. G. E. M., van Duivenbooden, J. C.,Frings-Dresen, M. H. W., & Burdorf, A. (2009). Determinants ofwork ability and its predictive value for disability. OccupationalMedicine, 59, 32–37.
Bakker, A. B., & Demerouti, E. (2007). The Job Demands-Resourcesmodel: State of the art. Journal of Managerial Psychology, 22(3),309–328.
Bakker, A. B., Demerouti, E., & Euwema, M. C. (2005). Job resourcesbuffer the impact of job demands on burnout. Journal ofOccupational Health Psychology, 10(2), 170–180.
Barnes-Farrell, J. L., Bobko, N., Fischer, F., Iskra-Golec, I., Kaliterna,L., & Tepas, D. (2004). Comparisons of work ability for health care
DEMANDS, RESOURCES, AND WORK ABILITY 15
Dow
nloa
ded
by [
Way
ne S
tate
Uni
vers
ity],
[A
lyss
a M
cGon
agle
] at
11:
49 2
6 Ju
ly 2
013

workers in five nations. In J. Ilmarinen & S. Lehtinen (Eds.), Past,present and future of work ability: Proceedings of the 1st interna-tional symposium on Work Ability (People and Work ResearchReports No. 65; pp. 76–82). Helsinki: Finnish Institute ofOccupational Health.
Barnes-Farrell, J., & Piotrowski, M. (1989). Workers’ perceptions ofdiscrepancies between chronological age and personal age: You’reonly as old as you feel. Psychology and Aging, 4(3), 376–377.
Bobko, N. A., & Barishpolets, A. T. (2002). Work ability, age and itsperception, and other related concerns of Ukraine health care work-ers. Experimental Aging Research, 28, 59–71.
Brannick, M. T. (1995). Critical comments on applying covariancestructure modeling. Journal of Organizational Behavior, 16(3),201–213.
Camerino, D., Conway, P. M., Van der Heijden, B. I. J. M., Estryn-Behar,M., Consonni, D., Gould, D., … Hasselhorn, H. (2006). Low per-ceived work ability, ageing and intention to leave nursing: A compar-ison among 10 European countries. Journal of Advanced Nursing, 56,542–552.
Centers for Disease Control and Prevention. (2000, November).Measuring healthy days. Atlanta, GA: Author. Retrieved fromhttp://www.cdc.gov/hrqol/pdfs/mhd.pdf
de Croon, E. M., Sluiter, J. K., Nijssen, T. F., Kammeijer, M.,Dijkmans, B. A. C., Lankhorst, G. J., & Frings-Dresen, M. H. W.(2005). Work ability of Dutch employees with rheumatoid arthritis.Scandinavian Journal of Rheumatology, 34, 277–283.
de Jong, J., Mulder, M. J. G. P., & Nijhuis, F. J. N. (1999). Theincorporation of different demand concepts in the Job Demand-Control model: Effects on health care workers. Social Science andMedicine, 48, 1149–1160.
de Jonge, J., & Dormann, C. (2006). Stressors, resources, and strains atwork: A longitudinal test of the Triple Match Principle. Journal ofApplied Psychology, 91(5), 1359–1374.
Demerouti, E., Bakker, A. B., Nachreiner, F., & Schaufeli, W. B.(2001). The Job Demands-Resources model of burnout. Journalof Applied Psychology, 86(3), 499–512.
Estryn-Behar, M., Kreutz, G., Le Nezet, O., Mouchot, L., Camerino,D., Salles, R. K., … Hasselhorn, H. M. (2005). Promotion of workability among French health care workers—value of the WorkAbility Index. International Congress Series, 1280, 73–78.
Fischer, F. M., Borges, F. N. S., Rotenberg, L., Latorre, M. R. D. O.,Soares, N. S., Rosa, P. L. F. S., … Landsbergis, P. (2006). Workability of health care shift workers: What matters? ChronobiologyJournal, 23, 1165–1179.
Global Health Workforce Alliance. (2010). The Global HealthWorkforce Alliance 2010 annual report: Adding value to health.Retrieved from http://www.who.int/workforcealliance/knowledge/resources/ghwa_annualreport2010_web.pdf
Goodin, H. J. (2002). The nursing shortage in the United States ofAmerica: An integrative review of the literature. Journal ofAdvanced Nursing, 43(4), 335–350.
Gould, R., Martelin, T., Koskinen, S., & Sainio, P. (2008). Work abilityin different population groups. In R. Gould, J. Ilmarinen, J.Järvisalo, & S. Koskinen (Eds.), Dimensions of work ability:Results of the Health 2000 survey (pp. 33–64). Helsinki: FinnishInstitute of Occupational Health.
Hopsu, L., Leppänen, A., Tanta, R., & Louhevaara, V. (2005).Perceived work ability and individual characteristics as predictorsfor early exit from working life in professional cleaners.International Congress Series, 1280, 84–88.
Hu, L. T., & Bentler, P. M. (1999). Cutoff criteria for fit indices incovariance structure analysis: Conventional criteria versus newalternatives. Structural Equation Modeling, 6, 1–55.
Ilmarinen, J., Gould, R., Järvikoski, A., & Järvisalo, J. (2008).Diversity of work ability. In R. Gould, J. Ilmarinen, J. Järvisalo,& S. Koskinen (Eds.), Dimensions of work ability: Results of theHealth 2000 survey (pp. 13–24). Helsinki: Finnish Institute ofOccupational Health.
Ilmarinen, J., Tuomi, K., Eskelinen, L., Nygård, C. H., Huuhtanen, P.,& Klockars, M. (1991a). Background and objectives of the Finnishresearch project on aging workers in municipal occupations.Scandinavian Journal of Work, Environment and Health, 17(Suppl. 1), 7–11.
Ilmarinen, J., Tuomi, K., Eskelinen, L., Nygård, C. H., Huuhtanen, P., &Klockars, M. (1991b). Summary and recommendations of a projectinvolving cross-sectional and follow-up studies on the aging worker inFinnish municipal occupations (1981–1985). Scandinavian Journal ofWork, Environment and Health, 17(Suppl. 1), 135–141.
Ilmarinen, J., Tuomi, K., & Seitsamo, J. (2005). New dimensions ofwork ability. International Congress Series, 1280, 3–7.
Jones, B., Flynn, D. M., & Kelloway, E. K. (1995). Perceptions ofsupport from the organization in relation to work stress, satisfaction,and commitment. In S. L. Sauter & L. R. Murphy (Eds.),Organizational risk factors for job stress (pp. 41–52).Washington, DC: American Psychological Association.
Kahn, R. L., Wolfe, D. M., Quinn, R. P., Snoek, J. D., & Rosenthal, R.A. (1964). Organizational stress: Studies in role conflict and ambi-guity. New York, NY: Wiley.
Karasek, R. (1979). Job demands, job decision latitude, and mentalstrain: Implications for job redesign. Administrative ScienceQuarterly, 24, 285–308.
Karasek, R., Brisson, C., Kawakami, N., Houtman, I., Bongers, P., &Amick, B. (1998). The Job Content Questionnaire (JCQ): Aninstrument for internationally comparative assessments of psycho-social of characteristics. Journal of Occupational HealthPsychology, 3, 322–355.
Kline, T., Sulsky, L., & Rever-Moriyama, S. (2000). Common methodvariance and specification errors: A practical approach to detection.Journal of Psychology, 134, 401–421.
Lazarus, R. S., & Folkman, S. (1984). Stress, appraisal, and coping.New York, NY: Springer.
Lindberg, P., Vingard, E., Josephson, M., & Alfredsson, L. (2005).Retaining the ability to work: Associated factors at work.European Journal of Public Health, 16(5), 470–475.
McClelland, G. H., & Judd, C. M. (1993). Statistical difficulties ofdetecting interactions and moderator effects. PsychologicalBulletin, 114(2), 376–390.
McVicar, A. (2003). Workplace stress in nursing: A literature review.Journal of Advanced Nursing, 44(6): 633–642.
Meade, A. W., Johnson, E. C., & Braddy, P. W. (2008). Power andsensitivity of alternative fit indices in tests of measurement invar-iance. Journal of Applied Psychology, 93(3), 568–592.
Molinie, A. F. (2005). Feeling capable of remaining in the same jobuntil retirement? International Congress Series, 1280, 112–117.
National Center for Health Workforce Analysis. (2013, April).Washington, DC: Bureau of Health Professions, Health Resourcesand Services Administration. The U.S. Nursing Workforce: Trendsin Supply and Education. Retrieved from http://bhpr.hrsa.gov/healthworkforce/reports/nursingworkforce/nursingworkforcefullreport.pdf
Nelson, D. L., & Simmons, B. L. (2011). Savoring eustress whilecoping with distress: The holistic model of stress. In J. C. Quick& L. E. Tetrick (Eds.), Handbook of occupational health psychol-ogy (pp. 55–74). Washington, DC: American PsychologicalAssociation.
Osmotherly, P., & Attria, J. (2006). The healthy worker survivor effectin a study of neck muscle performance measures in call-centreoperators. Work, 26, 399–406.
Peeters, M. C. W., & Le Blanc, P. M. (2001). Towards a match betweenjob demands and sources of social support: A study among oncol-ogy care providers. European Journal of Work and OrganizationalPsychology, 10(1), 53–72.
Piko, B. F. (2006). Burnout, role conflict, job satisfaction and psy-chosocial health among Hungarian health care staff: A question-naire survey. International Journal of Nursing Studies, 43,311–318.
16 MCGONAGLE ET AL.
Dow
nloa
ded
by [
Way
ne S
tate
Uni
vers
ity],
[A
lyss
a M
cGon
agle
] at
11:
49 2
6 Ju
ly 2
013
Quick, J. C., Quick, J. D., Nelson, D. L., & Hurrell, J. J. J. (1997).Preventive stress management in organizations. Washington, DC:American Psychological Association.
Seibt, R., Spitzer, S., Blank, M., & Scheuch, K. (2009). Predictors ofwork ability in occupations with psychological stress. Journal ofPublic Health, 17, 9–18.
Seitsamo, J., & Ilmarinen, J. (1997). Life-style, aging and work abilityamong active Finnish workers in 1981–1992. Scandinavian Journalof Work, Environment and Health, 23(Suppl. 1), 20–26.
Sjögren-Rönkä, T., Ojanen, M., Esko, L., Mustalampi, S. T., & Mälkiä,E. A. (2002). Physical and psychosocial prerequisites of functioningin relation to work ability and general subjective well-being amongoffice workers. Scandinavian Journal of Work, Environment andHealth, 28(3): 184–190.
Spector, P. (2006). Method variance in organizational research:Truth or urban legend? Organizational Research Methods, 9,221–232.
Sterling, T. D., & Weinkam, J. J. (1986). Extent, persistence andconstancy of the healthy worker or healthy person effect by alland selected causes of death. Journal of Occupational Medicine,28, 348–353.
Tuomi, K., Huuhtanen, P., Nykyri, E., & Ilmarinen, J. (2001).Promotion of work ability, the quality of work and retirement.Occupational Medicine, 51(5): 318–324.
Tuomi, K., Ilmarinen, J. A., Jahkola, A., Katajarinne, L., & Tulkki, A.(1998). Work Ability Index (2nd ed.). Helsinki: Finnish Institute ofOccupational Health.
Tuomi, K., Ilmarinen, J., Martikainen, R., Aalto, L., & Klockars, M.(1997). Aging, work, life style and work ability among Finnishmunicipal workers in 1981–1992. Scandinavian Journal of Work,Environment and Health, 23(1): 58–65.
Tuomi, K., Ilmarinen, J., Seitsamo, J., Huuhtanen, P., Martikainen, R.,Nygård, C. H., Klockars,M. (1997). Summary of the Finnish ResearchProject (1981–1992) to promote health and work ability of ageingworkers. Scandinavian Journal of Work, Environment and Health, 23,66–67.
Tuomi, K., Vanhala, S., Nykyri, E., & Janhonen, M. (2004).Organizational practices, work demands and the well-being ofemployees: A follow-up study in the metal industry and retailtrade. Occupational Medicine, 54, 115–121.
Van der Doef, M., & Maes, S. (1999). The Job Demand-Control-Support model and psychological well-being: A review of 20years of empirical research. Work and Stress, 13(2), 87–114.
Orginal manuscript received February 2012Revised manuscript received April 2013
First published online July 2013
DEMANDS, RESOURCES, AND WORK ABILITY 17
Dow
nloa
ded
by [
Way
ne S
tate
Uni
vers
ity],
[A
lyss
a M
cGon
agle
] at
11:
49 2
6 Ju
ly 2
013