Demand Forecasting of Electricity and Optimal Locationing of Transformer Locations Using Geo-Spatial...
17
1 23 Applied Spatial Analysis and Policy ISSN 1874-463X Appl. Spatial Analysis DOI 10.1007/s12061-014-9121-3 Demand Forecasting of Electricity and Optimal Locationing of Transformer Locations Using Geo-Spatial Techniques: A Case Study of Districts of Bihar, India Prerna R. & Prasun K. Gangopadhyay
-
Upload
independent -
Category
Documents
-
view
1 -
download
0
Transcript of Demand Forecasting of Electricity and Optimal Locationing of Transformer Locations Using Geo-Spatial...
1 23
Applied Spatial Analysis and Policy ISSN 1874-463X Appl. Spatial AnalysisDOI 10.1007/s12061-014-9121-3
Demand Forecasting of Electricity andOptimal Locationing of TransformerLocations Using Geo-Spatial Techniques: ACase Study of Districts of Bihar, India
Prerna R. & Prasun K. Gangopadhyay

1 23
Your article is protected by copyright and all
rights are held exclusively by Springer Science
+Business Media Dordrecht. This e-offprint
is for personal use only and shall not be self-
archived in electronic repositories. If you wish
to self-archive your article, please use the
accepted manuscript version for posting on
your own website. You may further deposit
the accepted manuscript version in any
repository, provided it is only made publicly
available 12 months after official publication
or later and provided acknowledgement is
given to the original source of publication
and a link is inserted to the published article
on Springer's website. The link must be
accompanied by the following text: "The final
publication is available at link.springer.com”.
Demand Forecasting of Electricity and Optimal Locationingof Transformer Locations Using Geo-Spatial Techniques:A Case Study of Districts of Bihar, India
Prerna R. & Prasun K. Gangopadhyay
Received: 9 May 2014 /Accepted: 9 September 2014# Springer Science+Business Media Dordrecht 2014
Abstract In the present study an attempt has been made to identify the demand of eachhousehold in the study area, in order to divide the villages into pockets of high, moderateand low priority for provision of electrification. This division is based on a “PriorityIndex” that has been designed in a manner to address the variations in electricity demandalso considering the socio-economic background of the household dwellers. Parametersthat were applied in order the assess the socio-economic status were, monthly income/expenditure, rate of literacy, occupational structure, number of school going children,size of household and level of poverty i.e. identification of APL/BPL households. Out ofthese, the most significant contributors were included in the computation of a bias freePriority Index. The spatial division (as per priority) was helpful in proposing potentiallocations for the placement of new transformers, providing higher spatial coverage withplanned energy allocation and minimized transmission loss. According to this method-ology, a holistic categorization was achieved which closely identified the pockets neededto be given highest priority for providing electricity, without compromising on greatestspatial coverage. The average percentage of households that remained uncovered acrossthe five villages studied was 9.68 % only, promising a reasonably high coverage.
Keywords Demand forecasting . Priority Index . Transformers . RGGVY
Appl. Spatial AnalysisDOI 10.1007/s12061-014-9121-3
P. R. (*)Department of Natural Resources, TERI University, 10 Vasant Kunj, New Delhi 110070, Indiae-mail: [email protected]
P. R.e-mail: [email protected]
P. K. GangopadhyayThe Energy and Resources Institute (TERI), Darbari Seth Block, IHC Complex, Lodhi Road, NewDelhi 110003, India
Present Address:P. K. GangopadhyayNational Centre for Antarctic and Ocean Research, Headland Sada, Vasco-da-Gama, Goa 403804, India
Author's personal copy
Introduction
The use of Geographic Information Systems (GIS) in the planning and developmentsector has, over the years, gained importance and popularity due to its high efficiencyand robustness. There have been several instances where GIS and remotely sensed datahave been brought together in order to identify pockets for intensifying electrification,delineating routes for placing transformer lines, grid network analysis and so forth.
Rural electrification is one such domain of the planning sector that needs continualobservation and management so as to aid in timely development and distribution. Thedevelopment of any rural area depends on a multitude of factors and for a rapidlyprogressing country like India, it becomes prerogative for every rural community to beprovided with all basic requirements, in order to utilize its resources in maintainingitself and commit in the betterment of the entire economy. One of these rudimentarynecessities of life is the access to electricity.
Over the years, it has been observed that the people, who belong to rural India, havediversified so much in terms of their lifestyle that the need for a reasonable supply ofelectricity is a must so as to be able to maintain their daily lifestyles. The era of oillamps and incandescent lighting sources has been replaced with energy efficient bulbsfor e.g. CFLs, mechanized tools for irrigation, television sets, dish antennas etc.showing the transition of rural lifestyle. This clearly indicates the upliftment of themarginal classes but at the same time, also lays more stress on the government to caterto these growing demands.
Several initiatives have been taken by the government from time to time aiming atthe reduction of power distribution inequalities in the economy coupled with intensiveelectrification of rural sections. One such widespread programme of the Indian gov-ernment is the Rajiv Gandhi Grameen Vidyutikaran Yojana (RGGVY) which aims atproviding electricity to all rural households of India and free of cost service connectionfor Below Poverty Line (BPL) households (RGGVYat a glance 2005). Also, one of themain objectives of the scheme is a minimum daily supply of 6–8 h of electricity in theRGGVY network with the assurance of meeting any deficit in this context by supplyingelectricity at subsidized tariff as required under the Electricity Act, 2003.
Unfortunately, due to several shortcomings, these primary objectives were notice-ably absent in the villages selected for the purpose of the study. Some of the primereasons for this lacuna between demand and supply are: (1) the load of the transformersis often exceeded by superfluous usage; (2) inadequate knowledge of the villagecommunity to understand the concept of optimum usage of resources; (3) heavypractice of hooking/thieving of electricity; (4) poor maintenance of electrical apparatus.These factors together lead to the absence of electricity, by incapacitating the trans-formers installed to meet the total load of all households in a village even for theminimum duration of 6–8 h. Premature breakdown of transformers mostly because ofthe disproportionate load on them is the most rampant hindrance noticed in mostvillages. Due to the above, such programmes are unable to fetch rightful capability.
Previous researchers have also identified certain more concrete and generalizedfactors that act as deterrents in the functioning of these distribution transformers.Bhalla (2000) has outlined that in order to reduce Transmission and Distribution (Tand D) losses, it is essential to first understand the magnitude of technical andcommercial losses. The prominent reasons for technical losses in India, according to
P. R., P.K. Gangopadhyay
Author's personal copy
his study, are: (a) inadequate investment on T and D causing overloading of thedistribution system without commensurate strengthening and augmentation; (b) hap-hazard growth of distribution systems with short sighted supply goals; (c) large scalerural electrification through long 11 kV and Low Tension Lines; (d) too many stage oftransformations; and (e) poor quality of equipment used in agricultural pumping. Onthe other side, commercial losses are spurred mainly by theft/pilferage accounting for asubstantial part of high T and D losses in the country. As per Bhalla (2000), non-consumers avail unauthorized supply by hooking or tapping the bare conductors of L.T.feeders, while the bonafide consumers cause damage by willfully tampering themeasuring equipment installed at their premises. Due to absence of realistic mecha-nisms of measuring T and D losses, it becomes all the more difficult to estimate revenuerequirements for meeting the loop-holes existing in the energy dissipation network.
It is evident from the above discussion that the major reason for poor performance ofenergy facilitation programmes is the miscalculation of the electricity demand of thearea being served and application of geospatial tools is one of the ways to bridge thisgap. If more and more methodologies can be developed and applied intelligently, theissue of pre-installation planning can be catered for, thereby increasing the life of thetransformers and allowing the people to access an undisrupted flow of electricity wheresupply is adequate.
In the light of the above, this study makes an attempt to assess the merit of theRGGVY programme in five blocks of Gaya and Nawada districts in the state of Bihar,India and also propose a geospatial methodology for identifying the most crucial pocketsin a village requiring greater attention in terms of energy supply. Primarily, the meth-odology follows a thorough door-to-door survey in the villages to identify the reasonsfor poor performance of the installed transformers and also to acquire, as precise aspossible, electricity demand per household. In this way, a demand forecast of the entirevillage has been done to calculate regions of priority which forms the base for theidentification of potential locations of new transformers. The positions and capacity ofthe new transformers have been suggested in congruence with the overall energyrequirement of the village, while being aimed at minimizing T and D losses. Also, theeffectiveness of employing GIS tools resulting in better planning and reduction in totalcost of implementation/maintenance has been highlighted in the study.
Previous Work
There are ample studies that have been conducted to portray the advantages of applyinggeo-spatial techniques in rural electrification planning and network constructions butnot many have applied their methods at the grass root level i.e. they have been limitedto the district or state level. Nevertheless, such works have proved quite beneficial inconstructing the methodology followed in this study and are discussed brieflyhereinafter.
Barnard (2008) utilized various factors for the identification of “the best path for anextension or new network”, the important ones being – roads, land cover, householdpositions and slope, which were combined to obtain a suitability raster with pixelvalues rating equal or near to zero. The conclusion of the study showed that theimplementation of GIS and spatial analysis was highly appreciable in finding areas
Demand Forecasting and Transformer Locationing Using GIS Method
Author's personal copy
which were supply deficit, showed overloaded demand, sparse capacity pockets, idealspaces for new substations establishment and so forth.
Another study by Kaijuka (2006) used a multitude of factors to formulate a networkdevelopment plan for intensifying electrification along the existing routes. Some ofthese variables included population distribution and population density, location ofdemand centers i.e. schools and village trading centers, road network, health centers,and finally the projection of high demand centers or regions as an assimilation of theabove variables. The entire study has been performed on the GIS platform enablingdata interoperability and the effect of one variable over the other. The dynamism androbustness of GIS in managing numerous data sets and several available means tocompare different parameters for studying energy alternatives for rural communities hasbeen established by Dominguez and Pinedo-Pascua (2009) in their research work onLatin American countries.
The above citations give an idea about the relevance of remote sensing and GIStechniques in dealing with the issues of rural electrification planning. However, a verysmall amount of work has been done in this field. There are several countries whichcould exploit the potentiality of such techniques for careful and systematic planningover time.
It has also been advocated by many that rural energy issues cannot be handled bystudying a particular attribute, rather an assortment of parameters have to be incorpo-rated. Rural electrification can be modelled as a multifactorial task connected to a largenumber of variables: decision makers need to choose the appropriate options byconsidering not only the techno-economic competitiveness but also socio-culturaldynamics and environmental consequences, making the task intricate (Rahman et al.2013). Multi-criteria analysis is one such common technique followed by researchersfor holistically studying the parameters that contribute in the variation of electricity in agiven region. Nerini (2012) in his work highlighted the importance of performing amulti-criteria analysis for choosing the right parameters to create a new aggregate indexfor identifying the appropriate electrification technology. It has also been shown byMunda and Russi (2005) that in the case of rural renewable energy policies, multi-criteria analyses aid decision makers to assess the contribution of different parametersand makes planning more effective.
The need for developing such exhaustive approaches to tackle the issue of ruralelectrification is prerogative. Since most failures occur due to the voids existingbetween demand and supply, such techniques can play a significant role in modulatingpre-installation measures, such that no issues are encountered later.
Research Objectives
The most important research question to be answered through this study was to gaugethe level up to which geospatial techniques could be successfully employed in thedomain of rural electrification. This was a challenging task as in most Indian villages,unplanned routes; scattered settlements and unequal demand of the households make itdifficult to develop an approach which could provide electricity in an equitable manner.
The second objective was the computation of an index for dividing the householdsas per priority (considering electricity demand cum socio economic factors); and finally
P. R., P.K. Gangopadhyay
Author's personal copy
to propose new transformer locations catering to the newly defined priority centers.These objectives have been summarized below:
& Data collection at grass root level to assess the contributing factors in load distri-bution and understand the socio-economic background of the village community.
& Selection of the most significant contributors to be incorporated in the PriorityIndex (PI).
& Division of the village as per PI into high, moderate and low.& Identification of new transformer locations in close proximity of high priority
pockets while also attempting for maximum coverage.
Material and Methods
Study Area
The state of Bihar lies in the north eastern part of the Indo Gangetic plains. Itis divided into 38 districts out of which two were selected namely Gaya andNawada. The prime reason for the selection of these two districts was due totheir enlistment in India’s 250 most backward districts in 27 states which arecovered by Backwad Regions Grant Fund Programme (BRGF) launched in2006 (Ministry of Panchayati Raj 2009). Both Gaya and Nawada have a poorpercentage of electrified households with 24.4 and 12.9 % respectively(International Institute for Population Sciences 2010) hence posing anotherreason for their selection in the present study.
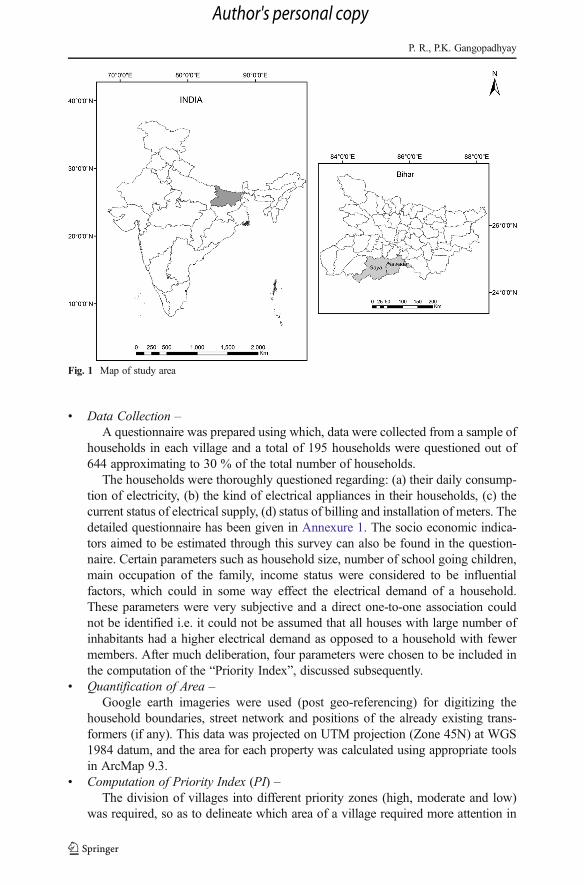
Further, villages were identified from the two districts which fall under theumbrella of the RGGVY and according to ease of accessibility – five villageswere short-listed to initiate the study. The villages are located between 24° 45′and 24° 56′ North latitudes, and 84° 52′ and 85° 22′ East longitudes. Thevillage names with their respective household counts are Ganjas (54); Paharpur(104); Nepa (128); Risaudh (159) and Repura (199), first four from Gayadistrict and the last from Nawada (Fig. 1).
Data Used
For the current study, high resolution images from Google Earth (DigitalGlobe andGeoEye imageries) were extracted and geo-referenced on WGS 1984 datum usingERDAS Imagine 9.1. Thereafter they were projected onto Universal TransverseMercator (Zone 45N) coordinate system which provided the base for generation ofdigitized maps for the study area. Delineation of priority areas, location of transformersand street network was done using the base maps in ArcMap 9.3.
Methodology
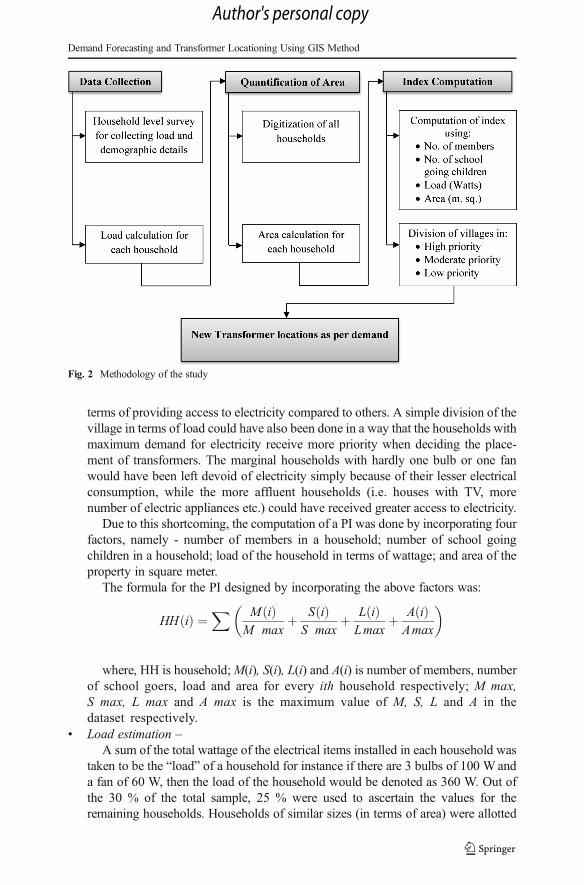
The methodology adopted in the study has been summarized in the flow chart (Fig. 2)shown below:
Demand Forecasting and Transformer Locationing Using GIS Method
Author's personal copy
& Data Collection –A questionnaire was prepared using which, data were collected from a sample of
households in each village and a total of 195 households were questioned out of644 approximating to 30 % of the total number of households.
The households were thoroughly questioned regarding: (a) their daily consump-tion of electricity, (b) the kind of electrical appliances in their households, (c) thecurrent status of electrical supply, (d) status of billing and installation of meters. Thedetailed questionnaire has been given in Annexure 1. The socio economic indica-tors aimed to be estimated through this survey can also be found in the question-naire. Certain parameters such as household size, number of school going children,main occupation of the family, income status were considered to be influentialfactors, which could in some way effect the electrical demand of a household.These parameters were very subjective and a direct one-to-one association couldnot be identified i.e. it could not be assumed that all houses with large number ofinhabitants had a higher electrical demand as opposed to a household with fewermembers. After much deliberation, four parameters were chosen to be included inthe computation of the “Priority Index”, discussed subsequently.
& Quantification of Area –Google earth imageries were used (post geo-referencing) for digitizing the
household boundaries, street network and positions of the already existing trans-formers (if any). This data was projected on UTM projection (Zone 45N) at WGS1984 datum, and the area for each property was calculated using appropriate toolsin ArcMap 9.3.
& Computation of Priority Index (PI) –The division of villages into different priority zones (high, moderate and low)
was required, so as to delineate which area of a village required more attention in
Fig. 1 Map of study area
P. R., P.K. Gangopadhyay
Author's personal copy
terms of providing access to electricity compared to others. A simple division of thevillage in terms of load could have also been done in a way that the households withmaximum demand for electricity receive more priority when deciding the place-ment of transformers. The marginal households with hardly one bulb or one fanwould have been left devoid of electricity simply because of their lesser electricalconsumption, while the more affluent households (i.e. houses with TV, morenumber of electric appliances etc.) could have received greater access to electricity.
Due to this shortcoming, the computation of a PI was done by incorporating fourfactors, namely - number of members in a household; number of school goingchildren in a household; load of the household in terms of wattage; and area of theproperty in square meter.
The formula for the PI designed by incorporating the above factors was:
HH ið Þ ¼X M ið Þ
M maxþ S ið Þ
S maxþ L ið Þ
Lmaxþ A ið Þ
Amax
� �
where, HH is household;M(i), S(i), L(i) and A(i) is number of members, numberof school goers, load and area for every ith household respectively; M max,S max, L max and A max is the maximum value of M, S, L and A in thedataset respectively.
& Load estimation –A sum of the total wattage of the electrical items installed in each household was
taken to be the “load” of a household for instance if there are 3 bulbs of 100 W anda fan of 60 W, then the load of the household would be denoted as 360 W. Out ofthe 30 % of the total sample, 25 % were used to ascertain the values for theremaining households. Households of similar sizes (in terms of area) were allotted
Fig. 2 Methodology of the study
Demand Forecasting and Transformer Locationing Using GIS Method
Author's personal copy
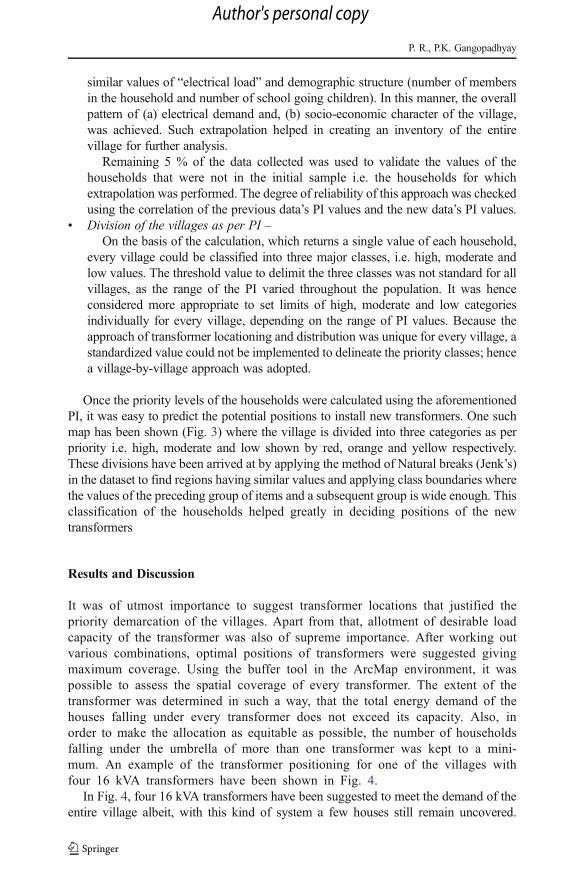
similar values of “electrical load” and demographic structure (number of membersin the household and number of school going children). In this manner, the overallpattern of (a) electrical demand and, (b) socio-economic character of the village,was achieved. Such extrapolation helped in creating an inventory of the entirevillage for further analysis.
Remaining 5 % of the data collected was used to validate the values of thehouseholds that were not in the initial sample i.e. the households for whichextrapolation was performed. The degree of reliability of this approach was checkedusing the correlation of the previous data’s PI values and the new data’s PI values.
& Division of the villages as per PI –On the basis of the calculation, which returns a single value of each household,
every village could be classified into three major classes, i.e. high, moderate andlow values. The threshold value to delimit the three classes was not standard for allvillages, as the range of the PI varied throughout the population. It was henceconsidered more appropriate to set limits of high, moderate and low categoriesindividually for every village, depending on the range of PI values. Because theapproach of transformer locationing and distribution was unique for every village, astandardized value could not be implemented to delineate the priority classes; hencea village-by-village approach was adopted.
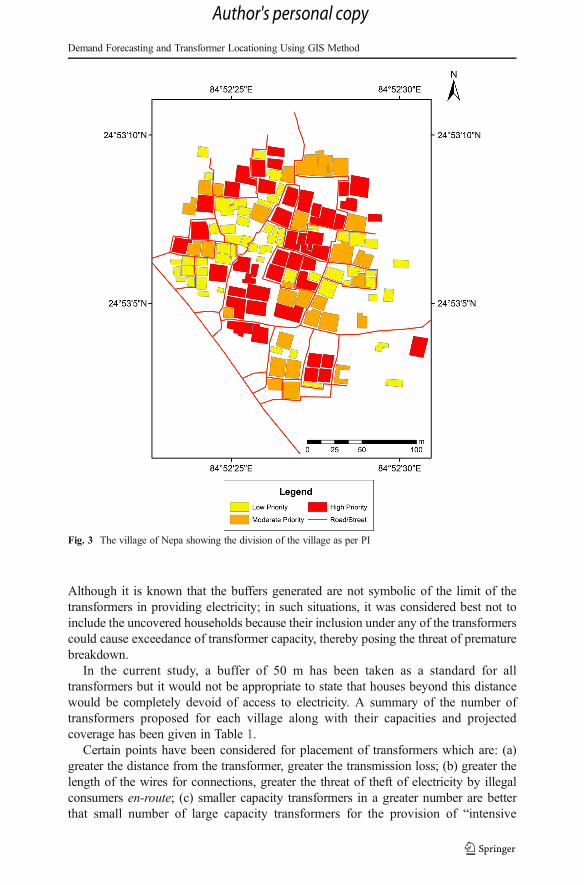
Once the priority levels of the households were calculated using the aforementionedPI, it was easy to predict the potential positions to install new transformers. One suchmap has been shown (Fig. 3) where the village is divided into three categories as perpriority i.e. high, moderate and low shown by red, orange and yellow respectively.These divisions have been arrived at by applying the method of Natural breaks (Jenk’s)in the dataset to find regions having similar values and applying class boundaries wherethe values of the preceding group of items and a subsequent group is wide enough. Thisclassification of the households helped greatly in deciding positions of the newtransformers
Results and Discussion
It was of utmost importance to suggest transformer locations that justified thepriority demarcation of the villages. Apart from that, allotment of desirable loadcapacity of the transformer was also of supreme importance. After working outvarious combinations, optimal positions of transformers were suggested givingmaximum coverage. Using the buffer tool in the ArcMap environment, it waspossible to assess the spatial coverage of every transformer. The extent of thetransformer was determined in such a way, that the total energy demand of thehouses falling under every transformer does not exceed its capacity. Also, inorder to make the allocation as equitable as possible, the number of householdsfalling under the umbrella of more than one transformer was kept to a mini-mum. An example of the transformer positioning for one of the villages withfour 16 kVA transformers have been shown in Fig. 4.
In Fig. 4, four 16 kVA transformers have been suggested to meet the demand of theentire village albeit, with this kind of system a few houses still remain uncovered.
P. R., P.K. Gangopadhyay
Author's personal copy
Although it is known that the buffers generated are not symbolic of the limit of thetransformers in providing electricity; in such situations, it was considered best not toinclude the uncovered households because their inclusion under any of the transformerscould cause exceedance of transformer capacity, thereby posing the threat of prematurebreakdown.
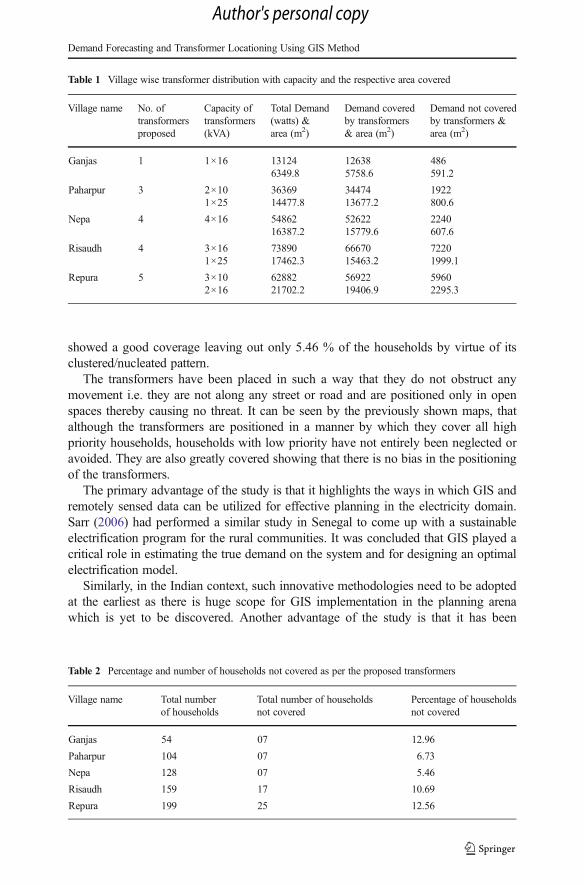
In the current study, a buffer of 50 m has been taken as a standard for alltransformers but it would not be appropriate to state that houses beyond this distancewould be completely devoid of access to electricity. A summary of the number oftransformers proposed for each village along with their capacities and projectedcoverage has been given in Table 1.
Certain points have been considered for placement of transformers which are: (a)greater the distance from the transformer, greater the transmission loss; (b) greater thelength of the wires for connections, greater the threat of theft of electricity by illegalconsumers en-route; (c) smaller capacity transformers in a greater number are betterthat small number of large capacity transformers for the provision of “intensive
Fig. 3 The village of Nepa showing the division of the village as per PI
Demand Forecasting and Transformer Locationing Using GIS Method
Author's personal copy

electrification”; (d) smaller capacity transformers (equal to or less than 25 kVA) areconsidered safer and easier to maintain as opposed to bigger transformers; (e) smallercapacity transformers can be placed closer to households due to their safety and smallsize, while bigger ones must be placed away from local regions of influence.
Conclusions and Policy Implications
In all five villages, the ratio between the households not covered to the total number ofhouseholds goes to a maximum of 12.96 % indicating a good coverage, with anaverage of 9.68 % (Table 2).
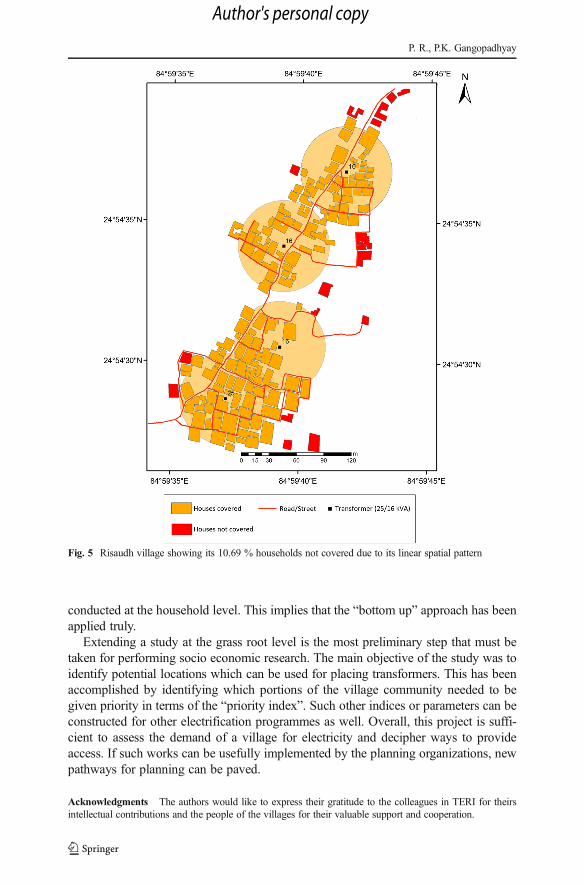
The spatial pattern of the village also seems to have a significant impact on themodeling of transformer load division, for example in village Risaudh more than 1/10thof the households were left out due to the linear pattern of its dwellings (Fig. 5). On theother hand, village Nepa, which is an equally large village with 128 households,
Fig. 4 Nepa village with new transformer locations showing maximum coverage
P. R., P.K. Gangopadhyay
Author's personal copy
showed a good coverage leaving out only 5.46 % of the households by virtue of itsclustered/nucleated pattern.
The transformers have been placed in such a way that they do not obstruct anymovement i.e. they are not along any street or road and are positioned only in openspaces thereby causing no threat. It can be seen by the previously shown maps, thatalthough the transformers are positioned in a manner by which they cover all highpriority households, households with low priority have not entirely been neglected oravoided. They are also greatly covered showing that there is no bias in the positioningof the transformers.
The primary advantage of the study is that it highlights the ways in which GIS andremotely sensed data can be utilized for effective planning in the electricity domain.Sarr (2006) had performed a similar study in Senegal to come up with a sustainableelectrification program for the rural communities. It was concluded that GIS played acritical role in estimating the true demand on the system and for designing an optimalelectrification model.
Similarly, in the Indian context, such innovative methodologies need to be adoptedat the earliest as there is huge scope for GIS implementation in the planning arenawhich is yet to be discovered. Another advantage of the study is that it has been
Table 1 Village wise transformer distribution with capacity and the respective area covered
Village name No. oftransformersproposed
Capacity oftransformers(kVA)
Total Demand(watts) &area (m2)
Demand coveredby transformers& area (m2)
Demand not coveredby transformers &area (m2)
Ganjas 1 1×16 131246349.8
126385758.6
486591.2
Paharpur 3 2×101×25
3636914477.8
3447413677.2
1922800.6
Nepa 4 4×16 5486216387.2
5262215779.6
2240607.6
Risaudh 4 3×161×25
7389017462.3
6667015463.2
72201999.1
Repura 5 3×102×16
6288221702.2
5692219406.9
59602295.3
Table 2 Percentage and number of households not covered as per the proposed transformers
Village name Total numberof households
Total number of householdsnot covered
Percentage of householdsnot covered
Ganjas 54 07 12.96
Paharpur 104 07 6.73
Nepa 128 07 5.46
Risaudh 159 17 10.69
Repura 199 25 12.56
Demand Forecasting and Transformer Locationing Using GIS Method
Author's personal copy
conducted at the household level. This implies that the “bottom up” approach has beenapplied truly.
Extending a study at the grass root level is the most preliminary step that must betaken for performing socio economic research. The main objective of the study was toidentify potential locations which can be used for placing transformers. This has beenaccomplished by identifying which portions of the village community needed to begiven priority in terms of the “priority index”. Such other indices or parameters can beconstructed for other electrification programmes as well. Overall, this project is suffi-cient to assess the demand of a village for electricity and decipher ways to provideaccess. If such works can be usefully implemented by the planning organizations, newpathways for planning can be paved.
Acknowledgments The authors would like to express their gratitude to the colleagues in TERI for theirsintellectual contributions and the people of the villages for their valuable support and cooperation.
Fig. 5 Risaudh village showing its 10.69 % households not covered due to its linear spatial pattern
P. R., P.K. Gangopadhyay
Author's personal copy

Annexure 1
Demand Forecasting and Transformer Locationing Using GIS Method
Author's personal copy

References
Barnard, J. (2008). Using GIS in electrification and network planning. Eskom Distribution, GIS Technical,2008, 25–31. Available at: http://www.eepublishers.co.za/images/upload/GIST%20-%20Using%20GIS%20in%20electrification.pdf.
Bhalla, M. S. (2000) Transmission and Distribution Losses (Power), In Proceedings of the NationalConference on Regulation in infrastructure Services: progress and way forward, The Energy andResources Institute, New Delhi, India. Available at: http://www.teriin.org/index.php?option=com_publication&task=details&sid=355.
Dominguez, J., & Pinedo-Pascua, I. (2009) GIS Tool for Rural Electrification with RenewableEnergies in Latin America, Proceeding GEOWS ’09 Proceedings of the 2009 International
P. R., P.K. Gangopadhyay
Author's personal copy

Conference on Advanced Geographic Information Systems & Web Services, pp. 171–176, ISBN:978-0-7695-3527-2, doi:10.1109/GEOWS.2009.25. Available at: http://dl.acm.org/citation.cfm?id=1510683.
International Institute for Population Sciences (IIPS). (2010) District Level Household and Facility Survey(DLHS-3), 2007-08: India. Bihar: Mumbai: IIPS. Available at: http://www.rchiips.org/pdf/rch3/report/bh.pdf.
Kaijuka, E. (2006). GIS and rural electricity planning: a case study Uganda, IT Power – Uganda. ATDFJournal, 2(2), 23–28. Available at: http://www.atdforum.org/IMG/pdf/GISUnganda.pdf.
Ministry of Panchayati Raj. (2009) A Note on the Backward Regions Grant Fund Programme, 8th September2009, National Institute of Rural Development, pp. 13–14. Available at: http://www.nird.org.in/brgf/doc/brgf_BackgroundNote.pdf.
Munda, G., & Russi, D. (2005) Energy Policies for Rural Electrification: A Social Multi-criteria EvaluationApproach, European Commission – Join Research Centre (EC-JRC), Italy and Universitat Autonoma deBarcelona Dept. of Economics and Economic History and Institute for Environmental Sciences andTechnologies, Spain, 26/2005 – UHE/UAB – 10.01.2005. Available at: http://www.h-economica.uab.es/wps/2005_01.pdf.
Nerini, F., Francesco, (2012) Possibilities of Rural Electrification in the Brazilian Amazon: A multi-criteriaanalysis to compare the most promising technological solutions, Masters’ Thesis, Erasmus MundusMaster’s Program in Environmental Pathways for Sustainable Energy Systems (SELECT). Availableat: http://www.diva-portal.org/smash/get/diva2:608450/FULLTEXT01.pdf.
Rahman, M. M., Paatero, J. V., & Lahdelma, R. (2013). Evaluation of choices for sustainable ruralelectrification in developing countries: a multi-criteria approach. Energy Policy, 59, 589–599. doi:10.1016/j.enpol.2013.04.017. Available at: http://www.sciencedirect.com/science/article/pii/S0301421513002565.
RGGVY. (2005) Rajeev Gandhi Grameen Vidyutikaran Yojana at a glance, Rural Electrification CorporationLtd., Ministry of Power, Government of India. Available at: http://rggvy.gov.in/rggvy/rggvyportal/index.html
Sarr, O. (2006) The Republic of Senegal Uses GIS for Rural Electrification, Agence SenegalaiseD’electrification Rurale (ARES), Article posted on ESRI ArcNews. Available at: http://www.esri.com/news/arcnews/summer02articles/republic-of.html.
Demand Forecasting and Transformer Locationing Using GIS Method
Author's personal copy