Deinking selectivity ( Z-factor): a new parameter to evaluate the performance of flotation deinking...
9
ELSEVIER Available online at www.sciencedirect.com Separation and Purification Technology 43 (2005) 33- 41 Separation Purification Technology www.elsevier.com/locate/seppur Deinking selectivity ( Z -factor): a new parameter to evaluate the performance of flotation deinking process J.Y. Zhu a, *, F. Tan a , K.L. Scallon a , Y.L. Zhao b , Y. Deng b a USDA Forest Service Forest Products Laboratory One Gifford Pinchot Dr., Madison WI 53 726-2398 USA b School of Chemical and Biomolecular Engineering, Georgia Institute of Technology, Atlanta, GA, USA Received 2 March 2004, received in revised form 24 September 2004, accepted 28 September 2004 Abstract This study proposes a deinking selectivity concept that considers both ink removal and fiber yield in determining the performance of deinking operations. The defined deinking selectivity. or Z -factor, is expressed by the ratio of ink removal expressed by the International Standards Organization (ISO) brightness gain or the reduction in relative effective residual ink concentration (ERIC) and the relative fiber (oven- dry basis) rejection loss. For most flotation processes, typical brightness Z -factor is on the order of unit value and ERIC Z -factor is on the order of 10 units. Therefore. the Z - factor weighted brightness gain and ERIC reduction have relevance to ISO brightness and ordinary ERIC reduction. Pilot - scale flotation deinking experiments showed that Z - factor weighted brightness gain and ERIC reduction are good indicators of deinking process efficiency. The period or stage Z -factors are good indicators of the efficiency of the periods or stages of a deinking process. The ERIC Z -factor can be directly related to the separation factor defined in chemical engineering science. A simple criterion developed using the stage Z - factor concept was applied to both pilot - scale experiments and an industrial recycling mill operation for determining the economics of a given period or stage in a flotation deinking operation. © 2004 Elsevier B.V. All rights reserved. Keywords: Flotation deinking; Paper recycling; Secondary fibers; Deinking sensitivity; Fiber yield; Fiber loss 1. Introduction Since its introduction in the 1980s, flotation deinking has been adopted as a standard practice for removing ink from wastepaper in paper recycling operations. Inks are detached from fibers through the pulping process before flotation. The objective of the flotation process is to remove the detached inks from the fiber suspension by injecting air bubbles, with the assumption that the hydrophobic ink particles will stick to air bubbles on collision. Ink is removed when the ink-attached bubble froth floats to the top of a flotation cell and is rejected. An increase in froth rejection rate results in an increase in ink removal. Unfortunately, the bubble froth rejection process also rejects fibers, primarily as a result of the entrainment of fiber into the bubble network [1–5]. Furthermore, fiber *Corresponding author. Tel.: +1 608 231 9520; fax: +1 509 277 0420. E-mail address: [email protected] (J.Y. Zhu). rejection loss is increased with an increase of froth rejection [3]. It is apparent that increased ink removal and fiber yield are two contradictory requirements in flotation operations, which makes flotation deinking so different from mineral flotation. Because the primary concerns in most paper recycling mill operations are machine or process runnability and meeting the ink removal specifications of mill customers without ad- ditional processing (e.g, bleaching or washing), most studies on flotation deinking have primarily focused on removal of contaminants. These studies include understanding pulping chemistry and process [6–10] to achieve good ink separation from the fibers for removing ink, removal of wax or stickies through flotation [ 1 1,12], and flotation chemistry to improve ink removal [13-19]. Typical gains of pulp brightness around 10% ISO standard [20] and effective residual ink concentra- tion (ERIC) reduction of 75% through flotation are common in laboratory or mill operations. Pulp ISO brightness is de- fined as the ratio of the radiance of wavelength 457 nm of a 1383-5866/$ – see front matter © 2004 Elsevier B.V. All rights reserved. doi: 10.1016/j.seppur.2004.09.011
-
Upload
independent -
Category
Documents
-
view
4 -
download
0
Transcript of Deinking selectivity ( Z-factor): a new parameter to evaluate the performance of flotation deinking...
ELSEVIER
Available online at www.sciencedirect.com
Separation and Purification Technology 43 (2005) 33-41
Separation Purification Technology
www.elsevier.com/locate/seppur
Deinking selectivity ( Z -factor): a new parameter to evaluate the performance of flotation deinking process
J.Y. Zhu a, *, F. Tan a , K.L. Scallon a , Y.L. Zhao b , Y. Deng b
a USDA Forest Service Forest Products Laboratory One Gifford Pinchot Dr., Madison WI 53 726-2398 USA b School of Chemical and Biomolecular Engineering, Georgia Institute of Technology, Atlanta, GA, USA
Received 2 March 2004, received in revised form 24 September 2004, accepted 28 September 2004
Abstract
This study proposes a deinking selectivity concept that considers both ink removal and fiber yield in determining the performance of deinking operations. The defined deinking selectivity. or Z -factor, is expressed by the ratio of ink removal expressed by the International Standards Organization (ISO) brightness gain or the reduction in relative effective residual ink concentration (ERIC) and the relative fiber (oven-dry basis) rejection loss. For most flotation processes, typical brightness Z -factor is on the order of uni t value and ERIC Z -factor is on the order of 10 units. Therefore. the Z -factor weighted brightness gain and ERIC reduction have relevance to ISO brightness and ordinary ERIC reduction. Pilot-scale flotation deinking experiments showed that Z -factor weighted brightness gain and ERIC reduction are good indicators o f deinking process efficiency. The period or stage Z -factors are good indicators o f the efficiency of the periods or stages o f a deinking process. The ERIC Z -factor can be directly related to the separation factor defined in chemical engineering science. A simple criterion developed using the stage Z -factor concept was applied to both pilot-scale experiments and an industrial recycling mill operation for determining the economics o f a given period or stage in a flotation deinking operation. © 2004 Elsevier B.V. All rights reserved.
Keywords: Flotation deinking; Paper recycling; Secondary fibers; Deinking sensitivity; Fiber yield; Fiber loss
1. Introduction
Since its introduction in the 1980s, flotation deinking has been adopted as a standard practice for removing ink from wastepaper in paper recycling operations. Inks are detached from fibers through the pulping process before flotation. The objective of the flotation process is to remove the detached inks from the fiber suspension by injecting air bubbles, with the assumption that the hydrophobic ink particles will stick to air bubbles on collision. Ink is removed when the ink-attached bubble froth floats to the top of a flotation cell and is rejected. An increase in froth rejection rate results in an increase in ink removal. Unfortunately, the bubble froth rejection process also rejects fibers, primarily as a result of the entrainment of fiber into the bubble network [1–5] . Furthermore, fiber
* Corresponding author. Tel.: +1 608 231 9520; fax: +1 509 277 0420. E-mail address: [email protected] (J.Y. Zhu).
rejection loss is increased with an increase of froth rejection [3] . It is apparent that increased ink removal and fiber yield are two contradictory requirements in flotation operations, which makes flotation deinking so different from mineral flotation.
Because the primary concerns in most paper recycling mill operations are machine or process runnability and meeting the ink removal specifications of mill customers without ad- ditional processing (e.g, bleaching or washing), most studies on flotation deinking have primarily focused on removal of contaminants. These studies include understanding pulping chemistry and process [6–10] to achieve good ink separation from the fibers for removing ink, removal of wax or stickies through flotation [ 1 1,12] , and flotation chemistry to improve ink removal [13-19] . Typical gains of pulp brightness around 10% ISO standard [20] and effective residual ink concentra- tion (ERIC) reduction of 75% through flotation are common in laboratory or mill operations. Pulp ISO brightness is de- fined as the ratio of the radiance of wavelength 457 nm of a
1383-5866/$ – see front matter © 2004 Elsevier B.V. All rights reserved. doi: 10.1016/j.seppur.2004.09.011
34 J. Y. Zhu et al. / Separation and Purification Technology 43 (2005) 33–41
paper specimen made from the pulp sample in question to that of a perfect reflecting diffuser (e.g., magnesium oxide). ERIC is defined as the ratio of the absorption coefficient of the paper specimen to that of ink at wavelength of 950 nm (normally assumed to be 10,000 m2/kg ifmeasurements are not available). It can measure the amount of ink on paper through calibration. Little attention has been paid to the im- provement of fiber yield through flotation. After studying the fiber entrapment mechanism of fiber loss in flotation deink- ing [5, 21] , water spray was used to reduce the fiber trapped in the bubble network and thereby increase yield in a laboratory study [21] .
A frothing agent spray concept was proposed to obtain separate control of froth stability to increase fiber yield and optimize ink removal in deinking of toner printed papers in a laboratory column flotation cell [4] . This concept was later successfully demonstrated using a mixture of old newsprint (ONP) and old magazine (OMG) furnishin a pilot-scale com- mercial flotation cell [22] . However, a limited number of com- mercial trials of the frothing agent spray concept have been conducted. Typical yield losses in recycling mill operatiom are about 10–25%, which contributes to the higher cost of recycled fibers compared with that of virgin fibers. Because loss in fiber yield is mainly caused by the same process used for removing ink in flotation, i.e., the froth rejection process, it is logical to take an integrated approach to study flotation deinking and to evaluate flotation deinking process perfor- mance. That is, the flotation process has to be optimized in terms of both high ink removal rate and fiber yield.
The objective of our study was to define a deinking selec- tivity concept that takes into consideration both ink removal and fiber yield loss in a deinking process. The deinking selec- tivity concept was then applied to a set of flotation deinking experiments conducted in a laboratory pilot-scale facility to demonstrate its usefulness in evaluating the performance of the flotation process under various experimental conditions. Note that deinking selectivity is completely different from the flotation selectivity used in mineral flotation. It is a mea- sure of the effectiveness of a deinking process to selectively remove ink. The selectivity used in mineral flotation is to measure the selective separation of various grades of miner- als. The goal of the present study was to develop a balanced evaluation technique to assess the performance of industrial deinking operations.
2. Definitions
In chemical engineering science, the degree of any sepa- ration process is defined by the separation factor [23] . For a two-stream process (accept and reject) in flotation deinking with two components of fiber and ink, the separation factor can be expressed as follows:
Table 1 ISO brightness gain and fiber loss in flotation deinking experiments
Experiment Fiber loss (%) Brightness Selectivity number gain (ISO, %)
1 5.3 8.75 1.64 2 5.9 9.80 1.67 3 10.0 9.97 1.00 4 12.1 8.52 0.70
where x can be the mole or mass fractions, or mole or mass flow rates. Unfortunately, pulp brightness, which has been accepted as a standard to measure the cleanness and visual quality of fibers in the pulp and paper industry, the commer- cial market for recycled fibers, and the academic research community, has no relation to the material mass quantities required in the definitionof separation factor (Eq. (1) ). More- over, the definition in Eq. (1) also requires to evaluate the ma- terial quantities in both the accept and reject streams, which makes the separation factor even more difficult to use.
In a previous study [22] , the ratio of pulp brightness gain after deinking and percentage of relative fiber loss was used to describe flotation deinking selectivity. We found that selec- tivity was effective in differentiating the overall performance of several flotation experiments under various condtions. Table 1 lists the experimental data presented in Figs. 4 and 5 of our previous study [22] to illustrate the effectiveness of selectivity. The data clearly show that experiment 2 was op- timal in terms of low fiber loss and high brightness gain. While experiment 3 resulted in the highest brightness gain, it suffered from very high fiber loss, 40% more than that incurred in experiment 2. Experiment 1 showed the lowest fiber loss, but brightness gain was also lowest among the three experiments. The selectivity data clearly show that the best results were obtained with experiment 2. The initial suc- cess of the term “deinking selectivity” in evaluating deinking performance led us to define deinking selectivity in general terms, including selectivity based on another deinking param- eter, ERIC, a standard to measure the degree of ink removal in industrial deinking operations and academic deinking re- search. Because ERIC can be a measure of the amount of ink remaining on the fibers in the accept stream through calibra- tion, we will relate the ERIC based deinking selectivity to the separation factor later in the text.
2.1. Instantaneous selectivity
Instantaneous deinking selectivity, Z ( t ), is defined as
where G is the relative percentage of change of any ink re- moval parameter, e.g., ISO brightness gain, relative effective residual ink concentration (ERIC) reduction, etc., and Frj is the percentage of fiber rejection loss. Therefore, instanta-
(1)
(2)

J. Y. Zhu et al. / Separation and Purification Technology 43 (2005) 33-41 35
neous brightness selectivity is defined as
where dRE is percentage of ERIC reduction. Eq. (2) can be generalized to define the selectivity for
the removal of wax, color, stickies, and other contaminants in paper recycling when a measure of the removal of these components is used.
2.2. Time-averaged period selectivity (stage selectivity or Z-factor)
In practical deinking operations, it is not possible to eval- uate the operation in an infinitesimal period. The definitions in Eqs. (2), (3a) and (3b) do not apply in practical situations. Rather, time-averaged deinking selectivities over a short pe- riod, ∆ ti, are often used:
(4)
The importance of time-averaged period deinking selec- tivities is their application in various stages of flotation in mill operatiom. When the relative changes of ink removal parameters, i.e., brightness gain or ERIC reduction, and rel- ative fiber loss are evaluated for an individual flotation stage (with typical residence time of 1–2 min), then the calculated time-averaged period selectivities are the selectivities of the individual stage. For this reason, the time-averaged period deinking selectivities can be called stage deinking selectivi- ties, or simply stage Z -factors. The stage Z -factor can be used to evaluate the efficiency of a flotation stage.
2.3. Accumulative deinking selectivity (process selectivity or Z-factor)
Accumulative deinking selectivity or Z -factor is used to evaluate the overall performance of the deinking process. It is the extension of time-averaged selectivity from a short pe- riod to the whole process. Therefore, it is the time-averaged deinking selectivity over the whole process. As a result of the nonlinear nature of deinking processes, the accumulative deinking selectivities or Z -factors are not equal to the mean of the stage selectivities or Z -factors. The accumulative se- lectivities or Z -factors can be calculated from the relative
percentage of change of ink removal parameters and rela- tive percentage of fiber loss of the individual stages using the following relations:
where Tis pulp suspension residence time in whole flotation process of various stages.
2.4. Selectivity or Z-factor weighted brightness gain and ERIC
Selectivity or Z -factor is a measure of the relative percent- age of gain in paper brightness or reduction of ERIC per unit percentage of fiber rejection loss. It is a measure of the effi- ciency of the flotation process or the efficiency of a particular flotation stage. Selectivity or Z -factor does not give the abso- lute value in brightness gain or ERIC reduction through the process or a particular stage. It is logical to define selectivity or Z -factor weighted brightness gain and ERIC (Eqs. (8a) and (8b) ) for absolute or quantitative comparison of ink removal through various processes or stages. The Z -factor weighted brightness gain and ERIC are simply equal to the bright- ness Z -factor times the ISO brightness gain and the ERIC Z -factor times the ordinary ERIC reduction, respectively. In most flotation processes, typical brightness Z -factor is on the order of unit value. Therefore, a brightness Z -factor weighted brightness gain is on the same order of magnitude of ordinary brightness gain and has relevance to the brightness gain used in current industrial practice. While typical ERIC Z -factor is on the order of 10 units, the ERIC Z -factor weighted ERIC reduction will be only an order of magnitude greater than the ordinary ERIC reduction:
where BGZB and REZE are the brightness and ERIC Z -factor weighted brightness and ERIC reduction, respectively. Note that there is always a finite value of fiber loss in practical unit operations. It is not possible to have infinitively large Z -factors, which would distort the intended meaning of the Z -factor weighted brightness gain and ERIC reduction. As will be discussed, large Z -factor values are possible as a re- sult of the rejection of a very small amount of fibers, which only occurs during the start-up of the system. However, small stage, process, or accumulative Z -factors are possible in the later stages of a unit operation as a result of the typical ki- netic behavior of ink removal (i.e., exponential decay in ink removal) and constant fiber rejection. Small Z -factors can
(3a)
(3b)
where GB is the gain in brightness in ISO (%) of a sheet made from deinked fibers. Similarly, deinking selectivity based on parameter ERIC can be defined as
(7b)
(5a)
(5b)
(8a)
(8b)
36 J. Y. Zhu et al. / Separation and Purification Technology 43 (2005) 33–41
lessen weighted brightness gain and ERIC reduction, which is the intended purpose of the two parameters defined by Eqs. (8a) and (8b) .
2.5. Economic significance of deinking selectivity or Z-factor
An advantage of the Z -factors is that these parameters can be put into an economic perspective to determine if an ad- ditional stage or additional processing is economically jus- tifiable. Assuming that the pulp price gain for an additional unit of ink removal (e.g., one unit of brightness gain or ERIC reduction) is ∆ P G over the initial pulp price P and that the additional percentage of fiber loss to achieve the additional ink removal ∆ G (either in terms of ISO brightness gain or percentage of ERIC reduction) is ∆ Frj through the flota- tion stage or processing under evaluation, then the economic gain of unit ton pulp can be calculated as expressed by the left-hand side of inequality in Eq. (9) . The economic gain has to be positive to justify the additional flotation stage or any further processing; i.e., the following expression must be held:
(9)
Recalling the definition of stage Z -factor in Eq. (4) , the fol- lowing criterion can be obtained from Eq. (9) :
where ∆ G /100 is often an higher order term for any stage or period and can be ignored. Therefore, Eq. (10) can be simplified as
Eq. (11) clearly indicates that the stage Z -factor must be greater than the inverse of the percentage of pulp sale price gain from the additional unit of ink removal to justify the additional flotation stage or process. Note that this criterion does not take into account the lost production output result- ing from increased residence time in the additional stage and ignores the positive high order term, a hundredth of ink re- moval ( ∆ G ) in Eq. (10). A similar criterion holds for elim- inating a flotation stage or process. Therefore, the Z -factor has significant practical importance in industrial applica- tions.
2.6. Relation of deinking selectivity to separation factor
ERIC is a measure of the ink on paper through calibration. The separation factor in a given period ∆ ti can be expressed by ERIC and the percentage fiber rejection loss.
Similarly, we can relate the process separation factor to pro- cess the ERIC Z -factor:
(12b)
where ERIC0 is the ERIC of the handsheets made of un- deinked pulp (from original wastepaper). Despite the fact that pulp brightness is not a measure of ink and cannot be related to the separation factor, the two deinking Z -factors defined in this study are simple and have practical economic significance. Furthermore, the ERIC Z -factor can be related to the separation factor used in chemical engineering science.
3. Experimental
Experiments were conducted in the pilot plant flotation deinking facility at the USDA Forest Service, Forest Products Laboratory, to illustrate the practicality of the Z -factors and their associated deinking parameters defined in the previous section. The high consistency pulper (HC-1.5, Voith-Sulzer, Germany) has a working capacity of 1500 L. The flotation fa- cility consists of a two-stage Lamort (Kadant Lamort, France) vertical flotation cell having a capacity of 2000 L. The flota- tion cell has concentric inner and outer chambers, each about 1000 L, as the two stages. The incoming flow rate of pulp suspension is approximately 180 L/min, giving a typical resi- dence time of 11 min; however, all the experiments conducted were run in batch mode.
The pulping conditions were as follows: 11 % consistency; temperature increase from 40°C to 50°C after 20 min pulp- ing; hydrogen peroxide, sodium silicate, and sodium hydrox- ide charge on OD pulp of 1%, respectively; and pH of 11. Fiber suspension feedstock was injected into the flotation cell through eight tangential jets in the inner chamber. Pres- surized air was pumped by venturi devices through the jets into the inner and outer chambers of the flotation cell. The flotation air flow rate was set at 10 standard cubic feet/min (scfm) for most experiments and 15 scfm for one experiment. After entering the bottom of the inner chamber, the fiber sus- pension feedstock swirled upward, carrying entrained air and ink particles. The feedstock spilled into the outer chamber. At the top of the fiber suspension interface a vacuum manifold suctioned off the top layer of foam to which was attached ink particles produced by air flotation.
To obtain good mixing, suspension stock was drawn from the bottom of the outer chamber, then recirculated tangen- tially through three jets to the bottom of the outer chamber. Air was also injected through the three recirculating jets us- ing venturi devices. The air recirculation pressure was main- tained at 62 kPa (9 lbf/in.2) in all experiments. The flotation
(12a)
(10)
(11)
J. Y. Zhu et al. / Separation and Purification Technology 43 (2005) 33–41 37
accept stream was removed from the bottom of the outer cell. One suction shoe was used to extract froth for ink removal. The typical distance between the suction shoe and the top suspension interface was maintained at about 2 cm in most operations.
Old newsprint (ONP) was obtained from London, Eng- land (Daily Mail, August-September 2002). Before experi- mentation, the newspapers were sorted to remove inserts. Old magazine papers (OMG) were obtained from Quad Graph- ics (Sussex, Wisconsin). The exact ratio of ONP and OMG in the wastepaper for pulping was 9 : 1 . The ash content of the feedstock from the pulping of the ONP and OMG mix- ture was about 5.6%. Commercial deinking chemical Vinings A (Lionsurf 5140, Kemira Chemicals, Kennesaw, Georgia) was used for all experiments. Vinings A is a blend of non- ionic surfactant and fatty acid for deinking of old newsprint. The chemical charge on oven-dry (OD) weight of paper was varied from 0.2 to 0.8%, which gave a range of chemical concentration in the suspension of 13.6–54.4 mg/L. To ob- tain time-dependent data from the flotation processes, reject and accept samples were collected every 3-5 min, depend- ing on the duration of the batch flotation. Feedstock samples were also collected for each experiment.
Handsheets made from wet samples (TAPPI method T205 sp–95) were used for ERIC measurements, using TAPPI method T567 pm–97 [20] . TAPPI method T218 om–91 [20] was used to make a pad from wet samples to determine the consistency of solid (ash and fiber) and ash content in the feedstock and reject stream. The same method was used to prepare a pad from wet samples for diffuse brightness mea- surements based on TAPPI standard T525 om–92 [20] . Two pads for measuring brightness were prepared from each sam- ple, and three readings were taken from each pad. A total of six readings were used to calculate the mean and standard deviation of pulp brightness. The pads made from the reject stream were combusted at 525 °C to determine ash and fiber (OD basis) content in the reject stream. ERIC measurements of the handsheets were analyzed by Technidyne Corp. (New Albany, Indiana). Five readings were used to calculate the mean and standard deviation of ERIC.
4. Results and discussion
4.1. Accumulative (process) Z-factors–effect of deinking chemical charge
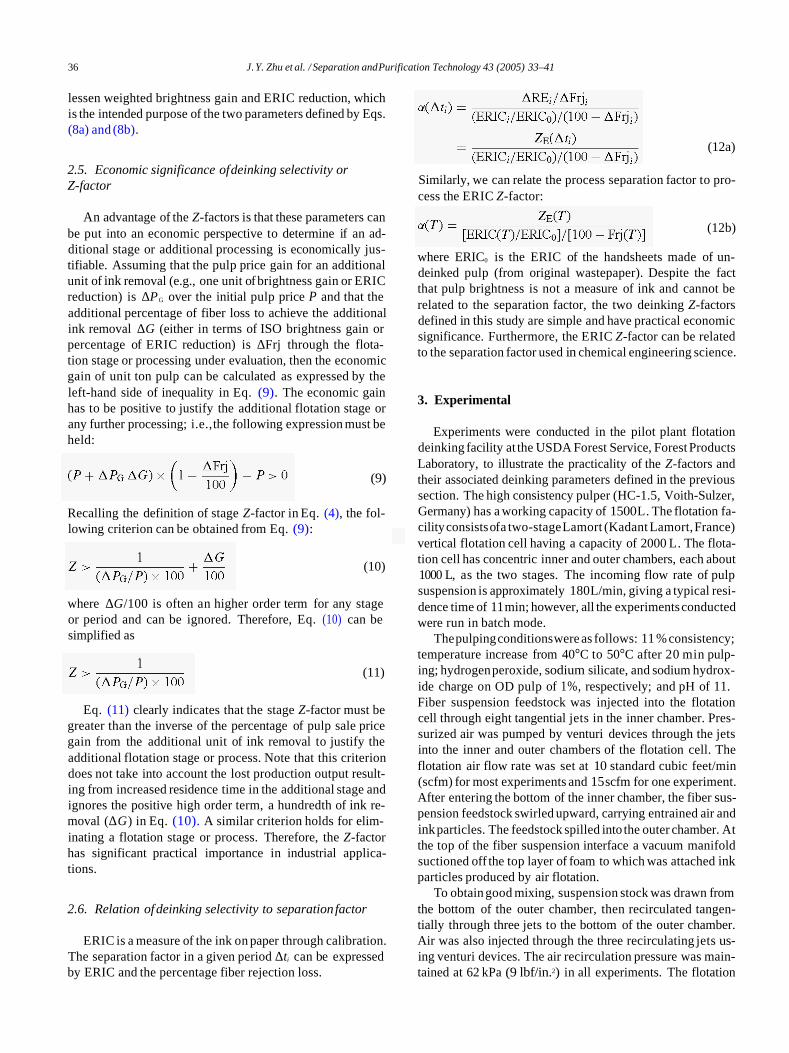
It is well known that increasing the deinking surfactant charge initially increases ink removal as a result of the in- crease infrothstability [4,5,15,16,19] . Further increasing sur- factant charge in the flotation stock reduces ink removal as a result of the reduction of the hydrophobicity of ink particle surfaces caused by the adsorption of surfactant. In our pilot- scale study, this effect of deinking surfactant on ink removal was also observed with the commercially blended deinking chemical Lionsurf 5140 ( Fig. 1 ). The data shown in Fig. 1
Fig. 1. Effect of deinking chemical charge on fiber ISO brightness gain and ERIC reduction after 15 min flotation.
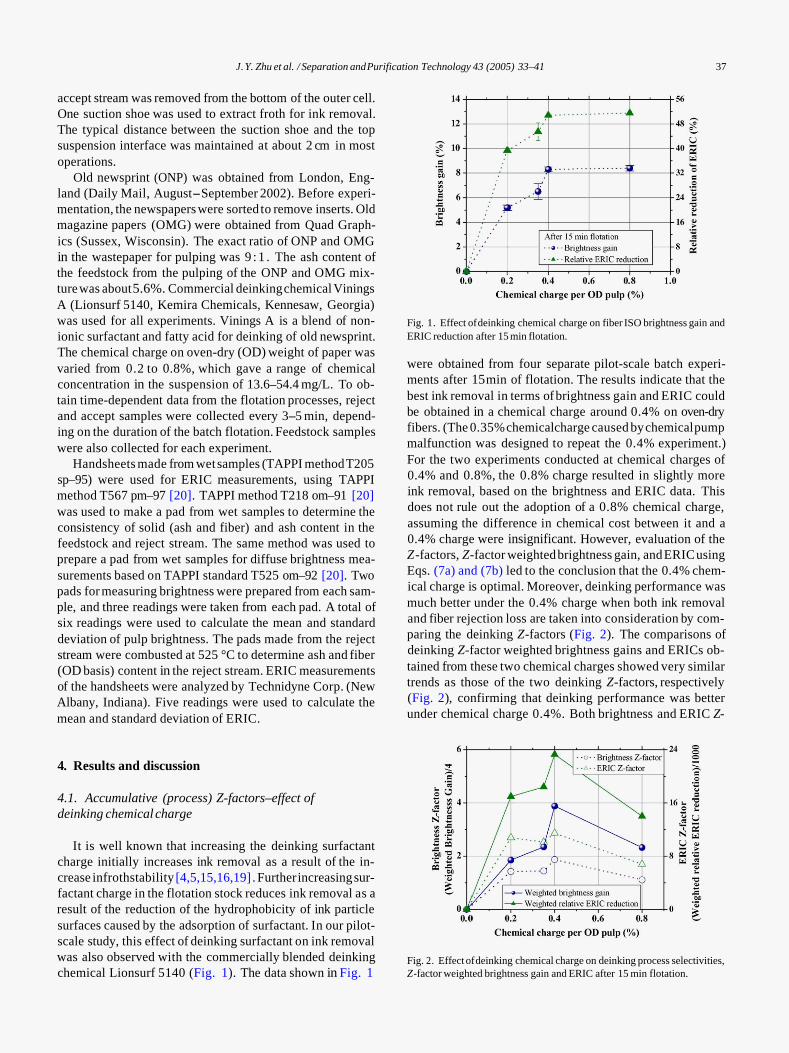
were obtained from four separate pilot-scale batch experi- ments after 15 min of flotation. The results indicate that the best ink removal in terms of brightness gain and ERIC could be obtained in a chemical charge around 0.4% on oven-dry fibers. (The 0.35% chemicalcharge caused by chemical pump malfunction was designed to repeat the 0.4% experiment.) For the two experiments conducted at chemical charges of 0.4% and 0.8%, the 0.8% charge resulted in slightly more ink removal, based on the brightness and ERIC data. This does not rule out the adoption of a 0.8% chemical charge, assuming the difference in chemical cost between it and a 0.4% charge were insignificant. However, evaluation of the Z -factors, Z -factor weighted brightness gain, and ERIC using Eqs. (7a) and (7b) led to the conclusion that the 0.4% chem- ical charge is optimal. Moreover, deinking performance was much better under the 0.4% charge when both ink removal and fiber rejection loss are taken into consideration by com- paring the deinking Z -factors ( Fig. 2 ). The comparisons of deinking Z -factor weighted brightness gains and ERICs ob- tained from these two chemical charges showed very similar trends as those of the two deinking Z -factors, respectively ( Fig. 2 ), confirming that deinking performance was better under chemical charge 0.4%. Both brightness and ERIC Z-
Fig. 2. Effect of deinking chemical charge on deinking process selectivities, Z -factor weighted brightness gain and ERIC after 15 min flotation.

J. Y. Zhu et al. / Separation and Purification Technology 43 (2005) 33–41 38
factor obtained at 0.4% chemical charge were about 70% greater than values obtained at 0.8% chemical charge, as a result of the significant increase in fiber rejection loss un- der the 0.8% deinking chemical charge, which, in turn, was caused by the increase in froth stability and consequent en- trapment of fibers [5,21]. The percentage of fiber (OD basis) rejection loss linearly increased with the increase in deinking chemical charge (mass ration between chemical and OD pulp) with a linear proportional coefficient of 6.74, y-intercept of 2% and r 2 of 0.98. The y-intercept at zero chical charge
of 2% can be considered as the fiber loss resulting from true flotation [5], which is not significant. It can be concluded that
an appropriate frothing agent charge not only reduces chem.- ical cost but also increases fiber yield and the control of froth stability is the key to reducing fiber rejection loss in flotation deinking operations. To further investigate the performance of the two flotation processes conducted at chemical charges of 0.4% and 0.8% we plotted time-dependent ISO brightness gain and ERIC reduction. As shown in Fig. 3, the two processes were essen- tially identical if simply judged on the basis of ink removal. However, it becomes evident that the process using 0.4% chemical charge is preferable when the time-dependent fiber loss data are plotted (Fig. 3). Fiber rejection loss was linearly dependent on flotation time in both runs, but the slope was lower for the 0.4% charge. The negative intercepts of the lin-ear regression results of the fiber rejection loss data were due to the unsteady behavior of the two batch processes during the start-up period. The comparison of these two processes can be easily illustrated by using the cumulative or process deinking selectivities or Z-factors defined by Eqs. (7a) and (7b). As shown in Fig. 4, both the cumulative brightness and ERIC selectivities or Z-factors of the 0.4% chemical process were consistently higher than those of the 0.8% process at any given flotation time. This discussion indicates that it is insufficient to judge deinking performance from ink removal data only and that deinking Z -factors are able to take into consideration both ink removal and fiber yield in determining deinking selec-
tivity. The Z-factor weighted brightness gain and relative ERIC reduction shown in Fig. 2 illustrate how these two pa-rameters can be used to determine the overall performance of a deinking operation or process without losing the tra- ditional meaning of ordinary brightness gain and ERIC re- duction. (Recall that the brightness and ERIC Z-factors are
on the order of 1 and 10, respectively for typical deinking
operations.)
___
To illustrate the period Z-factor concept, the time-
4.2. Period Z-factors_effect of flotation residence time
dependent deinking dataq, I.e., brightness gain, ERIC, and fiber loss, collected at 5-min intervals at chemical charge 0.35% on OD fiber were used to calculate period Z-factors. Brightness gain, ERIC reduction, and fiber loss over different periods were first calculated from the time-dependent data; period Z-factors were then evaluated according to Eqs. (5a) and (5b). As shown in Fig. 5, the period Z-factor follows the law of diminishing return due to the kinetic behavior of ink
39 J. Y. Zhu et al. / Separation and Purification Technology 43 (2005) 33-41
Table 2 Deinking performance of industrial seven-stage flotation operation
Brightness (%) ERIC Consistency Z Bi
Feed 44.17 1177 0.0087 Stage 1 51.27 574.2 6.179 Stage 2 53.32 428.6 1.784 Stage 3 54.68 363.1 1.184 Stage 4 55.51 303.4 0.722
Stage 6 56.19 266.1 0.070 Stage 7 56.29 265.6 0.0080 0.087 Process 56.29 265.6 1.506
Stage 5 56.11 273.3 0.522
removal and continued near-constant rate of fiber loss. The period brightness Z -factor was about 4 in the first 5 min of flotation and decreased to about 0.2 after another 20 min of flotation, whereas the ERIC Z -factor was decreased from 56 to about 0.6 in the same 20 min flotation period. The data clearly indicate that the last 5 min of flotation were very in- efficient. A pulp sale price gain of more than 5% for unit brightness gain and or a 1.6% price gain for an ERIC reduc- tion of 1% is required to make the last period of flotation economical according to Eq. (11).
4.3. Stage Z-factors–performance of flotation stage in industrial operation
We applied the stage Z -factor concept to a mill flotation deinking operation to determine the efficiency of each flota- tion stage at the mill. To conduct this exercise, we sampled the feed and accept stock of different stages of a production line with seven stages in series. Determination of the reject flow rate of each stage was not possible and was not attempted. Therefore, fiber loss was estimated from the consistency of the stock in each stage. The results indicate that consistency decreases linearly across the seven stages. Therefore, a con- stant fiber loss of one-seventh of total fiber loss determined from the consistency of the feed and final accept stock was used to determine the fiber loss at each stage.
Handsheets were prepared from the sampled pulps to mea- sure the brightness and ERIC of the deinked fibers. From the brightness and ERIC data along with the estimated fiber loss through each stage, we determined the deinking selectivity or Z -factor of each stage. As listed in Table 2 , both the brightness and ERIC Z -factors decreased exponentially across the seven stages as a result of exponential decay of inkremoval through the stages downstream. We then calculated the required pulp price gain for economical operation of each stage according to Eq. (11) . The results indicate that the last two stages are not economically justified according to this sampling exer- cise. The required pulp price gain per unitbrightnessgainwas over 10%, while the pulp price gain for each percentage of ERIC reduction required for the last stage to be economical was 27%. This exercise demonstrates the practical impor- tance of the deinking selectivities or Z -factors defined in this study.
Z Ei D P/P (%) per unit ISO GB D P/P (%) per %RE
44.574 10.766 4.843 4.414 2.225 0.533 0.037 9.624
0.16 0.56 0.84 1.39 1.92
14.29 11.49
0.02 0.09 0.21 0.23 0.45 1.88
27.03
4.4. Z-factor weighted brightness gain and ERIC reduction—comparison of flotation processes under various opevation conditions
To further illustrate how Z -factor weighted brightness gain and ERIC reduction can be used to determine deink- ing performance, batch flotation experiments were also con- ducted under various experimental conditions; i.e., various fiber rejection rates made by adjusting the distance between the suction shoe and the suspension top surface, differ- ent chemical charges, and different recirculation air flow rates.
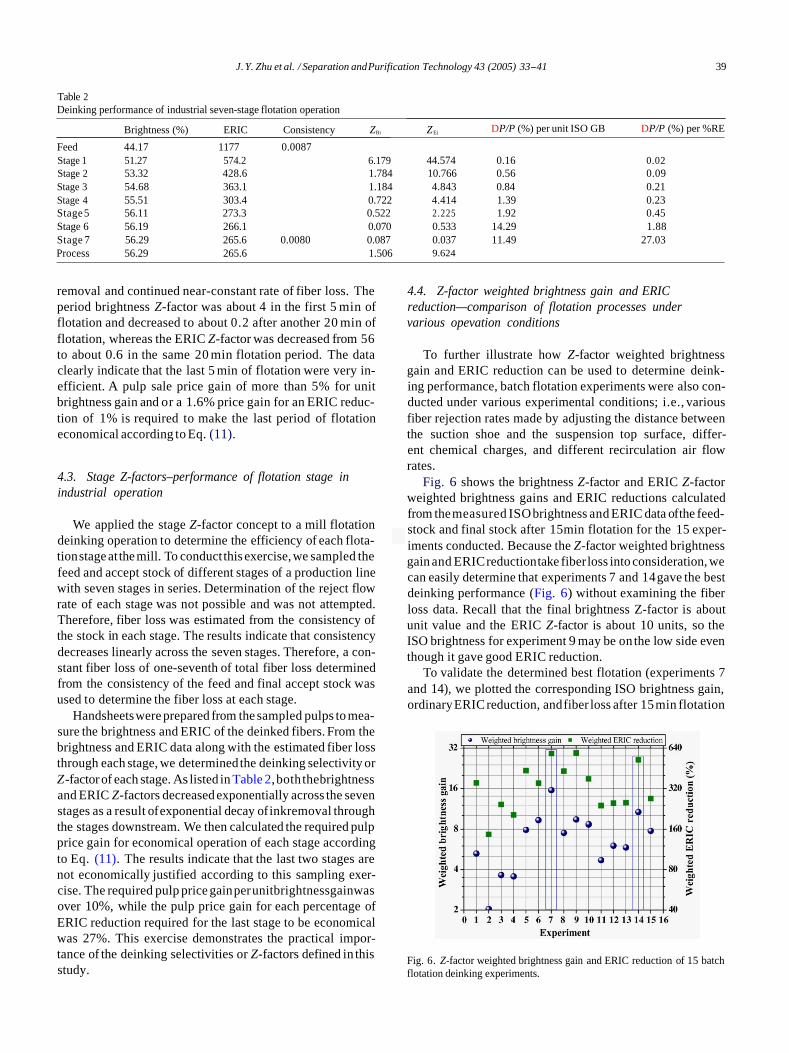
Fig. 6 shows the brightness Z -factor and ERIC Z -factor weighted brightness gains and ERIC reductions calculated from the measured ISO brightness and ERIC data of the feed- stock and final stock after 15 min flotation for the 15 exper- iments conducted. Because the Z -factor weighted brightness gain and ERIC reduction take fiber loss into consideration, we can easily determine that experiments 7 and 14 gave the best deinking performance ( Fig. 6 ) without examining the fiber loss data. Recall that the final brightness Z-factor is about unit value and the ERIC Z -factor is about 10 units, so the ISO brightness for experiment 9 may be on the low side even though it gave good ERIC reduction.
To validate the determined best flotation (experiments 7 and 14), we plotted the corresponding ISO brightness gain, ordinary ERIC reduction, and fiber loss after 15 min flotation
Fig. 6. Z -factor weighted brightness gain and ERIC reduction of 15 batch flotation deinking experiments.
40 J. Y. Zhu et al. / Separation and Purification Technology 43 (2005) 33–41
Fig. 7. ISO brightness gain, ERIC reduction, and fiber rejection loss of batch experiments reported in Fig. 6 .
for the 15 experiments reported in Fig. 6. As shown in Fig. 7, experiments 7 and 14 indeed gave the best performance in terms of both inkremoval and fiber yield. Some experiments were not considered optimal because of low brightness gain (experiments 5 and 9), whereas others resulted in high fiber loss (experiments 6, 10, 11, and 15). In summary, Z -factor weighted brightness gain and ERIC reduction are good indi- cators of deinking performance that also take fiber yield into consideration.
4.5. Correlation between ERIC Z-factor and separation factor
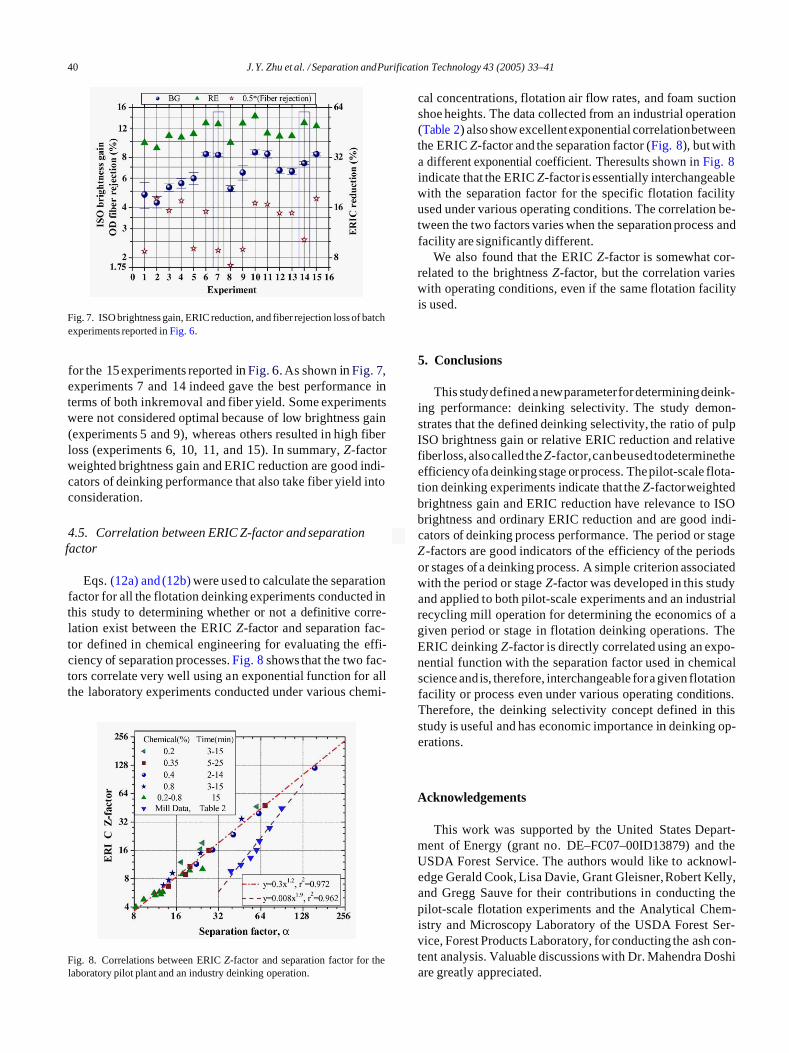
Eqs. (12a) and (12b) were used to calculate the separation factor for all the flotation deinking experiments conducted in this study to determining whether or not a definitive corre- lation exist between the ERIC Z -factor and separation fac- tor defined in chemical engineering for evaluating the effi- ciency of separation processes. Fig. 8 shows that the two fac- tors correlate very well using an exponential function for all the laboratory experiments conducted under various chemi-
Fig. 8. Correlations between ERIC Z -factor and separation factor for the laboratory pilot plant and an industry deinking operation.
cal concentrations, flotation air flow rates, and foam suction shoe heights. The data collected from an industrial operation ( Table 2 ) also show excellent exponential correlation between the ERIC Z -factor and the separation factor ( Fig. 8 ), but with a different exponential coefficient. Theresults shown in Fig. 8 indicate that the ERIC Z -factor is essentially interchangeable with the separation factor for the specific flotation facility used under various operating conditions. The correlation be- tween the two factors varies when the separation process and facility are significantly different.
We also found that the ERIC Z -factor is somewhat cor- related to the brightness Z -factor, but the correlation varies with operating conditions, even if the same flotation facility is used.
5. Conclusions
This study defined a new parameter for determining deink- ing performance: deinking selectivity. The study demon- strates that the defined deinking selectivity, the ratio of pulp ISO brightness gain or relative ERIC reduction and relative fiber loss, also called the Z -factor, can be used to determine the efficiency of a deinking stage or process. The pilot-scale flota- tion deinking experiments indicate that the Z -factor weighted brightness gain and ERIC reduction have relevance to ISO brightness and ordinary ERIC reduction and are good indi- cators of deinking process performance. The period or stage Z -factors are good indicators of the efficiency of the periods or stages of a deinking process. A simple criterion associated with the period or stage Z -factor was developed in this study and applied to both pilot-scale experiments and an industrial recycling mill operation for determining the economics of a given period or stage in flotation deinking operations. The ERIC deinking Z -factor is directly correlated using an expo- nential function with the separation factor used in chemical science and is, therefore, interchangeable for a given flotation facility or process even under various operating conditions. Therefore, the deinking selectivity concept defined in this study is useful and has economic importance in deinking op- erations.
Acknowledgements
This work was supported by the United States Depart- ment of Energy (grant no. DE–FC07–00ID13879) and the USDA Forest Service. The authors would like to acknowl- edge Gerald Cook, Lisa Davie, Grant Gleisner, Robert Kelly, and Gregg Sauve for their contributions in conducting the pilot-scale flotation experiments and the Analytical Chem- istry and Microscopy Laboratory of the USDA Forest Ser- vice, Forest Products Laboratory, for conducting the ash con- tent analysis. Valuable discussions with Dr. Mahendra Doshi are greatly appreciated.
J. Y. Zhu et al. / Separation and Purification Technology 43 (2005) 33–41 41
References