Defining the broader, medium and narrow autism phenotype among parents using the Autism Spectrum...
9
Wheelwright et al. Molecular Autism 2010, 1:10 http://www.molecularautism.com/content/1/1/10 Open Access RESEARCH © 2010 Wheelwright et al; licensee BioMed Central Ltd. This is an Open Access article distributed under the terms of the Creative Com- mons Attribution License (http://creativecommons.org/licenses/by/2.0), which permits unrestricted use, distribution, and reproduc- tion in any medium, provided the original work is properly cited. Research Defining the broader, medium and narrow autism phenotype among parents using the Autism Spectrum Quotient (AQ) Sally Wheelwright*, Bonnie Auyeung, Carrie Allison and Simon Baron-Cohen* Abstract Background: The Autism Spectrum Quotient (AQ) is a self-report questionnaire for quantifying autistic traits. This study tests whether the AQ can differentiate between parents of children with an autism spectrum condition (ASC) and control parents. In this paper, the use of the AQ to define the broader, medium and narrow autism phenotypes (BAP, MAP, NAP) is reported, and the proportion of parents with each phenotype is compared between the two groups. Methods: A sample of 571 fathers and 1429 mothers of children with an ASC completed the AQ, along with 349 fathers and 658 mothers of developing typically children. Results: Both mothers and fathers of the diagnosed children scored higher than the control parents on total AQ score and on four out of five of the subscales. Additionally, there were more parents of diagnosed children with a BAP, MAP or NAP. Conclusions: The AQ provides an efficient method for quantifying where an individual lies along the dimension of autistic traits, and extends the notion of a broader phenotype among first-degree relatives of those with ASC. The AQ is likely to have many applications, including population and clinical screening, and stratification in genetic studies. Background Autism spectrum conditions (ASC) are diagnosed on the basis of behaviour, specifically difficulties in social and communication development, alongside repetitive behav- iour and unusually narrow strong interests [1]. The evi- dence for the genetic basis of ASC initially came from twin studies of classic autism [2,3] and more recently twin studies of autistic traits [4-6]. Progress from these epide- miological findings to identifying specific DNA sequence variations that cause ASC has been slow: replication of results has been hampered by methodological issues such as limited power, varying designs and genotyping, along with imprecise phenotypic definitions [7]. Another rea- son for limited progress is that although ASC has a high inheritance rate, it is genetically heterogeneous. Rare de novo mutations and chromosomal abnormalities could account for as many as 20% of ASC cases, but common allelic variation is also important, suggesting that a cate- gorical approach to case ascertainment may not always be the best approach [8]. Indeed, a case-control or categorical approach to diag- nosis ignores the view that autism is not just a spectrum within the clinical population, but that autistic traits are continuously distributed right through the general popu- lation [5,9]. Taking seriously the dimensional view neces- sitates the use of techniques such as quantitative trait loci (QTL) analysis. Quantitative traits are characteristics that can be associated with a particular condition but are also continuously distributed in the non-affected population. If QTL is to be a successful tool in the search for autism susceptibility genes, then an instrument that can quantify autism traits in both affected and non-affected individu- als is required. As well as quantifying autism traits within the whole population, such an instrument could also be used to define the broader autism phenotype (BAP). The BAP is generally considered to be a subclinical set of characteristics or traits that index familiality and/or genetic liability to autism. This conception holds that the BAP is milder but qualitatively similar to the diagnosed * Correspondence: [email protected], [email protected] Autism Research Centre, Department of Psychiatry, University of Cambridge, Douglas House, 18b Trumpington Rd, Cambridge, CB2 8AH, UK Full list of author information is available at the end of the article
Transcript of Defining the broader, medium and narrow autism phenotype among parents using the Autism Spectrum...

Wheelwright et al. Molecular Autism 2010, 1:10http://www.molecularautism.com/content/1/1/10
Open AccessR E S E A R C H
ResearchDefining the broader, medium and narrow autism phenotype among parents using the Autism Spectrum Quotient (AQ)Sally Wheelwright*, Bonnie Auyeung, Carrie Allison and Simon Baron-Cohen*
AbstractBackground: The Autism Spectrum Quotient (AQ) is a self-report questionnaire for quantifying autistic traits. This study tests whether the AQ can differentiate between parents of children with an autism spectrum condition (ASC) and control parents. In this paper, the use of the AQ to define the broader, medium and narrow autism phenotypes (BAP, MAP, NAP) is reported, and the proportion of parents with each phenotype is compared between the two groups.
Methods: A sample of 571 fathers and 1429 mothers of children with an ASC completed the AQ, along with 349 fathers and 658 mothers of developing typically children.
Results: Both mothers and fathers of the diagnosed children scored higher than the control parents on total AQ score and on four out of five of the subscales. Additionally, there were more parents of diagnosed children with a BAP, MAP or NAP.
Conclusions: The AQ provides an efficient method for quantifying where an individual lies along the dimension of autistic traits, and extends the notion of a broader phenotype among first-degree relatives of those with ASC. The AQ is likely to have many applications, including population and clinical screening, and stratification in genetic studies.
BackgroundAutism spectrum conditions (ASC) are diagnosed on thebasis of behaviour, specifically difficulties in social andcommunication development, alongside repetitive behav-iour and unusually narrow strong interests [1]. The evi-dence for the genetic basis of ASC initially came fromtwin studies of classic autism [2,3] and more recently twinstudies of autistic traits [4-6]. Progress from these epide-miological findings to identifying specific DNA sequencevariations that cause ASC has been slow: replication ofresults has been hampered by methodological issues suchas limited power, varying designs and genotyping, alongwith imprecise phenotypic definitions [7]. Another rea-son for limited progress is that although ASC has a highinheritance rate, it is genetically heterogeneous. Rare denovo mutations and chromosomal abnormalities couldaccount for as many as 20% of ASC cases, but commonallelic variation is also important, suggesting that a cate-
gorical approach to case ascertainment may not always bethe best approach [8].
Indeed, a case-control or categorical approach to diag-nosis ignores the view that autism is not just a spectrumwithin the clinical population, but that autistic traits arecontinuously distributed right through the general popu-lation [5,9]. Taking seriously the dimensional view neces-sitates the use of techniques such as quantitative trait loci(QTL) analysis. Quantitative traits are characteristics thatcan be associated with a particular condition but are alsocontinuously distributed in the non-affected population.If QTL is to be a successful tool in the search for autismsusceptibility genes, then an instrument that can quantifyautism traits in both affected and non-affected individu-als is required. As well as quantifying autism traits withinthe whole population, such an instrument could also beused to define the broader autism phenotype (BAP).
The BAP is generally considered to be a subclinical setof characteristics or traits that index familiality and/orgenetic liability to autism. This conception holds that theBAP is milder but qualitatively similar to the diagnosed
* Correspondence: [email protected], [email protected] Research Centre, Department of Psychiatry, University of Cambridge, Douglas House, 18b Trumpington Rd, Cambridge, CB2 8AH, UKFull list of author information is available at the end of the article
© 2010 Wheelwright et al; licensee BioMed Central Ltd. This is an Open Access article distributed under the terms of the Creative Com-mons Attribution License (http://creativecommons.org/licenses/by/2.0), which permits unrestricted use, distribution, and reproduc-tion in any medium, provided the original work is properly cited.

Wheelwright et al. Molecular Autism 2010, 1:10http://www.molecularautism.com/content/1/1/10
Page 2 of 9
autism phenotype. BAP characteristics were firstobserved by Kanner [10], and were also noted in Folsteinand Rutter's early twin study [3], which found a higherconcordance rate for a more broadly defined cognitiveimpairment.
Given the increasing importance of measuring the BAP,not only in genetic studies, but across autism research(for example, in neuroimaging and cognitive studies), it isimportant to select the right tool. There are already atleast four instruments available for the assessment of theBAP: the Family History Interview (FHI), developed byRutter and Folstein; the Social Responsiveness Scale(SRS) [11]; the Broader Phenotype Autism SymptomScale (BPASS) [12]; and the Broad Autism PhenotypeQuestionnaire (BAPQ) [13].
The FHI measures autism-related traits in family mem-bers via interview with one member. The instrument cov-ers social and communication skills and range ofinterests. An algorithm determines the presence orabsence of the BAP in the three domains. The FHI wasused by Bolton and colleagues [14] to demonstrate higherrates of the BAP in the parents and siblings of probandswith autism compared with probands with Down's syn-drome. This finding was replicated by Piven and col-leagues [15].
The SRS is a 65-item questionnaire, which is completedby an adult informant. Its focus is on the ability of thesubject of the questionnaire to engage in emotionallyappropriate reciprocal social interaction and communi-cation. Using the SRS, a higher number of autistic traitshave been observed in the siblings of children withautism [16].
The BPASS was developed specifically for use in QTLstudies [12]. This instrument comprises seven semistruc-tured interview items and six observation items, whichtogether cover social motivation, social expressiveness,conversational skills and repetitive/restricted behav-iours. The BPASS is for use with both adults and children.
The most recently published instrument, the BAPQ,comprises 36 items, 12 in each of three subscales: aloofpersonality, pragmatic language deficits, and rigid per-sonality. Ideally, scores from self- and informant reportsare combined to give a best-estimate rating. The BAPQhas been validated using direct clinical assessment ofBAP [13].
We suggest that when choosing an instrument to mea-sure autistic traits in both the affected and non-affectedpopulations, the following qualities are important. (i) Agood BAP measure should be quantitative, with a widerange of possible scores, avoiding both ceiling and flooreffects. (ii) The content validity should be such that theinstrument can distinguish people with from those with-out an ASC. (iii) Versions of the same instrument shouldbe available for use with individuals of different ages,
both adults and children. (iv) Ideally, the instrumentshould produce a normal or near-normal distribution inthe general population. (v) The instrument should havegood test-retest reliability. (vi) It should have good cross-cultural applicability. (vii) It should correlate with eitherbiological and/or psychological measures of the broaderphenotype (concurrent validity). Finally, (viii) it should bequick and easy to use: participants in research projectsshould be subjected to the least amount of testing possi-ble, without compromising the validity of the researchproject.
Bearing in mind these qualities, each of the four instru-ments described above have some weaknesses: the FHIand BPASS are not truly quantitative and are both time-consuming to administer, the SRS is not normally distrib-uted, and the BAPQ is currently limited to adults.
In this paper, we propose that an alternative to the fourinstruments already available is the Autism SpectrumQuotient (AQ) [9]. The AQ was developed to assesswhere an individual lies on the autism spectrum (that is,how many autistic traits that person exhibits). Originallydesigned for adults, there are now child ( 4-11 years old)[17] and adolescent (12-16 years old) [18] versions avail-able (both completed by parents to improve accuracy).The questionnaires are freely available to download http://www.autismresearchcentre.com.
The AQ for adults has the format of a self-report,forced-choice questionnaire and is at the reading level ofa typical 10-year-oldl. It can be used by adults with an IQin the average range, who can read and understand atleast to this level. There are 50 items, covering behavioursacross five domains: communication, social skills, atten-tion switching, imagination, and attention to detail. Eachitem has the format of a statement with which therespondent rates how strongly they agree or disagree,using a four-point scale. In fact, each item is only scoredas '1' if the person reports the autistic trait, and '0' if theydo not, so total scores on the AQ can range from 0 to 50.Some researchers have used a four-point Likert scale forthe AQ [19-21], but this does not significantly alter thepattern of results. The AQ is quick and easy to use andproduces a near-normal distribution in the general popu-lation [9].
The adult AQ has been used extensively, and has beenshown to have consistent results both across time [22]and culture [20,23]. The AQ demonstrates high heritabil-ity [5]. The AQ score is a good predictor of clinical diag-nosis [24], correlates with brain function [25], singlenucleotide polymorphisms (SNPs) in candidate genes[26], social attention [27,28] and even prenatal testoster-one levels [29].
A previous study, by Dorothy Bishop and colleagues,suggested that AQ scores differentiate parents of childrenwith an ASC from control parents on two subdomains:

Wheelwright et al. Molecular Autism 2010, 1:10http://www.molecularautism.com/content/1/1/10
Page 3 of 9
communication and social skills [29]. Although this was apioneering study, its limitation was that it only tested 65mothers and 46 fathers of children with a pervasive devel-opmental disorder (PDD) diagnosis, and 48 mothers and37 fathers of control children. Although this study indi-cates the potential of the AQ to serve as a measure of theBAP, it is not clear whether the lack of significance onthree of the five subdomains of the AQ is because theseplay no role in the BAP or because the sample size wastoo small. Therefore, in the current study, we used theAQ with a much larger sample of parents.
Our first aim was thus to test if the results found byBishop and colleagues [29]could be replicated in a new,and considerably larger, sample. The second aim was totest the proportion of parents of children with an ASCwho demonstrate the BAP, the medium autism pheno-type (MAP) and the narrow autism phenotype (NAP).The MAP and NAP are new concepts. An individual withthe NAP has a large number of autistic traits, and most(but not all) people with the NAP will also have a diagno-sis on the autism spectrum. Not all individuals with theNAP will be diagnosed because there are many reasonswhy an individual may seek or receive a diagnosis: theNAP is one band within the phenotypic spectrum anddoes not take into consideration the individual's context,which may mediate whether they actually need or receivea diagnosis. Using the AQ, we define the NAP as thosescoring ≥ 3 standard deviations (SDs) above the mean. Anindividual with the MAP has a medium number of autis-tic traits (defined as individuals scoring between 2 to 3SDs above the mean on the AQ), and an individual withthe BAP has even fewer traits, but still significantly morethan average (defined as individuals scoring 1 to 2 SDsabove the mean on the AQ). People with the MAP orBAP are unlikely to require clinical intervention, but theirphenotypic status may be informative at a genetic level.
MethodsInstrumentFull details about the construction of the AQ are availableelsewhere [9]. The AQ consists of a series of 50 state-ments. Participants are asked to indicate whether they'strongly agree', 'slightly agree', 'slightly disagree' or'strongly disagree' with each statement. Each item scoreszero or one, with one point being awarded if the partici-pant chooses the 'autistic trait' response. On half theitems, the 'autistic trait' response is 'slightly/stronglyagree', and on half the items the 'autistic trait' response is'slightly/strongly disagree'. A total score is calculated bysumming across items. The BAP, MAP and NAP scoresare calculated using the mean and SD from the combinedmale and female control individuals shown in Table 1 (n =1761, mean ± SD = 16.3 ± 5.9; taken from [22]) BAP isdefined as AQ scores of 1 to 2 SDs above the mean (AQ
scores of 23 to 28). MAP is defined as AQ scores of 2 to 3SDs above the mean (AQ scores of 29 to 34). NAP isdefined as AQ scores ≥ 3 SDs above the mean (AQ scoresof 35+).
Participants and procedureTwo groups of parents took part in the study: parents ofchildren with a diagnosis on the autism spectrum andparents of families who only had children who weredeveloping typically. The parents of children with an ASCwere recruited from families who registered on the Cam-bridge University Autism Research Centre volunteerdatabase between 2002 and 2009 (online at http://www.autismresearchcentre.com). Ethics approval for thedatabase and questionnaire collection was provided bythe Cambridge Psychology Research Ethics Committee.Parents gave informed consent to take part in the studyelectronically.
Parents registering on the database are asked to statethe diagnosis of their child, who made the diagnosis, andwhere and when. In addition, parents are asked to pro-vide information about the IQ and language developmentof their child, although this is not obligatory. After regis-tering, the parents are invited to complete an AQ, and areasked to encourage the other biological parent to alsoregister and complete an AQ. The advantage of using anonline website to collect these data is that large samplescan be collected. The disadvantage is that diagnosis can-not be validated in every case. All parents included in thisstudy reported that their children had received their diag-nosis from experienced clinicians in recognized clinicsand according to the criteria from the Diagnostic andStatistical Manual of Mental Disorders, 4th edition(DSM-IV) or the International Statistical Classificationof Diseases and Related Health Problems, 10th Revision(ICD-10).
In total, 1582 families took part, with 571 fathers and1429 mothers completing the AQ. There were question-naires from 418 couples. The mean age of the fathers forwhom these data were available (n = 551) was 44.0 ± 6.9years and for mothers (n = 1228) was 41.2 ± 7.5 years.The numbers of diagnosed and developing typically chil-dren in the 1582 families are shown in Tables 1 and 2.There were 1752 children with a diagnosis of ASC:1472male and 280 female, giving a male:female ratio of 5.3:1.of he 1752 children, 727 were reported to have autism,725 to have Asperger's syndrome (AS), 185 to have highfunctioning autism (HFA) and 115 to have pervasivedevelopment disorder. As a further check on diagnosticsubtype, the registration process asks about comorbidlanguage delays or learning difficulties. A diagnosis of ASis only registered if the parent indicates that the child didnot have any language or general developmental delay. Adiagnosis of HFA is only registered if the parent indicates

Wheelwright et al. Molecular Autism 2010, 1:10http://www.molecularautism.com/content/1/1/10
Page 4 of 9
that there was no general developmental delay even iflanguage was delayed.
For the control group, the AQ was sent to the parents of1255 children (633 girls, 622 boys) who were participat-ing in a large epidemiological study of social and commu-nication skills in primary school-age children [30-32].This part of the project was ethically approved by theNational Health Service Suffolk Research Ethics Commit-tee, and written informed consent was obtained fromparticipating parents. Two copies of the questionnaireand two consent forms were posted to each family: oneset for the mother and one set for the father. A post-paidenvelope was included for participants to return thequestionnaires and consent forms. This sample was origi-nally ascertained by inviting 136 mainstream primaryschools in Cambridge City, east and south Cam-bridgeshire, and Fenland in the UK to participate inresearch (n = 92 (68%), agreed). In total, 1012 question-naires were received from 669 families (661 from moth-ers, 351 from fathers) with 343 pairs, a 40% response rate.Two families were excluded because they reported a childwith a diagnosis or suspected diagnosis on the autismspectrum. One family was excluded because theyreported a child with Down's syndrome. Questionnairesfrom 666 families (558 mothers and 349 fathers) with 341pairs were analysed. The mean age (at the time of com-pleting the AQ) of the fathers for whom these data wereavailable (n = 344) was 44.6 ± 5.0 years and for mothers (n= 644) was 42.4 ± 4.7. The children in these families were,according to parental report, all developing typically, andthe numbers are shown in Table 3; in total, there were1532 children in these families.
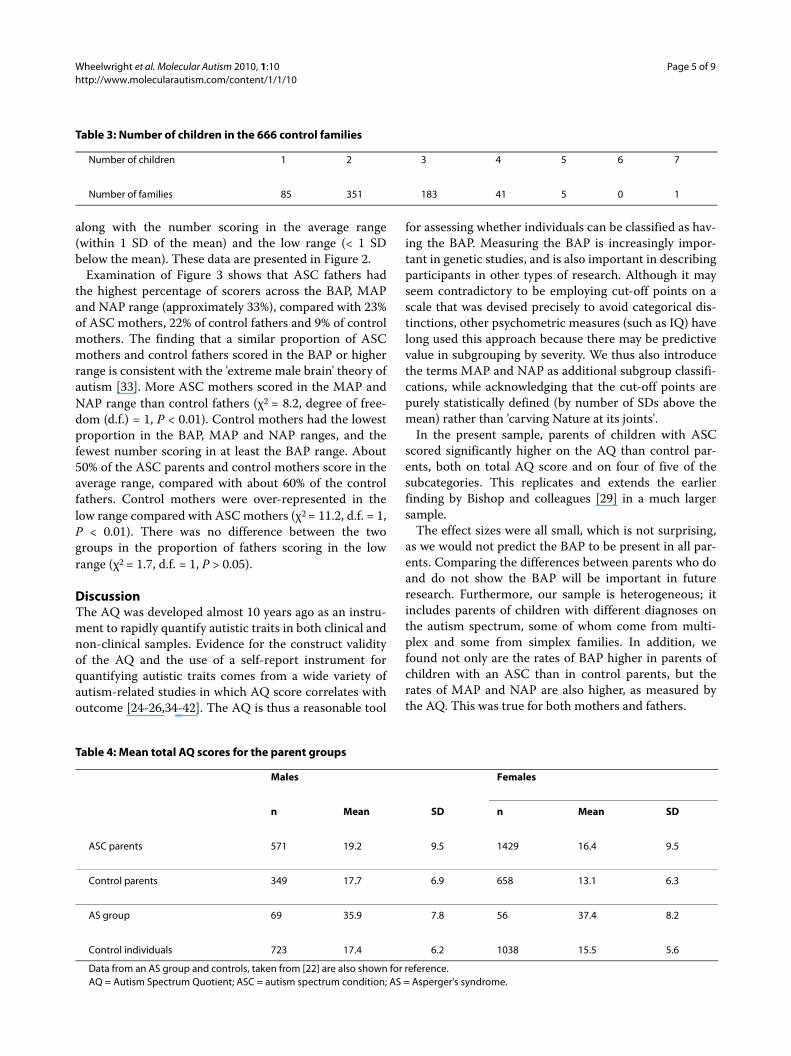
ResultsThe mean AQ scores and standard deviations are shownfor the two groups in Table 4, along with control data andAS data [22] for comparison. The distribution of scores inthe two parent groups are shown in Figure 1 and Figure 2.
Analysis of variance (ANOVA), with between-subjectfactors of 'group' (ASC parents versus control parents)and 'gender' was carried out on total AQ score. There wasa significant main effect of group (F(1,3003) = 45.8, P <0.001), with the ASC parents scoring higher than the con-trol parents, and of gender (F(1,3003)) = 104.3, P < 0.001),with males scoring higher than females. Although thegroup × gender interaction was significant (F(1,3003) =6.0, P < 0.05), simple effect tests indicated that the genderdifference held up in both groups separately (ASC par-ents: F(1,3003) = 42.0, P < 0.001; control parents:FF(1,3003) = 62.5, P < 0.001) and that the group differ-ence also held up when each gender was tested separately(males: F(1,3003) = 6.9, P < 0.01; females: F(1,3003)) =65.4, P < 0.001). The effect sizes for the group, gender,and group × gender interaction were all small: partial etasquared (η2) values were 0.02, 0.03 and 0.002 respectively,indicating that these factors accounted for just a smallamount of the overall variance.
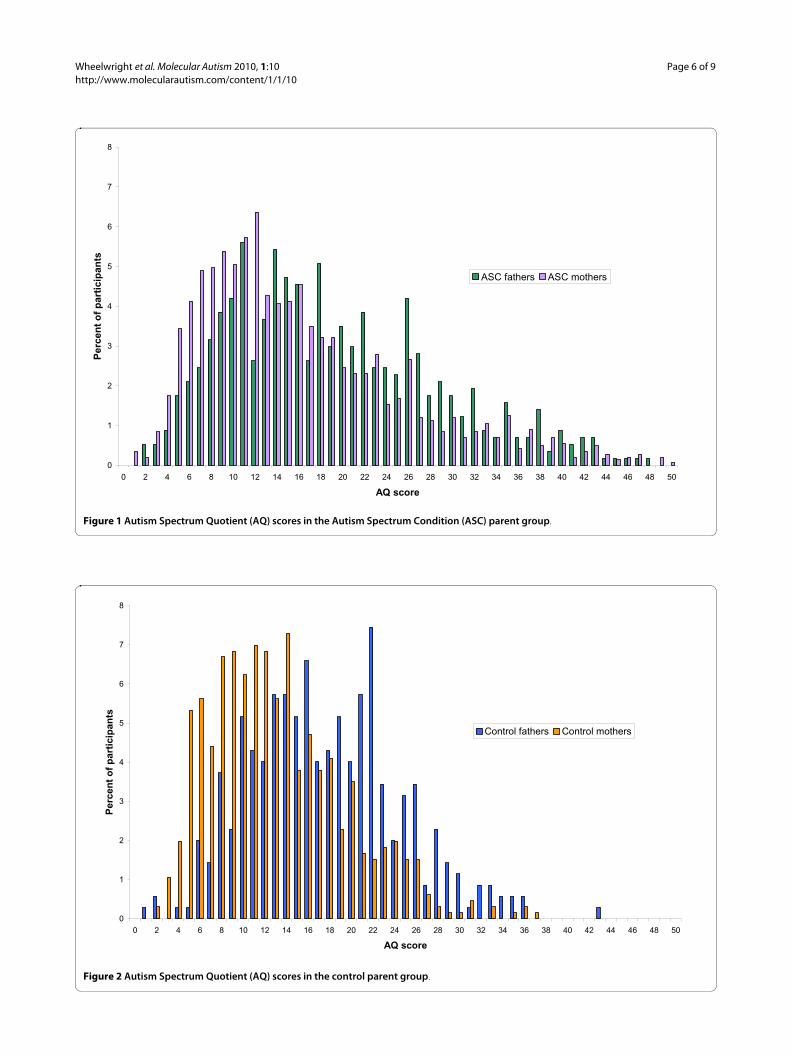
Table 5 shows the means and standard deviations of thefive subdomains of the AQ in the parent groups only.Also shown are the F values and partial η2 values gener-ated by separate ANOVAs, with between-subject factorsof group (ASC parents versus control parents) and gen-der, for each of the five subdomains. Inspection of themeans suggests that for each subcategory, males scoredhigher than females, and the ASC parents scored higherthan the control parents. The exception to this was thesubcategory 'attention to details'; in this, there was no sexdifference and the control parents scored higher than theASC parents. These observations were partly confirmedby the ANOVAs and simple effect tests. Similar to thetotal AQ score, the subcategories 'attention switching'and 'imagination' had significant main effects of groupand gender and a significant group × gender interaction.Also similar to the total AQ score, simple effect tests indi-cated that for both subcategories the sex difference heldup in both groups separately, and that the group differ-ence also held up when each sex was tested separately (P< 0.01 for all). The category 'communication and socialskills' both had significant main effects of group and gen-der, but no interaction between them, whereas the sub-category 'attention to detail' only had a significant maineffect of group. Again, all the effect sizes are small.
The number of parents matching each of the describedphenotypes (the BAP, MAP and NAP) was computed
Table 1: Number of children developing typically in the 1582 ASC families
Number of siblings developing typically 0 1 2 3 4 5
Number of families 1260 217 82 14 8 1
ASC = autism spectrum condition.
Table 2: Number of children with a diagnosis in the 1582 ASC families
Number of diagnosed children 1 2 3 4
Number of families 1423 150 7 2
ASC = autism spectrum condition.
Wheelwright et al. Molecular Autism 2010, 1:10http://www.molecularautism.com/content/1/1/10
Page 5 of 9
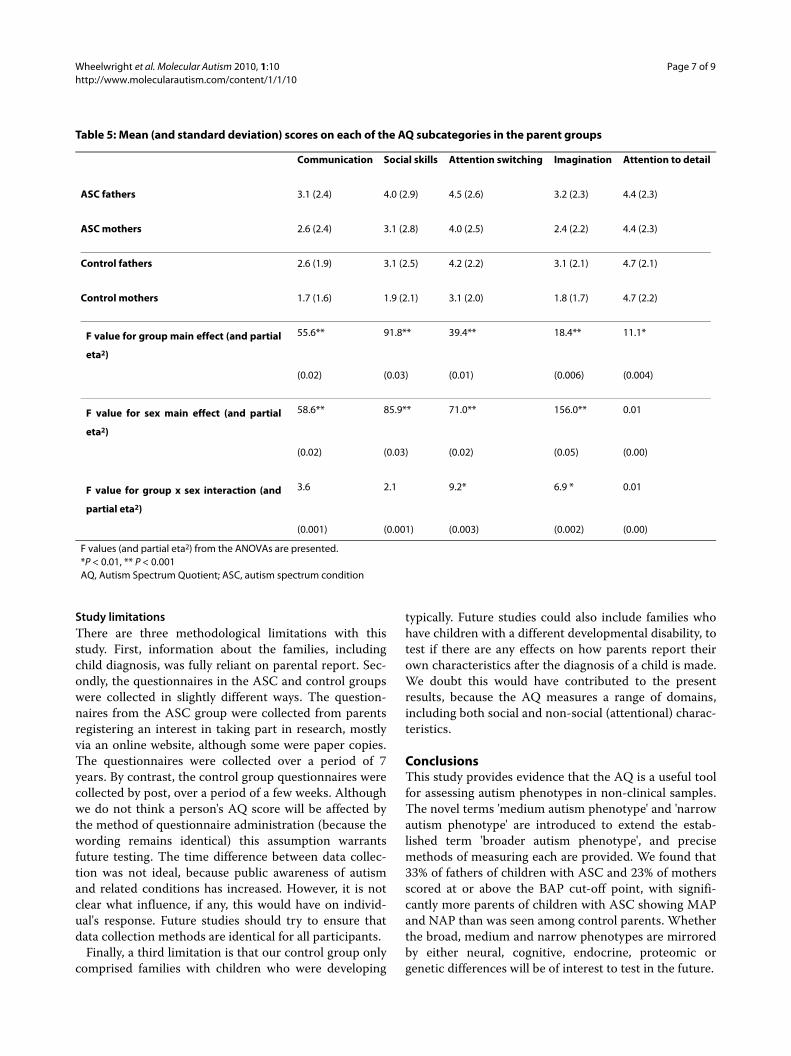
along with the number scoring in the average range(within 1 SD of the mean) and the low range (< 1 SDbelow the mean). These data are presented in Figure 2.
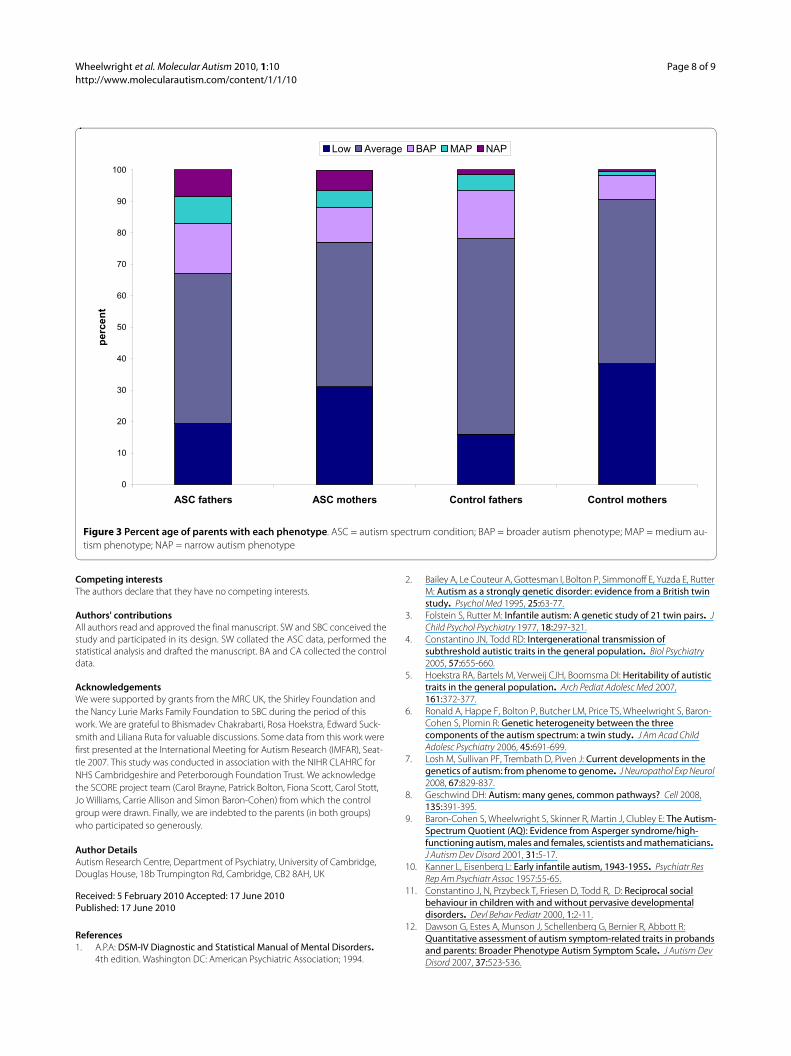
Examination of Figure 3 shows that ASC fathers hadthe highest percentage of scorers across the BAP, MAPand NAP range (approximately 33%), compared with 23%of ASC mothers, 22% of control fathers and 9% of controlmothers. The finding that a similar proportion of ASCmothers and control fathers scored in the BAP or higherrange is consistent with the 'extreme male brain' theory ofautism [33]. More ASC mothers scored in the MAP andNAP range than control fathers (χ2 = 8.2, degree of free-dom (d.f.) = 1, P < 0.01). Control mothers had the lowestproportion in the BAP, MAP and NAP ranges, and thefewest number scoring in at least the BAP range. About50% of the ASC parents and control mothers score in theaverage range, compared with about 60% of the controlfathers. Control mothers were over-represented in thelow range compared with ASC mothers (χ2 = 11.2, d.f. = 1,P < 0.01). There was no difference between the twogroups in the proportion of fathers scoring in the lowrange (χ2 = 1.7, d.f. = 1, P > 0.05).
DiscussionThe AQ was developed almost 10 years ago as an instru-ment to rapidly quantify autistic traits in both clinical andnon-clinical samples. Evidence for the construct validityof the AQ and the use of a self-report instrument forquantifying autistic traits comes from a wide variety ofautism-related studies in which AQ score correlates withoutcome [24-26,34-42]. The AQ is thus a reasonable tool
for assessing whether individuals can be classified as hav-ing the BAP. Measuring the BAP is increasingly impor-tant in genetic studies, and is also important in describingparticipants in other types of research. Although it mayseem contradictory to be employing cut-off points on ascale that was devised precisely to avoid categorical dis-tinctions, other psychometric measures (such as IQ) havelong used this approach because there may be predictivevalue in subgrouping by severity. We thus also introducethe terms MAP and NAP as additional subgroup classifi-cations, while acknowledging that the cut-off points arepurely statistically defined (by number of SDs above themean) rather than 'carving Nature at its joints'.
In the present sample, parents of children with ASCscored significantly higher on the AQ than control par-ents, both on total AQ score and on four of five of thesubcategories. This replicates and extends the earlierfinding by Bishop and colleagues [29] in a much largersample.
The effect sizes were all small, which is not surprising,as we would not predict the BAP to be present in all par-ents. Comparing the differences between parents who doand do not show the BAP will be important in futureresearch. Furthermore, our sample is heterogeneous; itincludes parents of children with different diagnoses onthe autism spectrum, some of whom come from multi-plex and some from simplex families. In addition, wefound not only are the rates of BAP higher in parents ofchildren with an ASC than in control parents, but therates of MAP and NAP are also higher, as measured bythe AQ. This was true for both mothers and fathers.
Table 3: Number of children in the 666 control families
Number of children 1 2 3 4 5 6 7
Number of families 85 351 183 41 5 0 1
Table 4: Mean total AQ scores for the parent groups
Males Females
n Mean SD n Mean SD
ASC parents 571 19.2 9.5 1429 16.4 9.5
Control parents 349 17.7 6.9 658 13.1 6.3
AS group 69 35.9 7.8 56 37.4 8.2
Control individuals 723 17.4 6.2 1038 15.5 5.6
Data from an AS group and controls, taken from [22] are also shown for reference.AQ = Autism Spectrum Quotient; ASC = autism spectrum condition; AS = Asperger's syndrome.
Wheelwright et al. Molecular Autism 2010, 1:10http://www.molecularautism.com/content/1/1/10
Page 6 of 9
Figure 1 Autism Spectrum Quotient (AQ) scores in the Autism Spectrum Condition (ASC) parent group.
0
1
2
3
4
5
6
7
8
0 2 4 6 8 10 12 14 16 18 20 22 24 26 28 30 32 34 36 38 40 42 44 46 48 50
AQ score
Per
cen
t o
f p
arti
cip
ants
ASC fathers ASC mothers
Figure 2 Autism Spectrum Quotient (AQ) scores in the control parent group.
0
1
2
3
4
5
6
7
8
0 2 4 6 8 10 12 14 16 18 20 22 24 26 28 30 32 34 36 38 40 42 44 46 48 50
AQ score
Per
cen
t o
f p
arti
cip
ants
Control fathers Control mothers
Wheelwright et al. Molecular Autism 2010, 1:10http://www.molecularautism.com/content/1/1/10
Page 7 of 9
Study limitationsThere are three methodological limitations with thisstudy. First, information about the families, includingchild diagnosis, was fully reliant on parental report. Sec-ondly, the questionnaires in the ASC and control groupswere collected in slightly different ways. The question-naires from the ASC group were collected from parentsregistering an interest in taking part in research, mostlyvia an online website, although some were paper copies.The questionnaires were collected over a period of 7years. By contrast, the control group questionnaires werecollected by post, over a period of a few weeks. Althoughwe do not think a person's AQ score will be affected bythe method of questionnaire administration (because thewording remains identical) this assumption warrantsfuture testing. The time difference between data collec-tion was not ideal, because public awareness of autismand related conditions has increased. However, it is notclear what influence, if any, this would have on individ-ual's response. Future studies should try to ensure thatdata collection methods are identical for all participants.
Finally, a third limitation is that our control group onlycomprised families with children who were developing
typically. Future studies could also include families whohave children with a different developmental disability, totest if there are any effects on how parents report theirown characteristics after the diagnosis of a child is made.We doubt this would have contributed to the presentresults, because the AQ measures a range of domains,including both social and non-social (attentional) charac-teristics.
ConclusionsThis study provides evidence that the AQ is a useful toolfor assessing autism phenotypes in non-clinical samples.The novel terms 'medium autism phenotype' and 'narrowautism phenotype' are introduced to extend the estab-lished term 'broader autism phenotype', and precisemethods of measuring each are provided. We found that33% of fathers of children with ASC and 23% of mothersscored at or above the BAP cut-off point, with signifi-cantly more parents of children with ASC showing MAPand NAP than was seen among control parents. Whetherthe broad, medium and narrow phenotypes are mirroredby either neural, cognitive, endocrine, proteomic orgenetic differences will be of interest to test in the future.
Table 5: Mean (and standard deviation) scores on each of the AQ subcategories in the parent groups
Communication Social skills Attention switching Imagination Attention to detail
ASC fathers 3.1 (2.4) 4.0 (2.9) 4.5 (2.6) 3.2 (2.3) 4.4 (2.3)
ASC mothers 2.6 (2.4) 3.1 (2.8) 4.0 (2.5) 2.4 (2.2) 4.4 (2.3)
Control fathers 2.6 (1.9) 3.1 (2.5) 4.2 (2.2) 3.1 (2.1) 4.7 (2.1)
Control mothers 1.7 (1.6) 1.9 (2.1) 3.1 (2.0) 1.8 (1.7) 4.7 (2.2)
F value for group main effect (and partial
eta2)
55.6** 91.8** 39.4** 18.4** 11.1*
(0.02) (0.03) (0.01) (0.006) (0.004)
F value for sex main effect (and partial
eta2)
58.6** 85.9** 71.0** 156.0** 0.01
(0.02) (0.03) (0.02) (0.05) (0.00)
F value for group x sex interaction (and
partial eta2)
3.6 2.1 9.2* 6.9 * 0.01
(0.001) (0.001) (0.003) (0.002) (0.00)
F values (and partial eta2) from the ANOVAs are presented.*P < 0.01, ** P < 0.001AQ, Autism Spectrum Quotient; ASC, autism spectrum condition
Wheelwright et al. Molecular Autism 2010, 1:10http://www.molecularautism.com/content/1/1/10
Page 8 of 9
Competing interestsThe authors declare that they have no competing interests.
Authors' contributionsAll authors read and approved the final manuscript. SW and SBC conceived thestudy and participated in its design. SW collated the ASC data, performed thestatistical analysis and drafted the manuscript. BA and CA collected the controldata.
AcknowledgementsWe were supported by grants from the MRC UK, the Shirley Foundation and the Nancy Lurie Marks Family Foundation to SBC during the period of this work. We are grateful to Bhismadev Chakrabarti, Rosa Hoekstra, Edward Suck-smith and Liliana Ruta for valuable discussions. Some data from this work were first presented at the International Meeting for Autism Research (IMFAR), Seat-tle 2007. This study was conducted in association with the NIHR CLAHRC for NHS Cambridgeshire and Peterborough Foundation Trust. We acknowledge the SCORE project team (Carol Brayne, Patrick Bolton, Fiona Scott, Carol Stott, Jo Williams, Carrie Allison and Simon Baron-Cohen) from which the control group were drawn. Finally, we are indebted to the parents (in both groups) who participated so generously.
Author DetailsAutism Research Centre, Department of Psychiatry, University of Cambridge, Douglas House, 18b Trumpington Rd, Cambridge, CB2 8AH, UK
References1. A.P.A: DSM-IV Diagnostic and Statistical Manual of Mental Disorders.
4th edition. Washington DC: American Psychiatric Association; 1994.
2. Bailey A, Le Couteur A, Gottesman I, Bolton P, Simmonoff E, Yuzda E, Rutter M: Autism as a strongly genetic disorder: evidence from a British twin study. Psychol Med 1995, 25:63-77.
3. Folstein S, Rutter M: Infantile autism: A genetic study of 21 twin pairs. J Child Psychol Psychiatry 1977, 18:297-321.
4. Constantino JN, Todd RD: Intergenerational transmission of subthreshold autistic traits in the general population. Biol Psychiatry 2005, 57:655-660.
5. Hoekstra RA, Bartels M, Verweij CJH, Boomsma DI: Heritability of autistic traits in the general population. Arch Pediat Adolesc Med 2007, 161:372-377.
6. Ronald A, Happe F, Bolton P, Butcher LM, Price TS, Wheelwright S, Baron-Cohen S, Plomin R: Genetic heterogeneity between the three components of the autism spectrum: a twin study. J Am Acad Child Adolesc Psychiatry 2006, 45:691-699.
7. Losh M, Sullivan PF, Trembath D, Piven J: Current developments in the genetics of autism: from phenome to genome. J Neuropathol Exp Neurol 2008, 67:829-837.
8. Geschwind DH: Autism: many genes, common pathways? Cell 2008, 135:391-395.
9. Baron-Cohen S, Wheelwright S, Skinner R, Martin J, Clubley E: The Autism-Spectrum Quotient (AQ): Evidence from Asperger syndrome/high-functioning autism, males and females, scientists and mathematicians. J Autism Dev Disord 2001, 31:5-17.
10. Kanner L, Eisenberg L: Early infantile autism, 1943-1955. Psychiatr Res Rep Am Psychiatr Assoc 1957:55-65.
11. Constantino J, N, Przybeck T, Friesen D, Todd R, D: Reciprocal social behaviour in children with and without pervasive developmental disorders. Devl Behav Pediatr 2000, 1:2-11.
12. Dawson G, Estes A, Munson J, Schellenberg G, Bernier R, Abbott R: Quantitative assessment of autism symptom-related traits in probands and parents: Broader Phenotype Autism Symptom Scale. J Autism Dev Disord 2007, 37:523-536.
Received: 5 February 2010 Accepted: 17 June 2010 Published: 17 June 2010This article is available from: http://www.molecularautism.com/content/1/1/10© 2010 Wheelwright et al; licensee BioMed Central Ltd. This is an Open Access article distributed under the terms of the Creative Commons Attribution License (http://creativecommons.org/licenses/by/2.0), which permits unrestricted use, distribution, and reproduction in any medium, provided the original work is properly cited.Molecular Autism 2010, 1:10
Figure 3 Percent age of parents with each phenotype. ASC = autism spectrum condition; BAP = broader autism phenotype; MAP = medium au-tism phenotype; NAP = narrow autism phenotype
0
10
20
30
40
50
60
70
80
90
100
ASC fathers ASC mothers Control fathers Control mothers
per
cen
t
Low Average BAP MAP NAP

Wheelwright et al. Molecular Autism 2010, 1:10http://www.molecularautism.com/content/1/1/10
Page 9 of 9
13. Hurley RS, Losh M, Parlier M, Reznick JS, Piven J: The broad autism phenotype questionnaire. J Autism Dev Disord 2007, 37:1679-1690.
14. Bolton P, MacDonald H, Pickles A, Rios P, Goode S, Crowson M, Bailey A, Rutter M: A Case-Control Family History Study of Autism. J Child Psychol Psychiatry 1994, 35:877-900.
15. Piven J, Palmer P, Jacobi D, Childress D, Arndt S: Broader autism phenotype: evidence from a family history study of multiple-incidence autism familiies. Am J Psychiatry 1997, 154:185-190.
16. Constantino JN, Lajonchere C, Lutz M, Gray T, Abbacchi A, McKenna K, Singh D, Todd RD: Autistic social impairment in the siblings of children with pervasive developmental disorders. Am J Psychiatry 2006, 163:294-296.
17. Auyeung B, Baron-Cohen S, Wheelwright S, Allison C: The Autism Spectrum Quotient: Children's Version (AQ-Child). J Autism Dev Disord 2008, 38:1230-1240.
18. Baron-Cohen S, Hoekstra RA, Knickmeyer R, Wheelwright S: The Autism-Spectrum Quotient (AQ) -Adolescent version. J Autism Dev Disord 2006, 36:343-350.
19. Austin EJ: Personality correlates of the broader autism phenotype as assessed by the Autism Spectrum Quotient (AQ). Pers Indiv Differ 2005, 38:451-460.
20. Hoekstra RA, Bartels M, Cath DC, Boomsma DI: Factor structure, reliability and criterion validity of the Autism-Spectrum Quotient (AQ): a study in Dutch population and patient groups. J Autism Dev Disord 2008, 38:1555-1566.
21. Stewart ME, Austin EJ: The structure of the Autism-Spectrum Quotient (AQ): Evidence from a student sample in Scotland. Pers Indiv Differ 2009, 47:224-228.
22. Wheelwright S, Baron-Cohen S, Goldenfeld N, Delaney J, Fine D, Smith R, Weil L, Wakabayashi A: Predicting Autism Spectrum Quotient (AQ) from the Systemizing Quotient-Revised (SQ-R) and Empathy Quotient (EQ). Brain Res 2006, 1079:47-56.
23. Wakabayashi A, Baron-Cohen S, Wheelwright S, Tojo Y: The Autism-Spectrum Quotient (AQ) in Japan: A cross-cultural comparison. J Autism Dev Disord 2006, 36:263-270.
24. Woodbury-Smith MR, Robinson J, Wheelwright S, Baron-Cohen S: Screening adults for Asperger syndrome using the AQ: A preliminary study of its diagnostic validity in clinical practice. J Autism Dev Disord 2005, 35:331-335.
25. Gomot M, Belmonte MK, Bullmore ET, Bernard FA, Baron-Cohen S: Brain hyper-reactivity to auditory novel targets in children with high-functioning autism. Brain 2008, 131:2479-2488.
26. Chakrabarti B, Dudbridge F, Kent L, Wheelwright S, Hill-Cawthorne G, Allison C, Banerjee-Basu S, Baron-Cohen S: Genes related to sex steroids, neural growth, and social-emotional behavior are associated with autistic traits, empathy, and Asperger syndrome. Autism Res 2009, 2:157-177.
27. Bayliss AP, di Pellegrino G, Tipper SP: Sex differences in eye gaze and symbolic cueing of attention. Q J Exp Psychol A 2005, 58:631-650.
28. Bayliss AP, Tipper SP: Gaze and arrow cueing of attention reveals individual differences along the autism spectrum as a function of target context. Br J Psychol 2005, 96:95-114.
29. Bishop DVM, Maybery M, Maley A, Wong D, Hill W, Hallmayer J: Using self-report to identify the broad phenotype in parents of children with autistic spectrum disorders: a study using the Autism-Spectrum Quotient. J Child Psychol Psychiatry 2004, 45:1431-1436.
30. Scott F, Baron-Cohen S, Bolton P, Brayne C: Prevalence of autism spectrum conditions in children aged 5-11 years in Cambridgeshire, UK. Autism 2002, 6(3):231-237.
31. Williams J, Scott F, Allison C, Bolton P, Baron- Cohen S, Brayne C: The CAST (Childhood Asperger Syndrome Test): test accuracy. Autism 2005:45-68.
32. Allison C, Williams J, Scott F, Stott C, Bolton P, Baron-Cohen S, Brayne C: The Childhood Asperger Syndrome Test (CAST): test-retest reliability in a high scoring sample. Autism 2007, 11:173-185.
33. Baron-Cohen S: The extreme male brain theory of autism. Trends in Cogn Sci 2002, 6:248-254.
34. Auyeung B, Baron-Cohen S, Ashwin E, Knickmeyer R, Taylor K, Hackett G: Fetal testosterone and autistic traits. Br J Psychol 2009, 100:1-22.
35. Baron-Cohen S, Wheelwright S: The Friendship Questionnaire: An investigation of adults with Asperger syndrome or high-functioning autism, and normal sex differences. J Autism Dev Disord 2003, 33:509-517.
36. Baron-Cohen S, Wheelwright S, Hill J, Raste Y, Plumb I: The 'Reading the Mind in the Eyes' test revised version: A study with normal adults, and adults with Asperger Syndrome or High-Functioning autism. J Child Psychol Psychiatry 2001, 42:241-252.
37. Golan O, Baron-Cohen S, Hill J: The Cambridge Mindreading (CAM) Face-Voice Battery: Testing complex emotion recognition in adults with and without Asperger syndrome. J Autism Dev Disord 2006, 36:169-183.
38. Grinter EJ, Maybery MT, Van Beek PL, Pellicano E, Badcock JC, Badcock DR: Global Visual Processing and Self-Rated Autistic-like Traits. J Autism Dev Disord 2009, 39:1278-1290.
39. Grinter EJ, Van Beek PL, Maybery MT, Badcock DR: Brief Report: Visuospatial Analysis and Self-Rated Autistic-Like Traits. J Autism Dev Disord 2009, 39:670-677.
40. Hermans EJ, van Wingen G, Bos PA, Putman P, van Honk J: Reduced spontaneous facial mimicry in women with autistic traits. Biol Psychol 2009, 80:348-353.
41. Stewart ME, Ota M: Lexical effects on speech perception in individuals with "autistic" traits. Cognition 2008, 109:157-162.
42. Stewart ME, Watson J, Allcock AJ, Yaqoob T: Autistic traits predict performance on the block design. Autism 2009, 13:133-142.
doi: 10.1186/2040-2392-1-10Cite this article as: Wheelwright et al., Defining the broader, medium and narrow autism phenotype among parents using the Autism Spectrum Quo-tient (AQ) Molecular Autism 2010, 1:10
http://www.ncbi.nlm.nih.gov/entrez/query.fcgi?cmd=Retrieve&db=PubMed&dopt=Abstract&list_uids=7962246