
Deep FORS1 Observations of the Double Main Sequence of ω Centauri
15
arXiv:astro-ph/0609650v1 25 Sep 2006 DRAFT VERSION FEBRUARY 5, 2008 Preprint typeset using L A T E X style emulateapj v. 6/22/04 DEEP FORS1 OBSERVATIONS OF THE DOUBLE MAIN SEQUENCE OF ω CENTAURI ∗ A. SOLLIMA 1 , F. R. FERRARO 1 , M. BELLAZZINI 2 , L. ORIGLIA 2 , O. STRANIERO 3 AND E. PANCINO 2 Draft version February 5, 2008 ABSTRACT We present the results of a deep photometric survey performed with FORS1@VLT aimed at investigating the complex Main Sequence structure of the stellar system ω Centauri. We confirm the presence of a double Main Sequence and identify its blue component (bMS) over a large field of view up to 26’ from the cluster center. We found that bMS stars are significantly more concentrated toward the cluster center than the other "normal" MS stars. The bMS morphology and its position in the CMD have been used to constrain the helium overabundance required to explain the observed MS morphology. Subject headings: techniques: photometric – stars: evolution – stars: Population II – globular cluster: ω Cen 1. INTRODUCTION The understanding of the origin and evolution of the stel- lar system ω Centauri (NGC5139) still represents one of the most intriguing unanswered questions of stellar astrophysics. Unique among Galactic star clusters in terms of structure, kinematics and stellar content, it is the only known globular cluster (GC) which shows a clear metallicity spread (Norris et al. 1996 and references therein). Recent photometric surveys have revealed the presence of multiple sequences in its color- magnitude diagram (CMD). In particular, high-precision pho- tometric analyses have revealed a discrete structure of its red giant branch (RGB, Rey et al. 2004; Sollima et al. 2005a), indicating a complex star formation history. Beside the domi- nant metal-poor population (MP, [Fe/H] ∼ -1.6), three metal- intermediate (MInt) components (spanning a range of metal- licity -1.3 < [Fe/H] < -1.0) and an extreme metal-rich popu- lation ([Fe/H] ∼ -0.6, Pancino et al. 2002) have been identi- fied. The different RGB populations of ω Cen share different structural and dynamical properties (Norris et al. 1997; Fer- raro et al. 2002; Pancino et al. 2003; Sollima et al. 2005a). In particular, Norris et al. (1997) found that the 20 % metal-rich tail of the distribution is more concentrated toward the cluster center than the dominant metal-poor component. Finally, Anderson (2002) and Bedin et al. (2004) discov- ered new peculiarities also along the Main Sequence (MS) of the cluster. Indeed, an additional blue MS (bMS, com- prising ∼ 30% of the whole cluster MS stars) running par- allel to the dominant one, has been resolved. According to stellar models with canonical chemical abundances, the loca- tion of the observed bMS would suggest a very low metal- licity ([Fe/H ] < -2). Conversely, the spectroscopic analysis of a sample of MS stars belonging to the two MS compo- nents showed that bMS stars present a metallicity ∼ 0.3 dex higher than that of the dominant cluster population (Piotto et al. 2005). Norris (2004) suggested that a large helium over- abundance (∆Y ∼ 0.15) could explain the anomalous position ∗ BASED ON FORS1 OBSERVATIONS COLLECTEDWITH THE VERY LARGE TELESCOPE AT THE EUROPEAN SOUTHERN OBSERVA- TORY, CERRO PARANAL, CHILE, WITHIN THE OBSERVING PRO- GRAM 74.D-0369(B). 1 Dipartimento di Astronomia, Università di Bologna, via Ranzani 1, Bologna, Italy 2 INAF Osservatorio Astronomico di Bologna, via Ranzani 1, I-40127 Bologna, Italy 3 INAF Osservatorio Astronomico di Collurania, via M. Maggioni, I- 64100 Teramo, Italy of the bMS in the CMD. However, such a large helium abun- dance spread poses serious problems in the overall interpreta- tion of the chemical enrichment history of this stellar system. In this paper we present deep BR photometry 4 covering a wide area extending from 6’ to 26’ from the cluster center with the aim of studying the morphology, the radial extent and the distribution of the bMS population. 2. OBSERVATIONS AND DATA REDUCTION The photometric data were obtained with the FORS1 cam- era, mounted at the Unit1 (UT1) of the ESO Very Large Tele- scope (VLT, Cerro Paranal, Chile). Observations were per- formed during 6 nights on March and April 2005 (see Table 1), using the standard resolution mode of FORS1. In this configuration the image scale is 0.2" pixel -1 and the cam- era has a global field of view of 6.8 ′ × 6.8 ′ . A mosaic of 8 partially overlapping fields spanning a wide area from 6’ to 26’ from the cluster center were observed (see Fig. 1). The innermost field partially overlaps the deep ACS photom- etry described in Ferraro et al. (2004) allowing linkage be- tween the two datasets. The standard pre-reduction proce- dure was followed to remove the bias and to apply flat-field corrections. We used the point-spread-function (PSF) fitting package DoPhot (Schechter et al. 1993) to obtain instrumen- tal magnitudes for all the stars detected in each frame. For each field, two different frames were observed through the B and R filters. The photometric analysis was performed inde- pendently on each image. Only stars detected in all the four frames were included in the final catalog. For each passband, the obtained magnitudes were transformed to the same instru- mental scale and averaged. As usual, the most isolated and brightest stars in the field were used to link the aperture mag- nitudes to the fitting instrumental ones, after normalizing for exposure time and correcting for airmass. During the observ- ing run, nine standard stars from the Landolt (1992) list were observed. Aperture photometry was performed on each stan- dard, and used to derive the equations linking the aperture photometry to the standard photometric system. The calibra- tion equations linking the b and r instrumental magnitudes to the standard system ones (B and R) are: B - b = -0.067 (b - r) + 27.123 R - r =0.007 (b - r) + 27.400 4 The entire catalog is only available in electronic form at the CDS via http://cdsweb.u-strasbg.fr/
-
Upload
independent -
Category
Documents
-
view
0 -
download
0
Transcript of Deep FORS1 Observations of the Double Main Sequence of ω Centauri

arX
iv:a
stro
-ph/
0609
650v
1 2
5 S
ep 2
006
DRAFT VERSIONFEBRUARY 5, 2008Preprint typeset using LATEX style emulateapj v. 6/22/04
DEEP FORS1 OBSERVATIONS OF THE DOUBLE MAIN SEQUENCE OFω CENTAURI∗
A. SOLLIMA 1, F. R. FERRARO1, M. BELLAZZINI 2, L. ORIGLIA 2, O. STRANIERO3 AND E. PANCINO2
Draft version February 5, 2008
ABSTRACTWe present the results of a deep photometric survey performed with FORS1@VLT aimed at investigating
the complex Main Sequence structure of the stellar systemω Centauri. We confirm the presence of a doubleMain Sequence and identify its blue component (bMS) over a large field of view up to 26’ from the clustercenter. We found that bMS stars are significantly more concentrated toward the cluster center than the other"normal" MS stars. The bMS morphology and its position in theCMD have been used to constrain the heliumoverabundance required to explain the observed MS morphology.Subject headings: techniques: photometric – stars: evolution – stars: Population II – globular cluster:ω Cen
1. INTRODUCTION
The understanding of the origin and evolution of the stel-lar systemω Centauri (NGC5139) still represents one of themost intriguing unanswered questions of stellar astrophysics.Unique among Galactic star clusters in terms of structure,kinematics and stellar content, it is the only known globularcluster (GC) which shows a clear metallicity spread (Norrisetal. 1996 and references therein). Recent photometric surveyshave revealed the presence of multiple sequences in its color-magnitude diagram (CMD). In particular, high-precision pho-tometric analyses have revealed a discrete structure of itsredgiant branch (RGB, Rey et al. 2004; Sollima et al. 2005a),indicating a complex star formation history. Beside the domi-nant metal-poor population (MP, [Fe/H] ∼ −1.6), three metal-intermediate (MInt) components (spanning a range of metal-licity −1.3< [Fe/H] < −1.0) and an extreme metal-rich popu-lation ([Fe/H] ∼ −0.6, Pancino et al. 2002) have been identi-fied. The different RGB populations ofω Cen share differentstructural and dynamical properties (Norris et al. 1997; Fer-raro et al. 2002; Pancino et al. 2003; Sollima et al. 2005a). Inparticular, Norris et al. (1997) found that the 20 % metal-richtail of the distribution is more concentrated toward the clustercenter than the dominant metal-poor component.
Finally, Anderson (2002) and Bedin et al. (2004) discov-ered new peculiarities also along the Main Sequence (MS)of the cluster. Indeed, an additional blue MS (bMS, com-prising∼ 30% of the whole cluster MS stars) running par-allel to the dominant one, has been resolved. According tostellar models with canonical chemical abundances, the loca-tion of the observed bMS would suggest a very low metal-licity ([ Fe/H] < −2). Conversely, the spectroscopic analysisof a sample of MS stars belonging to the two MS compo-nents showed that bMS stars present a metallicity∼ 0.3 dexhigher than that of the dominant cluster population (Piottoetal. 2005). Norris (2004) suggested that a large helium over-abundance (∆Y ∼ 0.15) could explain the anomalous position
∗BASED ON FORS1 OBSERVATIONS COLLECTED WITH THE VERYLARGE TELESCOPE AT THE EUROPEAN SOUTHERN OBSERVA-TORY, CERRO PARANAL, CHILE, WITHIN THE OBSERVING PRO-GRAM 74.D-0369(B).
1 Dipartimento di Astronomia, Università di Bologna, via Ranzani 1,Bologna, Italy
2 INAF Osservatorio Astronomico di Bologna, via Ranzani 1, I-40127Bologna, Italy
3 INAF Osservatorio Astronomico di Collurania, via M. Maggioni, I-64100 Teramo, Italy
of the bMS in the CMD. However, such a large helium abun-dance spread poses serious problems in the overall interpreta-tion of the chemical enrichment history of this stellar system.
In this paper we present deep BR photometry4 covering awide area extending from 6’ to 26’ from the cluster centerwith the aim of studying the morphology, the radial extentand the distribution of the bMS population.
2. OBSERVATIONS AND DATA REDUCTION
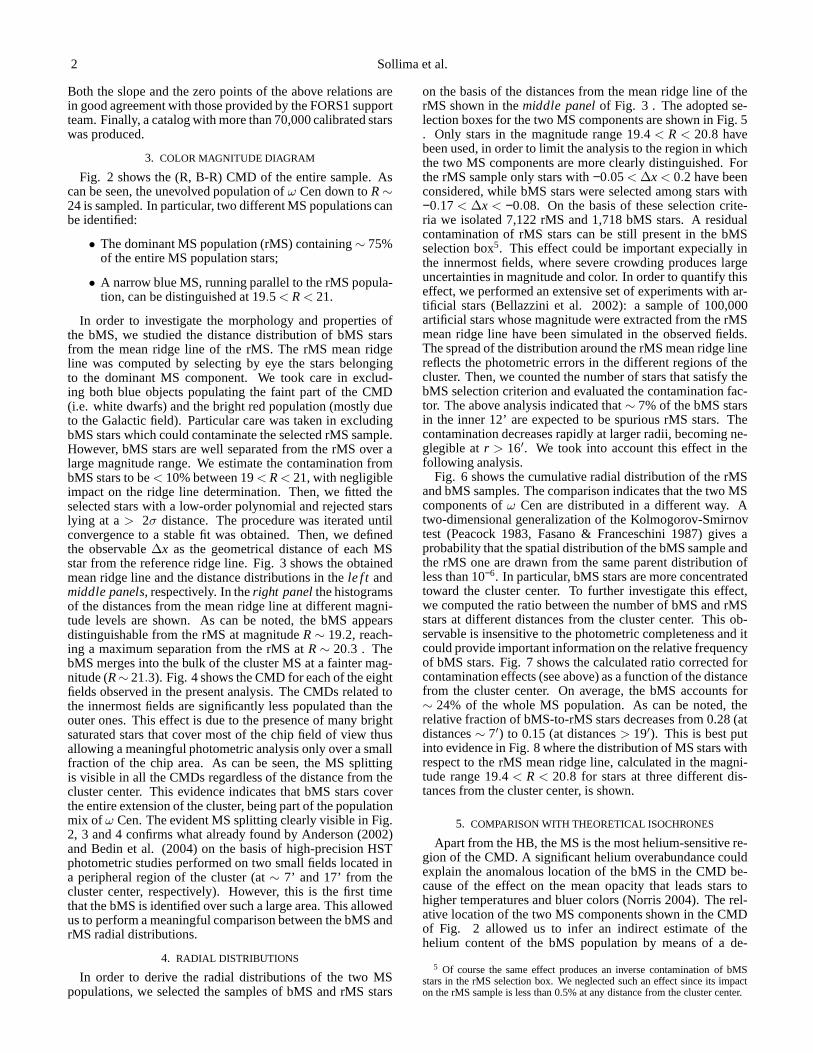
The photometric data were obtained with the FORS1 cam-era, mounted at the Unit1 (UT1) of the ESO Very Large Tele-scope (VLT, Cerro Paranal, Chile). Observations were per-formed during 6 nights on March and April 2005 (see Table1), using the standard resolution mode of FORS1. In thisconfiguration the image scale is 0.2"pixel−1 and the cam-era has a global field of view of 6.8′ × 6.8′ . A mosaic of8 partially overlapping fields spanning a wide area from 6’to 26’ from the cluster center were observed (see Fig. 1).The innermost field partially overlaps the deep ACS photom-etry described in Ferraro et al. (2004) allowing linkage be-tween the two datasets. The standard pre-reduction proce-dure was followed to remove the bias and to apply flat-fieldcorrections. We used the point-spread-function (PSF) fittingpackage DoPhot (Schechter et al. 1993) to obtain instrumen-tal magnitudes for all the stars detected in each frame. Foreach field, two different frames were observed through the Band R filters. The photometric analysis was performed inde-pendently on each image. Only stars detected in all the fourframes were included in the final catalog. For each passband,the obtained magnitudes were transformed to the same instru-mental scale and averaged. As usual, the most isolated andbrightest stars in the field were used to link the aperture mag-nitudes to the fitting instrumental ones, after normalizingforexposure time and correcting for airmass. During the observ-ing run, nine standard stars from the Landolt (1992) list wereobserved. Aperture photometry was performed on each stan-dard, and used to derive the equations linking the aperturephotometry to the standard photometric system. The calibra-tion equations linking the b and r instrumental magnitudes tothe standard system ones (B and R) are:
B − b = −0.067 (b − r) + 27.123
R − r = 0.007 (b − r) + 27.400
4 The entire catalog is only available in electronic form at the CDS viahttp://cdsweb.u-strasbg.fr/
2 Sollima et al.
Both the slope and the zero points of the above relations arein good agreement with those provided by the FORS1 supportteam. Finally, a catalog with more than 70,000 calibrated starswas produced.
3. COLOR MAGNITUDE DIAGRAM
Fig. 2 shows the (R, B-R) CMD of the entire sample. Ascan be seen, the unevolved population ofω Cen down toR ∼
24 is sampled. In particular, two different MS populations canbe identified:
• The dominant MS population (rMS) containing∼ 75%of the entire MS population stars;
• A narrow blue MS, running parallel to the rMS popula-tion, can be distinguished at 19.5 < R < 21.
In order to investigate the morphology and properties ofthe bMS, we studied the distance distribution of bMS starsfrom the mean ridge line of the rMS. The rMS mean ridgeline was computed by selecting by eye the stars belongingto the dominant MS component. We took care in exclud-ing both blue objects populating the faint part of the CMD(i.e. white dwarfs) and the bright red population (mostly dueto the Galactic field). Particular care was taken in excludingbMS stars which could contaminate the selected rMS sample.However, bMS stars are well separated from the rMS over alarge magnitude range. We estimate the contamination frombMS stars to be< 10% between 19< R < 21, with negligibleimpact on the ridge line determination. Then, we fitted theselected stars with a low-order polynomial and rejected starslying at a> 2σ distance. The procedure was iterated untilconvergence to a stable fit was obtained. Then, we definedthe observable∆x as the geometrical distance of each MSstar from the reference ridge line. Fig. 3 shows the obtainedmean ridge line and the distance distributions in thele f t andmiddle panels, respectively. In theright panel the histogramsof the distances from the mean ridge line at different magni-tude levels are shown. As can be noted, the bMS appearsdistinguishable from the rMS at magnitudeR ∼ 19.2, reach-ing a maximum separation from the rMS atR ∼ 20.3 . ThebMS merges into the bulk of the cluster MS at a fainter mag-nitude (R∼ 21.3). Fig. 4 shows the CMD for each of the eightfields observed in the present analysis. The CMDs related tothe innermost fields are significantly less populated than theouter ones. This effect is due to the presence of many brightsaturated stars that cover most of the chip field of view thusallowing a meaningful photometric analysis only over a smallfraction of the chip area. As can be seen, the MS splittingis visible in all the CMDs regardless of the distance from thecluster center. This evidence indicates that bMS stars coverthe entire extension of the cluster, being part of the populationmix of ω Cen. The evident MS splitting clearly visible in Fig.2, 3 and 4 confirms what already found by Anderson (2002)and Bedin et al. (2004) on the basis of high-precision HSTphotometric studies performed on two small fields located ina peripheral region of the cluster (at∼ 7’ and 17’ from thecluster center, respectively). However, this is the first timethat the bMS is identified over such a large area. This allowedus to perform a meaningful comparison between the bMS andrMS radial distributions.
4. RADIAL DISTRIBUTIONS
In order to derive the radial distributions of the two MSpopulations, we selected the samples of bMS and rMS stars
on the basis of the distances from the mean ridge line of therMS shown in themiddle panel of Fig. 3 . The adopted se-lection boxes for the two MS components are shown in Fig. 5. Only stars in the magnitude range 19.4 < R < 20.8 havebeen used, in order to limit the analysis to the region in whichthe two MS components are more clearly distinguished. Forthe rMS sample only stars with−0.05< ∆x < 0.2 have beenconsidered, while bMS stars were selected among stars with−0.17< ∆x < −0.08. On the basis of these selection crite-ria we isolated 7,122 rMS and 1,718 bMS stars. A residualcontamination of rMS stars can be still present in the bMSselection box5. This effect could be important expecially inthe innermost fields, where severe crowding produces largeuncertainties in magnitude and color. In order to quantify thiseffect, we performed an extensive set of experiments with ar-tificial stars (Bellazzini et al. 2002): a sample of 100,000artificial stars whose magnitude were extracted from the rMSmean ridge line have been simulated in the observed fields.The spread of the distribution around the rMS mean ridge linereflects the photometric errors in the different regions of thecluster. Then, we counted the number of stars that satisfy thebMS selection criterion and evaluated the contamination fac-tor. The above analysis indicated that∼ 7% of the bMS starsin the inner 12’ are expected to be spurious rMS stars. Thecontamination decreases rapidly at larger radii, becomingne-glegible atr > 16′. We took into account this effect in thefollowing analysis.
Fig. 6 shows the cumulative radial distribution of the rMSand bMS samples. The comparison indicates that the two MScomponents ofω Cen are distributed in a different way. Atwo-dimensional generalization of the Kolmogorov-Smirnovtest (Peacock 1983, Fasano & Franceschini 1987) gives aprobability that the spatial distribution of the bMS sampleandthe rMS one are drawn from the same parent distribution ofless than 10−6. In particular, bMS stars are more concentratedtoward the cluster center. To further investigate this effect,we computed the ratio between the number of bMS and rMSstars at different distances from the cluster center. This ob-servable is insensitive to the photometric completeness and itcould provide important information on the relative frequencyof bMS stars. Fig. 7 shows the calculated ratio corrected forcontamination effects (see above) as a function of the distancefrom the cluster center. On average, the bMS accounts for∼ 24% of the whole MS population. As can be noted, therelative fraction of bMS-to-rMS stars decreases from 0.28 (atdistances∼ 7′) to 0.15 (at distances> 19′). This is best putinto evidence in Fig. 8 where the distribution of MS stars withrespect to the rMS mean ridge line, calculated in the magni-tude range 19.4 < R < 20.8 for stars at three different dis-tances from the cluster center, is shown.
5. COMPARISON WITH THEORETICAL ISOCHRONES
Apart from the HB, the MS is the most helium-sensitive re-gion of the CMD. A significant helium overabundance couldexplain the anomalous location of the bMS in the CMD be-cause of the effect on the mean opacity that leads stars tohigher temperatures and bluer colors (Norris 2004). The rel-ative location of the two MS components shown in the CMDof Fig. 2 allowed us to infer an indirect estimate of thehelium content of the bMS population by means of a de-
5 Of course the same effect produces an inverse contaminationof bMSstars in the rMS selection box. We neglected such an effect since its impacton the rMS sample is less than 0.5% at any distance from the cluster center.

FORS1 observations of the double MS ofω Cen 3
tailed comparison with suitable theoretical models. In do-ing this, we used a new set of theoretical isochrones calcu-lated adopting the most up-to-date input physics and spanninga wide range in helium abundance. A detailed descriptionof the evolutionary code used to compute these new mod-els can be found in Straniero et al. 1997. To compare theobserved CMD with theoretical isochrones, a distance mod-ulus and a reddening correction have to be adopted. In thefollowing we used (m − M)0 = 13.70±0.13 (Bellazzini et al.2004). Concerning the reddening and extinction coefficients,we usedE(B−V ) = 0.11±0.01 (Lub 2002),AB = 4.1 E(B−V ),AR = 2.32E(B −V) (Savage & Mathis 1979).
For the dominant rMS population we adopted a metallicityof [Fe/H] = −1.6 as suggested by the most extensive spectro-scopic surveys performed on giant stars (Norris et al. 1996;Suntzeff & Kraft 1996), while for the bMS we adopted a sig-nificantly higher metallicity of [Fe/H] = −1.3, as indicatedby Piotto et al. (2005). The contribution of theα-elementenhancement has been taken into account by simply rescalingstandard models to the global metallicity [M/H], accordingtothe following relation
[M/H] = [Fe/H]+ log10(0.638 10[α/Fe] +0.362) Salaris et al. (1993)
We adopted [α/Fe] = +0.3 for both the rMS and the bMSsamples, according to the most recent high-resolution spec-troscopic results (Norris & Da Costa 1995; Smith et al. 2000;Vanture et al. 2002). For the two MS components wecomputed a set of models with canonical helium abundance(Y=0.246, Salaris et al. 2004) and various helium enhance-ment levels. The metallicity, in terms of mass fraction Z, hasbeen calculated according to the relation
Z = (1−Y)10[M/H ]+log[Z/X ]⊙
1+ 10[M/H ]+log[Z/X ]⊙Sollima et al. (2005b)
where [Z/X ]⊙ = 0.0176, according to Lodders et al. (2003).Fig. 9 shows the isochrone fitting for the two observedMS populations ofω Cen. As can be seen the metal-poorisochrone nicely fits the rMS. While the metal-rich isochronewith cosmological helium abundance cannot reproduce the lo-cation of the bMS in the CMD, a significant helium enhance-ment (Y > 0.35) is required to reproduce the bMS. The bMSis best fitted by an isochrone with Y=0.40 . This value is ingood agreement with that predicted by Norris (2004) and thatestimated by Piotto et al. (2005) on the basis of ACS obser-vations of a peripheral region of the cluster. However, theexact amount of helium overabundance needed to explain theobserved MS morphology is still largely uncertain because ofthe following reasons:
• Uncertainties in the color-temperature conversion.A helium overabundance significantly alters thetrasparency of the atmosphere. The adoption of color-temperature conversion based on standard models withno helium overabundance produces a shift in color thatmimics a larger helium abundance;
• Uncertainties on the metal abundances. Small changesin the iron and/orα-elements abundances produce sig-nificant effects on the MS morphology. Theoreticalmodels indicate that a variation of∆Z = 0.0001 in themetal content difference between the two MS popula-tions would mimic the effect of a change of∆Y = 0.012in the deduced helium abundance;
• Theoretical uncertainties in the helium-rich isochrones.Until now, none of the known stellar systems has beenfound to have a helium abundanceY > 0.30 . Therefore,there are no direct observational constraints that allowto confirm the effect of the large helium overabundancepredicted by theoretical models.
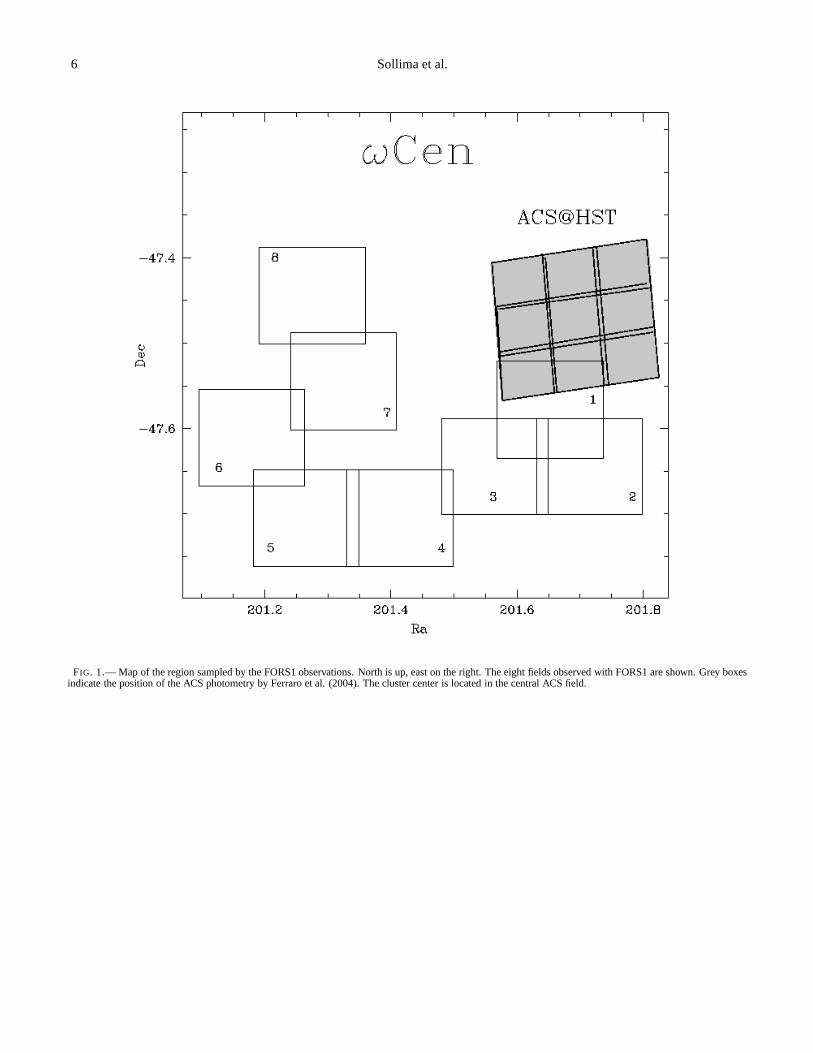
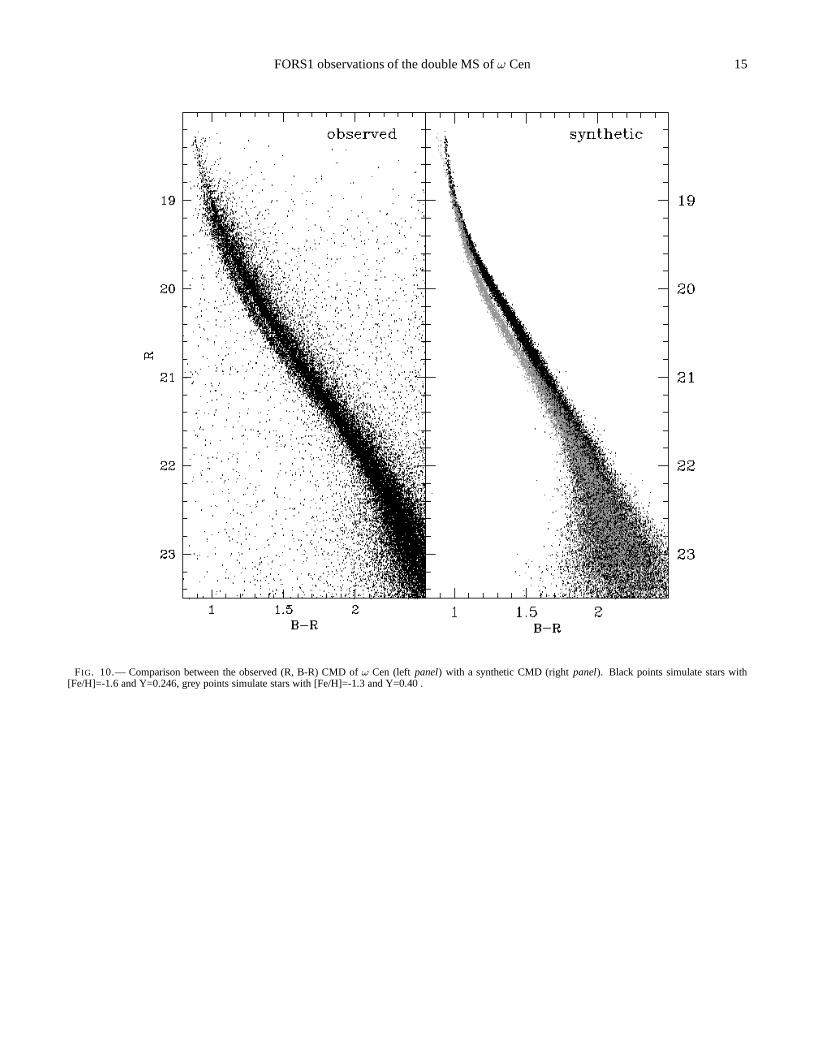
In Fig. 10 we compare the CMD of Fig. 2 with a syn-thetic CMD obtained adopting for the two MS componentsthe stellar parameters listed above, a Salpeter (1955) InitialMass Function and photometric errors derived from the arifi-cial star technique described in Sect. 4 . Note that the syn-thetic CMD reproduces quite well the observed CMD also inthe faint part of the MS where the bMS merges with the rMSat R ∼ 21 . The effective temperature of the lower part ofthe MS is indeed less sensitive to a variation of the heliumcontent with respect to the upper part (see Alexander et al.1997). This occurrence can be explained with simple argu-ments. In very low mass stars (< 0.5M⊙), the onset of theH2 recombination (below 6000 K) induces the formation of adeep convective envelope characterized by a very efficient en-ergy transport. In practice, the temperature gradient coincideswith the adiabatic gradient up to the top of the convectivezone. In this condition, since the radiative flux is negligible,the effective temperature is mainly controlled by the detailsof the equation of state and it is less sensitive to the variationof the radiative opacity. In particular, the adiabatic gradientis dominated by the presence of hydrogen molecules, whilethe atomic H and He only give minor contributions. Indeed,owing to the presence of these molecules, the number of inter-nal degrees of freedom increases, the specific heat increasesand the adiabatic gradient significantly decreases with respectto the typical value of a monoatomic perfect gas (with just 3degrees of freedom anddlogT/dlogP = 0.4). Detailed stel-lar models calculations confirm that the separation betweenisochrones computed with different helium abundances be-comes progressively less evident at fainter magnitudes. Theincreasing photometric error introduces a further confusion atlower magnitudes making impossible to distinguish the twoMSs.
6. DISCUSSION AND CONCLUSIONS
The results presented in this paper indicate that the bMSpresents peculiar structural properties which differ fromthoseof the dominant MS population ofω Cen. In particular, bMSstars are significantly more concentrated toward the clustercenter. Note that differences in the spatial distribution of dif-ferent RGB populations were already found by Norris et al.(1997), Pancino et al. (2003) and Sollima et al. (2005a)which showed that the metal-rich ([Fe/H] > −1.4) stellarpopulations ofω Cen are more concentrated than the domi-nant metal-poor population. Peculiarities in the radial distri-butions were also found among the HB stars ofω Cen: Bailynet al. (1992) and Rey et al. (2004) showed that the populationof Extreme Horizontal Branch (EHB) stars ofω Cen is moreconcentrated toward the cluster center than MS and Sub GiantBranch (SGB) stars.
A detailed comparison with theoretical isochrones confirmsthat a significant helium overabundance (∆Y > 0.10) couldexplain the observed bMS morphology, as already suggestedby Norris (2004), Piotto et al. (2005) and Lee et al. (2005).Note that the existence of a stellar population with such a largehelium overabundance can also naturally explain the HB mor-phology (in particular the existence of the population of EHB

4 Sollima et al.
stars observed in the cluster, Lee et al. 2005), the locationofthe RGB bumps (Sollima et al. 2005a) and the SGB morphol-ogy (Sollima et al. 2005b) remaining consistent with the short(< 2Gyr) star formation time-scale estimated by Sollima et al.(2005b). The peculiar structural properties of the bMS indi-cate that the star formation process inω Cen could have pro-ceeded favoring the formation of helium-rich population(s) inthe inner region of the cluster.
However, this scenario poses serious problems in drawingthe overall chemical enrichment history of this stellar system.In fact, none among the known chemical enrichment mecha-nisms is able to produce the huge amount of helium requiredto reproduce the observed MS morphology without drasticallyincreasing the metal abundance. Indeed, the derived helium-to-metals abundance gradient between the dominant metal-poor and bMS population turns out to beδY/δZ >> 100, instark contrast with more canonical values ofδY/δZ ∼ 3− 4(Jimenez et al. 2003). In this respect, an intriguing puz-zle is presented by the observed incongruences between theexpected and the observed luminosity of metal-intermediate([Fe/H] ∼ −1.2) RR Lyrae found inω Cen by Sollima et al.(2006, see also Rey et al. 2000 and Norris 2004). Note that ahelium-rich population is not expected to produce a sizeableRR Lyrae component (Lee et al. 2005). Hence, two pop-ulations with similar metallicities but very different heliumabundances seem to coexist within the cluster.
A selective self-enrichment process has to be invoked inorder to produce the required amount of helium while keepingthe metal abundance practically unchanged. Moreover, a veryefficient mechanism is required in order to homogenize andefficiently re-use all the “enriched” material ejected by theprevious generation of polluting stars.
However, apure self-enrichment scenario may not be thebest description of the evolution ofω Cen. Alternative sce-narios can also be considered.
In particular, the bMS population could have formed in adifferent environment, thus not partaking in the chemical en-richment process ofω Cen. In this case, a complex interplayof chemical and dynamical evolution has to be taken into ac-count, including gas exchange with the Milky Way and/or mi-nor mergers, within a framework such as the binary clustermergers scenario (Makino et al. 1997; Minniti et al. 2004).
Bekki & Norris (2006) noted that the large fraction of bMSstars (∼ 24%) cannot be explained without assuming thatmost of the helium enriched gas necessary to form the bMSoriginated from external sources. They suggested that partof the helium-enriched stars formed from gas ejected by fieldstellar populations surroundingω Cen when it was the nu-cleus of an ancient dwarf galaxy, and later fell into the centralregion of the system.
Another possible explanation can be provided by the pres-ence of spatial variation in the helium abundance of the pro-tostellar clouds from which the helium-rich population(s)ofω Cen formed. Diffusion could produce such an effect as aresult of the different acceleration imparted to helium atomsbecause of their different atomic masses (Chuzhoy 2006).
This research was supported by the Agenzia Spaziale Ital-iana and the Ministero dell’Istruzione, dell’Università edellaRicerca. We warmly thank Paolo Montegriffo for assistanceduring the catalogs cross-correlation and astrometric calibra-tion process.
REFERENCES
Alexander, D. R., Brocato, E., Cassisi, S., Castellani, V.,Ciacio, F.,Degl’Innocenti, S., 1997, A&A, 317, 90
Anderson J. in "ω Centauri: A Unique Window into Astrophysics", 2002, ed.F. van Leeuwen, J. D. Huges & G. Piotto, ASP Conf.Series, 87
Bailyn, C. D., Sarajedini, A., Cohn, H., Lugger, P. & Grindlay, J. E., 1992,AJ, 103, 1564
Bedin, L. R., Piotto, G., Anderson, J., Cassisi, S., King, I.R., Momany, Y. &Carraro, G., 2004, ApJ, 605, L125
Bekki, K. & Norris, J. E., 2006, ApJ, 637, L109Bellazzini, M., Ferraro, F. R., Origlia, L., Pancino, E., Monaco, L., Oliva, E.,
2002, AJ, 124, 3222Bellazzini, M., Ferraro, F. R., Sollima, A., Pancino, E., Origlia, L., 2004,
A&A, 424, 199Chuzoy, L., 2006, MNRAS, in pressFasano, G. & Franceschini, A., 1987, MNRAS, 225, 155Ferraro, F. R., Bellazzini, M., Pancino, E., 2002, ApJ, 573,95Ferraro, F. R., Sollima, A., Pancino, E., Bellazzini, M., Origlia, L., Straniero,
O., & Cool, A., 2004, ApJ, 603, L81Jimenez, R., Flynn, C., McDonald, J. & Gibson, B. K., 2003, Science, 299,
1552Landolt, A. 1992, AJ, 104, 340Lee, Y. W. et al., 2005, ApJ, 621, L57Lodders, K. 2003, ApJ, 591, 1220Lub, J. 2002, in A Unique Window into Astrophysics, ed. F. vanLeeuwen, J.
D. Hughes, & G.Piotto, ASP Conf.Series, Vol. 265, 95Makino, J., Akiyama, K., Sugimoto, D., 1997, Ap&SS, 185, 63Minniti, D., Rejkuba, M., Funes, S. J., José G., & Kennicutt,R. C., 2004,
ApJ, 612, 215Norris, J. E., Da Costa, G. S., 1995, ApJ, 447, 680Norris, J. E., Freeman, K. C. & Mighell, K. J., 1996, ApJ, 462,241Norris, J. E., Freeman, K. C., Mayor, M.& Seitzer, P., 1997, ApJ, 487, L187Norris, J. E., 2004, ApJ, 612, L25
Pancino, E., Pasquini, L., Hill, V., Ferraro, F. R. & Bellazzini, M., 2002, ApJ,568, L101
Pancino, E., Seleznev, A., Ferraro, F. R., Bellazzini, M. & Piotto, G., 2003,MNRAS, 345, 683
Peacock, J. A., 1983, MNRAS, 202, 615Piotto, G. et al., 2005, ApJ, 621, 777Rey, S.-C., Lee, Y.-W., Joo, J.-M., Walker, A., & Baird, S., 2000, AJ, 119,
1824Rey, S. C., Lee, Y. W., Ree, C. H., Joo, J. M., Sohn, Y. J. & Walker, A. R.,
2004, AJ, 127, 958Salaris, M., Chieffi, A., Straniero, O., 1993, Mem. Soc. Astron. Italiana, 63,
315Salaris, M., Riello, M., Cassisi, S. & Piotto, G., 2004, A&A,490, 911Salpeter, E. E., 1955, ApJ, 121, 161Savage, B. D., Mathis, J. S., 1979, ARA&A, 17, 73Schechter, P. L., Mateo, M., Saha, A., 1993, PASP, 105, 1342Smith, V. V., Suntzeff, N. B., Cunha, K., Gallino R., Busso, M., Lambert, D.
L. & Straniero, O., 2000, AJ, 119, 1239Sollima, A., Ferraro, F. R., Pancino E., & Bellazzini, M. 2005a, MNRAS,
357, 265Sollima, A., Pancino E., Ferraro, F. R., Bellazzini, M., Straniero, O. &
Pasquini, L., 2005b, ApJ, 634, 332Sollima, A., Borissova, J., Catelan, M., Smith, H. A., Minniti, D., Cacciari,
C. & Ferraro, F. R., 2006, ApJ, 640, L43Straniero, O., Chieffi, A. & Limongi, M., 1997, ApJ, 490, 425Suntzeff, N. B. & Kraft, R. P., 1996, AJ, 111, 1913van Leeuwen, F. & Le Poole, R. S., 2002, in "ω Centauri: A Unique Window
into Astrophysics", ASP Conf. Series, 265, 41Vanture, A. D., Wallerstein, G. & Suntzeff, N. B., 2002, ApJ,569, 984

FORS1 observations of the double MS ofω Cen 5
TABLE 1OBSERVING LOGS
Field Date Filter Exp timesec
1 10 Apr 2005 B 10991 10 Apr 2005 B 10991 10 Apr 2005 R 3941 10 Apr 2005 R 3942 16 Mar 2005 B 10992 16 Mar 2005 B 10992 16 Mar 2005 R 3942 16 Mar 2005 R 3943 16 Mar 2005 B 10993 16 Mar 2005 B 10993 16 Mar 2005 R 3943 16 Mar 2005 R 3944 08 Apr 2005 B 10994 08 Apr 2005 B 10994 08 Apr 2005 R 3944 08 Apr 2005 R 3945 10 Apr 2005 B 10995 10 Apr 2005 B 10995 10 Apr 2005 R 3945 10 Apr 2005 R 3946 12 Apr 2005 B 10996 12 Apr 2005 B 10996 12 Apr 2005 R 3946 12 Apr 2005 R 3947 04 Apr 2005 B 10997 04 Apr 2005 B 10997 04 Apr 2005 R 3947 04 Apr 2005 R 3948 12 Apr 2005 B 10998 12 Apr 2005 B 10998 12 Apr 2005 R 3948 12 Apr 2005 R 394
6 Sollima et al. ��������������������������������������������������������������������������������������������������������������������������������������������������������������������������������������������������������������������������������������������������������������������������������������������������������������������������������������������������������������������������������������������������������������������������������������������������������������������������������������������������������������������
FIG. 1.— Map of the region sampled by the FORS1 observations. North is up, east on the right. The eight fields observed with FORS1 are shown. Grey boxesindicate the position of the ACS photometry by Ferraro et al.(2004). The cluster center is located in the central ACS field.

FORS1 observations of the double MS ofω Cen 7 ��������������������������������������������������������������������������������������������������������������������������������������������������������������������������������������������������������������������������������������������������������������������������������������������������������������������������������������������������������������������������������������������������������������������������������������������������������������������������������������������������������������������
FIG. 2.— R, B-R CMD for the global sample of∼70,000 stars measured inω Cen.

8 Sollima et al. ��������������������������������������������������������������������������������������������������������������������������������������������������������������������������������������������������������������������������������������������������������������������������������������������������������������������������������������������������������������������������������������������������������������������������������������������������������������������������������������������������������������������
FIG. 3.— The zoomed (R, B-R) CMD ofω Cen in the bMS region is shown in thele f t panel. The mean ridge line of the rMS population is overplotted to theCMD as a dashed line. The distribution of MS stars with respect to the reference mean ridge line is shown in themiddle panel. In theright panel the histogramsof the distances from the mean ridge line at different magnitude levels are shown.

FORS1 observations of the double MS ofω Cen 9 ��������������������������������������������������������������������������������������������������������������������������������������������������������������������������������������������������������������������������������������������������������������������������������������������������������������������������������������������������������������������������������������������������������������������������������������������������������������������������������������������������������������������
FIG. 4.— The (R, B-R) CMDs ofω Cen zoomed in the bMS region for each of the eight observed fields. The field numbers are the same of Fig. 1 .

10 Sollima et al. ��������������������������������������������������������������������������������������������������������������������������������������������������������������������������������������������������������������������������������������������������������������������������������������������������������������������������������������������������������������������������������������������������������������������������������������������������������������������������������������������������������������������
FIG. 5.— Selection boxes for the rMS and bMS population in the (∆x,R) plane (Middle panel of Fig. 3) .

FORS1 observations of the double MS ofω Cen 11 ��������������������������������������������������������������������������������������������������������������������������������������������������������������������������������������������������������������������������������������������������������������������������������������������������������������������������������������������������������������������������������������������������������������������������������������������������������������������������������������������������������������������
FIG. 6.— Cumulative radial distribution for the rMS stars (solid line) and bMS stars (dashed line) as a function of their projected distance from the clustercenter.

12 Sollima et al. ��������������������������������������������������������������������������������������������������������������������������������������������������������������������������������������������������������������������������������������������������������������������������������������������������������������������������������������������������������������������������������������������������������������������������������������������������������������������������������������������������������������������
FIG. 7.— Corrected ratio between the number of bMS and rMS stars at different distances from the cluster center.

FORS1 observations of the double MS ofω Cen 13 ��������������������������������������������������������������������������������������������������������������������������������������������������������������������������������������������������������������������������������������������������������������������������������������������������������������������������������������������������������������������������������������������������������������������������������������������������������������������������������������������������������������������
FIG. 8.— Distribution of MS stars with respect to the reference mean ridge line calculated in the magnitude range 19.4 < R < 20.8 for stars at distancer < 10′
(bottompanel), 10′ < r < 15′ (middle panel) andr > 15′ (top panel) from the cluster center.

14 Sollima et al. ��������������������������������������������������������������������������������������������������������������������������������������������������������������������������������������������������������������������������������������������������������������������������������������������������������������������������������������������������������������������������������������������������������������������������������������������������������������������������������������������������������������������
FIG. 9.— Isochrone fitting of the MS populations ofω Cen. Theoretical isochrones with appropriate metallicityand helium abundance ([Fe/H]=-1.6 ; Y=0.246:solid line, [Fe/H]=-1.3 ; Y=0.246:dotted line , Y=0.40: dashed line) are overplotted.
FORS1 observations of the double MS ofω Cen 15 ��������������������������������������������������������������������������������������������������������������������������������������������������������������������������������������������������������������������������������������������������������������������������������������������������������������������������������������������������������������������������������������������������������������������������������������������������������������������������������������������������������������������
FIG. 10.— Comparison between the observed (R, B-R) CMD ofω Cen (left panel) with a synthetic CMD (rightpanel). Black points simulate stars with[Fe/H]=-1.6 and Y=0.246, grey points simulate stars with [Fe/H]=-1.3 and Y=0.40 .