Extended Use of Dabigatran, Warfarin, or Placebo in Venous Thromboembolism
Decision-Theoretic Re�nement Planning in MedicalDecision Making: Management of Acute DeepVenous ThrombosisPeter Haddawy, Ph.D.AnHai Doan, M.S.Charles E. Kahn, Jr., M.D.Decision Systems and Arti�cial Intelligence Laboratory,Department of Electrical Engineering and Computer Science,University of Wisconsin - Milwaukee,Milwaukee, Wisconsin 53201 (all authors)Section of Information and Decision Sciences,Department of Radiology,Medical College of Wisconsin,Milwaukee, Wisconsin 53226 (PH, CEK)February 11, 1996To appear in Medical Decision Making.1
AbstractDecision-theoretic re�nement planning is a new technique for �nding optimal courses of ac-tion. The authors sought to determine whether this technique could identify optimal strate-gies for medical diagnosis and therapy. An existing model of acute deep venous thrombosisof the lower extremities was encoded for analysis by the drips decision-theoretic re�nementplanning system. The encoding represented 6,206 possible plans. The drips planner usedArti�cial Intelligence techniques to eliminate 5,150 plans (83%) from consideration withoutexamining them explicitly. drips identi�ed the �ve strategies that minimized cost and mor-tality. We conclude that decision-theoretic planning is useful for examining large medicaldecision problems.
2
IntroductionTo solve complex problems, decision analysts often must evaluate numerous potential strate-gies by constructing decision trees by hand. This manual process has several drawbacks.First, because constructing the trees is labor-intensive, analysts may limit the numberof strategies to be explored and incorrectly may exclude potentially useful strategies [1,2]. Second, decision trees for large problems may be complex, and manual construction ofcomplex decision trees is prone to error. Third, decision trees have a very low degree of mod-ularity, making them di�cult to alter. This is a serious drawback since models are typicallydeveloped in an iterative fashion.The decision-theoretic re�nement planning system (drips) automates the process of de-cision tree construction and evaluation. The system provides a modular representation anduses abstraction techniques to e�ciently explore a large number of possible strategies [3].It �nds the strategy or strategies that maximize the expected value of a user-de�ned utilityfunction or a set of outcome attributes. With these capabilities, drips provides a mechanismto identify optimal strategies involving diagnosis and treatment. To study the applicabilityof this technique to medical decision making, we applied drips to data from a publishedanalysis of management of acute lower-extremity deep venous thrombosis (DVT), in which24 strategies (out of a space of 6,206 possible strategies) were evaluated [4]. To evaluatethe e�ciency of the technique, we compared its performance on this problem to that of astandard branch-and-bound decision tree algorithm.In this article, we �rst describe the model of DVT that serves as a domain in which todemonstrate our technique. We then describe the drips planner, and provide details of theaction representation, the abstraction techniques, and the planning algorithm. We �nish bypresenting the results of the analysis of the DVT domain produced by drips and comparingthe performance of drips to conventional decision trees.Acute Deep Venous ThrombosisTo evaluate the applicability of drips to medical decision making, we constructed a modelfor diagnosis and treatment of acute deep venous thrombosis of the lower extremeties. Ap-propriate management of patients with suspected DVT remains an important and complexclinical problem. The clinical �ndings of DVT do not permit diagnosis with certainty [5,6]. Unchecked, lower-extremity DVT can progress to pulmonary embolism (PE), a condi-tion that entails signi�cant morbidity and mortality. Anticoagulation therapy for DVT isexpensive and carries the risk of severe hemorrhage. Even diagnostic procedures such asvenography entail risks such as contrast reaction and iatrogenic DVT. The objective of ap-plying decision analysis to this problem is to determine the optimal strategies for testing andtreating a patient suspected of having DVT.Our model was based on data from an article that compared 24 di�erent managementstrategies [4]. We chose this article because it contained explicit probability and cost data,and because we hoped to show the advantage of our technique over the manual construction3
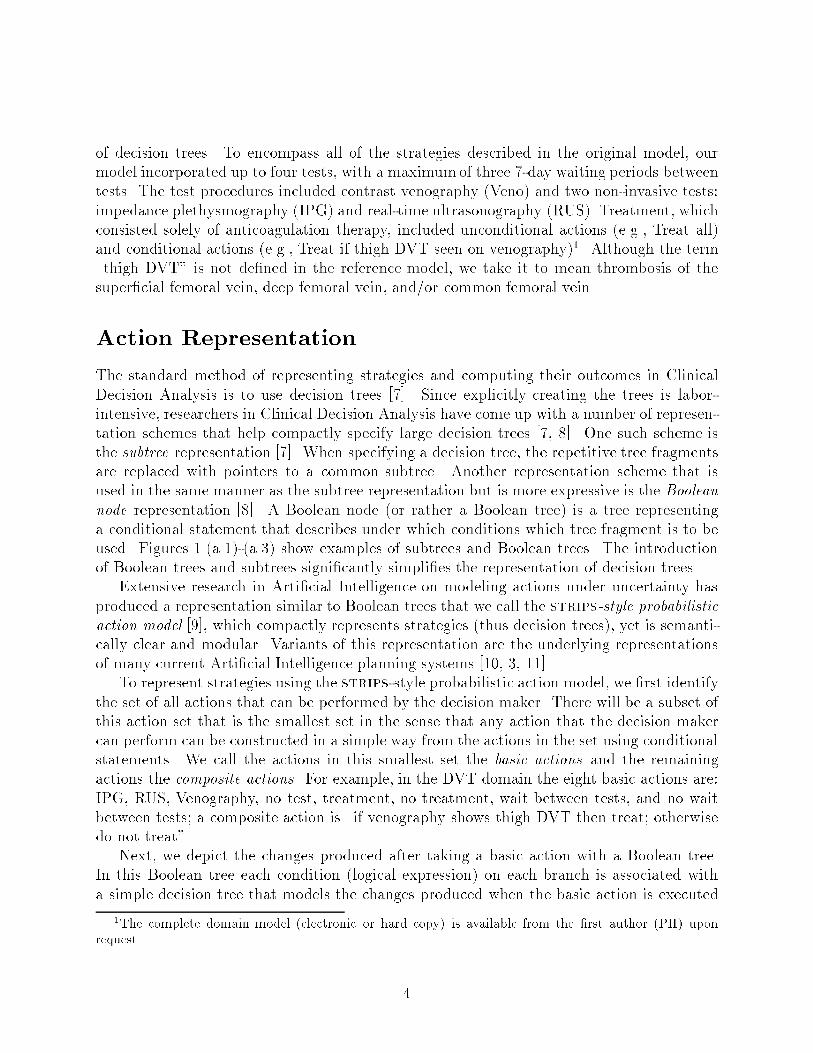
of decision trees. To encompass all of the strategies described in the original model, ourmodel incorporated up to four tests, with a maximumof three 7-day waiting periods betweentests. The test procedures included contrast venography (Veno) and two non-invasive tests:impedance plethysmography (IPG) and real-time ultrasonography (RUS). Treatment, whichconsisted solely of anticoagulation therapy, included unconditional actions (e.g., Treat all)and conditional actions (e.g., Treat if thigh DVT seen on venography)1. Although the term\thigh DVT" is not de�ned in the reference model, we take it to mean thrombosis of thesuper�cial femoral vein, deep femoral vein, and/or common femoral vein.Action RepresentationThe standard method of representing strategies and computing their outcomes in ClinicalDecision Analysis is to use decision trees [7]. Since explicitly creating the trees is labor-intensive, researchers in Clinical Decision Analysis have come up with a number of represen-tation schemes that help compactly specify large decision trees [7, 8]. One such scheme isthe subtree representation [7]. When specifying a decision tree, the repetitive tree fragmentsare replaced with pointers to a common subtree. Another representation scheme that isused in the same manner as the subtree representation but is more expressive is the Booleannode representation [8]. A Boolean node (or rather a Boolean tree) is a tree representinga conditional statement that describes under which conditions which tree fragment is to beused. Figures 1.(a.1)-(a.3) show examples of subtrees and Boolean trees. The introductionof Boolean trees and subtrees signi�cantly simpli�es the representation of decision trees.Extensive research in Arti�cial Intelligence on modeling actions under uncertainty hasproduced a representation similar to Boolean trees that we call the strips-style probabilisticaction model [9], which compactly represents strategies (thus decision trees), yet is semanti-cally clear and modular. Variants of this representation are the underlying representationsof many current Arti�cial Intelligence planning systems [10, 3, 11].To represent strategies using the strips-style probabilistic action model, we �rst identifythe set of all actions that can be performed by the decision maker. There will be a subset ofthis action set that is the smallest set in the sense that any action that the decision makercan perform can be constructed in a simple way from the actions in the set using conditionalstatements. We call the actions in this smallest set the basic actions and the remainingactions the composite actions. For example, in the DVT domain the eight basic actions are:IPG, RUS, Venography, no test, treatment, no treatment, wait between tests, and no waitbetween tests; a composite action is \if venography shows thigh DVT then treat; otherwisedo not treat".Next, we depict the changes produced after taking a basic action with a Boolean tree.In this Boolean tree each condition (logical expression) on each branch is associated witha simple decision tree that models the changes produced when the basic action is executed1The complete domain model (electronic or hard copy) is available from the �rst author (PH) uponrequest. 4
and the condition is true. Each simple decision tree is two levels deep, with a single chancenode as the root, and a number of branches stemming from this node and ending with leafnodes; each leaf node contains variable assignments specifying what happens after takingthe action. For example, Figure 1.b shows the Boolean tree of the basic action IPG2; thesimple decision tree associated with the �rst branch states that when IPG is performed andthigh DVT is present (thigh-dvt = 1), then with a chance of 0.95 the test result is positive(IPGResult := +) and cost is increased by $120 (cost := cost +120); with a chance of 0.05the test result is negative (IPGResult := �) and cost is increased by $120. The Boolean treeof RUS is identical to that of IPG but the test has higher speci�city and higher cost.We then construct Boolean trees that describe the composite actions using the Booleantrees of the basic actions. In the DVT domain, composite actions are used to describesituations where a certain basic action is performed only when certain conditions are true.For example, we might want to perform the action RUS only when IPGResult is negative.We can represent this with the composite action RUS if NIT- shown in Figure 1.c. Note thesimilarity between this Boolean tree and the Boolean tree in Figure 1.(a.2). Figure 1.d showsthe Boolean tree for Treat if NIT+, which represents the case where patients are treated ifat least one test result is positive. Note also the similarity between this Boolean tree andthe Boolean tree of Figure 1.(a.3). For the rest of the paper, the Boolean tree of a basic orcomposite action will be called its action description.Now we can represent a strategy with a sequence of (basic or composite) actions. Forexample, the strategy represented with the Boolean trees in Figures 1.(a.1)-(a.3) can berepresented by the sequence of actions IPG, RUS if NIT-, Treat if NIT+. We refer to asequence of actions representing a strategy as a plan. Evaluating a plan, i.e., computing theplan's outcomes, is the process of constructing the complete decision tree corresponding tothe plan and using the constructed tree to compute the outcomes.In summary, we model the set of possible actions among which the decision maker canchoose with a set of action descriptions, specifying the e�ects of each action. Each strategybeing considered is represented with a sequence of action descriptions and is called a plan.Computing the outcomes of a strategy amounts to using the descriptions of the actions inthe plan representing the strategy to construct a decision tree and using the constructed treeto compute the outcomes.Notice that the metholology we have outlined for creating the basic and composite ac-tion descriptions encourages modularity of description. The action descriptions are createdoutside the context of their use in any particular decision tree and are then composed insequence to create descriptions of decision trees representing the various possible strategies.2Action names are displayed in bold sanserif type when they refer to Boolean tree or drips actionrepresentations. 5
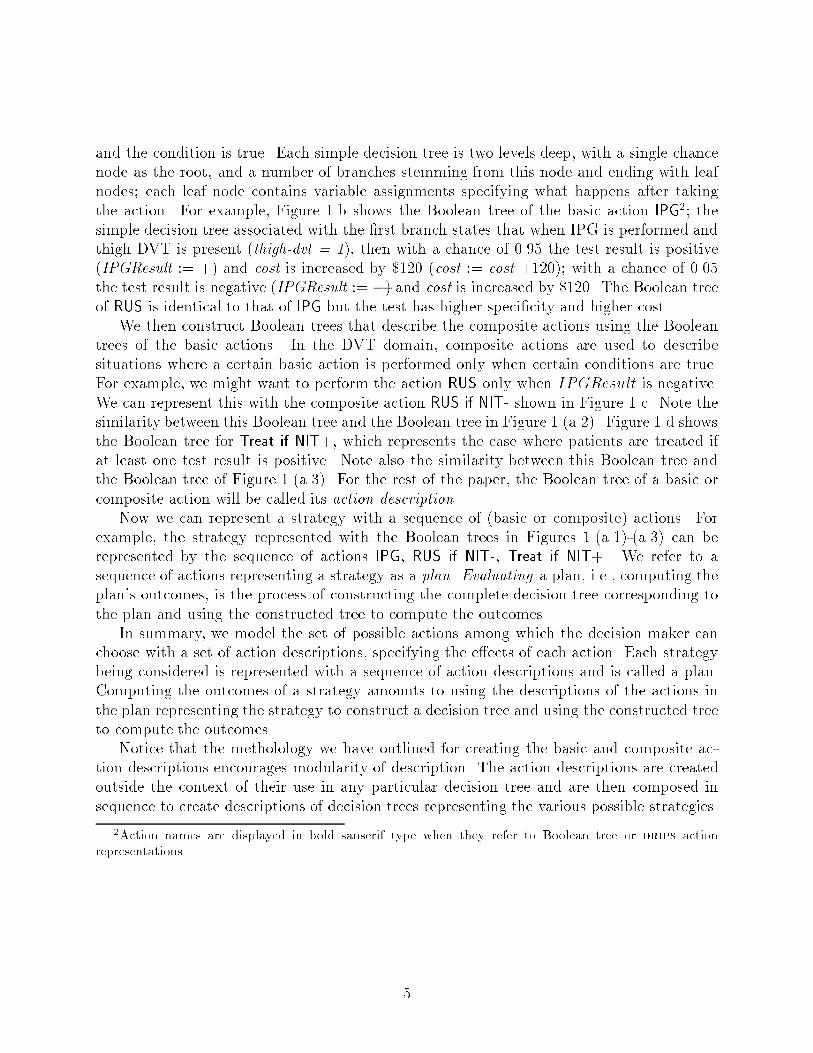
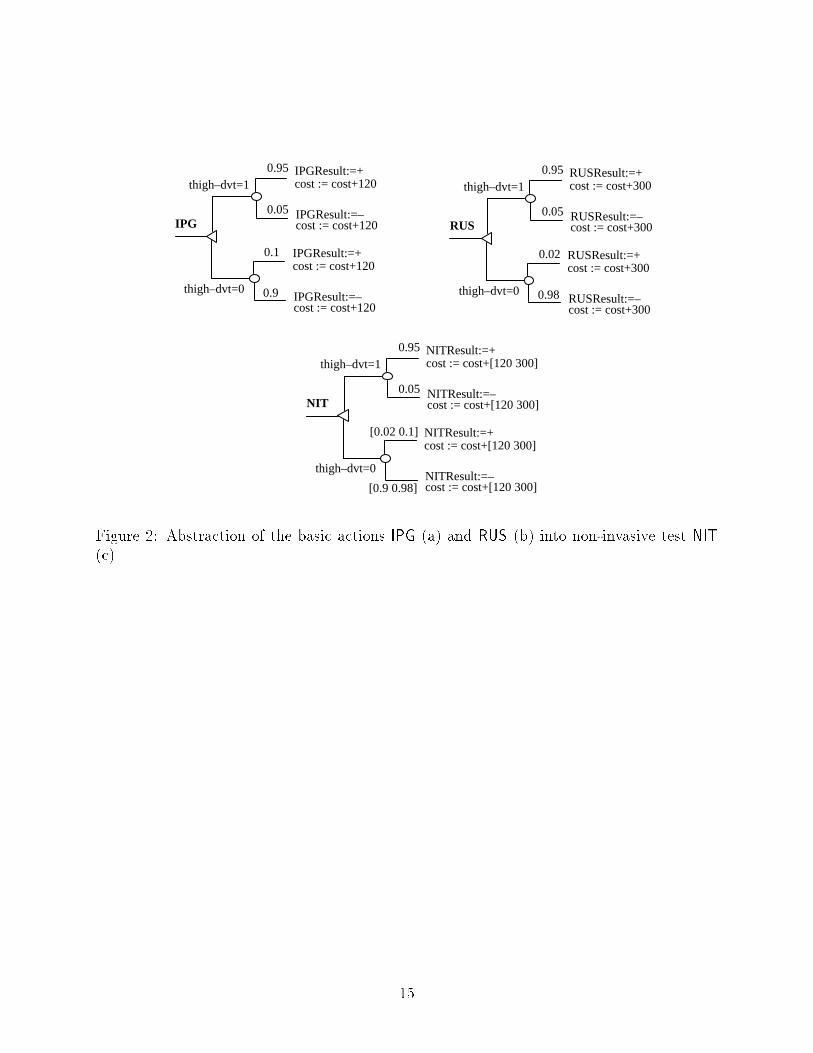
The drips PlannerIn the drips planner, a decision-theoretic planning problem is described in terms of a set ofaction descriptions, using the strips-style probabilistic action model, a set of prior proba-bilities, and one or more utility functions or outcome attributes. The drips system's goal isto �nd the optimal plan or set of plans.When using a single utility function, drips identi�es the plan that maximizes expectedutility. When using multiple utility functions or outcome attributes, drips identi�es the setof plans undominated with respect to the functions or attributes. In multi-attribute utilitytheory this set is called the e�cient frontier [12]. In all but the simplest of domains, analysis ofeach possible plan by exhaustive enumeration would be computationally prohibitive. dripsprovides a method for abstracting probabilistic actions; it can reason with these abstractionsin such a way that suboptimal classes of plans can be eliminated without explicitly examiningall plans in those classes.Action AbstractionThe drips planner uses a technique called inter-action abstraction [13] to search e�cientlythrough the space of possible plans. Inter-action abstraction groups together a set of anal-ogous actions and characterizes the set by the features common to all the actions. We thencan plan with the abstract action and infer properties of a plan involving any of its in-stances. Formally, an inter-action abstraction of a set of actions fa1; a2; :::ang is an actionthat represents the disjunction of the actions in the set. The actions in the set are called theinstantiations of the abstract action and are considered to be alternative ways of realizingthe abstract action.To create an inter-action abstraction of a set of action descriptions fa1; a2; :::ang we groupthe branches (or paths) of the action descriptions into disjoint sets such that each set containsat most one branch from each action description. For each set s that contains fewer thann branches, add n � jsj branches, each with the e�ect of one of the branches already inthe set and with condition False and probability zero. The e�ect of an abstract branch isany sentence entailed by each of the e�ects of the branches in the set. The condition is thedisjunction of the conditions on the branches in the set. The probability is speci�ed as arange: the minimum of the probabilities of the branches in the set and the maximum of theprobabilities of the branches in the set.In Figure 2 the action NIT (non-invasive test) is an abstraction of the actions IPG andRUS. The description of NIT is produced by grouping topologically corresponding branches.For example, the third branch of IPG is grouped with the third branch of RUS. The e�ectof the resulting abstract branch can be any expression that encompasses the e�ects of theabstracted branches. The two tests have the same e�ect on NITResult but di�erent costs,so the cost of the abstract e�ect is represented by a range that includes the two costs. Thetwo branches also di�er in the probabilities of the e�ects, so we must specify with whatprobability the abstract e�ect is realized. If IPG is chosen as the instantiation, it is realized6
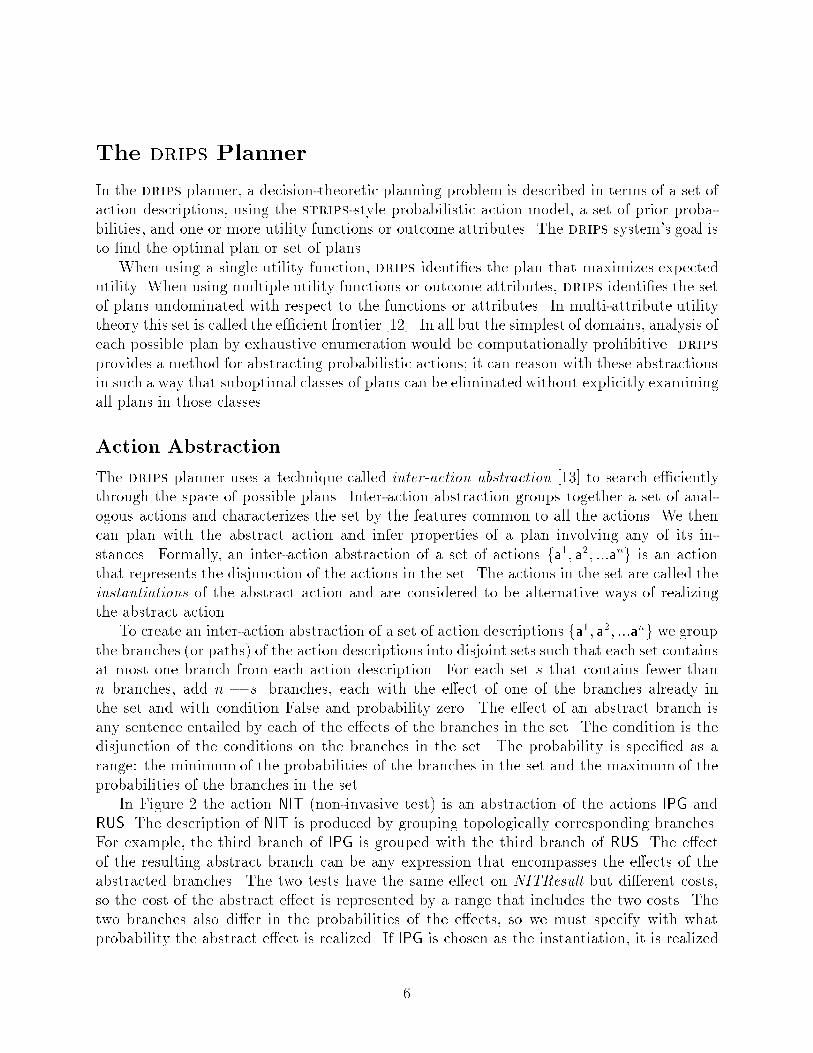
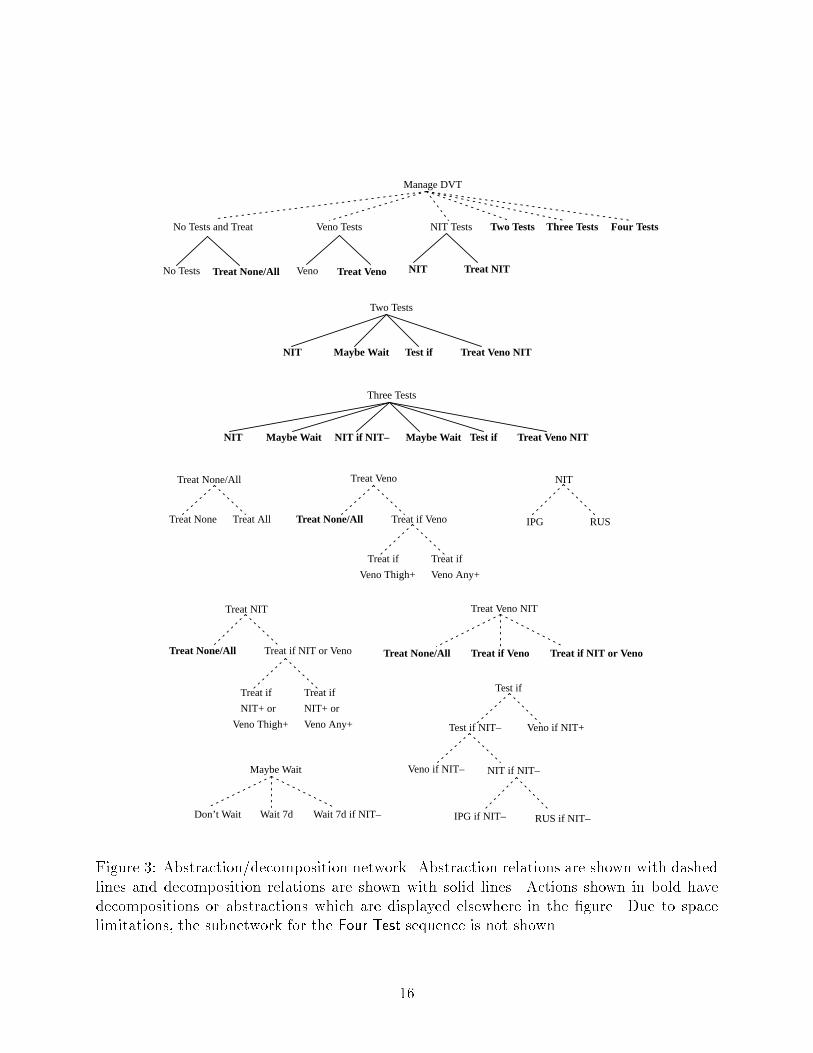
with probability .90 and if RUS is chosen it is realized with probability .98. Thus the e�ectis realized with a probability in the range [.90 .98]. For these two actions the conditions onthe grouped branches are identical, so the abstract branch is labeled with that condition. Ingeneral, grouped branches need not have the same condition.The construction of abstract actions takes some e�ort on the part of the user. Ratherthan specifying tight abstractions of actions, the user is free to specify trivial abstractions.But the presence of informative abstractions, such as NIT, greatly improves the e�ciencyof the planner. We have developed tools to facilitate the speci�cation of basic actions andthe construction of abstract actions. An action description editor provides action templatesthat are easily �lled in by the user. It provides syntax checking of the completed action de-scriptions and some consistency checking, e.g. to ensure that probabilities sum to one. Twoabstraction tools partially automate the process of creating abstract actions [14]. An inter-action abstraction tool generates abstract action descriptions given a speci�cation of whichactions to combine and how to group their branches. A composition tool generates a decom-posable action given a sequence of actions to compose [15]. The abstraction tools virtuallyeliminate the possibility of introducing errors in the process of constructing abstractions,since abstracting actions in the ways permitted by the tools is always correct.The Abstraction/Decomposition Networkdrips searches through a space of plans structured into an abstraction/decomposition net-work. An abstract action has one or more sub-actions, which themselves may be abstractionsor basic actions. A decomposable action has one or more sub-plans that all must be executedin sequence. The network for the DVT domain is shown in Figure 3.The most abstract action, Manage DVT, is an abstraction of six actions: No Tests andTreat, Veno Tests, NIT Tests, Two Tests, Three Tests, Four Tests. The number of testsrepresents the length of the longest allowed sequence of tests. Each of these actions furtherdecomposes into a sequence of actions. For example, NIT Tests decomposes into NIT, TreatNIT. We assume, as in the original model, that no testing will be performed after the decisionto treat is made. NIT can be instantiated as IPG or RUS. Our model for managementof suspected DVT encompassed 6,206 concrete plans; for example, one complete plan (aninstance of the Two Tests action) is \IPG, Wait 7d if NIT-, Veno if NIT-, Treat if NIT+ orVeno Thigh+," which means perform IPG, if the IPG is negative wait seven days and thenperform venography, treat if IPG or venography shows thigh DVT.The drips Algorithmdrips �nds optimal plans by building abstract plans, comparing them, and re�ning onlythose that might yield optimal plans. Unlike \generative" planning schemes that buildplans by adding actions [10, 11], drips performs \re�nement" planning. It begins with aset of abstract plans, and subsequently re�nes the plans from more general to more speci�c.Since evaluating abstract plans results in inferring probability intervals and attribute ranges,7

evaluating plans with respect to a single utility function assigns an expected utility intervalto the abstract plan, which includes the expected utilities of all possible instances of thatabstract plan. An abstract plan can be eliminated if the upper bound of its expected utilityinterval is lower than the lower bound of the expected utility interval for another plan. Inthe case of multiple utility functions, this property must apply to all pairs of utility intervals.Eliminating an abstract plan amounts to eliminating all its possible instances. When theplanner has some abstract plans with overlapping expected utility intervals, it re�nes theplans by instantiating some of their actions. This causes the expected utility intervals tonarrow. If some of the new intervals do not overlap, more plans can be eliminated and theplanner can then re�ne those remaining one step further.Given an abstraction/decomposition network, drips evaluates plans at the abstract level,eliminates suboptimal plans, and re�nes remaining candidate plans further until only optimalplans remain. The algorithm works as follows.1. Create a plan consisting of the single top-level action and put it into the set plans.2. Until there is no abstract plan left in plans,� Choose an abstract plan P. Re�ne P by replacing an abstract action in P with allits instantiations, yielding a set of subplans fP1;P2; :::;Png. For each instantiationthat has a decomposition, replace it with the sequence of actions into which itcan be decomposed.� Compute the expected utility of all the subplans.� Remove P from plans and add fP1;P2; :::;Png.� Eliminate suboptimal plans in plans.3. Return plans as the set of optimal plans.Since drips only eliminates plans that it can prove are suboptimal and if run to completionit explores the entire space of possible plans, it is guaranteed to �nd the optimal plans.Analysis of the DVT DomainWe encoded the DVT domain using data published by Hillner et al. [4]. The prior proba-bilities, as well as the probabilistic e�ects of all the basic actions are shown in Tables 1 and2. The abstraction/decomposition network representing a space of 6,206 possible strategiesis shown in Figure 3.Rather than using a single utility function, we evaluated plans according to two factors:the number of deaths per 1000 patients and the average cost per patient, as in the referencestudy. The cost was de�ned as the sum of the costs of tests and treatment and the costsassociated with the state of the patient at the end of the plan. The cost values used areshown in Table 3. 8
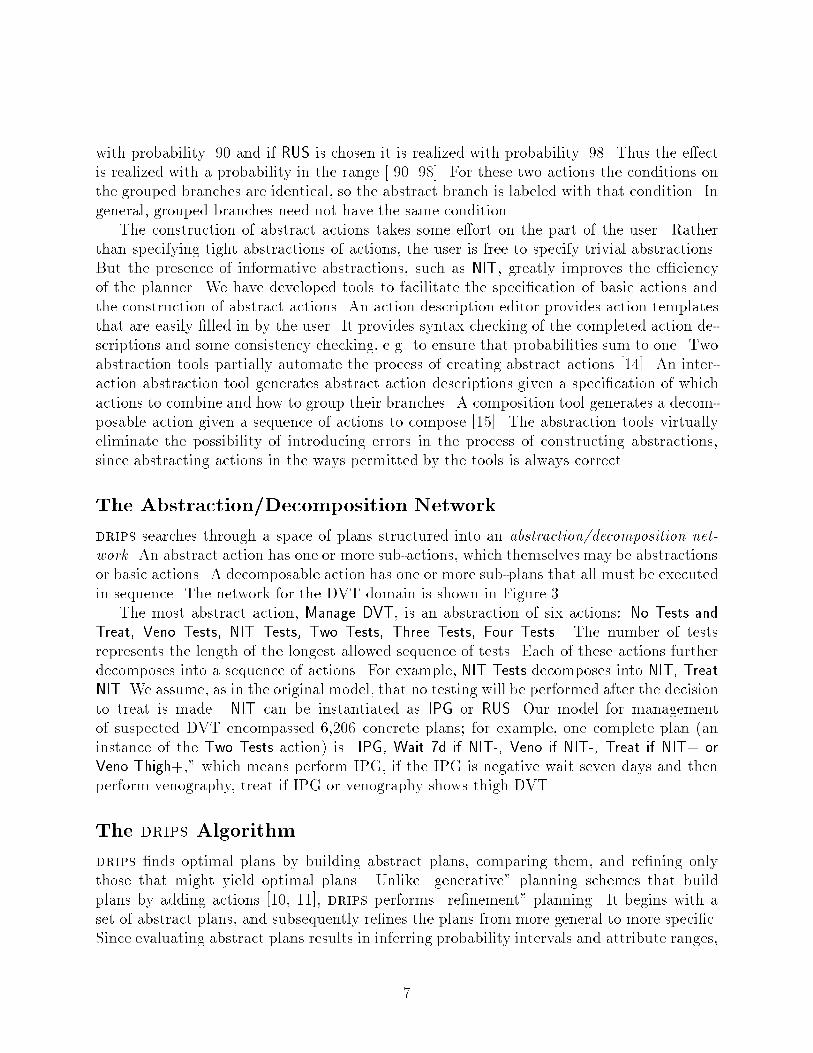
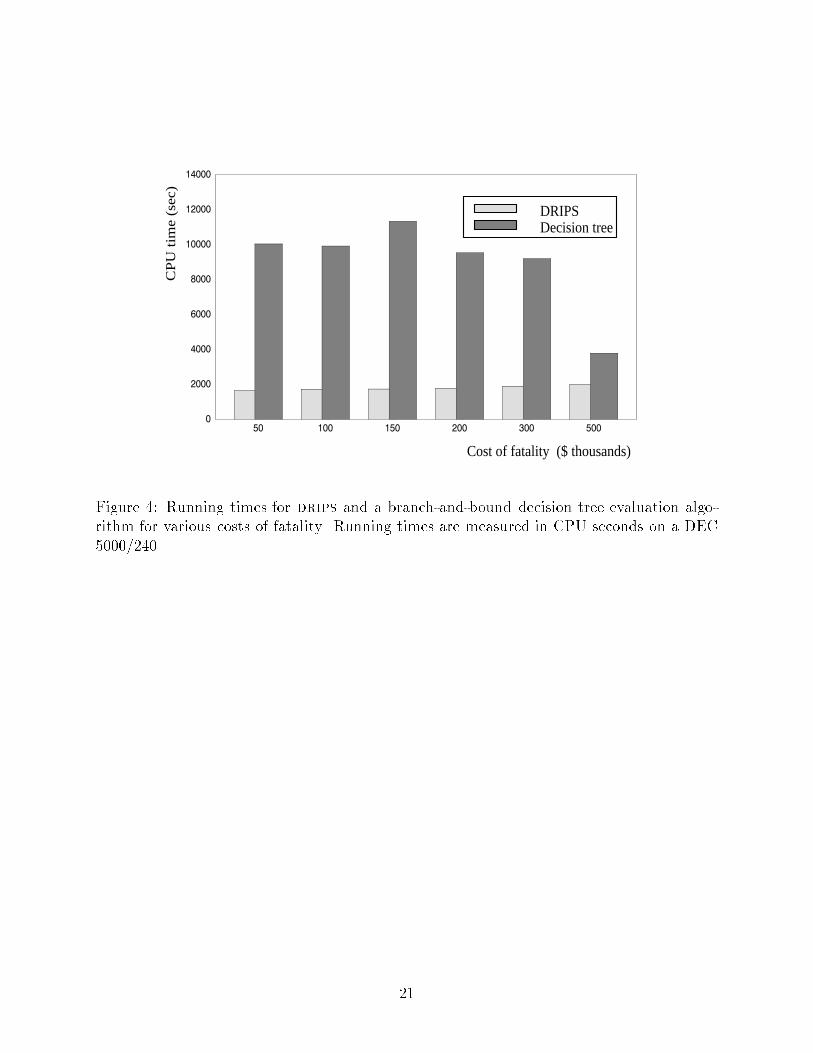
Given this problem description, drips enumerated the e�cient frontier by eliminatingall plans that were dominated by some other plan along both evaluation factors. For thebaseline case where cost of fatality was set at $30,000, the probability of thigh DVT at 0.3and the probability of calf DVT at 0.1, drips enumerated the e�cient frontier consisting of5 plans after evaluating less than 1000 plans, yielding a pruning rate of 83%. The plans inthe e�cient frontier are shown in Table 4, listed in order of decreasing total deaths per 1000patients.The results of our analysis di�ered signi�cantly from those of Hillner et al. First, ouranalysis determined a lower average cost per patient than the cost shown for all strategies inthe reference study. Analysis demonstrated that rather than showing calf DVT progressingto PE through thigh DVT, as de�ned in their model, the reference study implicitly modeledcalf DVT leading directly to PE with probability 0.5 [16]. Second, two of the strategiesconsidered to be among the best clinical strategies by the reference study did not appearin our e�cient frontier. Both of these strategies involved waiting between tests. Third,our e�cient frontier contained �ve strategies, while the reference study only lists three beststrategies. For example, the reference study did not consider such cost-e�ective strategiesas \perform IPG, don't wait, perform venography if IPG was negative, treat if venographyshowed thigh DVT." This can be accounted for by the fact that the drips system exploredmore than 6,000 strategies, while the reference study only examined 24 strategies consideredto be of clinical interest. Thus it may be advantageous to use an automated planner to siftthrough a large set of possible strategies rather than to use clinical judgment to select asmall subset to analyze. The drips methodology provides the computational e�ciency tomake this feasible.Analysis of Computational E�ciencySince one of the primary goals in developing the drips planner was to exploit the techniqueof abstraction to gain computational e�ciency, it is important to quantitatively evaluatethe e�ectiveness of the approach. Theoretical analysis shows that with an appropriate ab-straction hierarchy, the runtime complexity of drips is exponentially better than that ofexhaustive enumeration [3]. While this indicates great potential bene�t, it does not providea good indication of how e�ective the system will be in practice nor of how it compareswith standard approaches. To provide such a measure, we used both drips and a branch-and-bound decision tree evaluation algorithm to �nd the strategy with lowest average costper patient over a range of cost functions. We built software that used the basic actiondescriptions to generate a decision tree representing all possible plans and evaluated it usingbranch-and-bound techniques [17] to �nd the optimal plan. Both drips and the decision-treealgorithm were implemented in the CommonLisp programming language and analyses wererun on the same machine.Figure 4 shows the running time for drips and for the decision tree branch-and-boundalgorithm at values of cost of fatality ranging from $50,000 to $500,000. drips outperformedthe branch-and-bound algorithm at all values. In the most extreme case, the running time9
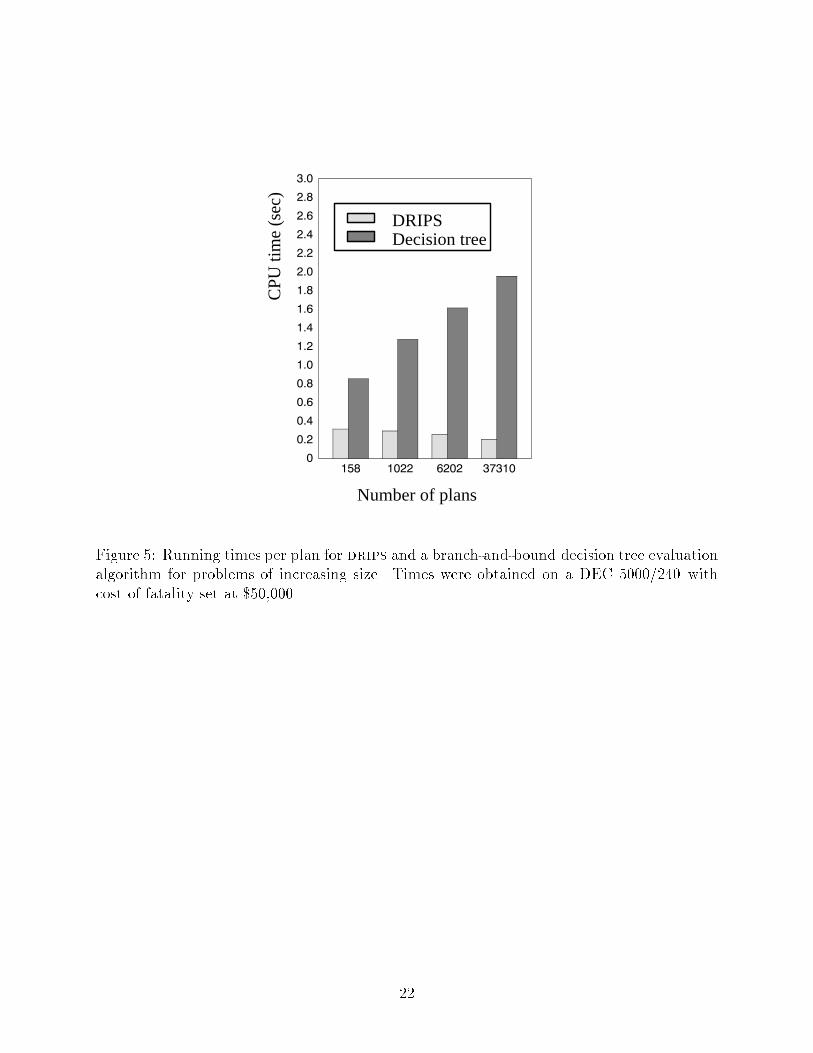
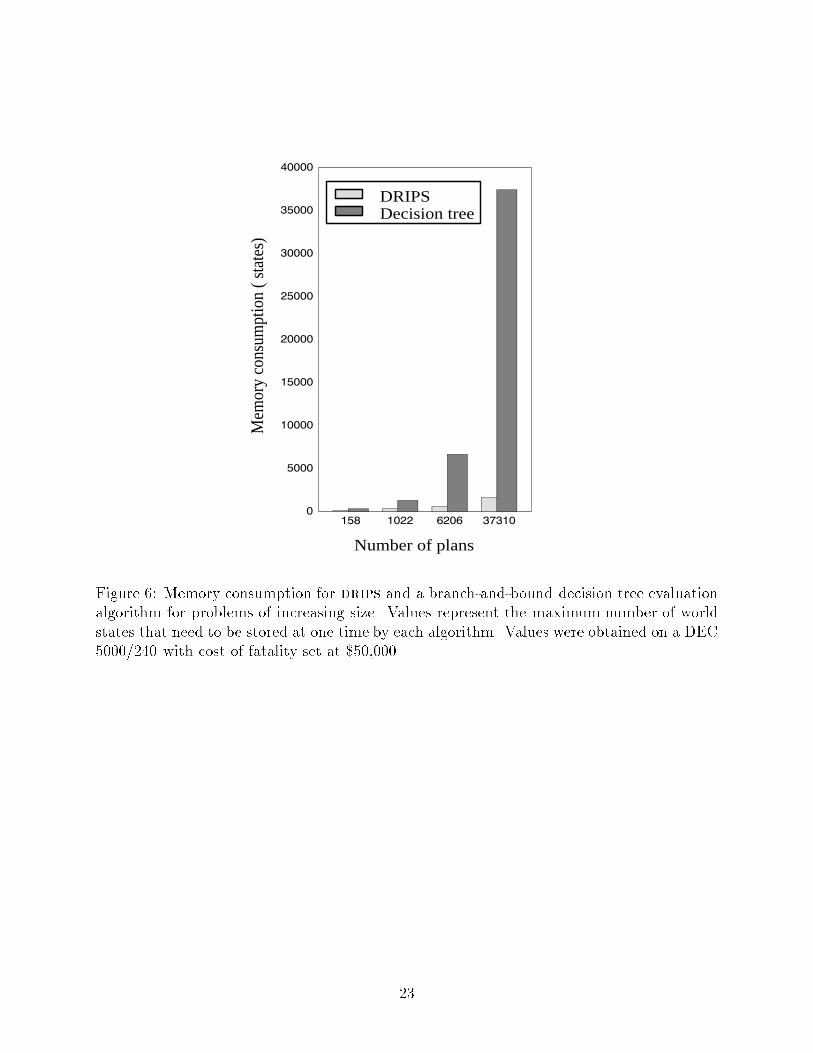
of drips was only 15% that of the branch-and-bound algorithm. While the running timefor drips varied little as the cost of fatality was changed, the running time for the branch-and-bound algorithm was highly sensitive to the cost of fatality and decreased considerablyat a cost of fatality of $500,000. This is due to the fact that at that cost, plans that have asigni�cant probability of fatality look su�ciently bad to be pruned away early.To examine how the e�ciency of the two approaches varies as a function of problemsize, we applied each approach to four versions of the DVT domain of increasing size. The�rst contained only plans including at most one test, for a total of 158 plans; the secondcontained plans with zero, one, or two tests, for a total of 1022 plans; the third domainwas the one on which we reported above; and the fourth domain contained plans with upto �ve tests, for a total of 37,310 plans. Figure 5 shows the running times per plan fordrips and the branch-and-bound algorithm for each of the domains. The running time perplan for the branch-and-bound algorithm increases markedly (from .86 seconds per plan to1.96 seconds per plan) as a function of problem size while the running time per plan fordrips actually decreases (from .32 seconds per plan to .21 seconds per plan). This meansthat the overall running time for drips increases more slowly than the domain size increasesand the overall running time for the branch-and-bound algorithm increases more rapidly.Thus, drips becomes even more e�cient than the branch-and-bound algorithm as the sizeof the domain increases. The memory usage of drips also compares favorably to that ofthe branch-and-bound algorithm over this same suite of problems (Figure 6). In the mostextreme case, drips uses only 4.4% as much memory as the branch-and-bound algorithm.DiscussionDecision-theoretic re�nement planning, as embodied in the drips planning system, may bevery useful for a wide variety of medical problems. The current investigation has shown itsapplicability to problems of policy development, but the planner also could be applied to themanagement of individual patients. Strengths of this approach include the modularity of theaction representation, and the ability to e�ciently explore a large set of possible strategies.While the results of the empirical comparison of the performance of drips against that ofthe branch-and-bound algorithm are not conclusive, they suggest that drips can providebetter performance in domains where good abstractions are available. Conclusive resultsawait further emiprical testing on a variety of problems.Wellman's SUDO-PLANNER system [18] uses decision-theoretic principles to eliminateclasses of suboptimal plans in domains characterized by partially satis�able goals and actionswith uncertain e�ects. It eliminates only those classes of plans which it can prove aredominated without resorting to reasoning about tradeo�s. Planning knowledge is representedin the form of qualitative probabilistic networks, which encode qualitative constraints on thejoint probability distribution over a set of variables, as well as the qualitative relation of thosevariables to a value node. SUDO-PLANNER does not produce plans but rather provides aset of constraints that the optimal plan must satisfy. Other recent work on decision-theoreticplanning has included the probabilistic least-commitment planner of Kushmeric, et.al. [11]10
and several Markov process based planners [19, 20, 21, 22].Uckun's spin system [23] uses abstraction/decomposition networks for protocol-basedtreatment planning, plan execution, and execution monitoring. The hierarchical representa-tion of plans is used for controlling execution. Although the hierarchy encodes alternativeplans, Uckun does not show how choices are made when alternatives exist. The spin systemdoes not include decision-theoretic measures of uncertainty or plan quality.The use of drips o�ers several practical advantages. drips allows the model builder toprovide \modules" of information: the description of each action can be highly compart-mentalized. One can easily alter a model's underlying assumptions to evaluate the e�ects onthe outcome; in this way, drips can perform sensitivity analysis of the model. Additionaltesting and treatment actions can be added easily to drips planning models. Furthermore,applying drips to a decision problem does not require the user to limit analysis to a smallset of possible strategies. We view decision-theoretic re�nement planning as a technique ofwide applicability to medical decision making.The e�ciency of our approach depends largely on how domain regularities are exploited tobuild the abstraction hierarchy. The applicability and the performance of the planner wouldbe improved if methods could be devised to automatically construct e�ective abstractionhierarchies that minimize information loss due to abstraction. Devising such procedures hasbeen shown to be possible for a limited class of domains [21]. In more complex domains withmore expressive utility functions it is much harder to de�ne procedures to automaticallygenerate good abstraction hierarchies. We are currently working on this problem.Other issues we are addressing include improving system performance and expandingthe class of problems the system can address. The current drips software is written in theCommon Lisp programming language3, and due to its developmental nature, has not beenoptimized for run-time e�ciency. The drips system's algorithms are well suited for parallelprocessing, and can be adapted easily to run e�ciently on a local- or wide-area network ofgeneral-purpose workstation computers. The drips algorithm can currently solve planningproblems involving discrete decisions but many decision problems involve choosing levels ofcontinuous quantities as well, e.g. the quantity of a drug to administer. We are extendingthe action representation and algorithm to handle such continuous decision variables.AcknowledgmentsPresented in part at the 16th annual meeting of the Society for Medical Decision Making,October 18, 1994. We thank Maureen Good Finigan for helping run the analyses of thedomain model. The authors acknowledge support from National Science Foundation grants#IRI-9207262 and #IRI-9509165 (PH) and from the 1993 American Roentgen Ray Soci-ety Scholarship (CEK). This work was facilitated by a grant from the National Libraryof Medicine (USPHS G08 LM05705) to the Medical College of Wisconsin for IntegratedAdvanced Information Management Systems (IAIMS) planning.3The software is available via www at http://www.cs.uwm.edu/faculty/haddawy.11

References[1] Tversky A, Kahneman D. Judgement under uncertainty: Heuristics and biases. Science,185:1124{1131, 1974.[2] Kahneman D, Slovic P, Tversky A (eds). Judgement under Uncertainty: Heuristics andBiases. Cambridge Univ. Press, Cambridge, 1982.[3] Haddawy P, Suwandi M. Decision-theoretic re�nement planning using inheritance ab-straction. In Proceedings, Second International Conference on AI Planning Systems,pages 266{271, June 1994.[4] Hillner BE, Philbrick JT, Becker DM. Optimal management of suspected lower-extremity deep vein thrombosis: an evaluation with cost assessment of 24 managementstrategies. Arch Intern Med, 152:165{175, 1992.[5] Landefeld S, McGuire E, Cohen AM. Clinical �ndings associated with acute proximaldeep vein thrombosis: a basis for qualifying clinical judgment. Am J Med, 88:382{388,1990.[6] Weinmann EE, Salzman EW. Deep-vein thrombosis. N Engl J Med, 331:1630{1641,1994.[7] Pauker SG, Kassirer JP. Decision analysis. New Engl J Med, 316:250{258, 1987.[8] Lau J, Kassirer JP, Pauker SG. Decision maker 3.0. Med Decis Making, 3:39{43, 1983.[9] Hanks S. Projecting Plans for Uncertain Worlds. PhD thesis, Yale University, January1990.[10] Goldman RP, Boddy MS. Epsilon-safe planning. In Proceedings of the Tenth Conferenceon Uncertainty in Arti�cial Intelligence, pages 253{261, Seattle, July 1994.[11] Kushmerick N, Hanks S, Weld D. An algorithm for probabilistic least-commitmentplanning. In Proceedings of the Twelfth National Conference on Arti�cial Intelligence,pages 1073{1078, Seattle, 1994.[12] Keeney RL, Rai�a H. Decisions with Multiple Objectives: Preferences and Value Trade-o�s. Wiley, New York, 1976.[13] Haddawy P, Doan AH. Abstracting probabilistic actions. In Proceedings of the TenthConference on Uncertainty in Arti�cial Intelligence, pages 270{277, Seattle, July 1994.[14] Finigan MG. Knowledge acquisition for decision-theoretic planning. In ProceedingsMAICSS'95, pages 98{102, Carbondale, IL, April 1995.12
[15] Doan A, Haddawy P. Generating macro operators for decision-theoretic planning. InWorking Notes of the AAAI Spring Symposium on Extending Theories of Action, pages68{73, Stanford, March 1995.[16] Kahn CE Jr, Haddawy P. Management of suspected lower-extremitydeep venous throm-bosis (letter). Archives of Internal Medicine, 155:426, February 1995.[17] Lawler EL, Wood DE. Branch-and-bound methods: A survey. Operations Research,14:699{719, 1966.[18] Wellman MP. Formulation of Tradeo�s in Planning Under Uncertainty. Pitman, Lon-don,UK, 1990.[19] Drummond M, Bresina J. Anytime synthetic projection: Maximizing the probabilityof goal satisfaction. In Proceedings of the Eighth National Conference on Arti�cialIntelligence, pages 138{144, Boston, MA, July 1990.[20] Dean T, Kaelbling LP, Kirman J, Nicholson A. Planning with deadlines in stochasticdomains. In Proceedings of the Eleventh National Conference on Arti�cial Intelligence,pages 574{579, July 1993.[21] Boutilier C, Dearden R. Using abstractions for decision-theoretic planning with timeconstraints. In Proceedings of the Twelfth National Conference on Arti�cial Intelligence,pages 1016{1022, Seattle, July 1994.[22] Cassandra AR, Kaelbling LP, Littman ML. Acting optimally in partially observablestochastic domains. In Proceedings of the Twelfth National Conference on Arti�cialIntelligence, pages 1023{1028, Seattle, July 1994.[23] Uckun S. Instantiating and monitoring treatment protocols. In Proceedings of theEighteenth Annual Symposium on Computer Applications in Medical Care (SCAMC94),pages 689{693, November 1994.13

IPG
thigh–dvt=1
thigh–dvt=0
IPGResult=+
IPGResult=–RUS
RUSResult=+
RUSResult=–
(thigh–dvt=1) &bleeding=0
bleeding=1
PE=1
bleeding=0
bleeding=1
PE=0
bleeding=0
bleeding=1
(a.1) Boolean tree for IPG (a.2) Boolean tree for the case where RUS is performed only when pre-vious IPG test returns negative result
(a.3) Boolean tree for the case wheretreatment is performed only when atleast one test result is positive
IPGResult=+
IPGResult=–
(NITResult=+)
(thigh–dvt=0) &
(NITResult=+)
(NITResult=–)
IPG
thigh–dvt=1
thigh–dvt=0
IPGResult:=+
IPGResult:=–
cost := cost+120
cost := cost+120
IPGResult:=+
IPGResult:=–
cost := cost+120
cost := cost+120
0.95
0.05
0.1
0.9
RUSResult:=+
RUSResult:=–
cost := cost+300
cost := cost+300
RUSResult:=+
RUSResult:=–
cost := cost+300
cost := cost+300
0.95
0.05
0.02
0.98
(NITResult=–)
(NITResult=–)
(NITResult=+)
RUS–if–NIT–
(b) (c)
bleeding:=0PE:=0
(NITResult=+)
(NITResult=+)
(NITResult=–)
0.81
cost:=cost+5000bleeding:=1PE:=0
cost:=cost+5000
0.09
bleeding:=0PE:=1cost:=cost+5000
bleeding:=1PE:=1cost:=cost+5000
0.09
0.01
0.9
0.1
bleeding:=0cost:=cost+5000
bleeding:=1cost:=cost+5000
Treat–if–NIT+
(d)
(thigh–dvt=1) &
(thigh–dvt=0) &
(thigh–dvt=1) &
(thigh–dvt=0) &Figure 1: (a) A decision tree represented as a sequence of three Boolean trees. The Booleantree shown in part (a.1) is also a subtree. NIT is shorthand for \noninvasive tests" andan expression such as NITResult = + is shorthand for the expression (IPGResult = +) or(RUSResult = +). The symbol < is used to indicate the switch of a Boolean node. Thesymbol g indicates all branches to which a subtree must be appended in order to create thecomplete decision tree. (b)-(d) Samples of action descriptions. The notation \cost := cost+ x" indicates that the variable cost is incremented by x dollars.14
IPG
thigh–dvt=1
thigh–dvt=0
IPGResult:=+
IPGResult:=–
cost := cost+120
cost := cost+120
IPGResult:=+
IPGResult:=–
cost := cost+120
cost := cost+120
0.95
0.05
0.1
0.9
RUS
thigh–dvt=1
thigh–dvt=0
RUSResult:=+
RUSResult:=–
cost := cost+300
cost := cost+300
RUSResult:=+
RUSResult:=–
cost := cost+300
cost := cost+300
0.95
0.05
0.02
0.98
NIT
thigh–dvt=1
thigh–dvt=0
NITResult:=+
NITResult:=–
cost := cost+[120 300]
cost := cost+[120 300]
NITResult:=+
NITResult:=–
cost := cost+[120 300]
cost := cost+[120 300]
0.95
0.05
[0.02 0.1]
[0.9 0.98]Figure 2: Abstraction of the basic actions IPG (a) and RUS (b) into non-invasive test NIT(c).
15
Manage DVT
No Tests and Treat Veno Tests NIT Tests Two Tests Three Tests Four Tests
Veno Treat Veno NIT Treat NITNo Tests Treat None/All
Two Tests
NIT Maybe Wait Test if Treat Veno NIT
Three Tests
NIT Maybe Wait NIT if NIT– Maybe Wait Test if Treat Veno NIT
NIT
IPG RUS
Maybe Wait
Don’t Wait Wait 7d Wait 7d if NIT–
Veno if NIT– NIT if NIT–
IPG if NIT– RUS if NIT–
Test if
Test if NIT– Veno if NIT+
Treat Veno
Treat None/All Treat if Veno
Treat NIT
Treat None/All Treat if NIT or Veno
Treat if
Veno Thigh+
Treat if
Veno Any+
Treat if
NIT+ or
Veno Thigh+
Treat if
NIT+ or
Veno Any+
Treat Veno NIT
Treat None/All Treat if Veno Treat if NIT or Veno
Treat None/All
Treat None Treat All
Figure 3: Abstraction/decomposition network. Abstraction relations are shown with dashedlines and decomposition relations are shown with solid lines. Actions shown in bold havedecompositions or abstractions which are displayed elsewhere in the �gure. Due to spacelimitations, the subnetwork for the Four Test sequence is not shown.16
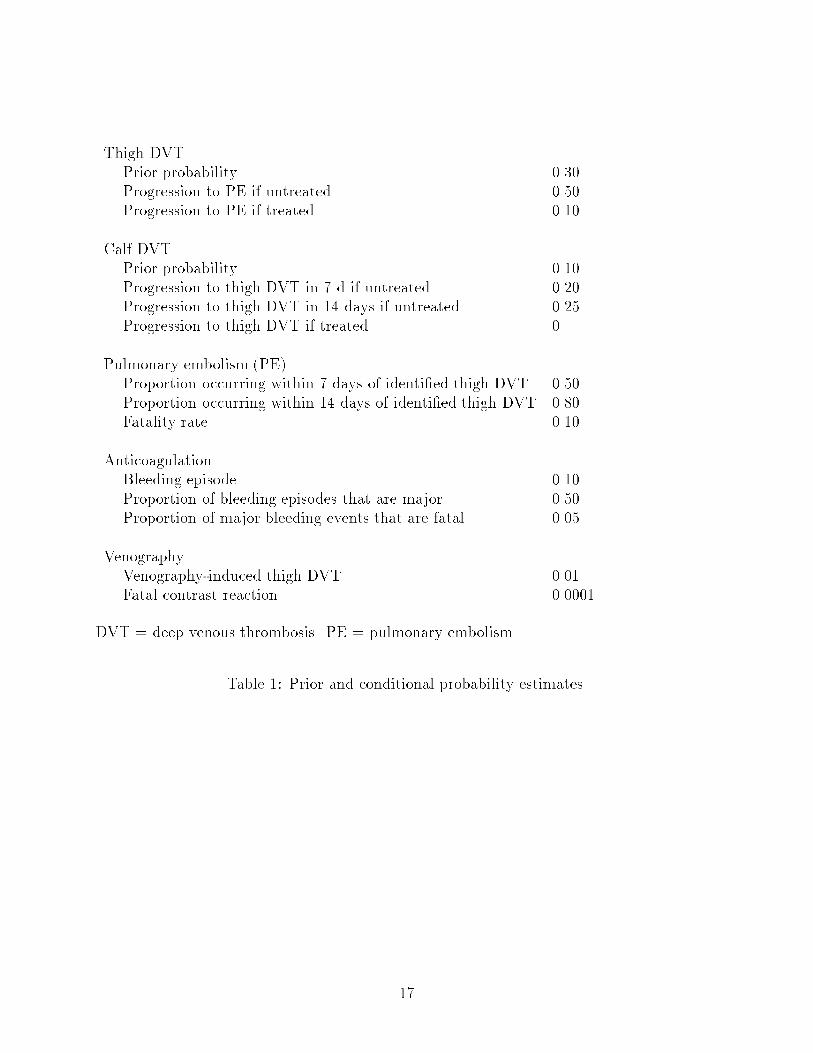
Thigh DVTPrior probability 0.30Progression to PE if untreated 0.50Progression to PE if treated 0.10Calf DVTPrior probability 0.10Progression to thigh DVT in 7 d if untreated 0.20Progression to thigh DVT in 14 days if untreated 0.25Progression to thigh DVT if treated 0Pulmonary embolism (PE)Proportion occurring within 7 days of identi�ed thigh DVT 0.50Proportion occurring within 14 days of identi�ed thigh DVT 0.80Fatality rate 0.10AnticoagulationBleeding episode 0.10Proportion of bleeding episodes that are major 0.50Proportion of major bleeding events that are fatal 0.05VenographyVenography-induced thigh DVT 0.01Fatal contrast reaction 0.0001DVT = deep venous thrombosis. PE = pulmonary embolism.Table 1: Prior and conditional probability estimates.17
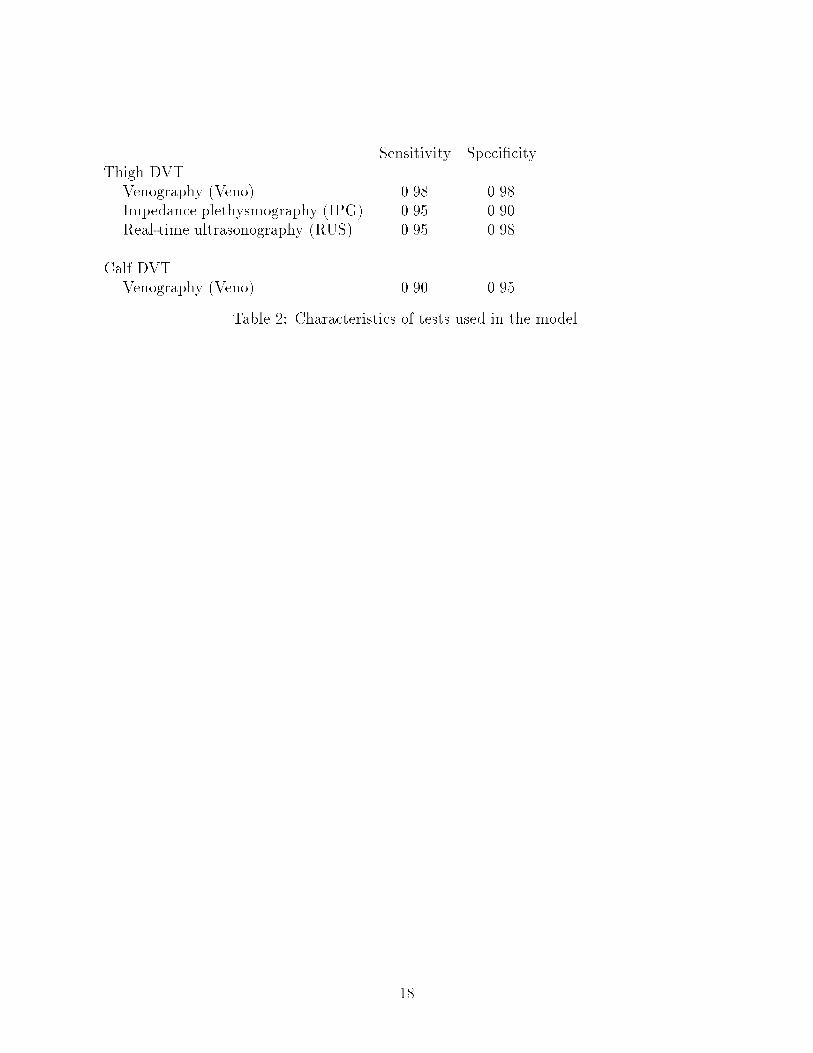
Sensitivity Speci�cityThigh DVTVenography (Veno) 0.98 0.98Impedance plethysmography (IPG) 0.95 0.90Real-time ultrasonography (RUS) 0.95 0.98Calf DVTVenography (Veno) 0.90 0.95Table 2: Characteristics of tests used in the model.
18
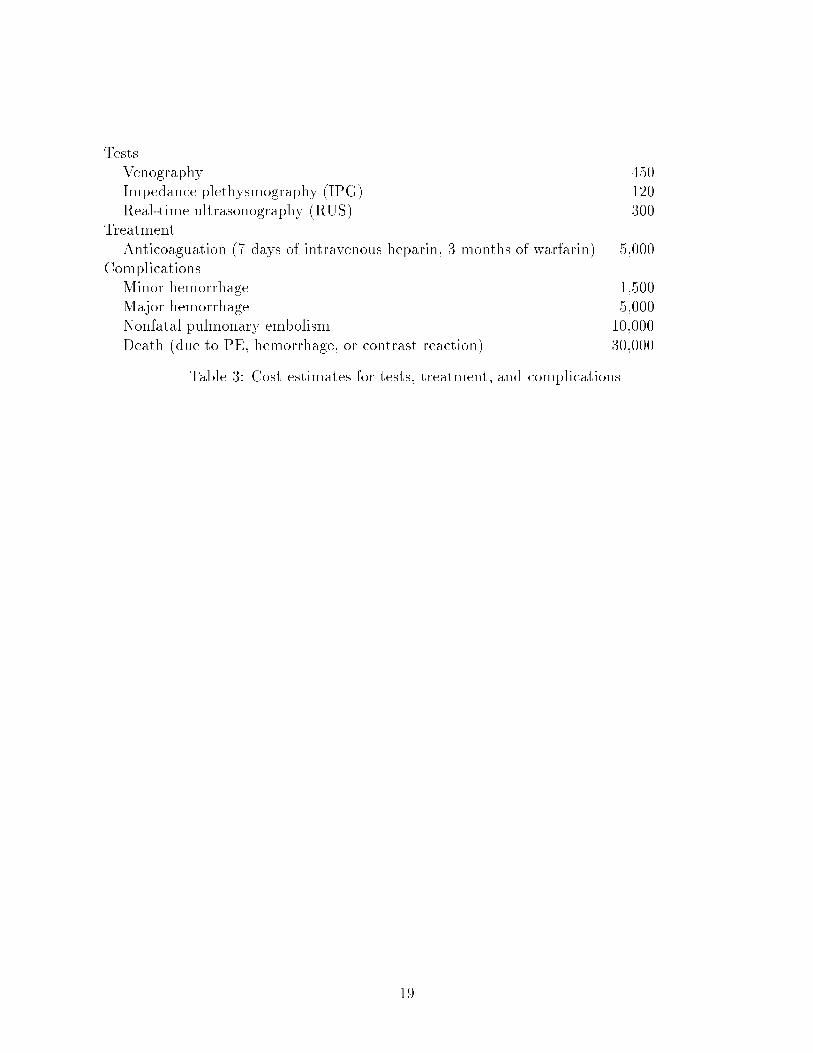
TestsVenography 450Impedance plethysmography (IPG) 120Real-time ultrasonography (RUS) 300TreatmentAnticoaguation (7 days of intravenous heparin, 3 months of warfarin) 5,000ComplicationsMinor hemorrhage 1,500Major hemorrhage 5,000Nonfatal pulmonary embolism 10,000Death (due to PE, hemorrhage, or contrast reaction) 30,000Table 3: Cost estimates for tests, treatment, and complications.
19
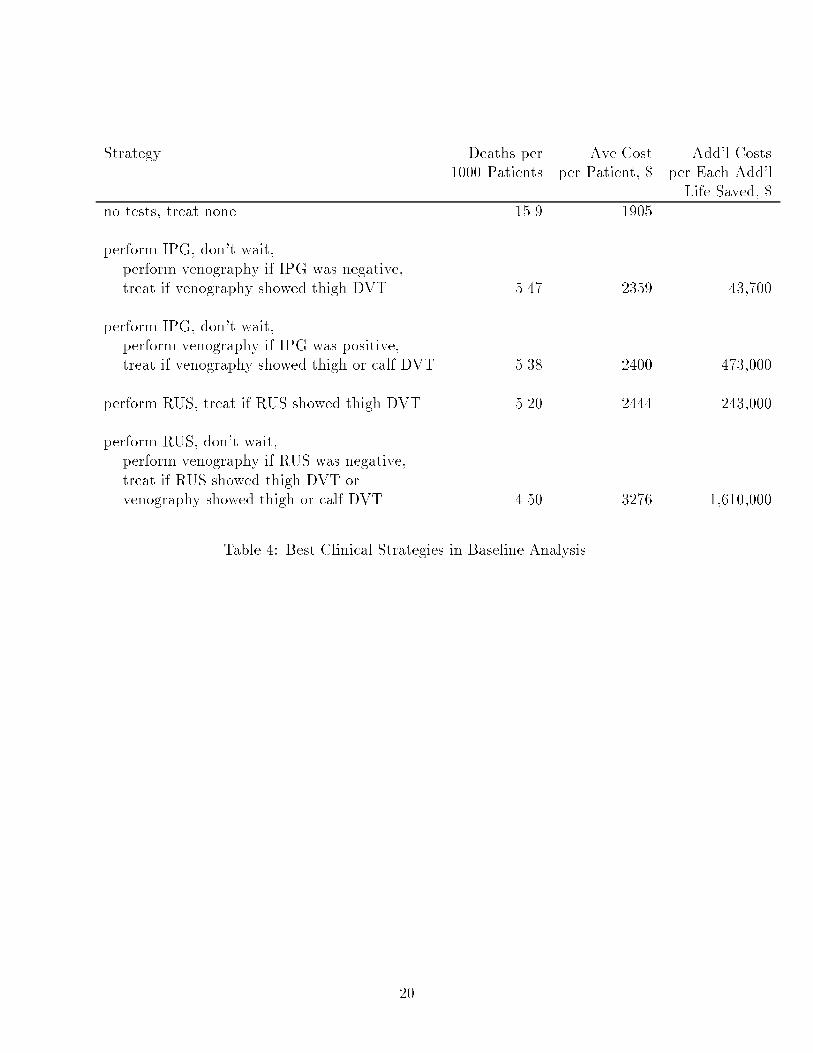
Strategy Deaths per Ave Cost Add'l Costs1000 Patients per Patient, $ per Each Add'lLife Saved, $no tests, treat none 15.9 1905 ...perform IPG, don't wait,perform venography if IPG was negative,treat if venography showed thigh DVT 5.47 2359 43,700perform IPG, don't wait,perform venography if IPG was positive,treat if venography showed thigh or calf DVT 5.38 2400 473,000perform RUS, treat if RUS showed thigh DVT 5.20 2444 243,000perform RUS, don't wait,perform venography if RUS was negative,treat if RUS showed thigh DVT orvenography showed thigh or calf DVT 4.50 3276 1,610,000Table 4: Best Clinical Strategies in Baseline Analysis.
20
�
����
����
����
����
�����
�����
�����
�� ��� ��� ��� ��� ���
Cost of fatality ($ thousands)
CP
U t
ime
(sec
)
DRIPSDecision tree
Figure 4: Running times for drips and a branch-and-bound decision tree evaluation algo-rithm for various costs of fatality. Running times are measured in CPU seconds on a DEC5000/240.
21
�
���
���
���
��
���
���
���
���
��
���
���
���
���
��
���
�� ���� ���� ����
Number of plans
CPU
tim
e (s
ec)
DRIPSDecision tree
Figure 5: Running times per plan for drips and a branch-and-bound decision tree evaluationalgorithm for problems of increasing size. Times were obtained on a DEC 5000/240 withcost of fatality set at $50,000.
22
�
����
�����
�����
�����
�����
�����
�����
�����
�� ���� ���� �����
Number of plans
Mem
ory
cons
umpt
ion
( sta
tes)
DRIPSDecision tree
Figure 6: Memory consumption for drips and a branch-and-bound decision tree evaluationalgorithm for problems of increasing size. Values represent the maximum number of worldstates that need to be stored at one time by each algorithm. Values were obtained on a DEC5000/240 with cost of fatality set at $50,000.23
Copyright © 2022 FDOKUMEN