D.C. Water Resources Research Center Annual Technical ...
166
D.C. Water Resources Research Center Annual Technical Report FY 2010 D.C. Water Resources Research Center Annual Technical Report FY 2010 1
-
Upload
khangminh22 -
Category
Documents
-
view
1 -
download
0
Transcript of D.C. Water Resources Research Center Annual Technical ...
D.C. Water Resources Research CenterAnnual Technical Report
FY 2010
D.C. Water Resources Research Center Annual Technical Report FY 2010 1

Introduction
This report summarizes the activities of the District of Columbia (DC) Water Resources Research Institute(the Institute) for the period March 1, 2010 through February 28, 2011. The Institute is one of a network of 54such entities at land-grant universities in the nation which constitutes a federal/state partnership in research,information transfer and education regarding water related issues. The Institute provides DC withinterdisciplinary research support to identify city water and environmental resources and problems andcontribute to their solution.
The Institute continues to increase its internal collaborations and partnerships among Departments at theUniversity of the District of Columbia to provide relevant water resources research results and transferinformation to assist policy makers and residents in the District of Columbia. Through its Seed GrantProgram, the Institute coordinates and facilitates water resources-related research projects awarded to facultymembers from the consortium of universities in the District. The consortium universities include theUniversity System of the District of Columbia, Howard University, George Washington University, theCatholic University, Georgetown University, George Mason University, and American University. Over 200seed grant projects have been completed and reports published by the Institute.
The opportunity to train students through development and implementation of practical applications of waterscience in Biological, Environmental, Urban Development and Engineering Programs is a majoraccomplishment of the Institute. More than 200 students trained by the Institute also interact with employersat federal and local agencies to prepare for future job opportunities. The seed grant program allows facultymembers access to new technologies and equipment that develop their expertise in water resourcemanagement. Results of each project are reported and disseminated through published studies, technicalreports, seminars, newsletters, brochures, and a website.
The Institute partners with the Cooperative Extension Service/Water Quality Education and Urban PesticideEducation Programs, the School of Engineering and Applied Science, the Biological and EnvironmentalDepartment, and the Agriculture Experiment Station, to work toward becoming an unbiased monitor ofsurface water, groundwater and drinking water quality in the District of Columbia. In order to achieve thisgoal, two environmental laboratories have been developed at the University. The two new laboratories willserve the research and training needs of our faculty and students as well as provide training opportunities forwater and wastewater quality operators for the local agencies of the DC Government. Through a partnershipwith DC Department of the Environment Toxic Waste and Hazardous Materials Branch, the Institute, incollaboration with the Cooperative Extension Service, was awarded a three-year Intra-District grant of$600,000 to upgrade our Water Quality Testing Laboratory to an Environmental Testing Laboratory capableof EPA certification in three years. A Gas Chromatograph-Mass Spectrometer (GC-MS) was purchased withthe first year funds and an Inductively Coupled Plasma-mass Spectrometer (ICP-MS) with the second year'sfunds. The complete renovation of the lab is expected at the end of February 2011. Our Water Quality TestingLaboratory will have the capacity to perform qualitative and quantitative analysis on most water, air, soil andplant diagnostic parameters. The Environmental Simulation and Modeling Laboratory is the predictive andsimulation component of our endeavor to impact efforts directed at improving the District's water resourcesquality and quantity. The Storm Water Management Modeling (SWMM) Software System and WorldwideEngine for Simulation and Training (WEST®) are the two modeling and simulation systems that have beenacquired. The SWMM Software is an urban stormwater management tool used to analyze and design existingand future drainage systems. The capabilities of these software systems include assessment of urban areastorm water runoff quantity and quality, design of storm water quantity and quality control systems, modelingof urban drainage systems including storm sewer systems and combined sewer systems, and evaluation of theperformance of Best Management Practices such as Low Impact Developments and storm water managementponds. Other analytical software such as GIS Arc Info 9.3 and Statistical Analysis System for statistical
Introduction 1

analysis has also been added. The WEST® software offers a user-friendly platform for the modeling andsimulation of urban wastewater treatment plants, fermentation processes of river watersheds, catchments, andecological systems. This software is a useful tool for design and comparison of varied plant configurationsand water quality management plans; existing process evaluation, optimization and cost analysis; andinvestigation of varied types of �what-if� scenarios. A rainfall simulator which simulates rainfall and runoffpotential under various scenarios is in the Laboratory. We have added a wireless solar powered weatherstation which would collect weather data for research purposes. These testing, simulation and modeling labswill significantly enhance our capacity for training, teaching, and research to better serve the residents of theDistrict of Columbia.
Large areas of the National Capital Region (NCR) are at risk of severe flooding from three threats: PotomacRiver inundations, storm surges caused by Atlantic hurricanes, and the inability of local drainage to handletorrential rainfall. This threat is not hypothetical as precursors have already been experienced. Nonetheless,current planning is inadequate to handle the scale of disaster expected to occur to downtown Washington'siconic corridor. The flood situation in the NCR parallels that in New Orleans prior to Katrina, but with evengreater national embarrassment. The lack of knowledge of flood potential and the lack of preparedness againstthe threat is a major concern.
The National Capital Region Flood Risk Assessment Program (FRAP) is a collaborative effort of theUniversity of Maryland, the University of the District of Columbia, and George Mason University. It bringstogether the expertise of these major regional universities to focus on the flood risk challenge. The DC WaterResources Research Institute and the Civil Engineering Department represent the District of Columbia inFRAP. The objectives of the FRAP are to facilitate joint research, promote the application of existingknowledge to flood risk mitigation, increase the capabilities of disaster managers, and provide practicalsupport for the development of flood risk management professional development (FRAP Prospectus, 2010).
The five year evaluation was completed and the review panel has recommended that the Institute berecertified for the next funding cycle. The new College of Agriculture, Urban Sustainability andEnvironmental Sciences (CAUSES) is fully functional with a Bachelor of Science and Professional Master ofScience Programs in Water Resource Management. This new college will increase our capacity to trainstudents and perform scholarly research in the future.
Introduction 2

Research Program Introduction
The DC Water Resources Research Institute will continue to provide the District with inter-disciplinaryresearch support to both identify and contribute to the solution of DC water resources problems. Theseresearch and educational projects provide students with essential practical skills required for future jobopportunities and also allow faculty members access to new technologies and equipment that develop theirexpertise in water resource management. Final reports for the four projects funded are included in thistechnical report along with three progress reports. Dr. Choi, PI on �Determining the Effectiveness of theDesign-Build Method on Water Infrastructure Rehabilitation Projects in the District of Columbia� relocatedto another University in September 2010 and requested cancellation of the project. No report is submitted forthis project.
Identifying major sources of fecal pollution in the District of Columbia from both combined sewage outlet(CSO) sites and non-point sources (NPS) is the purpose of Dr. David Morris's research project, �TheApplication of Multiple Antibiotic Resistance Profiles of Coliforms to Detect Sources of BacterialContamination of the Anacostia River.� The research links pollution-derived coliform levels, antibioticresistance in mid-summer water samples, and suggests transference of resistance between human and/oranimal-derived and natural-source coliforms. As few studies have been carried out to determine the varianceof MAR profiles of fecal coliforms in tributary that was studied, the study will provide a comprehensive�before and after� assessment of fecal contamination in the watershed as projected revitalization continues.
Dr. Harriet Phelps's paper, �Active (ABM) and Passive (POM) Chlordane Monitoring in the Anacostia RiverWatershed (MD),� details the active biomonitoring and passive monitoring she employed to assess thepresence of chlordane in the Sligo Creek Park watershed of the Anacostia River. Clams, minnows, andsediment were collected and the amounts of chlordane present in samples were analyzed. The use of bothtypes of monitoring yielded a more complete picture of chlordane and other contaminants in the creek sitesindicating, for example, the locations where Sligo Creek may be considered a potential ongoing source ofchlordane�contaminated sediment to the Anacostia tidal region.
Dr. Xueging Song analyzed three tributyltin compounds (TBTs) under varying pH conditions. Dr. Song'sresearch in �Speciation of some tributyltin compounds in Anacostia and Potomac River sediments using119SnNMR spectroscopy,� indicated that all TBTs first convert to a hydrated TBT species, with furtherdecomposition depending on the speciation time and the nature of the sediments. As the presence oftriorganotin in sediments has been regarded as long-term threat to marine and estuarine environments due toits persistence, understanding its fate in the environment is of primary importance to prevent its migration.
With their research project, �A Hierarchical Spatio-Temporal Dynamical Model for Predicting PrecipitationOccurrence and Accumulation,� Dr. Ali Arab and Dr. Tolessa Deksissa address the problem of predictingoccurrence and accumulation of precipitation, which is of considerable interest in many disciplines such asatmospheric sciences, agriculture, and hydrology, among others. The predictions based on climate models areoften in a coarse resolution that is unable to provide accurate predictions for specific locations. Alternatively,statistical modeling of precipitation data can provide more reliable predictions at higher resolutions. There areseveral statistical models suggested in the literature, but most of these models ignore the spatial and/ortemporal dependence of precipitation fields which results in lack of prediction accuracy. In this project, theauthors developed a statistical method that yields predictive distributions for precipitation occurrence andaccumulation while accounting for spatial and temporal correlation in the precipitation fields. The predictivedistributions for precipitation accumulation can then be used to obtain exceedance probability of rainfallaccumulation beyond a threshold in order to issue flash flood warnings, and optimize evacuation managementin case of flooding events. The proposed modeling approach is based on a hierarchical modeling frameworkthat allows breaking down a complex problem into simpler components that are linked together
Research Program Introduction
Research Program Introduction 1

probabilistically. The proposed approach was implemented using historic precipitation data in the WashingtonD.C. area.
Research for "Determination of Seasonal Source Variation of Hydrocarbons, Organics and Nutrients in theAnacostia River: Stable Isotope Ratios of Specific Compounds� was carried out by Dr. Stephen McAvoy.This project analyzed seasonal nutrient dynamics and organic material sources of the Anacostia River todetermine if a seasonal component to water nutrient concentrations and sources exists, and to identifybiogeochemical controls within the river in order to discern which geochemical and nutrient variables aredriving those controls. Water, sediment, and (when possible) invertebrate samples were collected (in mostcases monthly) from three tidal freshwater sites along the Anacostia River since April 2010, and continuingthrough May 2011. Water nutrients (NO3 and NH4) demonstrate seasonal fluxes; all sites show a peak innutrients during early summer (June) and subsequent decline. While the examination and interpretation ofresults is ongoing, Dr. McAvoy's progress report includes initial analysis, which was presented at the AnnualMeeting of the American Geophysical Union, December 2010. These and other results will be written up as amanuscript for peer- reviewed publication in summer 2011. A six month, no-cost extension was grantedMarch 3, 2011. The final report will be delivered in October, 2011.
Dr. Arash Massoudieh and Dr. Pradeep Behera continue to assess the impact of construction of various typesof Best Management Practices (BMPs) and Low Impact Development (LID) strategies on the loads of variouswater quality constituents discharging into the water bodies around the District of Columbia. For this purpose,they will develop an urban watershed model using the EPA SWMM model for a region at the eastern part ofthe city of Washington. Loads of TSS, and nutrients will be calculated for three water years including a wetyear, a small year and an average year. These simulations will serve as the baseline scenarios. The impacts ofvarious low impact development strategies including retention and detention basins, infiltration ponds, sandfilters, rain barrels and green roofs and permeable pavement will then be incorporated into the model. TheLID and BMPs will be incorporated as per-area cover and will influence the amount of runoff per area beinggenerated and also in some cases will impact the water quality of the storm runoff. The project will benefit thepublic health and the water quality by leading to a more sustainable, cost-effective and affordable stormwaterinfrastructure.
Listed below are the eight grants awarded to researchers for FY 2012 104B grants.
Title: Urban Stormwater Runoff Prediction Using Computational Intelligence Methods, Dr. Nian AshleeZhang, Assistant Professor, Dept. of Electrical and Computer Engineering - University of the District ofColumbia.
Title: Integrated Water Use Impact Assessment for DC urban Infrastructure, Dr. Royce Francis, AssistantProfessor, Assistant Professor, Department of Engineering Management and Systems Engineering- GeorgeWashington University.
Title: Metropolitan Washington Public Officials' Water Leadership Program, Howard Ways, AICP (PrincipalInvestigator), Director of Planning and Sustainability and Adjunct Professor, College of Arts & Sciences,Department of Urban Studies - University of the District of Columbia; Dr. Catherine Shrier (Co-PI), WatercatConsulting LLC.
Title: Hormone Disruption and Environmental Pollutants in Anacostia and Potomac River Fish, WashingtonDC, Dr. Stephen McAvoy, Department of Environmental Science �American University and Dr. CathySchaeff, Biology Department - American University.
Title: National Capital Region Flood Risk Assessment: Inter-university Collaboration Initiative, Dr. PradeepBehera (Principal Investigator), Associate Professor, Engineering, Architecture & Aerospace Technology-
Research Program Introduction
Research Program Introduction 2

University of the District of Columbia; Dr. Gerald Galloway (Co-PI), Glenn L. Martin Institute Professor ofEngineering, Department of Civil and Environmental Engineering -University of Maryland; Dr. Michael J.Casey (Co-PI), Assistant Professor and Graduate Director Department of Civil, Environmental, andInfrastructure Engineering, The Volgenau School of Info. Tech. and Engineering - George Mason University.
Title: Pollution Source Identification in Washington DC storm-water using Bayesian Chemical Mass BalanceModeling, Dr. Arash Massoudieh, Assistant Professor, Department of Civil Engineering �Catholic University(Principal Investigator); Dr. Ali Arab (Co-PI), Assistant Professor - Georegtown University; Dr. TolessaDeksissa (Co-PI), Program Director, Professional Science Master's in Water Resources Management, Collegeof Agriculture, Urban Sustainability and Environmental Sciences (CAUSES) - University of District ofColumbia.
Title: Monitoring of Glyphosate and its Degradation of Residue by Phosphorus-31 Nuclear MagneticResonance Spectroscopy, Dr. Xueging Song, Assistant Professor of Chemistry - University of the District ofColumbia.
Title: GIS-based Ecosystem Service Analysis of Urban Green Infrastructure as a Tool for Attaining Water andAir Quality Objectives in the District of Columbia, Dr. Tolessa Deksissa, Program Director, ProfessionalScience Master's in Water Resources Management, College of Agriculture, Urban Sustainability andEnvironmental Sciences (CAUSES) - University of District of Columbia.
Research Program Introduction
Research Program Introduction 3

Determining the Effectiveness of the Design-Build Methodon Water Infrastructure Rehabilatation Projects in theDistrict of Columbia
Basic Information
Title: Determining the Effectiveness of the Design-Build Method on Water InfrastructureRehabilatation Projects in the District of Columbia
Project Number: 2010DC108BStart Date: 3/1/2010End Date: 2/28/2011
Funding Source: 104BCongressional
District: DC
Research Category: EngineeringFocus Category: Education, Methods, Economics
Descriptors: NonePrincipal
Investigators: Kunhee Choi, Pradeep K. Behera
Publications
There are no publications.
Determining the Effectiveness of the Design-Build Method on Water Infrastructure Rehabilatation Projects in the District of Columbia
Determining the Effectiveness of the Design-Build Method on Water Infrastructure Rehabilatation Projects in the District of Columbia1

1
Dr. Choi, PI on “Determining the Effectiveness of the Design-Build Method on Water
Infrastructure Rehabilitation Projects in the District of Columbia” relocated to another
University in September 2010 and requested cancellation of the project. The co-PI also
declined to continue the project, therefore neither progress nor final report is submitted.
Dr. Kunhee Choi
Assistant Professor of Construction Management
Engineering, Architecture & Aerospace Technology
University of the District of Columbia
Building 42 Room 213E
4200 Connecticut Avenue
Washington, DC 20008
Tel: 202-274-6664
Fax: 202-274-6232
Email: [email protected]
Dr. Pradeep K Behera, Ph.D., P.E., D.WRE
Associate Professor
Engineering, Architecture & Aerospace Technology
University of the District of Columbia
Building 42 Room 213F
4200 Connecticut Avenue
Washington, DC 20008
Tel: 202-274-6186
Fax: 202-274-6232
Email: [email protected]
Abstract:
The majority of existing water infrastructure facilities in the District of Columbia and
elsewhere in the United States are being deteriorated rapidly and are thus reaching the
end of their serviceable lives (Buchberger et al., 2009). Therefore, in recent years there
are serious concerns about public health and safety with increased pressure to modernize
aging nation‟s water infrastructure systems. It has been estimated that more than 7
million people become ill each year from contaminated water, according to the Natural
Resources Defense Council. In response, President Obama has called for 2,680 water
infrastructure rehabilitation projects with an investment of $15 billion (WaterWorld,
2009). Design-Build (DB) is known as the fast-track project delivery strategy for getting
these projects started and completed early. According to an article recently published, the
DB has been cited as the key to implementing President Obama‟s commitment to water
infrastructure (WaterWorld, 2009). Yet, the effectiveness of implementing the DB
strategy on water infrastructure rebuilding projects is debatable largely because of its
inherent characteristics that can increase project cost and cause schedule delay if the DB
team lacks capabilities for doing the DB project. Furthermore, little is known about its
impact on project performance aspects such as project schedule, cost, and frequency of

2
contract change orders. The lack of systematic studies to assess it now prevents DCWRRI
from planning realistically and budgeting accurately when it is considered for
implementation. This study attempts to address these shortcomings by determining the
effectiveness of the DB strategy and by providing guidelines for effective use of DB.
Title: Determining the Effectiveness of the Design-Build Method on Water
Infrastructure Rehabilitation Projects in the District of Columbia
Statement of critical regional or State water problem:
Similar to many older cities in the nation, the sewer system in the District of Columbia is
comprised of both combined and separate sewer systems. Most of them are deteriorated
and dysfunctional, thus needing to be rehabilitated. The DC‟s over-burdened and
antiquated water infrastructure creates sustainability issues, too. According to the
Congressional Budget Office, more than 20 percent of drinking water is lost and 1.2
trillion gallons of storm water and wastewater overflow every year due to leaks and
breaks in the 800,000 miles of water pipes and 600,000 miles of sewer lines in the U.S.
Water infrastructure investment is expected to be a significant priority for many years. In
fact, to address these problems, the District of Columbia Water and Sewer Authority
(WASA) has developed a Long Term Control Plan (LTCP) that provides the alternative
solutions and their implementation costs. The implementation cost of recommended plan
stands at 1.6 billion dollars.
Currently Washington Aqueduct and WASA are facing a daunting task of financing the
implementation of water and wastewater infrastructure rehabilitation in an equitable
manner without placing an unreasonable burden on ratepayers. The WASA has used the
following two methods to document the burden on the District of the proposed LTCP:
Long-term rate impact analysis using the Authority‟s financial planning and rates
model, and
Affordability analysis using procedures developed by EPA.
Based on the analysis, a 40-year implementation time has been proposed for the entire
recommended plan if no outside financial assistance is received. If significant outside
financial assistance is obtained, it is technically feasible to accelerate the schedule to a
15-year implementation time frame.
Statement of results or benefits
With the DCWRRI seed grant, this research will be focused on:
Quantitative analysis of the measurements and interpretations of data arising from
an agency‟s selection of an innovative contracting strategy in construction of new
and existing water infrastructure; and
Quantitative analysis of the observed impacts of the contracting strategy choice
on project performance components such as schedule and cost.

3
Design-Build, which is the major focus of the research proposed in this proposal, is a
means to ensure faster construction done by a single DB firm, who is responsible for both
design and construction. Because DB projects are relatively large-scale and financed with
public funds on water infrastructure projects, its misapplication results in a loss of public
resources. Therefore, it is especially important that candidate projects be carefully
selected and effectively implemented.
Proceeding from this understanding, a quantitative analysis will be performed to
determine effectiveness of the use of the DB strategy. The deliverables include:
(1) A literature review that establishes the current state of industry;
(2) Comprehensive summary of project data classified by contracting method, project
type, and project scope; and,
(3) A summary evaluation of the effects of DB projects on time and cost compared to
conventional projects.
Solutions to problems and contributions of this research are defined in the Table 1.
Table 1. Proposed Solutions to the Problems.
Problems Solutions and Contributions
Problem I: Disagreement
about DB project‟s
effectiveness
Evaluate the effectiveness on schedule performance, cost
growth, and contract changes by comparing DB projects
with conventionally contracted projects.
Contribution
- Promote the effective application of the DB strategy by
knowing the percentages and overall performance.
Problem II: Lack of data
and systematic studies
Conduct a methodical quantitative analysis.
Contributions:
- Provide comprehensive evaluation data.
- Provide a synthesized analysis approach and make
recommendations for taking the next step to effectively
use DB contracting strategy.
Nature, scope, and objectives of the research
The major objective of this research is to determine the effectiveness of DB contracting
projects compared to the traditional design-bid-build (DBB) project on aspects of project
performance such as construction time, project cost, and frequency of change orders in
the water infrastructure.
Tasks to achieve this objective include:
1. Investigate whether use of DB affects construction duration;

4
2. Determine whether use of DB on water infrastructure improvement projects
significantly shortens their duration compared to conventional projects; and
3. Examine whether DB projects increase project costs above the levels seen in
conventional DBB projects.
This study has the potential to assist DCWRRI to: (1) make better informed decisions
when choosing a DB contracting strategy; and (2) allocate more accurate, realistic
budgets for DB projects.
Table 2. Time Line for The Proposed Project by Each Research Task.
# Description of Activities Time (months) from start to end of project
1 2 3 4 5 6 7 8 9 10 11 12
1 Literature Review
2 Data Collection & Analysis
3 Schedule & Cost Analysis
4 Contract Change Order Analysis
5 Report
Methods, procedures, and facilities
The proposed study requires project data recently completed in the District of Columbia
to quantify likely impacts of DB on project schedule, cost, and contract change orders
compared with the conventional DBB contracting method.
Initial project schedule and contract amount estimates are often adjusted due to contract
changes in project scope resulting from frequently occurring contract change orders.
Consequently, project data that will be used for quantitative analyses must contain this
contract change order information. The PIs will look for data that include the adjusted
days and contract amounts so that the impact of contract and schedule changes can be
quantified.
Results of this quantitative data analysis could be biased if samples of varied project
types and sizes are compared, so to perform an unbiased analysis, project data will be
sorted by similar project type and by similar project size.
Based on the nature of data, some appropriate statistical analyses will be performed to
evaluate project performance on project schedule and cost using the following ratios:
Schedule performance ratio =
[(final completion time – original (and amended) contract time) / original (and
amended) contract time]
The cost change ratio =
[(final project cost – original (and amended) contract amount) / original (and
amended) contract amount]

5
The schedule performance ratio is the ratio of the difference between the actual final
completion time and the original contract time to the original contract time. A negative
value implies that the project was completed sooner than originally scheduled. A positive
value implies that the project took longer than originally scheduled. If the ratio equals
zero, that implies the project was completed on time.
The cost changes ratio will be used to examine the level of cost growth for DB projects
over conventional projects. It is defined as the ratio of difference between the final
project cost and the original contract amount to the original contract amount. A positive
ratio implies cost growth and a negative one means a reduction.
Related Research
Dr. Choi completed his Ph.D. degree in Civil and Environmental Engineering at the
University of California at Berkeley in the Fall of 2008. Currently, he is an assistant
professor at the University of the District of Columbia. During his study at Berkeley, he
was selected as the recipient of the Earle C. Anthony Fellowship, which is the most
prestigious honor awarded college-wide to Ph.D. students for excellence in academic and
research performance. Prior to joining a graduate program at Berkeley, he held a position
as a field engineer for two years in the residential construction sector. He also worked as
a graduate student researcher and a post-doctoral researcher at the Institute of
Transportation Studies of UC Berkeley for six years. His research has centered around
the following three areas on urban infrastructure rehabilitation projects: 1) improved
project delivery systems with the special emphasis on evaluating the contractors‟ cost and
schedule performance of different types of projects (residential, commercial, etc.) built
under different delivery systems (design-build, design-bid-build, etc); 2) development of
an engineered decision-support computer model for complex civil infrastructure systems
to aid selection of a solution that would enable agencies to make better-informed
decisions; and 3) labor productivity study and streamlined strategies to maximize
construction productivity by minimizing project uncertainties. To date, he has published
and co-authored more than 15 peer-reviewed scholarly papers in these three areas, and
the research behind these papers has drawn praise from his peers in the academic and
professional engineering worlds.
Training potential
The proposed preliminary study will create an excellent opportunity for training students,
researchers and water resources professionals.
1. Budget Breakdown:
The budget breakdown for this proposed project is provided in Table 3.
Table 3. The Budget Breakdown for the Proposed Project.

6
Proposed Start Date: March 1, 2010 Proposed Completion Date: February 28, 2011
Project Number: (to be assigned by institute)
Project Title: Determining the Effectiveness of the Design-Build Method on Water
Infrastructure Rehabilitation Projects in the District of Columbia
Principle Investigator Dr. Kunhee Choi
Cost Category Federal Non Federal Total
1. Salaries and wages: $ $ $
- Principal Investigator (s)
Kunhee Choi $ 4,000 $ 18,800 $ 22,800
Pradeep Behera $ 4,000 $ 8,000 $ 12,000
Students $ 4,000 $ 4,000
Total Salaries and wages: $ 12,000 $ 26,800 $ 38,800
2. Fringe benefits
3. Supplies $ 400 $ 400
4. Equipment
5. Services or consultants
6. Travel $ 1,000 $ 1,000
7. Other direct costs
8. Total direct costs $ 13,400 $ 26,800 $ 40,200
9. Indirect costs on federal share $ 4,556 $ 4,556
10. Indirect costs on non- federal share: $ 9,112 $ 9,112
11. Total estimated cost $ 13,400 $ 40,468 $ 53,868
Budget Justification:
The budget required for each of these categories is estimated on the basis of minimum
requirements to perform the proposed research tasks identified in the Table 2. The PIs, Dr.
Choi and Dr. Behera, will be directly involved in the research activities and an amount of
$8,000 is allocated for their summer salary support. Engineering undergraduate students
from the University of the District of Columbia will be involved for collecting data and
research for three months. The travel money will be used for presenting the results in the
local conference.
Investigator’s qualifications:
Please see a two-page biographical sketch for the PIs attached.
Literature cited
Buchberger, S., Clark, R., Crayman, W., Li, Z., Mccutcheon, M., and Yang, J. (2009). “Needs
and Trends of the Nation‟s Water Infrastructure – The Utility Perspective.” World Environmental
and Water Resources Congress 2009, May 17-21, Kansas City, Missouri.

7
WaterWorld (2009). “Design-Build Method Key to Implementing President Obama‟s
Commitment to Water Infrastructure.”
<http://www.waterworld.com/index/display/article-
display/351730/articles/waterworld/drinking-water/infrastructure/rehabililtation/design-
build-method-key-to-rehabilitating-water-infrastructures.html> (Accessed on November
30, 2009).

8
KUNHEE CHOI, PH.D. (LEAD PI)
+1 (202) 274-6664
4200 Connecticut Ave., NW Washington, DC 20008
[email protected] http://kunhee.choi.googlepages.com
EDUCATION UNIVERSITY OF CALIFORNIA, BERKELEY Ph.D. in Engineering & Project Management (2008)
Department of Civil and Environmental Engineering
Minors in Finance and Statistics
TEXAS A&M UNIVERSITY M.S. in Construction Management (2002)
AT COLLEGE STATION Department of Construction Science
KOREA UNIVERSITY AT SEOUL B.E. in Architectural Engineering (1999)
ACADEMIC APPOINTMENT
UNIVERSITY OF THE DISTRICT OF COLUMBIA Assistant professor of construction management
(tenure-track)
(08/2009 – To date)
UNIVERSITY OF CALIFORNIA, BERKELEY Post-doctoral researcher
INSTITUTE OF TRANSPORTATION STUDIES Principal Investigator: Professor Carl L. Monismith
(03/2009 – 07/2009) − Plan, organize, and carry out long-term and short-term
research projects in the
area of highway infrastructure management.
UNIVERSITY OF CALIFORNIA, BERKELEY Graduate Student Researcher (50-100% appointment)
PAVEMENT RESEARCH CENTER (UCPRC) − Working with a multidisciplinary cross-functional team of
design, construction,
(06/2003 – 12/2008) and transportation.
− Develop expertise in strategic infrastructure project
management.
TEXAS A&M UNIVERSITY Graduate Student Teaching Assistant (25%
appointment)
(01/2002 – 05/2002)
INDUSTRY APPOINTMENT BR CONSTRUCTION GROUP, LLC Scheduling Engineer
(10/1998 – 07/2000) − Developed full CPM logic generated baseline schedules
for a large-scale high-rise
residential building project (project size: US $217 million).
− Perform monthly progress updates and create target
comparison and periodic
look-ahead schedules.
SAMSUNG C&T CORPORATION Assistant Engineer (Internship)
(10/1991 – 05/1992) − Prepared contract change order as-built drawings.
− Coordinate the execution and completion of budgets.

9
RELATED RESEARCH EXPERIENCE FOR THE PROJECT
PROJECT DELIVERY SYSTEMS ■ Quantified the impact of alternative contracting
strategies on aspects of
project performance such as project schedule, cost, and
change orders.
■ As the PI, developed a research grant proposal
(US$ 50,000) for the
quantitative study of design-build over the conventional
design-bid-build
building construction projects (under review)
INFRASTRUCTURE PROJECT MANAGEMENT ■ Developed an interdisciplinary research program in the
area of sustainable
infrastructure systems that integrate design and
materials, streamlined
transportation management strategies, and advanced
planning concepts.
STATE-OF-THE-ART CA4PRS SOFTWARE ■ Played a pivotal role in development, enhancement,
implementation, and
validation of CA4PRS computer program for
infrastructure management.
■ Using CA4PRS, helped agencies select the most
feasible construction
scenarios by providing an integrated
design/schedule/cost/traffic analysis.
■ Developed a work plan and a feasibility study report as
requirements of a
research funding grant of $1.2 million from FHWA and
Caltrans.
GRANT WRITING ■ Initiated search for new grant opportunities, initiated
conceptualization and
writing of grants, and co-wrote with PI.
■ Written over 8 research grants to agencies including
FHWA, Caltrans,
NCHRP, NECA, and DCWRRI. − CA4PRS enhancement studies, I-15 Devore project,
innovative contracting,
implementation study for long-life rehabilitation projects,
incentives/disincentives
SELECTED PUBLICATIONS
REFEREED ARCHIVAL JOURNAL PUBLICATIONS Choi, K., Lee, E.B., Ibbs, C.W., and Kim, Y. (2009).
“Multifaceted Public
Outreach and Cost-Benefit Analysis for Its
Effectiveness Validation.”
Journal of Construction Management and Economics,
27 (8), 771-782.
Lee, E.B., Choi, K., and Lim, D.S. (2008).
“Streamlined Strategies for
Faster, Less Traffic-Disruptive Highway Rehabilitation

10
in Urban
Networks.” Transportation Research Record
(Construction Management
Section): Journal of the Transportation Research Board,
No. 2081, TRB,
National Research Council, Washington, D.C., 38-45.
Lee, E.B. and Choi, K. (2006). “Fast-Track
Construction for Concrete
Pavement Rehabilitation: California Urban Highway
Network.”
Transportation Research Record (Pavement
Rehabilitation Section):
Journal of the Transportation Research Board, No.
1949, TRB,
National Research Council, Washington, D.C., 3-10.
REFEREED CONFERENCE PROCEEDINGS Choi, K. (2010). “Alternative Contracting Strategies:
Are They Really
Effective?” 4th
International Conference of Public
Procurement (IPPC2010),
Seoul, South Korea, August 26-28.
Choi, K. (2009). “A State-of-the-art Tool for
Sustainable Rebuilding of
Aging Infrastructure Systems.” 2009 American Society
of Engineering
Education Mid-Atlantic Conference, King of Prussia,
Pennsylvania, October
23-24.
SELECTED CONFERENCE PRESENTATIONS Choi, K. (2008). “Streamlined Strategies for Faster,
Less Traffic-Disruptive
Highway Rehabilitation in Urban Networks.” In the
87th
TRB Annual
Meeting, Washington, D.C., Jan. 15.
Choi, K. (2006). “California Experience with Fast-
track Construction for
Concrete Pavement Rehabilitation on an Urban
Highway Network.” In the
85th
TRB Annual Meeting, Washington, D.C., Jan. 23.
Choi, K. (2006). “Dynamic Approach to Public
Outreach for Minimizing
Traffic Inconvenience in Urban Highway
Rehabilitation.” In the 85th
TRB
Annual Meeting, Washington, D.C., Jan. 25.

11
PRADEEP K. BEHERA, Ph.D., P.E. Associate Professor, Dept. of Engineering, Architecture and Aerospace Technology
University of the District of Columbia
4200 Connecticut Avenue, Bldg. 42/Room 213H, Washington DC, N.W. 20008
Tel: 202-274 6186, Email: [email protected]
Research Interests: Urban Stormwater Management, Non-point Source Pollution, Water
Resources Engineering, Erosion and Sediment Control, Sustainable Urban Water
Systems.
EDUCATION AND CREDENTIALS
NSERC Industrial Post-Doctoral Research Fellow, Canada
Ph.D., Environmental Engineering, University of Toronto, Canada
M.S. Civil Engineering, Sambalpur University, India
B.S. (Honors) Civil Engineering, Sambalpur University, India
PROFESSIONAL EXPERIENCE
Associate Professor, Department of Engineering, Architecture and Aerospace,
University of the District of Columbia, Washington DC Aug 05-Present
Senior Water Resources Engineer, BPC Group Inc., Orlando, Florida May-Jul 2005
Water Resources Engineer, Clarifica Inc., Richmond Hill, Ontario 2001 – 2005
Doctoral Student, Dept. of Civil Eng., University of Toronto, Canada 1997-2001
Senior Lecturer, National Institute of Technology, Rourkela, India 1990-1996
RESEARCH PUBLICATIONS (Partial List)
Peer Reviewed Journal Publications
Behera, P, K., J. Y. Li, and B. J. Adams, “Runoff Quality Analysis of Urban
Catchments with Analytical Probabilistic Models" Journal of Water Resources
Planning and Management. ASCE January 2006.
Behera, P, K., J. Y. Li, and B. J. Adams, “Characterization of Urban Runoff Quality:
A Toronto Case Study" Applied Modeling of Urban Water Systems. W. James (Ed.),
CHI Guelph, Ontario, January 2000.
Behera, P, K., F. Papa, and B. J. Adams, “Optimization of Regional Storm-Water
Management Systems." Journal of Water Resources Planning and Management.
ASCE, January 1999, Vol. 125, No. 2, March-April, 1999.
Book Chapter Publication
Chapter 5 for the book „Urban Stormwater Management Planning with Analytical
Probabilistic Models‟ by B. J. Adams and F. Papa, John Wiley & Sons, New York,
2000.

12
Technical Reports
Author of Research Report (2004) “Assessment of Construction Sediment Control
Ponds to Protect Receiving Waters”.
Author of Research Report (2004) “Assessment of Construction Sediment Control
Ponds to Protect Receiving Waters”.
Presentations
“Probabilistic Approaches for Assessment of Non-Point Source Pollutant Loads
from Urban Watersheds” in the International Conference on “World
Environmental & Water resources Congress 2008 at Honolulu, Hi during May 12-
17, 2008.
Application of Analytical Models for TMDL Analysis” Behera, P.K., World
Environmental Congress, Omaha, May 21-25, 2006.
“Performance Evaluation of a Construction Sediment Control Pond”, by Krasnova,
R., J. Y. Li and P. K. Behera, International Conference on Stormwater and Urban
Water Systems Modeling, Toronto, Ontario, Feb 24-25, 2005.
"Runoff quality analysis of urban catchments with analytical probabilistic models: model
development, verification, and application" by Behera, P.K., J.Y. Chen, I.O. Poon, B, J.
Adams, B.J, EGU-1st General Assembly Conference, Nice, France, 25-30, April 2004.
“Runoff Quality Analysis for Metropolitan Toronto Waterfront” Annual Conference on
Storm water and Urban Water Systems Modeling, by Behera, P.K, B. J. Adams, and J.Y.
Li, Toronto, Ontario, Feb 18-19, 1999.
“Analytical Probabilistic Model to Estimate Long-term EMC of Pollutants in Urban
Runoff” by Behera, P.K, and B. J. Adams - 35th Central Canadian Symposium on Water
Pollution Research, Burlington, Ontario, 2000.
PROFESSIONAL AFFILIATION
Professional Engineer, State of Maryland, U.S.A.
Associate Member, American Society of Civil Engineers, U.S.A.
Diplomate, American Academy of Water Resources Engineer
Professional Engineer, Ontario, Canada

A Hierarchical Spatio-Temporal Dynamical Model forPredicting Precipitation Occurrence and Accumulation
Basic Information
Title: A Hierarchical Spatio-Temporal Dynamical Model for Predicting PrecipitationOccurrence and Accumulation
Project Number: 2010DC111BStart Date: 3/1/2010End Date: 2/28/2011
Funding Source: 104BCongressional
District: DC
Research Category: Climate and Hydrologic ProcessesFocus Category: Floods, Methods, None
Descriptors: NonePrincipal
Investigators: Ali Arab, Valbona Bejleri, Tolessa Deksissa
Publications
There are no publications.
A Hierarchical Spatio-Temporal Dynamical Model for Predicting Precipitation Occurrence and Accumulation
A Hierarchical Spatio-Temporal Dynamical Model for Predicting Precipitation Occurrence and Accumulation1

A Hierarchical Spatio-Temporal Dynamical Model for
Predicting Precipitation Occurrence and Accumulation
Progress Report
Submitted to
DISTRICT OF COLUMBIA WATER RESOURCES RESEARCH INSTITUTE
By:
Ali Arab, Ph.D. (PI)
Assistant Professor,
Department of Mathematics and Statistics
Georgetown University
Tolessa Deksissa, Ph.D. (Co-PI)
Research Associate and Lab Coordinator
DC WRRI and Agricultural Experiment Station
College of Agriculture Urban Sustainability and Environmental Sciences (CAUSES)
University of District of Columbia
Student researchers: Julie Menken (Georgetown University undergraduate student)
Christianne Greer (Georgetown University graduate student)
April 2011

2
Summary
The problem of predicting occurrence and accumulation of precipitation is of considerable
interest in many disciplines such as atmospheric sciences, agriculture, and hydrology among
others. The predictions based on climate models are often in a coarse resolution that cannot
provide accurate predictions for specific locations. Alternatively, statistical modeling of
precipitation data can provide more reliable predictions at higher resolutions. There are several
statistical models suggested in the literature, but most of these models ignore the spatial and/or
temporal dependence of precipitation fields, which results in lack of prediction accuracy.
Our goal in this project is to develop a statistical method that yields predictive distributions for
precipitation occurrence and accumulation while accounting for spatial and temporal correlation
in the precipitation fields. The predictive distributions for precipitation accumulation can then be
used to obtain exceedance probability of rainfall accumulation beyond a threshold in order to
issue flash flood warnings, and optimize evacuation management in case of flooding events.
Project Status (As of April 30, 2011)
Historic records on total monthly precipitation values were obtained from the main weather
stations in the DC area. These three stations are located at
Ronald Reagan Washington National Airport (DCA)
Baltimore/Washington International Airport (BWI) – Also known as: Thurgood Marshall Airport
Washington Dulles International Airport (IAD)
Student researchers have completed an extensive exploratory data analysis (EDA) of these data.
The EDA results are essential for the statistical modeling. In the next stage of the project, a
statistical model for predicting monthly rainfall values will be finalized based on work in
progress.
Single Variable EDA
In this section, we discuss EDA for all three stations. The data for DCA and BWI stations are
available for years 1871 through 2010. Note that IAD data is only available starting April, 1963
(through 2010).
Maximum total precipitation (in inches) levels by month and airport
Maximums by Month Month Maximum Value Year Airport Jan 7.84 1979 BWI Feb 7.16 1979 BWI Mar 8.84 1891 DCA Apr 9.13 1889 DCA

3
May 10.69 1953, 1889 DCA Jun 18.19 1972 IAD Jul 11.06 1945 DCA Aug 18.35 1955 BWI Sep 17.45 1934 DCA Oct 9.41 2005 DCA Nov 7.83 1963 IAD Dec 8.06 2009 BWI Maximums by Airport Maximum Value Year Month DCA 17.45 1934 September BWI 18.35 1955 August IAD 18.19 1972 June
January
February
0
1
2
3
4
5
6
7
8
9
18
71
18
77
18
83
18
89
18
95
19
01
19
07
19
13
19
19
19
25
19
31
19
37
19
43
19
49
19
55
19
61
19
67
19
73
19
79
19
85
19
91
19
97
20
03
20
09
in.
January Rainfall, 1871-2010
DCA
BWI
IAD

4
March
April
0
1
2
3
4
5
6
7
8
18
71
18
77
18
83
18
89
18
95
19
01
19
07
19
13
19
19
19
25
19
31
19
37
19
43
19
49
19
55
19
61
19
67
19
73
19
79
19
85
19
91
19
97
20
03
20
09
in.
February Rainfall, 1871-2010
DCA
BWI
IAD
0
1
2
3
4
5
6
7
8
9
10
18
71
18
77
18
83
18
89
18
95
19
01
19
07
19
13
19
19
19
25
19
31
19
37
19
43
19
49
19
55
19
61
19
67
19
73
19
79
19
85
19
91
19
97
20
03
20
09
in.
March Rainfall, 1871-2010
DCA
BWI
IAD

5
May
June
0
1
2
3
4
5
6
7
8
9
10
18
71
18
77
18
83
18
89
18
95
19
01
19
07
19
13
19
19
19
25
19
31
19
37
19
43
19
49
19
55
19
61
19
67
19
73
19
79
19
85
19
91
19
97
20
03
20
09
in.
April Rainfall, 1871-2010
DCA
BWI
IAD
0
2
4
6
8
10
12
18
71
18
77
18
83
18
89
18
95
19
01
19
07
19
13
19
19
19
25
19
31
19
37
19
43
19
49
19
55
19
61
19
67
19
73
19
79
19
85
19
91
19
97
20
03
20
09
in.
May Rainfall, 1871-2010
DCA
BWI
IAD

6
July
August
0
2
4
6
8
10
12
14
16
18
20
18
71
18
77
18
83
18
89
18
95
19
01
19
07
19
13
19
19
19
25
19
31
19
37
19
43
19
49
19
55
19
61
19
67
19
73
19
79
19
85
19
91
19
97
20
03
20
09
in.
June Rainfall, 1871-2010
DCA
BWI
IAD
0
2
4
6
8
10
12
18
71
18
77
18
83
18
89
18
95
19
01
19
07
19
13
19
19
19
25
19
31
19
37
19
43
19
49
19
55
19
61
19
67
19
73
19
79
19
85
19
91
19
97
20
03
20
09
in.
July Rainfall, 1871-2010
DCA
BWI
IAD

7
September
October
0
2
4
6
8
10
12
14
16
18
20
18
71
18
77
18
83
18
89
18
95
19
01
19
07
19
13
19
19
19
25
19
31
19
37
19
43
19
49
19
55
19
61
19
67
19
73
19
79
19
85
19
91
19
97
20
03
20
09
in.
August Rainfall, 1871-2010
DCA
BWI
IAD
0
2
4
6
8
10
12
14
16
18
20
18
71
18
77
18
83
18
89
18
95
19
01
19
07
19
13
19
19
19
25
19
31
19
37
19
43
19
49
19
55
19
61
19
67
19
73
19
79
19
85
19
91
19
97
20
03
20
09
in.
September Rainfall, 1871-2010
DCA
BWI
IAD

8
November
December
0
1
2
3
4
5
6
7
8
9
10
18
71
18
77
18
83
18
89
18
95
19
01
19
07
19
13
19
19
19
25
19
31
19
37
19
43
19
49
19
55
19
61
19
67
19
73
19
79
19
85
19
91
19
97
20
03
20
09
in.
October Rainfall, 1871-2010
DCA
BWI
IAD
0
1
2
3
4
5
6
7
8
9
18
71
18
77
18
83
18
89
18
95
19
01
19
07
19
13
19
19
19
25
19
31
19
37
19
43
19
49
19
55
19
61
19
67
19
73
19
79
19
85
19
91
19
97
20
03
20
09
in.
November Rainfall, 1871-2010
DCA
BWI
IAD

9
Model-Based EDA (Relationships Between Variables)
For brevity, we focus the exploratory data analysis on the data from the DCA weather station. It
should be noted that large scale patterns are very similar for the other two stations in the area and
most conclusions and results for this station are valid for the other stations as well.
Scatterplot of monthly observations against each other is given below. Here, our purpose is to
investigate potential linear or nonlinear patterns that may exist between historic monthly rainfall
data.
0
1
2
3
4
5
6
7
8
9
18
71
18
77
18
83
18
89
18
95
19
01
19
07
19
13
19
19
19
25
19
31
19
37
19
43
19
49
19
55
19
61
19
67
19
73
19
79
19
85
19
91
19
97
20
03
20
09
in.
December Rainfall, 1871-2010
DCA
BWI
IAD

10
We also conducted several simple linear regression analyses for the monthly data. For these
simple linear regression models, we considered all the possible combinations of monthly data
(e.g., each monthly data was regressed on all the other 11 monthly data—in a simple linear
regression setting). Results for significant regression analyses are given below
Regression: January on March
coefficient: 0.1632056
p-value < 0.05 (0.02884227)
Regression: March on January
coefficient: 0.2092128
p-value < 0.05 (0.02884227)
Regression: June on November
coefficient: 0.2443279
p-value < 0.05 (0.03100646)
Regression: November on June
coefficient: 0.1361715
p-value < 0.05 (0.03100646)
Regression: October on November
coefficient: 0.2537366
Regression: November on October
coefficient: 0.149278

11
p-value < 0.05 (0.02168590)
p-value < 0.05 (0.02168590)
Significant regressions at 0.05 level: January and March; June and November; October and
November.
Research Background and Literature Review
Numerical weather prediction (NWP) models tend to provide forecasts that are often biased or
over-predict precipitation accumulation (Berrocal et al., 2008). As a result, several statistical
models for precipitation occurrence and accumulation have been proposed in the literature
(Stidd, 1973; Bell, 1987, Bardossy and Plate, 1992; and Sanso and Guenni, 2004). Most of these
methods make unrealistic assumptions about the distribution of precipitation data which includes
many zero values (i.e., no precipitation), with a right-skewed distribution for precipitation
accumulations greater than zero. Berrocal et al.(2008) proposes a spatial two-stage method which
considers precipitation occurrence first, and then models nonzero precipitation accumulation
under the condition that it has occurred. The nonzero precipitation accumulation is modeled
using a continuous distribution such as exponential density, gamma density, or the mixture of
several densities (Sloughter et al., 2007). We propose a spatio-temporal dynamical model that
takes into account both spatial and temporal structure of data in a two stage model. The proposed
two stage model consists of an occurrence model (stage 1) which predicts the precipitation
occurrence at each location and time point and a precipitation accumulation model (stage 2)
conditioned on the outcome of the occurrence model.
There are several examples of related work on developing statistical models for precipitation
occurrence and accumulation in the literature (Stidd, 1973; Bell, 1987, Bardossy and Plate, 1992;
and Sanso and Guenni, 2004). Most of these methods make unrealistic assumptions about the
distribution of precipitation data, which includes many zero values (i.e., no precipitation), with a
right-skewed distribution for precipitation accumulations greater than zero.
Stidd (1973) is a pioneer work on deriving climatic expectancies of flood or drought from the
mean and variance of a precipitation record. The method is based on the cube root normal
distribution of precipitation. This method does not account for spatial and temporal dependence
and it provides an exploratory data analysis approach to analyzing precipitation data rather than a
statistical modeling attempt. Bell (1987) discusses a model of the spatial and temporal
distribution of precipitation that produces random spatial rainfall patterns defined on a grid with
each grid point representing the average rain rate over the surrounding grid box. This method is
based on a correlated Gaussian random field that exceeds a threshold. The focus of the model is
for use in evaluating sampling strategies for satellite remote-sensing of rainfall.
Bardossy and Plate (1992) discuss a multidimensional stochastic model for the spatio-temporal
distribution of daily precipitation. The rainfall is linked to the atmospheric circulation patterns
using conditional distributions and conditional spatial covariance functions. The model is a
transformed conditional multivariate autoregressive model, with parameters depending on the
atmospheric circulation pattern. The model reproduces both the local rainfall occurrence

12
probabilities and the distribution of the rainfall amounts at given locations. However, the
methodology does not focus on obtaining predictive distributions of precipitation. Sanso and
Guenni (2004) compare ground rainfall with purely deterministic Regional Climate Model
(RCM) simulations within a Bayesian framework. The method considers spatial dependence and
fits a truncated normal model to the observed ground data to represent spatial variability. The
predictive posterior distribution of the spatially aggregated rainfall is obtained and compared to
the RCM simulations.
Sloughter et al. (2007) uses Bayesian model averaging (BMA) as a statistical way of
postprocessing forecast ensembles to derive predictive probability density functions for weather
quantities. Berrocal et al. (2008) proposes a spatial two-stage method which consider
precipitation occurrence first, and then model nonzero precipitation accumulation conditioning
on the occurrence. The nonzero precipitation accumulation is modeled using a continuous
distribution. Our proposed method is an extension of the methodology discussed in Berrocal et
al. (2008) to a spatio-temporal setting.
Predictive Statistical Model
We will consider a statistical model that will utilize data for all three stations (DCA, BWI, and
IAD). Also, we will adopt a spatio-temporal modeling approach in a Bayesian framework. The
spatial aspect of our modeling approach allows for taking into account similarities between
values observed at weather stations that are located closer, ultimately allowing for ―borrowing
strength‖ across data for weather stations. We develop our model with the intention that it can be
easily modified and used for cases where data from more than three stations are available.
The temporal aspect of our model allows us to make realistic assumptions about the data (i.e.,
data are in form of a time series and thus, should not be considered as independent observations).
Our speculation is that, by considering both spatial and temporal structures of the data, our
model will be able to produce better prediction than most existing models which use faulty
assumptions (such as independence over time and space).
Another aspect of our modeling approach that can potentially strengthen the predictive power of
the model is that we consider monthly time series for each month and parameterize a similarity
structure for these data across month (e.g., rainfall values for January tend to get more affected
by the rainfall values of the past few months). So our model assumes annual (within months
variability) temporal effects (i.e., annual trends for each month are accounted for) as well as
monthly temporal effects (between months variability).
In the next phase of the project, we will develop this statistical model for the data from all the
weather stations in the DC area. The validation of the model will be tested using out-of-sample
procedures as well as checking the precision of future predictions.
In particular, the data model is given by
zt Ky t t, t ~ N(0,2)
and the process model is

13
y t HTy t H T1
y t1 t, t ~ N(0, )
Note this model requires data to be normally distributed. This can be achieved using a
transformation of data such as the Box-Cox transformation (DeOliveira et al., 1997).
The proposed dynamical model structure is justified based on the fact that the joint spatio-
temporal process can be factored into conditional models based on a Markovian assumption:
,],|[][}],,1,{|[1
10
T
t
tttt Tt θyyyθY
where the notation [x] denotes the probability distribution of a random variable x, and the
conditional distribution ],|[ 1 ttt θyy depends on a vector of parameters tθ which govern the
dynamics of the spatio-temporal process.
In the dynamical model defined above, t is a spatial error process, and T
H is the ―propagator
matrix‖ which includes parameters that govern the dynamics of the process.
The propagator matrices T
H and
H T1can be modeled in a hierarchical fashion in order to obtain
estimates of the parameters tθ . The estimation of the hierarchical model will be done using
Bayesian estimation where the posterior distribution of unknown parameters can be obtained
using the sampling distribution of data and prior densities of the parameters. Once the estimates
of parameters and models states are obtained a predictive distribution can be obtained for
locations for which we do not have precipitation measurements (denoted by uY for ungauged
locations u
t
uu sss ,,, 21 ) described as }].,,1,{,|[ Ttt
u θYY
In general, the estimation of the propagator matrix is often difficult due to its high
dimensionality. We efficiently parameterize these matrices based on scientific and intuitive
similarity structure between monthly rainfall data. The main assumption we will rely our
modeling structure on is that consecutive months tend to have similar total rainfall values. This
yields a sparse structure for the propagation matrix:
H T
0 0
0 O 0
0 O O
0 0
and H T1
0 0 0
0 O 0
0 O O 0
0 0 0
The proposed structure described above requires estimation of three unknown parameters
T (,)', and
T1 '.
This sparse structure accounts for the effect of consecutive months (e.g., the rainfall values for
January are only assumed to be affected by the values of December through parameter , and
February through , as well as, the effect of the values for January of the previous year through
parameter ). We will also add extra parameters to this sparse structure based on the exploratory

14
data analysis done on the data. In particular, we will add two extra parameters to account for
potential correlation between monthly total rainfall values of January and March, and June and
November. This parameterization is motivated by the exploratory data analysis discussed in the
previous section.
Another aspect of the proposed model is the ability to account for the spatial correlation between
the rainfall values of the three weather stations. This assumption is accounted for in the
covariance structure of the process model (
). The spatial correlation we consider is based on
an exponential covariogram model
R() exp( || d ||),
where the spatial correlation is based on the Euclidean distance (d) and a special range
parameter, (which governs the strength of spatial correlation over spatial locations). Then, the
covariance model can be written as
2R() In .
Here, the symbol represents the Kronecker product of the two matrices. The rationale for
accounting for spatial correlation is that there is spatial variability between the three weather
stations. This spatial variability is shown in the figures shown in the previous section. Although,
in some cases, the amount of variability between the three locations is negligible, in certain years
for certain months, this variability is significant and should be accounted for. For example, see
the plots for January, May, July, and August.

Development of Analytical Tools to Evaluate thePerformance of Low Impact Developments in the District ofColumbia
Basic Information
Title: Development of Analytical Tools to Evaluate the Performance of Low ImpactDevelopments in the District of Columbia
Project Number: 2010DC114BStart Date: 3/1/2010End Date: 1/28/2011
Funding Source: 104BCongressional
District: DC
Research Category: Climate and Hydrologic ProcessesFocus Category: Education, Hydrology, Non Point Pollution
Descriptors:Principal
Investigators: Arash Massoudieh, Pradeep K. Behera
Publications
There are no publications.
Development of Analytical Tools to Evaluate the Performance of Low Impact Developments in the District of Columbia
Development of Analytical Tools to Evaluate the Performance of Low Impact Developments in the District of Columbia1

Development of Analytical Tools to Evaluate the
Performance of Low Impact Developments
Progress Report
Submitted to
DISTRICT OF COLUMBIA WATER RESOURCES RESEARCH INSTITUTE
By:
Dr. Arash Massoudieh (PI)
Department of Civil Engineering
Catholic University
Dr. Pradeep Behera (co-PI)
Department of Engineering, Architecture & Aerospace Technology
University of the District of Columbia
May 2011

Progress Report May 10, 2011
DC Water Resources Research Institute Page 2 of 2
Summary
The goal of this project is to develop an urban watershed and water quality model to assess the
impact of construction of various types of Best Management Practices (BMPs) and Low Impact
Development (LID) strategies on the loads of various water quality constituents discharging into
the water bodies around the District of Columbia. For this purpose an urban watershed model
will be developed using the EPA SWMM model for a region at the eastern part of the city of
Washington. Loads of TSS, and nutrients will be calculated for three water years including a wet
year, a small year and an average year. These simulations will serve as the baseline scenarios.
The impacts of various low impact development strategies including retention and detention
basins, infiltration ponds, sand filters, rain barrels and green roofs and permeable pavement will
then be incorporated into the model. The LID and BMPs will be incorporated as per-area cover
and will influence the amount of runoff per area being generated and also in some cases will
impact the water quality of the storm runoff.
Objectives
To evaluate the impact of various scenarios of LID and BMP implementation on the
quantity and quality of water discharging into Anacostia River.
Proposing cost-effective management options for BMPs placement in the District.
Proposing a decision support system to assist with a phased approach toward TMDL
compliance.
The project will benefit the public health and the water quality by leading to a more
sustainable, cost-effective and affordable stormwater infrastructure.
Study Site and Data Availability:
Figures 1-3 shows the locations of the study sites chosen for the research. The location is only
composed of that part of eastern Washington, DC that is covered by separate stormwater and
municipal wastewater network (Figure 2). This area was selected to avoid the complications
associated with the mixing of municipal wastewater with the stormwater. Figure 1 shows the
study area in the District of Columbia. The central part of the City of Washington is covered by
combined sewer system and the generated runoff in those areas is mostly treated at the Blue
Plains wastewater treatment facility except for during the occurance of very large storms when
the capacity of the plant is not adequate for the volume of stormwater and municipal wastewater
and the water is discharged into the Anacostia River, untreated. There are two areas, one in the
east side and the other in the west side of the district that are covered by separate stormwater
networks and the stormwater generated in those areas are mainly discharged into the surrounding
water bodies. The eastern region is selected for this study. We have gathered most of the data
that is needed for the SWMM modeling including precipitation records, and topographic maps

Progress Report May 10, 2011
DC Water Resources Research Institute Page 3 of 2
and impervious and pervious areas. We have contacted DCWASA in order to obtain the sewer
network map in a GIS compatible format. However our attempts have been unsuccessful so far
but we have been promised to be provided with the ArcGIS shape files for the DC sewer
network. We currently have a non-GIS map of the sewer system and if we don’t succeed in
obtaining the GIS maps we will use this map to approximate the sewer network configuration
(Figure 4). As for flow, suspended solids and quantity data, we have got some data from the DC
Department of Environment DDOE, however there are not adequate amount of data available for
the discharge point of the catchment considered for this study. Topographic maps are
downloaded in Arcgrid format from the USGS National Elevation Dataset (NED) website. This
DEM data has a resolution of 1 Arc seconds (~30m). Rain data is available as hourly
precipitation data from Reagan National Airport Station (Figure 5).
Developing the SWMM flow and water quality model and the planned simulations
We are currently at the stage of developing the SWMM model. Due to the delay in the
subcontract being issued, the project was started later than planned. A no-cost extension until the
end of September 2011 has been approved by DCWRRI and we are planning to finish the model
development, calibration and also running several LID and BMP scenarios by that time.
Continuous yearly simulations are planned to be performed for baseline and the LID and BMP
implementation scenarios. The precipitation from three representative years will be considered
for simulation including a wet year, a dry year and an average year. The impacts of various LID
and BMP practices will be evaluated for all the three years. An exponential build-up function
will be used to model the accumulation of pollutants on the surfaces during the dry periods
between events. The range of the parameters of the exponential build up model will be obtained
from literature but they will be adjusted during the model calibration. Also an exponential wash-
off curve will be used.
The effectiveness of various LID approaches, including several scenarios of installation of bio-
retention cells, infiltration trenches, porous pavements, and rain barrels will be studied. LID units
will be represented by a combination of vertical layers whose properties are defined on a per-
unit-area basis (Rossman, SWMM User’s Manual, EPA). The impact of clogging on the long-
term performance of porous pavements and infiltration trenches will be considered in the model.
The porous pavement scenario will be implemented into the model by considering all or part of
the parking lots in the area of study to be made of porous pavement. The impact of transforming
the main roads’ surfaces to porous pavement will not be studied due to the fact that a cost-
effective and structurally durable method of using porous pavement for main roads have not been
developed yet and also the impacts of clogging on the long-term efficiency of porous pavement
has not been studied rigorously yet.

Progress Report May 10, 2011
DC Water Resources Research Institute Page 4 of 2
Figure 1: The extents of the study area

Progress Report May 10, 2011
DC Water Resources Research Institute Page 5 of 2
Figure 2: The extent of the study area and the regions of the city of Washington Covered
by Combined and separate sewer network

Progress Report May 10, 2011
DC Water Resources Research Institute Page 6 of 2
Figure 3: Topographic contour lines of the study site.

Progress Report May 10, 2011
DC Water Resources Research Institute Page 7 of 2
Figure 4: The map of the District of Columbia Sewer network

Progress Report May 10, 2011
DC Water Resources Research Institute Page 8 of 2
Figure 5: Daily Precipitation data at DCA meteorological station
Current Status of the project
Currently, almost all of the geospatial and temporal data required for the project have been
collected and stored in a geo-referenced relational database system using MS ACCESS and
ArcGIS. An undergraduate student (Tri Mihn Le) has been hired at CUA and will be assisting
fulltime on the project during the summer. He has been trained SWMM and some GIS skills by
Dr. Massoudieh. The SWMM model development is in progress.
Publications
Two journal review papers have been submitted partly as a result of this grant. In both papers
DCWRRI program have been acknowledged. One of the papers has been accepted and the
second one is under review:
Sharifi, S., A. Massoudieh, M. Kayhanian, (2011), A Stochastic Storm-Water Quality
Volume Sizing Method with First Flush Emphasis, Water and Environment Research, Accepted.
Progress Report May 10, 2011
DC Water Resources Research Institute Page 9 of 2
Sharifi, S., and A. Massoudieh, “A Novel Evolutionary Data-Driven Model Identification
Framework Using NSGA-II for the Analysis of Environmental Phenomena”, Submitted to
Hydroinformatics.
References
Rossman, (2004), L. A., Storm Water Management Model, User’s Manual, Version 5.0,
Water Supply and Water Resources Division, National Risk Management Research Laboratory,
Cincinnati, OH 45268.

Determination of Seasonal Source Variation ofHydrocarbons, Fatty Acids, Organics and Nutrients in theAnacostia River: Stable isotope Ratios of SpecificCompounds
Basic Information
Title: Determination of Seasonal Source Variation of Hydrocarbons, Fatty Acids, Organicsand Nutrients in the Anacostia River: Stable isotope Ratios of Specific Compounds
Project Number: 2010DC115BStart Date: 3/1/2010End Date: 2/28/2011
Funding Source: 104BCongressional
District: DC
ResearchCategory: Biological Sciences
Focus Category: Sediments, Toxic Substances, EcologyDescriptors: None
PrincipalInvestigators: Stephen E. MacAvoy
Publications
There are no publications.
Determination of Seasonal Source Variation of Hydrocarbons, Fatty Acids, Organics and Nutrients in the Anacostia River: Stable isotope Ratios of Specific Compounds
Determination of Seasonal Source Variation of Hydrocarbons, Fatty Acids, Organics and Nutrients in the Anacostia River: Stable isotope Ratios of Specific Compounds1

Determination of Seasonal Source Variation of
Hydrocarbons, Organics and Nutrients in the Anacostia
River: Stable Isotope Ratios of Specific Compounds
Progress Report
Submitted to
DISTRICT OF COLUMBIA WATER RESOURCES RESEARCH INSTITUTE
By
Dr. Stephen MacAvoy (PI)
Assistant professor
Department of Environmental Science
American University
May 2011

2
2
Progress Summary
A six month no-cost extension was granted March 3, 2011 so the final report of the
project will be delivered by October 31, 2011. Water, sediment, and (when possible)
invertebrate samples have been collected (in most cases monthly) since April 2010 and
have continued through May 2011. We have completed d13
C and d15
N on organics
(sediment and water column particulate organic matter (POM)) from the first 9 months or
so of the collections. Hydrocarbons have been extracted from those same samples and
have been characterized with the GC/MS. Also, characterization of the geochemistry of
Anacostia waters from our field sites has been and continues to be undertaken (analysis
of inorganics, including Ca, Mg, Na, S, K, P, B, Ba, Ni, Co, plus nutrients, including
NO3, NH4, PO4, and total organic carbon (TOC). The examination and interpretation of
our results is ongoing, however I have included in the progress report our initial analysis,
which has been presented at the Annual Meeting of the American Geophysical Union,
December 2010. These results will be written up as a manuscript for peer reviewed
publication summer 2011. We have yet to decide which of our hydrocarbon extracts
should be selected for d13
C characterization. Generally, only samples with compounds of
particular interest (branched or odd chain fatty acids, or petrochemicals for example)
should be selected because compound specific isotope analysis is a complex and
expensive procedure. We have to send our sediment and POM samples out for d34
S
analysis. Due to expense, we had to delay this analysis until the funding for the project
was in place. We expect to have all the data collected by early fall, and will review what
we find in the final report.
Below please find our initial analysis of our results from the geochemical/nutrient work.
Seasonal nutrient dynamics in the Anacostia River (D.C., USA): geochemistry and
hydrocarbon biomarkers*
Stephanie L. Sarraino1, Deborah E. Frantz
2, Stephen E. MacAvoy
1
1American University, Department of Environmental Science, Washington DC, 20016
2American University, Department of Biology, Washington DC, 20016
* This paper was presented at the Annual Meeting of the American Geophysical Union,
San Francisco, December 2010 B43A-0446 poster session

3
Abstract
The seasonal biogeochemistry of the urban Anacostia River (Washington D.C. USA) was
investigated. Chemical parameters examined include: inorganics (Ca, Mg, Na, S, K, P,
NO3, NH4, PO4, B, Ba, Ni, Co); fatty acids and other hydrocarbons; C, N and S stable
isotopes; and other water chemistry indicators (hardness, salinity, alkalinity, soluble salts,
SAR, TDS). Between April and September 2010, water and sediment were sampled from
three tidal freshwater sites along the Anacostia River (UP, MID, and DOWN). Stable
isotope analysis of surface sediments revealed a lack of temporal variation in the sources
of carbon and nitrogen to the Anacostia. 15N values ranged from +2 to +6‰, with the
most enriched sediment occurring at DOWN (+4 to +6‰). While these values do not
reflect sewage inputs, an overall enrichment is observed between spring and late summer,
which may indicate microbial activity. 13C values exhibited slightly more variation and
ranged from -30 to -25‰. All sites showed relative depletion in early summer compared
with spring or late summer/fall. Water nutrients (NO3 and NH4) demonstrate seasonal
fluxes; all sites show a peak in nutrients during early summer (June) and subsequent
decline. Overall, NO3 ranges from about 0.2 to 3.3 mg/L and NH4 ranges from 0 to 1.7
µg/L. Preliminary GC-MS analysis of isolated fatty acids does not explicitly suggest
bacterial or higher plant dominance in the spring; however, some notable compounds
were identified, such as the PAH fluoranthene, naphthoquinone, and testosterone, as well
as a number of cholesterols and other steroids. Principle Component Analysis (PCA) of
the chemistry data suggests mineral geochemical variables, rather than inorganic
nutrients, are the driving forces of observed trends.
Introduction
The Anacostia River is a major waterway, encompassing 440 km2, located in
Washington, D.C. It is also one of the nation’s 10 most contaminated rivers, containing
sewage, metals, PAHs, and PCBs, and has been cited by the EPA as a "major area of
concern" for the Chesapeake region (Maa 2008). Several studies have examined heavy
metal geochemistry in the river, but its biogeochemical processes remain largely
unstudied (MacAvoy et al. 2009). This paper examines nutrient dynamics, organic
material sources, and microorganism community makeup, as well as the seasonal trends
in these parameters.
Objectives
This research seeks to elucidate seasonal nutrient dynamics and organic material sources
of the Anacostia River by addressing the objectives: 1) Determine if seasonal component
to water nutrient concentrations and sources exists, and 2) Identify biogeochemical
controls within the river and discern which geochemical and nutrient variables are driving
those controls.

4
4
Methods
Sampling was conducted at three sites (UP, MID, DOWN) along a downstream gradient
originating in Bladensburg, Maryland (Plate 2). Water column and sediment samples
were collected in triplicate from each site on a once monthly basis, starting in April,
2010. Water samples were immediately filtered onto GFF once in lab, while replicates
were sent to Cornell’s Nutrient Analysis Lab for analysis of inorganics (Ca, Mg, Na, S,
K, P, NO3, NH4, PO4, B, Ba, Ni, Co). Sediment samples were dried for 72 hours at
60°C.
Extracted sediment samples and water column particulate organic matter (POM) were
sent to UC Davis’ Isotope Analysis Facility for 13
C and 15
N isotope analyses using a PDZ
Europa ANCA-GSL elemental analyzer interfaced to a PDZ Europa 20-20 isotope ratio
mass spectrometer. Fatty acids were extracted from GFFs and sediment via Soxhlet
extraction followed by saponification. FAMEs were analyzed using a Thermo Polaris Q
GC/MS. A Principle Components Analysis (PCA) was applied to nutrient variables to
elucidate relationships of covariance within the dataset (Dennis et al., 1995).
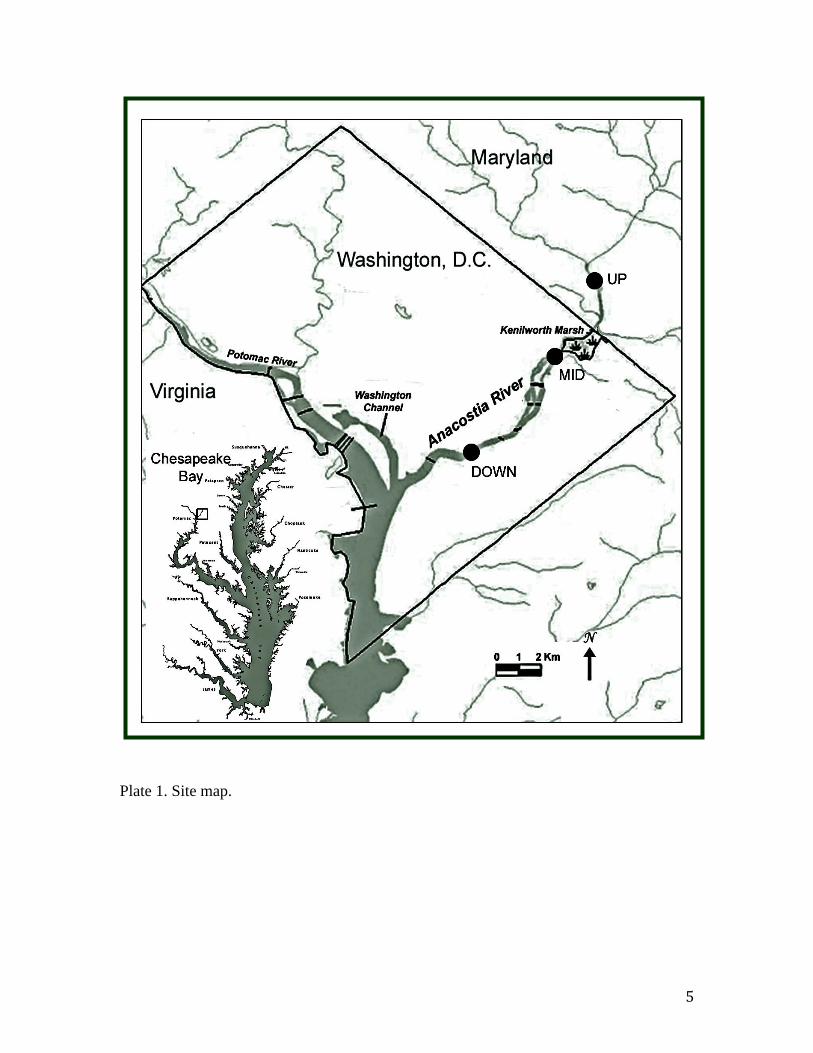
5
Plate 1. Site map.

6
6
Figure 1 Sediment Nitrogen (a) and Carbon (b) Isotope Values over Time: (a) 15N
values are observed to increase from April to July at all sites. Sediment at DOWN shows
the most enriched isotope signature, which could reflect its proximity to a combined
sewage outflow. Overall, sediment is less enriched than would be expected if sewage is a
source; N source appears to be autochthonous (b) 13C shows similar trends at all sites,
and becomes more enriched from ate May to September. Values range from -25‰ to -
30‰, and are not reflective of a terrestrial source.

7
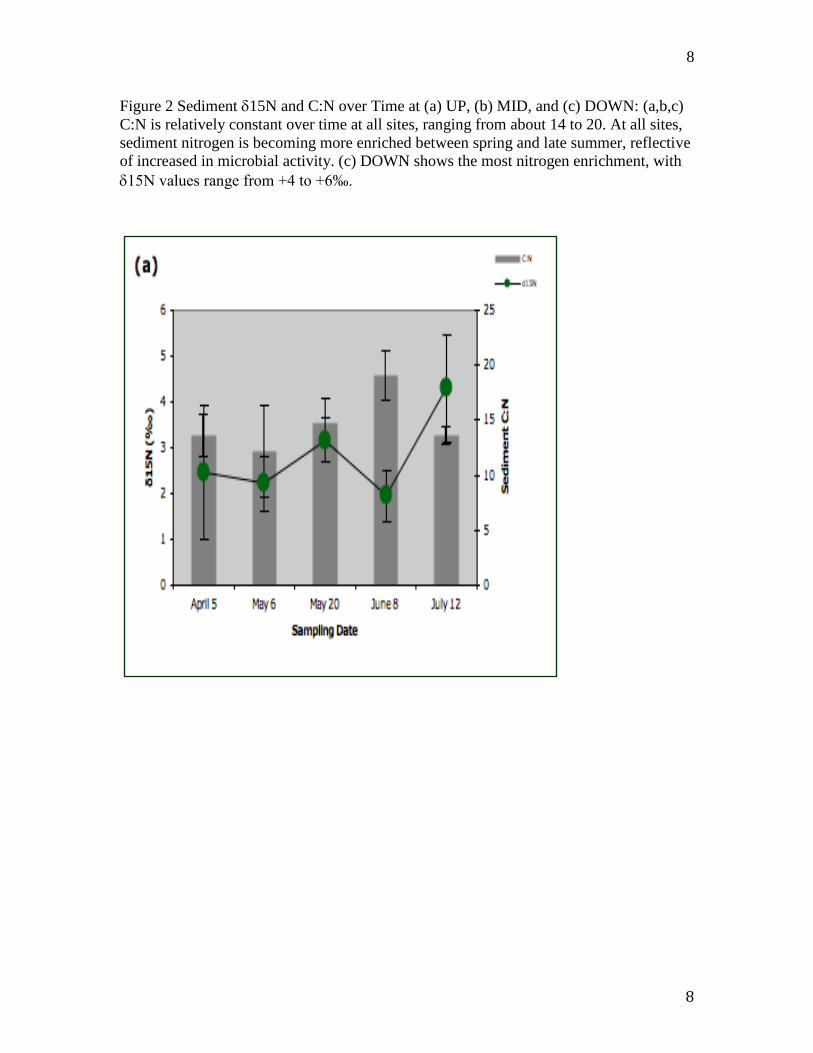
8
8
Figure 2 Sediment 15N and C:N over Time at (a) UP, (b) MID, and (c) DOWN: (a,b,c)
C:N is relatively constant over time at all sites, ranging from about 14 to 20. At all sites,
sediment nitrogen is becoming more enriched between spring and late summer, reflective
of increased in microbial activity. (c) DOWN shows the most nitrogen enrichment, with
15N values range from +4 to +6‰.

9

10
10

11
Figure 3 15N versus C:N (a) and Soil [N] (b) shows Clustering by Site: clustering in
figures 3 (a) and (b) suggests that sediment [C] is highly variable between sites UP and
DOWN.
3a.

12
12
3b.

13
Figure 4 Water Column Nitrogen (NO3 and NOH4) Trends over Time: At (a) UP, (b)
MID, and (c) DOWN. Nutrient levels are within similar ranges at all sites and are
variable across the time span of sampling. (b) a gradual increase in both parameters is
exhibited at MID, with a peak in June and subsequent decline. (c) a pulse of NO3 is seen
in May, uncouple with any NH4 increase.

14
14

15
Figure 5 Biplots of PCA at UP (a), MID (b), and DOWN (c): PCA including all water
and sediment parameters reveals that each site has distinct controls. There appears to be
a strong geochemical control to explain most of the dataset (PC1), while PC2 highlights
nutrient drivers such as 15N and C:N. (b, c) there is a strong correlation between Zn
levels and 15N at both sites MID and DOWN. (a, c) at UP and DOWN 13C is strongly
associated with geochemical variables.
5a.

16
16
5b.

17
5c.
Conclusions
1) A seasonal component is present in water nutrient concentrations; however variation is
sediment organic sources (15N, 13C, C:N) appears more closely associated with site
rather than collection date.
2) 13C (-25 to -30‰) are representative of autochthonous production.
3) 15N values ranged (+2 to +6), but UP showed the most enrichment (+4 to +6).
Values are not reflective of sewage inputs. 15N values also show a gradual enrichment
from April to July, which may suggest the increase is bacterial mobilization.
4) C:N ratios of between 13 and 19 suggest autochthonous sources of sediment organics.
5) Heterogeneity between sites values is highlighted in Figure 1(a) and Figure 4. PCA
reveals strong geochemical (mineral) involvement in PC1 and more nutrient involvement
in PC2. Each site is seen to have distinct biogeochemical controls (Figure 5).

18
18
Acknowledgments
The authors would like to thank the Cosmos Club Foundation and WRRI/USGS proposal
number for partial funding of this study.
References
Ballentine, D. C., S. A. Macko, et al. (1996). "Compound specific isotope analysis of
fatty acids and polycyclic aromatic hydrocarbons in aerosols: Implications for biomass
burning." Organic Geochemistry 25(1-2): 97-104.
Dennis, T. E., S. E. MacAvoy, et al. (1995). "The association of water chemistry
variables and fish condition in streams of Shenandoah National Park (USA)." Water Air
and Soil Pollution 85(2): 365-370.
Maa, J. P. Y. (2008). "Sediment erosion characteristics in the Anacostia River." Journal
of Hydraulic Engineering-Asce 134(8): 1102-1109.
MacAvoy, S. E., E. C. Ewers, et al. (2009). "Nutrients, oxygen dynamics, stable isotopes
and fatty acid concentrations of a freshwater tidal system, Washington, DC." Journal of
Environmental Monitoring 11(9): 1622-1628.

Speciation of Some Triorganotin Compounds in Anacostiaand Potomac River Sediments using NMR Spectroscopy(Phase II)
Basic Information
Title: Speciation of Some Triorganotin Compounds in Anacostia and Potomac RiverSediments using NMR Spectroscopy (Phase II)
Project Number: 2010DC116BStart Date: 3/1/2010End Date: 2/28/2011
Funding Source: 104BCongressional
District: DC
Research Category: Water QualityFocus Category: Sediments, Water Quality, Toxic Substances
Descriptors: NonePrincipal
Investigators: Xueqing Song
Publications
There are no publications.
Speciation of Some Triorganotin Compounds in Anacostia and Potomac River Sediments using NMR Spectroscopy (Phase II)
Speciation of Some Triorganotin Compounds in Anacostia and Potomac River Sediments using NMR Spectroscopy (Phase II)1

Speciation of some tributyltin compounds in Anacostia and
Potomac River sediments using 119
SnNMR spectroscopy
Final Report
Submitted to
DISTRICT OF COLUMBIA WATER RESOURCES RESEARCH INSTITUTE
By:
Dr. Xueging Song (PI)
Associate Professor
Chemistry Department
University of the District of Columbia
February 2011

2
Abstract
The presence of triorganotin in sediments has been regarded as long-term threat to marine and
estuarine environments due to its persistence and toxicity to marine organism, such as oysters
and fish. Tributyltins were used in antifouling paints on ship hulls because of its strong biocidal
effect. These applications are inevitably associated with triorganotin releases into the
surrounding water, where it accumulates in suspended matter and in sediments. The overall
objective of this research project was to investigate the environmental speciation of tributyltin
compounds that are leached from antifouling paints into DC waterways, such as the Anacostia
and Potomac Rivers, as a function of pH and to determine the transformation through interaction
with the river sediments. The speciation of three tributyltin compounds (TBTs) -- tributyltin
chloride (TBTCl), Bis(tributyltin) Oxide (TBTO) and tributyltin acetate (TBTOAc) under
varying pH conditions (5, 7 and 9) -- was studied by NMR spectroscopy in both anaerobic and
aerobic Anacostia River sediments. The results from this study will provide individuals and/or
government agencies interested in water quality and planning of Anacostia and Potomac rivers
with knowledge of the fate of these triorganotins once they are leached into these rivers. This
information will enable those making decisions about the water quality to better assess the long
term impact of these chemicals on the aquatic environment. In addition, understanding the long
term environment effects of these compounds, particularly on the fish population in the
Anacostia and Potomac rivers is critical, since many of the fish taken from these rivers are
consumed.
Objectives
The overall objective of this research project was to investigate the environmental
speciation of tributyltin compounds that are leached from antifouling paints into DC waterways,
such as the Anacostia and Potomac Rivers, as a function of pH and to determine the
transformation through interaction with the river sediments. Speciation of triorganotins is of
major concern due to their species-specific toxicity. Tributyltins were used in antifouling paints
on ship hulls because of its strong biocidal effect. These applications are inevitably associated
with triorganotin releases into the surrounding water, where it accumulates in suspended matter
and in sediments. These compounds have been found to be toxic to other non-targeted marine
organism, such as oysters and fish. The species that were produced as a result of these
interactions were determined using NMR spectroscopy. Compared with other analytical
methods, such as derivatization, pressurized liquid extraction, liquid chromatography –
inductively coupled plasma mass spectroscopy, and Mossbauer spectroscopy, NMR
spectroscopy offers an advantage in that it permits direct observation of the interaction between
the triorganotins and the sediments.

3
Introduction
The Anacostia River and Potomac River are two major waterways located in the District of
Columbia. Each year these rivers play host to extensive recreational activities for the residents
of the metropolitan area. Two classes of pollutants that find their way into Anacostia and
Potomac rivers, as well as other waterways that have high boat traffic, are tributyltins (TBTs)
and triphenyltins (TPTs) since they are the toxic additives added to antifoulant marine paints. 1
Marine paints are used to inhibit the attachment of barnacles, sea grass, hydroids and other
marine organisms to the bottom of ships and other submerged marine structures. Organotin
marine paints contain as much as 20% by weight of antifoulant.1 One mode of entry these
triorganotins into the various waterways is through their release from vessels and underwater
structures, such as harbors, estuaries, marinas and bays, than in open waters. The use of
triorganotin compounds in the United States has been restricted by the Organotin Act which
prohibits the use of organotin-based paints on vessels smaller than 25 meters. 2
However, vessels
larger than 25 meters may still use marine paints containing organotins and a number of these
larger vessels still travel these rivers, particularly, the Anacostia River where a naval shipyard is
located.
Studies have shown that these organotin compounds still possess a major threat to the
aquatic environment even after government regulations have restricted their use. 3,4
In the
aquatic environment, triorganotin compounds are known to have low aqueous solubility and
mobility, and exhibit strong binding to sediments. These compounds are therefore easily
absorbed by particular matter in water, which upon settling to he bottom, can be incorporated
into the sediment.5 Any disturbance of the sediment will permit the direct and continuous re-
introduction of the organotins back into the water column, where they can have adverse effect on
non-targeted species such as crustaceans and fish. 6
The presence of triorganotin in sediments has been regarded as long-term threat to marine
and estuarine environments due to its persistence. Understanding its fate in the environment is
therefore of primary importance to prevent its migration. TBT and TPT sorption were found to
be reversible, indicating that contaminated sediment may release triorganotins to overlying
waters following sediment disturbance.7 Hence, the approach to understand the conditions affect
the mobility of tin becomes a significant. While there have been numerous speciation studies of
organotin compounds in various bodies of water around the world, there have been no similar

4
extensive studies in DC waterways. While most investigators have focused on the determination
of organotin species and their concentration in the environment, only a few studies has been
initiated to study the interactions of the organotins with sediments. Thus, a study of the
speciation of triorganotins in the sediments of Anacostia and Potomac rivers as a function of pH
to evaluate their interaction with sediments would be essential for the understanding of the
effects of triorganotins on the aquatic environment. The results from this study will alert those
responsible for water quality to the long term impact of these hazardous chemicals and,
therefore, allow them to plan accordingly. The results from this study will provide individuals
and/or government agencies interested in water quality and planning of Anacostia and Potomac
rivers with knowledge of the fate of these triorganotins once they are leached into these rivers.
This information will enable those making decisions about the water quality to better assess the
long term impact of these chemicals on the aquatic environment. In addition, understanding the
long term environment effects of these compounds, particularly on the fish population in the
Anacostia and Potomac rivers, is critical since many of the fish taken from these rivers are
consumed. Consuming large amounts of these fish could have an adverse impact on the health
of individuals since triorganotin are known to have mammalian toxicities.
There are numerous analytical procedures in the literature for the determination of
organotin compounds. Two recent reviews 8,9
have indicated that the method most employed for
the quantitative determination of organotin species in sediments involves some types of
derivatization of the organotin species followed by species detection. For example, the
determination of organotin by gas chromatography (GC) involves four steps: (1)
extraction/concentration; (2) derivatization (hydridization or alkylation); (3) separation; and (4)
detection. 8 However, strong interaction between triorganotins and sediments can bias the
results.9 Furthermore, the accuracy of butyl- and phenyltin determination is hampered by the
lack of certified reference materials.9 It would be more advantageous to examine the original
organotin species than to study their derivatized analogs, since metals and any organic species
contained in the sediment can interfere with the derivatization of the organotin species.10-12
Mossbauer spectroscopy has been used in this lab to directly examine the original species in
sediments.13-15
However, two unsolved problems in the speciation of organotin using Mossbauer
spectroscopy make it difficult to get accurate information on the structure of the organotin
species in sediments. First, due to low resolution of the Mossbauer spectrometer towards tin, to

5
get a perfect Mossbauer spectrum, enough triorganotin compounds (0.1 g) have to be spiked with
the sediment (100 g). In order to get a sediment sample close to nature, it usually will take at
least 1 month to prepare a sample. The interaction between the unknown organic species
contained in the sediments and the triorganotins will normally result in more than more organotin
species in the sediments, it is not possible to differentiate these similar organotin species by
using Mossbauer spectroscopy only.
A method that would eliminate this problem is NMR spectroscopy, since this method would
allow direct examination of the organotin species in the sediments at a very low concentration.
Lower concentration of tin in sediments would be environmentally closer to the natural sediment
samples. The use of NMR spectroscopy for the elucidation of the molecular structure of the
organotin compound is well documented in the literature.16
Specially, 117/119
Sn NMR provides a
probe of the tin atom that is sensitive to oxidation number and the ligands around the tin atom. It
has been established that the coordination number of the tin atom is related to the 119
Sn Chemical
shift. For trialkyltin complexes, four coordinate tin has 119Sn chemical shift ranging from about
+200 ppm to -60 ppm, five coordinate tin from -90 to -190 ppm, and six coordinate tin from -200
to -400 ppm. 16
For butyltin complexes, tributyltins with a coordination number 4 or 5 around tin
atoms has 119
Sn chemical shift in the rang 200ppm to 60 ppm, di butyl tin with a coordination
number of 6 or even higher has 119
Sn chemical shift in the rang -80ppm to -400 ppm, Small
change of the coordinate environment to the tin atom will sensitively be reflected on the 119
Sn
NMR. Therefore, 119
Sn NMR is an ideal analytical tool to record the complicate interaction
between the triorganotin complexes and the sediments.
Methods and Materials
Triorganotin Compounds
Tributyltin chloride (TBTCl) and bis-tributyltin oxide (TBTO) were obtained from M &
T Chemicals, Inc., Rahway, NJ, USA. Tributyltin acetate (TBTOAc) were purchased from
Gelest, Inc., Tullytown, PA. All the compounds contained the normal abundance of 119
Sn and
were used as received without further purification to spike the sediment samples.
Collection of Sediments
Sediment samples were obtained as grab samples from the Anacostia River (Latitude: 38o
52' 17'' N; Longitude: 77o
00'18’'W) in the DC metropolitan area. The samples were kept frozen

6
until they were ready to be spiked. Aerobic sediments were prepared by allowing the anaerobic
sediments to dry in air. The color of the sediments changed from black/greenish to black to
brown.
Speciation Studies
The pH of the deionized water was adjusted to the desired values with either HCl or NaOH
solutions prior to the addition of the triorganotin compounds and sediments. The anaerobic
sediments were thawed in water to prevent oxidation. The following procedure was used in all
experiments. Five g of aerobic or anaerobic sediment were spiked with 50 mg of the tributyltin
compound. The mixture was then covered with 100 mL of deionized water. The mixture was
shaken mechanically in a closed vessel in the dark for two weeks at room temperature and
remained in the dark at room temperature for an additional week. The sediment samples will
then be collected by gravity filtration and extracted with three portions of 15 mL of
dichloromethane. The combined dichloromethane layer will be concentrated to about 5 mL using
rotary evaporator and then sent for 119
Sn NMR analysis.
119
Sn NMR Analysis
All NMR measurements were made on a Varian Unity Inova 500 MHz spectrometer. Sample
and instrument temperatures were controlled at 298 K. Proton-decoupled 13
C and 119
Sn spectra
were acquired with WALTZ decoupling. 119
Sn chemical shifts were referenced to tetramethyltin
externally. To identify the organotin species present, the experimental spectra were compared to
spectra of known organotin compounds. Spectra of the pure compounds were recorded and used
for comparison.
Results and Discussions
For preliminary studies, 8 sediment samples spiked with TBTs were prepared. The
Table 1. Typical spectra for the spiked aerobic and anaerobic sediments are shown in Fig. 1-8.
The preliminary data also indicated that changes in the pH values did not affect the
decomposition of the tributyltin compounds in the same sediments. For example, TBTCl spiked
with same Sediments at pH 5 (Fig 1) and 7 (Fig 2) shows very similar pattern in NMR spectra.
However, different patterns were observed in NMR spectra for TBTs in anaerobic and aerobic

7
sediments samples. Compared with Fig 31 (aerobic sample at pH 7), anaerobic TBTOAc sample
was decomposed more at same speciation time (2 weeks) Except the major signal from un-
decomposed hydrated TBT, two signals at 105 (medium) and -341 (weak) ppm were also
observed as shown in Fig 4. This would suggest that the organisms in the sediments are
responsible for the decomposition of the TBTs. Since anaerobic and aerobic sediments have
different organism composition, different pattern of decomposition are observed. This
decomposition was also clearly shown in the 1H NMR of TBTOAC samples. The typical acetate
CH3 proton with chemical shift around 2.1 ppm is missing in the 1HNMR spectrum (Fig 5). The
multiplets from 0.8-1.7-ppm are ascribed for butyl group in the sample. There are no other
protons in the sample except typical protons from water around1.6 ppm. Only very weak signals
in the range of 0-400 ppm were observed which are ascribed to decomposition of the TBTs in
sediments. This indicated that two weeks duration was not long enough to decompose TBTs in
sediment.
For these reason, further studies have focused on the anaerobic and aerobic samples spiked
in 2 weeks and 8 weeks at pH 7. Total 12 sediment samples spiked with TBTs were prepared.
different pH are listed
in Table 2 for TBTCl, TBTO and TBTOAC.
The 119
Sn NMR
compare with pure TBTs, no sediments samples have chemical shifts same as the pure one. This
may be due to the formation of hydrated tributyltin complexes in sediment samples. Most of the
hydrated TBT remained unchanged during the two weeks speciation. This is based on the
observation that the major peaks around 158 ppm remain as medium to strong in the 119
Sn NMR
spectra. This hydrated tributyltin species could be Bu3Sn(OH2)n+.
The equations shown in scheme 1 account for the possible mechanism of the formation of
the hydrated tributyltin species:

8
Bu3SnOAc + H2O Bu3SnOH + HOAc
Bu3SnOSnBu3 + H2O 2Bu3SnOH
Bu3SnOH + H+ Bu3SnOH2+
Bu3SnOH2+
£¨n-1)H2O+ Bu3Sn(OH2)n+
Scheme 1
It was also found that the tributyl hydroxide (TBTOH) and hydrated tributyltin species
Bu3Sn(OH2)n+
in sediments will further decompose to more unknown tributyltin species if
enough time is given for the speciation. As shown in Fig 6 and 7, TBTOAC was converted to
hydrated TBTs, then this hydrated TBT was converted to two major unknown species with
chemical shift around -11ppm and-109 ppm. Possible structures for these two unknown species
could be Bu3Sn(OH2)2 +
(-11ppm) and Bu3Sn(OH2)3+ (-109 ppm) .
Bu3Sn+ + H2OBu3SnOH2+
Bu3Sn+ + HS-Bu3SnSH
Bu3Sn+ + S2- Bu3SnSSnBu3
Bu3Sn+ + CO32- (Bu3Sn)2CO3
Scheme 2
Chemical shifts in 60ppm to 200 ppm are typical for four coordinated tributyl tin. Most of
the samples have several minor peaks other the major peak around 157 ppm. This is indication
of the formation of the Bu3Sn+ cation in the decomposition process, minor species could be
formed with different anions such as carbonate, sulfide and hydrogen sulfide. The peaks from
70-90 ppm could be assigned to tributyltin sulfides while the peaks around 110ppm could be
assigned to tributyltin carbonate (Scheme 2).
Chemical shifts around -340.9 ppm is an indication of dealkylation to di or monobutylatin
species, though the amount of decomposition is low as the signals around -341 ppm are all very
weak (Fig. 7). This would suggest that dealkylation of TBT takes a longer time than 8 weeks in
sediment samples. A Comparison of the strength of signal of dealkylation species and

9
undecomposed TBT species revealed that only less than 5% was decomposed to less toxic DBT
or MBT. This is different from the conclusion we made in the studies on the speciation of
triorganotins using Mossbauer Spectrometry when all the TBT were shown in Mossbauer spectra
to convert to other hydrated TBT species. This would suggest that NMR spectroscopy is more
sensitive spectrometer for detection of organotin species than Mossbauer spectrometer.
References
1. A. G. Davies and P. J. Smith, In Comprehensive Organometallic Chemistry, G. Wilkinson, F.
G. A. Stone and E. W. Abel (eds.), Pergamon Press, Oxford, Great Britain, 1982, Vol. 2,
p.613.
2. Federal Register, 53, 39022 (1988).
3. Y. K. Chau, R. J. Maguire, M. brownFYang and S. P. Batchelor, Water Qual. Res. J.
Canada, 32, 453(1997).
4. W. R. Ernst, G. Julien, P. Henningar and I. Hanson, Surveill. Rep. EPS (Environ. Can.; EPS-
5-AR-99-1) i-iv, 1 (1999).
5. S. J. Blunden, A. Hobbs and P. J. Smith, In: Environmental Chemistry, H. J. M. Bowen, (ed),
the royal Society of Chemistry, London, 1984, p. 49.
6. S. Dodson, R. Cabridenc, M. Gilbert and P. G. Jenkins, Tributyltin Compounds, Environ.
Health criteria 116, World health Organization, Geneva, 1990, p. 132 and reference therein.
7. P. H. Dowson, J. M. Bubb and J. N. Nester, Appl. Organomet. Chem., 7, 623(1993).
8. M. J. F. Leory, P. Quevauviller, O. F. X. Donard and M. Astruc, Pure & Appl. Chem., 70,
2051 (1998).
9. M. Abalos, J. M. Bayona, R. Compano, M. Granados, C. Leal and M. D. Prat, J.
Chromatogr. A., 788, 1 (1997).
10. O. F. X. Donard, L. Randall, S. Rapsonmanikis and J. H. Weber, Intern. J. Environ. Anal.
Chem., 27, 55 (1986).
11. P. J. Craig and S. Rapsonmanikis, Inorg. Chim. Acta, 80, l19 (1983).
12. P. Quevauviller, F. M. Martin, C. Belin and O. F. X. DOnard, Appl. Organomet. Chem., 7,
149 (1993).
13. G. Eng, X. Song and L. May, Hyperfine Inter., 170, 117 (2006).
14. X. Song, A. Zapata, L. May and G. Eng, Main Group Chem., 4, 39 (2005).
15. G. Eng, D. Desta, E. Biba, X. Song and L. May, Appl. Organometal. Chem., 16, 67 (2002).
16. G. Davies and P. J. Smith, in Comprehensive Organometallic Chemistry, G. Wilkinson, F. G.
A Stone and E. W. Abel (eds.), Vol. 2, Pergamon Press, New York, 1982, p. 519.

10
Table 1. 119
Sn NMR chemical shifts for TBTs spiked with sediment samples from the Anacostia
River.
TBTs pH Speciation
Duration
Sample
type
Chemical shifts
200 to 60 ppm 0 to -400 ppm
TBTCl 7 2 weeks Anaerobic 157.0 (medium)
109.9 (medium)
107.3 (strong)
95.1 (weak)
76.9 (medium)
76.6 (medium)
64.3 (medium)
-11.4 (weak)
-109.1(weak)
TBTCl 5 2 weeks Anaerobic 158.0 (strong)
107.8 (medium)
110.7 (weak)
77.1 (weak)
TBTCl Pure 85
TBTO 7 2 weeks Anaerobic 156.0 (medium)
105.2 (strong)
-109.1(weak)
-340.9 (weak)
TBTO Pure 141
TBTOAc 7 2 weeks Aerobic 157.1 (strong)
TBTOAc 7 2 weeks Anaerobic 156.0 (medium)
105.2 (strong)
-340.9 (weak)
TBTOAc 7 4 weeks Anaerobic 157.5 (strong)
-340.9 (weak)
TBTOAc 7 8 weeks Anaerobic 156.1 (medium)
109.6 (medium)
106.8 (strong)
76.3 (medium)
63.8 (medium)
-11.4 (weak)
-340.9 (weak)
TBTOAc Pure 118

11
Table 2. 119
Sn NMR chemical shifts for TBTOAc spiked with Anaerobic and Aerobic sediment
samples from the Anacostia River at pH 7.
Sample
type
Speciation
Duration
Chemical shifts
200 to 60 ppm 0 to -400 ppm
TBTCl
(Aerobic)
2 weeks 158.0 (strong)
107.8 (medium)
110.7 (weak)
77.1 (weak)
8 weeks 158.0 (medium)
107.8 (medium)
110.7 (weak)
77.1 (weak)
-11.4 (weak)
-109.1(weak)
TBTCl
(Anaerobic)
2 weeks 157.0 (medium)
109.9 (medium)
107.3 (strong)
95.1 (weak)
76.9 (medium)
64.3 (medium)
-11.4 (weak)
8 weeks 157.2 (weak)
109.5 (medium)
108.1 (medium)
95.7 (weak)
77.5 (medium)
-11.4 (medium)
-109.0(weak)
TBTCl 85
TBTO
(Aerobic)
2 weeks 156.4 (medium)
105.3 (strong)
-340.9 (weak)
8 weeks 156.2 (medium)
105.6 (strong)
-11.5 (minor)
-340.9 (weak)
TBTO
(Anaerobic)
2 weeks 156.0 (medium)
105.2 (strong)
-109.1(weak)
-340.9 (weak)
8 weeks 156.7 (medium)
105.4 (medium)
-109.1(weak)
-340.9 (weak)
TBTO 141
TBTOAc
(Aerobic)
2 weeks 157.1 (strong)
8 weeks 157.5 (strong)
109.6 (medium)
106.8 (strong)
76.3 (medium)
-11.5 (weak)
-340.9 (weak)
TBTOAC
(Anaerobic)
2 weeks 156.0 (medium)
105.2 (strong)
-340.9 (weak)
8 weeks 156.1(medium)
109.6(medium)
106.8 (strong)
76.3 (medium)
63.8 (medium)
-11.4 (weak)
-340.9 (weak)
TBTOAc 118

12
Figure 1. 119
Sn NMR spectra of tributyltin chloride (TBTCl) in spiked anaerobic sediments from
Anacostia River at pH 5. (Speciation time 2 weeks)

13
Figure 2. 119
Sn NMR spectra of tributyltin chloride (TBTCl) in spiked anaerobic sediments from
Anacostia River at pH 7. (Speciation time 2 weeks)

14
Figure 3. 119
Sn NMR spectra of tributyltin acetate (TBTOAC) in spiked aerobic sediments from
Anacostia River at pH 7 (speciation time 2 weeks).

15
Figure 4. 119
Sn NMR spectra of tributyltin actate(TBTOAc) in spiked anaerobic sediments from
Anacostia River at pH 7. (Speciation time 2 weeks)

16
Figure 5. Typical 1H NMR spectra (tributyltin acetate (TBTOAc) in spiked anaerobic sediments
from Anacostia River at pH 7).

17
Figure 6. 119
Sn NMR spectra of tributyltin actate(TBTOAc) in spiked anaerobic sediments from
Anacostia River at pH 7. (Speciation time: 4 weeks)

18
Figure 7. 119
Sn NMR spectra of tributyltin actate(TBTOAc) in spiked anaerobic sediments from
Anacostia River at pH 7. (Speciation time: 8 weeks)

19
Figure 8. 119
Sn NMR spectra of bistributyltin oxide (TBTO) in spiked anaerobic sediments from
Anacostia River at pH 7. (Speciation time 2 weeks)

Comparing Clam Active Biomonitoring and POM PassiveMonitoring for DC Watershed Contaminant Point Sources
Basic Information
Title: Comparing Clam Active Biomonitoring and POM Passive Monitoring for DCWatershed Contaminant Point Sources
Project Number: 2010DC117BStart Date: 3/1/2010End Date: 2/28/2011
Funding Source: 104BCongressional
District: DC
Research Category: Biological SciencesFocus Category: Water Quality, Education, Toxic Substances
Descriptors: NonePrincipal
Investigators: Harriette Phelps
Publications
There are no publications.
Comparing Clam Active Biomonitoring and POM Passive Monitoring for DC Watershed Contaminant Point Sources
Comparing Clam Active Biomonitoring and POM Passive Monitoring for DC Watershed Contaminant Point Sources1

1
Active (ABM) and Passive (POM) Chlordane
Monitoring in
the Anacostia River Watershed (MD)
Final Report
Submitted to
DISTRICT OF COLUMBIA WATER RESOURCES RESEARCH INSTITUTE
By:
Dr. Harriette L. Phelps (PI)
Professor Emeritus
Department of Biology
University of the District of Columbia
May 15, 2011

2
Abstract
This 2010 research project focused on high chlordane contamination in the upper
Sligo Creek Park (MD) watershed of the Anacostia River (MD/ DC), using active
biomonitoring (ABM) with translocated freshwater clams Corbicula fluminea, passive
monitoring with polyoxymethylene strips (POM) and fish and sediment analyses. At the
downstream site (SCF) sediment chlordane was 4X the Canadian standard for protection
of wildlife. Technical chlordane levels in Blacknose Dace minnows and in ABM clams at
four weeks were statistically equal and exceeded (5X) the US Fish and Drug
Administration (USFDA) standard for fish consumption. Chlordane by ABM and POM
increased significantly (1.5X) from two to four weeks deployment. No difference in
chlordane uptake was found among small and large clams. ABM chlordane was less at
the five sites monitored upstream from site SCF. The USFDA standard was exceeded at
all but one site. At the Sligo Creek sites above Route 193 (SC1, SC2, SCB, SCH)
minnows were absent and at site SCB the ABM clams initially died. At site SCF the
chlordane measured by ABM was higher than measured by POM but after adjusting for
weight more chlordane was adsorbed by POM than by clams. High chordane at sites was
accompanied by high heptachlor epoxide and dieldrin which were the only other
pesticides detected.
Introduction
The freshwater Anacostia River is a tributary of the freshwater Potomac River and
has a 126 square mile watershed in DC and MD. Although the Anacostia is currently the
subject of major plans to address stormwater, sediment, nutrients and trash (ARP 2010) it
is better known for its toxic pollutants that rate it one of three Areas of Concern in the
USEPA/NOAA Chesapeake Bay Program (Chesapeake Bay Program 1999) and listed
among America’s 10 worst rivers. Over 60% of the resident fish have tumors (PAHs)
(Pinkney et al. 2000) and the sediment is toxic and lacking many benthic species found in
the nearby Potomac (Phelps 1985, Phelps 1993). The Anacostia has a fishing advisory for
PCBs and pesticides (DC Department of Health 2006) with TMDLs for PCBs and Trash
and is developing programs for control of stormwater, nutrient and suspended sediment
(ARP 2010).
The 10 km tidal Anacostia River was extensively studied from 1999 to 2002 by an
EPA/NOAA partnership (AWTA 2004) which considered contaminated tidal sediments
as the major source of fish and benthos contamination (SRC 2000, NOAA 2002, AWTA
2004, EPA 2009). However the Anacostia Restoration Plan (NOAA 2002, ARP 2010)
was unable to include data on toxic sources in the free-flowing Anacostia watershed.
Active biomonitoring from 1999 to 2010 used iterative active biomonitoring
(ABM) where Corbicula clams translocated to 52 Anacostia watershed sites were
analyzed for EPA Priority Pollutants including 18 polycyclic hydrocarbons (PAHs), 28
polychlorinated biphenyl congeners (PCBs), 6 Aroclors, 21 pesticides, and five metals

3
(Cd, Cr, Cu, Fe, Pb) plus technical chlordane, percent water and percent lipid. These
studies found sections in five of 12 Anacostia subwatersheds with PCB, chlordane and
PAH totals exceeding levels found in the tidal Anacostia and USFDA standards for fish
consumption (Phelps 2011).
In addition to fish, clam and ecosystem contamination, polluted sites in the free-
flowing watershed could be sources of the tidal Anacostia contaminated sediments.
Organic contaminants like PAHs, PCBs and pesticides are transported by association
with suspended sediment particles, and particles from runoff have been found with much
higher pesticide concentrations than consolidated sediments due to short-term mixing
disequilibria (Bergamaschhi et al. 2001). The recent Anacostia Restoration Plan (ARP
2010) suggested watershed contaminants would be controlled as a result of stormwater
control. However this could not apply to toxics from ongoing point and legacy sources of
PCBs, PAHs and Chlordane in watershed streams.
Water contaminants can be measured both directly and indirectly. Direct water
measurement of low levels of toxic contaminant is the best but also difficult and
expensive. Indirect or passive samplers are preferred because they can use accumulators
containing a lipophilic solvent like hexane or a solid like polyoxymethylene over a period
of time. Active biomonitoring uses bioconcentration over time by living organisms
(often molluscs) either in situ or translocated. Active and passive monitoring have
different purposes and can give different results (El-Shenawy et al. 2010). Passive
indirect monitoring can be easier, used under more circumstances and related in the
laboratory to contaminant concentrations in water. Active biomonitoring requires living
organisms that have limits but gives information on actual bioavailability and life-stage
sensitivity under environmental variables such as salinity, temperature and suspended
organic material including additional sources of contaminants such as particulate food
(Phelps 1979, Phelps et al. 1985a, Phelps et al. 1985b, Phelps and Mihursky 1986, Phelps
and Hetzel 1987, Phillips 1987.) Active biomonitoring with molluscs has been used
worldwide for biomonitoring of toxic pollution (Crawford and Luoma 1993, Colombo et
al. 1995, DeKock and Cramer 1995,
Sligo Creek is a large subtributary of the Northwest Branch which has 42% of
Anacostia river flow (Fig. 1). Complete ABM Sligo Creek EPA Priority Pollutant scans
in 2007 and 2009 found chlordane as the major contaminant, with concentrations
increasing going upstream to the Main Branch site SCF (Fig. 1) (Phelps 2008, Phelps
2010). Chlordane is a complex manmade pesticide once used for termite control and
banned since 1988. Chlordane has high toxicity including neurological effects and is
called a PBT (Persistent Biological Toxic) that accumulates in animal tissue and
increases up the food chain, with toxic environmental effects. Its high chlordane was
accompanied by high heptachlor epoxide and dieldrin. The current plans for Sligo Creek
do not address its toxic contaminants (Sligo Action Plan 2009).

4
Materials and Methods
Chlordane monitoring in upper Sligo Creek began July 2010 by collecting
Blacknose Dace minnows at site SCF (Fig. 1) using a permitted square meter minnow
net. The minnows were frozen, picked up by TestAmerica (Baltimore), and sent to the
TestAmerica Laboratory of Burlington VT for pesticide analysis. Corbicula clams for
the ABM translocation studies were collected on 7/5/10, 8/24/10, 9/10/10, and 10/3/10
from the shoreline sandy sediment at the Potomac River reference site of Fort Foote (FF)
5 km below the Anacostia confluence. A subsample of the first clam collection (7/5/10)
received complete EPA Priority Pollutant analysis. The collected clams were kept cool
and dry and placed in plastic-coated wire mesh cages (raccoon protection) on the stream
bottoms at Sligo Creek sites within four hours. All ABM clam deployments were
analyzed for 21 pesticides plus technical chlordane at two two weeks unless otherwise
specified, and had continuous temperature monitors (Tidbit) attached. Alpha and gamma
chlordane are part of the EPA Priority Pollutant scan. Technical chlordane, which was
analyzed separately, includes several additional chlordane compounds and is used by the
US Food and Drug Administration (USFDA) for fish consumption advice.
The furthest downstream Sligo Creek site (SCF) was the sampling location for
Blacknose Dace minnows and sediment (SSCF, Table 1, Fig. 1, Fig. 2)). ABM at SCF
compared chlordane accumulation among small clams (13 – 18mm, SCFCS) and large
clams (22 – 40mm, SCFCL) (Fig. 2, Table 1). The ABM/POM study at site SCF had
four 1” x 4” polyoxymethylene (POM) strips wrapped in wire mesh with two placed in
the cages with clams for two and four weeks (SCFC2, SCFC4, POM2a, POM2b, POM4a,
POM4b). Dr. Upal Ghosh of the University of Maryland Baltimore Campus (UMBC)
supplied the POM strips and analyzed them for alpha and gamma chlordane (Phelps
2010).
The uppermost possible Sligo Creek ABM was at the headwater site (SCH) and
located just below the junction of a large community stormwater drain and a smaller side
drain (Fig. 1). The ABM sites in the upper Sligo Creek were in order going downstream:
SCH, SC1, SC2, SCB (bridge) above Route 193, and SCH3 below Route 193, then site
SCF (Fig. 2). Sligo Creek at Route 193 had large apartment buildings and a pond with a
dam.
Results and Discussion
The sediment sample collected at site SCF was sandy gravel (18% water) with
0.22% carbon. The sediment technical chlordane of 36 ug/Kg (dw) was 4X the Probable
Effects Level of 8.87 ug/Kg for freshwater sediment (Canadian Sediment Quality
Guidelines for the Protection of Aquatic Life. 1999) and exceeded the NOAA SQUIRT
table Upper Effects Threshold for chlordane effects in freshwater sediment biota (30
ug/Kg) (NOAA) (Table 1). When SCF sediment chlordane is normalized to organic
carbon its concentration is 1600 ug/Kg C, similar to chlordane levels in Anacostia tidal
sediments (NOAA 2002). This suggested Sligo Creek as a potential ongoing source of
chlordane–contaminated sediment to the Anacostia tidal region. ABM also found similar
high chlordane levels in the Riverdale East subtributary of the Northeast Branch which is
another possible source of contaminated sediments (Phelps 2005, Phelps 2008).

5
Blacknose Dace minnows at site SCF had technical chlordane of 1500 ug/Kg,
which is 5X the USFDA standard for fish consumption (300 ug/Kg) and statistically the
same as four-week clam chlordane (1300 ug/Kg) (Table 1). A USGS 1992-1995 National
Water-Quality Assessment survey found technical chlordane in native bivalves at
freshwater sites averaged one-third of fish chlordane (Wong et al. 2000). Small and large
clams deployed for two weeks had statistically similar concentrations of technical
chlordane, averaging 1020 ug/Kg, which is 3.4X the USFDA standard for fish (Table 1).
Technical chlordane by ABM exceeded the USFDA standard for fish
consumption at all sites except site SCH3 below the pond and dam at Route 193. Since
clams at site SCF had higher chlordane levels than at upstream sites SCF may have had
an additional source of chlordane (Fig. 2). SCF was located just below the entrance of a
large drain from a nearby suburban area.
At Site SCB the first set of deployed clams on 9/17/10 was found dead after the
two week deployment. The attached TidbiT showed the clams were not out of water.
The second SCB deployment on 10/17/10 had 100% clam survival. Electrofishing on
10/28/2011 by the Maryland Department of the Environment (MDE) found many
Blacknose Dace minnows at SCF but all sites above Route 193 (SCH, SCH1, SCH2,
SCB) had only a few tolerant sunfish (Fig. 2). MDE will analyze those fish for
chlordane. Corbicula clams are tolerant of high pollutants (Dougherty and Cherry 1988)
and chlordane was significantly higher at SCF than all upstream sites, so high chlordane
was probably not the cause of SCB clam death. The absence of fish and the one-time
SCB clam death suggested an upstream cause of intermittent toxicity. The Friends of
Sligo Creek website (http://www.fosc.org/SWMap17.htm) describes a large underground
stormwater storage facility constructed under the Arcola Elementary School playground
near site SCH. Underground water can become deoxygenated from organic matter and
bacterial action (pers. information, Maryland Department of Natural Resources,
MDDNR). Intermittent toxicity in Upper Sligo Creek could result from the slow release
of anoxic stored water from the stormwater storage facility. The dam at Route 193 would
block upstream migration and restoration of the Blacknose Dace minnow population.
Similar underground stormwater storage facilities are being proposed. Putting a small
waterfall at the outlets could restore proper oxygen levels if necessary (MDDNR).
In this study both passive (POM) and active (ABM) monitoring showed a chlordane
increase of 1.5X from two to four weeks deployment. The averaged chlordane by POM
was 34% of clam ABM (Table 1). A similar ABM/POM study for PCBs in Lower
Beaverdam Creek was carried out with Dr. Ghosh in 2009 (Phelps 2010). POM chlordane
is reported in units per dry weight and ABM chlordane is traditionally reported in units of
tissue wet weight (80% water). In the present chlordane study, if alpha and gamma
chlordane were reported in dry weight units for both ABM and POM, POM would
average 3.5X ABM chlordane levels. In the earlier ABM/POM study of PCBs in Lower
Beaverdam Creek, total PCB levels by POM averaged 2X total ABM PCBs when
measured by dry weight (Phelps 2010). This shows a difference among PCB and
chlordane pollution measured by POM and ABM monitoring. Both PCBs and Chlordane
are PBT contaminants with serious effects on downstream environments and higher
organisms like birds. All of Sligo Creek is being seriously contaminated by its upstream

6
chlordane sources. Monitoring by ABM is only the first start in addressing Sligo Creek
toxic pollution but it does identify the major contaminants and possible sources. Further
steps need to include developing a chlordane TMDL and possible sequestration measures.
Acknowledgments
Very grateful acknowledgement is made to continuous support from the District of
Columbia Water Resource Research Institute towards increasing understanding of the
role of the free-flowing Anacostia watershed in Anacostia River toxic pollution. Many
thanks are due to the many students who participated in this research. Special thanks go
to Earl Greenidge who was essential to the successful continuation and completion of this
work.
Table 1. Chemical and physical data at Upper Sligo Creek monitoring sites.
SITE SLIGO CREEK
LOCATION
DATE
COLL.
CHLORDANE
ng/Kg, gamma
alpha
gamma
+alpha
technical
GPS
northing
westing
SCH Headwater 7/22/10 17 27 44 300 39.042721 77.039543
SCH1 Below SCH 10/17/10 46 72 118 710 39.042202 77.037674
SCH2 Below SCH1 10/17/10 20 39 59 370 39.041154 77.035698
SCB Bridge 10/17/10 63 77 140 830 39.040127 77.034332
SCH3 Below bridge 10/17/10 10 19 29 150 39.042721 77.029850
SCFCS *Small clams 9/7/10 110 58 168 940 39.024777 77.030157
SCFCL *Large clams 9/7/10 140 77 217 1100 “ “
SCF2 *Clams 2 weeks 9/24/10 100 53 153 845 “ “
SCF4 *Clams 4 weeks 10/9/10 160 81 241 1300 “ “
SCF *Fish 7/2/10 100 190 290 1500 “ “
POM2A *POMa 2 weeks 9/24/10 25 20 45 (231) “ “
POM2B *POMb 2 weeks 9/24/10 36 25 61 (321) “ “
POM4A *POMa 4 weeks 10/9/10 46 34 80 (422) “ “
POM4B *POMb 4 weeks 10/9/10 47 36 83 (437) “ “
SSCF *Sediment 10/17/10 4 4 8 36 “ “
FF Reference site 7/5/10 10 19 29 110 38.461694 77.014797
*all at site SCF
( ) estimated

7
Figure 1. Sligo Creek watershed. Figure 2. Upper Sligo Creek.
References
ARP. 2010. Anacostia Restoration Plan and Report. Metropolitan Washington Council of
Governments Washington, DC. 146 p.
http://www.anacostia.net/Restoration_Plan/download/Anacostia-Report-Web-
Quality.pdf
AWTA. 2004. Charting a Course Toward Restoration: A Toxic Chemical Management
Strategy for the Anacostia River. Washington, D.C. 2004.
Bergamaschi, BA, KM Kuivila, MS Fram.2001. Pesticides associated with suspended
sediment entering San Francisco Bay following the first major storm of winter Year
1996. Estuaries 24(6):365-380.
Canadian Council of Ministers of the Environment. 1999. Canadian Sediment Quality
Guidelines for the Protection of Aquatic Life. Winnepeg, Canada. 4p.
Chesapeake Bay Program. 1999. Targeting toxics: A characterization report. A tool for
directing management and monitoring actions in the Chesapeake Bay’s tidal rivers:
Annapolis, Maryland. Chesapeake Bay Program CBP/TRS 222/106 (EPA 903-R-99-
010) 79p.
Colombo, J.C., C. Bilos, M. Campanaro, M.J. Rodriguez-Presa and J.A. Catoggio. 1995.
Bioaccumulation of polychlorinated biphenyls and chlorinated pesticides by the Asiatic
clam Corbicula fluminea: Its use as a sentinel organism in the Rio de La Plata Estuary,
Argentina. Env. Sci. and Tech. 29(4):914-927.
Crawford, J.K. and S.N. Luoma. 1993. Guidelines for studies of contaminants in biological
tissues for the National Water Quality Assessment Program. U.S. Geological Survey
Open-File Report 92-494.
DC DOH (District of Columbia Department of Health) 2006. Public Health Advisory.

8
DeKock, W.C. and K.J.M Kramer. 1994. Active biomonitoring (ABM) by translocation of
bivalve molluscs. In: Kramer, KJM (ed.) Biomonitoring of Coastal Waters and Estuaries.
CRC Press, Boca Raton, FL.
Dougherty F.S. and D.S. Cherry. 1988. Tolerance of the Asiatic clam Corbicula sp. to lethal
levels of toxic stressors - A review." Environ Poll 51:269-313.
El-Shenawy, N.S., Z.I. Nabil, I.M. Abdel-Nabi and R. Greenwood. 2010. Comparing the
passive and active sampling devices with biomonitoring of pollutants in langstone and
portsmouth harbor. U.K. J. Environ. Sci. Technol., 3:1-17.
EPA (2009). White Paper on PCB and PAH Contaminated Sediment in the Anacostia River.
Friends of Sligo Creek. http://www.fosc.org/SWMap17.htm
NOAA 2002. Watershed Database and Mapping Projects/Anacostia River.
http://response.restoration.noaa.gov
NOAA SQUiRT Screening Quick Response Tables
http://response.restoration.noaa.gov/faq_topic.php?faq_topic_id=6#top
Phelps, H.L. 1979. Cadmium sorption in estuarine mud-type sediment and cadmium
accumulation in the soft-shell clam, Mya arenaria. Estuaries 2(1):40-44.
Phelps, H.L. 1985. Summer 1984 Survey of Mollusc Populations of the Potomac and
Anacostia Rivers near Washington, D.C. Report to District of Columbia Environmental
Services. 67p.
Phelps, H.L. 1993. Sediment toxicity of the Anacostia River estuary Washington, DC. Bull.
Environ. Contam. Toxicol. 51:582-587.
Phelps, HL. 2005. Identification of PCB, PAH and chlordane source areas in the Anacostia
River watershed. DC Water Resources Research Center, Washington, DC 9p
Phelps. HL. 2008. Active Biomonitoring for PCB, PAH and Chlordane Sources in the
Anacostia Watershed. DC Water Resources Research Center, Washington, DC 11p
Phelps, H.L. 2010. Clam Active Biomonitoring and POM Passive Monitoring for Anacostia
Watershed Contaminant Point Sources. 11p. DC Water Resources Research Center,
Washington, DC.
Phelps, H.L., D.A. Wright and J.A. Mihursky. 1985a. Factors affecting trace metal
accumulation by estuarine oysters (Crassostrea virginica). Mar. Ecol. Prog. Series
22(2):187-197.
Phelps, H.L., W.R. Pearson and J.T. Hardy. 1985b. Clam burrowing behavior and mortality
related to sediment copper. Mar. Poll. Bull. 16:309-313.
Phelps, H.L. and J. A. Mihursky. 1986. Oyster (Crassostrea virginica, Gmelin) spat
settlement and copper in aufwuchs. Estuaries 9(2):127-132.
Phelps, H.L. and E. Hetzel. 1987. Oyster size, age, and copper and zinc accumulation. J
Shellfish Res 6(2):67-70.
Phillips, DJH. 1977. The use of biological indicator organisms to monitor trace metal
pollution in marine and estuarine environments--a review. Environ. Pollut, 13:281-317.
Pinkney A.E., J.C .Harshbarger, E.B. May and M.J. Melancon. 2000. Tumor relevance and
biomarkers of exposure in Brown Bullheads (Ameiurus nebulosus) from the Tidal
Potomac River Watershed. Environ Tox and Chem 20:1196-1205.
Sligo Creek Action Plan 2009.
http://www.anacostia.net/Restoration_Plan/download/ActionPlans/Sligo_SWAP_FINAL.

9
SRC (Syracuse Research Corporation) 2000. Interpretive Summary of Existing Data Relevant
to Potential Contaminants of Concern within the Anacostia River Watershed. Anacostia
Watershed Toxics Alliance. 218 pp + appendices.
Wong, C.S., D.C. Paul, L.H. Nowell. 2000. Results from the National Water-Quality
Assessment Program, 1992–1995. USGS Water-Resources Investigations Report 00-
4053.

The Application of Multiple-Antibiotic-Resistance (MAR)Profiles of Coliforms to Detect Sources of BacterialContamination of the Anacostia River
Basic Information
Title: The Application of Multiple-Antibiotic-Resistance (MAR) Profiles of Coliforms toDetect Sources of Bacterial Contamination of the Anacostia River
Project Number: 2010DC118BStart Date: 3/1/2010End Date: 2/28/2011
Funding Source: 104BCongressional
District: DC
ResearchCategory: Biological Sciences
Focus Category: Wastewater, Water Quality, EducationDescriptors: None
PrincipalInvestigators: David Morris
Publications
There are no publications.
The Application of Multiple-Antibiotic-Resistance (MAR) Profiles of Coliforms to Detect Sources of Bacterial Contamination of the Anacostia River
The Application of Multiple-Antibiotic-Resistance (MAR) Profiles of Coliforms to Detect Sources of Bacterial Contamination of the Anacostia River1

The Application of Multiple Antibiotic Resistance Profiles
of Coliforms to Detect Sources of
Bacterial Contamination of the Anacostia River
Final Report
Submitted to
DISTRICT OF COLUMBIA WATER RESOURCES RESEARCH INSTITUTE
By:
Dr. David W. Morris
Associate Professor
Department of Biological Sciences
George Washington University
May 2011

Abstract
The Anacostia River in Washington, DC has been burdened with the problem of an estimated
2,142 million gallons of sewage overflow per year. Our study is part of a year-long investigation
to identify major sources of fecal pollution in the District of Columbia from both combined
sewage outlet (CSO) sites and non-point sources (NPS). This project has involved the training
and active participation of a least 84 undergraduate students in four classes. Samples were
obtained from the outflow of CSOs located in the District from the Northeast Boundary to the
Douglass Bridge following precipitation events. The presence of Escherichia coli and other
coliforms were confirmed and differentiated from other known enteric bacteria using
characterization media. Isolates were tested for MAR using a panel of drugs commonly
prescribed in clinical and agricultural practice. To determine antibiotic resistance patterns, a two-
sided test of binomial proportion and Euclidian metric analysis were used. Isolates from all CSO
sources showed significantly greater resistance and higher MAR indices than the NPS sites
(p<0.05). The highest MAR indices were obtained from outflows from CSO sites 14, 16, 17, 18
and 19. MAR testing has proved to be a quick and reliable measure of identifying the source of
fecal contamination and have clearly shown that multiple drug resistance (MDR) fecal coliforms
are associated with CSO overflows. Ultimately, our study will provide a comprehensive ―before
and after‖ assessment of fecal contamination in the watershed as projected revitalization
continues. The continuation of this study is focused on determining antibiotic resistance transfer
to environmental sources of E. coli, Enterobacter spp. and non-coliform enteric bacteria such as
Salmonella spp., as well as the impact of MDR organisms and their long-term presence in the
watershed. Many isolates were identified as possible Extended-Spectrum β-Lactamase (ESBL)-
producing bacteria based on their resistance to cephalosporin drugs and aztreonam. Others were
resistant to the new fluoroquinoline antibiotics. These studies point to the critical need to hasten
current efforts for the rehabilitation of the river.
Introduction
The Anacostia River is an urban tributary in a highly industrial surrounding, making it a
dynamic and unique environment in which to study fecal pollution. It flows approximately 8.5
miles from Prince George’s County, Maryland through Washington, D.C., before finally joining
the Washington Canal and emptying into the Potomac River. Its watershed covers 176 square
miles and contains 13 sub-watersheds. Although encompassed by parkland, the Anacostia is
heavily polluted from sediment, toxins, pathogens, and trash (1,2). Public health risks can
originate from sewage drainage directly into the river and is caused by fecal coliform bacteria
and other pathogens found in the untreated wastewater. The harmful microbes debilitate water
quality and create hypoxic conditions, leading to large-scale fish death and deterioration of the
local wild-life (2,3). Water pollution is further compounded by the disrepair of the D. C.
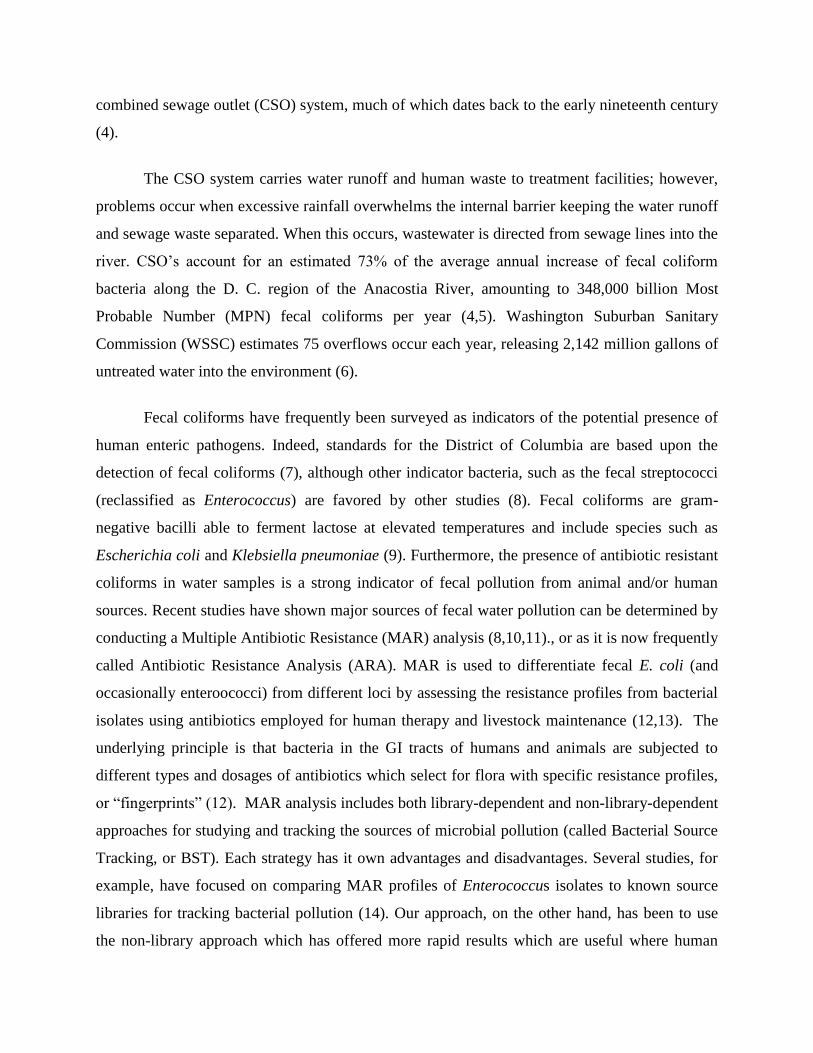
combined sewage outlet (CSO) system, much of which dates back to the early nineteenth century
(4).
The CSO system carries water runoff and human waste to treatment facilities; however,
problems occur when excessive rainfall overwhelms the internal barrier keeping the water runoff
and sewage waste separated. When this occurs, wastewater is directed from sewage lines into the
river. CSO’s account for an estimated 73% of the average annual increase of fecal coliform
bacteria along the D. C. region of the Anacostia River, amounting to 348,000 billion Most
Probable Number (MPN) fecal coliforms per year (4,5). Washington Suburban Sanitary
Commission (WSSC) estimates 75 overflows occur each year, releasing 2,142 million gallons of
untreated water into the environment (6).
Fecal coliforms have frequently been surveyed as indicators of the potential presence of
human enteric pathogens. Indeed, standards for the District of Columbia are based upon the
detection of fecal coliforms (7), although other indicator bacteria, such as the fecal streptococci
(reclassified as Enterococcus) are favored by other studies (8). Fecal coliforms are gram-
negative bacilli able to ferment lactose at elevated temperatures and include species such as
Escherichia coli and Klebsiella pneumoniae (9). Furthermore, the presence of antibiotic resistant
coliforms in water samples is a strong indicator of fecal pollution from animal and/or human
sources. Recent studies have shown major sources of fecal water pollution can be determined by
conducting a Multiple Antibiotic Resistance (MAR) analysis (8,10,11)., or as it is now frequently
called Antibiotic Resistance Analysis (ARA). MAR is used to differentiate fecal E. coli (and
occasionally enteroococci) from different loci by assessing the resistance profiles from bacterial
isolates using antibiotics employed for human therapy and livestock maintenance (12,13). The
underlying principle is that bacteria in the GI tracts of humans and animals are subjected to
different types and dosages of antibiotics which select for flora with specific resistance profiles,
or ―fingerprints‖ (12). MAR analysis includes both library-dependent and non-library-dependent
approaches for studying and tracking the sources of microbial pollution (called Bacterial Source
Tracking, or BST). Each strategy has it own advantages and disadvantages. Several studies, for
example, have focused on comparing MAR profiles of Enterococcus isolates to known source
libraries for tracking bacterial pollution (14). Our approach, on the other hand, has been to use
the non-library approach which has offered more rapid results which are useful where human

health hazards are suspected (15), Few studies have been carried out to determine the variance
of MAR profiles of fecal coliforms in this tributary; therefore, our research links pollution-
derived coliform levels, antibiotic resistance in mid-summer water samples, and suggests
transference of resistance between human and/or animal-derived and natural-source coliforms.
This project, above all, has been designed to train undergraduate students in some of the currents
methods used to monitor microbial contamination of the nation’s waterways and particularly to
focus their attention on the remediation efforts for the Anacostia River. Thus, the work described
here has been carried out, and in some cases designed, by undergraduate students in our program.

Methods and Materials
The materials and methods used in the research have not differed substantially from the proposal
although slight modifications in the proposed procedure have been necessary. While general
methods are presented here, a short manual for student instruction was prepared and is presented
in Appendix A..
Collection of Samples: CSO sites along the Anacostia River between the 11th
Street Bridge and
the East Capitol Bridge were chosen for MAR analysis. These sites drain both residential (84%)
and mixed commercial areas (16%). In addition, all sampled CSO sites experience overflows
during minimal (0.1-0.5 inches) rainfall (6). The non-point source (NPS) samples were collected
mid-stream at the M Street Railroad Bridge. Approximately 1 liter of water was collected from
each site on June 30th
2010, in duplicate, at each area immediately following a high flow storm
event. The samples were stored in sterile plastic collection bottles (Fisher Scientific) at 4oC and
were analyzed 24 hours later.
Figure 1: CSO sites on the Anacostia River sampled during this investigation (6)

Isolation, Enumeration, and Identification of Fecal Coliforms: Fecal coliform contamination in
each sample was assessed initially by using the Standard Method Analysis recommended by the
American Public Health Association (APHA) (16). This method estimates the MPN of fecal
coliforms using a standard assay and expressed as MPN /100 mL of water sample. Individual
colonies of fecal isolates were obtained based upon sample MPN results: coliform–confirmed
water samples were filtered through 0.2 m pore-sized nitrocellulose filters and the filters
incubated on MacConkey Agar plates at 37oC for 48 hours. Lactose-fermenting colonies were
further analyzed by replica-plating on Eosin-Methylene Blue, Desoxycholate and Hektoen
Enteric agar plates to confirm the isolation of fecal E. coli. Fecal coliform isolates were then
plated onto antibiotic inoculated LB media and scored according to their resistances to each in
order to generate MAR data.
MAR Analysis: The MAR value for a given organism or source relies upon the specific panel of
antibiotics which are used for testing. MAR indices were determined using similar patterns to
those employed by Kasper, et al (15). Isolates confirmed as fecal coliforms were tested for
antibiotic resistance on drug-infused LB agar plates of several different antibiotics used for
clinical therapy in humans and prophylactic use in livestock (Table 1). Isolates were replica-
plated from master plates to each of the antibiotic plates and incubated at 37oC for 18 to 24
hours. Isolates were recorded as resistant to an antibiotic if ≥80% colonial growth was observed.
The MAR index for each isolate was calculated using the following relationship: number of
antibiotics to which the isolate was resistant / number of antibiotics tested. MAR indices for
each sample site were calculated as the number of antibiotics to which all isolates were resistant /
(number of antibiotics tested x number of isolates inoculated per site) (15). Significant
differences between antibiotic resistance patterns at each site were determined by a two-sided
test of binomial proportion (p<0.05). Inter-isolate relationships were examined by converting the
data to binary code and analyzed by a Euclidian metric, average linked method (DendroUPGMA
Program)(12,17).

Table 1: Antibiotic Concentrations and Uses. Isolates confirmed as fecal coliforms were tested for antibiotic
resistance on drug-infused LB agar plates of several different antibiotics consistent with animal and human
treatment

Results and Discussion
Undergraduate involvement in the project (individual and class) commenced in late
summer 2010 and carried into spring 2011. Two classes were presented with group projects
involving some aspect of the work. The first was: ―Do We Need Biotechnology?, a part of the
Dean’s Seminar Series and is attended exclusively by freshmen (science and non-science
majors). This year’s class, held in the fall of 2010, constituted 18 students, only two of whom
were from the D.C. area. The second class was Introductory Microbiology (BiSc 2237 and BiSc
2237W), designed for upper-level undergraduates (juniors and seniors,), which was held in fall
2010 and spring 2011. Each class contained 32 students. Including all participating
undergraduate students conducting individual research projects in the laboratory, a total of 84
undergraduates have been actively involved in the water monitoring project. Class work and
laboratory exercises relevant to the project included water sampling and testing, determination of
fecal coliforms by APHA-recommended procedures (Most Probable Number (MPN) and water
filtration techniques), isolation, enumeration and characterization of enteric bacteria (Escherichia
coli, Enterobacter, Salmonella spp., and Shigella spp.) from water and fecal samples, MAR
analysis and plasmid DNA isolation procedures.
Comparison of Multiple-Antibiotic-Resistance (MAR) Profiles of fecal
Escherichia coli at CSO Sites 17 and 18 and a Non-Point Source on the
Anacostia River
CSO17 and CSO 18 along the Anacostia River were sampled for this study in the early
fall of 2010. Both sites lie between the 11th
Street Bridge and the Sousa Bridge. Samples of
approximately 1 liter of water were collected three times at each area in September of 2011. The
non-point source (NPS) samples were obtained mid-stream near the John Philip Sousa Bridge.
The water samples were analyzed as described previously. Briefly, water samples were filtered
through a 0.2 m pore-sized nitrocellulose filters, the filters were then placed on Desoxycholate
Agar and further differentiated on MacConkey and Hektoen Enteric Agars. Each plate was
incubated at 42.5°C. Suspected fecal E. coli isolates were plated on a grid for subsequent MAR
analysis. MAR indices were determined by the method of Kaspar et al. (15). Isolates were
identified as antibiotic-resistant if growth was identical to that on the MH plate without
antibiotics. In comparison to the control plate, if the growth of bacterial colonies of an isolate

was reduced by 20% or more, then the sample was marked as sensitive to the antibiotic. MAR
indices for each sample site were calculated as the number of antibiotics to which all isolates
were resistant / number of antibiotics tested x number of isolates inoculated per site. Antibiotic
resistance patterns at each site were determined by a two-sided test of binomial proportion
(p<0.05)(15).
The results indicated that isolates from both CSO sites showed significantly greater
resistance (p<0.001) and higher MAR indices than the NPS sites, with an average MAR index of
0.36±0.04. In contrast, NPS isolates exhibited resistance with an average MAR index of
0.07±0.04 (Figures 2 and 3).
Figure 2: Multiple antibiotic resistance testing for both non-point and point sources. From left to right the bars
represent the MAR frequency (number of antibiotic resistant isolates / total number of antibiotics tested), the percent
of resistant isolates, and the percent of isolates that had resistances to three or more antibiotics. PS (green bars); NPS
(blue bars).

Figure 3: Antibiotic resistance profiles of coliform isolates from PS and NPS sources.
Multiple drug resistance tests also revealed that 81.5% of point source samples showed
resistance to multiple drugs compared to 46.3% of nonpoint sources. Point source isolates also
expressed resistance to 8 or more different drugs in 7.8% of the samples, an astounding number.
Nonpoint source isolates showed varied resistance to no more than 6 drugs in any sampling and
only 2.8% were resistant to more than 3. Point source samples showed significantly higher levels
of widespread antibiotic resistance than non-point source samples (Figure 4).

Figure 4: A comparison of the number of antibiotics each isolate was resistant to. Numbers on the x-axis represent
the number resistances that each isolate had and the y-axis represents the number of isolates.
The MAR values and patterns of the PS isolates were similar to fecal E. coli isolates
recovered from raw sewage samples in the D.C. metropolitan area, strongly indicating that
multiple drug resistant (MDR) E. coli are being directly deposited into the river from these CSO
overflows. This portion of the study was carried out by students of the Dean’s Seminar Class (Do
We need Biotechnology? It was presented as a poster for the George Washington Research Day
in March 2011 and later at the Undergraduate Research Symposium in April where it won first
prize. The full poster is shown in Appendix B.

Using Multiple Antibiotic Resistance (MAR) Analysis to Identify CSOs as
Sources of Fecal Escherichia coli Contamination on the Anacostia River
More extensive studies were carried out by undergraduate students engaged in individual
research projects in the laboratory throughout the summer and fall of 2010, and continued into
the new year. Five CSO sites along the Anacostia River between the 11th
Street Bridge and the
East Capitol Bridge (CSO’s 14, 16, 17, 18 and 19) were chosen for MAR analysis. All sites drain
both residential (84%) and mixed commercial areas (16%). In addition, all sampled CSO sites
experience overflows during minimal (0.1-0.5 inches) rainfall. The non-point source (NPS)
samples were collected mid-stream at the M Street Railroad Bridge. The MAR Index values for
all CSO’s calculated an average of 52%, significantly higher than the NPS samples calculated at
16% (p<0.05). This indicates that the CSO’s are major point sources for contamination by fecal
E. coli. In addition, CSO isolates showed much higher resistance to combinations of antibiotics
than NPS isolates. No significant differences in MAR indexes were calculated between each of
the CSO sites (p=0.85); however, all CSO sites showed a significant difference with the NPS site
(p<0.05). 98% of isolates from CSO sites were resistant to one or more antibiotics. 83% of
isolates from mid-stream samples were resistant to one or more antibiotics. Most importantly,
the majority of E. coli isolates from CSO sources were resistant to three or more antibiotics.
Table 2 MAR and MDR Index Percent Values for CSO Sites. No significant differences in MAR indexes were
calculated between each of the CSO sites (p=0.85); however, all CSO sites showed a significant difference with the
NPS site (p<0.05). 98% of isolates from CSO sites had resistance to one or more antibiotics. 83% of isolates from
mid-stream samples were resistant to one or more antibiotics.
Comparative antibiotic resistance profiles of CSO sites showed no significant differences
for ampicillin, ciprofloxacin, streptomycin and chlortetracycline resistances. However, isolates
from the downstream CSO14, CSO16 and CSO17 sites showed significantly more resistance to
naladixic acid, tetracycline and oxytetracycline. Upstream CSO18 and CSO19 isolates showed

significantly more resistance to chloramphenicol. Profiles of isolates from mid-stream (NPS)
samples showed similar levels for ciprofloxacin and ampicillin resistances to CSO isolates only.
More diverse patterns of antibiotic resistance were seen in the CSO isolates compared to the NPS
source. 43 different resistance patterns were seen collectively in the CSO isolates compared to 8
patterns seen in the NPS isolates. These results are shown in detail on the poster display in
Appendix C. This presentation was made at the Maryland Water Monitoring Council Conference
in Baltimore, Maryland, in November 2010.
Extensive studies were also undertaken on samples obtained from CSO sites 5, 6 and 7
(at the Fort Stanton area on the south-eastern bank of the Anacostia River). MAR and MDR
index percent values for each of these CSO sites (27.8%) was significantly lower than for CSO
sites 14, 16, 17, 18 and 19 (p<0.05) but significantly higher than NPS values (p<0.05). Low
MAR percent index values were also obtained for CSO 8 (20.5 ) and CSO 9 (20.7%).
Overall, our studies indicated that CSO sites, 14, 16, 17, 18 and 19 contribute a
significantly greater load of fecal E. coli contaminants to the Anacostia River during CSO
overflows than the other CSO sites examined in this study. The E coli isolates from the Navy
Yard and North-East Boundary sites also show a wider variation in antibiotic resistance patterns.
One explanation for this wide variation may be due to the exchange of R-factors carried on
conjugative R-plasmids. It has been shown that plasmid transference readily occurs among fecal
coliforms in the microbial milieu of mammalian GI systems and in stagnant bodies of wastewater
(18,19). WSSC has reported that the D. C. region of the Anacostia River is a stagnant water body
with a long resting time in these urbanized areas that favors such exchange (5). Consequently,
the sluggish flow of the river does not allow for effective aeration of the water. Low O2
saturation levels as well as high water temperatures likely favor the survival of facultatively
anaerobic coliforms, resulting in genetic exchange between particularly virulent microbes and
those occurring naturally within the environment (20,21). Future work will focus on these and
other CSO sites this summer to confirm the consistency of our results.
There is an effort to remediate the Anacostia River and the watershed that supplies it.
However, an aging city sewage system is likely to maintain the current high levels of fecal
coliform contamination in the river. Any serious effort to improve the condition of the Anacostia

must be accompanied by careful monitoring of bacterial populations. We believe that using
MAR profiles of selected sites on the Anacostia River (CSO and NPS), as we have described
here, may be a useful and simple tool for monitoring the rehabilitation of the CSO system.

Studying the Antibiotic “Resistome” of the Anacostia Watershed
It is generally understood that, due to the overwhelming proliferation of antibiotic
resistant bacteria, we are now living in a ―Post-Antibiotic Era‖ (22). Microbial resistance to
antibiotics now spans all known classes of both naturally-produced substances as well as
chemically-synthesized compounds. D’ Costa and others (23,24) have argued that studying
reservoirs of antibiotic resistant bacteria (in biotic and abiotic sources) could provide an early
warning system for the potential transfer of antibiotic resistance genes to clinical isolates.
Equally possible is the transfer of resistance genes from clinical pathogens to naturally occurring
bacterial populations. It seemed logical, therefore, to extend our work into investigating the
MAR spectra of fecal bacteria found in the human and animal sources which contribute to the
contamination of the Anacostia River and its watershed.
In these studies, we extended the range of antibiotics used for antibiotic resistance
analysis to take into account recent studies which point to new patterns of antibiotic resistance
acquisition by enteric bacteria which constitute a public health threat. The additional antibiotics
included cefoxitin, aztreonam, piperacillin, oflaxacin and nitrofurantoin. The emergence of
resistance to expanded-spectrum cephalosporins has been a major concern and is due to the
production of Extended-Spectrum Beta-Lactamases (ESBLs)(25). ESBLs confer resistance to
many cephalosporin antibiotics, such as cefoxitin, and related oxyimino-β lactams, such as
aztreonam (26). This latter antibiotic is primarily administered intramuscularly due to its
inability to pass through the digestive tract unaltered. Resistance to piperacillin, another extended
spectrum β-lactam antibiotic, has also raised concerns (27). Dug resistant E. coli have been
identified in sewage and sludge specimens in Austria and Spain, and recently seen in enteric
bacteria isolated from avian sources in Spain and South Africa (28). ESBLs are frequently
encoded by plasmid-borne genes. These plasmids responsible for ESBL production frequently
carry genes encoding resistance to other drug classes (i.e., aminoglycosides)(29). Resistance to
ofloxacin, a second-generation fluoroquinolone, which has been associated with clinical strains
of Mycobacterium tuberculosis, and has now been noted in among enteric isolates, including E.
coli (27), In addition, we incorporated nitrofurantoin which is often used to combat urinary tract
infections caused by E. coli. Rates of resistance to nitrofurantoin in the United States have, until

recently, remained low (0.4 to 0.8%) but clinical isolates resistant to the antibiotic have
increasingly appeared over the past few years (30).
MAR Profiles of Coliform and Non-Coliform Bacteria from the Anacostia River and some
of its Tributaries in the Anacostia Watershed. Initial results suggest that resistances to some
of these ―second generation‖ antibiotics in fecal coliform isolates from some CSO sources are
high. For example, in a survey of E. coli isolates from CSO 5, 6 and 7, out of a total of 384
individual isolates, 63% were resistant to cefoxitin, 63% to nitrofurantoin and 38% to aztreonam.
In a similar study on Enterobacter isolates from CSO 19, 91% were resistant to aztreonam, and
39% to nitrofurantoin; all isolates were resistant to cefoxitin and streptomycin (total 128
isolates). Major patterns of antibiotic resistance are shown in Table 4 below: over half of the
isolates (54%) were resistant to the combination aztreonam-cefoxitin-streptomycin.
RESISTANCE PATTERN PERCENT ISOLATES
Az-Ce-St 54
Az-Cef-St-Nf 26.5
Ce-St 15.6
Ce-Sm-Nf 3.1
Table 4: Major resistance patterns seen in Enterobacter isolates from CSO 19. Az: aztreonam; Ce: cefoxitin; St:
streptomycin; Nf: nitrofurantoin.(n=128.)
MAR Profiles of Enteric Bacteria Isolated from Human Sources. E. coli, Enterobacter and
Salmonella spp. were isolated from individual human fecal samples and raw sewage obtained in
the vicinity of CSO 19. Isolates were characterized and identified by standard microbiological
procedures before being plated onto a grid for subsequent MAR analysis. MAR indices and
resistance patterns from individual samples varied considerably; however, sewage isolates
exhibited very high MAR indices (>90%) and a wide range of multiple drug resistance patterns.
Although this part of the project is still in the preliminary stages, one study on Salmonella spp.
isolates from raw sewage taken from a sampling point near CSO 19, found that the major
resistance pattern was Az-Ce-St, which has also been found in Enterobacter isolates from CSO
19 (see Table 4 above). Over 15% of the resistant isolates carried resistances to 9 of the 11
antibiotics tested.

MAR Profiles of Enteric Bacteria Isolated from Animal Sources. Antibiotic resistance
analysis was also undertaken on enteric isolates from domestic and wild animals. These included
cats, dogs, ferrets, horses and geese.. It has been suggested that wild birds, particularly migratory
fowl, may harbor a reservoir of antibiotic resistant bacteria and have the potential to disseminate
them over very long distances (32,33). One of our student studies focused on geese because these
are common denizens of the Anacostia River and its watershed. Fresh goose fecal samples were
collected from the Roosevelt Island area earlier this spring and Enterobactera spp. isolates
examined by MAR analysis. Our studies showed that goose fecal isolates were far more variable
in antibiotic resistance patterns than any other animals tested in this project. The MAR index of
the source was 41% (n=64). Most isolates were resistant to the β-lactams, aztreonam, piperacillin
and cefoxitin (Figure 5) and carried resistances to multiple antibiotics (Figure 6).
Figure 5: Percentages of individual goose Enterobacter isolates resistant to 11 antibiotics. Az: aztreonam; C:
chloramphenicol; O: oflaxacin; Ni: nitrofurantoin; Ne: neomycin; Pi: piperacillin; Ce: cefoxitin; K: kanamycin; Te:
tetracycline, G: geniticin; S: streptomycin.

Figure 6: Percentage of individual goose Enterobacter isolates resistant to multiple antibiotics
19 different antibiotic resistance patterns were seen among the isolates, the most common
depicted in Table 5.
Table 5: Predominant antibiotic resistance patterns in Goose Enterobacteria. Antibiotic abbreviations are the same
as those in Figure 5.
These studies may be important for identifying sources of fecal coliform contamination
of the Anacostia River and its watershed. Geese defecate freely in and around ponds and coastal
waterways within their migration paths. Indeed, recent studies have shown that geese and gulls
carry more antibiotic resistant coliforms when they nest in urban areas, especially near waste
water, or agricultural water. Many of these isolates were found to have antibiotic resistance
profiles similar to clinical isolates (31,34), suggesting that they may be potent disseminators of
antibiotic resistance determinants (35).
0
20
40
60
80
100
1 2 3 4 5 6 7 8 9 10 11 12
% Is
ola
tes
Re
sist
ant
# of Antibiotics
% of Isolates Resistant to Indicated # of Antibiotics

Plasmid DNA Profiles of Multiple Drug Resistant Bacteria. In addition to changes in the
selection of antibiotics used for MAR analysis, plasmid DNA isolation is underway to determine
the molecular basis of multiple drug resistance seen in many bacterial isolates from CSO sites as
well as animal and human sources. It has been well-established that the wide variation seen in
antibiotic resistance, especially among Gram-negative bacteria, is due to the exchange of R-
factors carried on conjugative R-plasmids (22,24). It has been shown that plasmid transfer
readily occurs among fecal coliforms in the microbial milieu of mammalian gastro-intestinal
systems and in stagnant bodies of wastewater (18,36). Thus, it is reasonable to hypothesize that
the multiple-drug resistance profiles (particularly those which recur frequently) we see in our
isolates are a direct cause of fecal contamination by the CSO system throughout the D.C.
metropolitan area linked to shared R-plasmids. Furthermore, plasmids are easily transferred
between species of bacteria. For this reason, this study was expanded to include other bacteria
known to inhabit the intestinal tract such as Enterococcus faecalis (another indicator, in addition
to E. coli, of recent human fecal contamination [8]), E. coli O157:H7, and Enterobacter spp. (in
which the percentages of ESBL producers have risen sharply over the past few years [37]).
Additional media and other assays have allowed our students to confirm the source of fecal
contaminations, catalogue each isolate by source, and compare singular and multiple drug
resistance profiles of the various water samples (NPS and CSO) to raw fecal samples.
The first attempts at plasmid DNA isolation has begun with individual isolates of MDR
E. coli and Enterobacter spp. from water sources, and human and animal fecal samples taken in
spring 2011. Plasmid isolation was conducted as outlined by Takahashi and Nagano (38) and the
samples electrophoresed on 0.8% agarose gel for 120 minutes at 90 volts. Figures 7 shows some
of the initial results. Figure 7 shows profiles of isolates from horses (lanes 6-9) and geese fecal
samples (lanes 11-16) and human fecal samples (lanes 18-22) taken from Children’s National
Medical Center in Washington, D.C. All the horse isolates were confirmed to be cefoxitin
resistant isolates. The goose fecal samples were inconsistently drug resistant to all antibiotics
tested with no significant resistance pattern observed. Human fecal samples were unanimously
resistant to cefoxitin, piperacillin, streptomycin and tetracycline. Similar patterns of plasmid
banding (with a predominant band at ~30kbp) was observed

Figure 7. Plasmid profiles of multiple-drug resistant fecal coliform isolates from (L to R)
humans (HR). geese (GF) and horse (HR). The single band seen in most profiles was
calculated to be about 30 kb in size compared to the standards in lane M.
These investigations will continue this summer. Furthermore, as planned in the Proposal, isolates
confirmed for plasmid content will be investigated by resistance transfer testing and plasmid
curing (36) to assign resistance genes to plasmid DNA.
Acknowdgments
D.W.M. and E.N.B. would like to thank Stephen Goldstein for help in preparing and editing this
manuscript and Nina Sabzevari for preparing preliminary reports and manuals.

References
1. The Anacostia Project. 1997. NOOA Damage Assessment, Remediation, and Restoration.
Retrieved 10 May 2011 from Anacostia River Watershed Database and Mapping Project.
Web Site: http//mapping2.orr.noaa.gov/portal/AnacostiaRiver/
2. ―Cleaning up the Anacostia River.‖ National Resources Defense Council. 10 May 2011.
Web Site: www.nrdc.org/water/pollution/anacost.asp.
3. Stoddrad, R. et al. 2008. Risk Factors for Infection with Pathogenic and Antimicrobial-
Resistant Fecal Bacteria in Northern Elephant Seals in California. Public Health report.
123: 360-370
4. Combined Sewer System Overview. 2001. DC Water and Sewer Authority. Retrieved 10
May 2011. Web Site: www.dcwasa.com/education/css/combined_sewer.cfm.
5. Guillozet, P. et al. 2001. DC-WASA Combined Sewer Overflow, Anacostia River.
United States Department of Environmental Programs.
6. CSO Overflow Predictions for Average Year. 2004. DC Water and Sewer Authority.
Retrieved 10 May 2011. Web Site:
www.dcwasa.com/education/css/CSO%20Overflow%20Predictions%20Average%20Yea
r.pdf
7. Environmental Protection Agency. 2003. 1998 Section 303(d) List Fact Sheet for the
District of Columbia. Retrieved 10 May 2011. Web Site:
http://oaspub.epa.gov/waters/state_rept.control?p_state=DC#TPOL
8. Hagedorn, C. et al. 1999. Determining Sources of Fecal Pollution in a Rural Virginia
Watershed with Antibiotic Resistance Analysis Patterns in Fecal Streptococci. Appl.
Environ Microbiol. 65: 5522-5531.
9. Holt, J.G. et al.. 1994. Bergey’s Manual of Determinative Bacteriology, 9th Edition.
Williams & Wilkins, Baltimore.
10. Scott, T.M., et al. 2002. Microbial Source Tracking: Current Methodology and Future
Directions. Applied and Environmental Microbiology. 68 (12): 5796-5803.
11. Simpson, J.M. et al. 2002. Microbial Source Tracking: State of the Science.
Environmental Science and Technology. 36: 5279-5288.
12. Parveen, S., et al. 1997. ―Association of Multiple-Antibiotic-Resistance Profiles with
Point and Non-Point Sources of Escherichia coli in Apalachicola Bay.‖ Appl. Environ.
Microbiol. 63:2607-2612.
13. Whitlock, J.E., D.T. Jones, V.J. Harwood. 2002. Identification of the Sources of Fecal
Coliforms in and Urban Watershed Using Antibiotic Resistance Analysis. Water

Research. 36: 4273-4282.
14. Wiggins, B. A. 1996. Discriminate Analysis of antibiotic resistance patterns in fecal
streptococci, a method to differentiate human and animals sources of fecal pollution
in natural waters. Appl. Environ. Microbiol. 62: 3997-4002.
15. Kaspar, C.W., et al., 1990. Antibiotic Resistance Indexing of Escherichia coli to Identify
Sources of Fecal Contamination in Water. Can. J. Microbiol. 36: 891-894.
16. American Public Health Association. 1989. Standard methods for the examination of
water and wastewater, 17th ed., p. 9.99–9.107. American Public Health Association.
Washington, D.C.
17. DendroUPGMA: A Dedrogram Construction Utility. 2002. Web Site:
http://genomes.urv.cat/UPGMA/index.php?entrada=Example3
18. Goyal, S. et al.. 1979. Transferable drug-resistance in bacteria of coastal canal water and
sediment. Water Res. 13: 349–356.
19. Gonzalez A.M. et al. 2001. Relationships between fecal indicators and pathogenic
microorganisms in a tropical lagoon in Rio de Janeiro, Brazil. Department of Biological
Sciences, Institute of Biology, University Federal of Rio de Janeiro, Prédio, Brazil. 944:
97-112.
20. Grabow, W et al.. 1973. Survival in maturation ponds of coliform bacteria with
transferable drug-resistance. Water Res. 7:1589–1597.
21. Grabow, W et al. 1976. Behavior in conventional sewage purification processes of
coliform bacteria with transferable or non-transferable drug-resistance. Water Res. 10:
717–723.
22. Neu, H.C. 1994. The Crisis in Antibiotic Resistance. Science 257: 1064-1073.
23. D’Costa, V.M et al. 2006. Sampling the Antibiotic Resistome. Science 2006: 374-377.
24. Allen, H.K. et al. 2010. Call of the Wild: Antibiotic Resistance Genes in Natural
Environments. Nature Rev. Microbiol. 8: 250-259.
25. Bradford PA.2001. Extended-spectrum β-lactamases in the 21st Century
characterization, epidemiology, and detection of this important resistance threat." Clinic.
Microbiol Rev; 48:933-51.
26. Jacoby, G.A and P. Han. 1996. Detection of Extended Spectrum Beta-lactamases in
Clinical Isolates of Klebsiella pneumonia and Escherichia coli. J. Clinic. Microbiol. 4:
908-911.
27. Fridkin, S at al. 1999. Surveillance of Antimicrobial Use and Antimicrobial Resistance
in United States Hospitals: Project ICARE, Phase 2. Clinic. Infect. Dis. 29: 245-252.

28. Blanco, J.S. et al. 1997. Prevalence of Bacterial resistance to Qunolones and Other
Antimicrobials Among Avian Escherichia coli Strains isolated from Septicemic and
healthy Chickens in Spain. J. Clinic. Microbiol. 35: 2184-2185.
29. Levenstein-van Hall, M.A. et al. 2011. Identical Resistance Genes and Plasmids in
Escherichia coli from Dutch patients, Poultry and Retail Chicken Meat. Ned, Tdsch.
Geneeskd. 155: A3401.
30. Sahm, D.F. et al. 2001. Multidrug Resistant Urinary Tract Isolates of Escherichia coli:
Prevalence and Patient Demographics in the United States in 2000. Antimicrob. Agents
Chemother. 45: 1402-1406.
31. Cole, D. et al. 2005. Free-Living Canada Geese and Antimicrobial Resistance. Emerg.
Infect. Dis. 11: 935-938.
32. Dojeska, M. et al. 2007. High Prevalence of Antimicrobial-Resistance Genes and
Integrons in Escherichia coli Isolates from Black-Headed Gullis in the Czech Republic.
J. Appl. Microbiol. 103: 11-19.
33. Sjolund, M. at al. 2008. Dissemination of Multidrug-Resistant Bacteria in the Arctic.
Emerg. Infect. Dis. 14: 70-72.
34. Kullas, H. et al. 2002. Prevalence of Escherichia coli Serogroups and Human Virulence
Factors in Feces of Urban Canadian Geese. Int. J. Environ. Health Res. 12: 153-162.
35. Middleton, J.H and A. Ambrose. 2005. Enumeration and Antibiotic Resistance Patterns
of Fecal Indicator Organisms Isolated from Migratory Canada Geese (Banta
Canadensis). J. Wildlife Dis. 41: 334-341.
36. Daini O. A. and Adesemowo A. 2008. Antimicrobial Susceptibility Patterns and R-
Plasmids of Clinical Strains of Escherichia coli. American Journal of Basic and Applied
Sciences. 3: 397-400.
37. Sidjabat, H. et al. 2007. Identification of Plasmid-Mediated Extended Spectrum and
AmpC β-lactamases in Enterobacter spp. Isolated from Dogs. J. Med. Microbiol. 56:
426-434.
38.

Appendix A: Student Manual for the isolation, characterization and MAR
analysis of fecal coliforms.
Day 1—Colony Collection
1) Water samples should be processed within 48 hours of collection. Shake acquired water
samples vigorously to mix contents that may have settled. Organic material caught in the
sample is normal and inconsequential.
2) Use vacuum filtration located next to the fume hood to filter the samples.
a. Turn on the vacuum in the hood and attach a filtration cup to the filter flask.
b. Remove the lid of the filtration cup and add desired water volumes
i. Late Spring—Early Fall: 5-10mL water or one of each
ii. Late Fall—Early Spring: 20-30mL water or one of each
c. Filter an additional 10-20 mL of distilled water after the contaminated water.
d. Dip tweezers in alcohol and remove the filter paper in the cup and place onto
plate consisting of MacConkey’s agar, grid-side up.
i. Place it down at an angle to avoid air bubbles and ensure the most contact
between the paper and the agar. Using the sterilized tweezers, gently press
out any remaining air bubbles.
3) Place topside down in 37C incubator overnight.
**NOTE: Plates must be read within 24 hours to ensure late sugar fermenting
organisms do not influence original results.
Day 2—Master Plates
1) Remove plates from incubator to ensure sufficient growth. If sufficient growth is not
observed, it may be necessary to filter a larger volume of water to obtain a higher
quantity of colony forming organisms.
2) Using pre-formed grid papers align fresh MacConkey's plates on top of the grid. Mark
the bottom of the plates to orient them. This differentiates the first colony to the last
colony when you read/compare them at a later date.
a. Label fresh plates with sample name/number from the filtration plates and
[current] date.
b. Square plates = square grid; round plates = round grid papers
3) Using sterile toothpicks, collect fermenting (red) colonies individually from the filter
plates and transfer by pricking gently into the new MacConkey’s plates. One colony per
square.
4) Place topside down in 37C incubator overnight. These plates will be referred to as the
―master plates‖ and must be read within 24 hours to ensure late fermenting organisms do
not contaminate original results.
Day 3—Classification/Characterization by Differentiation Media
1) When you read the previous days plates, note/record the color, shape and other unusual
physical characteristics of each colony. Your colonies should be primarily [Lac+]
pinkbrick red, round formations, and may have a bile precipitate present.

2) Align 8 grid papers one after another. The first placement is your master plate followed
by one each of your differentiation media:
a. Desoxycholate (Desoxy)
b. Eosin Methylene Blue (EMB; or // label)
c. Hektoen Enteric (HE)
d. Simmon’s Citrate
e. MacConkey’s (MAC; or / label)
f. Xylose Lysine Desoxycholate (XLD)
g. Sorbitol MacConkey’s (S. MAC)
Expected Results for E. coli (Refer to the Difco Manual):
Desoxy Red colonies with a surrounding bile precipitate
EMB Deep red—purple colored colonies with a greenish metal tinge
HE Large yellow—salmon-pink colonies with bile precipitate
Citrate No growth: an important test because it distinguishes
E. coli from Enterobacter (which does grow and elicits media color change
from green to blue). Change in color should be recorded as positive for
Enterobacter.
MAC Pinkish—brick-red colonies and bile precipitate
XLD Large, flat yellow colonies
S.
MAC
Pink—red colonies with bile precipitate; sorbitol non-fermentation is indicative
of O157:H7 Enterohemorrhagic E. coli [EHEC]
You may also be recommended to carry out the following confirmatory tests on selected
isolates: a. Gram staining; b. IMVic tests; c. API test strips for Salmonella/Shigella; d. TSI agar stabs; e. LB Salts (6.5%)
**This test attempts to isolate Streptococcus faecalis and growth of mucoidal,
round opaque colonies indicates a positive result. Gram stain sample organisms
to confirm.
3) Label each plate with the corresponding Master Plate information and [current] date. All
plates should be marked and oriented the same direction. Using a sterile toothpick,
transfer one colony at a time to each of the plates. Complete one master plate at a time
and remain consistently centered for ease of replica plating later.
a. You only need to use a new toothpick when going from one master plate to
another; however you can use one toothpick per master plate across all media.
b. You will be transferring one colony at a time so that the grids align across ALL
media plates. Colony 1 on the mater plate corresponds with colony 1 on the
subsequent media plates. It is okay for the same toothpick to go from HE to
citrate, etc.
4) Incubate topside down at 37C overnight.

Day 4—Antibiotic Assay
1) Record the results from these plates by noting the appearance of the plates, color changes,
any significant patterns and how much growth has occurred. If there are a few colonies,
be sure to count them and note this number.
a. Observe all physical characteristics of each colony individually—color, shape,
aggregation, surrounding media, etc. This is important and informative when we
consider source contamination of the water sample in addition to the further
classification of each colony. You will use the provided media descriptions to
organize and clarify or results.
2) Using the original master plates, transfer one colony at a time to antibiotic plates in the
same replication pattern used for differentiation. The antibiotics and concentration used
are:
a. Aztreonam: 0.05 μg/mL
b. Geneticin: 25 μg/mL
c. Nitrofurantoin: 0.64 μg/mL
d. Kanamycin: 50 μg/mL
e. Ofloxacin: 10 μg/mL
f. Cefoxitin: 0.4 μg/mL
g. Piperacillin: 25 μg/mL
h. Streptomycin: 12.5 μg/mL
i. Neomycin: 50 μg/mL
j. Tetracycline: 25 μg/mL
k. Choramphenicol: 25μg/mL
3) Using the same technique and setup as above transfer one colony at a time from the
MacConkey’s master plates onto the antibiotic plates. You should have 11 antibiotic
plates per water sample.
4) Incubate the plates topside down at 37C overnight.
A. Isolation of E. coli from anal swabs, animal feces and raw sewage
1) For anal swabs (human and animal).
a. Take a sample immediately after defecation and swipe directly onto an EMB plate
and incubate for 48 hours.
b. Alternatively, the swab may be placed in 1 mL of EC broth, incubated for 8 to 16
hours at 44.5oC (in a water bath) before plating onto EMB plates.
2) For fecal specimens,
a. Place approximately 1 gm of material in 10 ml of 1% tryptone broth and shake
vigorously to disperse the material. Use sterile glass rod if necessary.
b. Transfer 1 mL amounts to 5 ml of EC broth and incubate at 44.5oC for 8 to 16
hours. Plate samples (streaking is sufficient) onto EMB plates and incubate at
37oC for 24 to 48 hours.

3) For raw sewage, pipette 1 mL amounts into 5 ml of EC broth and process as described
above.
Transfer fermentative colonies (deep red in coloration) to fresh EMB plates and screen for E. coli
as above.
B. Data Calculations and other Schematics
Susceptible: 015% growth; Sensitive: 1579% growth; Resistant: ≥80%
1) For each ISOLATE
a. Multiple Antibiotic Resistance Index for each isolate calculated as follows:
MAR Index = (# of colonies grown/total # of AB’s tested) x 100 =
b. Present this information as a bar graph
c.
2) For each CSO/NPS
a. MAR Index for each AB calculated as follows:
AB MAR Index = (total # resistant isolates/total # isolates) x 100 =
b. Present this information as a bar graph.
c. Make a chart of the samples/antibiotics and write down the number of colonies
that showed growth per total number of colonies poked onto the antibiotic plates.
a. Note if any plates have turned a greenish color.
b. In addition, your record will also need to note growth (as +)/no growth (as -) for
each colony inoculated onto the plate. This means, for each square AB plate, you
will have a series of 64 +/- notations.
c. You will use the above information later to develop analytical tools such as
comparative matrices and isolate ―fingerprints‖ called Dendograms.

Appendix B: Fecal Contamination Analysis of the Anacostia, by Gaurav Dhiman
and Mark Mallozzi (―Do We Need Biotechnology?‖ Dean’s Seminar Class).
Presented at the George Washington University Undergraduate Research
Symposium. April 25th
2011.

Appendix C: MAR Profiles of Fecal Escherichia coli from Point and Non-Point
Sources Along D.C. Metro Area Waterways, by Emma N. Burns, Yalin Firinci,
Monica Passi, Nina Sabzerai and David Morris.
Presented at the 16th
Annual Maryland Water Monitoring Council Conference,
November 2010.

Information Transfer Program Introduction
Dr. Tolessa Deksissa and water consultant Dr. Cat Shrier coordinated the 14-week DC Area Water IssuesProgram (DCAWIP), offered as a pilot program during the fall 2010 semester by the University of the Districtof Columbia's College of Agriculture, Urban Sustainability and Environmental Sciences (CAUSES).DCAWIP was created to implement a strategic goal of the DC Water Resources Research Institute: togenerate greater involvement by students and faculty at all of the area universities in water educationprograms, as well as that of other DC area water stakeholders; and to develop a network of peer reviewers forDCWRRI-funded research. This multi-disciplinary seminar program featured expert speakers from waterorganizations and explored numerous aspects of water and watersheds in the DC area. DCAWIP drew anaverage of 40 attendees per week, indicating a strong interest by participants to come together on a regularbasis to learn more about area issues and programs, and to develop opportunities for greater student and otheruniversity involvement in the larger community of water professionals.
A new Research Associate was hired to support and strengthen our Information Transfer Program. Ms. GerriWilliam has an extensive background as a technical writer and a radio talk show host on environmental issues.She has already contributed to revamping our Water Highlights Newsletter from biannually to quarterlyissues.
Information Transfer Program Introduction
Information Transfer Program Introduction 1

DC Water Issues Forum and Water Research FacultyProfessional Development Program
Basic Information
Title: DC Water Issues Forum and Water Research Faculty Professional DevelopmentProgram
Project Number: 2010DC110BStart Date: 3/1/2010End Date: 2/28/2011
Funding Source: 104BCongressional District: DC
Research Category: Not ApplicableFocus Category: Education, None, None
Descriptors: NonePrincipal
Investigators: Tolessa Deksissa, Catherine Shrier
Publications
There are no publications.
DC Water Issues Forum and Water Research Faculty Professional Development Program
DC Water Issues Forum and Water Research Faculty Professional Development Program 1

DC Water Issues Forum and Water Research Faculty
Professional Development Program
Final Report
Submitted to
DISTRICT OF COLUMBIA WATER RESOURCES RESEARCH INSTITUTE
By:
Dr. Tolessa Deksissa (PI)
Agriculture Experiment Station
College of Agriculture, Urban Sustainability and Environmental Sciences
University of the District of Columbia
Dr. Cat Shrier (Co-PI)
Watercat Consulting LLC
Washington, DC
February 2011

TABLE OF CONTENT
Abstract ........................................................................................................................................... 1
1. INTRODUCTION .................................................................................................................. 2
1.1. Background ..................................................................................................................... 2
1.2. Goal and Objectives ........................................................................................................ 3
1.3. Scope of Work ................................................................................................................ 3
2. PROGRAM COMPONENTS ................................................................................................. 3
2.1. Internship and Student Volunteers .................................................................................. 3
2.2. Seminar Programs and Speakers ..................................................................................... 4
2.3. Receptions and Sponsors ................................................................................................ 7
2.4. Tours, Fairs, and Other Events ....................................................................................... 8
3. EVALUATION OF PARTICIPATION AND OUTCOMES................................................. 8
3.1. Participation Evaluation and Statistics................................................................................ 8
3.2. Program Evaluations ......................................................................................................... 11
3.3. Additional Outcomes ........................................................................................................ 12
3.4. Publications ....................................................................................................................... 12
4. CONCLUSIONS AND RECOMMENDATIONS ............................................................... 12
APPENDIX B: PROGRAM FLYERS AND ANNOUNCEMENTS ........................................... 15
APPENDIX C: WEEKLY PROGRAM HANDOUTS ................................................................ 20
APPENDIX D: SPECIAL PROGRAM ANNOUNCEMENTS ................................................... 34
APPENDIX E: PROGRAM EVALUATION FORM .................................................................. 36

1
Abstract
The DC Area Water Issues Program (DCAWIP) was offered as a pilot program during the Fall 2010 semester by the University of the District of Columbia’s College of Agriculture, Urban Sustainability and Environmental Sciences (CAUSES). Funded by the US Geological Survey (USGS) through DC Water Resources Research Institute (DCWRRI), this Program was developed with the goal of creating a more cohesive water research community in the DC area. DCAWIP was created to implement some of the measures recently identified in strategic planning activities by the DC Water Resources Research Institute, which had indicated the need for greater involvement by students and faculty at all of the area universities in water education programs, as well as the involvement of other DC area water stakeholders; and for the development of a network of peer reviewers for DCWRRI-funded research.
DCAWIP was a comprehensive set of university events open to all DC Area students, faculty, water managers, and members of the general public who are interested in water. DCAWIP was a multi-disciplinary program, exploring issues related to the science and engineering, policy, and socioeconomic aspects of water and watersheds in the DC area. Every Thursday afternoon for 14 weeks, a seminar series was offered in which speakers from water “stakeholder” organizations provide insightful, practical information about DC water issues and their role in the water community, followed by sponsored refreshments and community-building reception.
Initial speakers included leadership from DC Water, Washington Aqueduct, DC Department of the Environment, Interstate Potomac River Basin Commission, and Metropolitan Washington Council of Governments, provided an introduction to DC area watersheds; water supply, treatment, and wastewater systems; storm water and flooding issues; habitat issues; stakeholders and regional coordination efforts. The middle series of speakers focused on water-related opportunities for educational programs and degrees, jobs, internships, scholarships, volunteering. The final speakers were on topics selected by the “DC Area Water Community” participants,” including urban gardening and green spaces; wastewater reuse and communications; and water security issues. Additional events provided included art exhibits, a book signing, a film screening, and a boat tour of the Anacostia River.
DCAWIP drew an average of 40 attendees per week, with at least 30 attendees at all programs, and two programs with attendance of more than 50. The program included interns and volunteer students from UDC, Catholic University, Howard University, the University of Maryland at College Park, George Washington University. Participants registered and submitted evaluation forms and self-identifying data. There was consistent support for reception sponsorships, which was not part of the original proposal budget. The inclusion of food was found to be important both in attracting attendance and in providing opportunities for participants to continue discussion and generate new opportunities for collaboration and understanding. The program created opportunities for collaboration between students, faculty, and staff with area water providers and other water stakeholders, such as the Anacostia Watershed Society, Metropolitan Washington Council of Governments, DC Department of the Environment, DC Water, and Washington Aqueduct.
The DC Area Water Issues Program (DCAWIP) demonstrated a strong interest by students, faculty, staff, and area stakeholders to come together on a regular basis to learn more about area issues and programs, and to develop opportunities for greater student and other university involvement in the larger community of water professionals.

2
1. INTRODUCTION
The DC Area Water Issues Program (DCAWIP) – offered by UDC’s College of Agriculture, Urban Sustainability and Environmental Sciences (CAUSES) -- was developed as a pilot program during the Fall 2010 semester. DCAWIP was created as a comprehensive set of university events open to all DC Area students, faculty, water managers, and members of the general public who are interested in water. DCAWIP explored issues related to the science and engineering, policy, and socioeconomic aspects of water and watersheds in the DC area, including the suburban areas of Maryland and Virginia. Funded by the US Geological Survey (USGS) through DC Water Resources Research Institute (DCWRRI), the goal of DCAWIP was to create a more cohesive water research community in the DC area.
1.1. Background
The District of Columbia Water Resources Research Institute (DCWRRI) has taken several steps in recent years to build the capacity of the Institute to fulfill its statutory mandate and its mission to DCWRRI’s mission, which is to provide the District of Columbia with interdisciplinary research support to identify DC water resources problems and contribute to their solution. The Institute has also taken steps to address needs identified in prior USGS Evaluation Committees, and to go beyond these requirements to become a “center for excellence” in water research.
In 2009, DCWRRI commissioned Cat Shrier, President of Watercat Consulting LLC, to complete an external review of its Resources and Accomplishments, resulting in a White Paper entitled “DCWRRI Preliminary Inventory and Assessment of Resources and Accomplishments” (updated October 23, 2009), which includes recommendations to address the concerns raised by the Evaluation Committee and in additional communications with USGS.
As noted in this White Paper, while the District of Colombia includes several major universities within an area of roughly 70 square miles, there is no cohesive water research community, nor is there any individual university with a strong and multidisciplinary water research focus. The White Paper and recent USGS evaluations had identified the need for greater involvement by students and faculty at all of the area universities, as well as to involve the DC water stakeholders; and for the development of a network of peer reviewers for DCWRRI-funded research. Individual faculty at DC universities had expressed concerns regarding the need for a greater understanding of proposal expectations for grant funding programs, information on related research underway at other DC universities, and opportunities for the development of multidisciplinary teams to address water resources research. Several DC area agencies and policymakers have expressed a strong interest in developing the District of Columbia as a more sustainable or “green” city, providing leading research and programs on urban sustainability. Stakeholders who comprise the DCWRRI Advisory Board (including Washington Aqueduct; DC Water and Sanitation Authority; Metropolitan Washington Council of Governments; Interstate Commission on the Potomac River Basin; DC Department of Environmental Protection; Friends of Rock Creek; and Chesapeake Bay Foundation) had identified research needs that can be addressed by DC area faculty, as well as the need to develop future employees with an understanding of DC water issues. DC-based federal and local agency personnel, consulting firms and other water professionals, have expressed similar research and hiring needs which can be met, in part, through local university researchers and graduates.
Based upon this information and feedback received from the Stakeholder Advisory Board, DCWRRI staff, and UDC Deans, the DCAWIP proposal was developed by Dr. Shrier and UDC Research Associate (and current Director of the UDC Professional Master’s Degree in Water Resources Management) Dr. Tolessa Deksissa as a set of coordinated programs to be funded, in part, through the USGS 104B program, to simultaneously address several of the recommendations identified in the White Paper and in previous evaluations completed by USGS.

3
1.2. Goal and Objectives
The goal of DCAWIP was to create a more cohesive water research community in the DC area. This goal was to be met through the development of a pilot program consisting of a comprehensive set of university events open to all DC Area students, faculty, water managers, and members of the general public who are interested in water, enabling participants to explore issues related to the science and engineering, policy, and socioeconomic aspects of water and watersheds in the DC area, including the suburban areas of Maryland and Virginia.
Specific objectives include: - Provide a pilot set of seminars to serve as an “Introduction to DC water issues” with presentation
made by stakeholders, hosted at UDC but open to all DC area university students, faculty, and staff, as well as stakeholders and the general public. Incorporate opportunities for participants to talk less formally over a reception.
- Provide information for faculty, students, and staff for information on funding, scholarship, and grant programs.
- Provide opportunities for water tours - Provide an internship
- Evaluate the pilot programs and review opportunities for a water research symposium and institutionalization of the seminar series
1.3. Scope of Work
DCAWIP was developed to include:
1) a paid student internship 2) a Weekly Seminar Series 3) a Boat Tour of the Anacostia River, as well as art exhibits, a book signing, and film screening 4) Fairs for Students and Faculty to develop Research Opportunities, Scholarships, Grants, Work,
and Internships
2. PROGRAM COMPONENTS
2.1. Internship and Student Volunteers
A competitive internship program was announced by Principal Investigator Dr. Tolessa Deksissa and Co-Principal Investigator Cat Shrier, using a list of faculty in water-related disciplines throughout DC. A copy of the internship announcement is provided in Appendix A. After interviewing the respondents, two interns were retained by Watercat Consulting LLC during August 2010 to assist with preparation of the seminar series. Diego Antezana, a Civil engineer student at Catholic University, was offered the internship funded through the original 104B grant, while additional funding was sought for a second intern, Arielle Benjamin, an undergraduate chemical engineering student from Howard University, who was paid by Watercat Consulting for work performed during August 2010. Additional funding support was not found for Ms. Benjamin, who continued as a volunteer until mid-September.
Mr. Antezana, the paid intern, provided program management support including:
Weekly mailings to the “DC Area Water Community” email list Weekly updates of the “DC Area Water Community” email list with new participant from the sign-
in sheets Coordination with speakers and sponsors Setting up registration and overseeing volunteers

4
Ordering food and setting up the weekly receptions
Based upon experience acquired during this internship, Mr. Antezana was later able to secure a position with a construction management company. After the start of the fall semester, funding was also sought for a third intern, Antonia (Toni) Davidson, a professional master’s degree student in water resources management at UDC, who worked on weekly surveys of participants in the seminars. Funding was not available for Ms. Davidson. However, Ms. Davidson continued to support the program as a volunteer throughout the semester, as did several other students in the UDC professional master’s degree program in water resources management. Trevor Cone, a master’s degree student in water resources engineering at the University of Maryland, also provided volunteer support for registration at the weekly seminar programs and with the post-program survey. Volunteers were identified as “university ambassadors” and their support was critical to the success of the program. The university ambassadors supported program implementation including setup and cleanup of weekly registration and reception.
2.2. Seminar Programs and Speakers
The seminar series was set up as a weekly program offered at UDC, open to all university students,
faculty, staff, stakeholders and the general public. The programs were developed to cover a broad array
of topics, providing an opportunity for area water stakeholders to “tell their own story,” and providing
opportunities for a facilitated dialogue between the participants and the speakers, as well as less formal
communications over a reception following each program.
The original proposed title of the program was the “DC Water Issues Program.” Between the time of the
proposal and the start of the program, however, the water utility serving the District of Columbia, the DC
Water and Sewer Authority, had changed their “branding” and is now known as “DC Water.” DC Water
requested that the name of the UDC program be changed. The revised program title, the “DC Area
Water Issues Program,” proved to be more inclusive, encouraging greater participation by students,
faculty, and residents from Virginia and Maryland, including sponsorship by the Maryland Water
Resources Research Institute of one of the weekly program receptions, and participation by a UMD
university ambassador. Given that DC’s watersheds, including the Potomac and Anacostia Rivers, are
shared with Virginia and Maryland, and the residents and employees of the region often cross borders
between DC, Virginia, and Maryland, this title change and more inclusive approach to the program was
fortuitous.
The pilot weekly seminar program was held during the Fall Semester of 2010, and coincided with the
launch of the College of Agriculture, Urban Sustainability, and Environmental Sciences (CAUSES).
CAUSES provided essential support for the program, including review of program announcements,
certificate of appreciation for invited speakers, volunteers, reception sponsors, and exhibitors. CAUSES
is a reorganization of related programs at UDC including:
Three academic programs: (Department of Architecture and Urban Design; Department of Nutrition
and Food Sciences; and Department of Environmental Sciences and Urban Sustainability)
Four research units: (Agricultural Experiment Station (AES, a land-grant unit); Architecture
Research Institute (ARI); Water Resources Research Institute (WRRI); and World’s River Institute
(WRI)
Four outreach programs: Family and Consumer Sciences & the Center for Nutrition Diet and Health
(CNDH); Environment and Natural Resources & the Institute for Applied Urban Agriculture; 4-H and

5
the Center for Youth Development; and Community Resources and Economic Development and
the Center for Cooperatives)
The Fall 2010 semester also featured the launch of the CAUSES graduate Professional Science Master’s
Program in Water Resources Management – the first graduate program of its kind offered by a historically
black college or university (HBCU). The DCAWIP Principal Investigator, Dr. Tolessa Deksissa, is the
director of the PSM in Water Resources Management, and several of his students were volunteers and
participants in the weekly programs.
To develop a means of announcing and promoting the program, the DCAWIP Directors (PIs) and interns
met with the CAUSES Marketing Specialist, Mary Elliot, who reviewed the meeting announcements.
Because of new university requirements regarding contact with the press and use of the university brand,
the announcements of the program were limited to weekly emails and flyers. Copies of the emails and
flyers distributed for the seminar programs are provided in Appendix B.
The seminars were held at UDC each week from 4:00-5:30 pm, followed by a reception from 5:30-6:30
pm. Each of the weekly seminars was designed with a similar structure, including:
An introduction to CAUSES and the DCAWIP by PI Tolessa Deksissa and Co-PI Cat Shrier,
respectively
Announcements of upcoming water-related events and sponsor recognition
A speaker program
A facilitated dialogue with the audience (the “DC Area Water Community”)
A sponsored reception, along with related fairs, exhibits, and other activities
The “Water Peace” was added to the program to provide community members with an opportunity to
greet one another at the start of each program, and to support open and civil dialogue.
Copies of the seminar programs for each of the seminars are provided in Appendix C. Copies of the
special programs for film screening and boat tour are provided in Appendix D.
The reception sponsorships and the additional events (including a boat tour, film screening, fairs and art
exhibits) are discussed in sections 2.2 and 2.3 of this report, respectively.
DCAWIP participants were asked to sign in to registration at each program, and to complete an
evaluation form, shown in Appendix E.
The seminar topic included the following:
The first of the weekly seminar programs was held on August 26, 2010. This initial program was
developed as a joint kickoff program for the National Capital Region Flood Risk Assessment
Program, in order to announce a memorandum of understanding between UDC, the University of
Maryland (UMD), and George Mason University (GMU) to pursue research addressing severe flood
risks in the DC area. Presentations were given by researchers from UDC, UMD, and GMU on area
flood risks and responses. This program was promoted by UMD and GMU as well as UDC.
The next 7 programs featured speakers from area stakeholder groups, including several members
of the DCWRRI Stakeholder Advisory Board, providing an introduction to DC area water issues,
including:
Getting to Know DC’s Water, Watersheds, and Stakeholders
Joe Hoffman, Executive Director, Interstate Commission on the Potomac River Basin

6
DC Drinking Water Supply Systems and Treatment
Tom Jacobus, General Manager, Washington Aqueduct
Rich Giani, Director of Water Quality Programs, DC Water
Regional Cooperation: The Anacostia Watershed Restoration Plan
Ted Graham, Director of Environmental Programs, Metropolitan Washington Council of
Governments
DC Department of Environment’s Water Pollution Control Approach
Hamid Karimi, Deputy Director, DC Department of Environment
Water in DC’s History and Culture
Jack Wennersten, Author, Anacostia: Death and Life of an American River
Commodore Steve Ricks, Chair, Historic Anacostia Boating Association
DC’s Federal Water “Footprint” and Greening the Federal House
John Simpson, GSA Office of Federal High Performance Green Buildings
Water Energy and Power in DC
Ernest Jolly, DC Water, Beverly Perry, PEPCO, and Sheila Hollis, Public Service
Commission)
The next three seminars (Seminar 9, 10, and 11) focused on opportunities for university students,
faculty, and staff get involved in water by learning about workforce development and jobs training
programs; advocacy and volunteer opportunities; scholarships and grant funding programs. During
the weekly reception that followed these programs, opportunities were provided for area programs
to provide information and sign up DC area water community members for their programs (the
“fairs”). The programs offered during these middle seminars were:
Water Workforce Development and Green Jobs in DC -- plus water-related green jobs
training program fair (Annette Gantt, Earth Conservation Corps, John Wasiutynski, DC
Department of Environment, and Ron Lord, International Association of Plumbers and
Mechanical Officials)
DC Area Water Advocacy Roundtable and Film Screening on Global Water Advocacy (With
Dottie Yunger, Anacostia Riverkeeper, Brent Bolin, Anacostia Watershed Society; Irv
Sheffey, Sierra Club, Paul Schwartz, Clean Water Action, plus film screening and dialogue
with producer/writer/director Jim Thebaut)
Funding Opportunities for Water Research and Education, plus scholarship and grant funding
program fair (Bill Hare, DCWRRI/USGS, Jim Dobrowolski, USDA National Institute of Food
and Agriculture; Greg Lank, USEPA “People, Prosperity, and the Planet (P3)”; and Lindsay
Birt, Doctoral Candidate and National Academy of Sciences Science & Policy Fellow)
The final three program topics were selected with input from the DC Area Water Community,
addressing more advanced topics of interest to the participants, namely:
Water, Trees, and Gardens in the DC Area (Sandy Farber Bandier, Master Gardener
Program Coordinator, DC Cooperative Extension; and Marcelo Lopez, Wiles Mensch
Corporation, on behalf of Casey Trees)
Wastewater Treatment, Reuse, and Communications in DC Area (Sudhir Murthy, DC Water,
and Laurens van der Tak, CH2M HILL)

7
Community-Based Water Resiliency (Nushat Thomas, US Environmental Protection Agency
Water Security Division)
The final program also featured a presentation by Drs. Deksissa and Shrier on the DCAWIP program
results and initial evaluation, and recognition of the speakers and sponsors.
The possibility was explored for offering the seminar with the option to provide university credit, with
additional assignments and learning objectives for students. Administrative requirements and deadlines
for fall semester courses made this option infeasible. However, there were several university faculties
who required or recommended students to attend the seminars as part of their own courses, as well as
continuing education credits provided to program participants, including the Master Gardner program
offered through UDC’s Cooperative Extension program.
2.3. Receptions and Sponsors
One critical element of the program was the inclusion of sponsored receptions after each seminar. The receptions provided opportunities for the audience to have further discussion with the speaker(s), distribute information on local water events, and build stronger relationships within the community. The original seed grant from USGS did not include funds to support the sponsored receptions, but area stakeholders were invited to provide sponsorship support as in-kind support through purchase and donation of Giant supermarket gift cards. To ensure maximum value of participation for DC Area Water Issues Program (DCAWIP) sponsors, DCAWIP worked with JMT and EBA consulting firms to develop sponsor packages, which included:
Company name and logo displayed on DCAWIP handouts for the seminar sponsored, and for the all-semester program (see Appendices B and C)
An exhibit table to pass out company brochures and give-aways (e.g. pens) during the registration and reception
Discounted parking passes
Recognition and an opportunity to address the community during the seminar
Company name and logo displayed on the auditorium screen
Preparation for the weekly reception began on Monday with an estimated cost of the food, paper goods, and inventory of supplies for the upcoming seminar reception. By Wednesday the order was placed by phone to the deli at Giant, located across the UDC campus on Connecticut Avenue. All food was purchased using the Giant gift cards at the time of pickup on Thursdays afternoon. Because the student intern and volunteers picked up the food and set up the receptions, the costs for each reception were minimized. Reception sponsors included:
Johnson, Mirmiran, and Thompson (JMT)
EBA Engineering
University of the District of Columbia
Interstate Potomac River Basin Commission
Metropolitan Washington Council of Governments
Maryland Water Resources Research Center
International Association of Plumbers and Mechanical Officials (twice)
Watercat Consulting LLC
CH2M HILL

8
2.4. Tours, Fairs, and Other Events
The weekly seminars and receptions were supplemented with several events designed to encourage
greater appreciation for and understanding of DC area water issues.
One of the additional events was a presentation and boat tour, scheduled on November 11, organized on
the Veteran’s Day Holiday, which fell on a Thursday, when the seminars were otherwise held. The boat
tour was organized through the Anacostia Watershed Society (AWS), led by AWS Executive Director Jim
Foster, with a presentation and lunch with the AWS staff.
Other events were organized during or after the weekly seminar receptions, including:
Exhibits of artwork featuring scenes of the Anacostia River by local artist Bruce McNeil.
A book signing by author John Wennersten of his book, Anacostia: Death and Life of an
American River and display of “essential water books” from the book collection of Adam
Shrier
A film screening and conversation by filmmaker Jim Thebaut, Writer/Executive Producer of
the Running Dry Film Series, including a 20-minute preview of his film “Running Dry: Beyond
the Brink” on the Australian drought and global security issues related to water, and a 5-
minute preview of “Running Dry: South Africa” about urban water education. The special
program followed the Water Advocacy seminar and reception.
Multiple “fairs” were offered with tables provided for organizations on green jobs training
programs, scholarship and grant funding applications, and volunteer opportunities with water
advocacy organizations and gardening programs.
3. EVALUATION OF PARTICIPATION AND OUTCOMES
3.1. Participation Evaluation and Statistics
Participation in each of the seminars was determined by the registration forms and evaluated. The total
attendance for each week and sample demographic data of the participants for week one is shown in
Figure 1 and Figure 2, respectively.
Attendance ranged from 30 to 80, including speakers, directors, interns, and sponsor. Figure 2 shows the
attendance breakdown of attendees based on the sign-in sheets for each week.
The highest attendance occurred at Seminar 1, where the kickoff for a MOU between UDC, UMD, and
GMU was announced to research regional severe flood risks and protections in the National Capital
Region (see Figure 1). . The seminar targeted students, faculty, staff, government agency, non-profit,
consultants, and other members of the DC community. The demographics of participants on week one
is illustrated in Figure 2. The majority of the attendees were students from universities including UDC,
Howard, Catholic, UMD, and GWU. The majority of participants were from UDC.

9
1 - Flood Risks
2 - Getting to know DC's Water
3 - DC Drinking Water Supply
4 - Anacostia Watershed
5 - DDOE Pollution Control
6 - History and Culture
7 – DC’s Federal Water
8 - Water, Energy, and Power
9 - Green Jobs in DC
10 - Water Advocacy
11 - Funding Opportunities
12 - Trees and Agriculture
13 - Wastewater and Reuse
DCAWIP OVERALL ATTENDANACE
0
10
20
30
40
50
60
70
80
1 2 3 4 5 6 7 8 9 10 11 12 13
Seminar By Week
Nu
mb
er
of
Pa
rtic
ipn
ts 1 - Flood Risks
2 - Getting to know DC's Water
3 - DC Drinking Water Supply
4 - Anacostia Watershed
5 - DDOE Pollution Control
6 - History and Culture
7 – DC’s Federal Water
8 - Water, Energy, and Power
9 - Green Jobs in DC
10 - Water Advocacy
11 - Funding Opportunities
12 - Trees and Agriculture
13 - Wastewater and Reuse
DCAWIP OVERALL ATTENDANACE
0
10
20
30
40
50
60
70
80
1 2 3 4 5 6 7 8 9 10 11 12 13
Seminar By Week
Nu
mb
er
of
Pa
rtic
ipn
ts
Figure 1. The total attendance for each week: the highest is number was recorded on the 1
st
(flood risks) and 8th week (DC drinking water supply)
A
UDC
62%
American
7%Catholic
5%Maryland
18%
George
Mason
8%
B
Students
49%
Faculty
9%
Agency
19%
Other
2%
Staff
13%
Consultants
6%
Non-Profit
2%
Figure 2. Demographics of participants on the basis of institution (A) and profession (B) on week one
Seminar 2, Getting to Know DC’s Water Resources totaled 39 attendees, a majority of whom were
students, with several members of the professional community in attendance, possibly due to outreach
to the local chapter of the American Water Resources Association.
Seminar 3, DC Drinking Water Supply Systems and Treatment attendance improved to 47 attendees
and there was a slight increase in both faculty and staff. This seminar also included consulting firm
sponsors and outreach to the Chesapeake Section of American Water Works Association. There was a
display provided by the sponsors, with “giveaways” (e.g. pens) that attracted additional attendees.
Seminar 4, Anacostia Watershed Restoration Plan, totaled 34, with a slight increase in staff and faculty,
including Dr. Harriet Phelps and others who have been involved in research related to the Anacostia
River.
Seminar 5, Water Pollution Control Approach attendance totaled 36, with a major increase in staff
members, tripling the normal weekly attendance. This was the first week that staff out-numbered

10
student population. We also had increased attendance from government agencies and non-profit
organizations.
Seminar 6, Water in DC’s History and Culture attendance totaled 33 members of our water community,
and included recreational boaters interested in the Historic Anacostia Boating Association. This
program was on a night with major rainfall and some flooding in the streets.
Seminar 7, Federal Water and Greening the Federal House totaled 33 members of our water
community, with peak faculty attendance this week, reaching 8 members. This program was
scheduled to coincide with the GreenGov conference of federal agency personnel involved in
sustainability efforts at federal facilities. This program was sponsored by the International Association
of Plumbing and Mechanical Officials, who subsequently provided a speaker for the Water and Green
Jobs Training program.
Seminar 8, Water, Energy and Power, had the second highest turnout, totaling 51. This program also
included discussion from audience members involved in water and energy studies from the Washington
Aqueduct and Colorado River Water Conservation District.
Seminar 9, Water Workforce Development and Green Jobs, was developed to reach out to students as
possible to share with them the opportunities available in the DC area to find jobs or volunteer
experience. Due to exam week, many of the undergraduate and graduate students typically in
attendance were not able to attend this seminar. However, there were several students from jobs
training programs hosted at the DC Community College, and more nonprofit community members and
professional associations were present. This program also included attendance by EPA staff involved in
water workforce development.
Seminar 10, DC Area Water Advocacy, had 30 people, and also coincided with term papers, so fewer
students were able to attend, although there was greater participation from members of water advocacy
organizations, including the Anacostia Watershed Society, which led the subsequent Boat Tour and has
developed a Watershed Steward Training Program with UDC.
Seminar 11, Funding Opportunities for Water Research and Education, had 34 participants and
speakers, despite the need to change rooms due to a leak in the ceiling, on a night with major flooding
in the streets.
Seminar 12, Water, Trees, and Gardens in the DC Area, including displays from the UDC Cooperative
Extensive gardening and ethnic food programs, and attendance by several consultants and federal
agency personnel.
Seminar 13, Wastewater Treatment, Reuse, and Communications in the DC Area, included 37
attendees, including several students who were able to talk with the Director of Wastewater Research
for DC Water regarding potential research opportunities.
Seminar 14, Community-Based Water Resiliency, with 34 attendees, also included a ceremony in which
interns, speakers, volunteers, and sponsors were recognized with gift bags.

11
3.2. Program Evaluations
Evaluations forms were developed initially to support potential for the seminars to be offered for academic
credit. Participants were asked to complete forms each week addressing questions including the
following:
Did the seminar meet your learning expectations?
Was this seminar taught at the appropriate level?
Did this seminar provide you with new information?
Will you be able to apply what was learned in your daily practices?
The value of the evaluation forms for all seminars are almost similar and the overall satisfaction of the
seminar was rated good and the results for seminar 8 and 9 are shown in Figure 3.
Seminar #8
0 2 4 6 8 10 12 14 16 18 20
Did this seminar meet your learning
experience
Was this seminar taught at
appropriate level
This seminar provided you with new
information
You will be able to apply what was
learnedin your daily practices
Question and answer session
Overall satisfaction with this seminar
Eval
uati
on Q
uest
ion
Number of Ratings
poor
fair
good
excellent
Seminar #9
0 2 4 6 8 10 12
Did this seminar meet your learning
experience
Was this seminar taught at appropriate
level
This seminar provided you with new
information
You will be able to apply what was
learnedin your daily practices
Question and answer session
Overall satisfaction with this seminar
Eval
uatio
n Q
uest
ion
Number of Rating
poor
fair
good
excellent
Figure 3. Results of post seminar evaluation for seminar 8 (Water, Energy and Power) and 9 (Water
Workforce Development and Green Jobs)

12
3.3. Additional Outcomes
A formal post-seminar survey was not conducted due to time constraints. However, program participants were asked to notify the PI and Co-PI of any outcomes related to the program. Outcomes identified included:
Identification of funding opportunities for research identified during DCAWIP programs, including funding for the National Capital Region Flood Risk Assessment Program.
Submittal of DCWRRI grant proposals based upon information received during DCAWIP programs, including the Metropolitan Washington Public Officials Water Leadership Program.
Enrollment of new students in the UDC graduate degree programs based upon information received during DCAWIP programs.
Development of a joint Watershed Steward Certification program between UDC and the Anacostia Watershed Society.
3.4. Publications
An extended abstract of the DCAWIP is accepted for both oral and poster presentations at the 2011 Universities Council on Water Resources Annual Conference. The extended abstract will be published in the conference proceedings. Another article is also accepted to be published in a streamline publication of the American Water Works Association.
4. CONCLUSIONS AND RECOMMENDATIONS
The DC Area Water Issues Program (DCAWIP) demonstrated a strong interest by students, faculty, staff,
and area stakeholders to come together on a regular basis to learn more about area issues and
programs, and to develop opportunities for greater student and other university involvement in the larger
community of water professionals. The program consistently had at least 30 attendees, with 2 programs
with attendance of more than 50.
There was consistent support for reception sponsorships, which was not part of the original proposal
budget. The inclusion of food was found to be important both in attracting attendance and in providing
opportunities for participants to continue discussion and generate new opportunities for collaboration and
understanding. The program created opportunities for collaboration between students, faculty, and staff
with area water providers and other water stakeholders, such as the Anacostia Watershed Society,
Metropolitan Washington Council of Governments, DC Department of the Environment, DC Water, and
Washington Aqueduct.
There were some concerns regarding the timeframe, although the time was selected to accommodate the
evening classes of most of the UDC students, and to be late enough in the day for area professionals to
leave work early to attend the seminars. Including the boat tour during the university Veteran’s Day
holiday was also considered a good opportunity for students and others to gain a firsthand experience
with the Anacostia River, which was featured in many of the seminar discussions.
Conference abstracts have been submitted for posters at the American Water Works Association and
Universities Council on Water Resources conferences in 2011, although notice has not yet been provided
regarding their acceptance.

13
There has been interest in the potential offering of a similar program on a for-credit basis, although
additional administrative considerations would need to be addressed. There was also interest in less
frequent gatherings when UDC can involve members of the DC area water community to the campus
along with high level speakers. Any continuation of the program or program components would require
additional funding to be secured.

APPENDIX A: INTERNSHIP ANNOUNCEMENT
14

APPENDIX B: PROGRAM FLYERS AND ANNOUNCEMENTS
15
APPENDIX B: PROGRAM FLYERS AND ANNOUNCEMENTS

APPENDIX B: PROGRAM FLYERS AND ANNOUNCEMENTS
16

APPENDIX B: PROGRAM FLYERS AND ANNOUNCEMENTS
17

APPENDIX B: PROGRAM FLYERS AND ANNOUNCEMENTS
18

APPENDIX B: PROGRAM FLYERS AND ANNOUNCEMENTS
19
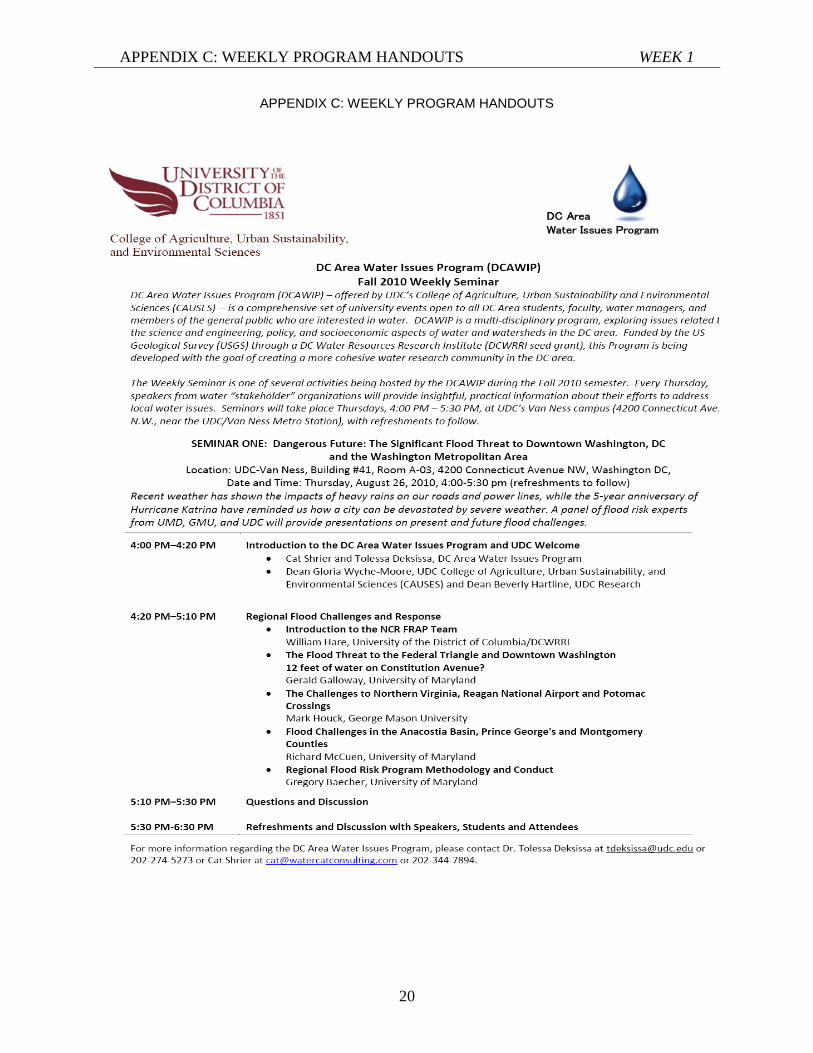
APPENDIX C: WEEKLY PROGRAM HANDOUTS WEEK 1
20
APPENDIX C: WEEKLY PROGRAM HANDOUTS

APPENDIX C: WEEKLY PROGRAM HANDOUTS WEEK 2
21

APPENDIX C: WEEKLY PROGRAM HANDOUTS WEEK 3
22

APPENDIX C: WEEKLY PROGRAM HANDOUTS WEEK 4
23

APPENDIX C: WEEKLY PROGRAM HANDOUTS WEEK 5
24

APPENDIX C: WEEKLY PROGRAM HANDOUTS WEEK 6
25

APPENDIX C: WEEKLY PROGRAM HANDOUTS WEEK 7
26

APPENDIX C: WEEKLY PROGRAM HANDOUTS WEEK 8
27

APPENDIX C: WEEKLY PROGRAM HANDOUTS WEEK 9
28

APPENDIX C: WEEKLY PROGRAM HANDOUTS WEEK 10
29

APPENDIX C: WEEKLY PROGRAM HANDOUTS WEEK 11
30
APPENDIX C: WEEKLY PROGRAM HANDOUTS WEEK 12
31

APPENDIX C: WEEKLY PROGRAM HANDOUTS WEEK 13
32

APPENDIX C: WEEKLY PROGRAM HANDOUTS WEEK 14
33

APPENDIX D: SPECIAL PROGRAM ANNOUNCEMENTS
34
APPENDIX D: SPECIAL PROGRAM ANNOUNCEMENTS
FILM SCREENING

APPENDIX D: SPECIAL PROGRAM ANNOUNCEMENTS
35
BOAT TOUR

APPENDIX E: PROGRAM EVALUATION FORM
36
APPENDIX E: PROGRAM EVALUATION FORM
DC Area Water Issues Program (DCAWIP)
Learning Experience Evaluation Form
SEMINAR EIGHT: Water, Power, and Energy in DC Ernest Jolly, Energy Manager, DC Water
Beverly Perry, Senior Vice President, PEPCO Holdings Inc. Sheila Slocum Hollis, Board Member, US Energy Association, and Partner, Duane Morris LLP
Refreshment and community building reception sponsored by: Watercat Consulting LLC
Please rate this week’s seminar for the following criteria: Your feed back is very important to us
Did this seminar meet your learning expectations: Excellent Good Fair Poor
Was this seminar taught at the appropriate level: Excellent Good Fair Poor
This seminar provided you with new information: Excellent Good Fair Poor
You will be able to apply what was learned in your daily practices: Excellent Good Fair Poor
Question and answer session: Excellent Good Fair Poor
Overall satisfaction with this seminar: Excellent Good Fair Poor
Do you think you will attend future seminars? Yes No
Please Check All that Apply:
Student, Department Faculty, Department ____________ University Staff Agency Consultant Nonprofit Organization Other
Overall comments regarding this seminar and speaker(s):__________________ __________________________________________________________________________
__________________________________________________________________________
__________________________________________________________________________
DC Area Water Issues Program

USGS Summer Intern Program
None.
USGS Summer Intern Program 1

Student Support
Category Section 104 BaseGrant
Section 104 NCGPAward
NIWR-USGSInternship
SupplementalAwards Total
Undergraduate 15 0 0 0 15Masters 1 0 0 0 1
Ph.D. 0 0 0 0 0Post-Doc. 0 0 0 0 0
Total 16 0 0 0 16
1

Notable Awards and Achievements
Notable Awards and Achievements 1