Data Mining and Its Applications in Higher Education
21
Data mining is the process of discovering “hidden messages,” patterns and knowledge within large amounts of data and of making predictions for outcomes or behaviors. This chapter discusses in detail the theoretical and practical aspects of data mining and provides a case study of its application to college transfer data. NEW DIRECTIONS FOR INSTITUTIONAL RESEARCH, no. 113, Spring 2002 © Wiley Periodicals, Inc. 17 2 Data Mining and Its Applications in Higher Education Jing Luan The first chapter has afforded readers an opportunity to review the defini- tions and components of knowledge management. The chapter also estab- lished that knowledge management is closely linked to technology. Explicit knowledge, which is a product of several major technologies, is the focus of this chapter. Specifically, this chapter addresses data mining. One among a host of recent technology innovations, data mining is making changes to the entire makeup of our skills and comfort zones in information analysis. Not only does it introduce an array of new concepts, methods, and phrases, it also departs from the well-established, traditional, hypothesis-based statistical techniques. Data mining is a new type of exploratory and predictive data analysis whose purpose is to delineate sys- tematic relations between variables when there are no (or incomplete) a pri- ori expectations as to the nature of those relations. Herman Hollerith’s invention of punch cards in 1880 and of a count- ing machine for the 1890 census led to the development of modern data management and computing techniques. Thearling (1995) even chronicled the evolution of data as data collection in the 1960s, data access in the 1980s, data navigation in the 1990s, and data mining in the new century. Thearling (1995) and others foresaw the possibilities of data mining as a result of maturity of all three disciplines: massive data collection and storage, pow- erful multiprocessor computers, and data mining algorithms. According to Rubenking (2001), “data mining is a logical evolution in database technol- ogy. The earliest databases, which served as simple replacements for paper records, were data repositories that provided little more than the capability to summarize and report. With the development of query tools such as SQL
-
Upload
khangminh22 -
Category
Documents
-
view
1 -
download
0
Transcript of Data Mining and Its Applications in Higher Education

Data mining is the process of discovering “hiddenmessages,” patterns and knowledge within large amountsof data and of making predictions for outcomes orbehaviors. This chapter discusses in detail the theoreticaland practical aspects of data mining and provides a casestudy of its application to college transfer data.
NEW DIRECTIONS FOR INSTITUTIONAL RESEARCH, no. 113, Spring 2002 © Wiley Periodicals, Inc. 17
2
Data Mining and Its Applications inHigher Education
Jing Luan
The first chapter has afforded readers an opportunity to review the defini-tions and components of knowledge management. The chapter also estab-lished that knowledge management is closely linked to technology. Explicitknowledge, which is a product of several major technologies, is the focus ofthis chapter. Specifically, this chapter addresses data mining.
One among a host of recent technology innovations, data mining ismaking changes to the entire makeup of our skills and comfort zones ininformation analysis. Not only does it introduce an array of new concepts,methods, and phrases, it also departs from the well-established, traditional,hypothesis-based statistical techniques. Data mining is a new type ofexploratory and predictive data analysis whose purpose is to delineate sys-tematic relations between variables when there are no (or incomplete) a pri-ori expectations as to the nature of those relations.
Herman Hollerith’s invention of punch cards in 1880 and of a count-ing machine for the 1890 census led to the development of modern datamanagement and computing techniques. Thearling (1995) even chronicledthe evolution of data as data collection in the 1960s, data access in the 1980s,data navigation in the 1990s, and data mining in the new century. Thearling(1995) and others foresaw the possibilities of data mining as a result ofmaturity of all three disciplines: massive data collection and storage, pow-erful multiprocessor computers, and data mining algorithms. According toRubenking (2001), “data mining is a logical evolution in database technol-ogy. The earliest databases, which served as simple replacements for paperrecords, were data repositories that provided little more than the capabilityto summarize and report. With the development of query tools such as SQL
18 KNOWLEDGE MANAGEMENT
[Structured Query Language], database managers were able to query datamore flexibly.”
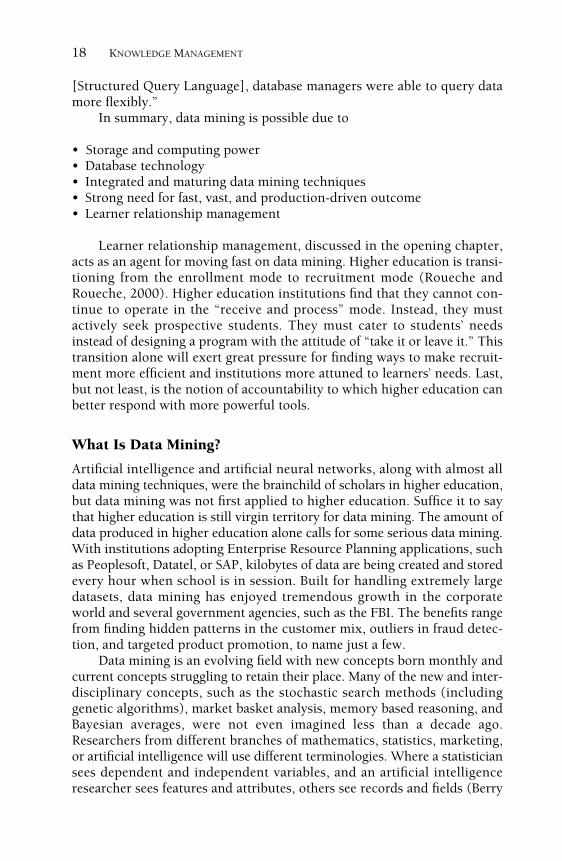
In summary, data mining is possible due to
• Storage and computing power• Database technology• Integrated and maturing data mining techniques• Strong need for fast, vast, and production-driven outcome• Learner relationship management
Learner relationship management, discussed in the opening chapter,acts as an agent for moving fast on data mining. Higher education is transi-tioning from the enrollment mode to recruitment mode (Roueche andRoueche, 2000). Higher education institutions find that they cannot con-tinue to operate in the “receive and process” mode. Instead, they mustactively seek prospective students. They must cater to students’ needsinstead of designing a program with the attitude of “take it or leave it.” Thistransition alone will exert great pressure for finding ways to make recruit-ment more efficient and institutions more attuned to learners’ needs. Last,but not least, is the notion of accountability to which higher education canbetter respond with more powerful tools.
What Is Data Mining?
Artificial intelligence and artificial neural networks, along with almost alldata mining techniques, were the brainchild of scholars in higher education,but data mining was not first applied to higher education. Suffice it to saythat higher education is still virgin territory for data mining. The amount ofdata produced in higher education alone calls for some serious data mining.With institutions adopting Enterprise Resource Planning applications, suchas Peoplesoft, Datatel, or SAP, kilobytes of data are being created and storedevery hour when school is in session. Built for handling extremely largedatasets, data mining has enjoyed tremendous growth in the corporateworld and several government agencies, such as the FBI. The benefits rangefrom finding hidden patterns in the customer mix, outliers in fraud detec-tion, and targeted product promotion, to name just a few.
Data mining is an evolving field with new concepts born monthly andcurrent concepts struggling to retain their place. Many of the new and inter-disciplinary concepts, such as the stochastic search methods (includinggenetic algorithms), market basket analysis, memory based reasoning, andBayesian averages, were not even imagined less than a decade ago.Researchers from different branches of mathematics, statistics, marketing,or artificial intelligence will use different terminologies. Where a statisticiansees dependent and independent variables, and an artificial intelligenceresearcher sees features and attributes, others see records and fields (Berry
DATA MINING AND ITS APPLICATIONS IN HIGHER EDUCATION 19
and Linoff, 1997). The phrase “neural networks” is synonymous with datamining.
Although data mining is known for having exotic names, the field hasbegun to include certain kinds of descriptive statistics and visualization tech-niques into data mining (Westphal and Blaxton, 1998). Statsoft, an on-linestatistical software provider, seemed to favor “exploratory data analysis.”Berthold and Hand (1999) called their work “intelligent data analysis.” Thischapter will refer to all activities involving modeling and nonhypothesis-based analytical techniques as data mining and adopt the concept developedby Berthold and Hand that all statistical techniques developed prior to the1960s are “classic” and “conformatory.”
The definition of data mining from Gartner Group seems to be mostcomprehensive: “the process of discovering meaningful new correlations,patterns, and trends by sifting through large amounts of data stored inrepositories and by using pattern recognition technologies as well as statis-tical and mathematical techniques” (Gartner Group, 2000). I refine thenotion of data mining as the purpose of uncovering hidden trends and pat-terns and making accuracy based predictions through higher levels of ana-lytical sophistication. It is producing new observations from existingobservations. As explained by Rubenking (2001), “data mining is the pro-cess of automatically extracting useful information and relationships fromimmense quantities of data. In its purest form, data mining doesn’t involvelooking for specific information. Rather than starting from a question or ahypothesis, data mining simply finds patterns that are already present in thedata.”
Finally, in statistical language, Statsoft (2001) categorizes typical on-lineanalytical processing (OLAP) techniques as basic statistical exploratory meth-ods or exploratory data analysis that include such techniques as “examiningdistributions of variables (e.g., to identify highly skewed or non-normal, suchas bi-modal patterns), reviewing large correlation matrices for coefficientsthat meet certain thresholds, or examining multi-way frequency tables (e.g.,‘slice by slice’ systematically reviewing combinations of levels of control vari-ables).” It reserves the term “multivariate exploratory techniques” for datamining. These techniques are designed specifically to identify patterns inmultivariate (or univariate, such as sequences of measurements) data setsthat include cluster analysis, factor analysis, discriminant function analysis,multidimensional scaling, log-linear analysis, canonical correlation, stepwiselinear and nonlinear (for example, logit) regression, correspondence analy-sis, time series analysis, and classification trees.
Essential Concepts and Definitions
Data mining assumes the existence of spherical multi-Euclidean dimensions(Delmater and Hancock, 2001). The n-dimensional Euclidean space, orEuclidean hyperspace, is called feature space, where any given coordinates

20 KNOWLEDGE MANAGEMENT
Table 2.1. Classification of Data Mining Tasks and Tools
Tasks Supervised Unsupervised
Classification Memory based reasoning, geneticalgorithm, C&RT, linkanalysis, C5.0, ANN
Kohonen nets
Estimation ANN, C&RT —
Segmentationa Market basket analysis, memorybased reasoning, link analysis,rule induction
Cluster detection, K-means,generalized rule induction,APRIORI
Description Rule induction, market basketanalysis
Spatial visualization
aFor ease of understanding, the author includes tasks of affinity grouping, association, and clus-tering in Segmentation.
of ordered triples or ordered pairs are viewed as feature vectors. The under-standing of Gaussian distribution, z-scores, and regression equations is veryuseful in data mining. One of the fundamental concepts operating withinthe data mining hyperspace is the cluster, which is formed of sets of featurevectors that are understood by examining their standard deviations. Thetighter the vectors cluster, the better it is for classification purposes. In thiscase, the clusters are considered as good features, or gestalts.
Both rule induction and neural network data mining techniques fallunder the category of machine learning (Hand, 1999), and they are basedon various sophisticated and high-speed modeling techniques for predict-ing outcomes or uncovering hidden patterns. Tools for data mining are con-stantly emerging, and there are perhaps as many vendors of data miningsoftware as data mining techniques. Some examples of data mining prod-ucts and vendors are provided in Chapter Six. Frequently cited and usedtools such as C&RT (classification and regression trees) and CHAID (chi-squared automatic induction), artificial neural networks (ANN), K-means,nearest neighbor, MBA (market basket analysis), MBR (memory based rea-soning), automatic cluster detection, link analysis, decision trees, andgenetic algorithms are most familiar to the data mining community.
Data mining is further divided into supervised and unsupervisedknowledge discovery. Unsupervised knowledge discovery is to recognizerelationships in the data and supervised knowledge discovery is to explainthose relationships once they have been found (Berry and Linoff, 1997;Thearling, 1995; Westphal and Blaxton, 1998). Berry and Linoff (1997)described unsupervised knowledge discovery as a bottom-up approach thatmakes no prior assumptions; the data are allowed to speak for themselves.
To begin to better understand how data mining can be of use to insti-tutional researchers is to examine the tasks performed and the tools used.Data mining tasks are categorized as follows: classification, estimation, seg-mentation, and description. Table 2.1 lists the tasks and the correspondingtools.
DATA MINING AND ITS APPLICATIONS IN HIGHER EDUCATION 21
The main goal of a classification task is using data mining models tolabel output that is defined as a category of good-bad or yes-no. Accordingto Berry and Linoff (2000), the estimation tasks refer to data mining mod-els with outputs that are likelihood functions, or even more directly, sizesor length. Classification also functions for filling in missing values (dataimputing). Segmentation includes tasks of affinity grouping and association,and clustering. Description has surpassed conventional visualization of afinal outcome of data mining. Techniques or models used for descriptionsare applicable to data modeling process in its entirety.
Cluster detection is inherently unsupervised data mining (Berry andLinoff, 1997) and decision trees are used for supervised data mining. C&RTand CHAID fall under this class. Genetic algorithms are similar to statistics,in that the form of the model needs to be known in advance. Genetic algo-rithms use the selection, crossover, and mutation operators to evolve suc-cessive generation of solutions. As the generations evolve, only the mostpredictive survive, until the functions converge on an optimal solution.When the inputs have many categorical variables, decision trees often workwell. When the relationship between the inputs and the output is difficultto figure out, neural networks are frequently the technique of choice (Berryand Linoff, 1997).
Neural networks work best when the nature of the data is nonlinear.Running neural networks may take a very long time due to back-propagating. Most neural networks rely on the process for the hidden layerto perform the summation and constantly adjust the weights until it reachesan optimal threshold, which then produces the outcome for a record(Garson, 1998). However, if the researcher terminates an active neural net-work at any given time while it is being trained on a test dataset, it will stillprovide useful results. Everything else being equal, fewer inputs will shortenthe training time. Some in the data mining community advocate the use ofdecision trees before neural networks. Others prefer comparing both typesof models simultaneously to see which one produces the most accuratemodel. The latter technique is called “bagging.”
This chapter focuses on decision trees, also called rule induction tech-nique, and back-propagation neural networks, a frequently used artificialneural network (ANN). These are also the tools selected in the case studypresented later in the chapter.
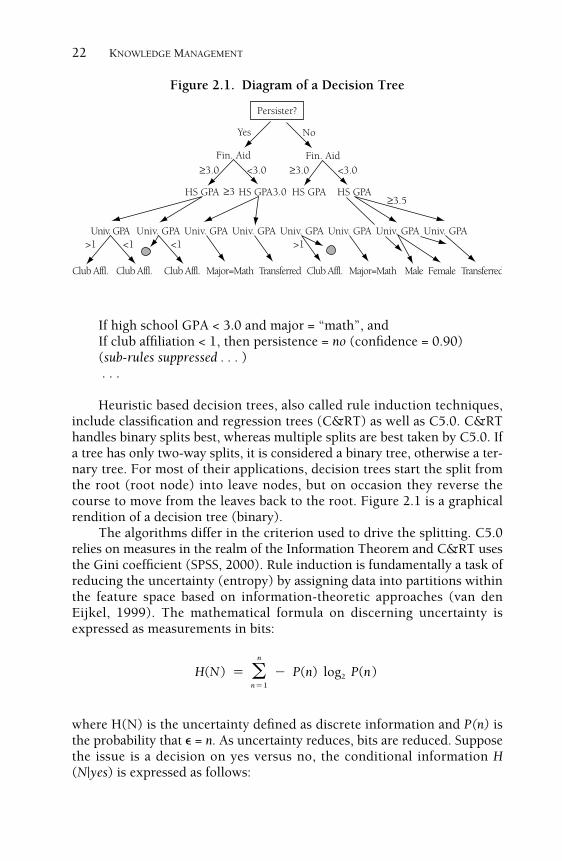
Decision Trees (CART and C5.0). Decision trees, also called ruleinduction techniques, are fairly easy to explain, since the notions of trees,leaves, and splits are generally understood. Inductive reasoning refers toestimation of a sample while the population is known. Decision trees usesplits to conduct modeling and produce rule sets. For instance, a simple ruleset might say
If financial aid = “Yes”, and high school GPA ≥ 3.0 andIf university GPA ≥ 3.5, then persistence = yes (confidence = 0.87)(sub-rules suppressed . . . )
22 KNOWLEDGE MANAGEMENT
Persister?
Fin. Aid Fin. Aid
Yes No
≥3.0 ≥3.0<3.0 <3.0
HS GPA HS GPA HS GPA HS GPA
Univ. GPA Univ. GPA Univ. GPA Univ. GPA Univ. GPA Univ. GPA Univ. GPA Univ. GPA
Club Affl. Club Affl. Club Affl. Club Affl.Major=Math Major=MathTransferred TransferredMale Female
>1 >1<1 <1
≥3 3.0≥3.5
Figure 2.1. Diagram of a Decision Tree
If high school GPA < 3.0 and major = “math”, andIf club affiliation < 1, then persistence = no (confidence = 0.90)(sub-rules suppressed . . . ). . .
Heuristic based decision trees, also called rule induction techniques,include classification and regression trees (C&RT) as well as C5.0. C&RThandles binary splits best, whereas multiple splits are best taken by C5.0. Ifa tree has only two-way splits, it is considered a binary tree, otherwise a ter-nary tree. For most of their applications, decision trees start the split fromthe root (root node) into leave nodes, but on occasion they reverse thecourse to move from the leaves back to the root. Figure 2.1 is a graphicalrendition of a decision tree (binary).
The algorithms differ in the criterion used to drive the splitting. C5.0relies on measures in the realm of the Information Theorem and C&RT usesthe Gini coefficient (SPSS, 2000). Rule induction is fundamentally a task ofreducing the uncertainty (entropy) by assigning data into partitions withinthe feature space based on information-theoretic approaches (van denEijkel, 1999). The mathematical formula on discerning uncertainty isexpressed as measurements in bits:
where H(N) is the uncertainty defined as discrete information and P(n) isthe probability that � = n. As uncertainty reduces, bits are reduced. Supposethe issue is a decision on yes versus no, the conditional information H(N|yes) is expressed as follows:
n
H(N) � � P(n) log P(n)� 2n�1

DATA MINING AND ITS APPLICATIONS IN HIGHER EDUCATION 23
As with any artificial intelligence, algorithms tend to continue indefi-nitely once executed (Garson, 1998). As in developing rule sets, decisiontrees may split into fine leaf nodes that render themselves incapable of pre-dicting, because no future records will be similar at such a fine level of split-ting. This is considered to be underfitting. However, overfitting, a trade-offbetween bias and variance, is also a concern in using these techniques. Themethod to control the extent to which the tree splits is called pruning. Shorttrees tend to have higher bias. If the leaf node is not completely developed,or the tree is pruned too soon, then most anything will look alike to themodel. A case befitting this scenario would be stopping the split at the nodelevel of the first occurrence of gender. The model may determine that therest of the relationships within or between the records will not be examined.In this case, a student may be predicted to be successful no matter what heor she does, so long as the student’s gender is female or male. At some point,the development of leaf nodes needs to stop. One school of thought in han-dling the degree with which a tree is considered properly pruned is Occam’srazor, which states a simpler explanation is more likely to capture theessence of the problem (van den Eijkel, 1999). Only humans can intuitivelymake that decision. This reason alone is why humans most certainly can-not be replaced completely by any or a combination of all the data miningalgorithms.
Chi-Squared Automatic Induction (CHAID). CHAID was developedby J. A. Hartigan, who borrowed an earlier work by J. A. Morgan and J. N.Sonquest in automatic induction detection (AID). CHAID limits itself to cat-egorical variables. Continuous variables need to be changed into ranges orclasses. However, one benefit of CHAID is its ability to stop the split beforeoverfitting occurs.
Artificial Neural Networks (ANN). Our brain has 109 neurons inter-connected in a complex way. There can be several thousand connectionsper neuron, potentially amounting to 60 trillion synapses (Garson, 1998).The precise manner of how neurons, or the inner layer of these neural net-works, operate remains unknown (Brieman, 1994). The artificial intelli-gence developed in the 1960s underwent tremendous modification to bettermimic the inner functions of the brain. The current theory is a revisit to thePavlovian theory, further advanced by renowned neurological system sci-entist Donald Hebb, who theorized that learning is a result of the strengthof the synaptic connections, rather than the older concept that learning is aresult of manipulations of symbols (Statsoft, 2001).
Developed as a mathematical rendition to explain the function of thenervous system by neurophysiologist Warren McCulloch and logician
n
H(N |yes) � � P(n|yes) log P(n|yes)� 2n�1
24 KNOWLEDGE MANAGEMENT
Time-series persistence
Major selection
Financial aid
SAT
High school GPAx1w1
w2
w5…n
x2
x3
x4
x5…n
Synaptic weights
Input layerHidden layer
Student will persist forless than two terms
Student will persist formore than two terms
Inputs
Output(s)
Figure 2.2. Diagram of the Case Study Neural Net
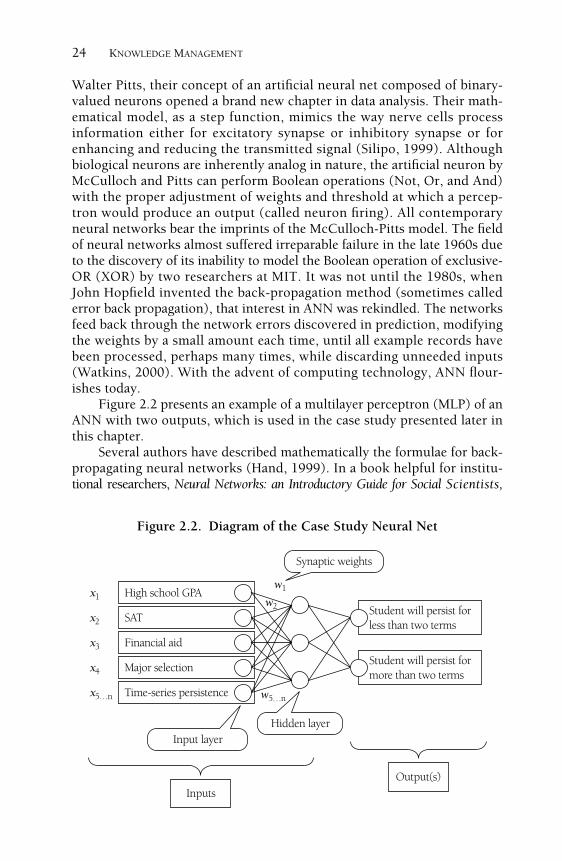
Walter Pitts, their concept of an artificial neural net composed of binary-valued neurons opened a brand new chapter in data analysis. Their math-ematical model, as a step function, mimics the way nerve cells processinformation either for excitatory synapse or inhibitory synapse or forenhancing and reducing the transmitted signal (Silipo, 1999). Althoughbiological neurons are inherently analog in nature, the artificial neuron byMcCulloch and Pitts can perform Boolean operations (Not, Or, and And)with the proper adjustment of weights and threshold at which a percep-tron would produce an output (called neuron firing). All contemporaryneural networks bear the imprints of the McCulloch-Pitts model. The fieldof neural networks almost suffered irreparable failure in the late 1960s dueto the discovery of its inability to model the Boolean operation of exclusive-OR (XOR) by two researchers at MIT. It was not until the 1980s, whenJohn Hopfield invented the back-propagation method (sometimes callederror back propagation), that interest in ANN was rekindled. The networksfeed back through the network errors discovered in prediction, modifyingthe weights by a small amount each time, until all example records havebeen processed, perhaps many times, while discarding unneeded inputs(Watkins, 2000). With the advent of computing technology, ANN flour-ishes today.
Figure 2.2 presents an example of a multilayer perceptron (MLP) of anANN with two outputs, which is used in the case study presented later inthis chapter.
Several authors have described mathematically the formulae for back-propagating neural networks (Hand, 1999). In a book helpful for institu-tional researchers, Neural Networks: an Introductory Guide for Social Scientists,

DATA MINING AND ITS APPLICATIONS IN HIGHER EDUCATION 25
Garson (1998) treated the inner workings of an MLP as a weighted sum-mation function and a sigmoid transfer function. He explained the processof dendrites (inputs) passing information to reach a threshold for axons(output) to signal the connected neural nets using the mathematical for-mulae
where o is the outcome, xi is the input vector, wi is the weight, which is setat random upon first feed.
Kohonen Neural Networks. There are many alternative neural net-works. One of the most well known is the Kohonen neural network.Developed by Finnish researcher Tuevo Kohonen, Kohonen neural net-works primarily act as an unsupervised knowledge discovery technique.Garson (1998) stated that Kohonen nets are estimators of the probabilitydensity function for the input vector. Some data miners call it self-organizing maps (SOM), which means intuitively that the outcome is aresult of allowing the algorithms to analyze the variables until certain pat-terns emerge (Berry and Linoff, 2000; Silipo, 1999). In formulaic terms,
where the Euclidean distance d of neuron j is the sum of the squared dis-tances from x (inputs) and the assigned weights of x.
Kohonen nets are useful for discerning patterns and groups within afeature space. Researchers may use Kohonen nets to learn about the databefore building other models. They have great value in understanding whotakes what clusters of courses or what groups of students tend to have sim-ilar course-taking patterns.
Statistics, Data Mining, and On-Line AnalyticalProcessing
Delmater and Hancock (2001, p. 192) wrote: “The science underlying pre-dictive modeling is a mixture of mathematics, computer science, anddomain expertise.” Their point is very well taken and is the focus of this sec-tion. Data mining is a knowledge discovery process to reveal patterns andrelationships in large and complex data sets (De Veaux, 2000). Moreover,data mining can be used to predict an outcome for a given entity. The ulti-mate reason for carrying out pattern identification or rule setting is to usethe knowledge gained from this exercise to influence the policy makers.
n
2d � (x � w )j � ji ji� �� i�1
n
�x �2 �xo � f o w , where f �(x) � �(1 � e ) e (�1)j � i ji� �i�1

26 KNOWLEDGE MANAGEMENT
Table 2.2. Crosswalk of Data Mining Models and Algorithms toStatistics and Data Warehouse Based OLAP
Data Mining Statistics Data Warehousing, OLAP
Artificial neuralnetworks
Regression equations, chi-square,structural equations
—
Rule induction Principle components, discriminantfunction, factor analysis, logistic R
—
Kohonen networks Cluster analysis, probability densityfunction
Multidimensional cube
Spatial visualization Two–Three dimension charts Two–Three dimensioncharts
Euclidean space Structured equations, linear and non-linear regression
Sequential files
Classification Logistical regression Multidimensional cubeEstimation Regression equations, chi-square,
structural equations—
Segmentation Cluster analysis, factor analysis Multidimensional cubePrediction accuracy Statistical significance Temporal, trend reportingOutliers detection Standard deviation, error analysis AggregationSupervised learning Hypothesis, distributional assumptions,
APRIORI—
Unsupervisedlearning
Descriptive statistics, cluster analysis Temporal, trend reporting
Population, universe Samples Fact tables and dimensiontables
Feature vectors Histogram, correlation Cross-tabsFeature extraction Flat files Extract, transform, load
(ETL)Machine learning,
artificialintelligence
Mathematics Structured query language(SQL)
Attributes, features Variables, values Fields, recordsOutputs or scoring Independents Fields
Most of the processes involved in data mining are explainable by math-ematics, statistics in particular, and are to a certain extent familiar toresearchers who are comfortable with explication statistics. Even in the so-called “data fishing expedition” of conducting unsupervised data mining,the algorithms are still based on logics and formulae.
Table 2.2, which I developed, provides a crosswalk comparison amongthe major concepts in data mining, statistics, and on-line analytical pro-cessing (OLAP). A crosswalk like this provides a guide for understandingdata mining terminologies and concepts. It is not intended, however, to beall-inclusive, as researchers can spend a lifetime collecting and categorizingthe ever-growing data mining models (Garson, 1998) and terminologies.
In the early days of computing when classical statistics were the onlytools of choice, reducing data size was crucial (Berry and Linoff, 1997). Thepower delivered by data warehousing to data mining software has chal-lenged traditional statistical methodologies (Mena, 1998). Rather thanapproaching a problem in a limited source domain that typically is a sam-ple of data identified by the guidance of a priori hypotheses, researchers cannow overlay data mining algorithms on the entire population. This entire
DATA MINING AND ITS APPLICATIONS IN HIGHER EDUCATION 27
population can be terabytes in size, and in the very near future data miningmodeling can happen to live data, called knowledge discovery in databases.
In this case, the typical steps taken by researchers to make statisticalassumptions about the population are not necessary. However, under-standing the database in which data reside and the data characteristics(structured and unstructured) are essential to successful data mining.Throwing all variables in a database for data mining is not conducive tomachine learning. For instance, a researcher may want to identify patternsof persistence. In the dataset entered, student social security number andthe corresponding college assigned student IDs and student names servedno other purpose than confusing the algorithms and hogging memory. Theyneed not be selected. However, addresses may reveal important informationabout a student’s inclination to relocate. Sometimes the use of factor analy-sis or principal components to root out the auxiliary features may be desir-able. The use of several techniques to cross-validate particular extrapolatives,including classical statistical techniques, is a recommended approach, called“bagging.”
Data mining works best in exploratory analysis scenarios that have nopreconceived assumptions (Westphal and Blaxton, 1998). A prior hypoth-esis may guide classical statistical approach but cloud the judgment of a dataminer. Data mining, neural networks in particular, is most useful for pre-diction and scoring but not for casual statistical analysis (Garson, 1998). Ifthe traditional methods can be viewed as top down, data mining is truly bot-tom up. Research questions do not begin with “what if;” instead, they beginwith “what is” (Luan and Willette, 2001).
As expressed earlier in the chapter, basic and classical statistical knowl-edge is highly useful to a data miner in discerning minute significance incluster boundaries—an important data mining task. Neural networks are in essence regression models adapted to conduct estimation. In this sense,what was a concern to a researcher, statistical significance, is now a ques-tion of how it translates into accuracy of the prediction or classification.Data mining has set researchers free by taking the chore of making distri-butional assumptions about data out of their hands and giving them thepower of applying machine learning models to new data. This is how datamining transforms a researcher armed with statistical skills into a data minerwho drives the engine of pattern recognition and behavior prediction.
Current Trends in Data Mining
Evolving out of traditional statistics, data mining started as an independentset of tools. More and more, visualization and database data mining areadopted. Conventional visualization techniques are aimed at the executiveswho are information consumers. Spatial visualization provides visual plotsdepicting members of the population in their feature space. It is not aggre-gation based computation, but faithful (powerful) rendition of the geomet-ric relationships, be it orientation, density, or clustering (Delmater and

28 KNOWLEDGE MANAGEMENT
Hancock, 2001). Also, knowledge discovery in database attempts to seam-lessly integrate data mining with databases, so as to eliminate the extra workof producing additional datasets. Knowledge discovery in database main-tains data consistency and, most crucially, makes real-time scoring possi-ble. Both these trends are here to stay.
Fuzzy Logic. Another data mining algorithm being developed is fuzzylogic, which can be applied to both rule induction techniques and neuralnetworks. Silipo (1999) argued that the opaque nature of all neural networkoperations would be diminished via the implementation of fuzzy logic dueto its relatively transparent decisional algorithms. Berthold (1999) appliedfuzzy logic to imprecise data, most commonly found in social science wherecrisp measurements do not exist. Even though regular neural networks haveredundancy computation built in, which alleviates some of the damage doneby data degradation (Silipo, 1999), the use of fuzzy logic is deemed a goodalternative.
Genetic Algorithm. Genetic algorithm (GA) is an optimization algo-rithm developed by John Holland at the University of Michigan. It is basedon the two basic rules that govern the vast organic world, selection and var-iation. Genetic algorithm uses selection, crossover, and mutation parame-ters in evolutionary computation in reaching the solution ( Jacob, 1999;Berry and Linoff, 1997). Genetic algorithms fall under the class of stochas-tic search methods.
Applications of Data Mining
Data mining has been recently discovered by academia but was first put tofull use by the Fortune 500, who have since benefited tremendously. Datamining was behind numerous successful market campaigns and qualityassurance. Table 2.3 depicts some of the core questions most often used inthe business world and their analogs in higher education.
Table 2.3. Comparison of Data Mining Questions in Education andthe Corporate World
Questions in the Business World Counterpart Questions in Higher Education
Who are my most profitable customers? Who are the students taking most credithours?
Who are my repeat website visitors? Who are the ones likely to return formore classes?
Who are my loyal customers? Who are the persisters at our university,college?
What clients are likely to defect to myrivals?
What type of courses can we offer toattract more students?

DATA MINING AND ITS APPLICATIONS IN HIGHER EDUCATION 29
Data mining was first implemented for marketing outside higher edu-cation. It certainly has parallel implications and value in higher education.As discussed earlier, marketing is part of learner relationship management.Marketing concerns the service area, enrollment, annual campaign, alumni,and college image. Combined with institutional research, it expands intostudent feedback and satisfaction, course availability, and faculty and staffhiring. A university service area now includes on-line course offerings, thusbringing the concept of mining course data to a new dimension. Data min-ing is quickly becoming a mission critical component for the decision-making and knowledge management processes.
Exploring Data Mining in Higher Education: A Case Study
Using data mining to monitor and predict community college students’transfer to four-year institutions provides significant benefits for decisionmakers, counselors, and students. For years, institutional researchers havenot been able to clearly pinpoint the type of students who transfer and theircourse taking patterns. Analyses of the outcomes of transferred students inupper divisions can influence the curriculum design back at the communitycolleges. Data mining helps predict the transferability of each currentlyenrolled student. A model developed in this case study is aimed at provid-ing a profile of the transferred students and predicting which student cur-rently enrolled in a community college will transfer so that the college canpersonalize and time their interactions and interventions with these stu-dents, who may need certain assistance and support. This embodies theprinciples of learner relationship management.
A data exchange consortium, led by the planning and research office ofCabrillo College, including Cabrillo College, University of California SantaCruz, San Jose State University, and California State University MontereyBay, established in 1998 a longitudinal data warehouse of transferred stu-dents, including all their course information. Taken together, the recordscover 75 percent of the total annual transfers from Cabrillo College. Thetransfer data warehouse is then combined with the existing data warehouseof the planning and research office at Cabrillo College to provide unitaryrecords for every student from the moment they enrolled at Cabrillo Collegeto the day they graduated from the four-year institution. This data goldmine holds answers to many policy and research questions.
Data Mining Approach to Transfer Data. Both University ofCalifornia Santa Cruz (UCSC) and San Jose State University provided datagoing back to 1992. California State University Monterey Bay, created in1995, did not participate in this study because of the recency of their data. Ispent a significant amount of time staging the data that came from three dis-parate sources. Cross industry standard process for data mining (CRISP-DM)

30 KNOWLEDGE MANAGEMENT
lent guidance for this endeavor, and I have also listed steps in data prepara-tion in the appendix of this chapter. It is a major rule in the data miningcommunity that a data mining project cannot be successful if the investiga-tor is not a domain expert who is very tuned to the granular data. The inves-tigator must also have adequate skills in feature extraction, where more than65 percent of the time can be spent on getting the features and attributes cor-rectly presented and primed for mining purposes. The current trend is forresearchers to educate themselves to master these contrasting sets of skillsin order to adapt to the changing world of knowledge management.
With the outcome of transfer of students being clearly known, this wasa supervised data mining. Owing to the need for predicting transfers and,as a consequence, planning for contacting these transfer-directed students,the dataset includes as much enrollment history and demographic infor-mation as possible for every student who had ever attended CabrilloCollege, transferred or not. This constitutes a considerably deep and widefeature extraction. The evolution of this project is chronicled as follows.
Transfer tracking is a matter of latency. Research showed that it typi-cally takes two to four years for the majority of the cohort to transfer.Therefore, the first task was to decide which time series in the database touse. The first year when data were available in the planning and researchoffice data warehouse was 1992, which meant the corresponding first yearof the two universities’ data should be 1994. Since the last year of data thatwere congruent to each other from these universities was 1998, the cohorttherefore should be former Cabrillo College students who enrolled betweensummer 1992 and spring 1997. The second task was to edit every field sothat indexes could function properly. Many hidden problems, such as dif-ferent coding for social security numbers and terms, were uncovered at thispoint, thus preventing future problems downstream. Also, data fields sentfrom the same university were not the same each year, when a new personwas wearing the database administrator hat. The third task was to tackle theso-called “deep and wide” enrollment history data due to the nature of the original data source, governed by a transactional data structure, whichmeant that the enrollment data were highly normalized with enrollmentrecords repeating for as many rows as needed for each student. Althoughdata mining algorithms would run directly using this setup, it could onlyproduce completely erroneous conclusions. Each subsequent enrollmentrecord of a student needed to become a field by itself, a requirement thatbrought on the issue of dealing with potentially many dozens of fields forjust the courses taken without yet introducing the grades for the courses andthe term in which the student took each of the courses. The final dataset wasa result of collapsing courses based on their type (transfer, remedial, voca-tional) at the expense of term and individual grades.
The total number of students in the dataset was thirty-two thousand.A proprietary data split algorithm divided the set into a test set and a vali-dation set. Data mining was applied to the test set, until such time when the

DATA MINING AND ITS APPLICATIONS IN HIGHER EDUCATION 31
models were considered optimal. The validation set, first time seen by allthe models, was brought in for actual scoring.
The following is a partial list of the groups of features (fields) selectedfor this case study:
• Demographics: age, gender, ethnicity, high school, zip codes, plannedemployment hours, education status at initial enrollment
• Financial aid• Transfer status (doubled as the reference variable)• Total transfer, vocational, basic skills, science, and liberal arts courses taken• Total units earned and grade points by course type
Clementine, a software by SPSS Inc., enjoys a reputation for being theeasiest model to deploy. The study chose Clementine as the data miningsoftware (please refer to Chapter Six for data mining tools). Experience ledme to use neural networks (NN) and two rule induction algorithms, C5.0and C&RT, to compare models and to complement the scoring. As alreadymentioned, some data mining experts call this “bagging.” The type node inClementine coded the fields into appropriate types, and the balance nodereduced the imbalance between transferred and nontransferred students,which was quite large initially.
The NN model resulted in an accuracy of 76.5 percent. It contained fifty-two neurons, seven hidden neurons, and one neuron (for a dichotomous out-put). The top ten fields listed in the relative importance of inputs were
Number of liberal arts classes taken (0.315)High school origin (0.189)Race (0.161)Planned work hours (0.159)Initial education status (0.145)Grade points (0.085)Number of nonbasic skills courses taken (0.084)Number of UCSC transferable courses taken (0.081)Gender (0.079)Number of degree applicable courses taken (0.074)
The values in parenthesis would range from zero to one, but in prac-tice they were rarely above the 0.35 threshold. A couple of points worth not-ing here are that the investigator should pay attention to every field, eventhe one listed at the bottom, as data mining is both a task to identify theaverages and rule of thumbs and a task to use outliers for a number of rea-sons, such as fraud detection. As neural networks results were a bit cryptic,it was necessary to use a rule induction model to list the rules uncovered.The following resulted from C5.0:
32 KNOWLEDGE MANAGEMENT
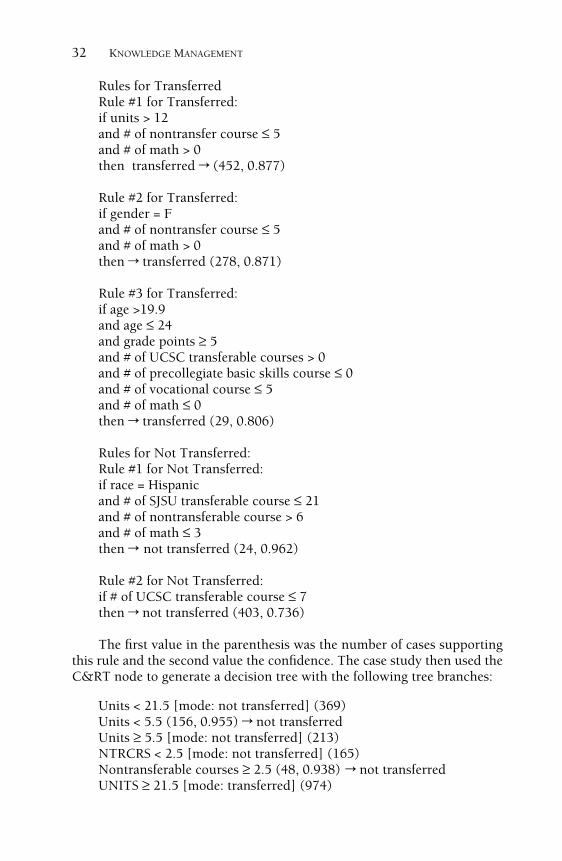
Rules for TransferredRule #1 for Transferred:if units > 12and # of nontransfer course ≤ 5and # of math > 0then transferred r (452, 0.877)
Rule #2 for Transferred:if gender = Fand # of nontransfer course ≤ 5and # of math > 0then r transferred (278, 0.871)
Rule #3 for Transferred:if age >19.9and age ≤ 24and grade points ≥ 5and # of UCSC transferable courses > 0and # of precollegiate basic skills course ≤ 0and # of vocational course ≤ 5and # of math ≤ 0then r transferred (29, 0.806)
Rules for Not Transferred:Rule #1 for Not Transferred:if race = Hispanicand # of SJSU transferable course ≤ 21and # of nontransferable course > 6and # of math ≤ 3then r not transferred (24, 0.962)
Rule #2 for Not Transferred:if # of UCSC transferable course ≤ 7then r not transferred (403, 0.736)
The first value in the parenthesis was the number of cases supportingthis rule and the second value the confidence. The case study then used theC&RT node to generate a decision tree with the following tree branches:
Units < 21.5 [mode: not transferred] (369)Units < 5.5 (156, 0.955) r not transferredUnits ≥ 5.5 [mode: not transferred] (213)NTRCRS < 2.5 [mode: not transferred] (165)Nontransferable courses ≥ 2.5 (48, 0.938) r not transferredUNITS ≥ 21.5 [mode: transferred] (974)
DATA MINING AND ITS APPLICATIONS IN HIGHER EDUCATION 33
Table 2.4. Matrixes of Model Performance for Testand Validation Sets
Neural Networks on Test Set On Validation Set
NoTran Tran NoTran TranNoTran 67.9 32.1 NoTran 78.7 21.3
Tran 20.8 79.2 Tran 22.5 77.5
C5.0 on Test Set On Validation Set
NoTran Tran NoTran TranNoTran 72.1 28.0 NoTran 70.0 30.0
Tran 12.5 87.5 Tran 8.0 92.0
C&RT on Test Set On Validation Set
NoTran Tran Notran TranNoTran 81.3 18.7 NoTran 82.8 17.2
Tran 18.4 81.6 Tran 17.9 82.1
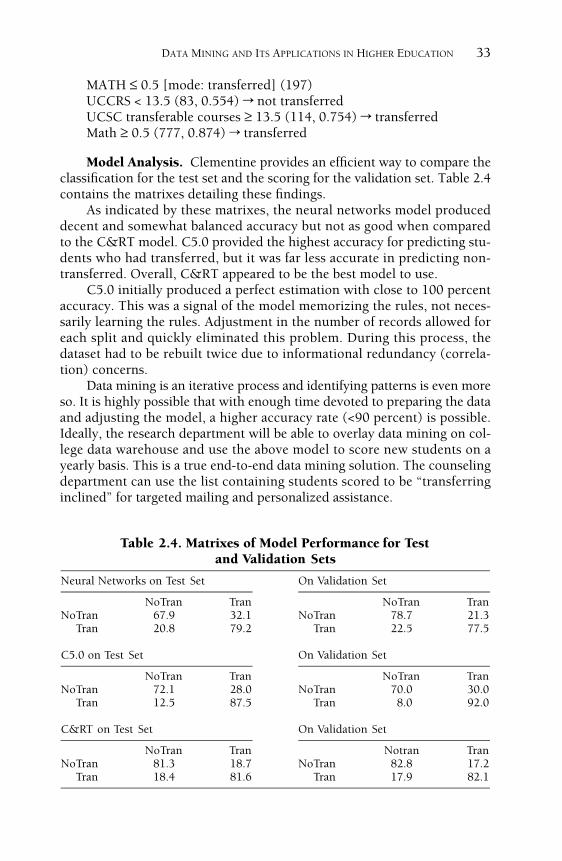
MATH ≤ 0.5 [mode: transferred] (197)UCCRS < 13.5 (83, 0.554) r not transferredUCSC transferable courses ≥ 13.5 (114, 0.754) r transferredMath ≥ 0.5 (777, 0.874) r transferred
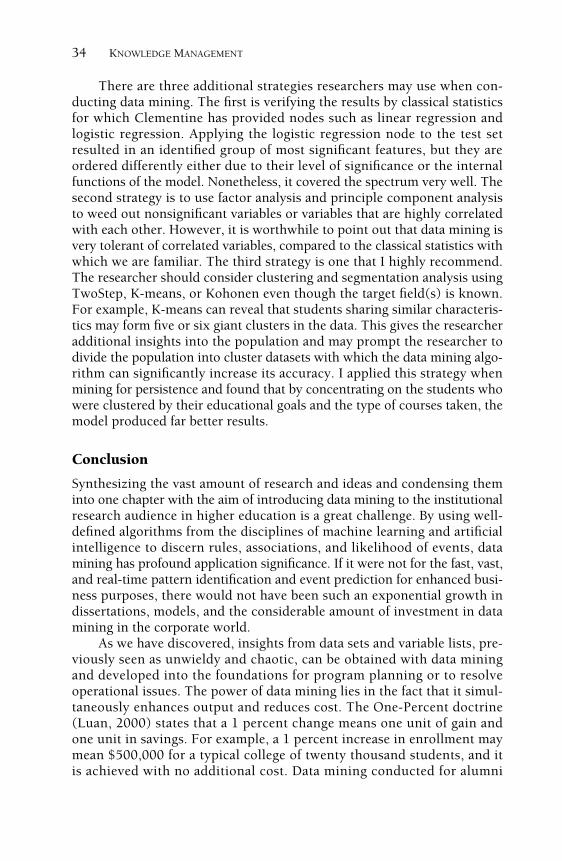
Model Analysis. Clementine provides an efficient way to compare theclassification for the test set and the scoring for the validation set. Table 2.4contains the matrixes detailing these findings.
As indicated by these matrixes, the neural networks model produceddecent and somewhat balanced accuracy but not as good when comparedto the C&RT model. C5.0 provided the highest accuracy for predicting stu-dents who had transferred, but it was far less accurate in predicting non-transferred. Overall, C&RT appeared to be the best model to use.
C5.0 initially produced a perfect estimation with close to 100 percentaccuracy. This was a signal of the model memorizing the rules, not neces-sarily learning the rules. Adjustment in the number of records allowed foreach split and quickly eliminated this problem. During this process, thedataset had to be rebuilt twice due to informational redundancy (correla-tion) concerns.
Data mining is an iterative process and identifying patterns is even moreso. It is highly possible that with enough time devoted to preparing the dataand adjusting the model, a higher accuracy rate (<90 percent) is possible.Ideally, the research department will be able to overlay data mining on col-lege data warehouse and use the above model to score new students on ayearly basis. This is a true end-to-end data mining solution. The counselingdepartment can use the list containing students scored to be “transferringinclined” for targeted mailing and personalized assistance.
34 KNOWLEDGE MANAGEMENT
There are three additional strategies researchers may use when con-ducting data mining. The first is verifying the results by classical statisticsfor which Clementine has provided nodes such as linear regression andlogistic regression. Applying the logistic regression node to the test setresulted in an identified group of most significant features, but they areordered differently either due to their level of significance or the internalfunctions of the model. Nonetheless, it covered the spectrum very well. Thesecond strategy is to use factor analysis and principle component analysisto weed out nonsignificant variables or variables that are highly correlatedwith each other. However, it is worthwhile to point out that data mining isvery tolerant of correlated variables, compared to the classical statistics withwhich we are familiar. The third strategy is one that I highly recommend.The researcher should consider clustering and segmentation analysis usingTwoStep, K-means, or Kohonen even though the target field(s) is known.For example, K-means can reveal that students sharing similar characteris-tics may form five or six giant clusters in the data. This gives the researcheradditional insights into the population and may prompt the researcher todivide the population into cluster datasets with which the data mining algo-rithm can significantly increase its accuracy. I applied this strategy whenmining for persistence and found that by concentrating on the students whowere clustered by their educational goals and the type of courses taken, themodel produced far better results.
Conclusion
Synthesizing the vast amount of research and ideas and condensing theminto one chapter with the aim of introducing data mining to the institutionalresearch audience in higher education is a great challenge. By using well-defined algorithms from the disciplines of machine learning and artificialintelligence to discern rules, associations, and likelihood of events, datamining has profound application significance. If it were not for the fast, vast,and real-time pattern identification and event prediction for enhanced busi-ness purposes, there would not have been such an exponential growth indissertations, models, and the considerable amount of investment in datamining in the corporate world.
As we have discovered, insights from data sets and variable lists, pre-viously seen as unwieldy and chaotic, can be obtained with data miningand developed into the foundations for program planning or to resolveoperational issues. The power of data mining lies in the fact that it simul-taneously enhances output and reduces cost. The One-Percent doctrine(Luan, 2000) states that a 1 percent change means one unit of gain andone unit in savings. For example, a 1 percent increase in enrollment maymean $500,000 for a typical college of twenty thousand students, and itis achieved with no additional cost. Data mining conducted for alumni
DATA MINING AND ITS APPLICATIONS IN HIGHER EDUCATION 35
donations may correctly pinpoint the right donors and the right targetamount. This saves campaign costs and increases the campaign’s effec-tiveness. The ability to provide intervention to individual students whoare seen as likely to drop out or to transfer also holds value beyond costand savings. Data mining conducted to predict the likelihood of an appli-cant’s enrollment following their initial application may allow the collegeto send the right kind of materials to potential students and prepare theright counseling for them. The potential of data mining in education can-not be underestimated.
Appendix: Steps for Data Mining Preparation, Basedon Cross Industry Standard Process for Data Mining(CRISP-DM)
• Step One. Investigate the possibility of overlaying data mining algorithmsdirectly on a data warehouse. Doing so may require extra effort and diplo-matic skills with the information technology department, but it pays offin the long run. It avoids possible errors in field names, unexpectedchanges in data types, and extra effort to refresh multiple data domains.The scoring can also be directly performed to live database. This is calledan end-to-end data mining solution, also called knowledge discovery indatabase (KDD). (Total time usage: 5 to 15 percent.)
• Step Two. Select a solid querying tool to build data mining files. Thesefiles closely resemble multidimensional cubes. As a matter of fact,MOLAP (multidimensional on-line analytical processing) serves this pur-pose well. Except for APRIORI, which can use transactional data filesdirectly (alas!), all other algorithms need “tabular” files, which are rela-tional database files queried to produce a file with unique records withmultiple fields. A number of querying tools are available for this purpose.SQL skills are highly desirable. This step can be most time consuming.(Total time usage: 30 to 75 percent.)
• Step Three. Data visualization and validation. This means examining fre-quency counts as well as generating scatter plots, histograms, and othergraphics, including clustering models. A graph is the best indication fora correlation estimate. This step gives the researcher the first impressionof what each of the data fields contains and how it may play out in theanalysis. Missing data should not be treated in the same manner in everysituation. In certain cases, missing data are extremely diagnostic. In datamining, the outliers may be just what we are looking for, simply becausethey deviate from the norm. Therefore, they may hold truth for discov-ering previously unknown patterns. In fraud detection, it is these outliersthat will flag the system to avoid loss. (Total time usage: 10 to 20 per-cent.)
• Step Four. Mine your data! (Total time usage: 10 to 20 percent.)

36 KNOWLEDGE MANAGEMENT
References
Berry, M., and Linoff, G. Data Mining Technique: For Marketing, Sales, and CustomerSupport. New York: Wiley Computer Publishing, 1997.
Berry, M., and Linoff, G. Master Data Mining: The Art and Science of Customer RelationshipManagement. New York: Wiley Computer Publishing, 2000.
Berthold, M. “Fuzzy Logic.” In M. Berthold and D. Hand (eds.), Intelligent Data Analysis.Milan: Springer, 1999.
Brieman, L. “Comment.” Statistical Science, 1994, 9(1), 38–42.Delmater, R., and Hancock, M. Data Mining Explained: A Manager’s Guide to Customer-
Centric Business Intelligence. Boston: Digital Press, 2001.De Veaux, R. “Data Mining: What’s New, What’s Not.” Presentation at a Data Mining
Workshop, Long Beach, Calif., 2000.Garson, G. D. Neural Networks: An Introductory Guide for Social Scientists. London:
Sage, 1998.Gartner Group. “The GartnerGroup CRM Glossary.” [http://www.gartnerweb.com
/public/static/hotc/hc00086148.html].Hand, D. “Introduction.” In M. Berthold and D. Hand (eds.), Intelligent Data Analysis.
Milan: Springer, 1999.Jacob, C. “Stochastic Search Method.” In M. Berthold and D. Hand (eds.), Intelligent Data
Analysis. Milan: Springer, 1999.Luan, J. “An Exploratory Approach to Data Mining in Higher Education: A Primer and
a Case Study.” Paper presented at the AIR Forum, Seattle, Wash., 2000.Luan, J., and Willette, T. “Data Mining and Knowledge Management.” Paper presented
at the Research and Planning Group Conference, Lake Arrowhead, Calif., 2001.Mena, J. “Data-Mining FAQs.” DM Review, January 1998. [http://www.dmreview.com
/master.cfm?NAVID=198&EdiD=792].Roueche, J. E., and Roueche, S. S. High Stakes, High Performance: Making Remediation
Work. Washington, D.C.: Community College Press, 1999.Rubenking, N. “Hidden Messages.” PC Magazine, May 22, 2001, 20(10), 86–88.Silipo, R. “Neural Networks.” In M. Berthold and D. Hand (eds.), Intelligent Data
Analysis. Milan: Springer, 1999.SPSS. SPSS Clementine 6.0 User’s Guide. Chicago: SPSS, 2001.Statsoft. [http://www.statsoft.com/textbook/glosfra.html], 2001.Thearling, K. “An Overview of Data Mining at Dun and Bradstreet.” DIG White Paper,
1995. [http://www3.shore.net/~kht/text/wp9501/wp9501.htm].van den Eijkel, G. C. “Rule Induction.” In M. Berthold and D. Hand (eds.), Intelligent
Data Analysis. Milan: Springer, 1999.Watkins, D. “Neural Network Master Class.” Presented at Clementine User Group
(CLUG), July 2000, Reading, United Kingdom.Westphal, C., and Blaxton, T. Data Mining Solutions: Methods and Tools for Solving Real-
World Problems. New York: Wiley Computer Publishing, 1998.
JING LUAN is chief planning and research officer at Cabrillo College in Aptos,California.