
Introduction to vocalizations of crossbills in north-western ...
Data-driven automated acoustic analysis of human infantvocalizations using neural network tools
Anne S. Warlaumont,a� D. Kimbrough Oller, and Eugene H. BuderSchool of Audiology and Speech-Language Pathology, The University of Memphis, 807 Jefferson Avenue,Memphis, Tennessee 38105
Rick DaleDepartment of Psychology, The University of Memphis, 202 Psychology Building, Memphis,Tennessee 38152
Robert KozmaDepartment of Mathematical Sciences, The University of Memphis, 373 Dunn Hall, Memphis,Tennessee 38152
�Received 25 January 2009; revised 19 January 2010; accepted 22 January 2010�
Acoustic analysis of infant vocalizations has typically employed traditional acoustic measuresdrawn from adult speech acoustics, such as f0, duration, formant frequencies, amplitude, and pitchperturbation. Here an alternative and complementary method is proposed in which data-derivedspectrographic features are central. 1-s-long spectrograms of vocalizations produced by six infantsrecorded longitudinally between ages 3 and 11 months are analyzed using a neural networkconsisting of a self-organizing map and a single-layer perceptron. The self-organizing map acquiresa set of holistic, data-derived spectrographic receptive fields. The single-layer perceptron receivesself-organizing map activations as input and is trained to classify utterances into prelinguisticphonatory categories �squeal, vocant, or growl�, identify the ages at which they were produced, andidentify the individuals who produced them. Classification performance was significantly better thanchance for all three classification tasks. Performance is compared to another popular architecture,the fully supervised multilayer perceptron. In addition, the network’s weights and patterns ofactivation are explored from several angles, for example, through traditional acoustic measurementsof the network’s receptive fields. Results support the use of this and related tools for derivingholistic acoustic features directly from infant vocalization data and for the automatic classificationof infant vocalizations. © 2010 Acoustical Society of America. �DOI: 10.1121/1.3327460�
PACS number�s�: 43.70.Ep, 43.70.Jt, 43.72.Bs �AL� Pages: 2563–2577
r's
com
plim
enta
ry c
op
y
I. INTRODUCTION
Over the course of their first year of life, human infants’vocalizations become progressively more speech-like in theirphonation, articulation, timing, and in other respects �Stark,1980; Oller, 1980, 2000; van der Stelt, 1993�. The explora-tion of the sound-making capability by infants, the formationof new contrastive categories of sound, and the systematicuse of these categories in vocal play and in flexible expres-sion of emotional states appear to form a critical foundationfor speech �Koopmans-van Beinum and van der Stelt, 1986;Vihman et al., 1985�. In fact, failure to reach milestones ofvocal development is associated with hearing impairmentand other medical conditions as well as with slower vocabu-lary development �Roe, 1975; Stoel-Gammon, 1989; Eilersand Oller, 1994; Oller et al., 1999�. However, in the firstmonths of life, infant sounds bear little resemblance tospeech and thus their description presents unique method-ological challenges.
Acoustic analysis is central to the study of prelinguisticvocalization development. Since recordings of infant vocal-izations constitute high-dimensional time series data, their
a�Author to whom correspondence should be addressed. Electronic mail:
[email protected]J. Acoust. Soc. Am. 127 �4�, April 2010 0001-4966/2010/127�4
acoustic analysis presents a challenge of data reduction. It isnecessary to represent the signal in terms of the most signifi-cant features, the ones around which development is funda-mentally organized. Some of the acoustic measures that havebeen applied to infant vocalizations include duration, f0
means, peaks, standard deviations, contours, formant fre-quencies, spectral concentration/standard deviation, and de-gree of tremor �as measured by within-syllable f0 and ampli-tude modulation� �Kent and Murray, 1982; Robb andSaxman, 1988; Papaeliou et al., 2002�. Such measures areinspired by a priori assumptions rooted in acoustic phonetictheory. They are usually treated as independent, with rela-tively limited attention paid to possible interactions. This islikely an oversimplification, since vocal categories are basedon interactive, multivariate acoustic features in maturespeech �Repp, 1982�, and it seems likely that early infantsounds are also composed of acoustic features in interactiveways. Further, the traditional approach assumes that the se-lected a priori acoustic measures represent the fundamentaldimensions of vocal development, exploration, and manipu-lation. There is a need for methods that address the multi-variate and high-dimensional acoustic properties of infantvocalizations directly.
In addition, the need for automated analysis of infant
vocal development is rapidly growing. Samples involving© 2010 Acoustical Society of America 2563�/2563/15/$25.00 Au
tho
r's
com
plim
enta
ry c
op
y
millions of utterances from thousands of hours of all-dayaudio recordings are being collected and analyzed �Zimmer-man et al., 2009�. It is important to develop a set of auto-mated acoustic analysis tools appropriate for such infant vo-calization data, which would be impractical to analyzemanually.
Here a method is presented for reducing high-dimensional samples of infant vocalizations to a smaller setof holistic acoustic features derived directly and automati-cally based on the patterns exhibited by a set of infant vo-calizations. The approach makes relatively few a priori as-sumptions and is intended to complement research usingmore traditional acoustic measures derived from speech sci-ence principles. It utilizes a computational algorithm thatwould be suitable as an automated analysis method for ap-plication to large sets of infant utterances from naturalisticrecordings.
Infant vocalizations are first analyzed using a type ofunsupervised artificial neural network, the self-organizingmap �SOM�. The SOM derives a set of 16 holistic spectro-graphic features based on clusters detected in an input corpusconsisting of spectrograms of infant utterances. Then a typeof supervised neural network, the single-layer perceptron, isused to classify utterances on the basis of the SOM’s derivedacoustic features. The classification types are �1� prelinguis-tic vocal categories �squeals, vocants, and growls�, �2� whenin the first year of life the utterances were produced, and �3�the identity of the individual who produced a given utter-ance.
The relationship between the SOM’s features and vocalcategorizations, age, and individual differences is exploredby looking at the patterns of activations across the SOMfeatures and through some simple acoustic measurements�spectral mean, spectral standard deviation, and duration�made on the SOM features and the perceptron’s weightingsof those features. The perceptron’s performance is alsoevaluated quantitatively and is compared to performance bya prominent neural network classifier, the multilayer percep-tron �MLP�. Note that the SOM and perceptron neural net-works can be used either �1� purely for statistical analysispurposes or �2� as models of human perception and classifi-cation. The present study falls into the first category of us-age, with the second being a potential future direction.
Section I A below provides background on prelinguisticvocal categories, developmental changes, and individual dif-ferences. This is followed in Sec. I B by a brief review ofprevious work that has used SOMs or perceptrons to analyzevocalization data.
A. Three areas of investigation in infant prespeechvocalization research
1. Prelinguistic phonological categories
The fact that vocalizations produced during the first yearexhibit some of the characteristics of adult speech yet arestill in many respects immature poses a challenge to phono-logical description. It is clear that phonetic transcription atthe phonological segment level is not appropriate for early
infant vocalizations �Lynip, 1951�. As an alternative, some2564 J. Acoust. Soc. Am., Vol. 127, No. 4, April 2010
researchers have identified prelinguistic vocal categories,termed “protophones” �Oller, 2000�, that seem to appearrelatively universally during development across the firstmonths of life �Stark, 1980; Nathani and Oller, 2001�.
Some protophone categories relate to the purposefulvariation of phonatory characteristics, especially pitch andvoice quality. One such category is squeal, which includesutterances that are high in pitch and often accompanied bypitch variation, loft �falsetto� quality, and/or harshness�Nathani et al., 2006�. Another category is growl, which in-cludes utterances with low pitch, harshness, creaky voice,and/or pulse register �Buder et al., 2008�. Perhaps the mostfrequently occurring protophone is the vocant, which refersto vowel-like utterances �Martin, 1981; Kent and Bauer,1985�. Vocants have intermediate pitch and relatively normalphonation. Purposeful variation of pitch and vocal qualityusually appears by at least 4 months of age and continues tobe explored throughout the first year and beyond �Stark,1980�. Although other protophone categories address matu-ration in the timing of syllable production �marginal andcanonical syllables; Oller, 1980� and the capacity to producemultisyllabic utterances of various sorts �reduplicated andvariegated babbles; Smith et al., 1989�, the present studyfocuses only on the early emerging phonatory protophones—squeal, growl, and vocant—as an illustration of how ourmethod can be applied to the acoustic analysis of protophonecategories.
Protophone categories have an inherent element of sub-jectivity, since they are seen as protophonological constructsthat form the basis for interpretation of emotional states andintentions by caregivers �Papaeliou et al., 2002; Scheiner etal., 2002�. Their validity is supported by the fact that squeals,growls, and vocants are often spontaneously reported by par-ents when asked to identify sounds their babies produce �vo-cants being called “vowels;” Oller et al., 2001�. Laboratoryresearch involving these categories primarily uses trainedadult listeners’ perceptual judgments �Nathani and Oller,2001�.
Little relevant acoustic data on the key categories havebeen published for the squeal, vocant, and growl proto-phones. However, a primary acoustic correlate has been pro-posed to be fundamental frequency �f0� �Nathani et al., 2006;Oller, 1980; Stark, 1980�. A goal of the present study is toexplore the acoustic correlates of human listeners’ proto-phone judgments via inspection and visualization of neuralnetwork weights and activations. The present study also laysa foundation for the development of automatic protophoneclassification. This is important because protophone classifi-cation is otherwise a costly and time-consuming procedure,involving prior training of analysts and repeated careful lis-tening to individual utterances.
2. Developmental changes across the first year
Because during most or all of the first year of life infantsdo not produce recognizable words, their prelinguistic vocal-izations are the main means of assessing the development ofspeech- and language-related production capabilities. Whileethologically oriented auditory studies of changes in vocal-
izations across the first year have been informative in deter-Warlaumont et al.: Neural network analysis of infant vocalizations Au
tho
r's
com
plim
enta
ry c
op
y
mining stages of vocal development and the protophones thatemerge with each stage �Holmgren et al., 1986; Koopmans-van Beinum and van der Stelt, 1986�, developmental patternshave also been studied using acoustic phonetic methods. Forexample, Kent and Murray �1982� tracked a number ofacoustic measurements, including duration, mean f0, f0 into-nation contours, first and second formant frequencies, and avariety of glottal and supraglottal quality characteristics suchas fry, tremor, and the spectral concentration of noise, in across-sectional study of 3-, 6-, and 9-month-old infants’ vo-calizations. Across age, they found changes in formant fre-quency values �see also Lieberman, 1980 and Kuhl andMeltzoff, 1996� as well as in amount of tremor.
Despite the important contributions of such research, itdoes not address the possibility that the changes in suchacoustic measures across development are not independentof each other. For example, increases in duration and de-creases in phonatory variability may emerge in coordinationwith each other, driven by common physiological and cog-nitive maturation that lead to increased control over the lar-ynx. Unsupervised statistical analysis may help to addressthis concern, either �1� by reducing the large number ofacoustic measures to a smaller number of component dimen-sions that are weighted on each of those acoustic parametersor �2� by deriving a limited number of new, holistic acousticmeasures directly from relatively unprocessed recordings ofinfant vocalizations. The present study takes the second ap-proach.
An aim of this work is to develop potential methods forautomatic measurement of the acoustic maturity of infantutterances. This goal is motivated by fact that “language age”or “age-equivalence” is commonly used as an index of lan-guage development status in both research and clinical as-sessment of children older than 1 year �e.g., Stevenson andRichman, 1976; Thal et al., 2007�. Automatic classificationof vocalization maturity is already being pursued with somesuccess using statistical algorithms incorporating automaticcalculation of more traditional acoustic measures, such asduration, and automatic detection of phonetic features, suchas bursts, glottal articulations, sonorant quality, and syllabic-ity �Fell et al., 2002�. The method presented here laysgroundwork for the automatic measurement of the maturityof an utterance on the basis of holistic, data-driven features,which could prove a worthwhile addition to current methodsfor automatic detection of utterance maturity.
3. Individual differences
The ordering of phonological stages of vocal develop-ment appears to be robust across infants, even those fromdifferent language environments, with differing socioeco-nomic status, and in large measure with differences in hear-ing function �Oller and Eilers, 1988�. However, reports ofnotable individual differences are also common in literatureon infant vocal development �Stark, 1980; Vihman et al.,1986; Nathani Iyer and Oller, 2008�. These individual differ-ences appear to be associated with differences in later lan-guage styles and abilities. For example, Vihman and Green-lee �1987� found that the degree of use of true consonants
�consonants other than glottals and glides� in babble andJ. Acoust. Soc. Am., Vol. 127, No. 4, April 2010 War
words at 1 year of age predicted phonological skill at 3years. It is important to be able to quantify individual differ-ences in preverbal vocalizations within normally developinginfants as this might be used to predict later differences inspeech and language ability and usage. The study of indi-vidual differences in typical infants also sets the stage for thestudy of infant vocalizations across groups, e.g., across vari-ous language or dialect environments, genders, and popula-tions with hearing, language learning, or cognitive impair-ments.
As with the study of age differences, the study of indi-vidual differences is likely to benefit from the introduction ofdata-driven acoustic measures that convert high-dimensionalacoustic input to a smaller number of essential holistic fea-tures. In this study, the problem of characterizing and quan-tifying individual differences among infants is addressedthrough exploration of differences across infants in the pres-ence of such holistic features. Automatic detection of infantidentity provides groundwork for future detection of differ-ences in the vocalization patterns across different infantpopulations of clinical significance.
B. Previous applications of neural networks torelated problems
Neural networks are often used as tools for statisticalpattern analysis and are particularly appropriate for high-dimensional data that are suspected of having nonlinear clus-ter or class boundaries �Bishop, 1995�. The networks aretypically trained through exposure to data exemplars. Theycan be used both in cases where the classes in a data set areknown and used to provide explicit feedback to the network�supervised networks�, or when they are unknown and dis-covered without explicit supervision �unsupervised net-works�.
The perceptron is perhaps the most commonly used su-pervised neural network. It consists of an input layer, anoutput layer, and zero or more hidden layers. Each layerexcept the output has a set of weights that describes thestrength of the connections between its nodes and the nodesof the following layer. Activation from the input is propa-gated to the hidden layers �if there are any� and then to theoutput. The network’s output activations are then comparedto the known classifications for that input, and the network’serror is determined. Based on that error, the network’sweights are adjusted, typically using the delta rule, or withbackpropagation if there are any hidden layers �Bishop,1995�.
A common unsupervised network is the SOM �alsoknown as Kohonen network�. SOMs are typically used forunsupervised cluster analysis and visualization of multi-dimensional data �Kohonen, 2001; Ritter, 2003; Xu andWunsch, 2005�. A SOM consists of an input layer and anoutput layer and a set of connection weights between them.The nodes of the output layer are arranged spatially, typicallyon a two-dimensional �2D� grid. When an input is presented,each of the output nodes is activated to varying extents de-pending on the input and its connection weights from theinput layer. The output node with the highest activation is the
winner. It and, to a lesser extent, its neighboring nodes havelaumont et al.: Neural network analysis of infant vocalizations 2565 Au
tho
r's
com
plim
enta
ry c
op
y
their connection weights strengthened so that their receptivefields �i.e., their preferred inputs� more closely resemble thecurrent input stimulus. The result after training is that theoutput nodes’ receptive fields reflect the patterns found in theinput and that the receptive fields are topographically orga-nized; i.e., nearby nodes have similar patterns of weightsfrom the input layer.
There appear to be few, if any, previous applications ofneural networks to recordings of infant prespeech non-cryvocalizations. However, neural networks have been used toanalyze recordings of vocalizations produced by songbirds,disordered and normal adult human voice, and infant crying.Many of these applications were developed in response to aneed to represent high-dimensional, complex acoustic signalsin a data-driven way. For example, Janata �2001� used aSOM to cluster spectrographic representations of segmentsof juvenile zebra finch song into 200 topographically ar-ranged holistic spectrogram prototypes. The visualizations ofthe loadings of features across 30 consecutive days repre-sented a map of the developmental pathways by which adultsongs emerged. In addition to permitting data-driven detec-tion of song features, Janata �2001� pointed out that the SOMprovides automated acoustic analysis and classification of avery large set of vocalization data, permitting the study of adata set that would have been unrealistic to attempt to scoremanually.
In another application of neural networks to avian vocal-izations, Nickerson et al. �2007� used a single-layer percep-tron, a type of supervised neural network, to discover theacoustic features most relevant to the distinction betweenthree different note types in black-capped chickadee �Poecileatricapillus� “chick-a-dee” calls �notes being the primaryunits of these calls�. The network received seven frequency-and duration-related acoustic features as input and learned topredict the note type for these inputs. Testing the networkwith systematically modified inputs enabled them to deter-mine which acoustic features were most important in dis-criminating note types.
SOMs or SOM-inspired networks have also been used ina number of studies to model the perception and classifica-tion of speech sounds of one’s native language. For example,Guenther and Gjaja �1996� trained an unsupervised networkon formant frequency inputs. They then showed that the dis-tribution of learned receptive fields exhibited the perceptualmagnet effect humans exhibit in the perception of the vowelsof their native language. Another example is a study byGauthier et al. �2007� that used a SOM to successfully clas-sify Mandarin tones based on the first derivative of f0 con-tours. This classification was robust in the face of the surfacevariability present in the multiple speakers’ connected speechfrom which the inputs were taken.
SOMs have also been applied to the study of disorderedadult human voices. In one study, Leinonen et al. �1992�trained a SOM on short-time spectra from 200 Finnishwords. They then provided the network input from both nor-mal and dysphonic speakers and tracked the trajectory ofwinning SOM nodes for the vowel �a:�. Normal and dyspho-nic voices differed in the amount of area on the SOM that
was visited by these vowel trajectories. The work illustrates2566 J. Acoust. Soc. Am., Vol. 127, No. 4, April 2010
that a SOM tool can discriminate between normal and dys-phonic voices, and that acoustic differences for these twopopulations can be portrayed topographically. Callan et al.�1999� also used a SOM to study normal and dysphonicvoices. However, instead of raw spectra, their inputs werescores on six acoustic measures that had previously beenused in studies of dysphonia �e.g., amplitude perturbationquotient, first cepstral harmonic amplitude, and standard de-viation of f0�. After training, they marked each SOM nodeaccording to which clinical group activated it the most. TheSOM was able to reliably classify voices according to group.Output node activations and weights from the input �the sixacoustic measures� were also visualized.
Finally, in an application of a neural network to thestudy of infant vocalizations, Schönweiler et al. �1996� useda SOM to cluster recordings of cries by normal and deafinfants. The input consisted of 20-step Bark spectra. It wasnoted that different individuals’ cries mapped onto differentareas of the SOM, which is in agreement with the idea thatdifferent infants produce identifiably different cries.
The results of the studies reviewed in this section sug-gest that neural networks, including the unsupervised SOMand the supervised perceptron networks, are appropriate anduseful tools for visualization, feature-extraction, and classifi-cation purposes in the study of acoustic vocalization data.Thus, it seems fitting to explore the application of neuralnetworks to study infant vocal development.
II. METHOD
A. Participants
Data from six typically developing human infant partici-pants, four female and two male, are used in this study. Par-ticipants were recruited for a study of both interactive andspontaneously produced vocalizations and were recordedlongitudinally from early in the first year until age 30 months�see Buder et al., 2008 for additional details on participantsand recording setup and procedures�. The present study fo-cuses on a subset of those recordings spanning three ageintervals across the first year of life: 3;0–5;4, 6;0–8;4, and9;0–11;4.
B. Recording
Infants were recorded for two to three 20-min sessionson each day of recording. For each infant, two of the 20-minsessions were selected from each age interval for use in thepresent study. The selections were made from among avail-able recordings based on there being a relatively high vocalactivity level of the infant and a relative lack of crying.
Recordings took place in a minimally sound-treatedroom furnished with soft mats and toys while the parent waspresent. Siblings were sometimes present during recordingsas well. Infants and their mothers interacted relatively natu-ralistically although some periods of time were dedicated toan oral interview between laboratory staff and the parentwhile the infant played nearby. Both mother and infantwore wireless microphones �Samson Airline ultra high fre-quency �UHF� transmitter, equipped with a Countryman As-
sociates low-profile low-friction flat frequency responseWarlaumont et al.: Neural network analysis of infant vocalizations Au
tho
r's
com
plim
enta
ry c
op
y
MEMWF0WNC capsule, sending to Samson UHF AM1 re-ceivers�. The infant’s was sewn into a custom-built vestadapted from models designed by Buder and Stoel-Gammon�2002�. The microphone capsule was housed within a velcropatch to locate the grill at a distance of approximately 5–10cm from the infant’s mouth. Using TF32 �Milenkovic, 2001�operating a DT322 acquisition card �Data Translation, Inc.,Marlboro, MA�, signals were digitized at 44.1–48.1 kHz af-ter low-pass filtering at 20 kHz via an AAF-3 anti-aliasingboard. Microphone signals were concurrently sent to digitalvideo recorders via separate UHF receivers to eliminate con-tamination to the signals that would otherwise have beentransmitted from the video monitors via direct cables. Therecordings for infant 1 are an exception to this procedure.This infant’s recordings were made according to an earlierlaboratory protocol in which audio from the infant’s andmother’s microphones were compressed in mp3 format aspart of an mpeg recording file that combined audio withvideo. These recordings were subsequently extracted frommp3 format to wav format. Based on detailed inspection ofthese wav files, the only noticeable compression-based dif-ference between the mp3-based wav file and those for infants2–6 was that mp3 compression eliminated frequency compo-nents above about 12 kHz. To ensure signal comparabilityacross all the recordings, only frequencies 12 kHz or lowerare included in the signals processed by the neural networksin this study.
C. Utterance location and coding by human analysts
Prior to analysis by the neural networks, recordings un-derwent two types of processing by trained adult human ana-lysts: �1� location of infant utterances within recording ses-sion files and �2� labeling these utterances according toprotophone categories. Infants’ utterances were locatedwithin each recording using the spectrographic display fea-ture of action analysis coding and training �AACT� software�Delgado, 2008�, marking the beginning and end of eachutterance. In addition to listening to the recordings, analystswere permitted to consult spectrograms, waveform views,rms contours, and videos for both the infant and the car-egiver as they performed this localization task. An utterancewas defined as a vocalization or series of vocalizations per-ceived as belonging to the same breath group �Oller andLynch, 1992�. Crying and other distress vocalizations as well
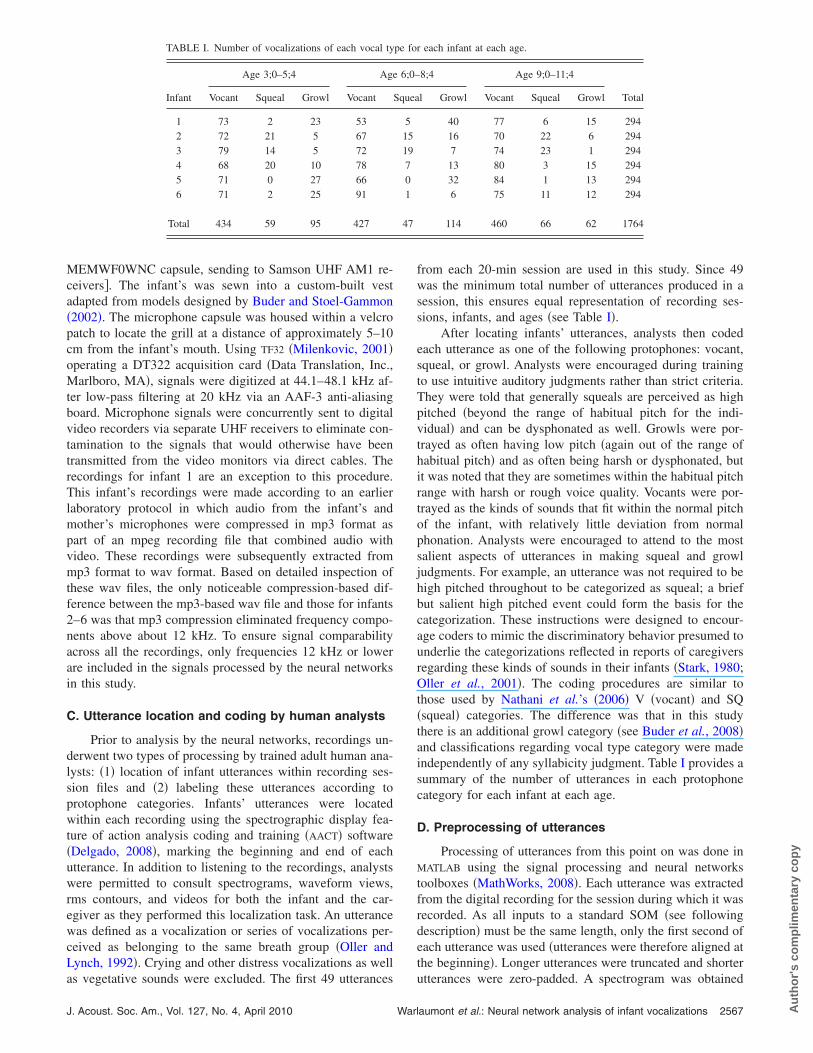
TABLE I. Number of vocalizations of each vocal ty
Infant
Age 3;0–5;4 Age
Vocant Squeal Growl Vocant S
1 73 2 23 532 72 21 5 673 79 14 5 724 68 20 10 785 71 0 27 666 71 2 25 91
Total 434 59 95 427
as vegetative sounds were excluded. The first 49 utterances
J. Acoust. Soc. Am., Vol. 127, No. 4, April 2010 War
from each 20-min session are used in this study. Since 49was the minimum total number of utterances produced in asession, this ensures equal representation of recording ses-sions, infants, and ages �see Table I�.
After locating infants’ utterances, analysts then codedeach utterance as one of the following protophones: vocant,squeal, or growl. Analysts were encouraged during trainingto use intuitive auditory judgments rather than strict criteria.They were told that generally squeals are perceived as highpitched �beyond the range of habitual pitch for the indi-vidual� and can be dysphonated as well. Growls were por-trayed as often having low pitch �again out of the range ofhabitual pitch� and as often being harsh or dysphonated, butit was noted that they are sometimes within the habitual pitchrange with harsh or rough voice quality. Vocants were por-trayed as the kinds of sounds that fit within the normal pitchof the infant, with relatively little deviation from normalphonation. Analysts were encouraged to attend to the mostsalient aspects of utterances in making squeal and growljudgments. For example, an utterance was not required to behigh pitched throughout to be categorized as squeal; a briefbut salient high pitched event could form the basis for thecategorization. These instructions were designed to encour-age coders to mimic the discriminatory behavior presumed tounderlie the categorizations reflected in reports of caregiversregarding these kinds of sounds in their infants �Stark, 1980;Oller et al., 2001�. The coding procedures are similar tothose used by Nathani et al.’s �2006� V �vocant� and SQ�squeal� categories. The difference was that in this studythere is an additional growl category �see Buder et al., 2008�and classifications regarding vocal type category were madeindependently of any syllabicity judgment. Table I provides asummary of the number of utterances in each protophonecategory for each infant at each age.
D. Preprocessing of utterances
Processing of utterances from this point on was done inMATLAB using the signal processing and neural networkstoolboxes �MathWorks, 2008�. Each utterance was extractedfrom the digital recording for the session during which it wasrecorded. As all inputs to a standard SOM �see followingdescription� must be the same length, only the first second ofeach utterance was used �utterances were therefore aligned atthe beginning�. Longer utterances were truncated and shorter
r each infant at each age.
8;4 Age 9;0–11;4
Totall Growl Vocant Squeal Growl
40 77 6 15 29416 70 22 6 2947 74 23 1 294
13 80 3 15 29432 84 1 13 2946 75 11 12 294
114 460 66 62 1764
pe fo
6;0–
quea
51519701
47
utterances were zero-padded. A spectrogram was obtained
laumont et al.: Neural network analysis of infant vocalizations 2567 Au
tho
r's
com
plim
enta
ry c
op
y
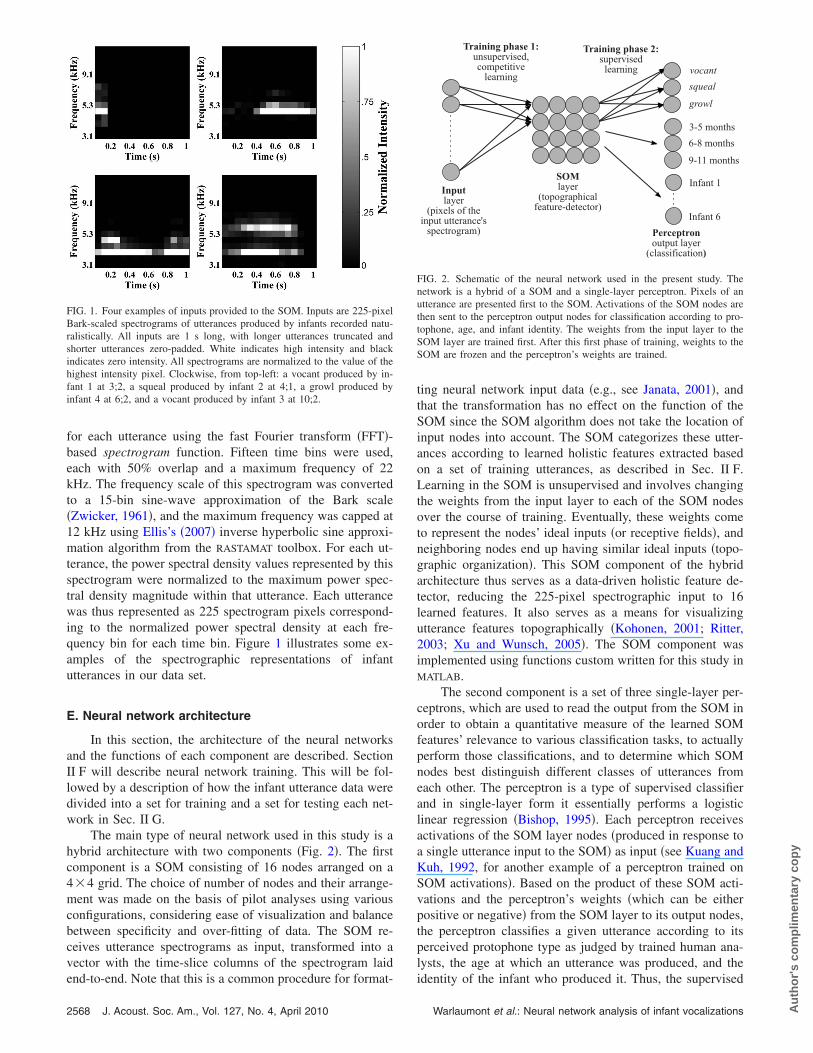
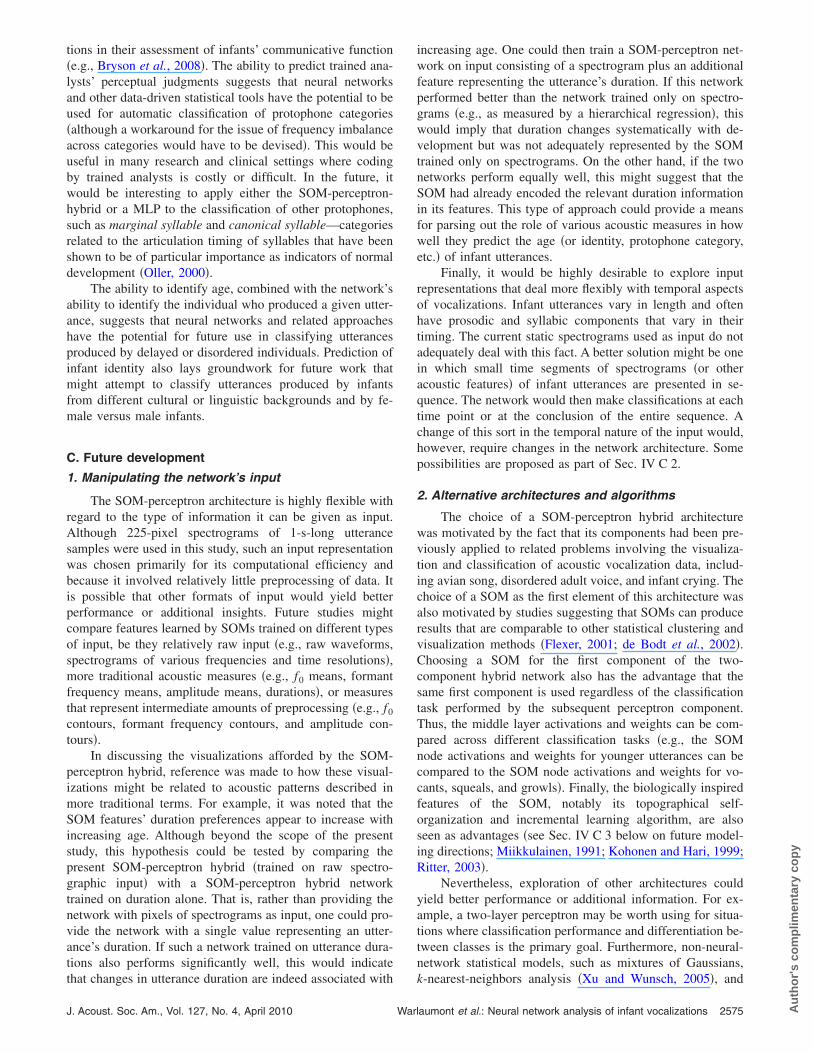
for each utterance using the fast Fourier transform �FFT�-based spectrogram function. Fifteen time bins were used,each with 50% overlap and a maximum frequency of 22kHz. The frequency scale of this spectrogram was convertedto a 15-bin sine-wave approximation of the Bark scale�Zwicker, 1961�, and the maximum frequency was capped at12 kHz using Ellis’s �2007� inverse hyperbolic sine approxi-mation algorithm from the RASTAMAT toolbox. For each ut-terance, the power spectral density values represented by thisspectrogram were normalized to the maximum power spec-tral density magnitude within that utterance. Each utterancewas thus represented as 225 spectrogram pixels correspond-ing to the normalized power spectral density at each fre-quency bin for each time bin. Figure 1 illustrates some ex-amples of the spectrographic representations of infantutterances in our data set.
E. Neural network architecture
In this section, the architecture of the neural networksand the functions of each component are described. SectionII F will describe neural network training. This will be fol-lowed by a description of how the infant utterance data weredivided into a set for training and a set for testing each net-work in Sec. II G.
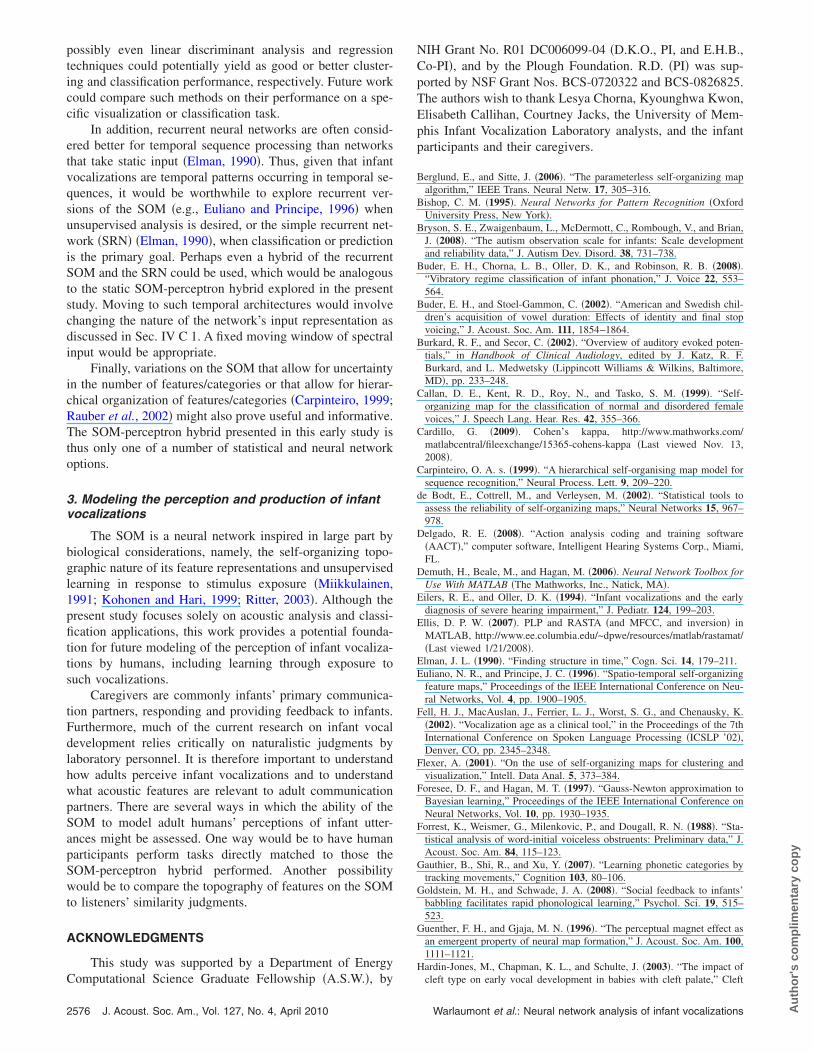
The main type of neural network used in this study is ahybrid architecture with two components �Fig. 2�. The firstcomponent is a SOM consisting of 16 nodes arranged on a4�4 grid. The choice of number of nodes and their arrange-ment was made on the basis of pilot analyses using variousconfigurations, considering ease of visualization and balancebetween specificity and over-fitting of data. The SOM re-ceives utterance spectrograms as input, transformed into avector with the time-slice columns of the spectrogram laid
FIG. 1. Four examples of inputs provided to the SOM. Inputs are 225-pixelBark-scaled spectrograms of utterances produced by infants recorded natu-ralistically. All inputs are 1 s long, with longer utterances truncated andshorter utterances zero-padded. White indicates high intensity and blackindicates zero intensity. All spectrograms are normalized to the value of thehighest intensity pixel. Clockwise, from top-left: a vocant produced by in-fant 1 at 3;2, a squeal produced by infant 2 at 4;1, a growl produced byinfant 4 at 6;2, and a vocant produced by infant 3 at 10;2.
end-to-end. Note that this is a common procedure for format-
2568 J. Acoust. Soc. Am., Vol. 127, No. 4, April 2010
ting neural network input data �e.g., see Janata, 2001�, andthat the transformation has no effect on the function of theSOM since the SOM algorithm does not take the location ofinput nodes into account. The SOM categorizes these utter-ances according to learned holistic features extracted basedon a set of training utterances, as described in Sec. II F.Learning in the SOM is unsupervised and involves changingthe weights from the input layer to each of the SOM nodesover the course of training. Eventually, these weights cometo represent the nodes’ ideal inputs �or receptive fields�, andneighboring nodes end up having similar ideal inputs �topo-graphic organization�. This SOM component of the hybridarchitecture thus serves as a data-driven holistic feature de-tector, reducing the 225-pixel spectrographic input to 16learned features. It also serves as a means for visualizingutterance features topographically �Kohonen, 2001; Ritter,2003; Xu and Wunsch, 2005�. The SOM component wasimplemented using functions custom written for this study inMATLAB.
The second component is a set of three single-layer per-ceptrons, which are used to read the output from the SOM inorder to obtain a quantitative measure of the learned SOMfeatures’ relevance to various classification tasks, to actuallyperform those classifications, and to determine which SOMnodes best distinguish different classes of utterances fromeach other. The perceptron is a type of supervised classifierand in single-layer form it essentially performs a logisticlinear regression �Bishop, 1995�. Each perceptron receivesactivations of the SOM layer nodes �produced in response toa single utterance input to the SOM� as input �see Kuang andKuh, 1992, for another example of a perceptron trained onSOM activations�. Based on the product of these SOM acti-vations and the perceptron’s weights �which can be eitherpositive or negative� from the SOM layer to its output nodes,the perceptron classifies a given utterance according to itsperceived protophone type as judged by trained human ana-lysts, the age at which an utterance was produced, and the
Inputlayer
(pixels of theinput utterance'sspectrogram) Perceptron
output layer(classification)
3-5 months6-8 months
9-11 monthsSOMlayer
(topographicalfeature-detector)
Infant 1
Infant 6
vocantsqueal
growl
Training phase 1:unsupervised,competitivelearning
Training phase 2:supervisedlearning
FIG. 2. Schematic of the neural network used in the present study. Thenetwork is a hybrid of a SOM and a single-layer perceptron. Pixels of anutterance are presented first to the SOM. Activations of the SOM nodes arethen sent to the perceptron output nodes for classification according to pro-tophone, age, and infant identity. The weights from the input layer to theSOM layer are trained first. After this first phase of training, weights to theSOM are frozen and the perceptron’s weights are trained.
identity of the infant who produced it. Thus, the supervised
Warlaumont et al.: Neural network analysis of infant vocalizations Au
tho
r's
com
plim
enta
ry c
op
y
perceptrons relate the features learned by the unsupervisedSOM to known protophone, age, and identity classifications.The output layer of each of these perceptrons was con-structed to have one node for each class of utterances. Thevocal type protophone perceptron thus has three outputnodes: one for squeals, a second for vocants, and a third forgrowls. The age-predicting perceptron has three outputnodes: one for utterances produced at age 3;0–5;4, a secondfor utterances produced at age 6;0–8;4, and a third for utter-ances produced at age 9;0–11;4. Finally, the identity-predicting perceptron has six output nodes, one for each in-fant in our data set. The perceptron component wasimplemented using the feed-forward network functions inMATLAB’s neural network toolbox �Demuth et al., 2006�. Lo-gistic activation functions were used for the output nodes ofthe perceptron classifiers, and default values were used forall other parameters in initializing the network �further de-tails can be found in Demuth et al., 2006�.
To compare the hybrid SOM-perceptron classifier to theMLP, which is probably the most popular neural networkused in supervised classification �Bishop, 1995�, we alsotrained a set of MLPs to perform the age and vocal typeclassifications using the leave-one-infant-out training data.These MLPs were run using the same procedures and param-eter settings as for the single-layer perceptrons describedabove. The number of hidden layer nodes was set to 16,which is the same as the number of nodes in the SOM layerof our SOM-perceptron hybrid. Thus, the numbers ofweights �i.e., free parameters that the networks adjust duringtraining� are roughly similar. We then compared the MLP’sclassification performance to that of our SOM-perceptron hy-brid. In addition, we trained a single-layer perceptron to pre-dict age on the basis of protophone-trained MLP’s hiddenlayer activations. Likewise, we trained a single-layer percep-tron to predict protophones on the basis of age-trainedMLP’s hidden layer activations. Comparing classifications ofthese perceptrons to classifications from the SOM-perceptronhybrid assesses whether using the SOM layer is truly criticalto obtaining a task-general hidden layer.
F. Neural network training
For the SOM-perceptron hybrid, training was conductedin two phases. During the first phase, only the SOM compo-nent was involved. Prior to training, its weights were set torandom values with a different randomization for each of the15 SOM runs. The SOM training algorithm was adaptedfrom Berglund and Sitte’s �2006� parameterless SOM algo-rithm. This algorithm takes three parameters ��, �, and ��,which determine the behavior of the SOM during training.The following parameter values were used: �=1, method 2for calculating �, and � multiplied by a factor of 0.5. Theexact roles of �, �, and � are described in Berglund and Sitte�2006�. In essence, training involved presenting an utteranceas input �randomly chosen from the set of training utter-ances, discussed in Sec. II G� to the SOM, finding the SOM’snode whose weights to the input layer are the most similar tothat input �as measured by the Euclidean distance between
the input vector and the vector representing weights from theJ. Acoust. Soc. Am., Vol. 127, No. 4, April 2010 War
input to a given output node�, and then updating that node’sweights and �to a lesser extent� its neighbors’ weights tomake them even more similar to the input. This procedurewas repeated 1407 times. This was the number of utterancesper session times the number of sessions times the reciprocalof the scaling factor for � in the SOM training algorithm.This amount of training was more than sufficient for thenetwork’s performance to stabilize as judged by the meansquared distances between testing set inputs and their win-ning node’s weights and by visual inspection of changes innetwork weights across training.
After completion of this first phase of training, theweights from the input layer to the SOM nodes remainedfixed during the next training phase. This second phase oftraining the SOM-perceptron hybrid involved only the per-ceptron component. Perceptrons were trained using the deltarule with regularization using MATLAB’s trainbr function.This is a variation on the traditional delta rule algorithm thatbalances reduction in classification error against parsimonyof network weight. This method �sometimes also referred toas “learning with forgetting”� has been shown to producegood generalization of performance to previously unseendata and increases the interpretability of network weights�Foresee and Hagan, 1997; Kasabov et al., 1998; Demuth etal., 2006�. In essence, this training algorithm involves pre-senting training set examples, which are the SOM node ac-tivations produced in response to an infant utterance, one at atime. After presentation of each example, the network’s clas-sification predictions are calculated, and then, based on thedifference between these classification predictions and thecorrect classifications, the weights from the SOM layer toeach of the perceptrons’ output nodes are updated so as toreduce this error �as measured by the squared error� in clas-sifying subsequent inputs while also maintaining parsimonyof network weights. All parameters other than the trainingmethod �trainbr� and the activation transfer function �log-sigmoid� were set to default values. Further details can befound in the MATLAB documentation and in Demuth et al.�2006�.
The MLPs were trained in mostly the same way as theperceptron described above but with the following excep-tions: The MLP was trained directly on the spectrographicinput and was done in a single phase. Training was per-formed using the same MATLAB training method �trainbr�, butsince there were two layers instead of just one, backpropa-gation was involved in addition to the delta rule �Bishop,1995�.
G. Partitioning of data into training and testing sets
In order to train the SOM, perceptron, and MLP whilealso allowing for testing the networks’ generalization abili-ties, the infant utterance data were divided into two subsets:one for training the network and the other for evaluating thenetwork’s classification performance. From each recordingsession �of which there were two for each child at each age�,37 of the 49 utterances �approximately 75%� were randomlychosen to be used in training; the remaining 12 utterances
�approximately 25%� were reserved for testing the networklaumont et al.: Neural network analysis of infant vocalizations 2569 Au
tho
r's
com
plim
enta
ry c
op
y
�discussed in Sec. II I�. This random partitioning was done15 times and the SOM-perceptron hybrid was run 15 times,each corresponding to a different random partitioning. Themeans and standard deviations presented in Sec. III werecomputed over these 15 runs.
In a variation on this training procedure, an alternativeleave-one-infant-out method of partitioning the data intotraining and testing sets was applied to a second set of 36networks, wherein all the utterances produced by five infantswere used in training and the utterances from the sixth re-maining infant were reserved for use in testing only. Acrossthese 36 networks, each infant was used as the test infant sixtimes. As with the perceptron, means and standard deviationswere computed over these 36 runs. The MLP simulationswere trained and tested using the leave-one-infant-outmethod, although only 6 simulations �rather than 36� wererun due to the long time it took for MLP runs to complete.Each infant was used exactly once in testing.
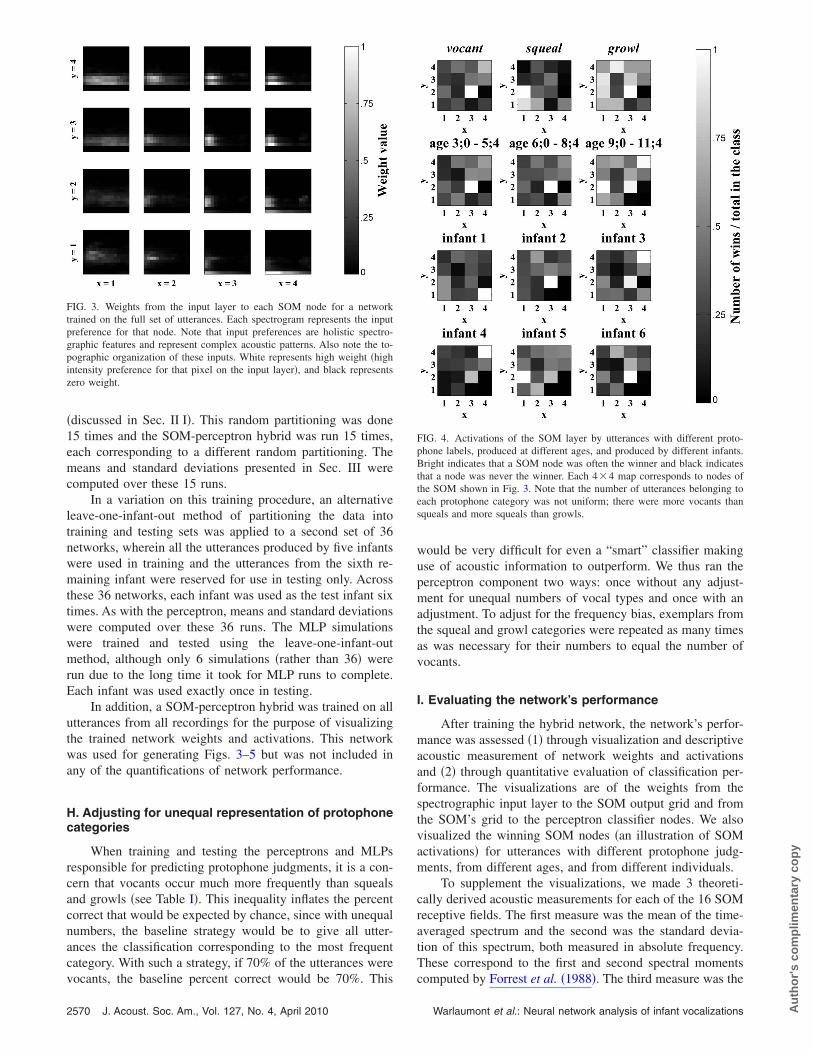
In addition, a SOM-perceptron hybrid was trained on allutterances from all recordings for the purpose of visualizingthe trained network weights and activations. This networkwas used for generating Figs. 3–5 but was not included inany of the quantifications of network performance.
H. Adjusting for unequal representation of protophonecategories
When training and testing the perceptrons and MLPsresponsible for predicting protophone judgments, it is a con-cern that vocants occur much more frequently than squealsand growls �see Table I�. This inequality inflates the percentcorrect that would be expected by chance, since with unequalnumbers, the baseline strategy would be to give all utter-ances the classification corresponding to the most frequentcategory. With such a strategy, if 70% of the utterances were
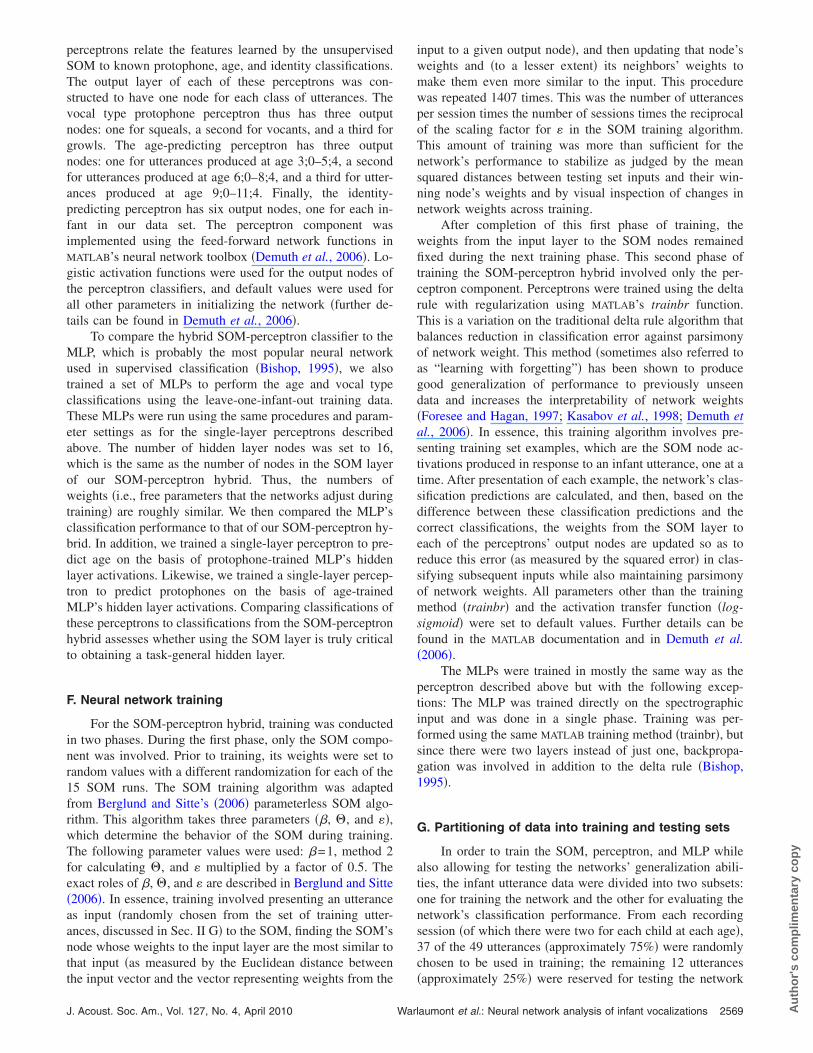
FIG. 3. Weights from the input layer to each SOM node for a networktrained on the full set of utterances. Each spectrogram represents the inputpreference for that node. Note that input preferences are holistic spectro-graphic features and represent complex acoustic patterns. Also note the to-pographic organization of these inputs. White represents high weight �highintensity preference for that pixel on the input layer�, and black representszero weight.
vocants, the baseline percent correct would be 70%. This
2570 J. Acoust. Soc. Am., Vol. 127, No. 4, April 2010
would be very difficult for even a “smart” classifier makinguse of acoustic information to outperform. We thus ran theperceptron component two ways: once without any adjust-ment for unequal numbers of vocal types and once with anadjustment. To adjust for the frequency bias, exemplars fromthe squeal and growl categories were repeated as many timesas was necessary for their numbers to equal the number ofvocants.
I. Evaluating the network’s performance
After training the hybrid network, the network’s perfor-mance was assessed �1� through visualization and descriptiveacoustic measurement of network weights and activationsand �2� through quantitative evaluation of classification per-formance. The visualizations are of the weights from thespectrographic input layer to the SOM output grid and fromthe SOM’s grid to the perceptron classifier nodes. We alsovisualized the winning SOM nodes �an illustration of SOMactivations� for utterances with different protophone judg-ments, from different ages, and from different individuals.
To supplement the visualizations, we made 3 theoreti-cally derived acoustic measurements for each of the 16 SOMreceptive fields. The first measure was the mean of the time-averaged spectrum and the second was the standard devia-tion of this spectrum, both measured in absolute frequency.These correspond to the first and second spectral moments
FIG. 4. Activations of the SOM layer by utterances with different proto-phone labels, produced at different ages, and produced by different infants.Bright indicates that a SOM node was often the winner and black indicatesthat a node was never the winner. Each 4�4 map corresponds to nodes ofthe SOM shown in Fig. 3. Note that the number of utterances belonging toeach protophone category was not uniform; there were more vocants thansqueals and more squeals than growls.
computed by Forrest et al. �1988�. The third measure was the
Warlaumont et al.: Neural network analysis of infant vocalizations Au
tho
r's
com
plim
enta
ry c
op
y
median point in time of the frequency-averaged intensitycontour. This should give a rough measure of the preferredduration of the receptive field. After calculating these threevalues for each SOM node, we calculated each perceptronoutput node’s preferred value for each of the three acousticmeasures by finding the average SOM receptive field valuesweighted by the perceptron output node’s weights from theSOM layer.
Quantitative evaluation involved feeding the networks’utterances from the set that were reserved for testing. Thenetworks’ classifications regarding the protophone, agegroup, and infant identity for each of these test utteranceswere then obtained, and an overall mean percentage correctfor each type of classification for each type of network wascomputed. Cohen’s � reliability statistics and their corre-sponding probabilities were computed using Cardillo’s�2009� MATLAB function, in order to evaluate the magnitude
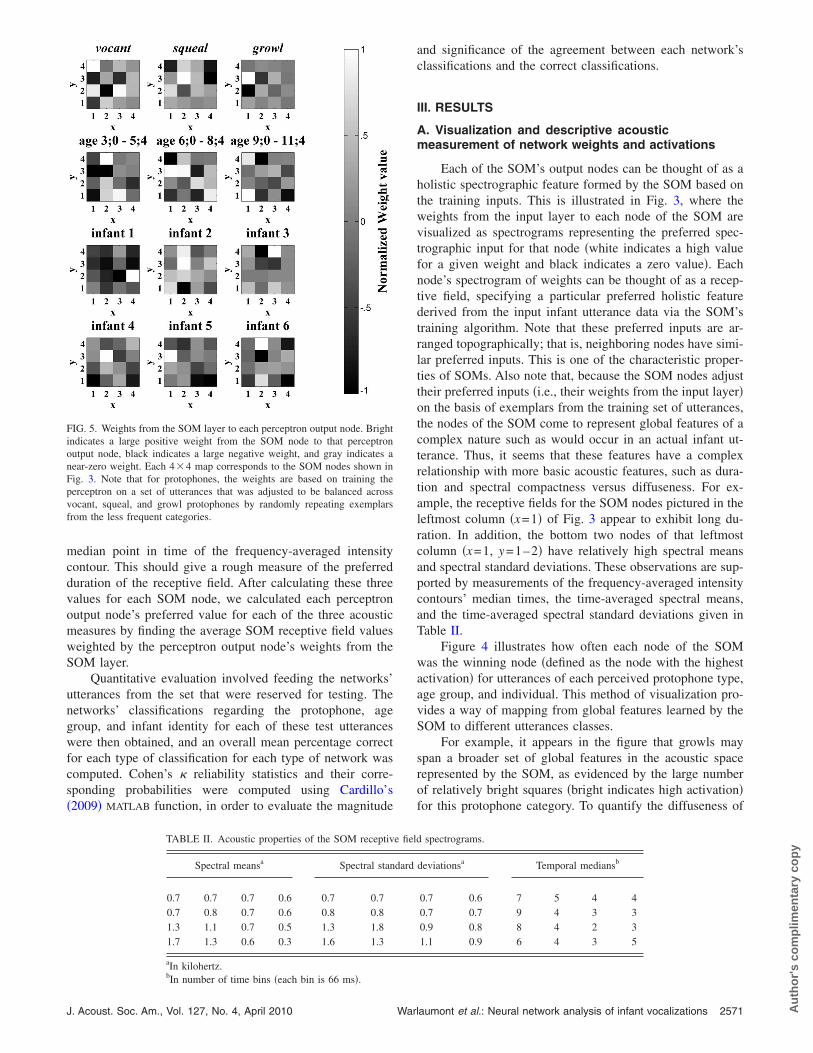
FIG. 5. Weights from the SOM layer to each perceptron output node. Brightindicates a large positive weight from the SOM node to that perceptronoutput node, black indicates a large negative weight, and gray indicates anear-zero weight. Each 4�4 map corresponds to the SOM nodes shown inFig. 3. Note that for protophones, the weights are based on training theperceptron on a set of utterances that was adjusted to be balanced acrossvocant, squeal, and growl protophones by randomly repeating exemplarsfrom the less frequent categories.
TABLE II. Acoustic properties of the SOM receptiv
Spectral meansa Spectral stan
0.7 0.7 0.7 0.6 0.7 0.70.7 0.8 0.7 0.6 0.8 0.81.3 1.1 0.7 0.5 1.3 1.81.7 1.3 0.6 0.3 1.6 1.3
aIn kilohertz.b
In number of time bins �each bin is 66 ms�.J. Acoust. Soc. Am., Vol. 127, No. 4, April 2010 War
and significance of the agreement between each network’sclassifications and the correct classifications.
III. RESULTS
A. Visualization and descriptive acousticmeasurement of network weights and activations
Each of the SOM’s output nodes can be thought of as aholistic spectrographic feature formed by the SOM based onthe training inputs. This is illustrated in Fig. 3, where theweights from the input layer to each node of the SOM arevisualized as spectrograms representing the preferred spec-trographic input for that node �white indicates a high valuefor a given weight and black indicates a zero value�. Eachnode’s spectrogram of weights can be thought of as a recep-tive field, specifying a particular preferred holistic featurederived from the input infant utterance data via the SOM’straining algorithm. Note that these preferred inputs are ar-ranged topographically; that is, neighboring nodes have simi-lar preferred inputs. This is one of the characteristic proper-ties of SOMs. Also note that, because the SOM nodes adjusttheir preferred inputs �i.e., their weights from the input layer�on the basis of exemplars from the training set of utterances,the nodes of the SOM come to represent global features of acomplex nature such as would occur in an actual infant ut-terance. Thus, it seems that these features have a complexrelationship with more basic acoustic features, such as dura-tion and spectral compactness versus diffuseness. For ex-ample, the receptive fields for the SOM nodes pictured in theleftmost column �x=1� of Fig. 3 appear to exhibit long du-ration. In addition, the bottom two nodes of that leftmostcolumn �x=1, y=1–2� have relatively high spectral meansand spectral standard deviations. These observations are sup-ported by measurements of the frequency-averaged intensitycontours’ median times, the time-averaged spectral means,and the time-averaged spectral standard deviations given inTable II.
Figure 4 illustrates how often each node of the SOMwas the winning node �defined as the node with the highestactivation� for utterances of each perceived protophone type,age group, and individual. This method of visualization pro-vides a way of mapping from global features learned by theSOM to different utterances classes.
For example, it appears in the figure that growls mayspan a broader set of global features in the acoustic spacerepresented by the SOM, as evidenced by the large numberof relatively bright squares �bright indicates high activation�for this protophone category. To quantify the diffuseness of
spectrograms.
deviationsa Temporal mediansb
0.7 0.6 7 5 4 40.7 0.7 9 4 3 30.9 0.8 8 4 2 31.1 0.9 6 4 3 5
e field
dard
laumont et al.: Neural network analysis of infant vocalizations 2571 Au
tho
r's
com
plim
enta
ry c
op
y
activation across the SOM for a given utterance class, wefirst calculated for each node the number of inputs for whichthat node was the winner, divided by the total number ofinputs belonging to that class. Then the median of these pro-portion values was computed. These medians were comparedacross the three protophone categories. Indeed, the medianwas higher for growls �0.24� than for vocants �0.18� or forsqueals �0.15�. This indicates that the winning nodes for thiscategory are distributed more evenly across the map than forthe other categories.
Another observation that is evident in Fig. 4 is the over-lap between utterance classes. While there is some distinct-ness across protophones, as indicated, for example, by therebeing different most highly activated nodes for squeals �thenode at x=1, y=2� than for vocants and growls �the node atx=3, y=2�, there is also a high degree of overlap in the SOMnode activations, as indicated by numerous nodes that showgray activation for all three protophone types.
Figure 5 illustrates the weights from the SOM to theperceptron output nodes for each age, infant, and protophoneprediction. Recall that the goal of the perceptron is differen-tiation of categories �protophone type, age, and infant� viapositive and negative weights. Thus for Fig. 5 the scaling isdifferent from that of Fig. 4. In Fig. 5, white indicates highpositive weight, black indicates high negative weight, andmid-gray indicates near-zero weight. The weights indicatewhich of the SOM’s holistic features are informative forclassification purposes, highlighting the differences betweenutterance classes and ignoring features that are common toall classes.
The visualizations in Figs. 4 and 5 exhibit both similari-ties and differences. This is evident in the correlation coeffi-cients between a given class’s SOM activations �Fig. 4� andthe weights from the SOM to its perceptron node �Fig. 5�.The mean, across all class types, of these correlation coeffi-cients is r=.31 where r was always positive, ranging from0.03 to 0.58. As an example of a specific similarity betweenactivation and weight patterns, the SOM nodes located at�x=1, y=4�, �x=4, y=4�, and �x=4, y=3� are very dark forsqueals in both figures. This indicates that these SOM nodesare both infrequent �Fig. 4� and negatively associated char-acteristics �Fig. 5� of squeals. An example of a differencebetween the two figures is that, while the SOM node locatedat �x=4, y=4� is the second highest activated for vocants asshown in Fig. 4, it does not have a very large positive weightto the perceptron vocant node, as indicated in Fig. 5. Differ-ences between Figs. 4 and 5 are due to the fact that Fig. 4indicates the frequency with which features were observedwhereas Fig. 5 highlights the particular SOM nodes that,when activated at least partially by an utterance, distinguishutterances of one class �e.g., vocants� from utterances ofother classes �e.g., squeals and growls�.
Recall the discussion of duration, spectral mean, andspectral standard deviation from the discussion of the SOMreceptive field spectrograms �Fig. 3�. It was observed that theleftmost column was associated with long duration and thatthe bottom two nodes of that column also had high spectralmeans and standard deviations. Interestingly, this leftmost
column appears both in Fig. 4 and in Fig. 5 to be associated2572 J. Acoust. Soc. Am., Vol. 127, No. 4, April 2010
more �as evidenced by light-colored pixels in this column�with the older two age groups than with the younger agegroup. This suggests that increase in duration is associatedwith increase in age. In addition, the bottom two nodes ofthat leftmost column are associated with the oldest agegroup. This suggests that the oldest age group is associatedalso with increase in spectral mean and standard deviation.Combining information about the acoustic properties ofSOM weights and the values of the weights from the SOMlayer to each of the perceptron output nodes, it is possible toexplore whether these acoustic features are present in thenodes that distinguish between different ages. Table IIIshows the spectral mean, spectral standard deviation, andtemporal duration properties for each age, protophone type,and infant. Indeed, the spectral duration of perceptronweights appears to increase across the three age groups, andthe spectral mean and standard deviation are highest for theoldest age group.
Table III also reveals interesting patterns with respect tothe three protophones’ acoustic properties. Squeals have thehighest spectral mean and spectral standard deviation. This isin accordance with previous descriptions of this category ashigh pitch often accompanied by harshness and/or pitchvariation. However, growls do not differ from vocants ineither mean or spectral standard deviation. Perhaps the highharshness/pulse/creaky-voice combine with the low pitch ofgrowls to yield moderate spectral mean values. Thus, al-though the differentiating acoustic properties of squeals fitwith their previous perceptual descriptions, the differentiat-ing acoustic properties of growls may be less straightfor-wardly defined in this neural network.
B. Classification performance
1. Protophone-classification performance
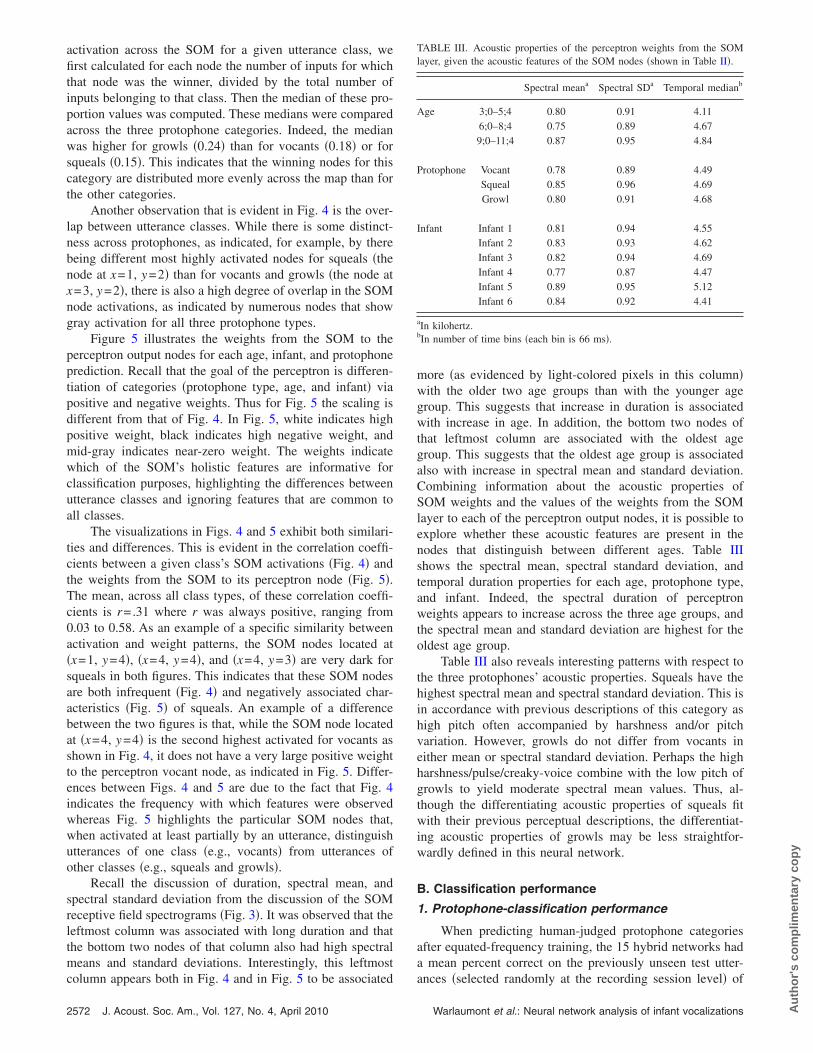
When predicting human-judged protophone categoriesafter equated-frequency training, the 15 hybrid networks hada mean percent correct on the previously unseen test utter-
TABLE III. Acoustic properties of the perceptron weights from the SOMlayer, given the acoustic features of the SOM nodes �shown in Table II�.
Spectral meana Spectral SDa Temporal medianb
Age 3;0–5;4 0.80 0.91 4.116;0–8;4 0.75 0.89 4.679;0–11;4 0.87 0.95 4.84
Protophone Vocant 0.78 0.89 4.49Squeal 0.85 0.96 4.69Growl 0.80 0.91 4.68
Infant Infant 1 0.81 0.94 4.55Infant 2 0.83 0.93 4.62Infant 3 0.82 0.94 4.69Infant 4 0.77 0.87 4.47Infant 5 0.89 0.95 5.12Infant 6 0.84 0.92 4.41
aIn kilohertz.bIn number of time bins �each bin is 66 ms�.
ances �selected randomly at the recording session level� of
Warlaumont et al.: Neural network analysis of infant vocalizations Au
tho
r's
com
plim
enta
ry c
op
y
54.4% �see the first column of Table IV�. Since there werethree protophone types, each of which was equally repre-sented in both the training and the testing utterance sets, theclassification performance that would be expected for a clas-sifier performing at chance is 33.3%. The vocal-type-predicting networks’ 54.4% correct performance was signifi-cantly better than chance, �=0.316, p�0.001.
Recall that 36 additional hybrid networks were trainedon utterances from five infants and tested on the sixth re-maining infant’s utterances. Each infant was used for testingfor exactly 6 of the 36 networks. The purpose of this varia-tion on the method for partitioning utterances into trainingand testing sets was to see if classification of protophoneswould generalize across infants. Mean classification perfor-mance for these networks was 55.0% correct, where chancelevel performance would have been 33.3% �see the secondcolumn of Table IV�. This was statistically better thanchance, �=0.325, p�0.001. This shows that for protophoneprediction, performance did not differ from when thesession-level train-test partition method was used to whenthe leave-one-infant-out method was used. Thus, it appearsthat the network’s protophone-classification capabilities arebased on features of utterances that are generalizable even toinfants the network has never previously encountered.
When no adjustment was made for the inequality in thenumber of exemplars in each protophone category, the per-centage correct was 73.4% where the baseline percent cor-rect for an algorithm that always guessed vocant would be74.9%.
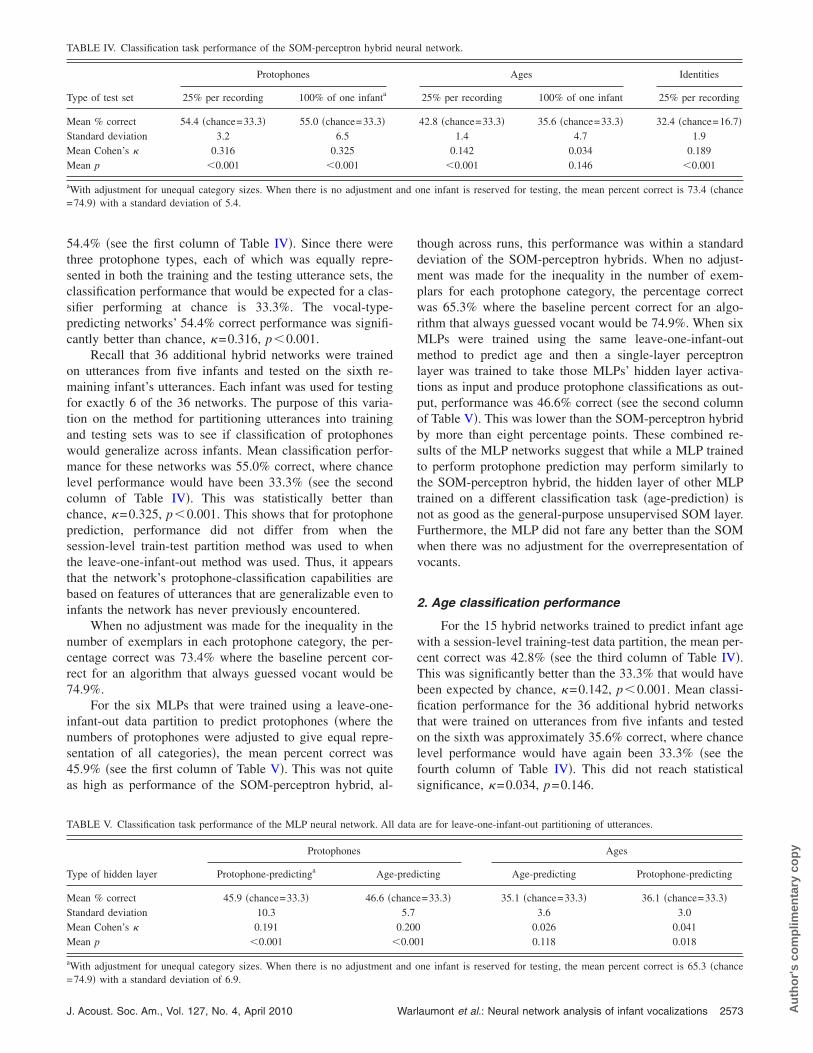
For the six MLPs that were trained using a leave-one-infant-out data partition to predict protophones �where thenumbers of protophones were adjusted to give equal repre-sentation of all categories�, the mean percent correct was45.9% �see the first column of Table V�. This was not quiteas high as performance of the SOM-perceptron hybrid, al-
TABLE IV. Classification task performance of the SOM-perceptron hybrid
Type of test set
Protophones
25% per recording 100% of one infanta
Mean % correct 54.4 �chance=33.3� 55.0 �chance=33.3�Standard deviation 3.2 6.5Mean Cohen’s � 0.316 0.325Mean p �0.001 �0.001
aWith adjustment for unequal category sizes. When there is no adjustment=74.9� with a standard deviation of 5.4.
TABLE V. Classification task performance of the MLP neural network. All
Type of hidden layer
Protophones
Protophone-predictinga Age
Mean % correct 45.9 �chance=33.3� 46.6 �cStandard deviation 10.3Mean Cohen’s � 0.191Mean p �0.001 �
aWith adjustment for unequal category sizes. When there is no adjustment
=74.9� with a standard deviation of 6.9.J. Acoust. Soc. Am., Vol. 127, No. 4, April 2010 War
though across runs, this performance was within a standarddeviation of the SOM-perceptron hybrids. When no adjust-ment was made for the inequality in the number of exem-plars for each protophone category, the percentage correctwas 65.3% where the baseline percent correct for an algo-rithm that always guessed vocant would be 74.9%. When sixMLPs were trained using the same leave-one-infant-outmethod to predict age and then a single-layer perceptronlayer was trained to take those MLPs’ hidden layer activa-tions as input and produce protophone classifications as out-put, performance was 46.6% correct �see the second columnof Table V�. This was lower than the SOM-perceptron hybridby more than eight percentage points. These combined re-sults of the MLP networks suggest that while a MLP trainedto perform protophone prediction may perform similarly tothe SOM-perceptron hybrid, the hidden layer of other MLPtrained on a different classification task �age-prediction� isnot as good as the general-purpose unsupervised SOM layer.Furthermore, the MLP did not fare any better than the SOMwhen there was no adjustment for the overrepresentation ofvocants.
2. Age classification performance
For the 15 hybrid networks trained to predict infant agewith a session-level training-test data partition, the mean per-cent correct was 42.8% �see the third column of Table IV�.This was significantly better than the 33.3% that would havebeen expected by chance, �=0.142, p�0.001. Mean classi-fication performance for the 36 additional hybrid networksthat were trained on utterances from five infants and testedon the sixth was approximately 35.6% correct, where chancelevel performance would have again been 33.3% �see thefourth column of Table IV�. This did not reach statisticalsignificance, �=0.034, p=0.146.
l network.
Ages Identities
25% per recording 100% of one infant 25% per recording
42.8 �chance=33.3� 35.6 �chance=33.3� 32.4 �chance=16.7�1.4 4.7 1.9
0.142 0.034 0.189�0.001 0.146 �0.001
ne infant is reserved for testing, the mean percent correct is 73.4 �chance
are for leave-one-infant-out partitioning of utterances.
Ages
icting Age-predicting Protophone-predicting
=33.3� 35.1 �chance=33.3� 36.1 �chance=33.3�3.6 3.0
0.026 0.0411 0.118 0.018
ne infant is reserved for testing, the mean percent correct is 65.3 �chance
neura
and o
data
-pred
hance5.7
0.2000.00
and o
laumont et al.: Neural network analysis of infant vocalizations 2573 Au
tho
r's
com
plim
enta
ry c
op
y
The six MLPs that were trained using a leave-one-infant-out data partition to predict age had a mean percentcorrect of 35.1% �see the third column of Table V�. This wasvery similar to the performance of the SOM-perceptron hy-brid. When six MLPs were trained using the same leave-one-infant-out method to predict protophones �numbers adjustedfor equal representation of protophone categories� and then asingle-layer perceptron layer was trained to take thoseMLPs’ hidden layer activations as input and produce ageclassifications as output, performance was 36.1% correct �seethe fourth column of Table V�. This was again very similar tothe performance of the SOM-perceptron hybrid. These com-bined results of the two MLP variations suggest that both aMLP and the SOM-perceptron hybrid are approximatelyequally suited to the task of predicting age, though neitherdoes very well when forced to generalize to an infant it hasnever previously encountered before.
3. Infant identity classification performance
For the 15 hybrid networks trained to predict the identityof the infant who produced an utterance �with session-leveltraining-test data partition�, the mean percent correct wasapproximately 32.4% correct �see the fifth column of TableIV�. Compared to the 16.7% correct that would be expectedhad the networks been performing at chance, this perfor-mance was statistically significant, �=0.189, p�0.001.
IV. DISCUSSION
A. Visualization of network weights and activations
One of the main advantages of the SOM-perceptron hy-brid is its usefulness for data visualization purposes. By plot-ting the weights from the input layer to the SOM �Fig. 3�, itis possible to visualize the range of holistic spectrographicfeatures exhibited by the vocalizations in the present data set.These holistic features are extremely complex, which can beseen as both an advantage, in that they retain the complexityof prototypical utterances, and as a disadvantage, in that theyare difficult to interpret. By plotting the activations of eachSOM node according to protophone, age, and identity, andby plotting the weights from each SOM node to each percep-tron node, it is also possible to explore the relationship be-tween the holistic spectrographic features learned by theSOM and different categories of utterances.
One method that was used to quantitatively interpret thetrends observed in the figures was to get the median numberof wins per SOM node for a specific utterance type �e.g., foreach of the protophone types� to see which tended to occupymore of the SOM’s representational space. Using thismethod, it was found that growls had more diffuse activationof the SOM than squeals or growls, suggesting that growlshave a larger range of acoustic variability.
In another approach to interpreting the trained networkwe showed that since the SOM’s receptive fields take thesame form as their inputs, which in this case are coarse-grained spectrograms, more traditional acoustic descriptions,such as spectral mean, spectral standard deviation, and tem-poral median �related to duration� can be gotten. As observed
in Sec. III, the leftmost column of SOM nodes in Fig. 3 had2574 J. Acoust. Soc. Am., Vol. 127, No. 4, April 2010
long durations and the bottom two nodes of that column hadhigh spectral mean and standard deviation. These nodes alsohad a tendency to be activated more by utterances from theolder two age groups �6;0–11;4� than by utterances from theyoungest age group �3;0–5;4�, as evidenced by their lightercolorings in Figs. 4 and 5. Thus, a hypothesis for futureinvestigation might be that utterances produced at older agesare not only longer in duration but also higher in spectralmean and variance.
B. Classification performance
The hybrid neural network, consisting of a perceptronclassifier operating on the SOM’s holistic spectrographic fea-tures, is able to reliably classify 1-s-long utterance samplesaccording to vocal type protophones, ages at which theywere produced, and the identities of the individuals who pro-duced them. Reliable performance on these classificationtasks provides support for the validity of the SOM’s learnedutterance features, suggesting that they reflect meaningfulacoustic variation in infants’ vocal productions. One of themost important possible applications of the work representedhere may be in contributing to the rapidly growing field ofautomated analysis of vocalization. MLPs trained on thesame classification tasks also performed well, so when thegoal is purely classification, and comparison of holistic fea-tures across different classifications is not important, MLPsmay also be a good choice of tool.
It should be emphasized that the most critical issue forthe future of automated vocal analysis is that reliability besignificant, not necessarily that it be high. With very largedata sets, relatively low kappa values do not necessarilypresent an important problem. If a signal is consistently�even though at low levels� detectable, it can become highlydiscernible at high Ns. This principle is widely recognized,for example, in the field of averaged evoked potentials�Burkard and Secor, 2002�. It should also be noted that, al-though the methods used in the present study did involvesome processing by human analysts, this was only in order toperform utterance extraction and protophone labeling. An au-tomated infant utterance extraction method has already beendeveloped for very large vocalization data sets taken fromday-long recordings �see Zimmerman et al., 2009�, and sucha method could be substituted for the manual utterance ex-traction performed here. As for protophone labeling, formodel training and evaluation, the use of human judgmentsin establishing gold-standard classifications is unavoidable.However, for automated analysis of large data sets, trainingand evaluation of a network using manually labeled utter-ances need not be done on the entire large data set, but onlyon a sample of data large enough to ensure satisfactory net-work performance and generalization.
The ability to reliably classify utterances according toprotophone is of considerable interest. At present, proto-phone categories are widely used in studies of infant speechdevelopment in both typically and atypically developingchildren �e.g., Hardin-Jones et al., 2003; Salas-Provance etal., 2003; Iverson and Wozniak, 2007; Goldstein and
Schwade, 2008� as well as in tools that use infants’ vocaliza-Warlaumont et al.: Neural network analysis of infant vocalizations Au
tho
r's
com
plim
enta
ry c
op
y
tions in their assessment of infants’ communicative function�e.g., Bryson et al., 2008�. The ability to predict trained ana-lysts’ perceptual judgments suggests that neural networksand other data-driven statistical tools have the potential to beused for automatic classification of protophone categories�although a workaround for the issue of frequency imbalanceacross categories would have to be devised�. This would beuseful in many research and clinical settings where codingby trained analysts is costly or difficult. In the future, itwould be interesting to apply either the SOM-perceptron-hybrid or a MLP to the classification of other protophones,such as marginal syllable and canonical syllable—categoriesrelated to the articulation timing of syllables that have beenshown to be of particular importance as indicators of normaldevelopment �Oller, 2000�.
The ability to identify age, combined with the network’sability to identify the individual who produced a given utter-ance, suggests that neural networks and related approacheshave the potential for future use in classifying utterancesproduced by delayed or disordered individuals. Prediction ofinfant identity also lays groundwork for future work thatmight attempt to classify utterances produced by infantsfrom different cultural or linguistic backgrounds and by fe-male versus male infants.
C. Future development
1. Manipulating the network’s input
The SOM-perceptron architecture is highly flexible withregard to the type of information it can be given as input.Although 225-pixel spectrograms of 1-s-long utterancesamples were used in this study, such an input representationwas chosen primarily for its computational efficiency andbecause it involved relatively little preprocessing of data. Itis possible that other formats of input would yield betterperformance or additional insights. Future studies mightcompare features learned by SOMs trained on different typesof input, be they relatively raw input �e.g., raw waveforms,spectrograms of various frequencies and time resolutions�,more traditional acoustic measures �e.g., f0 means, formantfrequency means, amplitude means, durations�, or measuresthat represent intermediate amounts of preprocessing �e.g., f0
contours, formant frequency contours, and amplitude con-tours�.
In discussing the visualizations afforded by the SOM-perceptron hybrid, reference was made to how these visual-izations might be related to acoustic patterns described inmore traditional terms. For example, it was noted that theSOM features’ duration preferences appear to increase withincreasing age. Although beyond the scope of the presentstudy, this hypothesis could be tested by comparing thepresent SOM-perceptron hybrid �trained on raw spectro-graphic input� with a SOM-perceptron hybrid networktrained on duration alone. That is, rather than providing thenetwork with pixels of spectrograms as input, one could pro-vide the network with a single value representing an utter-ance’s duration. If such a network trained on utterance dura-tions also performs significantly well, this would indicate
that changes in utterance duration are indeed associated withJ. Acoust. Soc. Am., Vol. 127, No. 4, April 2010 War
increasing age. One could then train a SOM-perceptron net-work on input consisting of a spectrogram plus an additionalfeature representing the utterance’s duration. If this networkperformed better than the network trained only on spectro-grams �e.g., as measured by a hierarchical regression�, thiswould imply that duration changes systematically with de-velopment but was not adequately represented by the SOMtrained only on spectrograms. On the other hand, if the twonetworks perform equally well, this might suggest that theSOM had already encoded the relevant duration informationin its features. This type of approach could provide a meansfor parsing out the role of various acoustic measures in howwell they predict the age �or identity, protophone category,etc.� of infant utterances.
Finally, it would be highly desirable to explore inputrepresentations that deal more flexibly with temporal aspectsof vocalizations. Infant utterances vary in length and oftenhave prosodic and syllabic components that vary in theirtiming. The current static spectrograms used as input do notadequately deal with this fact. A better solution might be onein which small time segments of spectrograms �or otheracoustic features� of infant utterances are presented in se-quence. The network would then make classifications at eachtime point or at the conclusion of the entire sequence. Achange of this sort in the temporal nature of the input would,however, require changes in the network architecture. Somepossibilities are proposed as part of Sec. IV C 2.
2. Alternative architectures and algorithms
The choice of a SOM-perceptron hybrid architecturewas motivated by the fact that its components had been pre-viously applied to related problems involving the visualiza-tion and classification of acoustic vocalization data, includ-ing avian song, disordered adult voice, and infant crying. Thechoice of a SOM as the first element of this architecture wasalso motivated by studies suggesting that SOMs can produceresults that are comparable to other statistical clustering andvisualization methods �Flexer, 2001; de Bodt et al., 2002�.Choosing a SOM for the first component of the two-component hybrid network also has the advantage that thesame first component is used regardless of the classificationtask performed by the subsequent perceptron component.Thus, the middle layer activations and weights can be com-pared across different classification tasks �e.g., the SOMnode activations and weights for younger utterances can becompared to the SOM node activations and weights for vo-cants, squeals, and growls�. Finally, the biologically inspiredfeatures of the SOM, notably its topographical self-organization and incremental learning algorithm, are alsoseen as advantages �see Sec. IV C 3 below on future model-ing directions; Miikkulainen, 1991; Kohonen and Hari, 1999;Ritter, 2003�.
Nevertheless, exploration of other architectures couldyield better performance or additional information. For ex-ample, a two-layer perceptron may be worth using for situa-tions where classification performance and differentiation be-tween classes is the primary goal. Furthermore, non-neural-network statistical models, such as mixtures of Gaussians,
k-nearest-neighbors analysis �Xu and Wunsch, 2005�, andlaumont et al.: Neural network analysis of infant vocalizations 2575 Au
tho
r's
com
plim
enta
ry c
op
y
possibly even linear discriminant analysis and regressiontechniques could potentially yield as good or better cluster-ing and classification performance, respectively. Future workcould compare such methods on their performance on a spe-cific visualization or classification task.
In addition, recurrent neural networks are often consid-ered better for temporal sequence processing than networksthat take static input �Elman, 1990�. Thus, given that infantvocalizations are temporal patterns occurring in temporal se-quences, it would be worthwhile to explore recurrent ver-sions of the SOM �e.g., Euliano and Principe, 1996� whenunsupervised analysis is desired, or the simple recurrent net-work �SRN� �Elman, 1990�, when classification or predictionis the primary goal. Perhaps even a hybrid of the recurrentSOM and the SRN could be used, which would be analogousto the static SOM-perceptron hybrid explored in the presentstudy. Moving to such temporal architectures would involvechanging the nature of the network’s input representation asdiscussed in Sec. IV C 1. A fixed moving window of spectralinput would be appropriate.
Finally, variations on the SOM that allow for uncertaintyin the number of features/categories or that allow for hierar-chical organization of features/categories �Carpinteiro, 1999;Rauber et al., 2002� might also prove useful and informative.The SOM-perceptron hybrid presented in this early study isthus only one of a number of statistical and neural networkoptions.
3. Modeling the perception and production of infantvocalizations
The SOM is a neural network inspired in large part bybiological considerations, namely, the self-organizing topo-graphic nature of its feature representations and unsupervisedlearning in response to stimulus exposure �Miikkulainen,1991; Kohonen and Hari, 1999; Ritter, 2003�. Although thepresent study focuses solely on acoustic analysis and classi-fication applications, this work provides a potential founda-tion for future modeling of the perception of infant vocaliza-tions by humans, including learning through exposure tosuch vocalizations.
Caregivers are commonly infants’ primary communica-tion partners, responding and providing feedback to infants.Furthermore, much of the current research on infant vocaldevelopment relies critically on naturalistic judgments bylaboratory personnel. It is therefore important to understandhow adults perceive infant vocalizations and to understandwhat acoustic features are relevant to adult communicationpartners. There are several ways in which the ability of theSOM to model adult humans’ perceptions of infant utter-ances might be assessed. One way would be to have humanparticipants perform tasks directly matched to those theSOM-perceptron hybrid performed. Another possibilitywould be to compare the topography of features on the SOMto listeners’ similarity judgments.
ACKNOWLEDGMENTS
This study was supported by a Department of Energy
Computational Science Graduate Fellowship �A.S.W.�, by2576 J. Acoust. Soc. Am., Vol. 127, No. 4, April 2010
NIH Grant No. R01 DC006099-04 �D.K.O., PI, and E.H.B.,Co-PI�, and by the Plough Foundation. R.D. �PI� was sup-ported by NSF Grant Nos. BCS-0720322 and BCS-0826825.The authors wish to thank Lesya Chorna, Kyounghwa Kwon,Elisabeth Callihan, Courtney Jacks, the University of Mem-phis Infant Vocalization Laboratory analysts, and the infantparticipants and their caregivers.
Berglund, E., and Sitte, J. �2006�. “The parameterless self-organizing mapalgorithm,” IEEE Trans. Neural Netw. 17, 305–316.
Bishop, C. M. �1995�. Neural Networks for Pattern Recognition �OxfordUniversity Press, New York�.
Bryson, S. E., Zwaigenbaum, L., McDermott, C., Rombough, V., and Brian,J. �2008�. “The autism observation scale for infants: Scale developmentand reliability data,” J. Autism Dev. Disord. 38, 731–738.
Buder, E. H., Chorna, L. B., Oller, D. K., and Robinson, R. B. �2008�.“Vibratory regime classification of infant phonation,” J. Voice 22, 553–564.
Buder, E. H., and Stoel-Gammon, C. �2002�. “American and Swedish chil-dren’s acquisition of vowel duration: Effects of identity and final stopvoicing,” J. Acoust. Soc. Am. 111, 1854–1864.
Burkard, R. F., and Secor, C. �2002�. “Overview of auditory evoked poten-tials,” in Handbook of Clinical Audiology, edited by J. Katz, R. F.Burkard, and L. Medwetsky �Lippincott Williams & Wilkins, Baltimore,MD�, pp. 233–248.
Callan, D. E., Kent, R. D., Roy, N., and Tasko, S. M. �1999�. “Self-organizing map for the classification of normal and disordered femalevoices,” J. Speech Lang. Hear. Res. 42, 355–366.
Cardillo, G. �2009�. Cohen’s kappa, http://www.mathworks.com/matlabcentral/fileexchange/15365-cohens-kappa �Last viewed Nov. 13,2008�.
Carpinteiro, O. A. s. �1999�. “A hierarchical self-organising map model forsequence recognition,” Neural Process. Lett. 9, 209–220.
de Bodt, E., Cottrell, M., and Verleysen, M. �2002�. “Statistical tools toassess the reliability of self-organizing maps,” Neural Networks 15, 967–978.
Delgado, R. E. �2008�. “Action analysis coding and training software�AACT�,” computer software, Intelligent Hearing Systems Corp., Miami,FL.
Demuth, H., Beale, M., and Hagan, M. �2006�. Neural Network Toolbox forUse With MATLAB �The Mathworks, Inc., Natick, MA�.
Eilers, R. E., and Oller, D. K. �1994�. “Infant vocalizations and the earlydiagnosis of severe hearing impairment,” J. Pediatr. 124, 199–203.
Ellis, D. P. W. �2007�. PLP and RASTA �and MFCC, and inversion� inMATLAB, http://www.ee.columbia.edu/~dpwe/resources/matlab/rastamat/�Last viewed 1/21/2008�.
Elman, J. L. �1990�. “Finding structure in time,” Cogn. Sci. 14, 179–211.Euliano, N. R., and Principe, J. C. �1996�. “Spatio-temporal self-organizing
feature maps,” Proceedings of the IEEE International Conference on Neu-ral Networks, Vol. 4, pp. 1900–1905.
Fell, H. J., MacAuslan, J., Ferrier, L. J., Worst, S. G., and Chenausky, K.�2002�. “Vocalization age as a clinical tool,” in the Proceedings of the 7thInternational Conference on Spoken Language Processing �ICSLP ’02�,Denver, CO, pp. 2345–2348.
Flexer, A. �2001�. “On the use of self-organizing maps for clustering andvisualization,” Intell. Data Anal. 5, 373–384.
Foresee, D. F., and Hagan, M. T. �1997�. “Gauss-Newton approximation toBayesian learning,” Proceedings of the IEEE International Conference onNeural Networks, Vol. 10, pp. 1930–1935.
Forrest, K., Weismer, G., Milenkovic, P., and Dougall, R. N. �1988�. “Sta-tistical analysis of word-initial voiceless obstruents: Preliminary data,” J.Acoust. Soc. Am. 84, 115–123.
Gauthier, B., Shi, R., and Xu, Y. �2007�. “Learning phonetic categories bytracking movements,” Cognition 103, 80–106.
Goldstein, M. H., and Schwade, J. A. �2008�. “Social feedback to infants’babbling facilitates rapid phonological learning,” Psychol. Sci. 19, 515–523.
Guenther, F. H., and Gjaja, M. N. �1996�. “The perceptual magnet effect asan emergent property of neural map formation,” J. Acoust. Soc. Am. 100,1111–1121.
Hardin-Jones, M., Chapman, K. L., and Schulte, J. �2003�. “The impact of
cleft type on early vocal development in babies with cleft palate,” CleftWarlaumont et al.: Neural network analysis of infant vocalizations Au
tho
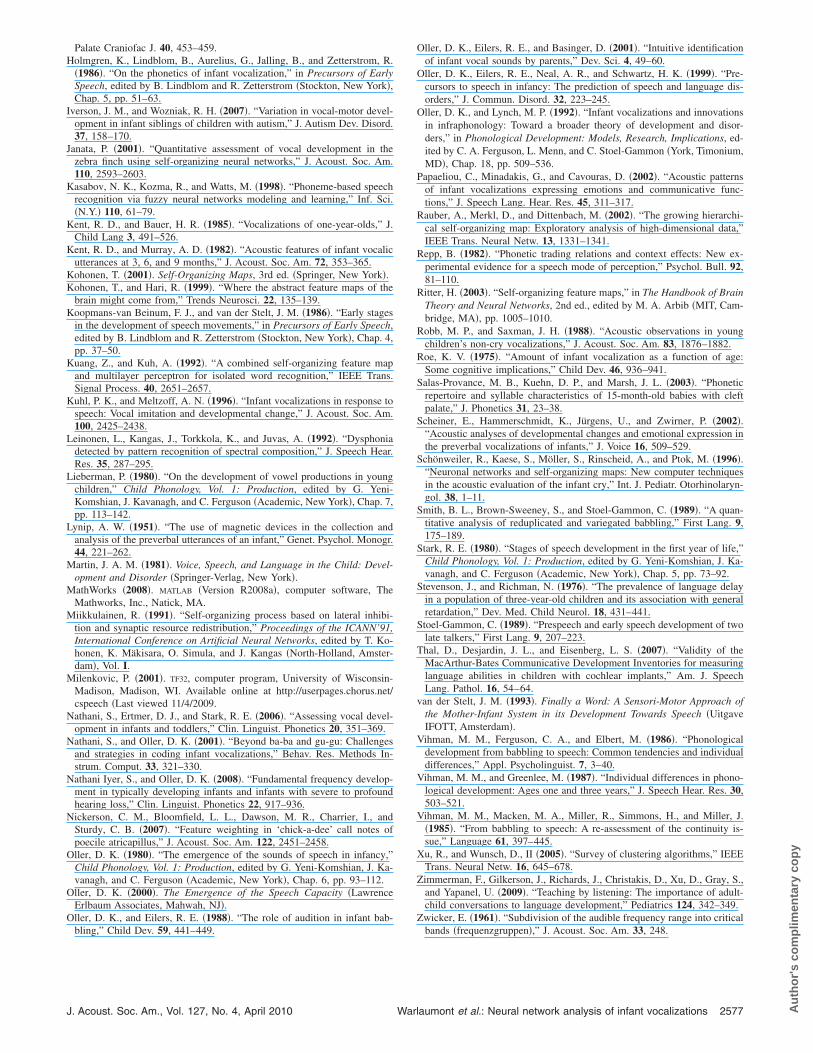
limen
tary
co
py
Palate Craniofac J. 40, 453–459.Holmgren, K., Lindblom, B., Aurelius, G., Jalling, B., and Zetterstrom, R.
�1986�. “On the phonetics of infant vocalization,” in Precursors of EarlySpeech, edited by B. Lindblom and R. Zetterstrom �Stockton, New York�,Chap. 5, pp. 51–63.
Iverson, J. M., and Wozniak, R. H. �2007�. “Variation in vocal-motor devel-opment in infant siblings of children with autism,” J. Autism Dev. Disord.37, 158–170.
Janata, P. �2001�. “Quantitative assessment of vocal development in thezebra finch using self-organizing neural networks,” J. Acoust. Soc. Am.110, 2593–2603.
Kasabov, N. K., Kozma, R., and Watts, M. �1998�. “Phoneme-based speechrecognition via fuzzy neural networks modeling and learning,” Inf. Sci.�N.Y.� 110, 61–79.
Kent, R. D., and Bauer, H. R. �1985�. “Vocalizations of one-year-olds,” J.Child Lang 3, 491–526.
Kent, R. D., and Murray, A. D. �1982�. “Acoustic features of infant vocalicutterances at 3, 6, and 9 months,” J. Acoust. Soc. Am. 72, 353–365.
Kohonen, T. �2001�. Self-Organizing Maps, 3rd ed. �Springer, New York�.Kohonen, T., and Hari, R. �1999�. “Where the abstract feature maps of the
brain might come from,” Trends Neurosci. 22, 135–139.Koopmans-van Beinum, F. J., and van der Stelt, J. M. �1986�. “Early stages
in the development of speech movements,” in Precursors of Early Speech,edited by B. Lindblom and R. Zetterstrom �Stockton, New York�, Chap. 4,pp. 37–50.
Kuang, Z., and Kuh, A. �1992�. “A combined self-organizing feature mapand multilayer perceptron for isolated word recognition,” IEEE Trans.Signal Process. 40, 2651–2657.
Kuhl, P. K., and Meltzoff, A. N. �1996�. “Infant vocalizations in response tospeech: Vocal imitation and developmental change,” J. Acoust. Soc. Am.100, 2425–2438.
Leinonen, L., Kangas, J., Torkkola, K., and Juvas, A. �1992�. “Dysphoniadetected by pattern recognition of spectral composition,” J. Speech Hear.Res. 35, 287–295.
Lieberman, P. �1980�. “On the development of vowel productions in youngchildren,” Child Phonology, Vol. 1: Production, edited by G. Yeni-Komshian, J. Kavanagh, and C. Ferguson �Academic, New York�, Chap. 7,pp. 113–142.
Lynip, A. W. �1951�. “The use of magnetic devices in the collection andanalysis of the preverbal utterances of an infant,” Genet. Psychol. Monogr.44, 221–262.
Martin, J. A. M. �1981�. Voice, Speech, and Language in the Child: Devel-opment and Disorder �Springer-Verlag, New York�.
MathWorks �2008�. MATLAB �Version R2008a�, computer software, TheMathworks, Inc., Natick, MA.
Miikkulainen, R. �1991�. “Self-organizing process based on lateral inhibi-tion and synaptic resource redistribution,” Proceedings of the ICANN’91,International Conference on Artificial Neural Networks, edited by T. Ko-honen, K. Mäkisara, O. Simula, and J. Kangas �North-Holland, Amster-dam�, Vol. I.
Milenkovic, P. �2001�. TF32, computer program, University of Wisconsin-Madison, Madison, WI. Available online at http://userpages.chorus.net/cspeech �Last viewed 11/4/2009.
Nathani, S., Ertmer, D. J., and Stark, R. E. �2006�. “Assessing vocal devel-opment in infants and toddlers,” Clin. Linguist. Phonetics 20, 351–369.
Nathani, S., and Oller, D. K. �2001�. “Beyond ba-ba and gu-gu: Challengesand strategies in coding infant vocalizations,” Behav. Res. Methods In-strum. Comput. 33, 321–330.
Nathani Iyer, S., and Oller, D. K. �2008�. “Fundamental frequency develop-ment in typically developing infants and infants with severe to profoundhearing loss,” Clin. Linguist. Phonetics 22, 917–936.
Nickerson, C. M., Bloomfield, L. L., Dawson, M. R., Charrier, I., andSturdy, C. B. �2007�. “Feature weighting in ‘chick-a-dee’ call notes ofpoecile atricapillus,” J. Acoust. Soc. Am. 122, 2451–2458.
Oller, D. K. �1980�. “The emergence of the sounds of speech in infancy,”Child Phonology, Vol. 1: Production, edited by G. Yeni-Komshian, J. Ka-vanagh, and C. Ferguson �Academic, New York�, Chap. 6, pp. 93–112.
Oller, D. K. �2000�. The Emergence of the Speech Capacity �LawrenceErlbaum Associates, Mahwah, NJ�.
Oller, D. K., and Eilers, R. E. �1988�. “The role of audition in infant bab-
bling,” Child Dev. 59, 441–449.J. Acoust. Soc. Am., Vol. 127, No. 4, April 2010 War
Oller, D. K., Eilers, R. E., and Basinger, D. �2001�. “Intuitive identificationof infant vocal sounds by parents,” Dev. Sci. 4, 49–60.
Oller, D. K., Eilers, R. E., Neal, A. R., and Schwartz, H. K. �1999�. “Pre-cursors to speech in infancy: The prediction of speech and language dis-orders,” J. Commun. Disord. 32, 223–245.
Oller, D. K., and Lynch, M. P. �1992�. “Infant vocalizations and innovationsin infraphonology: Toward a broader theory of development and disor-ders,” in Phonological Development: Models, Research, Implications, ed-ited by C. A. Ferguson, L. Menn, and C. Stoel-Gammon �York, Timonium,MD�, Chap. 18, pp. 509–536.
Papaeliou, C., Minadakis, G., and Cavouras, D. �2002�. “Acoustic patternsof infant vocalizations expressing emotions and communicative func-tions,” J. Speech Lang. Hear. Res. 45, 311–317.
Rauber, A., Merkl, D., and Dittenbach, M. �2002�. “The growing hierarchi-cal self-organizing map: Exploratory analysis of high-dimensional data,”IEEE Trans. Neural Netw. 13, 1331–1341.
Repp, B. �1982�. “Phonetic trading relations and context effects: New ex-perimental evidence for a speech mode of perception,” Psychol. Bull. 92,81–110.
Ritter, H. �2003�. “Self-organizing feature maps,” in The Handbook of BrainTheory and Neural Networks, 2nd ed., edited by M. A. Arbib �MIT, Cam-bridge, MA�, pp. 1005–1010.
Robb, M. P., and Saxman, J. H. �1988�. “Acoustic observations in youngchildren’s non-cry vocalizations,” J. Acoust. Soc. Am. 83, 1876–1882.
Roe, K. V. �1975�. “Amount of infant vocalization as a function of age:Some cognitive implications,” Child Dev. 46, 936–941.
Salas-Provance, M. B., Kuehn, D. P., and Marsh, J. L. �2003�. “Phoneticrepertoire and syllable characteristics of 15-month-old babies with cleftpalate,” J. Phonetics 31, 23–38.
Scheiner, E., Hammerschmidt, K., Jürgens, U., and Zwirner, P. �2002�.“Acoustic analyses of developmental changes and emotional expression inthe preverbal vocalizations of infants,” J. Voice 16, 509–529.
Schönweiler, R., Kaese, S., Möller, S., Rinscheid, A., and Ptok, M. �1996�.“Neuronal networks and self-organizing maps: New computer techniquesin the acoustic evaluation of the infant cry,” Int. J. Pediatr. Otorhinolaryn-gol. 38, 1–11.
Smith, B. L., Brown-Sweeney, S., and Stoel-Gammon, C. �1989�. “A quan-titative analysis of reduplicated and variegated babbling,” First Lang. 9,175–189.
Stark, R. E. �1980�. “Stages of speech development in the first year of life,”Child Phonology, Vol. 1: Production, edited by G. Yeni-Komshian, J. Ka-vanagh, and C. Ferguson �Academic, New York�, Chap. 5, pp. 73–92.
Stevenson, J., and Richman, N. �1976�. “The prevalence of language delayin a population of three-year-old children and its association with generalretardation,” Dev. Med. Child Neurol. 18, 431–441.
Stoel-Gammon, C. �1989�. “Prespeech and early speech development of twolate talkers,” First Lang. 9, 207–223.
Thal, D., Desjardin, J. L., and Eisenberg, L. S. �2007�. “Validity of theMacArthur-Bates Communicative Development Inventories for measuringlanguage abilities in children with cochlear implants,” Am. J. SpeechLang. Pathol. 16, 54–64.
van der Stelt, J. M. �1993�. Finally a Word: A Sensori-Motor Approach ofthe Mother-Infant System in its Development Towards Speech �UitgaveIFOTT, Amsterdam�.
Vihman, M. M., Ferguson, C. A., and Elbert, M. �1986�. “Phonologicaldevelopment from babbling to speech: Common tendencies and individualdifferences,” Appl. Psycholinguist. 7, 3–40.
Vihman, M. M., and Greenlee, M. �1987�. “Individual differences in phono-logical development: Ages one and three years,” J. Speech Hear. Res. 30,503–521.
Vihman, M. M., Macken, M. A., Miller, R., Simmons, H., and Miller, J.�1985�. “From babbling to speech: A re-assessment of the continuity is-sue,” Language 61, 397–445.
Xu, R., and Wunsch, D., II �2005�. “Survey of clustering algorithms,” IEEETrans. Neural Netw. 16, 645–678.
Zimmerman, F., Gilkerson, J., Richards, J., Christakis, D., Xu, D., Gray, S.,and Yapanel, U. �2009�. “Teaching by listening: The importance of adult-child conversations to language development,” Pediatrics 124, 342–349.
Zwicker, E. �1961�. “Subdivision of the audible frequency range into critical
bands �frequenzgruppen�,” J. Acoust. Soc. Am. 33, 248.laumont et al.: Neural network analysis of infant vocalizations 2577 Au
tho
r's
com
p
Copyright © 2022 FDOKUMEN