Process Engineering Considerations - SelectedWorks - Bepress
Upload
independentCategory
view
1download
0
153-610,-
AUTHOR
*POPUB :bA0
NOTE
-=Ep RS PRIcR:
TRACTThe CO*0411Y. cf th,0 -0e4414.p4Ch1eii- for .Kode4U-
,COsipute:i based information: systems hasits predecesEors. The .ptle.teAted:_-tc_the, 'designer i i to-00,n*4i1±0 ,.system ii4#4.-§a#444- -u*:4 :-.44.**40 -1024C.; 4_1404jA9'-
-,g,Yt-eiii-1--reSou4CE related perfcraance cI.iteria. The puzjose of this4ia_Pei. 01: to :t.±§:40* an èaluation tookiiiAue::ko* ;04,s#441, theproblea of u].tiple criteria performance eVa4uatirCr ,C4 444.CriatiCn.systeis. The cf thiE technique tc lit-Vide the 4e0iogiiet- withan eVaiiiati-Ve :procedure ,which: :50)'5, to EstaLlish A: ,:dit-salrelationship :between attaiO!crtg azd :tyglt,,re...sdOiCe'expenditures, while a.ji1)..Csiiiitj. 404 the CCiledtiCh. C4 heietc4o4e h444 to-'obtain evaluation 114014-ii:Oni. meaEures ilet.aCt CI individual-user -classes syete*;,peifOr*ance; those
activities wch fht.1314 be 1cd1fiEd to i.up4O.Vesystei li.e4.40,404uce related to .those gcal.s. All Cf this is achieved byaaintaining resource utilization stati:4tice. ,C4 a- zi-ge-4, class basis-.. Itis thoughtthat such an ,Oia-111-043* #044,0 tt 4s: Caail-e- cfei-iiihatili47,,Ogy of the -iltiiiierOUe'lltiatigfactcr-y ,de.t1,00.; bydirecting the designer to the most ,a0/0"ptagedug cne. OuthcilD40.
pCjctiOpiT 1*-"Oisg!,
IF OO 885
Chandler, -Lichn pie10444 1,1iiCrat, G.ilethicdClo,gyl .4-ct irictmation System
, _
'Design.=0,12.ioState Oniv, Ccluubus. dcm.puter. and Information'Stiebte.:Reearchj.:Cehte4:.National rSdienCe,:'F,c_uhdaticre Wahington, E.C.
RC-TI-77-1 LJun '77:
36p.
£I44. -FC0tage,-besigUert, A340140. :Preferences; :R*41taticil,
440-iita*ioirjiiiii4v4-041,N4t; *4-foisartion -0-41#atfon:;*Re...40-ttuand-0-4-1#4444: Re4,4,C4*-ar.06, *ProgramDesign; Use
.3* iRePioduCtion-suppiie.4': by DBS are thE Jest that Ca4_ :he 'Bade'41oin- the -04--i.§itaj .i1C-COMento.
-**45,311.91c4c**21(****.***111***************21!*4-314:#431411c**********314*******0******_ ,_ .

U.S: DEPARTMENT of HEALTHEDUCATION A WELFARE'
-NATIONAL- INSTITUTE OF:EDUCATION
DOCUMENT 41/4- BEEN -REPRO;.
OUCECo. EXAC RECEIVED t:F ROM'.THEpERSON OR ORGANIZATION OlkIGIN,A'T I NGa f:POi NT S OFViEW OR OPINIONS
,s1ATED;130,NO3;,NECESSARLY;,REORE!OFFICIAL:NATIONACINSTITUTE OF
EOLICATICCFOSITION OROL:CY.
7'44
1-!A:MeOptIolOgyfoOtulti;44'Iteri4-
'flifOriiiatiop*4eth,00sige
John -$.. ;ChaiI lT r and: Thomas 1;ettiti
"PERMISSION- TO REPRODUCE TAISMATEA *AS: EtiEfskGRANT041Y
Gehenna Tayls*
:koudATIONALeiiki:OuRale--INFOAMAT(Ofsi CENTER (ERIC!'ANDti
usEks'og TI-i6,ERle.
'WotIcerfotmed-Aindik
.64.4001**t-S47-4404-8"-
J4e4440.43A440*T0044-04
omObE0# Centier-The,,06:*-ate,t40.4r6114
Columbus, Ohio 43210
:Rine- 1977

1. Iritioduetioh,
Evaluative itequi-x-eiherits,
3:, of the, 'Stage- 2 tyalii4t-itre Procedure;
4. -Liaison- i4ith-Otete, 1.
;Stage: 3 AnalYeid
'TABLE{ -OF -CONTENTS
REFERENCES,
15.
18
26
rt

This work was supported- _Gtannuiribei' SIS75-:21648 from 'The
National `Science Foundation to Dr. Thomas G'. DeLutis, ,Associate 'Pro=
,EesSor of Computer and Information- Science, and conducted- at the
Computer and Informatio Science Research Center of The- Ohio State
University. The CoMpUter and Information Science Research Center
of The Ohio.- State: university is an interdisciplinary research, organ-
ization. which..consists-of thestaff, graduate students, and faCultyof _Many .11hiverSity departments and lahoratorieth. This report is
based on research- accOmilished in cooperation with the Department
of :Computer _and- Information Science. The-research contract waa.7adniiniStered -and monitored by The. Ohio ,State University Research
:Foundation.

1. Introdii4ion
In,Oarch,.of 1973, ALIALAnd_iit-spOnored:=a-Workshoi).
perfOrMance evaluation. One of the major reSults, of that Vorkshopwas
d-COn-SeilausthAt 'there- hive been two separate-, approaches= to the eValip-
atiori3Of information systems ,performance -- one which the-
computer ssterti domain and the ;other. whose attention is directed -at the
application system '(User)' domain, -Each-has its own. viAls and.
measures:- the computer AYAPeT- 401141-#; TAAsAFAA,kke b4AA4' on resource
ipieueing, and utilitaiiOn statistics. and the user domain, 1.0,,evaluat4
thrOugh the ,performance-Ok-reipleated-SerVices- 1.1baSUreS such as through=
Tut and response: time are CoMMOn for tile latter. The Workshop -also t
concluded- that -any, performanCe analyse6 '!should recognize bOtti
costs .of a computer" inStAilatiOri, and the ,need0 of users for _service"
The -domPiexiy of tile,design problem for -modern -computer 'based:
ilifO;ladOn- Sy-Stems, has increased -Significantly-over its predeees7OrS,
dueyto::
A. theserVicing .of .0/1 expAriding range of .uSer or uses with
ocirreepOnding diverSe ,performance- goals= and resource require -,meets, and
13, the dynamic and unpredictable behAViot. of the .system: A.
functio of design decisions. and load- mix.
ThuSi it is quite possible to improve the performance of the system
.i.?ith .respect to- one- or more users at the -expense- of others. Likewise,
because System resources Are used by different-users, improving the
TerforMance characteristics of one or more resources, for the benefit, of
specific. Users' may ha re ,ail overall detrimental effect.-on performance:
The problem -preSened to the designer is to configure a. system Which'
.satisfies the .user criterion while achieving Oyseria resource related
performance criteria.
(1):This was One, in ,4 Series of WOrkshopS sponsored jointily. .by -404 and
193S ,f6 ;eXAMiiie the major issues involving computers. l'Oitormancawas-'chosen- as the:topic- of this 14Orkshop, because 'of its
significant impacti-on computer usage. A- _summary of. he conclusionsappears: in _ .

-2--
-A computer based information prodeSsing system can he viewed as a
-Sybiotid relationship between the system's users and its hardware, Soft-
-ware,and,data-reSources: Ideally; the-system-wilt perform-,loptimally"-
when. it achieves its user oriented objectives within a minimum cost System.
However,, optimal solutions are seldoM adhieVed when-systems are domPiex,.
ill defined or constrained for reasons outside the control of the designer,
and thus,. the Settles for a satisfactorially behaving system.
Hopefully, systematid,prOcedures-are-emproyed'to achieve syStethhOnfigu,-,
rations which concurrently Meet the-user objectives while obtaining,effi-
dient utilization of its re§ourdes. Current evaluative technologies focus
hn-only one hriteria in:the system desigh-equation, either the-user'Shr
the system's resourceperformance. The ability to SimultaneodSly, ascertain
the impact of resource performance Oausr,goal§-or vice versa is not
Teadily-adhievable-through theSe-MethodOlOgies. The purpose of this
paper is &" describe a methodolog3i'WhicheStablishes a formal liaiSon'be,-
tween the evaluation of user goals as a function of system behavior and
the analysis of resource performance as a function of user activity
User oriented analyses with objective functions Based,on-resPonse
time, throughput,, and cost have_beeyand are continuing to be) reported
in the literature- IHost frequentiy,dnalytic approaches use queueing
models as their basis (GAV76, BUZ73,!NHI76are representative of this-tyPe
of analysiS). Due to the necessity to maintain tractable models, many-
SiMplifiaatiOne-are required for a- model's analytical solution: Sima=
lation models have also been appliedito-uSer oriented analysis (C0H65,
J070)-. Unfortunately, these Moder§ yield only average and/or aggregate
measares of system response A4-a result of these siMpiificatiOns, the
analyses produced by 'both of the approaches fail in-Many-cases to identi-
fy -the relationship, between uSers'andresources. Therefore, they are
shspect when uSed-to predict the impact on system performanceS of-modi-
Iying,the current enVirormieht&
Alternatively, performance analyses can be mad from the system's
standpoint, treating the uSer-and-his gpala-inthe-aggregate. The' =St,
hOmMpaapProach is a subsystem study, where a particular part of the
information system complex is csolated, with the subsysem-user(S) repte-
Onted-bY a stochastic generator, both analytic and siMulative. The most
-eiphaeized-areAS.of research has been the I/O subsystem UtA68;

SHE76, BEL* and CPU utilization (KLE72, AGR76, LEW71). The prcblem
.with-this level of evaluation is that, although providing valuable
local intuitive insight, these models rarely relate to the ultimate
information system user, and, therefore, do not provide realistic in-
sight into global performance.
-Examinations of complete systems have also been made. Exhaustive
hardwaie/software measurements have been analyzed by Gonzales and Cantrell
(G0N76, CAN68) while simulation models, including an aggregate user
_compOnenthave_been built_by_Regv.es_and_PoochNokland,..and-Lum-(REE75,
NOR71,1D470). Although results of the e'valuation's include resource
utiliiation statistics and user oriented Measures such as response time,
there is little attempt in these models' to relate - particular resource
Usage to the-effect ouuser goaI -attainment, '(TwO exceptions are
LindSay's study of the KRONOS systeM (L1N76) and-HallYS.data base. investi-
gations (HAL74).) But from practical experience it is evident that there
is'indeed a relationship between user goals and resource usage. In fadt,
BuzerL(BUZ76)- has recently Aropoeed_some_fundamental-laws_for computer
Terformance which relate resource activity to global system /user measures
such as response time and throughput.
It is assumed that the objective of goO;d system design is to satisfice
both perfordande related criteria. However; in light of the complexity
of modern systems, many design decisions tenito be madeiwithout proper
supportive evidence on perforMance. The-crux of the problem is to ex-
tablish a causal relationship between user goal attainment and system--4
resource expenditures. The methodology to be-discussed has been designed
to establish such a liaison and will be shown to allow for the collection
of heretofore hard to obtain evaluative information. Themethodology
measures the impidtof individual user classes on internal system per-
formance and-identifies system bottlenecks which inhibit the attainment
of user goals. This is achieved by Maintaining resource utilization
statistics on a user class basis. This methodology presents an evaluative
framework which is capable of eliminating many of the numerous non -
satisfactory designs by directing the designer to the most advantageous
ones., This methodology is an iterative one with each iteration involving
three separate but integrated stages. Figure 1 illustrates the activities
-kor,an iteration. Briefly the responsibilities for each stage shown In
.-7thiS figure are:

stage 1
Stage 2
`Stage
IdentifyPerformanceObjectives
First
FormulateFirst System
EvaluateSystem
77Evaluate,
User Goals
rSatisfactory
110
-4-
oimMir 1111 01.1110
FortulateAlternative
SysteM-
11111MMP 1110 .0111111
Yes
VTerminate
DesignProcesS
011 OWNED
Figure I. Stages-in System Design Process

Stage 1: System Evaluation
This stage is responsible for evaluating the behavior of a specific
information system model. It does this by associating the hardware; soft-
vs-re and data activities belonging to a specific design with the system's
user activites. The outputs of Stage 1 are performance statistics for
the resources in the aggregate and for their behavior with respect to
identified user (or uses). To perform this function, the IPSS Simulator
is- employed
Stage 2: User Goal Evaluation
Stage 2 has two,Rurposes, the first is to ascertain whether the user
goals are being either over or under achieved. The second purpose is to
determine the "best" set of-guidelines for altering the Current system
'configuration in order to obtain the user goals with minimum penalty for
either under or over achievement. Multiple goal programming is used for
this purpose. As will be seen, "best" is a function of the assigned
penalty coefficients in the goal programming objective function.
Stage 3:, Design Evaluation
Stage 3 has two functions. The first is to ascertain whether or not
the current design's performance is satisfactory with respect to both
the user criteria and the system criteria. If the design iS not satis-
factory, then this stage's second goal is to define a new system based
upon the current design, prior alterations, and the results of the Stage 1
and Stage 2 analyses. Heuristic procedures are currently employed for
Stage 3.
The focus of this paper is on the*Stage 2 formulation and its formal
liaison to Stage 1. The paper aid° identifies the unique features of
IPSS which permit this multi-stage multi-criteria methodology to be
achieved._ The paper concluded with a discussion of the use of the
Stage 1 and Stage-2 results in the Stage 3 heuristics.
(I)IPSS is a special purpose discrete event simulator whose develop-
ment was conducted with the suppoit of the National Science_ *Founda-tion; Grant No.,GN-36622.

-6--
2. Evaluative Requirements
For the purposes of this-methodology-, Aninforthation.systeM is-viewed,
as including- its users-and their,goais, and the system's services-and their
subordinate activities. This is illustrated in Figure It is assumed
that the system's analyst can identify and_ciaSsify the system's users
according to their service. request Characteristics and_according to the
performance constraints imposed upon the system goals) whSn
honoring-their requests. It is also-assumed-that the analyst can identi-
fy those information-system activities which are critical to sysiemf_,
performance. -Obviously, the-Compiexity.of the problem IS increased Sub-
stantially when a-system Supports diverse users orproVides a wide.spec-
trum of services. Whether or not thesysteM is-complex or simple, the
criteria for identifying syStemsctivities should be based -upon the
sensitivity of the system's performance with regard to changeS in their
behavior.
Information system services are viewed as being a series of distinct
yet interconnected activities which are invoked ddring the processing of
a--stream of user requests for the service. Again, Figure 2 illustrates
-this view of a-system. Most likely, syStem activities are aggregations
of one or more traditional computer system functions that perform the-
following tasks:
1. request (job) scheduling,
2.--task management,
3. resource allocation,
4. secondary storage I/O processing, and
5. applitition processing._
The choice of what constitute-6'4n activity ispart-of the art of perfOrmance
evaluation, however, a necessary condition for their Selection isthat they
be measurable and-that these measurements diStinguish the service fates for
separate classes'of system services. It is also assumed that the role of
performande,MeaSurement is to_determine the current processing rate for
the _jth-activity with-respect to the ith service.
_Figure:3 is-a schematic of the functionalcompositioh of system
activities. Eat': 4.6-Viewed" as an- individual quedeing,syStetutontaining
10
-ce-ara,fraa

Users
tiger-
Request
MeadureS of" theSystWs Attainmentof User-Oriented
T*formarice-Goalt,
11
S-
Y
S
T
E
M
Service #3
ervice #2
'Service #1
Services
Request forServiti #1
Request forService #2
oft.Oft.
14.
ServiceType #1
Figure 2. The Methodology's View of an Information System
ssik
ServiceType #2
=

Attiviil _ofRe_quest,:at', the,,AdtiVitV,
,fo* SerVi4e,Thi.e
T
Queue TransitTime.
,'Queue'
patChe,,i
etie
MIIM11111111
Queue #2,
Ser0erPis'patchei
Time- to-Seivice Request
(i)
MIND 4E011 0111. !MIND_Queue ,#N
.....;,....:..c-"---Systeni/ActiVity Interface
' -'.41,,, ,C,C,S,t,
(ServerI I
#2
Server
-1-#M"
Completion of. the Activity'sServicing of the Request
Figure A.COnCePtual.',VieW,Of an_ Activity.
Servic---TimE

-9-
one or more priority qUeues and one-or more identiCal servers. Addition-
ally, the performance measure for the activity in processing arequest
type is the Sum-of both the queue petfOrmance and service functions of the
activity. Throughout this, paper, the variable(ra is employed to identi-
fy ttis-performance of activity Ai, 'With respect to Servide Si. It 4s-
A0uth4d:to be the average of performance for all the executions of Al fot
Si,,116o,asSociaed with each activity A; is a:_performariCe factor pl,
which ts interpreted as the-sCating_factor tobe,applied.to_the-RJ .(a
to obtain the level of Performance for the jth,adtivity-mhich minimizes
the goal programming objective-function.- It-should be ,notedthat the
ProbleM of identifYing a "good=' level ofTetfotMance for activities,-i.e.,_
determining the appropriate VaIttesof*elyirs is.dompOunded- by the
4mU1tiple'Use, of the activity .by. different and possibly conflicting
services. Therefore, the modification .of an -activity's pioceaSing rate
to achieVe one goal may be counter ptOdUctive.to the attainment of another
goal., It is to this possibility of multiple conflicting interactions and
goals; that this methodology is focused-.
--Formutation-of-tha-S tag-a-2 Evalt.ative-Priidedure-
Stage 2 is based on an evaluative procedure commonly called-multiple
goal programming (MGP). The proaedure was first formulated by Charnes
and-Cooper (CHA61) in 1961 to solve linear programming probleMs that had
conflicting constraints. Ijiri (IJ165) developed the details of the pro-*
cedure within the framework of mathematical programming. This technique
has been used to solve problems in the arras of strategic management
planning such as accounting control (Ijiri), advertising-media planning
(Charnes and Cooper (CHA68)), and resource allocation (Lee, (LEE72)).
The employment of goal programming in conjunction with information system
performance evaluation is a new use of the procedure.
There are three reasons for choosing multiple goal programming for
use in this stage of the methodology. First, this approach can evaluate
linear and ordinal multiple goal situations, both of which are inherent
to information systems evaluation. For example, one user class may pay
twice-as much for its service, and, therefore, satisfaction of its goals,
16
"h.
,.

.may be worth twice as -Much as others;. a linear relation.. On the -otherhand, certain ,Usere; 'Such as a critical patient monitor..ng application, -
may have inaomparabie importance- relative to.-:Other ,Classes; an :ordinalrelation. SecOnd,_:multiPlea goal programming produces a-- solution that notonly evaluates the total goal Situation; but also evaluates- each- goal,individually. One of the pUtPoses of-this inethOdOlogY is:-to deterMine'the- Critieal Alser _olaSses_and.aeSociatect activities. Thirdrives` the Obese' deSign::Unde the given go-di: constraints. 70elidf deSigri-.approaches such as, weighting, sequential -elimination, and spatial PrOx..7'4pity (i4AC73) , a'r'e based- on. selecting the ''!best" design from , a 'finite_Set of 'alternatives. The purpose of the overall- Methodology; hoWever,0, to design an appropriate, system -,to ,satisfy the :user--and -resourceconstraints.. The standard fOrniulation. of a multiple -gbal ,pi-OgraMiriing
.problem
.[A] Minimize P D
Subject to A X + D = G
where
t echnological-coefficients-which-cantbe _thought cf, as the "rates at Which the ith:service-uses the jth-resotirce
_
the .array ,of xesulting, ,systeM. resource allocation
G = the' array of service .goalsD the array -of discrepancies froM these goalsP = the array of penalties associated with the
discrepanaieS:
arid' where the objective function is to minimize the product of the tli.§r-erePancies and:their associated penalties. The solation to a :Multiple,gOal.programMing,problem'represenis:flie'Wst, set of _level's for th.resource 'allocatiOn vector ,X such that the objective funct..an is minimized.
The remainder of this section discusses the specific formulatiOn for theStage 2'.cOmponent of the methodology;
'I'ignte 4 illustrates the relationship between MGP,, the informationSYSteM,a6tiliitias; and its servicing f.1: 'user. requests.., The servicingof a request type i_lara sequence- of 74e..tivitiesi A1, A , ..., An, each

V
,Request,
for -Service' i......______ ..,. ,
ormation-Systm
. a '
Beques
Service i-OoMplete
lActiirity
-17
0Ueue.
%- -
Server
'V
QueueA-t
ServerTime
I
System Service Time-fdr Ts(i) E
'Goal for Service i TG(i)_I 4s'
Discrepancy my-1
Estimated Service Time r(1)*-=-E R-(1.) 0- *S _4
(Based on values for -A)
17
IStipstedDiscrepancy
Estimated for1)(i)*.-v4TIATP.;_
.
*Values of O's and D(i)'s are,the outputs of Goal Program Optimization Problem
Figure 4. Relationship Between Goal Programming and Information System Chadbterization
-12-
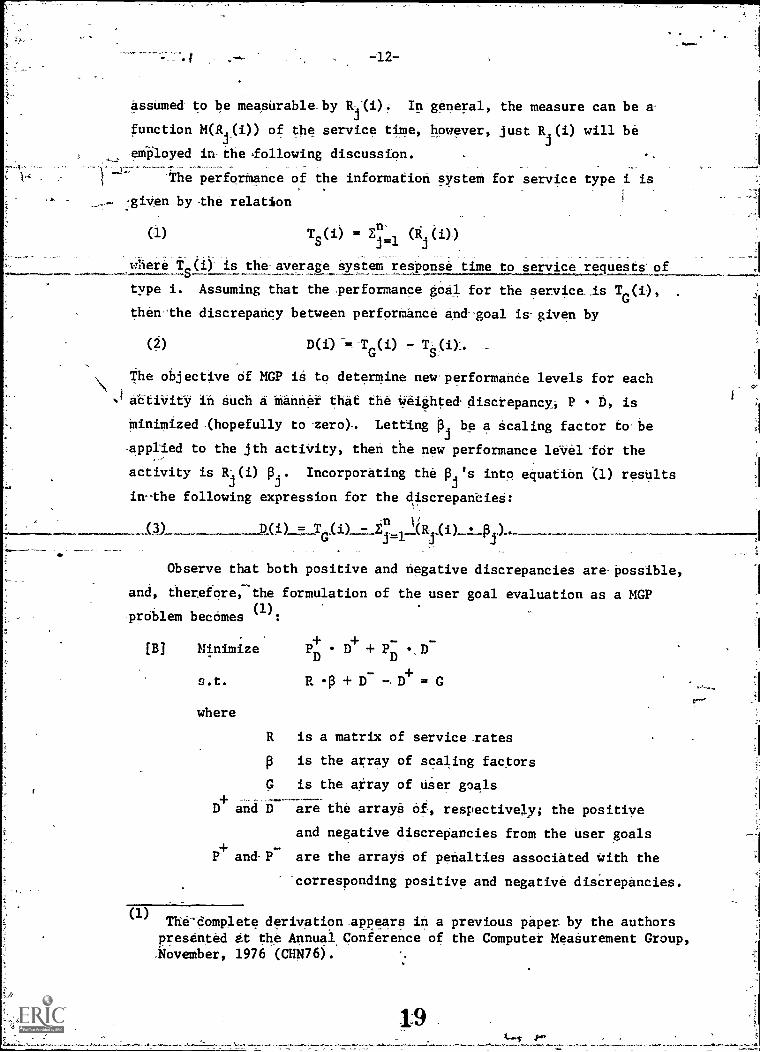
assumed to be measurable -by yi): In general, the measure can be a-
function M(Ei(i)) of the service time, however, just RR(i) will be
employed in-the .following discussion.
The perforMance of the information system for service type i is
:giVen by the relation
(1) T (i)- = E3=1
(j
where (i)' is the-average system response time to service requests' of
type i. ASsuming that the performance goal for the service-.is TG(i),
then-the discrepancy between performance and-goal is-given by
(2) D(i) =-T (i)G S]
The objective of MGP is to determine new performance levels for each
JACtIVitY- in such a Manner that the weighted discrepancy, P D, is.
Minimized (hopefully to -zaro) -. Letting Oj be a scaling factor to' he
-applied to the jth activity, then the new performance level for the
activity is RR(i) p. Incorporating the pa's into equation (1) results
in-the following expression for the discrepancieS:
To i = -( 1 - 11;(3) TG, R (i) P )*
Observe that both positive and-negative discrepancies are-possible,
and, therefore, the formulation of the user goal evaluation as a MGP
prOblem becomes (1):
- -[B] Minimize
PD+
D
+PD D
s.t. R + D- D+ = G
where
R is a matrix of service -rates
p is the array of scaling factors
G is the array of user goals
D and D are the arrays Of, respectively; the positiye
and negative discrepancies from the user goals
P+
are the arrays of penalties associated with the
-corresponding positive and negative disCrepancies.
(1)The-Om plete derivation in a previous paper_ by the authors
presented at the Annual Conference of the Computer MeaSurement Group,.November, 1976 (CHN76).
19

'The, formulation serves two purposes: it evaluates--goal achivement and
prodUcee the fki 'S. By Setting the- values of the p s to reflect only the
Current tenfigukation (i.e.,' _p 1), the eValuation_ of the system's
.attainment of the 'User ,goats is accoinpliShed.
Tirperiments -with formulation [B] produced valid, but impractical
Seta of .0'e. The NGF"'probiem as statedl.allowed- for the possibility ofsolutions -where a 03 could equal 0; -crearlY an unacceptable situation.
In 'rirder to inhibit this type of solution, limits were placed on the
=range-.of possible pi values-. This was accomplished with the following
,set .afedditional constraint
(5)
Where
Oj vI = Hi
is used to restrict- the, alternative possibilities. for, the case. that
1 -while H is. used for those cases that 0 _general, the
.set,-of :a11 and'' 1) 2'
likeWiSe far HS ,(v+ v+ V.,1) N..- off and N have similar definitions)-
These constraints are reflected' in the objective function in a
Mariner different than previous constraints. Instead of minimizing both
discrepancies, only one is minimized. In Ole**,ase of L4 only is
+included, since, if p,i is driven to zero, the p p,f = L , implying
> Li, the desired condition. Similarly, for ni only ui is in
the objective function because minimizing 1. results in
These added constraints also have a physical interpretation relative
to the evaluation of the system. No activity can be eliminated from a
systeth = 0) since L.Jmust be greater than 0. In general, how-
ever, Li represents the lower bound-- on-the degree_ of reduction feasible
for the current level of usage for an activity. For example, Li = .25
implies that the usage time for activity j can be made, at most, four-times
shorter, being reduced, to 25% of its current level. Similarly, Hi repre-

sents the upper bound on the -degree to which an activity's level can be
increased (made longer). It must be emphasized that these thrifts are
only rough -Otimates, not exact 'Values.
In order to reduce the number of alternatives one should* minimize
the number of modifications indicated per evaluation iteration. Sinde
Modifications are characterized,,by the production of pj's not equal to
1, a.secondary objective of Stage 2 is to produce as-few p 0 1 solutions
a s_possihl e. This, ._including ,:the__constraint._.equation:the_constraint_equat
(6) pj+ e e = 1
While minimizing both e+ and
Contrainta of this type- .provide a default Value of for the -multiple
goal programming procedures in- the case where an activity is neither
critically irieffiCient or excessive. (Note: (el, e2, , e) = E+.)+
-As a result of these added ,constraints, the actual formulation' of
the MGP problem used in Stage-2 is -given in formulation [C] below:
-- - - +Minimize Pip
+ +Pip
PN[C]
s. t.
where
R p + D - D+ = G
p + - /1[4. = L
p + N - /44. = H
p + E - e =
R. is the matrix of service rates
p is the array of scaling factors
G, L, H, and I are the arrays" of goals- for the ug-e-r criteria
and the respective p constraints+ + +D-, M-, N- and E- are the arrays of positive and negatiw: dis-
crepancies from the, respective goals+ + +
' M, N' PE rP-D
P- P- and - are the arrays of penalties for the associated
discrepancies.

-15-
The solution variables for the MCP problem are the P's. They identi-
fy those activities that must be altered in order to improve user based
or syStem based performance. If the value for a pi = 1 then the service
characteristics of activity j were adequate to satisfy all the user's
criteria. If a pi < 1, this implies that the Current service rate of
activity j is insufficient to meet the system's needs. The new service
rate for the activity should be R (.) = (p ) (.)). If a p
-then, the current _service tate of...activity j is faster-than-necessary
,and-there exists the-possibIlity-of-excess-capacity: 1Che-new'unit rate
shouldbe-41.(,)=0)*(11.(- ) )3 3
Assuming that an activity follows the characterization in Figure 3,
then the analyst has' three-avenues of-action when a pi # 1.-tFirst, he
-can analyze the queue-dispatching discipline in order to increase queue
throughput (or possibly replace it with a simpler-one if pj > 1).
Second, he can alter the service rate characteristics oethe servers,
e.g., slower. ardware devices. And third, he-can increase (decrease)
the degree of parallelism among servers, for example, by adding (re-
moving) a second channel, controller, etc.
4. Liaison With Stage 1
The critical factors in the Stage 2 evaluation are the values for
the Ri(1.)4s needed by the MGP formulation. These-values-are calculated-
inStage 1 and are thastatisticaImeasure produced vis-a-vis the simu-
lation. The specific model to be evaluated isthe result of tha
teUristic procedures constituting Stage 3. The liaison is based upon the
assumption that an information system can be viewed as a collection of
resource allocation and task management activities and user oriented
services. This view is supported by the literature, e.g., Madnick (MAD74)
and Zurcher and Randall (ZUR69). IPSS also views the modeling of an
information system in a similar manner, and thus, facilitates the
development of the formal liaison with the MGP user evaluation.
The view of the system taken in Stage 2 (as illustrated in'Figure 2)
has an analog in IPSS. Its basic modeling concept is that of a service
as shown in Figure 5. The service is classified in IPSS as a procedural
22

-serviee,,Request-
Service Complete
a
Queue of'ReqUests
Identification `Issuing
of ResOurces
Request for neededResoufees or Services
Wilting fok requestedResources or Service,Sequence of
Acquisition, Useand' Release
Use and Release-ofAcquired-Resources
Figure 5. Functions of IPSS Service Entities

-17-
facility and is ,:apable of representing any information system activity
including request (job) scheduling, task management, resource allocation,
secondary storage I/O processing and application software. Since services
.are allocatable facilities in IPSS they have associated with them both
queueing and utilization statistics. Furthermore, service behavior can
be predicated on the quantity and characteristics of other IPSS hardware
and software facilities. Therefore, the statistics associated with serviceti
facilitieshavetheappropriatestructuretoserviceasthelt.'s needed
in Stage 2..
To complete the formal liaison between the two stages a second
feature is employed. This is the Task facility. Through its use, the
service facility statistics can be automatically segregated into service
statistics by user. In this manner, the statistic Ri(i), required by
Stage 2, is colledted. Thus, the Stage 2 users (indexed by i) and the
activities (indexed by are, respectively, an IPSS model's Task and
Service facilities. An Rj (i) is the sum of queueing and utilization
statistics gathered for Service i when executing Task j.
Stage 1 must also be adaptive to model changes dictated via Stage 3.
Again,-the IPSS model synthesis philosophy and language constructs permit
the desiredmadaptiveness-.--This-i-s-vo-s-sibt-e, for reasons Coo detailed to
in this paper. A complete description of IPSS is available in
the document titled "The Information Processing System Simulator (IPSS):
Lan-gdge'Syntak and Semantics" (DEL76). Briefly, however, pOssible
modifications to an existing and executing model without requiring complete
'reformulation include changes to:.
1. timing and space characteristics associated with secondary
storage hardware and storage media,
2. the secondary storage I/O configuration,
3. user usage patterns and service requirements,
4. file organization methods and space management policies,
5. the queueing disciplines associated with job scheduling, re-
source allocation and task management, and
6. memory management policies.
IPSS supplies the Stage 1 processing with a capability of being
self-adaptive with respect to Stage 3 outputs. Currently, the methodology
25

employs modeler assistance in Stage 3. Future research will be directed
at providinglsore sophisticated heuristics:for-Stage 3 in,order to
provide a truly self-contained iterative methodology for the multiple
criteria.evaluation-of_information_systeM.4.
5. Stage 3 Analysis
The functions of Stage 3 of the Methodology,are_to_determine_whether
the current configUration is satisfactory and to formulate a new model
in light,ofthe data provided from Stage 1 and Stage 2, Figure 6 shows
the informationflow to Stage 3. New models reflect-the performance
goals of bith the user -and the system. Heuristic6 using Sutherland's (1)
definition of a,hehristic are eMplOyed in Stage 3.
"The - problems encountered are complex and- unstructured. Determining
if the current design is acceptable requires a mixtu.:!,:. of objective,and-
subjective reasoning. It would be a rare situation if all the user goals
and system constraints were satisfied simultaneously. Generally, an
extremely ciide spectrum of acceptable performance levels and alternative
designs are poseffliTTE-61151riteration, to satisfy both user .and system
criteria. Trale-offs will dominate the decisionTrocsq4e. _144 factors
Affecting suitable designs may not be included inthe formulations and
procedures of the first two stages. For example, there may be external
,political., organizational or economic considerations that are not directly
-related to- the performance of the system, but may be a major factor in the
final decision. The methodologY does-aasuMe, however, that the heuristic
procedures have access to this external criterion.
When it has been determined that another iteration is desirable,
it is assumed that the heuristics will examine current and past designs.
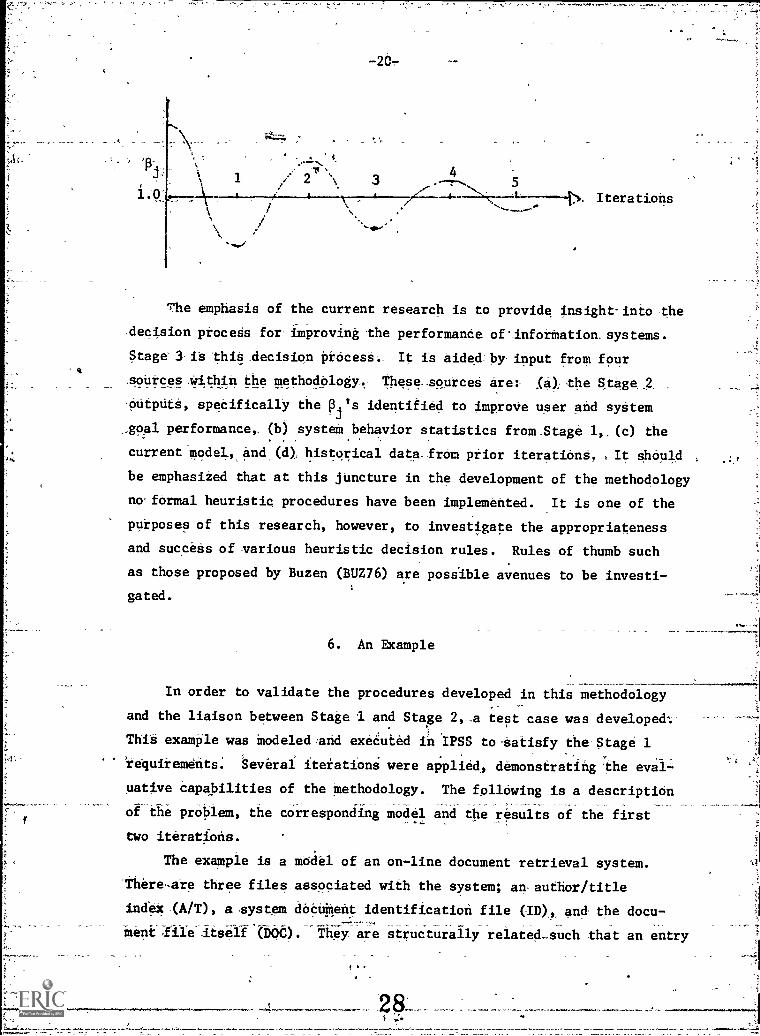
WhateVer the heuristic employed, ideally its-objective is to produce a
liequence of mockls whose pi characteristics (for all 13's) behave as
follows:
(1) A-heuristic io"a disciplined trial- and- error process,...-, an exer-cise in,sUccessiVe-improvement where we may learn from botivsucceesand-failure And:where the criteria for success and failure may varywith what wehave-previoUsly learned" (p. 183, ,(SUT75))_

4,
!.;
19
Resource,Activity
Measures
STAGE 2
(a) p's
) Current ModelSpecifications
,(d) HistoricalData onPreviousIterations
Figure6. Information Flow to Stage 3
LP,
-267.
1 / 2 \..--
3 ,-..-,..... 5/----:-A-- . /..e 4 --N.N -I'
'',....- ,......'t>. Iterations
N
7he.emphasis of the current research is to provide indight-intothe
.decision,proceas for improving the performande of.inforMation.systems.
Stage 3- is this -decision iirecesS:. It is Aided=by-input from- four
sources :Within -the methodology.. These_source6 are:- ,(4); the qtage,2,
-CUtpntS, specifically the pj's identified to improVe user and syStem
_goal performance,. (b) systein behavior statistics from -Stage 1,,(c) the
currentgiode1,and(0 historical data -,from prior iterations. It Should ,
be emphasized that at this juncture in the development of the methodology
no-formal heuristic procedures have been implemented. It is one of the
purposes of this research, however, to investigate the appropriateness
and success of various heuristic decision rules. Rules of thumb such
as those proposed by Buzen (BUZ76) are possIble avenues to be investi-
gated.
6. An Example
In order to validate the procedures developed in this methodology
and the liaison between Stage I and Stage 2,_a test case was developed:
This example was Modeledand executed in IPSS to-satisfy the-Stage 1
requirements: Several iterations were applied., demonstrating the evaiL
uative Capabilities of the methodology. The following is a description
of ktbe problem, the corresponding model and theresUitsdithefirst
two iterations.
The example is a model of an on-line document retrieval system.
`Thera-are three files associated with the system; ary author/title
index .(A/T), a system doCUMent identification file (ID),and, the docu-
ment They are structurally related. such that an entry

in the AfT filelmints to one or more entries in the ID file and each
ID file-entry im turmis associated with only one DOC entry.
The model is-designed so that a unique activity is associated with
the, accessing of each file; ActiVity 1 with the A/T file, Activity 2 with
the ID file an& Aceivity 3. with the DOC' file. Each activity-performs
functiOns: obtaining and releasing-devices, reading records,
Terforming I/O technic:100, but to different files.
It IS assumed that the system supports three user classes,, each
_with -adifferent_demand_cnF:theretrieval_system and eadh-characterized-
a,different combination of activities: The purpose of the first user
class, USER1, 6 to retrieve a dOcUMene for a particular author, thus-_
utilizing all three activities. Those in the second user- class, USER2,
want ,to determine the'eXiSteh661nOn-,ekiStence 'of an entry in the*steth
for 4_0,v64- authOr,-and'iherefOre, need. to use. only ACtivitY 1. The
i.4-43; User-class, USERS, already has the. address of the ID entry. and
"wants to retrieve the associated DOC entry requiring only Activity 2
and Activity 3.
In-order to-complete the-formulation of the performance evaluation
problem for this methodology, assumptions concerning the performance of
the system were made. A summary of these assumptions for the user goals
and P,- constraints and the penalties associated with the corresponding
discrepancies in accordance to the requirements of formulation [C] is
shown below.
G = ( 150.0,3_00.0, 400.0)
( .2, .2)
H = ( 5.0, 5.0, 5.0)
( 1.0, 1.0, 1.0)
P+= (l000.o, 10.0, 1000.0)
P = (
p+ = pE (
1.0,
1.0,
0.0,
1.0,
0.0)
1.0)E

The-model .constructed in It'SS'aSsumed.n_-SimPle_configuration of
One processor and one bank of 'IBM 2314-type-direet access. devices.
Un4br S'*giVen:loading (which,is not e,controiiable variable in this
'methodology) the resulting .performance Statistics,. the values of matrix
R, are: shown beidw.
Q1(1) = 0.0 Q2(1) = 0.0 Q3(1) = 11.4
S1(1) = 37.2 S2(1) =.37.1 S3(1) = 90.9
R1(1) = 37.2 R2(1) = 37.1 R3(1) = 102.3
Q1(2) =12-.2 Q2(3) = 0.0 Q3 ('3) = 8.9
S1(2) = 36.3 S2(3) =-39.1 S3(3) = 93.5
R1(2) = '48.52
"R-(3) = 39a = 102.4
This performance information, coupled with the goal assumptions,
was input to Stage 2. The evaluation of the current configuration's
Performance with respect to the set of user's goals is shown in Table 1.
It indicates that the goals of user classes 2 and 3 were satisfied with
a good-margin-of ,slack; (which is not penalized in this example) while
the goal of the first user class was not satisfied' (under-achievement
implying non-satisfaction).
Table 1. liser GoalEvaluation
Goal Under Achievement Over-Achievement
USER1
26.6 0.0
USER2
0.0 51.5
USERS 0.0 258.5
,In .the second ptiese of Stage-2, the P's-are allowed to be manipu-
lated until they satisfy the user ,goal constraints and best,sacisfice
the Systemsuid4ine'Constrainre. Theresult IS the identifiCationof
141o134-, activities whose performance can 'he,, an needs to .be, improved'
with respect to one or-both, of the Criteria:. The VilueS-fot the

as calculated were
P1 = 1.0
r.23,
P2 = 1.0 p3 = .74
These are interpreted' as indicating that both Activity 1 and ACtivity 2
were adequate to meet the user-demands put to them. Activity 3, however,
_Was found to be insufficient to satisfy the requirements of user_
-classes 1 and 3. TheAnodifiCation indicated is to reduce the _present
level of'usage-for_Activity-3-by'ai least 1t4. in.order_to satisfy the
-user_ goals, in particular; the first user class goal.
The determination of Whether to ceasethe design loop by accepting
.this performance Otto continue lv,mOdifying the existing model is made
in Stage 3. GiVen'the stateAgoalipenaliy-strutture, it was assumed
that_tile,un4etrachievement of 'USER' goal was at an unacceptable level and
the design- process must continue if possible: By examining the queueing
and service time statistics for the first iteration, one can,eiiminate
some ,Of the-modification possibilities. The result of Stage 3 analysis
Was a-decision to replace the IBM 2314 type device with a faster one,
i.e, : -an IBM 3330 type device.A
The original model of this example system-was dynamically altered
-to reflect this modification. Under the-same loading as before, the
following performance statistics were accumulated.
Q1(1) = 0.0 op2(1) 0.4 Q3(1) = 3.8
S1(1) = 11.9 S2(1) = 11.3 S3(1) = 27.6
R1(1) = 11.9 R
2(1) = 11.7 R
3(1) = 31.4
Q1(2) = 3.8 Q2(3) = 0.0 Q3(3) = 0.0
S1(2) = 11.1 S
2(3) = 12.0 S
3(3) = 29.1
R1(2) 14.9 R
2(3) = 12.0 R
3(3) = 29.1
Stage 2 analysis showed that now all three user class goals were
satisfied (i.e., over-achieved). The calculation of the pi's, how-
eVer, indicated that while Activities 1 and 2 were still adequate
(pi p2 1.0), Activity 3 now had the possibility of excess capacity
(4. 4.0). Although a slower and probably less expensive device for

Activity 3-would'be more appropriate, we hactfoundin the first iteration
that such a deVice Wasnot able to satisfy all the user goals. There=
:fore, in- future- StageljprocedureS had- to. examine. more
subtle methods Ofimproving-Performance.
1Wern information systems do not exist as entities unto themselves,
but must interact-with their. environment, i.e., their users. The loading
and mix of the users affeCt the _performance of the system resources. and
likewise, the service-Characteristics of the Systeril resources Affect
theaatisfaetionTof user goals. In Order to design such systems, one
-must satisfy -a large 'set of users-demanding, a conflicting set of,per=
formande gOals- while operating Withinekficiency-andminimum cost con-
etrainta: Thus, performance evaluation of information systems is a
multiple criteria, problem. Concurrently, satisfying both of theee sets
of criteria is the goal of this methodology. Current available techniqUes.
however, only address one side of the problem, either the_uaer-or
system, The methodology described in this paper establishes a formal,,
liaison between the evaluation of user goals as a_ function of syitem
-behavior and the analysis of system resource performance as a function,
of user demand,-thereby, facilitating multi- criteria evaluation.
:IlleMethodology_ia_iterative,,cotprising_OKee separate but
integrated stages. The first stage models and evaluates system behavior.
The particular technique employed in the,first Stage is IPSS and it
is-able to, Collect the necessary statistic, R U-Y. The second stage
evaluates the user based criteria and provides evaluative insight into
-performance improvement. Solution of the MGP formulation in [C] pro=
duces a,set of p's, the Variables:of Stage .2 which indicate inefficiencies
and/or excesses in the current_ model, And finally; the third stage
heuristically determines the current model's acceptability and need
for modifications:
The-Oval4ativeproceddree*V440-for methodology have been
shown .to be valid in practice.. Furtilertore, thi.tOnethodology provides
_an excellent- basis fer-COntinued,reseerch_into areas such as

-25-4
A. investigation into the causal relationships .between user
demand and.raystentactivity,
b.. sensitivity analysis of these' relationships,
C. investigation IntO, suitable heuristics for Stage 3, either
testing existing"hehristics or.development of new ones, and
4. development ofleuristic/modifiCation rules to close-the
design loop into an automatic selfmodifying-process.

-26-
REFERENCES
ABA68 Abate, J., DUblier, H., and-Weiriberg,,S. B., "Queueing Analysisof the IBM,234 Disk Storage Facility ", jACS4Nol 15, no. 4,(1960,4v. 577-589-.
AGB76 AgraWala, A. IC, and Larsen,,R., L., "Uperience with the CentralServer Modal ,on a Lightly :I.,oaded-$Sted", SyMPosium.9n:thesidulationdf-CompUier-SysteMS-IIN
BoE75 Boehm, B., and Bell, T. E., "Issues in Computer PerformanceEVaivatiOn: Some Consenaus, Some Divergence", PER,-Voi. 4,no 3,'-(1975), pp. 4-39.
BUZ73 Buzen,. J. T.., "Computer Algorithms for Closed Queueing NetworkswithExponential Server's ",.CACM, vol. 16, no. 9, (1973),,pp. 527-531.
BUZ76- Buzen, J. P., "Furdamental taws-of Computer Perfordandi", inProc. of Int'l. Fymp. on Computer Performance Modeling, Measure-ment and Evaluation (CPMME), 0.976),,pp. 200-210.
CAN68 Cantrell, H. N., and Ellison, A. L., "Multiprogramding SystemPerformance Measurement and Analysis", AFIPS Conf. Proc., vol.22, (1968), pp. 213-221.
CHA61 Charnes, A., and Cooper, W. W., Management Models and IndustrialApplications of Linear Programming, New York: John WileyleSons, Inc., 1961.
CHAW_Charnes,.A.._et al.., "A .Goal Programming_Model.for. Media. .Planning" _. _Management Science, vol. 14, no. 8, (April 1968), pp. 423-430.
CHN76 Chandler, J. S., and DeLutis, T. G., "A Methodology for thePerformance Evaluation of Information Systems Under MultipleCriteria", Proc. of Computer Measurement Group, (1976), pp. 221-230.
C0N65 Conger-, IC. R., "The' Sidulation and Evaluati9n of InformationRetrieval Systems", Report 352-R-17, -(April 1965).
DEL76 DeLutis, T. G., "The Information Processing System SimulatorLanguage-Syntaxand_Semantics,-unPublished research..
report (Grant No. GN-36622).
GAM Gayer, D. P., and Hunfeld, G., "Multitype Multiprogramming:Probability Models and Numerical Procedures", Proc. of CPMME,(1976), pp. 38-43.
G0N76 Analysis as 0 Aid to Interpretttie Results of a Yek0ifti4O66-Meititifekenr; Piod. of CPMME, (1976),-pp. 179=146:_

HAL74 Hall, W. A., "A Simulation Model to Aid in the Design and Tuningof Hierarchical Databases", Winter Simulation Conference,(1974), pp. 277-284.
406 Hellerman, H. R., and Smith, H. J., "Throughput Analysis of SomeIdealized_ Input, Output and-Computer Overlap Configurations",Computing Surveys, vol. 2, no. 2, (1970), pp. 111-118.
IJ165 Ijiri, Y.., .Management. Goals_ancLAccounting for Control, Chicago:Rand McNally, 1965.
KLE72 Kleinrock, L., and: Muntz, I. R., "ProCessor=Sharing Queueing'Models of Mixed Scheduling isciplines for'Time=Shared Systems",JACM, vol. 19,, no. 3, (1972)-, pp. 464-482.
LEE72 Lee, S. H., Goal Programming for Decision Analysis, Philadelphia:Auerbach, 1972.
LEW71 Lewis, P. A. IT., and Shedler, G. C., "A Cyclic-Queue Model ofSySteM Overhead in Multiprogrammed Computet_SystemsnJACd,vol. 18, no. 2, (1971), pp. 199-220.
LIN76 Lindsay, D. S., "A Hardware Monitor Study of a CDC KRONOS System",Proc. of CPMME, (1976), pp. 179-186.
LUM70--Lum, V. Y., Ling, H., and Senko, M. E., "Analysis of a ComplexData Management Access Method by Simulation Modeling", FJCC,(1970), pp. 211-222.
MAC73 MacCrimmon, K. R., "An Overview of Multiple Objective DecisionMaking", Multiple Criteria Decision Making, eds., J. L. Cochraneand M. Zeleny, Columbia, S. C., ;1973), pp. 18-44.
MAD74 Madnick, S., and Donovan, J., Operating Systems, N. Y., McGraw-Hill,1974.
NAH73 Nahourii, E., "Direct Access Device Simulation", IBM SystemsJournal, vol. 13, no. 1, (1973), pp. 19-31.
NEI76 Neilson, J. E., "An Analytic Performance Model of a MultiprogrammedBatch Time-Shared Computer", Proc. of CPMME, (1976), pp. 59-70.
1:s
NOR71 Norland, K. E., and Bulgren,' W. C., "A Siiulation Model ofGECOS III", Proc. of ACM, (1971), pp. 596-612.
lleeves,,T. E., and Pooch, U. W., "A Multiple Subsystem Simulatiotof Processor Scheduling", Symposium on the Simulation of ComputerSystems III, (1975), pp. 129-135.
ROE70 Roehrkasse, R. C., and Smith, D., "Simulation of OperatingSystems", Tech. Report GITIS-70-11, (1970), Georgia Inst. ofTech.
SHE76 Sherman, S. W., and Bric, R. C., "I/O Buffer Performance in aVirtual'Memory-SyStem%Symposium-on the- Simulation of ComputerSystems, (1976), pp. 24 -35.

......
-28-
SUT75 Sutherland, J. W., Systems: Analysis, Administration, andArchitecture, Van Nortrand Reinhold,-Nel York, (1975).
ZUR69 Zurcher, F. W., and Randall, B., "Iterative Multi-Level Modelling:A Methodology for Computer System Design", IFIP "68, 'pp. 867-871.
0-ateRS *v.36.
Copyright © 2022 FDOKUMEN