Daniel Biella, Nelson Baloian, Wolfram Luther GPS Drawing ...
18
Daniel Biella, Nelson Baloian, Wolfram Luther GPS Drawing on Street Networks: Extracting Routes from Polygonal Coverings This contribution provides important fundamentals of digital geometry and algorithms based on polygonal coverage and chain codes to generate GPS drawings. Illustrative examples created with the GPSVisualizer and GoopleMaps show the difficulty in finding suitable road networks. Thanks to the organizers and authors of the proceedings
-
Upload
khangminh22 -
Category
Documents
-
view
2 -
download
0
Transcript of Daniel Biella, Nelson Baloian, Wolfram Luther GPS Drawing ...

Daniel Biella, Nelson Baloian, Wolfram LutherGPS Drawing on Street Networks: Extracting Routes from Polygonal Coverings
This contribution provides important fundamentals of digital geometry and algorithms based on polygonal coverage and chain codes to generate GPS drawings. Illustrative examples created with the GPSVisualizer and GoopleMaps show the difficulty in finding suitable road networks.
Thanks to the organizers and authors of the proceedings

Fig. 1. Walk across the campus of University of Chile: Publicdomain under Creative Commons 4.0 license
Motivation
Project PRASEDEC 2014-2016UDE – UCH
Algorithmic approach to GPSPainting
We worked with the data collected from a walk in Parque O'Higgins, Tupper, Beauchef, Blanco Encalada, Jose Miguel Carrera, Domeyko, and Almirante Latorre on Tuesday, September 3, 2013 between 17 and 18h using several smart phones.

Fig. 2a. Trace of the walk, b. a star, c. a light bulb (length 3.4 km) in Brooklyn, and d) a circle in Yerevan
• The trace shows the accuracy of the GPS coordinates (parameter linewidth: higher values mean lower accuracy). The color used represents type of environment—forest, trees, small and high buildings, free areas, streets and crossings
• Rosner mentions the challenge to paint a star and a circle which is quite simple with a regular street grid at hand (cf. Figure 2b, Brooklyn, NY)
• Special arcs in the Brooklyn road network can be used to draw a lightbulb• A grid-covering algorithm was be applied to the city map of Yerevan.
Examples
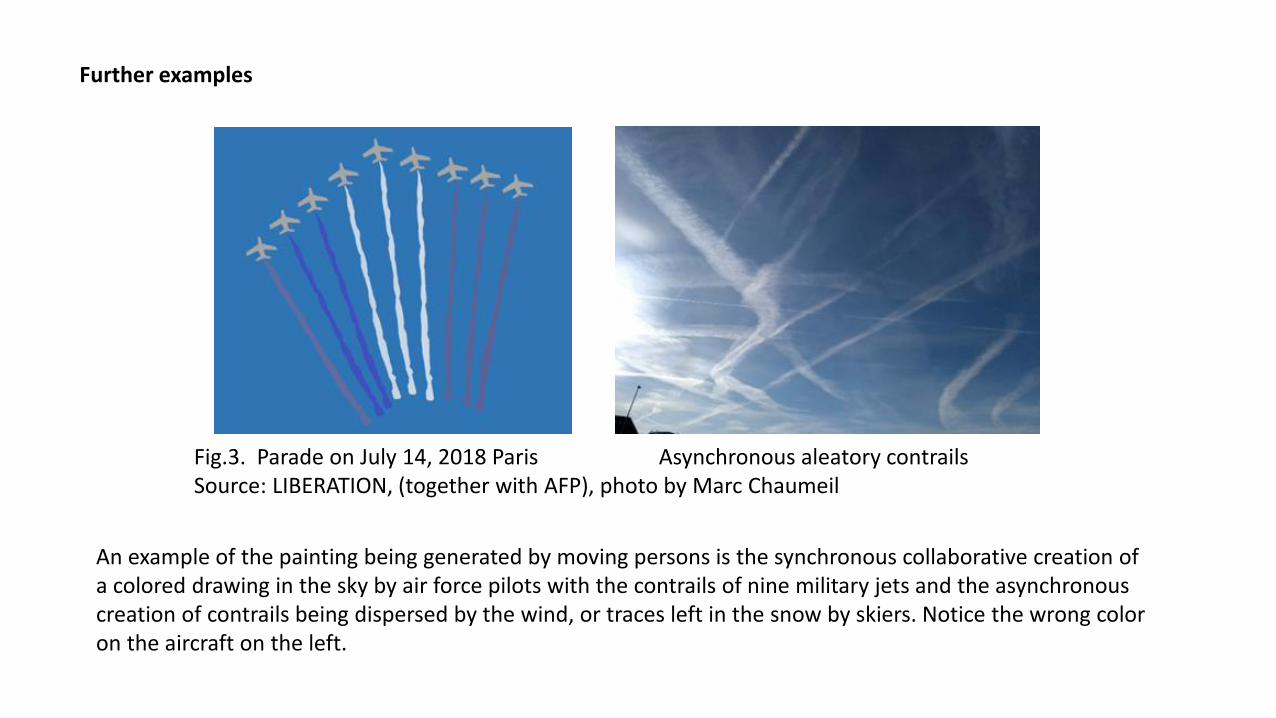
An example of the painting being generated by moving persons is the synchronous collaborative creation of a colored drawing in the sky by air force pilots with the contrails of nine military jets and the asynchronous creation of contrails being dispersed by the wind, or traces left in the snow by skiers. Notice the wrong color on the aircraft on the left.
Fig.3. Parade on July 14, 2018 Paris Asynchronous aleatory contrails Source: LIBERATION, (together with AFP), photo by Marc Chaumeil
Further examples
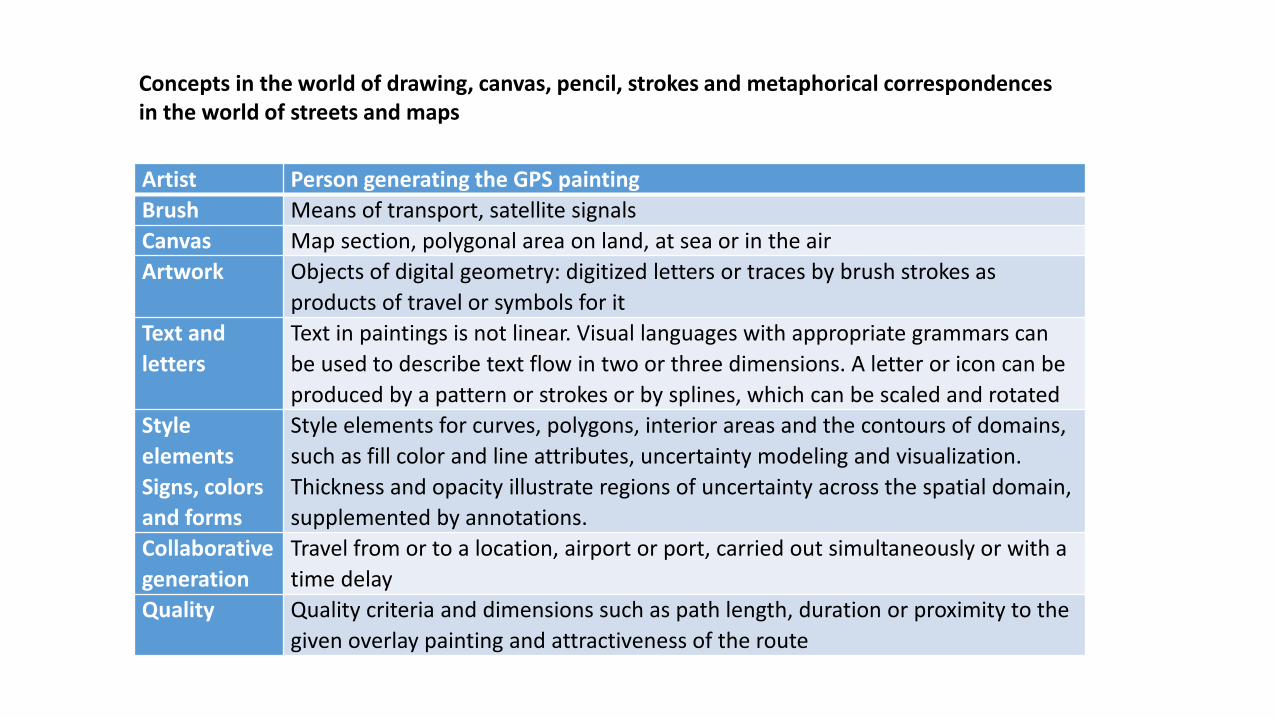
Concepts in the world of drawing, canvas, pencil, strokes and metaphorical correspondences in the world of streets and maps
Artist Person generating the GPS painting
Brush Means of transport, satellite signals
Canvas Map section, polygonal area on land, at sea or in the air
Artwork Objects of digital geometry: digitized letters or traces by brush strokes as
products of travel or symbols for it
Text and
letters
Text in paintings is not linear. Visual languages with appropriate grammars can
be used to describe text flow in two or three dimensions. A letter or icon can be
produced by a pattern or strokes or by splines, which can be scaled and rotated
Style
elements
Signs, colors
and forms
Style elements for curves, polygons, interior areas and the contours of domains,
such as fill color and line attributes, uncertainty modeling and visualization.
Thickness and opacity illustrate regions of uncertainty across the spatial domain,
supplemented by annotations.
Collaborative
generation
Travel from or to a location, airport or port, carried out simultaneously or with a
time delay
Quality Quality criteria and dimensions such as path length, duration or proximity to the
given overlay painting and attractiveness of the route
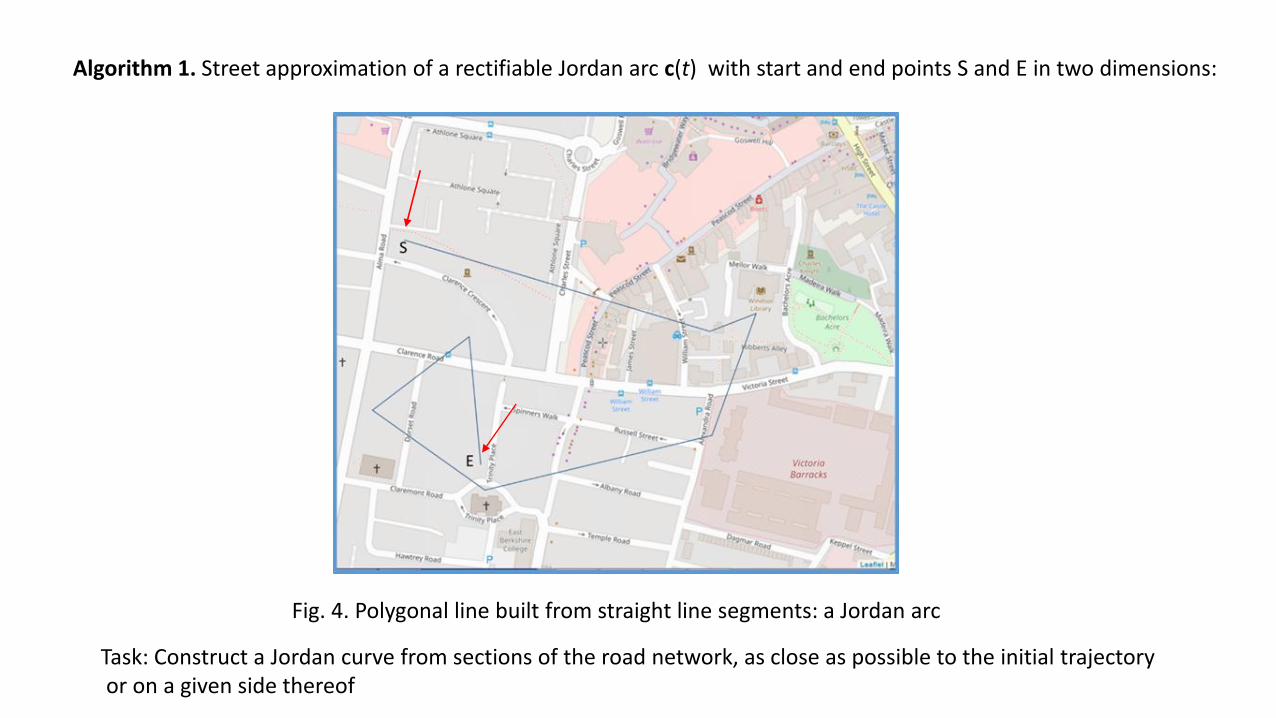
Algorithm 1. Street approximation of a rectifiable Jordan arc c(t) with start and end points S and E in two dimensions:
Fig. 4. Polygonal line built from straight line segments: a Jordan arc
Task: Construct a Jordan curve from sections of the road network, as close as possible to the initial trajectoryor on a given side thereof
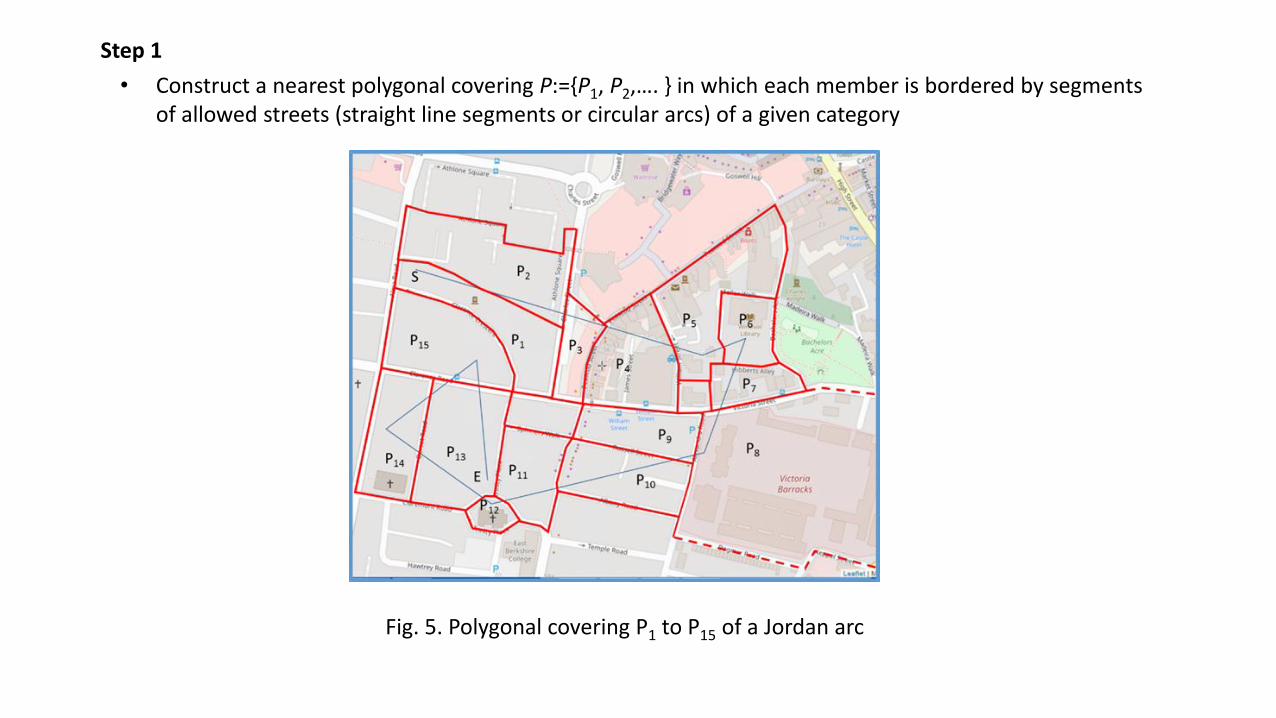
• Construct a nearest polygonal covering P:={P1, P2,…. } in which each member is bordered by segments of allowed streets (straight line segments or circular arcs) of a given category
Fig. 5. Polygonal covering P1 to P15 of a Jordan arc
Step 1
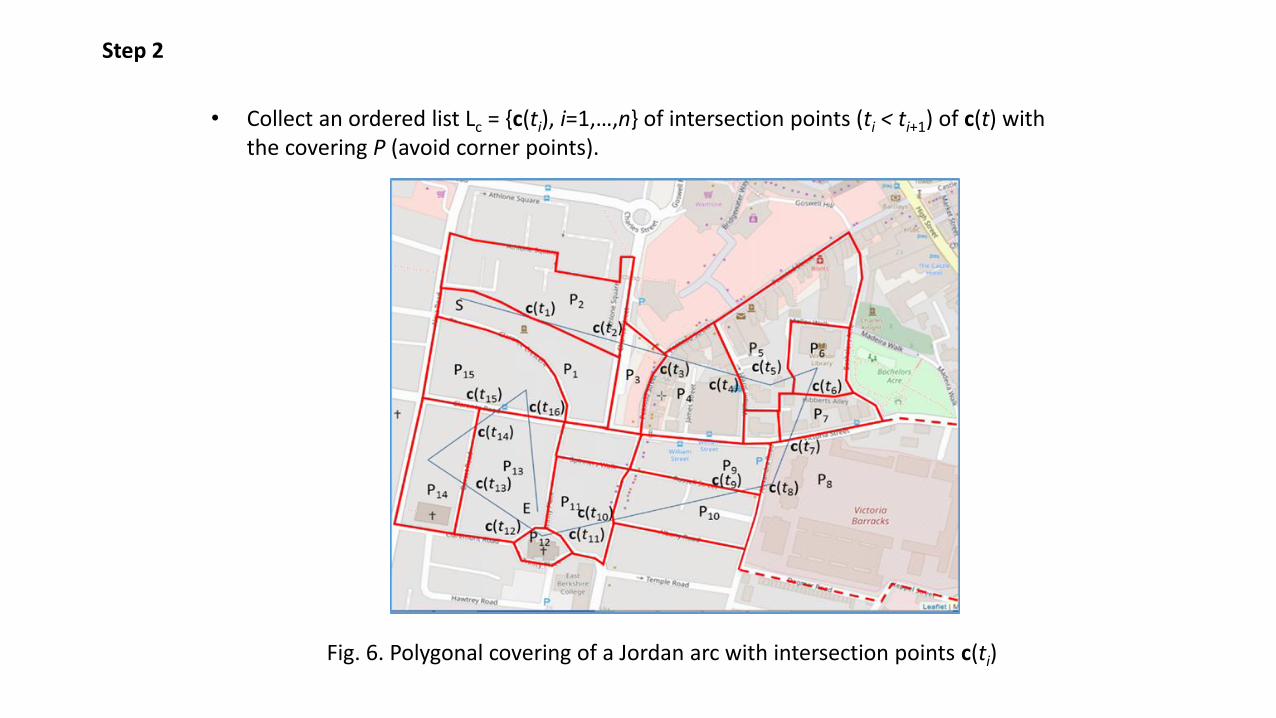
• Collect an ordered list Lc = {c(ti), i=1,…,n} of intersection points (ti < ti+1) of c(t) with the covering P (avoid corner points).
Step 2
Fig. 6. Polygonal covering of a Jordan arc with intersection points c(ti)

Further steps
• Start with c(t1), and set P1=Pj(0) that contains a part of c(t), t<t1.
• For i:=1 to n: determine Pj(i) with border point c(ti), which contains a part of c(t); t>ti , Pj(i-1)
contains a part of c(t), t<ti, resulting in a list Lp = {(Pj(i-1), Pj(i)), i=1,…, n, j=j(i)} of adjacent polygons.
• Try to assemble a path built from parts of the boundary ∂Pj(i), i=0,1,2,…., such that the optimality criteria (boundary parts of each member of the polygonal covering used, double crossed sections eliminated, shortest or closest Jordan path constructed) are fulfilled. Fig. 7. Extracted routes from polygonal covering – inner and outer variants
S
E
c(t) c(t1)
P1=Pj(0)
P2=Pj(1)
c(t2)c(t3) c(t4)
c(t5)
c(t6)
c(t7)
c(t8)c(t9)
c(t10)c(t11)c(t12)
c(t13)
c(t14)
c(t15)
c(t16)
P3=Pj(2)
P4=Pj(3)
P5=Pj(4)
P6=Pj(5)
P7=Pj(6)
P8 = Pj(7)P9=Pj(8)
P10=Pj(9)
P11=Pj(10)
P12=Pj(11)
P13 =Pj(12)
P14=Pj(13)
P13=Pj(14)
P15=Pj(15)
P13=Pj(16)
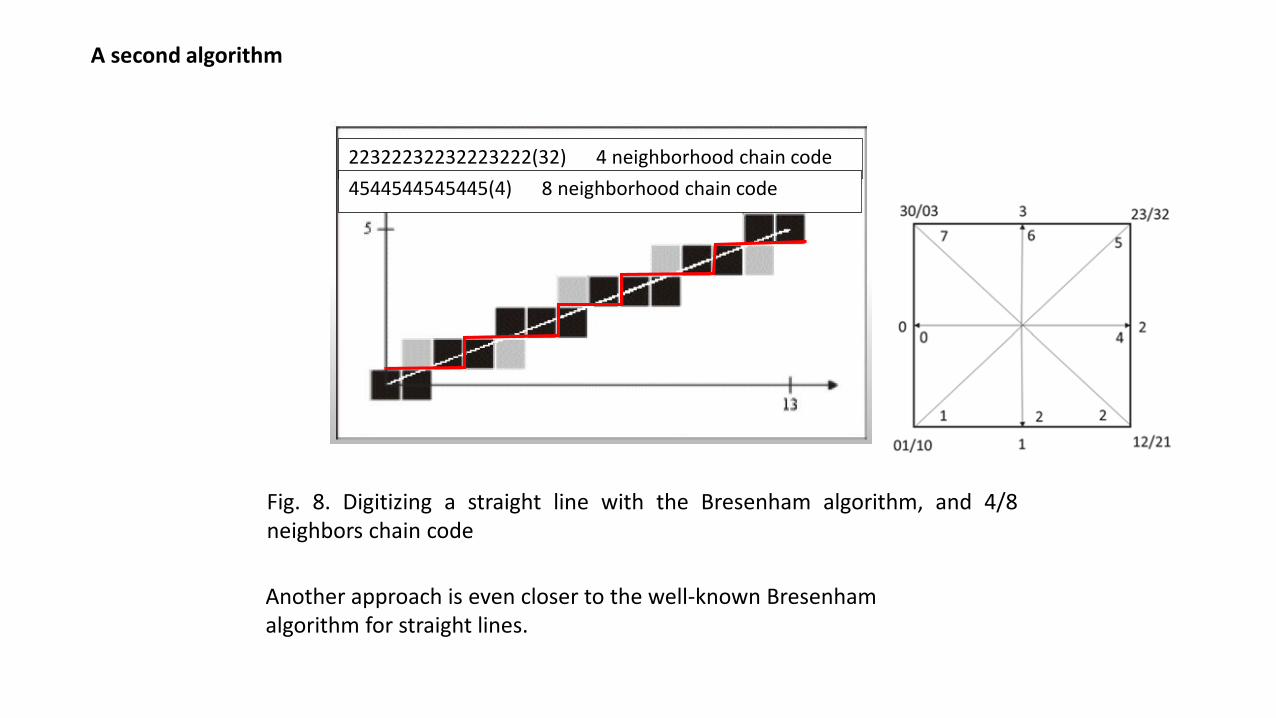
22322232232223222(32) 4 neighborhood chain code
4544544545445(4) 8 neighborhood chain code
Fig. 8. Digitizing a straight line with the Bresenham algorithm, and 4/8neighbors chain code
Another approach is even closer to the well-known Bresenham algorithm for straight lines.
A second algorithm
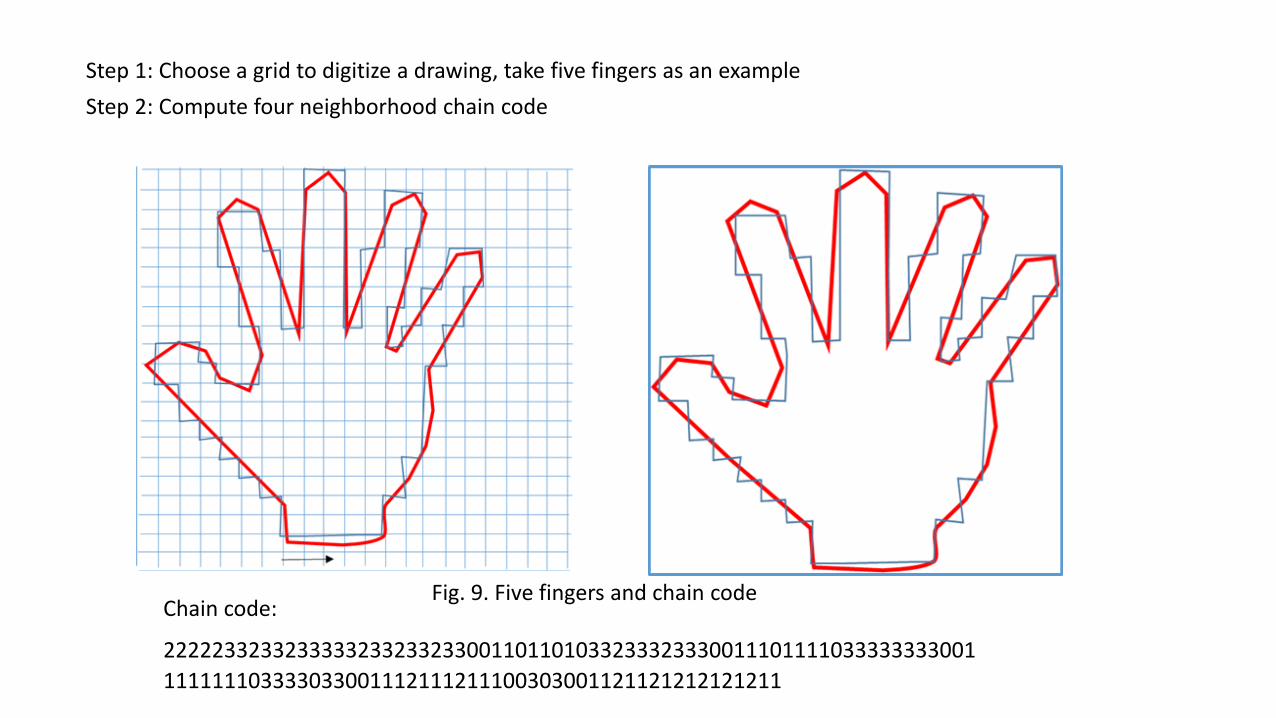
Step 1: Choose a grid to digitize a drawing, take five fingers as an example
Step 2: Compute four neighborhood chain code
Fig. 9. Five fingers and chain codeChain code:
2222233233233333233233233001101101033233323330011101111033333333001
111111103333033001112111211100303001121121212121211
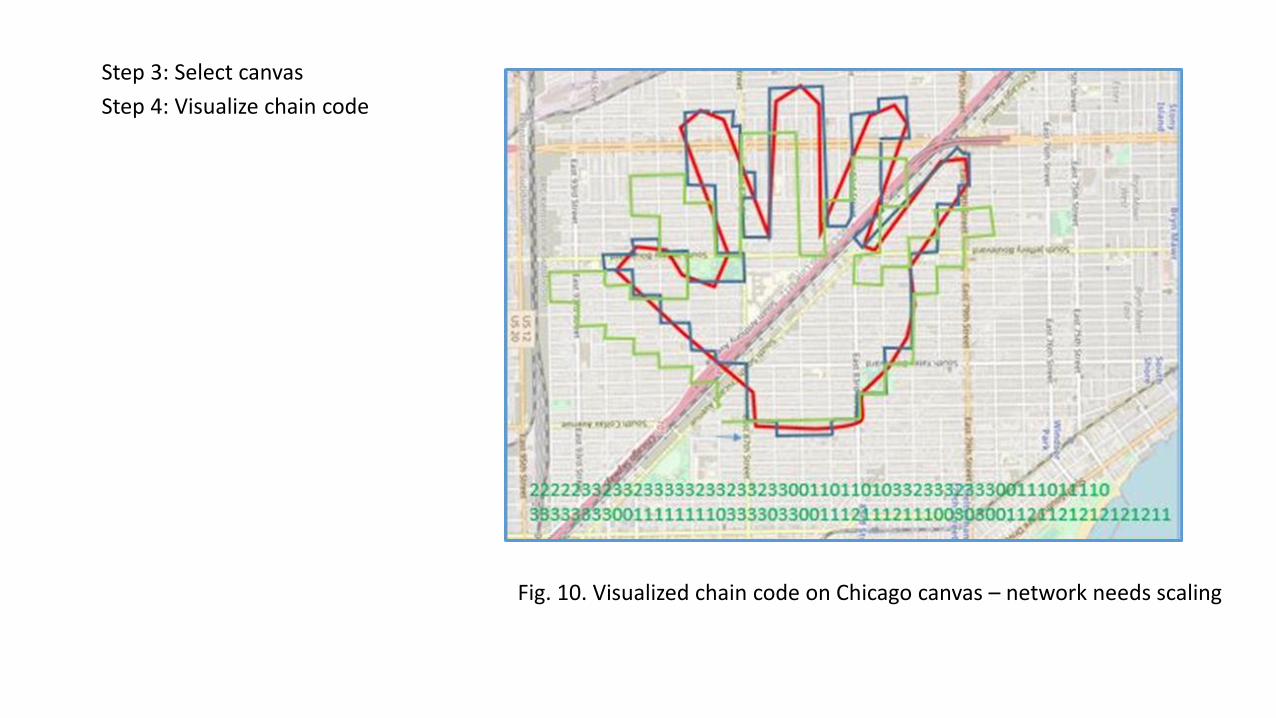
Step 3: Select canvas
Step 4: Visualize chain code
Fig. 10. Visualized chain code on Chicago canvas – network needs scaling

Further example
Fig. 11. Digitized text “MERRY ME OK” with four-chain code on rectangular (0, 57) x (0, 6) Manhattan canvas –chain code for used letters - start and end points - example for GPS coordinates of an intersection
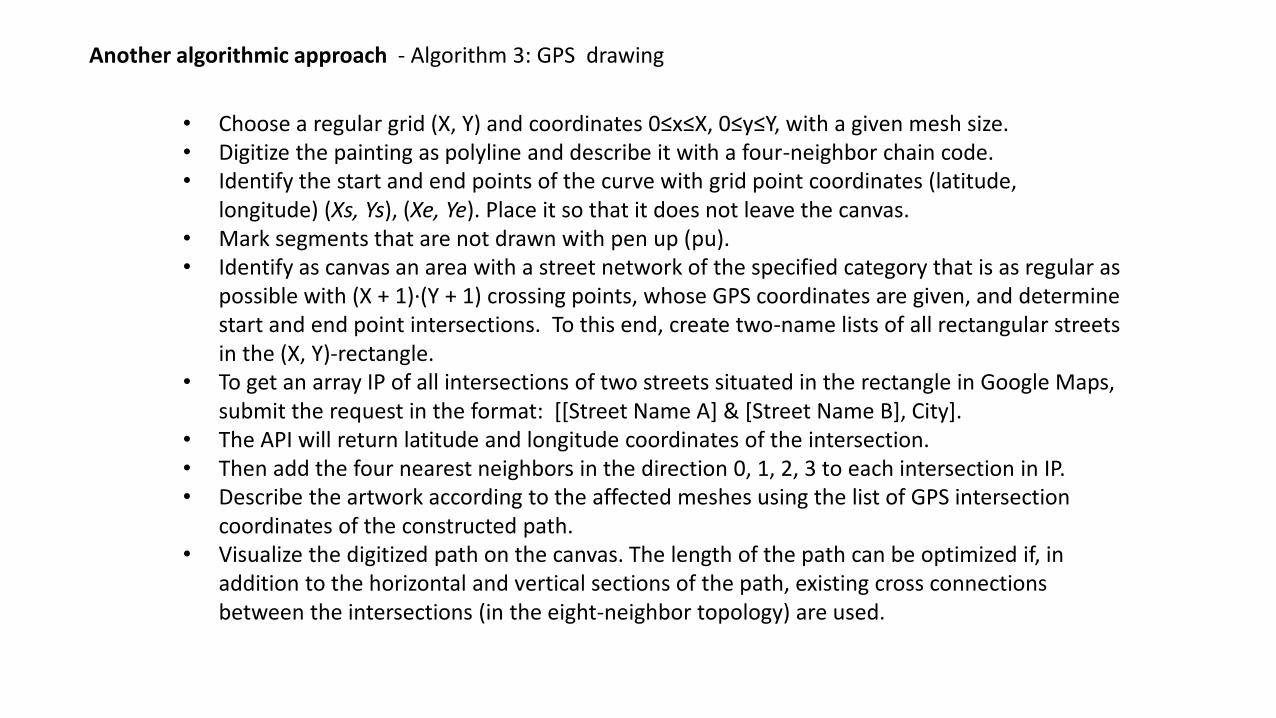
Another algorithmic approach - Algorithm 3: GPS drawing
• Choose a regular grid (X, Y) and coordinates 0≤x≤X, 0≤y≤Y, with a given mesh size.• Digitize the painting as polyline and describe it with a four-neighbor chain code.• Identify the start and end points of the curve with grid point coordinates (latitude,
longitude) (Xs, Ys), (Xe, Ye). Place it so that it does not leave the canvas. • Mark segments that are not drawn with pen up (pu).• Identify as canvas an area with a street network of the specified category that is as regular as
possible with (X + 1)∙(Y + 1) crossing points, whose GPS coordinates are given, and determine start and end point intersections. To this end, create two-name lists of all rectangular streets in the (X, Y)-rectangle.
• To get an array IP of all intersections of two streets situated in the rectangle in Google Maps, submit the request in the format: [[Street Name A] & [Street Name B], City].
• The API will return latitude and longitude coordinates of the intersection. • Then add the four nearest neighbors in the direction 0, 1, 2, 3 to each intersection in IP.• Describe the artwork according to the affected meshes using the list of GPS intersection
coordinates of the constructed path.• Visualize the digitized path on the canvas. The length of the path can be optimized if, in
addition to the horizontal and vertical sections of the path, existing cross connections between the intersections (in the eight-neighbor topology) are used.
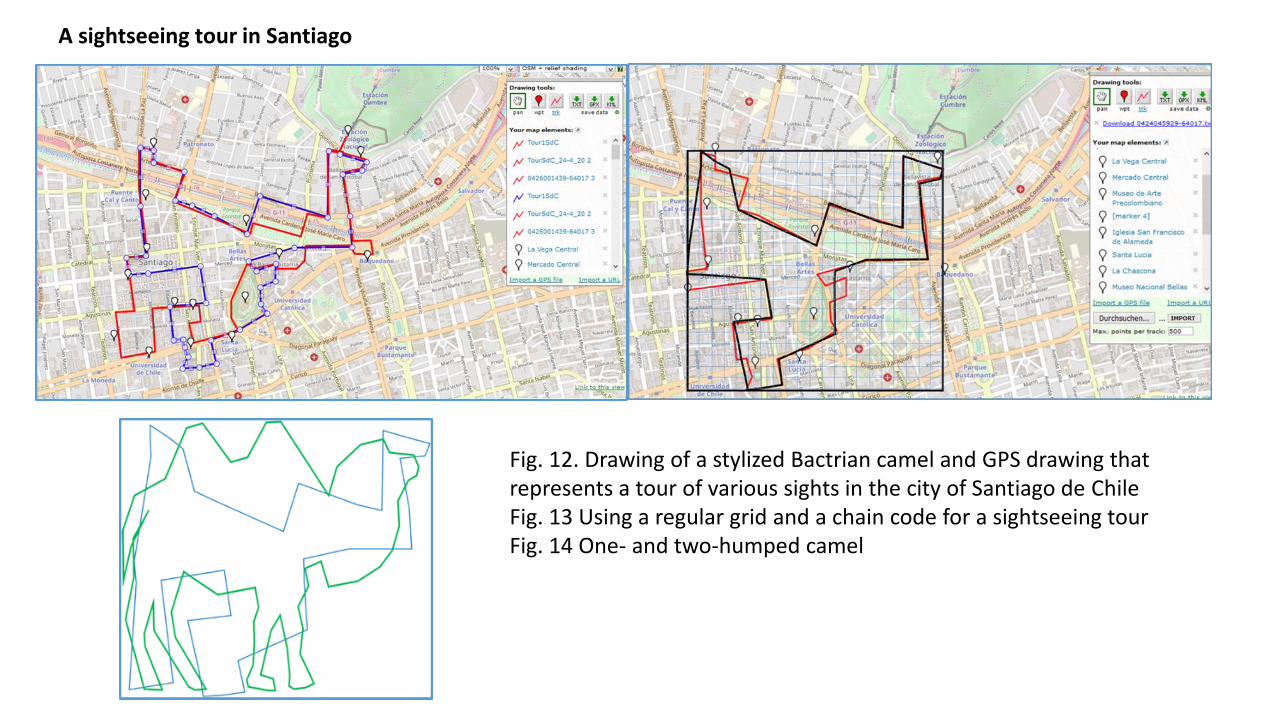
A sightseeing tour in Santiago
Fig. 12. Drawing of a stylized Bactrian camel and GPS drawing that represents a tour of various sights in the city of Santiago de ChileFig. 13 Using a regular grid and a chain code for a sightseeing tourFig. 14 One- and two-humped camel
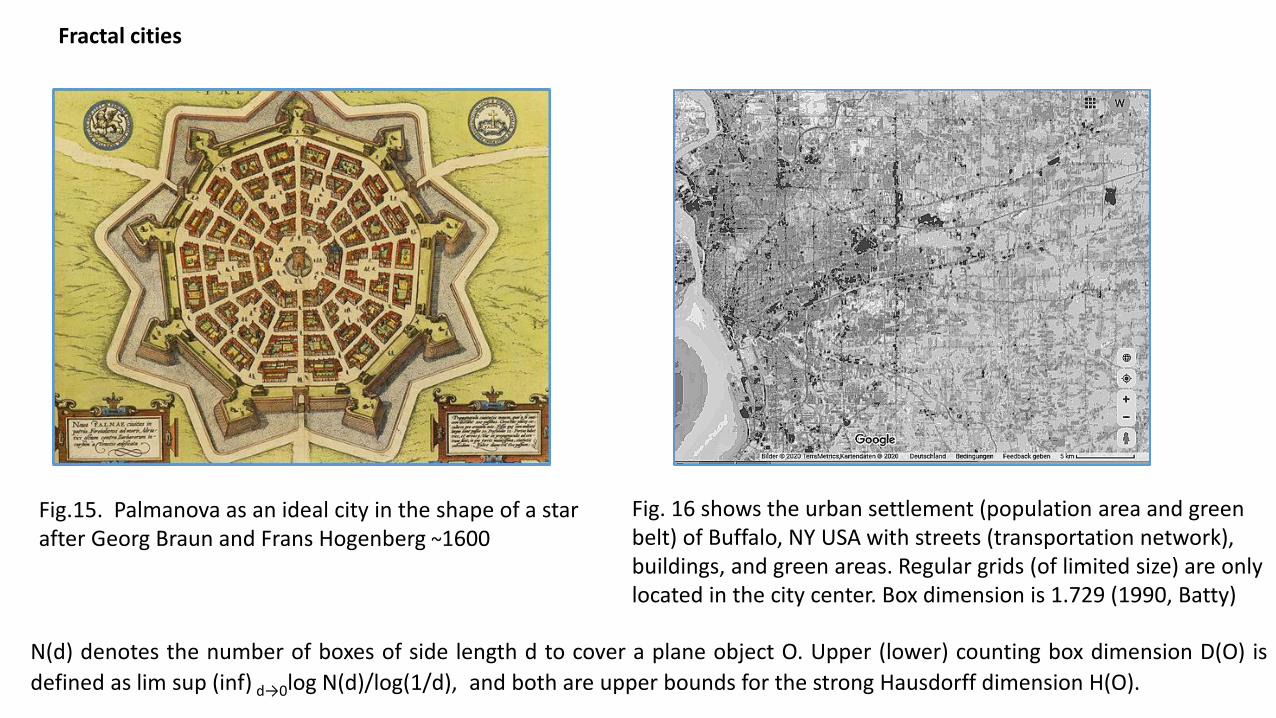
Fig.15. Palmanova as an ideal city in the shape of a star after Georg Braun and Frans Hogenberg ~1600
N(d) denotes the number of boxes of side length d to cover a plane object O. Upper (lower) counting box dimension D(O) is
defined as lim sup (inf) d→0log N(d)/log(1/d), and both are upper bounds for the strong Hausdorff dimension H(O).
Fig. 16 shows the urban settlement (population area and green belt) of Buffalo, NY USA with streets (transportation network), buildings, and green areas. Regular grids (of limited size) are only located in the city center. Box dimension is 1.729 (1990, Batty)
Fractal cities
Acknowledgement
The material was partly published together with Nelson Baloian and Daniel Biella in the CODASSCA 2020 Proceedings
“Collaborative Technologies and Data Science in Artificial Intelligence Applications”. The figures were created with the
GPSVisualizer and GoopleMaps.
GPSVisualizer is a sketchbook of GPS artists and proposes a standardized input form that automatically draws your GPS
data (or various exchange formats KML/ KMZ file, etc.) overlaid upon a variety of background maps and imagery, using
either the Google Maps API or Leaflet, an open-source mapping library and freehand drawing utility that allows users
to interactively draw on a map creating their own GPX or KML file. We used this software to produce figures 2, 4-7,
and 10-13.
Google Maps can be used to build highly customizable and scalable maps with their own content and imagery and to
import features from KML files, spreadsheets and other files formats (CVM, KML, KMZ, GPX, and XLSX). It supports the
user in creating complex applications and powerful visualizations of the data on a modern web platform with a
comprehensive user interface (see Figure 16).
Wolfram Luther University, Duisburg-Essen, [email protected], www.scg.inf.uni-due.de
Conclusion
There is a rich set of tools of digital geometry methods and freely accessible software to implement GPS drawings. The efficient localization of suitable road networks using intelligent learning approaches, scaling and adaptation of the canvas, and an evaluation of the user experience are priority topics for a relevant research question and planned for future work.
References
Batty, M., Longley, P.: Fractal Cities: A Geometry of Form and Function. Academic Press, San Diego, CA and London (1994) http://www.fractalcities.org/
Coeurjolly, D., Zerarga, L.: Supercover model, digital straight line recognition and curve reconstruction on the irregular isothetic grids. Computers & Graphics 30(1) 46–53 (2005)
Google Maps https://maps.google.com
GPS Visualizer https://www.gpsvisualizer.com/draw/
Janser, A., Luther, W., Otten, W.: Computergraphik und Bildverarbeitung, Vieweg 1996
Mattyus, G., Luo, W., and Urtasun, R.: Deep road mapper: Extracting road topology from aerial images. In The IEEE Inter. Conf. on Computer Vision (ICCV), Oct 2017. Machine Vision and Applications 28, 679–694 (2017)
Palmanova https://de.wikipedia.org/wiki/Palmanova#/media/Datei:Palmanova1600.jpg
Rosner, D., K., Saegusa, H., Friedland, J., Chambliss, A.: Walking by Drawing. Proceedings CHI 2015, Crossings, Seoul, Korea, April 18–23, 397–406 (2015)
Waschk, A., Krüger: J.: Automatic route planning for GPS art generation. Computational Visual Media 5(3) 303–310 (2019)
Zogg, J.-M.: GPS Essentials of Satellite Navigation Compendium. U-blox AG (2009)