Carbon Nanodots: Supramolecular Electron DonorAcceptor Hybrids Featuring Perylenediimides

DaltonTransactions
Dynamic Article Links
Cite this: Dalton Trans., 2012, 41, 13060
www.rsc.org/dalton PAPER
A novel ruthenium(II)–cobaloxime supramolecular complex for photocatalyticH2 evolution: synthesis, characterisation and mechanistic studies†‡
Donald M. Cropek,a Anja Metz,a Astrid M. Müller,b Harry B. Gray,b Toyketa Horne,c Dorothy C. Horton,c
Oleg Poluektov,d David M. Tiede,d Ralph T. Weber,e William L. Jarrett,f Joshua D. Phillipsc andAlvin A. Holder*c
Received 10th February 2012, Accepted 2nd April 2012DOI: 10.1039/c2dt30309d
We report the synthesis and characterization of novel mixed-metal binuclear ruthenium(II)–cobalt(II)photocatalysts for hydrogen evolution in acidic acetonitrile. First, 2-(2′-pyridyl)benzothiazole (pbt), 1,was reacted with RuCl3·xH2O to produce [Ru(pbt)2Cl2]·0.25CH3COCH3, 2, which was then reacted with1,10-phenanthroline-5,6-dione (phendione), 3, in order to produce [Ru(pbt)2(phendione)](PF6)2·4H2O, 4.Compound 4 was then reacted with 4-pyridinecarboxaldehyde in order to produce [Ru(pbt)2(L-pyr)]-(PF6)2·9.5H2O, 5 (where L-pyr = (4-pyridine)oxazolo[4,5-f ]phenanthroline). Compound 5 was thenreacted with [Co(dmgBF2)2(H2O)2] (where dmgBF2 = difluoroboryldimethylglyoximato) in order toproduce the mixed-metal binuclear complex, [Ru(pbt)2(L-pyr)Co(dmgBF2)2(H2O)](PF6)2·11H2O·1.5CH3COCH3, 6. [Ru(Me2bpy)2(L-pyr)Co(dmgBF2)2(OH2)](PF6)2, 7 (where Me2bpy = 1,10-phenanthroline, 4,4′-dimethyl-2,2′-bipyridine) and [Ru(phen)2(L-pyr)Co(dmgBF2)2(OH2)](PF6)2,8 were also synthesised. All complexes were characterized by elemental analysis, ESI MS, HRMS,UV-visible absorption, 11B, 19F, and 59Co NMR, ESR spectroscopy, and cyclic voltammetry, whereappropriate. Photocatalytic studies carried out in acidified acetonitrile demonstrated constant hydrogengeneration longer than a 42 hour period as detected by gas chromatography. Time resolved spectroscopicmeasurements were performed on compound 6, which proved an intramolecular electron transfer froman excited Ru(II) metal centre to the Co(II) metal centre via the bridging L-pyr ligand. This resultedin the formation of a cobalt(I)-containing species that is essential for the production of H2 gasin the presence of H+ ions. A proposed mechanism for the generation of hydrogen is presented.
Introduction
Due to the fact that fossil fuel reserves are rapidly diminishing,emphasis has been placed on the use of renewable energy to
meet the fuel needs of the world. Solar-to-chemical energy con-version is one of the most attractive for sustainable development;thus there is a growing need for the direct generation of molecu-lar hydrogen from water as a result of a convenient and cleanenergy vector, while utilising renewable resources, for example,water and sunlight.1–6 However, splitting water into hydrogenand oxygen is a complex multi-electron redox process7 involvinghigh energy barriers that require either an electric potential or acatalyst to lower energy barriers. The splitting of water intooxygen and hydrogen has utilised catalysts that are derived fromexpensive and rare noble metals, for example Pt, Pd, Rh, etc.,8,9
which are not competitive with fossil fuels, and unsuitable tomeet global demands.10 More recently and in the past, efforts inresearch have shifted from heterogeneous to the use of homo-geneous catalytic processes that are based on cheaper and abun-dant first-row transition metals.11–19
The entire water-to-hydrogen process first requires the oxi-dation of water to protons and O2 followed by the reduction ofprotons to hydrogen. Success has been achieved on wateroxidation,20–22 however, our focus is on the latter reactiondesigned to produce H2. While one approach is to mimic thecore of natural hydrogenases,23–26 there have also been reports
†Based on the presentation at Dalton Discussion No. 13, 10–12 Septem-ber 2012, University of Sheffield, UK.‡Electronic supplementary information (ESI) available: Figures featur-ing ESI MS (Fig. S1–S5), FT IR spectra (Fig. S5–S8), UV-visiblespectra (Fig. S9), and Q- and X-band ESR spectra (Fig. S10 and S11)data are collated here. See DOI: 10.1039/c2dt30309d
aU.S. Army Corps of Engineers, Construction Engineering ResearchLaboratory, Champaign, IL 61822, USAbCalifornia Institute of Technology, Beckman Institute, Pasadena,CA 91125, USAcDepartment of Chemistry and Biochemistry, The University of SouthernMississippi, 118 College Drive, #5043, Hattiesburg, Mississippi 39406-0001, USA. E-mail: [email protected]; Fax: +601-266-6075;Tel: +601-266-4767dChemical Sciences and Engineering Division, Argonne NationalLaboratory, Argonne, IL 60439, USAeEPR Division Bruker BioSpin, 44 Manning Road, Billerica, MA 01821,USAfSchool of Polymers and High-Performance Materials, The Universityof Southern Mississippi, 118 College Drive, #5050, Hattiesburg,MS 39406-0076, USA
13060 | Dalton Trans., 2012, 41, 13060–13073 This journal is © The Royal Society of Chemistry 2012
Dow
nloa
ded
by U
nive
rsity
of
Sout
hern
Mis
siss
ippi
on
25 O
ctob
er 2
012
Publ
ishe
d on
11
Apr
il 20
12 o
n ht
tp://
pubs
.rsc
.org
| do
i:10.
1039
/C2D
T30
309D
View Online / Journal Homepage / Table of Contents for this issue

of cobaloxime-containing complexes that are efficient electro-catalysts for hydrogen evolution.7,27–39 Cobaloximes are com-posed of a Co(II) centre, two equatorial glyoxime ligands andtwo exchangeable axial ligands, which influence the catalyticactivity.38 Lehn and co-workers pioneered the first studies onhomogeneous photogeneration of hydrogen using [Co(dmgH)2-(OH2)2] (where dmgH = dimethylglyoximate) as a catalyst with[Ru(bpy)3]
2+ as photosensitizer and triethanolamine (TEOA) asa sacrificial electron donor in a DMF solution.15
Connolly & Espenson,28 Razavet et al.,38 and more recently,Dempsey et al.7,29 carried out thorough investigations of themechanisms and kinetics of H2 reduction by cobaloximes.Whereas three different pathways were postulated, all proceedthrough the same intermediate, a Co(III)–hydride (Co(III)–H)complex that possesses a high hydridic character. Depending onthe relative concentrations of protons and Co(I), Co(III)–H iseither protonated and releases H2 in a heterolytic pathway orCo(III)–H is reduced by Co(I) to form Co(II)–H, followed byprotonation and H2 release.29 The former pathway is energeti-cally unfavourable since the formation of Co(III) involves highenergy barriers. A third, homolytic and energetically morefavourable pathway was suggested in which two Co(III)–Hspecies release H2 and form Co(II) in a reductive eliminationstep.29,38 More recently, Muckerman and Fujita40 carried outtheoretical studies of the reduction potentials of [Co(dmgBF2)2-(H2O)2] in an acetonitrile solution so as to shed light on its elec-trocatalytical mechanism for hydrogen production. Muckermanand Fujita40 proposed three mechanisms, all of which arebelieved to proceed through the formation of Co(III)–H. Theirresults indicate that the mechanism involving a Co(II)–H inter-mediate is the most likely.
In an approach to couple an H2 evolution catalyst to a photo-sensitizer for photocatalytic H2 generation, Fihri et al.12,13 syn-thesized a series of supramolecular catalysts comprising acobaloxime-based catalytic centre and a Ru(II)-based photosensi-tizer. The coupling was performed by replacing one of the axialH2O ligands of the cobaloxime with a pyridine-functionalizedruthenium(II)–polypyridine complex. These complexes weretested for photochemical hydrogen generation from [Et3NH]BF4,where it was found that the mixed-metal binuclear ruthenium(II)–cobalt(II) complexes were more efficient in hydrogen productionthan their corresponding multi-component systems under thesame conditions. A complex containing a BF2-bridged Co(II)centre was found to be superior when compared to those with anH-bridged Co(III) centre because the Co(II) state in the former ismore easily reducible and more resistant towards side reactions,for example, acidic hydrolysis and hydrogenation.12,13
Li et al.41 also studied related mixed-metal binuclear ruthe-nium(II)–cobalt(II) complexes with and without linker conju-gation in order to determine which of the two compounds werebetter photocatalysts for the generation of hydrogen under homo-geneous conditions. While both complexes were more activethan the corresponding multi-component systems, the non-conju-gated bridge was found to exhibit higher activity for hydrogenproduction.41
Over the years, our research group has been interested in thesynthesis and characterisation of bridging and terminal ligandsfor the construction of mixed-metal complexes that have at leastone ruthenium(II) metal centre. In this work, we followed the
approach by Fihri et al.12,13 and synthesized three novel mixed-metal binuclear catalysts containing a Ru(II) photosensitizer anda cobaloxime for photocatalytic H2 production in acetonitrile.The photocatalysts differ in their terminal ligands around theruthenium(II) metal centre, and have the formulae [Ru(pbt)2-(L-pyr)Co(dmgBF2)2(H2O)](PF6)2·11H2O·1.5CH3COCH3 6, [Ru-(Me2bpy)2(L-pyr)Co(dmgBF2)2(OH2)](PF6)2 7, and [Ru(phen)2-(L-pyr)Co(dmgBF2)2(OH2)](PF6)2 8. We chose those terminalligands in order to elucidate the effects of ligand structural varia-tions on the activity of photocatalytic behaviour for the pro-duction of hydrogen in acidic media. In this paper, we report forthe first time, ESR and NMR (11B, 19F, and 59Co) spectroscopicstudies, followed by photocatalytic and photochemical studieson compound 6. The precursor compound (compound 5) to com-pound 6 bearing the Ru(II) photosensitizer and L-pyr bridgingligand, but no Co(II) metal centre, was examined in order tostudy the effect of molecular coupling on an intra-molecularelectron transfer and catalytic activity.
Results and discussion
Compound 6 was synthesized (Scheme 1) in good yield by thesubstitution of one axial water ligand of [Co(dmgBF2)(H2O)2]by the pyridine moiety of compound 5; while compounds 7 and8 were prepared as by Horne et al.42 All complexes were charac-terized by elemental analysis, ESI MS, HRMS, UV-visibleabsorption, 11B, 19F, and 59Co NMR, ESR spectroscopy, andcyclic voltammetry, where appropriate.
ESI MS analysis
Low and high resolution ESI MS data were acquired for[Co(dmgBF2)2(H2O)2], compounds 4, 5, and 6 (see ESI,Fig. S1–S4‡). In all mass spectral analyses, we have assignedM as the molecular ion minus any solvates. A base peak for[Co(dmgBF2)2(H2O)2] occurred at m/z = 418.58 which is indica-tive of the presence of the [Co(dmgBF2)2(H2O)2 + H]+ species.Compound 4 gave the following m/z values: 368.0 (100%,[M − 2PF6]
2+) and 881.0 (100%, [M − PF6]+). High resolution
ESI MS gave m/z = 880.9938. Compound 5 gave m/z: 412.0(100%, [M − 2PF6]
2+) and 969.0 (100%, [M − PF6]+). High
resolution ESI MS also gave m/z = 969.0368 for compound 5.Compound 6 was found to be unstable in the chamber of themass spectrometer, but the mass spectrum showed the presenceof the following species: m/z values: 412.0 (100%, [M − 2PF6 −Co(dmgBF2)2(H2O)]
2+), 969.0 (100%, [M − PF6 − Co(dmgBF2)2-(H2O)]
+). [Co(dmgBF2)2(H2O)2 + H]+ was also detected in themass spectrometer at m/z = 418, which is the m/z ratio foundbetween m/z values of 412.0 and 431.8. This m/z ratio could bedue to [Co(dmgBF2)2(H2O)2 + H]+ being formed from the reac-tion between H2O (in CH3CN) and the [Co(dmgBF2)2(H2O)]species (which was dissociated from compound 6 in chamber ofthe mass spectrometer).
FT IR and UV-visible spectral studies
FT IR spectra were acquired for [Co(dmgBF2)2(H2O)2], com-pounds 4, 5, and 6 (see ESI, Fig. S5–S8‡). [Co(dmgBF2)2(H2O)2]
This journal is © The Royal Society of Chemistry 2012 Dalton Trans., 2012, 41, 13060–13073 | 13061
Dow
nloa
ded
by U
nive
rsity
of
Sout
hern
Mis
siss
ippi
on
25 O
ctob
er 2
012
Publ
ishe
d on
11
Apr
il 20
12 o
n ht
tp://
pubs
.rsc
.org
| do
i:10.
1039
/C2D
T30
309D
View Online

has a ν(B–O) stretching frequency at 1160.47, while the ν(B–F)stretching frequency occurs at 954.14 and 826.29 cm−1.43,44 Themain stretching frequency for the PF6
− anion occurs at 827.91and 827.73 cm−1 for compounds 4 and 5, respectively. Thestretching frequency of 823.43 cm−1 is a combination of ν(B–F)and ν(PF6
−) stretching frequencies for compound 6, whilethe ν(B–F) stretching frequency occurs at 1161.09 cm−1.
The stretching frequency for CvO in compound 4 occurs at1699.10 cm−1; while the stretching frequency for CvN occursat 1620.04, 1603.70, and 1614.14 cm−1 for [Co(dmgBF2)2-(H2O)2], compounds 5 and 6, respectively. The UV-visible spec-trum of [Co(dmgBF2)2(H2O)2] in acetonitrile (Fig. 1 and ESI,Fig. S9‡), show the main spectral bands occur at 260 (sh), 318,424, and 1163 nm, with the molar extinction coefficients being6.5 × 103, 2.5 × 10³, 3.6 × 10³, and 120 M−1 cm−1, respectively.In DMSO, the main spectral bands occur at 268, 337 and472 nm, with the molar extinction coefficients being 7.9 × 103,1.9 × 103, and 3.0 × 10³ M−1 cm−1, respectively. These valuescompare well with the electronic spectrum of [Co(dmgBF2)2-(H2O)2] in water as reported by Wangila and Jordan,45 where themain spectral bands for [Co(dmgBF2)2(H2O)2] occur at 260,326, and 456 nm with the molar extinction coefficients being6.38 × 103, 2.06 × 10³, and 4.04 × 10³ M−1 cm−1, respectively.The differences in the molar extinction coefficient values are dueto solvatochromism as a result of the two different solventsystems.
Scheme 1 Synthesis of compound 6. Compounds 7 and 8 are illus-trated here.
Fig. 1 The UV-visible spectra of concentrated solutions of [Co(dmgBF2)2-(H2O)2], compounds 4, 5, and 6 in CH3CN. (Top) [Co(dmgBF2)2-(H2O)2], compounds 4 and 5. (Bottom) Compound 6.
13062 | Dalton Trans., 2012, 41, 13060–13073 This journal is © The Royal Society of Chemistry 2012
Dow
nloa
ded
by U
nive
rsity
of
Sout
hern
Mis
siss
ippi
on
25 O
ctob
er 2
012
Publ
ishe
d on
11
Apr
il 20
12 o
n ht
tp://
pubs
.rsc
.org
| do
i:10.
1039
/C2D
T30
309D
View Online

All of the ruthenium(II) complexes (Fig. 1 and ESI, Fig. S9‡)have extensive light absorbing properties which are characterizedby UV-visible spectrophotometry. Compounds 4, 5, 6, 7, and 8,all possess intense intra-ligand transitions in the UV region,while the lowest Ru(dπ) → bridging ligand (BL) CT bands occurin the low energy visible spectrum.
The MLCT bands for compounds 4, 5, 6, 7, and 8, occur at458, 466, 466, 439, and 431 nm, respectively. The molar extinc-tion coefficients for all compounds are listed in Table 1. Com-pound 4 absorbs at 947 nm (ε = 82 M−1 cm−1); whilecompound 5 (Fig. 1 and S9, ESI‡) absorbs at 723 nm (ε = 360M−1 cm−1); and compound 6 absorbs at 720 nm (ε = 400 M−1
cm−1) and 1136 nm (ε = 100 M−1 cm−1). Note the artifact at1286 nm for compound 6 is due to poor subtraction of Woodsanomalies in the spectrophotometer.
The main feature with compound 6 is the observance of a verybroad absorption band at 1136 nm, which is blue-shifted whencompared to 1163 nm of [Co(dmgBF2)2(H2O)2] in acetonitrile.This blue shift is due to the coordination of the pyridine moietyfrom the bridging L-pyr ligand in compound 5. These broadbands at 1136 and 1163 nm indicate the presence of a low-spinCo(II) metal centre in [Co(dmgBF2)2(H2O)2] and compound 6.This is due to the transition within the octahedral 2Eg groundstate, which is split by the Jahn–Teller effect and tetragonalligand field, (2A1g →
2B1g). Such broad bands, along with suchan explanation were observed for [Co(dmvi)2(phen)]·2CHCl3(where dmvi = the dimethylviolurate anion),46 [Co(tpy)2]
2+,47
K2Ba[Co(NO2)6],48 [Co(1-oxa-4,7-diazacyclononane)2]I2,
49 andthe [Co(CN)5]
3− anion.50,51
11B, 19F, and 59Co NMR spectroscopic studies
In an NMR spectroscopic study, 11B, 19F, and 59Co NMR spectrawere acquired for [Co(dmgBF2)2(H2O)2] and compound 6 inDMSO-d6 at ambient temperature (Fig. 2–4). These NMRspectroscopic studies were carried out to verify whether there iscoordination of the L-pyr bridging ligand (BL) to the Co(II)metal centre, and what environmental effect there is on the BF2moiety and the Co(II) metal centre in the absence and presenceof the pyridine moiety of the bridging ligand.
Fig. 2 shows the 11B NMR spectra for [Co(dmgBF2)2(H2O)2]and compound 6. Chemical shifts of 0.69, 3.55, and 39.04 ppmwere found for [Co(dmgBF2)2(H2O)2], the chemical shift of39.04 ppm having the highest intensity. On the other hand, com-pound 6 produced chemical shifts at 0.66, 1.47, 2.98, and37.95 ppm. It must be noted that the highest intensity occurs at
37.95 for compound 6. The chemical shifts for compound 6 arebelieved to be due to presence of various diastereoisomers andpossible conformations (types A–C as shown below) that couldbe present in DMSO-d6. Such conformations have been reportedfor [Co(dmgBF2)2(py)]
− and [Cu(dmgBF2)2(CO)]− anions.52,53
The three chemical shifts for [Co(dmgBF2)2(H2O)2] could bedue to the presence of the conformations (types A–C shownbelow).
Fig. 3 shows the 19F NMR spectra for [Co(dmgBF2)2(H2O)2]and compound 6, with the predominant species resonating at
Table 1 UV-visible spectroscopic data of the respective complexes in CH3CN
Complex λ1/nm 10−3 ε1/M−1 cm−1 λ2/nm 10−3 ε2/M
−1 cm−1 λ3/nm 10−3 ε3/M−1 cm−1 λ4/nm 10−3 ε4/M
−1 cm−1 λ5/nm ε5/M−1 cm−1
[Co(dmgBF2)2(OH2)2] 228 11 260 sh 6.5 318 2.5 424 3.6 1163 120[Co(dmgBF2)2(OH2)2]
a — — 268 7.9 337 1.9 472 3.0 — —
4 248 36 306 39 334 sh 31 458 12 947 825 280 67 312 58 466 19 723 0.36 — —
6 280 52 312 44 464 15 720 0.399 1136 1017 — — — — 439 8.4 — — 1100 668 — — — — 431 8.4 — — 1100 92
a In DMSO.
This journal is © The Royal Society of Chemistry 2012 Dalton Trans., 2012, 41, 13060–13073 | 13063
Dow
nloa
ded
by U
nive
rsity
of
Sout
hern
Mis
siss
ippi
on
25 O
ctob
er 2
012
Publ
ishe
d on
11
Apr
il 20
12 o
n ht
tp://
pubs
.rsc
.org
| do
i:10.
1039
/C2D
T30
309D
View Online

−148.4 ppm for both compounds. Chemical shifts of −145.6,−146.6, and −148.4 ppm are present for [Co(dmgBF2)2(H2O)2],while chemical shifts at −143.8, −145.6, −145.9, −146.2, and−148.4 ppm, are present for compound 6. The numerous chemi-cal shifts for [Co(dmgBF2)2(H2O)2] could possibly due to thepresence of possible conformations (types A–C) existing in thedmgBF2 ligand; while those present in compound 6 could alsobe due to a combination of the possible conformations (typesA–C) in the dmgBF2 ligand, and the various diastereomers inthe DMSO-d6 solution. The chemical shifts of [Co(dmgBF2)2-(H2O)2] and compound 6 can be compared to that of [(Ph-Me2diimineO)2BF2]CoBr2 as reported by Berben and Peters,54
where δ = −147 ppm was measured for the BF2 moiety inCD2Cl2.
Transition metal NMR chemical shifts are useful probes of thestructure and reactivity of many coordination complexes sincethose chemical shifts allow for tiny variations at the coordinationmetal centre under investigation.55 It is known that the isotope59Co exhibits the largest known shielding range.56 It is also100% naturally abundant, possesses a relatively high magneto-gyric ratio, and by virtue of the magnetic mixing of its occupiedand excited d orbitals, it may experience substantial paramag-netic deshielding (>15 000 ppm) that will reveal subtle changesin the chemical environment of a cobalt metal centre.56 The 59Co
NMR properties have been extensively studied for cobaloximes[RCo(dmgH)2L] (where dmgH = dimethylglyoximate).57–59
Based on these facts, we have decided to use 59Co NMR spectro-scopy as a tool to verify whether we have formed the mixed-metal binuclear compound 6. Fig. 4 shows the 59Co NMRspectra for [Co(dmgBF2)2(H2O)2] and compound 6, where thechemical shift for [Co(dmgBF2)2(H2O)2] occurs at 5652 ppm;while that for compound 6 occurs at 5401 ppm. There is anupfield shift on substitution of one of the axial water moleculesin [Co(dmgBF2)2(H2O)2] by the pyridine moiety in compound5. Clearly, this is evidence of the formation of our mixed-metalbinuclear complex. Our 59Co NMR chemical shifts can be com-pared to a series of vitamin B12 model complexes that werereported by Tavagnacco et al.59 (Table 2). In Table 2, the 59CoNMR chemical shifts for both [Co(dmgBF2)2(H2O)2] and com-pound 6 are more downfield when compared to the values asreported by Tavagnacco et al.59 These differences are likely dueto a solvent effect since our spectra were measured in DMSO-d6instead of acetone-d6 It must be noted that there is a solventinfluence on the 59Co NMR chemical shifts for some cobalt(III)complexes, for example [Co(CN)6]
3− as reported by Taura.60
Our chemical shifts for [Co(dmgBF2)2(H2O)2] and compound 6are more downfield when compared to the solution 59Co NMRchemical shifts of vitamin B12 (δ = 4650 ± 20 ppm), B12 co-enzyme (δ = 4480 ± 30 ppm), methyl cobalamin (δ = 4215 ±
Fig. 2 11B NMR spectra for [Co(dmgBF2)2(H2O)2] and compound 6in DMSO-d6.
Fig. 3 19F NMR spectra for [Co(dmgBF2)2(H2O)2] and compound 6in DMSO-d6.
13064 | Dalton Trans., 2012, 41, 13060–13073 This journal is © The Royal Society of Chemistry 2012
Dow
nloa
ded
by U
nive
rsity
of
Sout
hern
Mis
siss
ippi
on
25 O
ctob
er 2
012
Publ
ishe
d on
11
Apr
il 20
12 o
n ht
tp://
pubs
.rsc
.org
| do
i:10.
1039
/C2D
T30
309D
View Online

10 ppm), and dicyanocobyrinic acid heptamethyl ester (δ = 4095± 5 ppm) as reported by Medek et al.37
ESR spectroscopic studies
In this study, ESR spectroscopy is used to gather relevant infor-mation about the compounds that contain a paramagnetic Co(II)metal centre. As such, we now report ESR spectroscopic studiesfor [Co(dmgBF2)2(H2O)2] and compounds 6–8, but with themain focus on [Co(dmgBF2)2(H2O)2] and compound 6.
Q-band ESR studies
We were also able to acquire Q-band ESR spectra (ESI,Fig. S10‡) for [Co(dmgBF2)2(H2O)2] and compound 6 inDMSO at 100 K. The spectra exhibit a larger amount of g- andA-strain as seen in similar systems studied by Harmer et al.61
who carried out X- and Q-band ESR spectroscopic studies oncorrin nitrogens and remote dimethylbenzimidazole nitrogen
interactions in Cob(II)alamin. Their ESR parameters were asfollows: (g1 = 2 : 272, g2 = 2 : 230, g3 = 2 : 004, A1
Co = 30 MHz,A2
Co = 40 MHz, and A3Co = 305 MHz). Their ESR parameters
compare favourably with our A1Co and A2
Co values, but our A3Co
value is nearly seven times greater (our spin Hamiltonian para-meters are shown in Table 3). In addition, the DMSO solventdoes not form a good glass. Both facts cause difficulties in inter-preting the spectra. Whereas no resolved hyperfine is seen incompound 6, there is an increase in line width from approxi-mately 7 G in [Co(dmgBF2)2(H2O)2] compared to approximately32 G in compound 6, indicating the coordination of the pyridinemoiety from compound 5.
X-band ESR studies
We were able to acquire X-band ESR spectra for [Co(dmgBF2)2-(H2O)2] and compounds 6–8 in DMSO at 4 K. The ESR spectrain Fig. 5 reveal the hyperfine structural features of the Co(II)metal centre of the cobaloxime moiety for compounds 6–8, allof which compare well with those complexes as reported byRangel et al.62,63 ESI Fig. S11‡ shows the ESR spectrum ofcompound 8 at a warmer temperature of 101 K, where thehyperfine features were more defined. The spectrum has a largerg tensor anisotropy where three g features are discernable. Thisis exhibited in the high field region as a result of the hyperfinecoupling of the unpaired electron with cobalt (59Co, I = 7/2) andnitrogen (14N, I = 1) atoms. Each of the eight lines in the ESRspectrum of compound 8 (ESI, Fig. S11‡) which arise fromcoupling to the cobalt(II) centre is further split into three relativeintensities 1 : 1 : 1, all due to the super hyperfine coupling withone axially bound nitrogen from the pyridine moiety of thebridging ligand, L-pyr. This ESR spectrum is assigned to a lowspin cobalt(II)-containing compound with one axially bound sub-stituted pyridine moiety of the bridging ligand, L-pyr. Thisneatly correlates with the evidence as gathered through ourUV-visible-NIR and 59Co NMR spectroscopic studies for [Co-(dmgBF2)2(H2O)2] and compound 6.
Table 3 also shows the spin Hamiltonian parameters obtainedfor the respective compounds in DMSO.
Electrochemical studies
Elemental analysis, ESI MS, and NMR spectroscopic data areconsistent with the L-pyr ligand of compound 5 coordinating tothe cobalt(II) metal centre of [Co(dmgBF2)2(H2O)2] in order toform compound 6. This was further supported by ascertainingthe redox properties of the ruthenium(II) metal complexesthrough cyclic voltammetry. Cyclic voltammograms (Fig. 6) ofcompounds 6–8 show a reversible CoII/I redox couple occurringat −0.45 V (in CH3CN with Ag/AgCl as a reference electrode).A similar value of −0.45 V was also obtained for [Ru(bpy)2-(L-pyr)Co(dmgBF2)2(H2O)](PF6)2 as reported by Fihri et al.13
Table 4 shows the respective electrochemical data obtained forcompounds 6–8.
Electrocatalytic studies
Electrocatalytic studies were carried out on compound 6. Com-pound 6 clearly displays electrocatalytic activity (Fig. 7) in
Fig. 4 59Co NMR spectra for [Co(dmgBF2)2(H2O)2] and compound 6in DMSO-d6. (Top) [Co(dmgBF2)2(H2O)2]. (Bottom) Compound 6.
This journal is © The Royal Society of Chemistry 2012 Dalton Trans., 2012, 41, 13060–13073 | 13065
Dow
nloa
ded
by U
nive
rsity
of
Sout
hern
Mis
siss
ippi
on
25 O
ctob
er 2
012
Publ
ishe
d on
11
Apr
il 20
12 o
n ht
tp://
pubs
.rsc
.org
| do
i:10.
1039
/C2D
T30
309D
View Online

acetonitrile on the addition of p-cyanoanilinium tetrafluoroborateas a proton source (where [complex] = 1.0 mM, and [H+] wasvaried, 1.5, 3.0, 5.0, and 10.0 equiv.). Fig. 7 shows a catalyticpeak at the Co(II/I) couple for compound 6 where a catalyticwave corresponding to hydrogen evolution was observed at−0.5 V vs. Ag/AgCl, a process that is comparable with that of[Ru(bpy)2(L-pyr)Co(dmgBF2)2(H2O)](PF6)2.
13 Upon additionof p-cyanoanilinium tetrafluoroborate, catalytic currents wereobserved near the CoII/I redox couple, where increasing acidconcentration produced a change from a reversible process to anirreversible process. It is also noticed that a second redox coupleappears on addition of three equivalents of the proton source.We are yet to ascertain the species that are formed upon additionof three equivalents of the proton source. As reported in litera-ture,29,33,34 we can conclude that since Co(II) is regeneratedduring H2 production, there is no return oxidation wave.
Photocatalytic studies with compounds 6 and 8
Photocatalytic studies were carried out on compounds 6 and 8 inacetonitrile as solvent, and in the presence of p-cyanoaniliniumtetrafluoroborate as a proton source in order to quantify theamount of H2 being produced on irradiation at 300 nm. We usedeither Et3N or triethanolamine ((EtOH)3N) as a sacrificial elec-tron donor in our study. One problem encountered with the use
of these sacrificial reducing agents, is that when increasing theirconcentration for faster quenching while keeping the pH constantby increasing the amount of acid accordingly, the catalystsshowed degradation effects. It has been reported in the literaturethat cobaloximes degrade in acetonitrile in the presence of astrong acid such as p-cyanoanilinium.27 While a 1 M concen-tration of (EtOH)3N with only 90 mM proton source led to agood H2 production rate, the same concentrations for Et3Nyielded only very small amounts of H2 probably due to thehigher pH of the solution as the pKa of Et3N is higher (10.7)than that of (EtOH)3N (7.8). Consequently we used differentconcentrations for the two electron donors and adjusted thedonor/acid molar ratios to 1.5 for Et3N (85 mM) and a ratio ofthree (3) for (EtOH)3N (440 mM). The concentration of catalystwas always 300 μM. Compound 6 produces higher H2 evolutionrates when compared to compound 8 (see Fig. 8) in each experi-ment with an average rate of 100 μL h−1 using Et3N (TOF =∼1 h−1) and over 200 μL h−1 using (EtOH)3N (TOF = ∼2 h−1).The production remained fairly constant for approximately eighthours, but then declined to an average of 20 μL h−1 with eitherelectron donor. H2 evolution was maintained over a period of atleast 42 hours. Compound 8 displayed a production rate of64 μL h−1 using Et3N (TOF = ∼0.5 h−1) and 100 μL h−1 using(EtOH)3N (TOF = ∼1 h−1) over the first eight hours and thenalso slowed down. In the absence of any catalyst, no H2
Table 3 Spin Hamiltonian parameters obtained from Q- and X-band ESR experiments in DMSO
Complex Band gx gy gz A1Co/MHz A2
Co/MHz A3Co/MHz AN/MHz
[Co(dmgBF2)2(H2O)2] Q 2.26 2.16 2.01 30 30 3006 Q 2.25 2.165 2.01 30 30 3106 X 2.22 2.17 2.015 30 30 2807 X 2.22 2.17 2.012 30 30 280 448 X 2.23 2.10 2.01 30 30 280 48
Table 2 59Co NMR spectroscopic data for [Co(dmgBF2)2(H2O)2], compound 6, and related cobalt-containing complexes59
Compound δ/ppm Compound δ/ppm
[Me–Co(dmg)2(H2O)] 4156 [Me–Co(DOBF2)2(H2O)]ClO4 4588[Et–Co(dmg)2(H2O)] 4180 [Et–Co(DOBF2)2(H2O)]ClO4 4612[Pr–Co(dmg)2(H2O)] 4185 [Pr–Co(dmgBF2)2(H2O)]ClO4 4678[Bu–Co(dmg)2(H2O)] 4195 [PhCH2–Co(DOBF2)2(H2O)]ClO4 5021[i-Pr–Co(dmg)2(H2O)] 4410[PhCH2–Co(dmg)2(H2O)] 4565
[Me–Co(DOH)2(H2O)] 4630 [Et–Co(DOH)2(H2O)] 4660[Et–Co(DOH)2(H2O)] 4660 [Et–Co(DOH)2(benzim)] 4270[Pr–Co(DOH)2(H2O)] 4670 [Et–Co(DOH)2(5,6-Me2–benzim)] 4250[i-Pr–Co(DOH)2(H2O)] 4905 [Et–Co(DOH)2(im)] 4140[PhCH2–Co(DOH)2(H2O)] 5090 [Et–Co(DOH)2(Me-im)] 4130
[Et–Co(DOH)2(py)] 4140
[Me–Co(dmgBF2)2(H2O)] 3888 [Co(dmgBF2)2(H2O)2]a 5652
[Et–Co(dmgBF2)2(H2O)] 3898 Compound 6a 5401[Pr–Co(dmgBF2)2(H2O)] 3912[Bu–Co(dmgBF2)2(H2O)] 3915[i-Pr–Co(dmgBF2)2(H2O)] 4094[PhCH2–Co(dmgBF2)2(H2O)] 4264
a This work.dmg = dimethylglyoximato. DOH = 2,3,9,10-tetramethyl-1,4,8,11-tetraazaundeca-1,3,8,10-tetraen-11-ol-1-olato. dmgBF2 =difluoroborondimethylglyoximato. DOBF2 = BF2-capped version of DOH.
13066 | Dalton Trans., 2012, 41, 13060–13073 This journal is © The Royal Society of Chemistry 2012
Dow
nloa
ded
by U
nive
rsity
of
Sout
hern
Mis
siss
ippi
on
25 O
ctob
er 2
012
Publ
ishe
d on
11
Apr
il 20
12 o
n ht
tp://
pubs
.rsc
.org
| do
i:10.
1039
/C2D
T30
309D
View Online

production was observed under the same conditions. A solutioncontaining compound 5 and [Co(dmgBF2)2(H2O)2] as separatecompounds produced H2 at a slow rate of approximately 8 μLmin−1 which proves that the supramolecular complex (compound6) with the sensitizer covalently coupled to the catalytic centreoffers a more efficient electron transfer. The graphs in Fig. 8display the absolute amount of H2 produced in the reactorfor compounds 6 and 8 as well as compound 5 plus [Co-(dmgBF2)2(H2O)2] as separate species.
The turnover frequency is lower than those reported forsimilar cobaloximes. Fihri et al.13 achieved 32 turnovers duringthe first hour and then observed a declined rate of 7–8 h−1 inacetone; while Li et al. reported a TON of 48 over 8 h of illumi-nation.13,41 However, comparing catalyst performance acrosslaboratories using different experimental set-ups is difficult. Inparticular, the photon flux of the illumination source has to betaken into consideration.
The low vapour Hg lamp used for photocatalysis emits fourdiscrete wavelengths with a total photon flux of 1 × 10¹⁶ s−1
cm−2 (see material section for lamp and calculation details) and5 mW cm−2 total irradiance. Fihri et al.13 and Li et al.41 used a
150 W or 500 W illumination source, respectively. The com-monly used 1.5 AM standard light source emits a continuum andprovides a total irradiance of 100 mW cm−2. Based on the totalphoton flux in our experiment, a H2 quantum yield of 2.2% wasestimated. The results also indicate that the sacrificial electrondonor significantly affects the H2 evolution rate making an inde-pendent evaluation of catalyst performance based solely on cata-lytic rate difficult.
Table 4 Electrochemical data for compounds 6–8
Complex E12/V Assignment
6 +1.32 RuIII/II
−0.45 CoII/I
−0.98 L-pyr0/−
−1.16 L-pyr−/−
−1.27 CoI/0
−1.44 pbt0/−
7 +1.29 RuIII/II
−0.45 CoII/I
8 +1.40 RuIII/II
−0.45 CoII/I
Fig. 6 Cyclic voltammograms of compounds 6–8 in CH3CN.[complex] = 1.0 mM, supporting electrolyte = 0.1 mM tetra-n-butylam-monium hexafluorophosphate (TBAP). All cyclic voltammometricmeasurements were carried out with a three-electrode system consistingof a working electrode = glassy carbon, a platinum wire auxiliary elec-trode, and reference electrode = Ag/AgCl. Scan rate = 100 mV s−1.
Fig. 5 ESR spectra for 5 [Co(dmgBF2)2(H2O)2] and compounds 6–8in DMSO at 4 K.
This journal is © The Royal Society of Chemistry 2012 Dalton Trans., 2012, 41, 13060–13073 | 13067
Dow
nloa
ded
by U
nive
rsity
of
Sout
hern
Mis
siss
ippi
on
25 O
ctob
er 2
012
Publ
ishe
d on
11
Apr
il 20
12 o
n ht
tp://
pubs
.rsc
.org
| do
i:10.
1039
/C2D
T30
309D
View Online

Photochemical studies
Photochemical studies were carried out on compounds 5 and 6.In Fig. 9, the steady-state photoluminescence of compound 6(blue line) is compared to that of compound 5 (black line). Thedifference in area suggests a quenching factor of approximately2.4. In order to observe an intra-molecular electron transfer, tri-ethylamine (Et3N) was added to the reaction solution as a sacri-ficial electron donor. A Stern–Volmer analysis revealed a linear
relationship between the concentration of Et3N and the lifetimeof the excited *Ru(II), where we determined a quenching rate fortriethylamine of kq = 3400 ± 160 M−1 s−1.
The strong photoluminescence of the compounds limited theobservation wavelengths for transient absorption (TA) measure-ments to a maximum of 590 nm. After performing preliminaryexperiments, TA probe wavelengths of 420, 530 and 590 nmwere chosen. At each wavelength, a series of three experimentswere performed: First, absorption measurements were measuredfor either compound alone (catalyst or precursor) at a concen-tration of 100 μM. In the next step Et3N was added as electronsource in a sufficient amount to observe quenching (>1 M), andfinally p-cyanoanilium tetrafluoroborate was added as a protonsource at a concentration of 26 mM. The reagents were addedwithout exposure to air using a custom-made cuvette describedin the method section. In addition to the transient absorptionmeasurements, steady-state UV-visible absorption spectra weretaken before and after each experiment.
Fig. 10a displays the TA over 8 μs following excitation forcompound 6 on the right and compound 5 on the left for thethree selected observation wavelengths. In the absence of Et3N itwas observed that the fast decay of *Ru(II) was observed at420 nm (top graph, black or blue line, respectively). In the pres-ence of Et3N, but absence of a proton source, the catalyst showsa long-lived absorption emerging rapidly after excitation (redline). We attributed this to the formation and stabilization ofRu(II)–BL–Co(I) species originating from *Ru(II)–BL–Co(II) thatbecomes Ru(III)–BL–Co(I). Ru(III)–BL–Co(I) then reacts withEt3N to form Ru(II)–BL–Co(I). With no electron donor orwithout the Co(II) moiety, this species does not exist, and conse-quently no TA is observed in compound 5 even in the presenceof Et3N. The absorption remains infinitely under anaerobicconditions.
As shown in the second graph from the top, a long-lived TA isobserved occurring at 530 nm in both compounds in the pres-ence of Et3N. Since compound 5 lacks a Co(II) metal centre, thisabsorption is likely caused by electron transfer to the organicligands, in particular when no proton source is available toaccept the electrons. This absorption band can offer insight intothe stability and efficiency of the catalyst. As will be discussedlater, the transient absorption disappears upon the addition of aproton source.
Fig. 8 Photocatalytic H2 production in acidic acetonitrile containing300 μM of each complex (compounds 5, 6, and 8), 85 mM Et3N plus41–55 mM p-cyanoanilinium tetrafluoroborate, or 440 mM (EtOH)3Nplus 136 mM p-cyanoanilinium tetrafluoroborate, respectively.
Fig. 9 Steady-state photoluminescence (PL) spectra of 117 μM ofcompound 5 (black) and 102 μM of compound 6 (blue), normalized totheir respective sample concentrations.
Fig. 7 Cyclic voltammograms involving electrocatalysis with com-pound 6 in CH3CN. [complex] = 1.0 mM, supporting electrolyte =0.1 mM tetra-n-butylammonium hexafluorophosphate (TBAP). Allcyclic voltammometric measurements were carried out with a three-elec-trode system consisting of a working electrode = glassy carbon, a plati-num wire auxiliary electrode, and reference electrode = Ag/AgCl. Scanrate = 100 mV s−1. [p-cyanoanilinium tetrafluoroborate] = 0, 1.5, 3.0,5.0, and 10.0 mM for each acquired CV.
13068 | Dalton Trans., 2012, 41, 13060–13073 This journal is © The Royal Society of Chemistry 2012
Dow
nloa
ded
by U
nive
rsity
of
Sout
hern
Mis
siss
ippi
on
25 O
ctob
er 2
012
Publ
ishe
d on
11
Apr
il 20
12 o
n ht
tp://
pubs
.rsc
.org
| do
i:10.
1039
/C2D
T30
309D
View Online
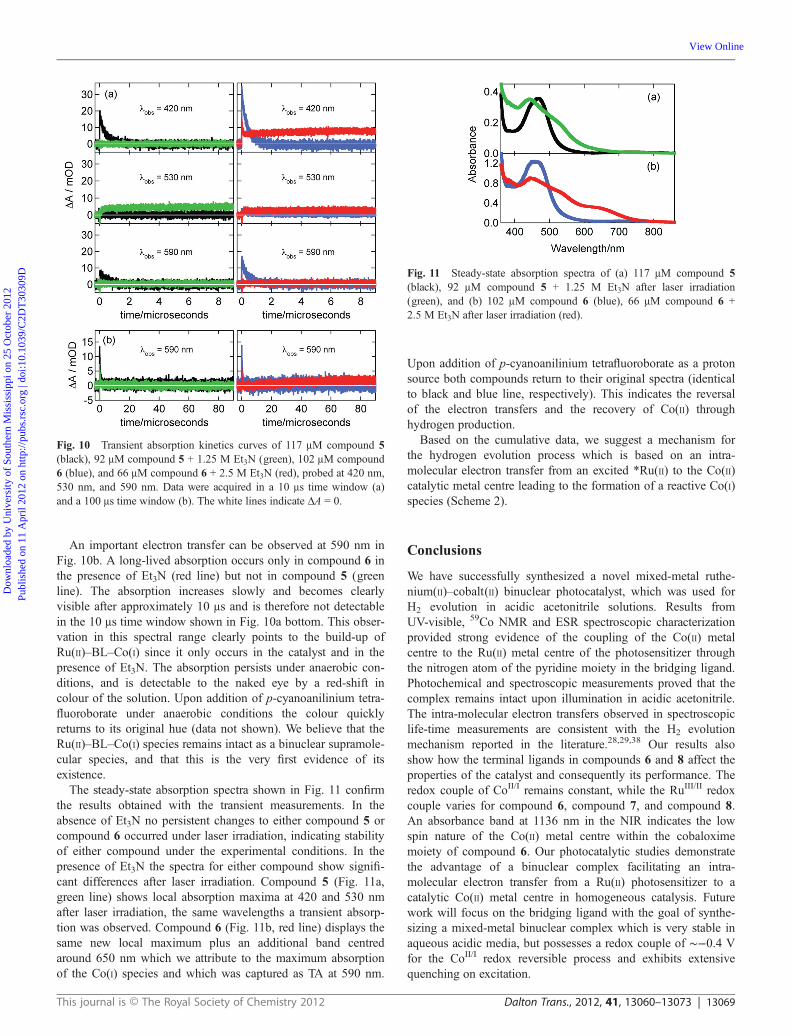
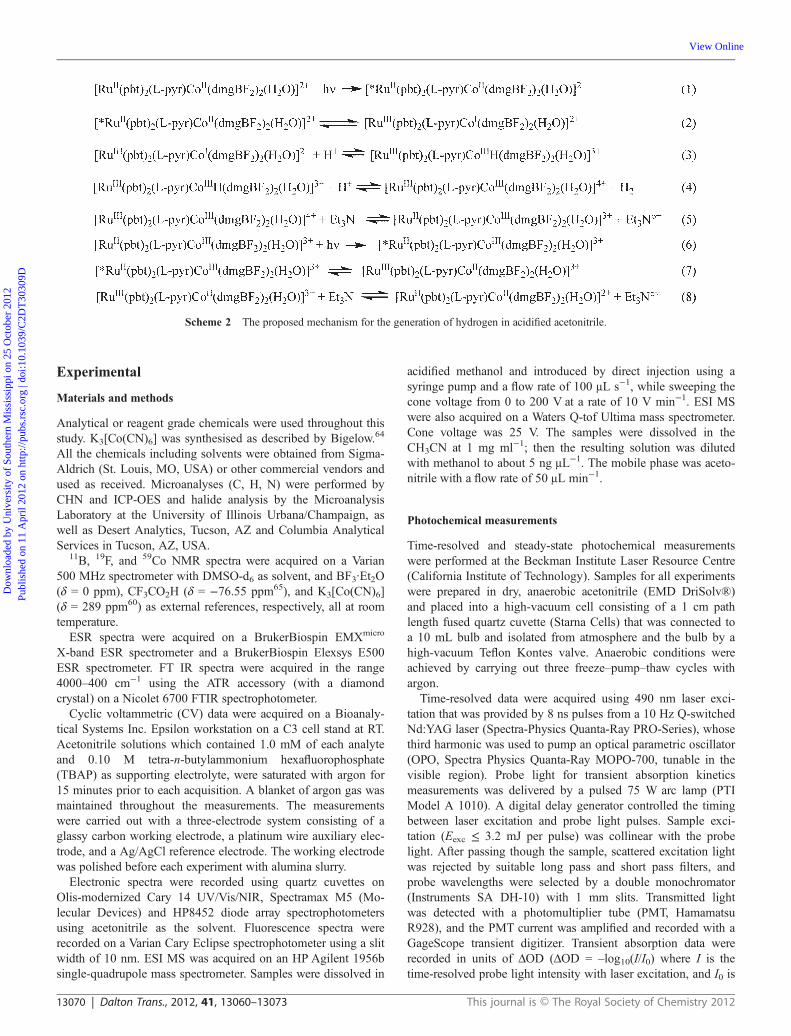
An important electron transfer can be observed at 590 nm inFig. 10b. A long-lived absorption occurs only in compound 6 inthe presence of Et3N (red line) but not in compound 5 (greenline). The absorption increases slowly and becomes clearlyvisible after approximately 10 μs and is therefore not detectablein the 10 μs time window shown in Fig. 10a bottom. This obser-vation in this spectral range clearly points to the build-up ofRu(II)–BL–Co(I) since it only occurs in the catalyst and in thepresence of Et3N. The absorption persists under anaerobic con-ditions, and is detectable to the naked eye by a red-shift incolour of the solution. Upon addition of p-cyanoanilinium tetra-fluoroborate under anaerobic conditions the colour quicklyreturns to its original hue (data not shown). We believe that theRu(II)–BL–Co(I) species remains intact as a binuclear supramole-cular species, and that this is the very first evidence of itsexistence.
The steady-state absorption spectra shown in Fig. 11 confirmthe results obtained with the transient measurements. In theabsence of Et3N no persistent changes to either compound 5 orcompound 6 occurred under laser irradiation, indicating stabilityof either compound under the experimental conditions. In thepresence of Et3N the spectra for either compound show signifi-cant differences after laser irradiation. Compound 5 (Fig. 11a,green line) shows local absorption maxima at 420 and 530 nmafter laser irradiation, the same wavelengths a transient absorp-tion was observed. Compound 6 (Fig. 11b, red line) displays thesame new local maximum plus an additional band centredaround 650 nm which we attribute to the maximum absorptionof the Co(I) species and which was captured as TA at 590 nm.
Upon addition of p-cyanoanilinium tetrafluoroborate as a protonsource both compounds return to their original spectra (identicalto black and blue line, respectively). This indicates the reversalof the electron transfers and the recovery of Co(II) throughhydrogen production.
Based on the cumulative data, we suggest a mechanism forthe hydrogen evolution process which is based on an intra-molecular electron transfer from an excited *Ru(II) to the Co(II)catalytic metal centre leading to the formation of a reactive Co(I)species (Scheme 2).
Conclusions
We have successfully synthesized a novel mixed-metal ruthe-nium(II)–cobalt(II) binuclear photocatalyst, which was used forH2 evolution in acidic acetonitrile solutions. Results fromUV-visible, 59Co NMR and ESR spectroscopic characterizationprovided strong evidence of the coupling of the Co(II) metalcentre to the Ru(II) metal centre of the photosensitizer throughthe nitrogen atom of the pyridine moiety in the bridging ligand.Photochemical and spectroscopic measurements proved that thecomplex remains intact upon illumination in acidic acetonitrile.The intra-molecular electron transfers observed in spectroscopiclife-time measurements are consistent with the H2 evolutionmechanism reported in the literature.28,29,38 Our results alsoshow how the terminal ligands in compounds 6 and 8 affect theproperties of the catalyst and consequently its performance. Theredox couple of CoII/I remains constant, while the RuIII/II redoxcouple varies for compound 6, compound 7, and compound 8.An absorbance band at 1136 nm in the NIR indicates the lowspin nature of the Co(II) metal centre within the cobaloximemoiety of compound 6. Our photocatalytic studies demonstratethe advantage of a binuclear complex facilitating an intra-molecular electron transfer from a Ru(II) photosensitizer to acatalytic Co(II) metal centre in homogeneous catalysis. Futurework will focus on the bridging ligand with the goal of synthe-sizing a mixed-metal binuclear complex which is very stable inaqueous acidic media, but possesses a redox couple of ∼−0.4 Vfor the CoII/I redox reversible process and exhibits extensivequenching on excitation.
Fig. 11 Steady-state absorption spectra of (a) 117 μM compound 5(black), 92 μM compound 5 + 1.25 M Et3N after laser irradiation(green), and (b) 102 μM compound 6 (blue), 66 μM compound 6 +2.5 M Et3N after laser irradiation (red).
Fig. 10 Transient absorption kinetics curves of 117 μM compound 5(black), 92 μM compound 5 + 1.25 M Et3N (green), 102 μM compound6 (blue), and 66 μM compound 6 + 2.5 M Et3N (red), probed at 420 nm,530 nm, and 590 nm. Data were acquired in a 10 μs time window (a)and a 100 μs time window (b). The white lines indicate ΔA = 0.
This journal is © The Royal Society of Chemistry 2012 Dalton Trans., 2012, 41, 13060–13073 | 13069
Dow
nloa
ded
by U
nive
rsity
of
Sout
hern
Mis
siss
ippi
on
25 O
ctob
er 2
012
Publ
ishe
d on
11
Apr
il 20
12 o
n ht
tp://
pubs
.rsc
.org
| do
i:10.
1039
/C2D
T30
309D
View Online
Experimental
Materials and methods
Analytical or reagent grade chemicals were used throughout thisstudy. K3[Co(CN)6] was synthesised as described by Bigelow.64
All the chemicals including solvents were obtained from Sigma-Aldrich (St. Louis, MO, USA) or other commercial vendors andused as received. Microanalyses (C, H, N) were performed byCHN and ICP-OES and halide analysis by the MicroanalysisLaboratory at the University of Illinois Urbana/Champaign, aswell as Desert Analytics, Tucson, AZ and Columbia AnalyticalServices in Tucson, AZ, USA.
11B, 19F, and 59Co NMR spectra were acquired on a Varian500 MHz spectrometer with DMSO-d6 as solvent, and BF3·Et2O(δ = 0 ppm), CF3CO2H (δ = −76.55 ppm65), and K3[Co(CN)6](δ = 289 ppm60) as external references, respectively, all at roomtemperature.
ESR spectra were acquired on a BrukerBiospin EMXmicro
X-band ESR spectrometer and a BrukerBiospin Elexsys E500ESR spectrometer. FT IR spectra were acquired in the range4000–400 cm−1 using the ATR accessory (with a diamondcrystal) on a Nicolet 6700 FTIR spectrophotometer.
Cyclic voltammetric (CV) data were acquired on a Bioanaly-tical Systems Inc. Epsilon workstation on a C3 cell stand at RT.Acetonitrile solutions which contained 1.0 mM of each analyteand 0.10 M tetra-n-butylammonium hexafluorophosphate(TBAP) as supporting electrolyte, were saturated with argon for15 minutes prior to each acquisition. A blanket of argon gas wasmaintained throughout the measurements. The measurementswere carried out with a three-electrode system consisting of aglassy carbon working electrode, a platinum wire auxiliary elec-trode, and a Ag/AgCl reference electrode. The working electrodewas polished before each experiment with alumina slurry.
Electronic spectra were recorded using quartz cuvettes onOlis-modernized Cary 14 UV/Vis/NIR, Spectramax M5 (Mo-lecular Devices) and HP8452 diode array spectrophotometersusing acetonitrile as the solvent. Fluorescence spectra wererecorded on a Varian Cary Eclipse spectrophotometer using a slitwidth of 10 nm. ESI MS was acquired on an HP Agilent 1956bsingle-quadrupole mass spectrometer. Samples were dissolved in
acidified methanol and introduced by direct injection using asyringe pump and a flow rate of 100 μL s−1, while sweeping thecone voltage from 0 to 200 V at a rate of 10 V min−1. ESI MSwere also acquired on a Waters Q-tof Ultima mass spectrometer.Cone voltage was 25 V. The samples were dissolved in theCH3CN at 1 mg ml−1; then the resulting solution was dilutedwith methanol to about 5 ng μL−1. The mobile phase was aceto-nitrile with a flow rate of 50 μL min−1.
Photochemical measurements
Time-resolved and steady-state photochemical measurementswere performed at the Beckman Institute Laser Resource Centre(California Institute of Technology). Samples for all experimentswere prepared in dry, anaerobic acetonitrile (EMD DriSolv®)and placed into a high-vacuum cell consisting of a 1 cm pathlength fused quartz cuvette (Starna Cells) that was connected toa 10 mL bulb and isolated from atmosphere and the bulb by ahigh-vacuum Teflon Kontes valve. Anaerobic conditions wereachieved by carrying out three freeze–pump–thaw cycles withargon.
Time-resolved data were acquired using 490 nm laser exci-tation that was provided by 8 ns pulses from a 10 Hz Q-switchedNd:YAG laser (Spectra-Physics Quanta-Ray PRO-Series), whosethird harmonic was used to pump an optical parametric oscillator(OPO, Spectra Physics Quanta-Ray MOPO-700, tunable in thevisible region). Probe light for transient absorption kineticsmeasurements was delivered by a pulsed 75 W arc lamp (PTIModel A 1010). A digital delay generator controlled the timingbetween laser excitation and probe light pulses. Sample exci-tation (Eexc ≤ 3.2 mJ per pulse) was collinear with the probelight. After passing though the sample, scattered excitation lightwas rejected by suitable long pass and short pass filters, andprobe wavelengths were selected by a double monochromator(Instruments SA DH-10) with 1 mm slits. Transmitted lightwas detected with a photomultiplier tube (PMT, HamamatsuR928), and the PMT current was amplified and recorded with aGageScope transient digitizer. Transient absorption data wererecorded in units of ΔOD (ΔOD = –log10(I/I0) where I is thetime-resolved probe light intensity with laser excitation, and I0 is
Scheme 2 The proposed mechanism for the generation of hydrogen in acidified acetonitrile.
13070 | Dalton Trans., 2012, 41, 13060–13073 This journal is © The Royal Society of Chemistry 2012
Dow
nloa
ded
by U
nive
rsity
of
Sout
hern
Mis
siss
ippi
on
25 O
ctob
er 2
012
Publ
ishe
d on
11
Apr
il 20
12 o
n ht
tp://
pubs
.rsc
.org
| do
i:10.
1039
/C2D
T30
309D
View Online

the probe light intensity without laser excitation). Samples werecontinuously stirred. Data were averaged over approximately1000 shots.
Time-resolved photoluminescence was recorded on the samehome-built instrument using the same laser excitation but noprobe light. The monochromator was used to select 700 nmemitted light that was detected with the same detection setupdescribed above and recorded as emission intensity.
Photoluminescence lifetimes of the excited *Ru(II) statewere obtained as a function of Et3N concentration in order todetermine the quenching rate by Et3N by Stern–Volmer analysis.The quenching rate kq was calculated using the Stern–Volmerequation (τ0/τ = 1 + kq[Q], where τ0 is the intrinsic lifetime,τ is the lifetime with quencher present, and [Q] is the quen-cher concentration). All instruments and electronics for time-resolved measurements were controlled by software writtenin LabVIEW (National Instruments). MATLAB R2007a(Mathworks, Inc.) was used for data conversion, while dataanalysis and graphing was performed using Igor Pro 5.05A(Wavemetrics).
Steady-state UV-visible absorption spectra were recorded in1 cm path length quartz cuvettes using a Hewlett Packard 8452spectrophotometer. Steady-state photoluminescence data wereacquired in 1 cm path length quartz cuvettes using a Jobin YvonSpec Fluorolog-3–11 fluorimeter. A xenon arc lamp with wave-length selection provided by a monochromator was used forsample excitation at 490 nm. Right angle emission was selectedwith a monochromator and detected with a Hamamatsu R928Pphotomultiplier tube with photon counting.
Photocatalysis
Hydrogen evolution was quantified in a borosilicate immersionwell containing two sample ports that were sealed with septa.The illumination was performed from the centre of the wellusing a Hg immersion lamp (Pen-ray model 11SC-1, UVP). TheUV portion of the Hg emission spectrum was filtered by theborosilicate reactor so that only the Hg emission lines at 312,365, 404.7 and 435.8 nm were used for illumination. The reactorwas filled with 18 mL acetonitrile containing 85 mM triethyl-amine as sacrificial electron donor and 55 mM p-cyanoaniliniumtetrafluoroborate as a proton source. The complex concentrationwas 300 μM. The solution was flushed with nitrogen before illu-mination began. Gas samples of 50 μL were taken periodicallythrough the septum using a gas tight syringe and analyzed on aGC equipped with a thermal conductivity detector (Agilent6890). Hydrogen was identified by its retention time and quan-tified on an RT-Molsieve column 15 m × 0.32 mm × 30 μm(Restek) using argon as carrier gas. A calibration of hydrogenwas performed by injecting known amounts of hydrogen gasinto an airtight vial of the same volume as the reaction vesseland filled with acetonitrile (18 mL) to account for the fractionthat dissolves in the solvent. That way the absolute amountof hydrogen evolved in the reaction vessel could be determined.The detection limit for H2 in the headspace of the reactorwas 5 μL. The oxygen concentration was also monitored inorder to detect leakage of the reactor. Control experimentswere performed under the same conditions but omitting thephotocatalyst.
Estimation of catalyst performance
In order to estimate catalyst performance, the total photon flux[photons s−1)] of the illumination source was calculated usingthe following formula:
ϕ ¼ Pðλ1Þ λ1hcþ Pðλ2Þ λ2hc� �
a
where P = the measured power density of the lamp in W cm−2,λ = the wavelength in metres, h = the Planck’s constant, c = thespeed of light, and a = the illuminated area of the lamp (11 cm2).
The intensity over 312 and 365 nm was measured using anOAI 308 power meter (OAI San Jose, CA, USA) and for theintensity over 405 and 436 nm an Orion PD (Ophir Optronics)was used. The measured values were 2 and 3 mW cm−2, respect-ively. However, only 50% of the photons at 405 and 436 nmwere absorbed by the catalyst whereas the absorption at 312 and365 nm was ∼90% as determined by power attenuation throughthe catalyst solution.
Taking this into account, the resulting total photon flux thereaction solution received was 7 × 10¹⁶ s−1. Since two photonsare required for one H2 molecule, the theoretical maximum H2
yield based on the photon flux would be
nH2 ¼ ϕ
2NA¼ 7� 1016
2� 6:022� 1023¼ 60 nmol s�1
or 89 μL min−1 at standard conditions. The average H2 evolutionmeasured for compound 6 using Et3N was 2 μL min−1, giving ayield of 2.2%.
Synthesis of ligands and complexes
Synthesis of 2-(2-pyridyl)benzthiazole (pbt), 1 and [Co(dmgBF2)-(H2O)2]. (Pyridine-2yl)benzo[d]thiazole (pbt) was synthesisedas reported by Gangopadhyay et al.,66 while [Co(dmgBF2)2-(H2O)2] was synthesized as by Bakac and Espenson.67
Synthesis of the complexes
Compounds 7 and 8 were prepared following the procedure ofHorne et al.42
Synthesis of [Ru(pbt)2Cl2]·0.25CH3COCH3, 2. RuCl3·xH2O(1.55 g, 7.46 mmol), pbt (3.17 g, 14.9 mmol) and LiCl (4 g,94.4 mmol) were added to a 100 ml round bottom flask, fol-lowed by DMF (40 ml). The mixture was refluxed under argonfor nine hours; then cooled. The reaction mixture was rotaryevaporated to a minimum volume; then acetone–water 1 : 1 v/v(400 ml) was added to the mixture. The resulting mixture wascooled in an ice bath; then filtered. The residue was washedthoroughly with water and air dried. Yield = 4.45 g (98%). Calc.for C24.75H17.5Cl2N4O0.25RuS2, C, 48.65; H, 2.89; N, 9.17.Found: C, 49.22; H, 2.97; N, 9.68.
Synthesis of [Ru(pbt)2(phendione)](PF6)2·4H2O 4. A mixtureof [Ru(pbt)2Cl)2]·0.25CH3COCH3, 2 (2.80 g, 4.58 mmol), 1,10-phenanthroline-5,6-phendione (phendione), 3 (1.184 g, 5.64 mmol),and 1 : 1 EtOH–H2O (400 ml) were degassed with argon fortwenty minutes; then refluxed under argon for 25 hours. The
This journal is © The Royal Society of Chemistry 2012 Dalton Trans., 2012, 41, 13060–13073 | 13071
Dow
nloa
ded
by U
nive
rsity
of
Sout
hern
Mis
siss
ippi
on
25 O
ctob
er 2
012
Publ
ishe
d on
11
Apr
il 20
12 o
n ht
tp://
pubs
.rsc
.org
| do
i:10.
1039
/C2D
T30
309D
View Online
reaction mixture was cooled to room temperature; then filteredsaturated aqueous KPF6 (400 ml) and NH4PF6 (8.0 g) wereadded to precipitate the product. The mixture was filtered; andthe residue was washed with plenty of water and air-dried. Theproduct was dissolved in the minimum volume of acetonitrile;then the solution was filtered. The filtrate was collected and theproduct was precipitated with diethyl ether, leaving a solid.Yield = 4.58 g (91%). Calc. for C36H30F12N6O6P2RuS2: C,39.39; H, 2.75; N, 7.66; S, 5.84; Ru, 9.21. Found: C, 39.59;H, 1.95; N, 7.34; S, 6.05; Ru, 9.14. m/z (ESI, positive mode):368.0 (100%, [M − 2PF6]
2+) and 881.0 (100%, [M − PF6]+).
High resolution ESI MS: m/z = 880.9938. FT IR (ν/cm−1):1699.10 (S) (CvO) and 827.91 (VS) (PF6
−). UV-visible spec-trum (CH3CN), λmax./nm (10−3 ε/M−1 cm−1): 248 (36), 306(39), 334 sh (31, 458 (12), and 947 (0.082).
Synthesis of [Ru(pbt)2(L-pyr)](PF6)2·9.5H2O, 5. A mixture of[Ru(pbt)2(phendione)](PF6)2·4H2O, 4 (1.65 g, 1.50 mmol),ammonium acetate (2.38 g, 32.20 mmol) and 4-pyridinecarbox-aldehyde (460 μl, 4.80 mmol) in glacial acetic acid (250 ml) wasrefluxed at 120 °C for 18 hours. The following day the solutionwas cooled to room temperature and diluted with water(500 ml). It is then neutralized to pH 7 with concentratedaqueous ammonia changing reddish-orange in appearance. Therewas an addition of aqueous KPF6 solution (400 ml) and NH4PF6(7.0 g) was added and a red precipitate is obtained. It was thenfiltered and the residue washed with water and air dried. Afterdrying, the crude was dissolved with MeCN; then the resultingsolution was purified on an alumina column by using MeCN asan eluent. Yield of product = 1.69 g (88%). Calc. forC42H45F12N8O10.5P2RuS2, C, 39.26; H, 3.53; N, 8.72; Ru, 7.87;S, 4.99. Found: C, 39.26; H, 2.33; N, 8.65; Ru, 7.26; S, 4.81.m/z (ESI, positive mode): 412.0 (100%, [M − 2PF6]
2+) and969.0 (100%, [M − PF6]
+). High resolution ESI MS: m/z =969.0368. FT IR (ν/cm−1): 1603.70 (m) (CvN) and 827.73(VS) (PF6
−). UV-visible spectrum (CH3CN), λmax./nm (10−3
ε/M−1 cm−1): 280 (67), 312 (58), 466 (19), and 723 (0.36).
Synthesis of [Ru(pbt)2(L-pyr)Co(dmgBF2)2(H2O)](PF6)2·11H2O·1.5CH3COCH3, 6. [Co(dmgBF2)2(H2O)2] (0.118 g, 0.28 mmol)and [Ru(pbt)2(L-pyr)](PF6)2·9.5H2O, 5 (0.3598 g, 0.28 mmol),along with acetone (100 ml) were mixed in a 250 ml roundbottom flask. The mixture was stirred at room temperature forthree hours; then rotary evaporated to dryness. The resultingsolid was washed thoroughly with diethyl ether; then air-dried.Yield = 0.4554 g (90%). Calc. For C54.5H71B2CoF16N12O18.5-P2RuS2, C, 36.33; H, 3.97; Co, 3.27; N, 9.33; Ru, 5.61; S, 3.56.Found: C, 36.46; H, 2.8; Co, 2.92; N, 9.36; Ru, 5.34; S, 3.72.An ESI mass spectrum was acquired for compound 6, which wasfound to be very unstable in the chamber of the mass spectro-meter. The mass spectrum showed the presence of the followingspecies: m/z (ESI): 412.0 (100%, [M − 2PF6 − Co(dmgBF2)2-(H2O)]
2+), 969.0 (100%, [M − PF6 − Co(dmgBF2)2(H2O)]+).
[Co(dmgBF2)2(H2O)2 + H]+ was also detected in the massspectrometer. FT IR (ν/cm−1): 1614.14 (m) (CvN), 1161.09 (S)(B–F), and 823.43 (VS) (B–F and PF6
−). UV-visible spectrum(CH3CN), λmax./nm (10−3 ε/M−1 cm−1): 280 (52), 312 (44), 464(15), 720 (0.399), and 1136 (0.101). δB (500 MHz; DMSO-d6):0.66, 1.47, 2.98, and 37.95 ppm; δF (500 MHz; DMSO-d6):
−148.4, −146.3, −145.9, −145.6, and −143.8 ppm; and δCo(500 MHz; DMSO-d6): 5401 ppm.
Acknowledgements
This research was supported in part by an appointment to theStudent Research Participation Program at the U.S. Army Engi-neer Research and Development Center, Construction EngineeringResearch Laboratory, administered by the Oak Ridge Institute forScience and Education through an interagency agreementbetween the U.S. Department of Energy and ERDC-CERL. Thiswork was also supported by the Center Directed ResearchProgram at the U.S. Army Corps of Engineers, the Arnold andMabel Beckman Foundation, The Mississippi LSAMP (grant#HRD-0602740), and by the Mississippi INBRE funded bygrants from the National Center for Research Resources(5P20RR016476-11) and the National Institute of GeneralMedical Sciences (8 P20 GM103476-11) from the National Insti-tutes of Health. The authors also acknowledge the NationalScience Foundation (NSF) for funding our ESI and MALDI-ToFmass spectrometers (Grant CHE 0639208). We are also gratefulfor the use of our BrukerBiospin EMXmicro ESR spectrometer,which was funded by the NSF CRIF:MU Award #0741991; alsoour new 400 MHZ NMR spectrometer, which was funded by theNSF CRIF:MU Award #0840390. AAH would like to thank theNSF for an NSF CAREER Award; also this material is basedupon work supported by the NSF under CHE - 1151832. Theauthors would like to acknowledge the scientists at Olis, Inc. foracquiring all of the NIR spectra on their Olis-modernized Cary14 UV/Vis/NIR spectrophotometer.
We also acknowledge Dr Aimin Liu and Ms. Fange Liu ofGeorgia State University for their assistance in acquiring twoESR spectra for us in liquid helium. D.C.H. and T.H. would liketo thank Dr Karen Mulfort of Argonne National Laboratory(ANL) for her assistance during their summer research stint insummer 2009 at ANL.
Notes and references
1 N. Armaroli and V. Balzani, Angew. Chem., Int. Ed., 2007, 46, 52–66.2 R. Eisenberg and D. G. Nocera, Inorg. Chem., 2005, 44, 6799–6801.3 H. B. Gray, Nat. Chem., 2009, 1, 112.4 M. I. Hoffert, K. Caldeira, A. K. Jain, E. F. Haites, L. D. D. Harvey,S. D. Potter, M. E. Schlesinger, S. H. Schneider, R. G. Watts,T. M. L. Wigley and D. J. Wuebbles, Nature, 1998, 395, 881–884.
5 W. Lubitz and W. Tumas, Chem. Rev., 2007, 107, 3900–3903.6 R. F. Service, Science, 2005, 309, 548–551.7 J. L. Dempsey, A. J. Esswein, D. R. Manke, J. Rosenthal, J. D. Soper andD. G. Nocera, Inorg. Chem., 2005, 44, 6879–6892.
8 P. Du, K. Knowles and R. Eisenberg, J. Am. Chem. Soc., 2008, 130,12576–12577.
9 A. J. Esswein and D. G. Nocera, Chem. Rev., 2007, 107, 4022–4047.10 R. B. Gordon, M. Bertram and T. E. Graedel, Proc. Natl. Acad.
Sci. U. S. A., 2006, 103, 1209–1214.11 M. Elvington, J. Brown, S. M. Arachchige and K. J. Brewer, J. Am.
Chem. Soc., 2007, 129, 10644–10645.12 A. Fihri, V. Artero, A. Pereira and M. Fontecave, Dalton Trans., 2008,
5567–5569.13 A. Fihri, V. Artero, M. Razavet, C. Baffert, W. Leibl and M. Fontecave,
Angew. Chem., Int. Ed., 2008, 47, 564–567.14 J. R. Fisher and D. J. Cole-Hamilton, J. Chem. Soc., Dalton Trans., 1984,
809–813.15 J. Hawecker, J. M. Lehn and R. Ziessel, Nouv. J. Chim., 1983, 7,
271–277.
13072 | Dalton Trans., 2012, 41, 13060–13073 This journal is © The Royal Society of Chemistry 2012
Dow
nloa
ded
by U
nive
rsity
of
Sout
hern
Mis
siss
ippi
on
25 O
ctob
er 2
012
Publ
ishe
d on
11
Apr
il 20
12 o
n ht
tp://
pubs
.rsc
.org
| do
i:10.
1039
/C2D
T30
309D
View Online

16 M. Wang, Y. Na, M. Gorlov and L. Sun, Dalton Trans., 2009,6458–6467.
17 G. M. Brown, B. S. Brunschwig, C. Creutz, J. F. Endicott and N. Sutin,J. Am. Chem. Soc., 1979, 101, 1298–1300.
18 C. V. Krishnan, B. S. Brunschwig, C. Creutz and N. Sutin, J. Am. Chem.Soc., 1985, 107, 2005–2015.
19 C. V. Krishnan and N. Sutin, J. Am. Chem. Soc., 1981, 103, 2141–2142.20 Z. Huang, Z. Luo, Y. V. Geletii, J. W. Vickers, Q. Yin, D. Wu, Y. Hou,
Y. Ding, J. Song, D. G. Musaev, C. L. Hill and T. Lian, J. Am. Chem.Soc., 2011, 133, 2068–2071.
21 N. S. McCool, D. M. Robinson, J. E. Sheats and G. C. Dismukes, J. Am.Chem. Soc., 2011, 133, 11446–11449.
22 S. Y. Reece, J. A. Hamel, K. Sung, T. D. Jarvi, A. J. Esswein,J. J. H. Pijpers and D. G. Nocera, Science, 2011, 334, 645–648.
23 X. Li, M. Wang, S. Zhang, J. Pan, Y. Na, J. Liu, B. Aakermark andL. Sun, J. Phys. Chem. B, 2008, 112, 8198–8202.
24 Y. Na, J. Pan, M. Wang and L. Sun, Inorg. Chem., 2007, 46, 3813–3815.25 Y. Na, M. Wang, J. Pan, P. Zhang, B. Akermark and L. Sun, Inorg.
Chem., 2008, 47, 2805–2810.26 B. E. Barton, M. T. Olsen and T. B. Rauchfuss, Curr. Opin. Biotechnol.,
2010, 21, 292–297.27 C. Baffert, V. Artero and M. Fontecave, Inorg. Chem., 2007, 46,
1817–1824.28 P. Connolly and J. H. Espenson, Inorg. Chem., 1986, 25, 2684–2688.29 J. L. Dempsey, B. S. Brunschwig, J. R. Winkler and H. B. Gray, Acc.
Chem. Res., 2009, 42, 1995–2004.30 J. L. Dempsey, J. R. Winkler and H. B. Gray, J. Am. Chem. Soc., 2010,
132, 16774–16776.31 J. L. Dempsey, J. R. Winkler and H. B. Gray, J. Am. Chem. Soc., 2010,
132, 1060–1065.32 L. Gong, J. Wang, H. Li, L. Wang, J. Zhao and Z. Zhu, Catal. Commun.,
2011, 12, 1099–1103.33 X. Hu, B. M. Cossairt, B. S. Brunschwig, N. S. Lewis and J. C. Peters,
Chem. Commun., 2005, 4723–4725.34 X. L. Hu, B. S. Brunschwig and J. C. Peters, J. Am. Chem. Soc., 2007,
129, 8988–8998.35 S. Losse, J. G. Vos and S. Rau, Coord. Chem. Rev., 2010, 254,
2492–2504.36 O. Pantani, E. Anxolabehere-Mallart, A. Aukauloo and P. Millet, Electro-
chem. Commun., 2006, 9, 54–58.37 B. Probst, C. Kolano, P. Hamm and R. Alberto, Inorg. Chem., 2009, 48,
1836–1843.38 M. Razavet, V. Artero and M. Fontecave, Inorg. Chem., 2005, 44,
4786–4795.39 P. Zhang, M. Wang, C. Li, X. Li, J. Dong and L. Sun, Chem. Commun.,
2010, 46, 8806–8808.
40 J. T. Muckerman and E. Fujita, Chem. Commun., 2011, 47.41 C. Li, M. Wang, J. Pan, P. Zhang, R. Zhang and L. Sun, J. Organomet.
Chem., 2009, 694, 2814–2819.42 T. Horne, D. C. Horton, O. Poluektov, D. M. Tiede and A. A. Holder,
2009, Unpublished work.43 A. Bilgin, B. Ertem and Y. Gok, Bull. Chem. Soc. Jpn., 2007, 80,
1549–1555.44 T. Ramasami and J. H. Espenson, Inorg. Chem., 1980, 19, 1523–1527.45 G. W. Wangila and R. B. Jordan, Inorg. Chim. Acta, 2005, 358,
3753–3760.46 J. Faus, M. Julve, F. Lloret and M. C. Munoz, Inorg. Chem., 1993, 32,
2013–2017.47 S. Kremer, W. Henke and D. Reinen, Inorg. Chem., 1982, 21,
3013–3022.48 G. Backes and D. Reinen, Z. Anorg. Allg. Chem., 1975, 418, 217–228.49 D. Reinen, A. Ozarowski, B. Jakob, J. Pebler, H. Stratemeier,
K. Wieghardt and I. Tolksdorf, Inorg. Chem., 1987, 26, 4010–4017.50 J. J. Alexander and H. B. Gray, J. Am. Chem. Soc., 1967, 89, 3356–3357.51 F.-D. Tsay, H. B. Gray and J. Danon, J. Chem. Phys., 1971, 54,
3760–3769.52 S. Shi, L. M. Daniels and J. H. Espenson, Inorg. Chem., 1991, 30, 3407.53 M. W. McCool, R. E. Marsh, D. M. Ingle and R. R. Gagne, Acta Crystal-
logr., Sect. B: Struct. Crystallogr. Cryst. Chem., 1981, B37, 935.54 L. A. Berben and J. C. Peters, Chem. Commun., 2010, 46, 398–400.55 W. von Philipsborn, Chem. Soc. Rev., 1999, 28, 95–105.56 R. K. Harris and B. E. Mann, NMR and the Periodic Table, Academic,
New York, 1970.57 F. Asaro, R. Gobetto, L. Liguori and G. Pellizer, Chem. Phys. Lett., 1999,
300, 414–420.58 A. Medek, V. Frydman and L. Frydman, Proc. Natl. Acad. Sci. U. S. A.,
1997, 94, 14237–14242.59 C. Tavagnacco, G. Balducci, G. Costa, K. Taeschler and W. Von Philipsborn,
Helv. Chim. Acta, 1990, 73, 1469–1480.60 T. Taura, Bull. Chem. Soc. Jpn., 1990, 63, 1105–1110.61 J. Harmer, S. Van Doorslaer, I. Gromov and A. Schweiger, Chem. Phys.
Lett., 2002, 358, 8–16.62 M. Rangel, T. Arcos and B. de Castro, Organometallics, 1999, 18,
3451–3456.63 M. Rangel, A. Leite, J. Gomes and B. de Castro, Organometallics, 2005,
24, 3500–3507.64 J. H. Bigelow, Inorg. Synth., 1946, 2, 225.65 http://chemnmr.colorado.edu/manuals/19F_NMR_Reference_Standards.
pdf66 J. Gangopadhyay, S. Sengupta, S. Bhattacharyya, I. Chakraborty and
A. Chakravorty, Inorg. Chem., 2002, 41, 2616–2622.67 A. Bakac and J. H. Espenson, J. Am. Chem. Soc., 1984, 106, 5197–5202.
This journal is © The Royal Society of Chemistry 2012 Dalton Trans., 2012, 41, 13060–13073 | 13073
Dow
nloa
ded
by U
nive
rsity
of
Sout
hern
Mis
siss
ippi
on
25 O
ctob
er 2
012
Publ
ishe
d on
11
Apr
il 20
12 o
n ht
tp://
pubs
.rsc
.org
| do
i:10.
1039
/C2D
T30
309D
View Online
Copyright © 2022 FDOKUMEN