
K b Hi ti Kebenaran Hipnotis (I) (I) , K K Rahasia Metode Pelatihan PakarHipnotis

PHYSICAL REVIEW D 71, 092003 (2005)
Dalitz analysis of the three-body charmless decays B� ! K����� and B� ! K�K�K�
A. Garmash,32 K. Abe,7 K. Abe,40 H. Aihara,42 M. Akatsu,20 Y. Asano,46 V. Aulchenko,1 T. Aushev,11 T. Aziz,38
S. Bahinipati,4 A. M. Bakich,37 Y. Ban,31 I. Bedny,1 U. Bitenc,12 I. Bizjak,12 S. Blyth,24 A. Bondar,1 A. Bozek,25
M. Bracko,7,18,12 J. Brodzicka,25 P. Chang,24 Y. Chao,24 A. Chen,22 K.-F. Chen,24 B. G. Cheon,3 R. Chistov,11 S.-K. Choi,5
Y. Choi,36 Y. K. Choi,36 A. Chuvikov,32 J. Dalseno,19 M. Danilov,11 M. Dash,47 L. Y. Dong,9 J. Dragic,19 A. Drutskoy,4
S. Eidelman,1 V. Eiges,11 Y. Enari,20 S. Fratina,12 N. Gabyshev,1 T. Gershon,7 G. Gokhroo,38 J. Haba,7 T. Hara,29
N. C. Hastings,7 K. Hayasaka,20 H. Hayashii,21 M. Hazumi,7 T. Higuchi,7 L. Hinz,16 T. Hokuue,20 Y. Hoshi,40 S. Hou,22
W.-S. Hou,24 T. Iijima,20 A. Imoto,21 K. Inami,20 A. Ishikawa,7 R. Itoh,7 M. Iwasaki,42 Y. Iwasaki,7 J. H. Kang,48
J. S. Kang,14 S. U. Kataoka,21 N. Katayama,7 H. Kawai,2 T. Kawasaki,27 H. R. Khan,43 H. Kichimi,7 H. J. Kim,15
J. H. Kim,36 S. K. Kim,35 S. M. Kim,36 K. Kinoshita,4 P. Koppenburg,7 S. Korpar,18,12 P. Krizan,17,12 P. Krokovny,1
R. Kulasiri,4 C. C. Kuo,22 A. Kuzmin,1 Y.-J. Kwon,48 T. Lesiak,25 J. Li,34 S.-W. Lin,24 D. Liventsev,11 G. Majumder,38
F. Mandl,10 D. Marlow,32 T. Matsumoto,44 A. Matyja,25 W. Mitaroff,10 H. Miyake,29 H. Miyata,27 R. Mizuk,11
D. Mohapatra,47 T. Mori,43 T. Nagamine,41 Y. Nagasaka,8 E. Nakano,28 M. Nakao,7 H. Nakazawa,7 Z. Natkaniec,25
S. Nishida,7 O. Nitoh,45 S. Ogawa,39 T. Ohshima,20 T. Okabe,20 S. Okuno,13 S. L. Olsen,6 W. Ostrowicz,25 H. Ozaki,7
P. Pakhlov,11 H. Palka,25 H. Park,15 N. Parslow,37 L. S. Peak,37 R. Pestotnik,12 L. E. Piilonen,47 A. Poluektov,1
M. Rozanska,25 H. Sagawa,7 Y. Sakai,7 N. Sato,20 T. Schietinger,16 O. Schneider,16 P. Schonmeier,41 J. Schumann,24
C. Schwanda,10 A. J. Schwartz,4 S. Semenov,11 K. Senyo,20 H. Shibuya,39 B. Shwartz,1 J. B. Singh,30 A. Somov,4
N. Soni,30 R. Stamen,7 S. Stanic,46 M. Staric,12 T. Sumiyoshi,44 S. Suzuki,33 S. Y. Suzuki,7 O. Tajima,7 F. Takasaki,7
K. Tamai,7 N. Tamura,27 M. Tanaka,7 Y. Teramoto,28 X. C. Tian,31 K. Trabelsi,6 T. Tsukamoto,7 S. Uehara,7 T. Uglov,11
K. Ueno,24 S. Uno,7 Y. Ushiroda,7 G. Varner,6 K. E. Varvell,37 S. Villa,16 C. C. Wang,24 C. H. Wang,23 M.-Z. Wang,24
M. Watanabe,27 Y. Watanabe,43 A. Yamaguchi,41 H. Yamamoto,41 Y. Yamashita,26 J. Ying,31 Y. Yusa,41 C. C. Zhang,9
L. M. Zhang,34 Z. P. Zhang,34 V. Zhilich,1 and D. Zontar17,12
(Belle Collaboration)
1Budker Institute of Nuclear Physics, Novosibirsk2Chiba University, Chiba
3Chonnam National University, Kwangju4University of Cincinnati, Cincinnati, Ohio 45221, USA
5Gyeongsang National University, Chinju6University of Hawaii, Honolulu, Hawaii 96822, USA
7High Energy Accelerator Research Organization (KEK), Tsukuba8Hiroshima Institute of Technology, Hiroshima
9Institute of High Energy Physics, Chinese Academy of Sciences, Beijing10Institute of High Energy Physics, Vienna
11Institute for Theoretical and Experimental Physics, Moscow12J. Stefan Institute, Ljubljana
13Kanagawa University, Yokohama14Korea University, Seoul
15Kyungpook National University, Taegu16Swiss Federal Institute of Technology of Lausanne, EPFL, Lausanne
17University of Ljubljana, Ljubljana18University of Maribor, Maribor
19University of Melbourne, Victoria20Nagoya University, Nagoya
21Nara Women’s University, Nara22National Central University, Chung-li23National United University, Miao Li
24Department of Physics, National Taiwan University, Taipei25H. Niewodniczanski Institute of Nuclear Physics, Krakow
26Nihon Dental College, Niigata27Niigata University, Niigata
28Osaka City University, Osaka29Osaka University, Osaka
30Panjab University, Chandigarh
1550-7998=2005=71(9)=092003(24)$23.00 092003-1 2005 The American Physical Society

A. GARMASH et al. PHYSICAL REVIEW D 71, 092003 (2005)
31Peking University, Beijing32Princeton University, Princeton, New Jersey 08544, USA33Saga University, Saga
34University of Science and Technology of China, Hefei35Seoul National University, Seoul
36Sungkyunkwan University, Suwon37University of Sydney, Sydney NSW
38Tata Institute of Fundamental Research, Bombay39Toho University, Funabashi
40Tohoku Gakuin University, Tagajo41Tohoku University, Sendai
42Department of Physics, University of Tokyo, Tokyo43Tokyo Institute of Technology, Tokyo
44Tokyo Metropolitan University, Tokyo45Tokyo University of Agriculture and Technology, Tokyo
46University of Tsukuba, Tsukuba47Virginia Polytechnic Institute and State University, Blacksburg, Virginia 24061, USA
48Yonsei University, Seoul(Received 23 December 2004; published 20 May 2005)
*On leave f
We report results on the Dalitz analysis of three-body charmless B� ! K����� and B� ! K�K�K�
decays based on a 140 fb�1 data sample collected with the Belle detector. Measurements of branchingfractions for quasi-two-body decays to scalar-pseudoscalar states: B� ! f0�980�K�, B� !K�
0�1430�0��, and to vector-pseudoscalar states: B� ! K��892�0��, B� ! �0K�, B� ! �K� are
presented. Upper limits on decays to some pseudoscalar-tensor final states are reported. We also reportthe measurement of the B� ! �c0K
� branching fraction in two �c0 decays channels: �c0 ! ���� and�c0 ! K�K�.
DOI: 10.1103/PhysRevD.71.092003 PACS numbers: 13.20.He, 13.25.Hw, 13.30.Eg, 14.40.Nd
I. INTRODUCTION
Studies of B meson decays to three-body charmlesshadronic final states are a natural extension of studies ofdecays to two-body charmless final states. Some of thefinal states considered so far as two-body (for example ��,K��, etc.) proceed via quasi-two-body processes involvinga wide resonance state that immediately decays in thesimplest case to two particles, thereby producing a three-body final state. Multiple resonances occurring nearby inphase space will interfere and a full amplitude analysis isrequired to extract correct branching fractions for theintermediate quasi-two-body states. B meson decays tothree-body charmless hadronic final states may providenew possibilities for CP violation searches [1–4].
Observations of B meson decays to various three-bodycharmless hadronic final states have already been reportedby the Belle [3,5,6], CLEO [7], and BaBar [8] Col-laborations. First results on the distribution of signal eventsover the Dalitz plot in the three-body B� ! K����� andB� ! K�K�K� decays are described in Ref. [6]. With adata sample of 29:1 fb�1 a simplified analysis techniquewas used due to lack of statistics. Using a similar tech-nique, the BaBar Collaboration has reported results of theiranalysis of the Dalitz plot for the decay B� ! K�����
with a 56:4 fb�1 data sample [9]. With the large data
rom Nova Gorica Polytechnic, Nova Gorica.
092003
sample that is now available, we can perform a full ampli-tude analysis. The analysis described in this paper is basedon a 140 fb�1 data sample containing 152� 106 B �B pairs,collected with the Belle detector operating at the KEKBasymmetric-energy e�e� collider [10] with a center-of-mass (c.m.) energy at the �4S� resonance (on-resonancedata). The beam energies are 3.5 GeV for positrons and8.0 GeV for electrons. For the study of the e�e� ! q �qcontinuum background, we use 8:3 fb�1 of data taken60 MeV below the �4S� resonance (off-resonance data).
The paper is organized as follows: Section II gives abrief description of the Belle detector; the event recon-struction procedure and background suppression tech-niques are described in Secs. III and IV, respectively;Section V describes results on the three-body signal yieldsmeasurement and qualitative analysis of the two-particlemass spectra, while Sec. VI is devoted to the amplitudeanalysis of the observed three-body signals; final results ofthe analysis are given in Sec. VII and discussed inSec. VIII.
II. THE BELLE DETECTOR
The Belle detector [11] is a large-solid-angle magneticspectrometer based on a 1.5 T superconducting solenoidmagnet. Charged particle tracking is provided by a three-layer silicon vertex detector and a 50-layer central driftchamber (CDC) that surround the interaction point. Thecharged particle acceptance covers laboratory polar angles
-2

DALITZ ANALYSIS OF THE THREE-BODY CHARMLESS . . . PHYSICAL REVIEW D 71, 092003 (2005)
between � � 17 and 150, corresponding to about 92% ofthe total solid angle in the c.m. frame. The momentumresolution is determined from cosmic rays and e�e� !���� events to be �pt=pt � �0:30 0:19pt�%, where ptis the transverse momentum in GeV=c.
Charged hadron identification is provided by dE=dxmeasurements in the CDC, an array of 1188 aerogelCerenkov counters (ACC), and a barrel-like array of 128time-of-flight scintillation counters (TOF); informationfrom the three subdetectors is combined to form a singlelikelihood ratio, which is then used for pion, kaon andproton discrimination. At large momenta (> 2:5 GeV/c)only the ACC and CDC are used to separate charged pionsand kaons since here the TOF provides no additionaldiscrimination. Electromagnetic showering particles aredetected in an array of 8736 CsI(Tl) crystals (ECL) thatcovers the same solid angle as the charged particle trackingsystem. The energy resolution for electromagnetic showersis �E=E � �1:3 0:07=E 0:8=E1=4�%, where E is inGeV. Electron identification in Belle is based on a combi-nation of dE=dx measurements in the CDC, the responseof the ACC, and the position, shape and total energydeposition (i.e., E=p) of the shower detected in the ECL.The electron identification efficiency is greater than 92%for tracks with plab > 1:0 GeV/c and the hadron misiden-tification probability is below 0.3%. The magnetic field isreturned via an iron yoke that is instrumented to detectmuons and K0
L mesons. We use a GEANT-based MonteCarlo (MC) simulation to model the response of the detec-tor and determine its acceptance [12].
III. EVENT RECONSTRUCTION
Charged tracks are selected with a set of track qualityrequirements based on the number of CDC hits and on thedistances of closest approach to the interaction point (IP).We also require that the track momenta transverse to thebeam be greater than 0:1 GeV=c to reduce the low mo-mentum combinatorial background. For charged kaon
0
10
20
30
40
50
60
70
80
90
100
-0.2 -0.1 0 0.1 0.2
∆E (GeV)
arbitrary units (a)
FIG. 1. (a) Energy difference �E and (b) beam constrained m(histograms) and q �q background in off-resonance data (points). Cur
092003
identification, we impose a requirement on the particleidentification variable that has 86% efficiency and a 7%fake rate from misidentified pions. Charged tracks that arepositively identified as electrons or protons are excluded.Since the muon identification efficiency and fake rate varysignificantly with the track momentum, we do not vetomuons to avoid additional systematic errors.
We identify B candidates using two variables: theenergy difference �E and the beam-energy constrained
mass Mbc. �E is calculated as �E � EB � E�beam �
�Pi
���������������������������c2p2
i � c4m2i
q� � E�
beam; where the summation isover all particles from a B candidate; and pi and mi aretheir c.m. three-momenta and masses, respectively. Sincethe �4S� decays to a pair of B mesons with no additionalparticles, each B meson carries half of the c.m. energy���s
p=2 � E�
beam � 5:29 GeV, where E�beam is the beam en-
ergy in the c.m. frame. The �E distribution for the B� !K����� signal MC events is shown in Fig. 1(a). Sincethere are only charged particles in final states considered inthis analysis, the �E width is governed by the track mo-mentum resolution. A typical value of the �E resolution is15 MeV. The beam-energy spread is about 3 MeVand givesa negligible contribution to the total �E width. The signal�E shape is fitted by a sum of two Gaussian functions witha common mean. In fits to the experimental data, we fix thewidth and fraction of the second Gaussian function fromMC simulation. The width of the main Gaussian is floated.For comparison, the �E distribution for the off-resonancedata is also shown in Fig. 1(a), where the background isparametrized by a linear function.
The beam-energy constrained mass variable Mbc isequivalent to the B invariant mass with the measured Bcandidate energy EB replaced by the beam energy E�
beam:
Mbc �1c2
����������������������������E�2
beam � c2P2B
q� 1
c2
��������������������������������������E�2
beam � c2�Pipi�
2q
, wherePB is the B candidate momentum in the c.m. frame. Theaverage B meson momentum in the c.m. frame is about0:34 GeV=c which is much smaller than its total energy.
0
10
20
30
40
50
60
70
80
90
100
5.20 5.22 5.24 5.26 5.28 5.30
mbc (GeV/c2)
arbitrary units (b)
ass Mbc distributions for B� ! K����� signal MC eventsves represent the results of the fits.
-3

A. GARMASH et al. PHYSICAL REVIEW D 71, 092003 (2005)
Thus, the uncertainty in the measured PB gives a smallcontribution to the Mbc width, which is dominated by thebeam-energy spread. The Mbc width is about 3 MeV=c2
and is nearly independent of the final state unless photonsare included. The Mbc distribution for the signalB� ! K����� MC events and for the off-resonancedata are shown in Fig. 1(b). The signal Mbc shape is welldescribed by a Gaussian function. The background shapeis parametrized with an empirical function f�Mbc� /
x��������������1� x2
pexp ���1� x2��, where x � Mbc=E
�beam and �
is a parameter [13].
IV. BACKGROUND SUPPRESSION
There are two sources of the background: the dominantone is due to e�e� ! q �q (q � u; d; s and c quarks) con-tinuum events that have a cross-section about 3 times largerthan that for the e�e� ! �4S� ! B �B; the other oneoriginates from other B meson decays. The backgroundfrom continuum events is suppressed using variables thatcharacterize the event topology. Since the two B mesonsproduced from an �4S� decay are nearly at rest in the c.m.frame, their decay products are uncorrelated and the eventtends to be spherical. In contrast, hadrons from continuumq �q events tend to exhibit a two-jet structure. We use �thr,which is the angle between the thrust axis of the B candi-date and that of the rest of the event, to discriminatebetween the two cases. The distribution of j cos�thrj isstrongly peaked near j cos�thrj � 1:0 for q �q events and isnearly flat for B �B events. A Fisher discriminant is utilizedfor the further suppression of the continuum background.When combined, these two variables reject about 98%(92%) of the continuum background in the B� !K����� (B� ! K�K�K�) decay while retaining 36%(70%) of the signal. (As the continuum background in thethree-kaon final state is much smaller a looser requirementon the Fisher discriminant is imposed to retain the effi-ciency.) A detailed description of the continuum suppres-sion technique can be found in Ref. [3] and referencestherein.
The understanding of the background that originatesfrom other B meson decays is of great importance in thestudy of charmless B decays. We study the B �B relatedbackground using a large sample (about 2.5 times theexperimental dataset) of MC generated B �B generic events.We use the CLEO generator [14] to simulate B decaysgoverned by the dominant b! c tree transition. Note thatcharmless hadronic B decays that proceed via b! s�d�penguin and b! u tree transitions are not included in thegenerator and are generated separately. We find that thedominant B �B background in the K����� final state thatpeaks in the signal region is due to B� ! �D0��, �D0 !K��� and also B� ! J= � �2S��K�, J= � �2S�� !���� decays. We veto B� ! �D0�� events by requiringjM�K�� �MDj> 0:10 GeV=c2. The B� ! �D0K�, �D0 !���� signal is removed by requiring jM������ �
092003
MDj> 15 MeV=c2 ( � 2:5�). To suppress the backgrounddue to �=K misidentification, we also exclude candidatesif the invariant mass of any pair of oppositely chargedtracks from the B candidate is consistent with the �D0 !K��� hypothesis within 15 MeV=c2, regardless of theparticle identification information. Modes withJ= � �2S�� in the final state contribute due to muon-pionmisidentification; the contribution from the J= � �2S�� !e�e� submode is found to be negligible after the electronveto requirement. We exclude J= and �2S� backgroundsby requiring jM���������� �MJ= j> 0:07 GeV=c2
and jM���������� �M �2S�j> 0:05 GeV=c2, wheresubscript ���� indicates that the muon mass assignmentwas used for charged tracks to calculate the two-particleinvariant mass. Yet another small but clearly visible back-ground associated with B� ! J= K�, J= ! ����
decays is due to a somewhat complicated particle misiden-tification pattern: the charged kaon is misidentified as apion, the �� is misidentified as a kaon and the �� asanother pion. This background is excluded by applying aveto: jM�K�������� �MJ= j> 0:020 GeV=c2. Themost significant background from charmless B decays isfound to originate from B� ! %0K� followed by %0 !����&. Another contribution comes from B� ! �0��
decay, where one of the final state pions is misidentified asa kaon. We take these contributions into account whendetermining the signal yield.
The dominant background to the K�K�K� final statefrom other B decays is found to come from the processB! Dh, where h stands for a charged pion or kaon. Tosuppress this background, we reject events where any two-particle invariant mass is consistent with �D0 ! K�K� or�D0 ! K��� within 15 MeV=c2 regardless of the particle
identification information. We find no charmless B decaymodes that produce a significant background to theK�K�K� final state.
V. THREE-BODY SIGNAL YIELDS
The �E distributions for B� ! K����� and B� !K�K�K� candidates that pass all the selection require-ments and with jMbc �MBj< 9 MeV=c2 are shown inFig. 2, where clear peaks in the signal regions are observed.In the fit to the �E distribution for theK����� final state,we fix the shape and normalization of the charmless B �Bbackground components from the measured branchingfractions [15] and known number of produced B �B events.For the B �B generic component, we fix only the shape andlet the normalization float. The slope and normalization ofthe q �q background component are free parameters. Resultsof the fit are shown in Fig. 2, where different componentsof the background are shown separately for comparison.There is a large increase in the level of the B �B relatedbackground in the �E<�0:15 GeV region for theK����� final state. This is mainly due to the decay B!D�, D! K��. This decay mode produces the same final
-4

TABLE I. Results of fits to the �E distributions with a doubleGaussian for the signal (see Sec. III).
Final state �1 �2 Fraction of theMain Gaussian
Signal yieldMeV MeV (Events)
K����� 17:5 � 0:9 35:0 (fixed) 0:84 (fixed) 1533 � 69K�K�K� 14:0 � 1:0 40:0 (fixed) 0:85 (fixed) 1089 � 41
0
100
200
300
400
500
600
700
-0.3 -0.2 -0.1 0 0.1 0.2 0.3 0.4 0.5
(a) B+→ K+π+π-
∆E (GeV)
Events/(10 MeV)
- data
- total background
- continuum
- BB- total
- BB- charmless
0
50
100
150
200
250
300
350
-0.3 -0.2 -0.1 0 0.1 0.2 0.3 0.4 0.5
(b) B+→ K+K+K-
∆E (GeV)
Events/(10 MeV)
- data
- total background
- continuum
- BB- total
FIG. 2. �E distributions for (a) B� ! K����� and (b) B� ! K�K�K� candidate events. Points with error bars are data; thecurve is the fit result; the hatched area is the background.
DALITZ ANALYSIS OF THE THREE-BODY CHARMLESS . . . PHYSICAL REVIEW D 71, 092003 (2005)
state as the studied process plus one extra pion that is notincluded in the energy difference calculation. The decayB! D�, D! K�)� also contributes due to muon-pionmisidentification. The shape of this background is de-scribed well by the MC simulation. In the fit to the �Edistribution for the K�K�K� final state, we fix not onlythe shape but also the normalization of the B �B background.This is done because the B �B background in this final stateis found to be much smaller than the dominant q �q back-ground, thus the relative fraction of these two contributions
-0.2
-0.1
0
0.1
0.2
5.20 5.22 5.24 5.26 5.28 5.30
Mbc (GeV/c2)
∆E (GeV)
(a)
FIG. 3. (a) Distribution of �E versus Mbc for the B� ! K�K�Kregions in the Mbc ��E plane.
092003
is poorly determined from the fit. The signal yields ob-tained from fits are given in Table I.
To examine possible quasi-two-body intermediate statesin the observed B� ! K����� and B� ! K�K�K�
signals, we analyze two-particle invariant mass spectra.To determine the distribution of the background we useevents in the Mbc and �E sidebands. The definition of thesignal and sideband regions is illustrated in Fig. 3. Definedin this way, the Mbc � �E sidebands are equivalent to thefollowing sidebands in terms of the three-particle invariantmassM�Khh� and three-particle momentum P�Khh� in thec.m. frame:
0:05 GeV=c2 < jM�Khh� �MBj< 0:10 GeV=c2;
P�Khh�< 0:48 GeV=c
and
-0.2
-0.1
0
0.1
0.2
5.20 5.22 5.24 5.26 5.28 5.30
signal (loose)
signal (tight)
sidebands
Mbc (GeV/c2)
∆E (GeV)
(b)
� candidates in data. (b) Definitions of the signal and sideband
-5

A. GARMASH et al. PHYSICAL REVIEW D 71, 092003 (2005)
jM�Khh� �MBj< 0:10 GeV=c2;
0:48GeV=c < P�Khh�< 0:65 GeV=c:
The signal region is defined as an ellipse around the Mbc
and �E mean values:
�Mbc �MB�2
�n�Mbc�2
��E2
�n��E�2 < 1;
where �Mbc� 3 MeV=c2 and ��E is equivalent to �1 in
Table I. We define two signal regions: with loose �n � 3�and tight �n � 2� requirements. Tight requirements reduce(compared to the loose requirements) the background frac-tion in the data sample by about 65% while retaining about85% of the signal. The efficiency of the loose (tight)requirements that define the signal region is 0.923 (0.767)for the K����� final state and 0.948 (0.804) for theK�K�K� final state. The total number of events in thesignal region is 2584 (1809) for the K����� and 1400(1078) for the K�K�K� final state. To determine therelative fraction of signal and background events in thesesamples, we use the results of the fits to the �E distribu-tions (see Table I). We find 1533� 69 signal B� !K����� events and 1089� 41 signal B� ! K�K�K�
events. The relative fraction of signal events in the signalregion with loose (tight) requirements is then determinedto be 0:548 � 0:025 (0:650 � 0:032) for the K����� and0:738� 0:028 (0:828 � 0:033) for the K�K�K� finalstate. All final results are obtained from fits to events inthe signal region with loose �E andMbc requirements. Thesubsample with tight requirements is used for a cross-check only.
The K��� and ���� invariant mass spectra for B� !K����� candidate events in the Mbc � �E loose signalregion are shown as open histograms in Fig. 4. The hatchedhistograms show the corresponding spectra for backgroundevents in the Mbc ��E sidebands, normalized to theestimated number of background events. To suppress thefeed-across between the ���� and K��� resonancestates, we require the K��� (����) invariant mass tobe larger than 2:0�1:5� GeV=c2 when making the ����
0
20
40
60
80
100
0.5 1.0 1.5 2.0 2.5 3.0 3.5
M(K+π-) (GeV/c2)
Events/(0.030 GeV/c2)
(a)
0
20
40
60
80
100
120
0 0.5 1.0 1
M(π+π-)
Events/(0.030 GeV/c2)
FIG. 4. Two-particle invariant mass spectra for B� ! K�����
background events in the �E�Mbc sidebands (hatched histogramM������ with M�K����> 2:0 GeV=c2 and (c) M������ in the
092003
(K���) projection. The K��� invariant mass spectrum ischaracterized by a narrow peak around 0:9 GeV=c2, whichis identified as the K��892�0, and a broad enhancementaround 1:4 GeV=c2. Possible candidates for this enhance-ment are the scalar K�
0�1430� and tensor K�2�1430� reso-
nances. In the ���� invariant mass spectrum two distinctstructures in the low mass region are observed. One isslightly below 1:0 GeV=c2 and is consistent with thef0�980� and the other is between 1:0 GeV=c2 and1:5 GeV=c2. We cannot identify unambiguously the reso-nant state that is responsible for such a structure. Possiblecandidates for a resonant state in this mass region might bef0�1370�, f2�1270� and perhaps ��1450� [15]. In whatfollows, we refer to this structure as fX�1300�. There isalso an indication for the ��770�0. Finally, there is a clearsignal for the decay B� ! �c0K�, �c0 ! ����.Figure 4(c) shows the ���� invariant mass distributionsin the �c0 mass region.
The K�K� invariant mass spectra for B� ! K�K�K�
candidate events in the Mbc ��E signal region with looserequirements are shown as open histograms in Fig. 5. Sincethere are two same-charge kaons in the B� ! K�K�K�
decay, we distinguish the K�K� combinations withsmaller, M�K�K��min, and larger, M�K�K��max, invariantmasses. The M�K�K��min spectrum, shown in Fig. 5(a), ischaracterized by a narrow peak at 1:02 GeV=c2 corre-sponding to the ��1020� meson and a broad structurearound 1:5 GeV=c2, shown in Fig. 5(b). Possible candi-dates for a resonant state in this mass region are thef0�1370�, f0�1500�, or f02�1525� [15]. In what follows,we refer to this structure as fX�1500�. Figure 5(c) showsthe M�K�K��max invariant mass distribution in the �c0mass region. A clear enhancement is observed at3:4 GeV=c2, where the �c0 is expected. Some enhance-ment of signal events over the expected background level isalso observed in the full mass range shown in Fig. 5(c). Asthe �c0 meson has a significant natural width (about15 MeV=c2) [15], the amplitude that is responsible forthe B� ! �c0K
� decay may interfere with a charmlessamplitude. As a result of the interference between thesetwo amplitudes, the lineshape of the �c0 resonance can
.5 2.0 2.5 3.0
(GeV/c2)
(b)
0
5
10
15
20
25
3.0 3.2 3.4 3.6 3.8 4.0
M(π+π-) (GeV/c2)
Events/(0.025 GeV/c2)
(c)
candidates in the B signal region (open histograms) and fors). (a) M�K���� spectrum with M������> 1:5 GeV/c2; (b)�c0 mass region with M�K����> 2:0 GeV=c2.
-6

0
5
10
15
20
25
0.98 1.00 1.02 1.04 1.06 1.08
M(K+K-)min (GeV/c2)
Events/(1 MeV/c2)
(a)
0
10
20
30
40
50
60
1.0 1.5 2.0 2.5 3.0 3.5 4.0
M(K+K-)min (GeV/c2)
Events/(0.030 GeV/c2)
(b)
0
4
8
12
16
20
3.0 3.2 3.4 3.6 3.8 4.0
M(K+K-)max (GeV/c2)
Events/(0.025 GeV/c2)
(c)
FIG. 5. Two-particle invariant mass spectra for B� ! K�K�K� candidates in the B signal region (open histograms) and forbackground events in the �E�Mbc sidebands (hatched histograms). (a) M�K�K��min invariant mass spectrum near the ��1020� massregion; (b) M�K�K��min spectrum in the full range; (c) M�K�K��max in the �c0 mass region with 2:0 GeV=c2 <M�K�K��min <3:4 GeV=c2.
DALITZ ANALYSIS OF THE THREE-BODY CHARMLESS . . . PHYSICAL REVIEW D 71, 092003 (2005)
be distorted. In our previous analysis of B meson decaysto three-body charmless hadronic final states [3,6], weimposed a requirement on the invariant mass of the���� and K�K� combination to veto the B� ! �c0K
�
signal. In this analysis we do not apply such a requirement.From these qualitative considerations it is apparent that
an amplitude analysis is required for a more completeunderstanding of the individual quasi-two-body channelsthat contribute to the observed three-body B� !K����� and B� ! K�K�K� signals.
VI. AMPLITUDE ANALYSIS
In the preceding section we found that a significantfraction of the signals observed in B� ! K����� andB� ! K�K�K� decays can be assigned to quasi-two-body intermediate states. These resonances will cause anonuniform distribution of events in phase space that canbe analyzed using the technique pioneered by Dalitz [16].Multiple resonances that occur nearby in phase space willinterfere and provide an opportunity to measure both theamplitudes and relative phases of the intermediate states.This in turn allows us to deduce their relative branchingfractions. Amplitude analyses of various three-body Dmeson decays have been successfully performed by anumber of groups [17]. From their results we can learnthat this kind of analysis requires, in general, high statistics(of the order of a few thousand signal events, at least). Incontrast to the analysis of D meson three-body decays,where the level of the combinatorial background is usuallyquite small, the signal and background levels in charmlessthree-body decays of B mesons are comparable. This com-plicates the analysis, requiring careful study of the distri-bution of background events over the phase space. Finally,independent of the statistics, the choice of the model (thatis the set of quasi-two-body intermediate states) to fit thedata is often not unique. This unavoidably introduces somemodel dependence into the determination of quasi-two-body branching fractions. This is especially true forthree-body charmless decays of B mesons where experi-mental statistics is quite limited while the available phasespace is large.
092003
A. Formalism
Since we are studying the decay of a spin-zero particle tothree spin-zero daughters B! h1h2h3, only 2 degrees offreedom are required to completely describe the kinemat-ics. There are three invariant masses that can be formed byconsidering all possible pairs of final state particles: s12 �M2�h1h2�, s13 � M2�h1h3� and s23 � M2�h2h3�. Only twoof them are independent, however, since energy and mo-mentum conservation results in the additional constraint
M2 �m21 �m2
2 �m23 � s12 � s13 � s23; (1)
where M2 is the mass of the initial particle, and mi aremasses of the daughter particles. In what follows we uses13 and s23 as the two independent variables.
The density of signal events on the Dalitz plot is de-scribed by the matrix element M as
d$ �jMj2
256�3M3 ds13ds23; (2)
which in turn depends on the decay dynamics.The amplitude for B decay to a three-body final state via
an intermediate resonance state R is given by
A J � FBF�J�R BWJTJ; (3)
where FB and F�J�R are form factors which, in general, are
unknown functions. For F�J�R we use the Blatt-Weisskopf
penetration factors [18] given in Table II. These factorsdepend on a single parameter, R, which is the ‘‘radius’’ ofthe meson. For all intermediate resonances we set thisparameter to R � 1:5 GeV�1. Form factors are normalizedto unity at the nominal meson mass. FB is parametrized in asingle pole approximation [19]
FB �1
1� sM2
pole
; (4)
where we use the mass of the B� meson [15] as a pole massMpole.
The Breit-Wigner function BWJ in Eq. (3) is given bythe expression
-7

TABLE II. Blatt-Weisskopf penetration form factors. pr is themomentum of either daughter in the meson rest frame. ps is themomentum of either daughter in the candidate rest frame (sameas pr except the parent mass used is the two-track invariant massof the candidate rather than the mass of the meson). R is themeson radial parameter.
Spin J Form factor F�J�R
0 1
1�������������1�R2p2
r
p�������������1�R2p2
s
p
2�������������������������9�3R2p2
r�R4p4
r
p�������������������������9�3R2p2
s�R4p4s
p
A. GARMASH et al. PHYSICAL REVIEW D 71, 092003 (2005)
BWJ�s� �1
M2R � s� iMR$
�J�R �s�
; (5)
whereMR is the nominal mass of the resonance, and $�J�R �s�
is the ‘‘mass dependent width.’’ In the general case, $�J�R �s�
is expressed as [20]
$�J�R �s� � $R
�pspr
�2J�1
�MR
s1=2
�F2R; (6)
where pr is the momentum of either daughter in theresonance rest frame, calculated with the resonance massequal to the nominal MR value, ps is the momentum ofeither daughter in the resonance rest frame when the reso-nance mass is equal to s1=2, J is the spin of the resonance,and $R is the width of the resonance.
The function TJ in Eq. (3) describes the angular corre-lations between the B decay products. We distinguish thefollowing three cases:
(1) Scalar-pseudoscalar �J � 0� decay—If R is a scalarstate, the decay amplitude Eq. (3) takes the simplest formwith T0 � 1. We treat the scalar f0�980� as a special case,for which we try two parametrizations for the s-dependentwidth $f0
�s�: by Eq. (6), and following the parametrizationby Flatte [21]
$f0�s� � $��s� � $K�s�; (7)
where
$��s� � g����������������������s=4�m2
�
q;
$K�s� �gK2
� �����������������������s=4�m2
K�
q�
�����������������������s=4�m2
K0
q �;
(8)
and g� and gK are coupling constants for f0�980� ! ��and f0�980� ! KK, respectively.
(2) Vector-pseudoscalar �J � 1� decay—In the case of apseudoscalar-vector decay of the B meson, the Lorentz-invariant expression for T1 is given by
092003
T1�h1h2h3jR23� � s12 � s13 ��M2 �m2
1��m23 �m2
2�
s23;
(9)
where R23 is an intermediate resonance state decaying toh2h3 final state.
(3) Tensor-pseudoscalar �J � 2� decay—For apseudoscalar-tensor decay, T2 takes the form
T2�h1h2h3jR23� �
�s13 � s12 �
�M2B�m2
1��m22 �m2
3�
s23
�2
�1
3
�s23 � 2M2
B� 2m21 �
�M2B�m2
1�2
s23
�
�
�s23 � 2m2
2 � 2m23 �
�m22 �m2
3�2
s23
�:
(10)
We do not consider resonant states of higher spin in ouranalysis.
There is also the possibility of a so-called ‘‘nonreso-nant’’ amplitude. In the Dalitz analysis of D meson decaysto three-body final states the nonresonant amplitude isoften parametrized as a complex constant. In the case ofB meson decays, where the available phase space is muchlarger, it is rather unlikely that the nonresonant amplitudewill have a constant value over the entire phase space;some form factors should be introduced. Unfortunately,at the moment there is no theoretical consensus on theproperties of nonresonant B meson decays. In our analysiswe use an empirical parametrization that in the case of theK����� final state is
A nr�K������ � anr
1 e�3s13ei4
nr1 � anr
2 e�3s23ei4
nr2 ; (11)
where s13 � M2�K����, s23 � M2������, and anr1;2, and
4nr1;2 and 3 are fit parameters. In a certain limit this pa-
rametrization is equivalent to a constant. Several alterna-tive parametrizations (mentioned below) are alsoconsidered to estimate the model dependence.
An important feature that should be taken into account inthe construction of the matrix element for the decay B� !K�K�K� is the presence of the two identical kaons in thefinal state. This is achieved by symmetrizing the matrixelement with respect to the interchange of the two kaons ofthe same charge, that is s13 $ s23. Because of symmetri-zation the nonresonant amplitude for the K�K�K� finalstate becomes
A nr�K�K�K�� � anr�e�3s13 � e�3s23�ei4nr; (12)
where s13 � M2�K�1 K
��, s23 � M2�K�2 K
��.Given the amplitude for each decay type, the overall
matrix elements can be written as a coherent sum
M �Xj
ajei4jAj �Anr; (13)
-8

DALITZ ANALYSIS OF THE THREE-BODY CHARMLESS . . . PHYSICAL REVIEW D 71, 092003 (2005)
where the index j denotes the quasi-two-body intermediatestate, aj and 4j are the amplitude and relative phase of thej-th component. Since we are sensitive only to the relativephases and amplitudes, we are free to fix one phase and oneamplitude in Eq. (13). The fraction fl of the total three-body signal attributed to a particular quasi-two-body inter-mediate state can be calculated as
fl �
RjalAlj2ds13ds23RjMj2ds13ds23
: (14)
The sum of the fit fractions for all components is notnecessarily unity because of interference.
The amplitude analysis of B meson three-body decaysreported here is performed by means of an unbinned maxi-mum likelihood fit which minimizes the function
F � �2X
events
lnP�s13; s23;7�; (15)
where the function P�s13; s23; 7� describes the density ofexperimental events over the Dalitz plot; 7 is a vector ofparameters.
An important question that arises in an unbinned analy-sis is the estimation of the goodness-of-fit. As the unbinnedmaximum likelihood fitting method does not provide adirect way to estimate the quality of the fit, we need ameasure to assess how well any given fit represents thedata. To do so the following procedure is applied. We firstsubdivide the entire Dalitz plot into 1 �GeV=c2�2 �1 �GeV=c2�2 bins. If the number of events in the bin issmaller than Nmin � 16 it is combined with the adjacentbins until the number of events exceeds Nmin. After com-pleting this procedure, the entire Dalitz plot is divided intoa set of bins of varying size, and a �2 variable for themultinomial distribution can be calculated as
�2 � �2XNbins
i�1
ni ln�pini
�; (16)
where ni is the number of events observed in the i-th bin,and pi is the number of predicted events from the fit. For alarge number of events this formulation becomes equiva-lent to the usual one. Since we are minimizing the un-binned likelihood function, our ‘‘�2’’ variable does notasymptotically follow a �2 distribution but it is boundedby a �2 variable with (Nbins � 1) degrees of freedom and a�2 variable with (Nbins � k� 1) degrees of freedom [22],where k is the number of fit parameters. Because it isbounded by two �2 variables, it should be a useful statisticfor comparing the relative goodness of fits for differentmodels.
B. Efficiency, detector resolution and background
Several effects should be taken into account when fittingthe experimental data. The reconstruction efficiency canvary significantly over the Dalitz-plot area and distort the
092003
initial distribution of signal events. In addition, there is alsosome fraction of background that fakes the signal. As isevident in Fig. 2, the background level in the signal regionis comparable to that of the signal. Thus, understanding thedistribution of background events over the Dalitz plot isimportant for an amplitude analysis. Finally, the detectorresolution produces some smearing of the Dalitz-plotboundaries so that the phase space for the reconstructedB candidates exceeds the kinematically allowed area. Tocorrect for this effect, three-body combinations are kine-matically fit to the nominal B mass. As the intermediateresonances in general have large widths, we neglect theeffect of detector resolution on the resonance shapes inmost cases. In the case of narrow resonant states (forexample, the � meson in the K�K�K� final state or the�c0 in both K�K�K� and K����� final states), we takethe detector resolution into account by convolving thesignal probability density function with a two-dimensionalGaussian resolution function. The widths of the two-dimensional resolution function depend on the position inthe Dalitz plot and are determined from the MC simulation.
To account for the background events and nonuniformreconstruction efficiency the event density function,P�s13; s23;7� can be written as
P�s13; s23;7� �Ns"�s13; s23�S�s13; s23; 7� � nbb�s13; s23�Ns
R"�s13; s23�S�s13; s23; 7�ds13ds23 � nb
;
(17)
where Ns is the initial number of signal events distributedover the the Dalitz plot according to the signal densityfunction S�s13; s23; 7� , "�s13; s23� is the reconstructionefficiency as a function of the position on the Dalitz plot,nb is the expected number of the observed backgroundevents distributed with the density b�s13; s23�, and a vectorof parameters 7 (masses, widths and relative amplitudesand phases) is to be determined from the minimization.Equation (17) can be written in terms of the expectednumber of the observed signal events ns � Ns"s �Ns
R"�s13; s23�S�s13; s23; 7�ds13ds23 and the background
density function B�s13; s23� � "bb�s13; s23�="�s13; s23�:
P�s13; s23; 7� � "�s13; s23�
�nsS�s13; s23; 7�"s � nbB�s13; s23�="b
ns � nb;
(18)
where the overall efficiencies "s and "b are determinedfrom the MC simulation:
"s �Z"�s13; s23�S�s13; s23; 7�ds13ds23
��
Ngen
XMC
S�s13; s23; 7�; (19)
-9

A. GARMASH et al. PHYSICAL REVIEW D 71, 092003 (2005)
"b �Z"�s13; s23�B�s13; s23�ds13ds23
��
Ngen
XMC
B�s13; s23�: (20)
The sumP
MC is calculated from a set of MC eventsgenerated with a uniform distribution over the Dalitzplot, passed through the full detector simulation and sub-jected to all the event selection requirements; Ngen is thenumber of generated events; � is the Dalitz-plot area.
The likelihood function to be minimized can be writtenas
F � �X
events
2 ln�F
S�s13; s23; 7�PMCS�sMC
13 ; sMC23 ; 7�
� �1� F�
�B�s13; s23�P
MCB�sMC
13 ; sMC23 �
��
Xevents
2 ln"�s13; s23�
��F� F0�
2
�2F0
; (21)
where signal and background density functions are nor-malized to satisfy the requirement
ZS�s13; s23; 7�ds13ds23 � 1;
ZB�s13; s23�ds13ds23 � 1;
(22)
F � ns=�ns � nb� is the relative fraction of signal events inthe data sample and F0 is the estimated fraction from the fitto the �E distribution. The third term takes into accountthe uncertainty in our knowledge of the background con-tribution. As the second term in Eq. (21) does not dependon the fit parameters 7, it is constant for a given set ofexperimental events and, thus, can be omitted. In Eq. (21)we assume there is no interference between signal andbackground processes. The background density function
0
5
10
15
20
25
0 5 10 15 20 25 30
M2(K+π-) (GeV2/c4)
M2(π+π-) (GeV2/c4)
(a)
FIG. 6. Dalitz plots for events in the �E�Mbc sidebands f
092003
B�s13; s23� is determined from the unbinned likelihood fitto the experimental events in the Mbc � �E sidebands.
C. Fitting the background shape
The definition of the Mbc � �E sideband region isshown in Fig. 3. Figure 6 shows the Dalitz distributionsfor events in these sidebands; we find 7360 and 2176 eventsfor the K����� and K�K�K� final states, respectively.This is about 7 times the estimated number of backgroundevents in the corresponding signal region.
We use the following empirical parametrization to de-scribe the distribution of background events over the Dalitzplot in the K����� final state
BK���s13; s23� � 31e�;1s13 �32e�;2s23 �33e�;3s12
�34e�;4�s13 � s23��35e
�;5�s13 � s12�
�36e�;6�s23 � s12��&1jBW1�K
��892��j2
�&2jBW1���770��j2; (23)
where s13 � M2�K����, s23 � M2������ and 3i (31 �1:0), ;i, and &i are fit parameters. The first three terms inEq. (23) are introduced to describe the background en-hancement in the two-particle low invariant mass regions.This enhancement originates mainly from e�e� ! q �qcontinuum events. Because of the jetlike structure of thisbackground, all three particles in a three-body combinationhave almost collinear momenta. Hence, the invariant massof at least one pair of particles is in the low mass region. Inaddition, it is often the case that two high momentumparticles are combined with a low momentum particle toform a B candidate. In this case there are two pairs withlow invariant masses and one pair with high invariant mass.This results in even stronger enhancement of the back-ground in the corners of the Dalitz plot. This is taken intoaccount by terms 4� 6 in Eq. (23). To account for thecontribution from real K��892�0 and ��770�0 mesons, weintroduce two more terms in Eq. (23), that are (noninterfer-
0
5
10
15
20
25
0 2 4 6 8 10 12 14
M2(K+K-)min (GeV2/c4)
M2(K+K-)max (GeV2/c4)
(b)
or the (a) K����� and (b) K�K�K� (right) final states.
-10
0
50
100
150
200
0.5 1 1.5 2 2.5 3 3.5 4 4.5 5 5.5M(K+π-) (GeV/c2)
Events/(0.05 GeV/c2)
(a)
0
20
40
60
80
100
1.5 2 2.5 3 3.5 4 4.5 5M(K+K-)max (GeV/c
2)
Events/(0.05 GeV/c2)
(d)
0
50
100
150
200
0 0.5 1 1.5 2 2.5 3 3.5 4 4.5 5M(π+π-)max (GeV/c
2)
Events/(0.05 GeV/c2)
(b)
0
50
100
150
200
250
0.5 1 1.5 2 2.5 3 3.5 4M(K+K-)min (GeV/c
2)Events/(0.05 GeV/c2)
(e)
0
10
20
30
40
0.98 1 1.02 1.04 1.06 1.08
0
50
100
150
200
0.5 1 1.5 2 2.5 3 3.5 4 4.5 5 5.5M(K+π+) (GeV/c2)
Events/(0.05 GeV/c2)
(c)
0
10
20
30
40
50
60
70
0.5 1 1.5 2 2.5 3 3.5 4 4.5 5M(K+K+) (GeV/c2)
Events/(0.05 GeV/c2)
(f)
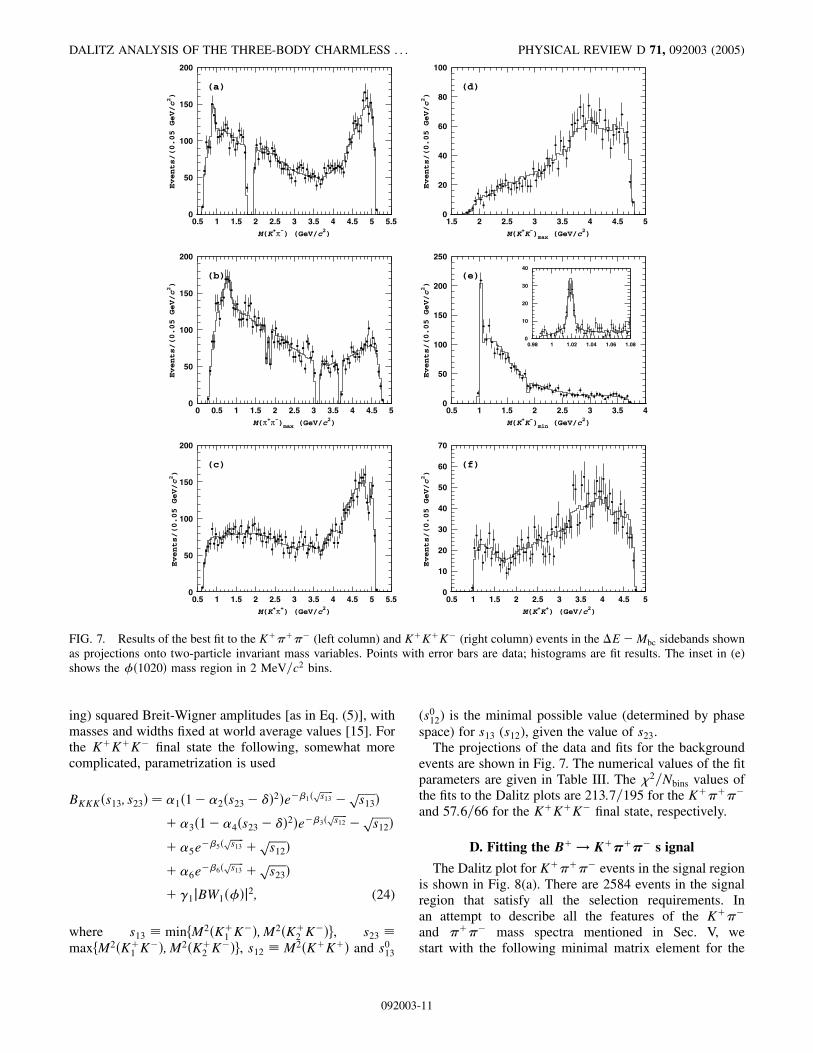
FIG. 7. Results of the best fit to the K����� (left column) and K�K�K� (right column) events in the �E�Mbc sidebands shownas projections onto two-particle invariant mass variables. Points with error bars are data; histograms are fit results. The inset in (e)shows the ��1020� mass region in 2 MeV=c2 bins.
DALITZ ANALYSIS OF THE THREE-BODY CHARMLESS . . . PHYSICAL REVIEW D 71, 092003 (2005)
ing) squared Breit-Wigner amplitudes [as in Eq. (5)], withmasses and widths fixed at world average values [15]. Forthe K�K�K� final state the following, somewhat morecomplicated, parametrization is used
BKKK�s13; s23� � 31�1�32�s23 �4�2�e�;1������s13
p�
������s13
p�
�33�1�34�s23 �4�2�e�;3������s12
p�
������s12
p�
�35e�;5�
�����s13
p�
������s12
p�
�36e�;6������s13
p�
������s23
p�
�&1jBW1���j2; (24)
where s13 � minfM2�K�1 K
��;M2�K�2 K
��g, s23 �maxfM2�K�
1 K��;M2�K�
2 K��g, s12 � M2�K�K�� and s013
092003
(s012) is the minimal possible value (determined by phasespace) for s13 (s12), given the value of s23.
The projections of the data and fits for the backgroundevents are shown in Fig. 7. The numerical values of the fitparameters are given in Table III. The �2=Nbins values ofthe fits to the Dalitz plots are 213:7=195 for the K�����
and 57:6=66 for the K�K�K� final state, respectively.
D. Fitting the B� ! K����� s ignal
The Dalitz plot for K����� events in the signal regionis shown in Fig. 8(a). There are 2584 events in the signalregion that satisfy all the selection requirements. Inan attempt to describe all the features of the K���
and ���� mass spectra mentioned in Sec. V, westart with the following minimal matrix element for the
-11

TABLE III. Parameters of the background density functionsdetermined from the fit to events in the Mbc ��E sidebands forthe final states K����� and K�K�K�.
K����� K�K�K�
31 1.0 (fixed) 1:0 (fixed)32 0:78� 0:10 0:0131� 0:001733 1:22� 0:27 0:51� 0:1034 1:51� 0:22 0:0118� 0:003135 2:05� 0:28 0:40� 0:1736 1:98� 0:36 3:36� 1:13;1 1:25� 0:09 4:09� 0:32;2 1:66� 0:10 . . .;3 2:17� 0:23 4:83� 0:69;4 0:27� 0:01 . . .;5 0:38� 0:01 0:89� 0:13;6 0:27� 0:02 1:53� 0:16&1 0:80� 0:23 2:80� 0:45&2 2:25� 0:61 . . .4 . . . 14:21� 0:50
A. GARMASH et al. PHYSICAL REVIEW D 71, 092003 (2005)
B� ! K����� decay (referred to as model K��� AJ):
SAJ �K������ � aK�ei4K�A1��
�K���jK��892�0�
� aK�0ei4K�
0A0���K���jK�
0�1430�0�
� a�ei4�A1�K
�����j��770�0�
� af0ei4f0A0�K
�����jf0�980��
� afXei4fXAJ�K�����jfX�
� a�c0ei4�c0A0�K�����j�c0�; (25)
where the subscript J denotes the unknown spin of thefX�1300� resonance; amplitudes ai, relative phases 4i,masses and widths of the f0�980� and fX�1300� resonancesare fit parameters. The masses and widths of all otherresonances are fixed at their world average values [15].
0
5
10
15
20
25
0 5 10 15 20 25 30
M2(K+π-) (GeV2/c4)
M2(π+π-) (GeV2/c4)
(a)
FIG. 8. Dalitz plots for events in the signal region fo
092003
While fitting the data, we choose the K��892�0�� signal asour reference by fixing its amplitude and phase (aK� � 1and 4K� � 0). Figs. 9(a)–9(c) show the fit projections withmodel K��� A0 and the data [23]. The numerical valuesof the fit parameters in terms of relative phases and frac-tions calculated with Eq. (14) are given in Table IV.However, the data are not well represented by this matrixelement, especially in the lowK��� mass region as shownin Fig. 9(a). This is also demonstrated in Fig. 10, where theK��� invariant mass distributions are shown for the twoM2������ regions: M2������< 11 GeV=c2 andM2������> 11 GeV=c2, which approximately corre-spond to the two helicity angle regions: cos�K�H < 0 andcos�K�H > 0, respectively. Result of the fit using modelK��� A0 is shown as a dashed histogram in Fig. 10.(The helicity angle is defined as the angle between thedirection of flight of the �� in the K��� rest frame andthe direction of K��� system in the B rest frame.) Thedifference in shape of the M�K���� spectra clearly ob-served in Figs. 10(a) and 10(b) is consistent with what isexpected in the case of interference of vector and scalaramplitudes. The scalar amplitude introduced by theK�
0�1430�0 state is found to be insufficient to reproduce
this pattern. Thus, we modify the matrix element [Eq. (25)]by introducing an additional scalar amplitude. First, weconstruct model K��� BJ, that is model K��� AJ withan additional scalarK��� resonance. A candidate for sucha state could be the so-called > resonance. An indication ofthe presence of the > in D� ! K����� decay withM�>� � 797 � 19� 43 MeV=c2 and $�>� � 410� 43�87 MeV=c2 was reported by the E791 Collaboration [24].Results of the fit with model K��� B0 are summarized inTable IV. The agreement with the data is somewhat im-proved as compared to the model K��� A0. However, ifthe mass and the width of the > are allowed to float, the fitfinds M�’’>’’� � 1:23� 0:07 GeV=c2 and $�”>”� �2:41� 0:26 GeV=c2. Both the mass and the width differfrom those for the > state measured by the E791
0
5
10
15
20
25
0 2 4 6 8 10 12 14
M2(K+K-)min (GeV2/c4)
M2(K+K-)max (GeV2/c4)
(b)
r the (a) K����� and (b) K�K�K� final states.
-12

0
20
40
60
80
100
120
140
1 2 3 4 5M(K+π-) (GeV/c2)
Events/(0.05 GeV/c2) (a)
0
20
40
60
80
0.6 0.8 1.0 1.2 1.4 1.6 1.8
0
20
40
60
80
100
120
140
1 2 3 4 5M(K+π-) (GeV/c2)
Events/(0.05 GeV/c2) (d)
0
20
40
60
80
0.6 0.8 1.0 1.2 1.4 1.6 1.8
0
20
40
60
80
100
120
140
160
180
0 1 2 3 4 5M(π+π-) (GeV/c2)
Events/(0.05 GeV/c2) (b)
0
5
10
15
20
25
30
2.6 2.8 3.0 3.2 3.4 3.6 3.8 4.0
0
20
40
60
80
100
120
140
160
180
0 1 2 3 4 5M(π+π-) (GeV/c2)
Events/(0.05 GeV/c2) (e)
0
5
10
15
20
25
30
2.6 2.8 3.0 3.2 3.4 3.6 3.8 4.0
0
20
40
60
80
1 2 3 4 5M(K+π+) (GeV/c2)
Events/(0.05 GeV/cc2) (c)
0
20
40
60
80
1 2 3 4 5M(K+π+) (GeV/c2)
Events/(0.05 GeV/c2) (f)
FIG. 9. Results of the fit to K����� events in the signal region with model K��� A0 (left column) and model K��� C0 (rightcolumn). Points with error bars are data, the open histograms are the fit result and hatched histograms are the background components.Insets in (a) and (d) show the K��892� � K�
0�1430� mass region in 20 MeV=c2 bins. Insets in (b) and (e) show the �c0 mass region in25 MeV=c2 bins. Note that for plots (a) and (d) [(b) and (e)] an additional requirement M������> 1:5 GeV=c2 (M�K����>1:5 GeV=c2) is imposed.
DALITZ ANALYSIS OF THE THREE-BODY CHARMLESS . . . PHYSICAL REVIEW D 71, 092003 (2005)
Collaboration. On the other hand, a scalar amplitude withsuch a large width could be an indication of the presence ofa nonresonant amplitude. To check this hypothesis, weconstruct model K��� CJ, that is model K��� AJplus a nonresonant amplitude parametrized by Eq. (11).Results of the fit with model K��� C0 are given inTable IV and shown in Figs. 9(d)–9(f).
The mass and width of the fX�1300� state obtainedfrom the fit with model K��� C0 are consistent withthose for the f0�1370� [15]. If a tensor amplitude isused for the fX�1300� state (model K��� C2), the fitfinds M�fX�1300�� � 1:377� 0:038 GeV=c2 and$�fX�1300�� � 0:085� 0:031 GeV=c2 ( � 2 logL ��4013:0; �2=Nbin � 103:8=106), which disagree with
092003
the world average f2�1270� parameters [15]. In thecase of a vector amplitude (model K��� C1), the fitgives M�fX�1300�� � 1:330� 0:019 GeV=c2 and$�fX�1300�� � 0:210 � 0:048 GeV=c2 ( � 2 logL ��4048:1; �2=Nbin � 105:5=106). Based on this study,we choose model K��� C0 as our default and obtainall the final results for the B� ! K����� decay usingthis model. Figure 11 shows the M�K���� (M������)distributions in slices ofM2������ (M2�K����) to allowa more detailed comparison of the data and fit results withmodel K��� C0.
In addition to the two-particle invariant mass distribu-tions shown in Figs. 9 and 11, the helicity angle distribu-tions for several regions are shown in Fig. 12. (For the
-13

TABLE IV. Summary of fit results to K����� events in the signal region. The two values given for model K��� C0 correspondto two solutions (see text for details).
Parameter ModelK��� A0 K��� B0 K��� C0
Solution 1/Solution 2
K��892�0�� Fraction, % 18:0 � 1:4 14:1� 1:3 13:7� 1:1=12:6 � 1:3Phase, 0 (fixed)
K�0�1430�
0�� Fraction, % 42:1 � 3:7 48:6� 3:4 58:4� 2:7=10:7 � 2:8Phase, 11� 8 73� 9 36� 7=� 11� 9
��770�0K� Fraction, % 11:2 � 1:4 9:85� 1:20 10:0 � 1:5=8:18� 0:92Phase, �17� 18 25� 25 �52� 18=47� 25
f0�980�K� Fraction, % 16:5 � 1:5 17:4� 1:7 15:8� 2:5=14:0 � 1:4
Phase, 33� 19 74� 23 20� 16=94� 17Mass, GeV=c2 0:975� 0:004 0:976� 0:004 0:976� 0:004=0:975� 0:003Width, GeV=c2 0:063� 0:009 0:065� 0:009 0:061� 0:009=0:053� 0:009
�c0K� Fraction, % 3:56� 0:93 3:09� 0:87 2:86� 0:58=2:13� 0:67
Phase, �124� 16 �37� 24 �29� 23=� 15� 22
fX�1300�K� Fraction, % 6:70� 1:42 6:14� 1:50 5:47� 2:47=3:75� 1:70Phase, 160� 18 185� 21 158� 18=� 134� 22
Mass, GeV=c2 1:369� 0:026 1:344� 0:026 1:369� 0:026=1:400� 0:028Width, GeV=c2 0:220� 0:063 0:227� 0:070 0:185� 0:052=0:165� 0:048
>�� Fraction, % . . . 20:3� 0:0 . . .Phase, . . . �139� 6 . . .
Mass, GeV=c2 . . . 0.797 (fixed) . . .Width, GeV=c2 . . . 0.410 (fixed) . . .
Nonresonant Fraction, % . . . . . . 36:2� 3:2=40:1 � 5:2anr
2 =anr1 . . . . . . 0:34� 0:09=0:42� 0:09
4nr1 , . . . . . . �25� 7=8� 84nr
2 , . . . . . . 140� 16=� 146� 133 . . . . . . 0:102� 0:023=0:106� 0:022
Charmless totala
Fraction, % 97:7 � 0:6 96:6� 0:8 97:5� 0:7=97:6 � 0:6�2 lnL �3845:3 �3966:6 �4041:8=� 4024:4�2 227.8 129.0 104:2=107:1Nbins 106 106 106Nfit:var: 14 16 19
aHere ‘‘Charmless total’’ refers to the total three-body B� ! K����� signal excluding the contribution from B� ! �c0K�.
0
20
40
60
80
100
0.6 0.8 1.0 1.2 1.4 1.6M(K+π-) (GeV/c2)
Events/(0.05 GeV/c2)
(a)datafit with model A0fit with model C0
0
20
40
60
80
100
0.6 0.8 1.0 1.2 1.4 1.6M(K+π-) (GeV/c2)
Events/(0.05 GeV/c2)
(b)datafit with model A0fit with model C0
FIG. 10. K��� invariant mass distributions for K����� events with (a) M2������< 11 GeV=c2 and (b) M2������>11 GeV=c2.
A. GARMASH et al. PHYSICAL REVIEW D 71, 092003 (2005)
092003-14

0
20
40
60
80
100
120
1 2 3 4 5M(K+π-) (GeV/c2)
Events/(0.10 GeV/cc2)
M2(π+π-) < 5 GeV2/c4(a)
0
20
40
60
80
0 1 2 3 4 5M(π+π-) (GeV/c2)
Events/(0.10 GeV/c2)
M2(K+π-) < 5 GeV2/c4(f)
0
10
20
30
40
50
60
70
1 2 3 4 5M(K+π-) (GeV/c2)
Events/(0.10 GeV/c2)
5 GeV2/c4 < M2(π+π-) < 10 GeV2/c4(b)
0
10
20
30
40
0 1 2 3 4 5M(π+π-) (GeV/c2)
Events/(0.10 GeV/c2)
5 GeV2/c4 < M2(K+π-) < 10 GeV2/c4(g)
0
10
20
30
40
50
1 2 3 4 5M(K+π-) (GeV/c2)
Events/(0.10 GeV/c2)
10 GeV2/c4 < M2(π+π-) < 15 GeV2/c4(c)
0
10
20
30
40
0 1 2 3 4 5M(π+π-) (GeV/c2)
Events/(0.10 GeV/c2)
10 GeV2/c4 < M2(K+π-) < 15 GeV2/c4(h)
0
20
40
60
80
1 2 3 4 5M(K+π-) (GeV/c2)
Events/(0.10 GeV/c2)
15 GeV2/c4 < M2(π+π-) < 20 GeV2/c4(d)
0
10
20
30
40
50
60
70
0 1 2 3 4 5M(π+π-) (GeV/c2)
Events/(0.10 GeV/c2)
15 GeV2/c4 < M2(K+π-) < 20 GeV2/c4(i)
0
5
10
15
20
25
30
35
1 2 3 4 5M(K+π-) (GeV/c2)
Events/(0.10 GeV/c2)
20 GeV2/c4 < M2(π+π-) (e)
0
20
40
60
80
100
0 1 2 3 4 5M(π+π-) (GeV/c2)
Events/(0.10 GeV/c2)
20 GeV2/c4 < M2(K+π-) (j)
FIG. 11. M�K���� (M������) distributions in slices of M������ (M�K����). Points with error bars are data, the openhistograms are the fit results with model K��� C0 and the hatched histogram is the background component. Solid and dottedhistograms correspond to Solution 1 and Solution 2, respectively, (see Table IV and text for details).
DALITZ ANALYSIS OF THE THREE-BODY CHARMLESS . . . PHYSICAL REVIEW D 71, 092003 (2005)
���� combination the helicity angle is defined in a simi-lar way as for K��� combination.) All plots shown inFig. 12 demonstrate good agreement between data and thefit.
To test for the contribution of other possible quasi-two-body intermediate states such as K��1410�0��,
092003
K��1680�0��, K�2�1430�
0��, or f2�1270�K�, we include
an additional amplitude of each of these channels in modelK��� C0 and repeat the fit to data. None of these chan-nels have a statistically significant signal.
To estimate the model dependent uncertainty in thebranching fractions for individual quasi-two-body chan-
-15

0
10
20
30
40
50
-1.0 -0.5 0.0 0.5 1.0cos(θH)
Events/0.10
(a)
0
20
40
60
80
100
-1.0 -0.5 0.0 0.5 1.0cos(θH)
Events/0.10
(b)
0
10
20
30
40
50
-1.0 -0.5 0.0 0.5 1.0cos(θH)
Events/0.10
(c)
0
10
20
30
40
50
-1.0 -0.5 0.0 0.5 1.0cos(θH)
Events/0.10
(d)
FIG. 12. Helicity angle distributions for K����� events in different regions: (a) K��892�0 (0:82 GeV=c2 <M�K����<0:97 GeV=c2); (b) K�
0�1430�0 �1:0 GeV=c2 <M�K����< 1:76 GeV=c2�; (c) ��770�0 �M������< 0:90 GeV=c2� and (d)
f0�980� �0:90 GeV=c2 <M������< 1:06 GeV=c2�. Points with error bars are data, the open histogram is the fit result with modelK��� C0 and the hatched histogram is the background component. Visible irregularities are due to vetoes applied on invariantmasses of two-particle combinations.
A. GARMASH et al. PHYSICAL REVIEW D 71, 092003 (2005)
nels, we use the results of fits obtained with modelsK��� BJ and K��� CJ � R, where R is one of anadditional resonances mentioned above. We also use differ-ent parametrizations of the nonresonant amplitude to esti-mate the related uncertainty. We try the followingalternative parametrizations:
(a) A
nr�K������ � anr1 e�3s13ei4nr1 �
anr2 e
�3s23ei4nr2 � anr
3 e�3s12ei4
nr3 ;
nr nr
(b) A
nr�K������ �a1
s13ei4
nr1 �
a2
s23ei4
nr2 ;
nr
(c) A nr�K������ � anrei4 . While fitting the data with model K��� C0, we foundthat two solutions with very similar likelihood values exist.The comparison between the two solutions and the data areshown in Fig. 11. The main difference between these twosolutions is the relative fractions of the total B� !K����� signal ascribed to the B� ! K�
0�1430�0�� de-
cay: the fraction of this channel changes by a factor ofabout five. The reason for the existence of the secondsolution is similar behavior of the two amplitudes [thenonresonant component parametrized by Eq. (11) andthe scalar K�
0�1430�0�� amplitude] as functions of
M2�K����. Because of the large width of the K�0�1430�
0
resonance, these two amplitudes can be, to a large extent,interchanged providing a nearly identical description of thedata. An even stronger effect is observed in the case ofmodel K��� B0 when the mass and width of the ‘‘>’’
092003
resonance is allowed to float. In this case the two ampli-tudes are almost identical. A similar behavior is observedfor all the parametrizations used to describe the nonreso-nant amplitude. The existence of secondary maxima of thelikelihood function is confirmed with MC simulation (seeSec. VIII for the more detailed discussion).
E. Fitting the B� ! K�K�K� signal
The Dalitz plot for K�K�K� events in the signal regionis shown in Fig. 8(b). There are 1400 events in the signalregion. In the analysis of the K�K�K� final state wefollow the same strategy as in the case of the K�����
state. In an attempt to describe all the features in theK�K�
mass spectrum mentioned in Sec. V, we start with thefollowing minimal matrix element of the B� !K�K�K� decay (referred to as model KKK � AJ):
SA�K�K�K�� � a�ei4��A1�K�1 K
�2 K
�j��
�A1�K�2 K
�1 K
�j���
� a�c0ei4�c0 �A0�K
�1 K
�2 K
�j�c0�
�A0�K�2 K
�1 K
�j�c0��
� afXei4fX �AJ�K�
1 K�2 K
�jfX�
�AJ�K�2 K
�1 K
�jfX��; (26)
-16

DALITZ ANALYSIS OF THE THREE-BODY CHARMLESS . . . PHYSICAL REVIEW D 71, 092003 (2005)
where the subscript J denotes the unknown spin of thefX�1500� resonance; amplitudes ai, relative phases 4i,mass and width of the fX�1500� resonance are fit parame-ters. As there are two identical kaons in the final state, theamplitude in Eq. (26) is symmetrized with respect toK�
1 $ K�2 interchange. When fitting the data, we choose
the fX�1500�K� signal as our reference by fixing its am-plitude and phase (afX � 1 and 4fX � 0). Figs. 13(a)–13(c) show the two-kaon invariant mass projections formodel KKK � A0 and the data. The numerical values ofthe fit parameters are given in Table V. Although the dataare described relatively well even with this simple matrixelement, there is a region where the agreement is notsatisfactory. The enhancement of signal events in the
0
20
40
60
80
100
120
0.5 1 1.5 2 2.5 3 3.5 4M(K+K-)min (GeV/c
2)
Events/(0.05 GeV/c2)
(a)
0
10
20
30
40
50
60
0.99 1.00 1.01 1.02 1.03 1.04 1.05
0
20
40
60
80
0.5 1 1.5 2 2.5 3 3.5 4 4.5 5M(K+K-)max (GeV/c
2)
Events/(0.05 GeV/cc2)
(b)
0
5
10
15
20
25
2.8 3.0 3.2 3.4 3.6 3.8 4.0
0
10
20
30
40
50
60
70
0.5 1 1.5 2 2.5 3 3.5 4 4.5 5M(K+K+) (GeV/c2)
Events/(0.05 GeV/c2)
(c)
FIG. 13. Results of the fit with the model KKK � A0 (left columnNote that the first and the second rows show the distributions for thebars are data, the open histogram is the fit result and hatched histogr��1020� mass region in 2 MeV=c2 bins. Insets in (b) and (e) shorequirement 2:0 GeV=c2 <M�K�K��min < 3:4 GeV=c2.
092003
higher K�K� mass range visible in Fig. 13(a) causes thewidth of the fX�1500� state determined from the fit withmodel KKK � A0 to be very large. This results in a poordescription of the data in the M�K�K�� ’ 1:5 GeV=c2
region, where the peaking structure is significantly nar-rower. On the other hand, as for B� ! K�����, theexcess of signal events at highM�K�K�� may be evidencefor nonresonant B� ! K�K�K� decay. To test this hy-pothesis, we extend model KKK � AJ to include a non-resonant amplitude (model KKK � BJ) parametrized byEq. (12). Results of the fit with model KKK � B0 areshown in Figs. 13(d)–13(f); numerical values of the fitparameters are given in Table V. The agreement with datais significantly improved compared to model KKK � A0.
0
20
40
60
80
100
120
0.5 1 1.5 2 2.5 3 3.5 4M(K+K-)min (GeV/c
2)
Events/(0.05 GeV/c2)
(d)
0
10
20
30
40
50
60
0.99 1.00 1.01 1.02 1.03 1.04 1.05
0
20
40
60
80
0.5 1 1.5 2 2.5 3 3.5 4 4.5 5M(K+K-)max (GeV/c
2)
Events/(0.05 GeV/c2)
(e)
0
5
10
15
20
25
2.8 3.0 3.2 3.4 3.6 3.8 4.0
0
10
20
30
40
50
60
70
0.5 1 1.5 2 2.5 3 3.5 4 4.5 5M(K+K+) (GeV/c2)
Events/(0.05 GeV/c2)
(f)
) and KKK � B0 (right column) to events in the signal region.M�K�K��min and M�K�K��max, respectively. Points with erroram is the background component. Insets in (a) and (d) show thew the �c0 mass region in 25 MeV=c2 bins with an additional
-17

TABLE V. Summary of fit results to K�K�K� events in the signal region. The two values given for model KKK � B0 correspond tothe two solutions (see text for details).
Parameter ModelKKK � A0 KKK � B0
Solution 1/Solution 2
��1020�K� Fraction, % 14:0 � 1:2 14:7� 1:3=15:2 � 1:3Phase, �17� 11 �123� 10=� 200� 10
fX�1500�K� Fraction, % 83:3 � 2:5 63:4 � 6:9=8:21� 1:94
Phase, 0 (fixed)Mass, GeV=c2 1:373� 0:025 1:524� 0:014=1:491� 0:018Width, GeV=c2 0:720� 0:058 0:136� 0:023=0:145� 0:029
�c0K� Fraction, % 4:48� 1:4 2:67� 0:82=8:01� 1:35
Phase, 165� 15 �118 � 15=127� 10
Nonresonant Fraction, % . . . 74:8� 3:6=65:1 � 5:1Phase, . . . �68� 9=61� 10
3 . . . 0:121� 0:014=0:116� 0:015
Charmless totala
Fraction, % 96:0 � 0:7 95:2� 1:0=95:6 � 0:9
�2 lnL �2140:4 �2218:2=� 2177:4�2 65.0 43:3=57:1Nbins 53 53Nfit:var: 6 9
aHere ‘‘Charmless total’’ refers to the total three-body B� ! K�K�K� signal excluding the contribution from B� ! �c0K�.
A. GARMASH et al. PHYSICAL REVIEW D 71, 092003 (2005)
In order to check the sensitivity of the data to the spin of thefX�1500� state, we replace the scalar amplitude by a vector(model KKK � B1) or a tensor (model KKK � B2) am-plitude for the fX�1500� with its mass and width as freeparameters. The scalar hypothesis gives the best fit.Figure 14 shows a detailed comparison of the fit and theM�K�K��min (M�K�K��max) distributions for differentslices of M2�K�K��max (M2�K�K��min). Finally, Fig. 15shows the helicity angle distributions for the � andfX�1500� regions. Based on these results, we choose modelKKK � B0 as the default. All of the final results for thedecay B� ! K�K�K� are based on this model.
To estimate the model dependent uncertainty in therelative fractions of individual quasi-two-body intermedi-ate states and determine the contribution of other possiblequasi-two-body intermediate states, we modify modelKKK � B0 to include an additional decay channel andrepeat the fit to the data. In particular we test the��1680�K�, f02�1525�K
� and a2�1320�K� channels. Inall cases the fit finds no statistically significant signal forthe newly added channel. Since we observe a clearf0�980�K
� signal in the K����� final state, we try toinclude the f0�980�K
� amplitude in the B� ! K�K�K�
matrix element as well: no statistically significant contri-bution from this channel is found. As the dominant modeluncertainty is related to the parametrization of the non-resonant amplitude, we use several alternative, yet alsoarbitrary, parametrizations to estimate the relevant uncer-tainty:
092003
(a) A
-18
nr�K�K�K�� � anr
1 �e�3s13 � e�3s23�ei4
nr1 �
anr2 e
�3s12ei4nr2 ;
(b) A
nr�K�K�K�� � anr1 �1s13
� 1s23�ei4
nr1 ;
nr
(c) A nr�K�K�K�� � anrei4 . As in the case of B� ! K�����, we find two solutionsin the fit to K�K�K� events with model KKK � B0. Thecomparison between the two solutions and the data areshown in Fig. 14. The main difference in these two solu-tions is in the fraction of the B� ! fX�1500�K
� signalwhich changes by about an order of magnitude. Results forboth solutions of the KKK � B0 model are given inTable V.
F. MC pseudoexperiments
The parameters that are directly determined from the fitto data are the amplitudes and phases with their statisticalerrors. However, while the relative fraction for a particularquasi-two-body channel depends only on the correspond-ing amplitude in the matrix element, its statistical errordepends on the statistical errors of all amplitudes andphases. To determine the statistical errors for quasi-two-body channels, we use a MC pseudoexperiment technique.
MC pseudoexperiments are MC generated sampleswhich are the proper mixture of ‘‘signal’’ and ‘‘back-ground’’ events distributed according to density functionsdetermined from the fit to experimental events. For eachmodel we generate 100 statistically independent MC pseu-doexperiments with numbers of signal and background

0
2
4
6
8
10
12
0.5 1.0 1.5 2.0 2.5 3.0 3.5 4.0M(K+K-)min (GeV/c
2)
Events/(0.05 GeV/c2)
M2(K+K-)max < 5 GeV2/c4(a)
0
5
10
15
20
25
30
1.5 2.0 2.5 3.0 3.5 4.0 4.5 5.0M(K+K-)max (GeV/c
2)
Events/(0.05 GeV/c2)
M2(K+K-)min < 1.05 GeV2/c4(f)
0
5
10
15
20
25
30
35
0.5 1.0 1.5 2.0 2.5 3.0 3.5 4.0M(K+K-)min (GeV/c
2)
Events/(0.05 GeV/c2)
5 GeV2/c4 < M2(K+K-)max < 10 GeV2/c4(b)
0
10
20
30
40
1.5 2.0 2.5 3.0 3.5 4.0 4.5 5.0M(K+K-)max (GeV/c
2)
Events/(0.05 GeV/c2)
1.05 GeV2/c4 < M2(K+K-)min < 5 GeV2/c4(g)
0
10
20
30
40
0.5 1.0 1.5 2.0 2.5 3.0 3.5 4.0M(K+K-)min (GeV/c
2)
Events/(0.05 GeV/c2)
10 GeV2/c4 < M2(K+K-)max < 15 GeV2/c4(c)
0
5
10
15
20
1.5 2.0 2.5 3.0 3.5 4.0 4.5 5.0M(K+K-)max (GeV/c
2)
Events/(0.05 GeV/c2)
5 GeV2/c4 < M2(K+K-)min < 10 GeV2/c4(h)
0
10
20
30
40
0.5 1.0 1.5 2.0 2.5 3.0 3.5 4.0M(K+K-)min (GeV/c
2)
Events/(0.05 GeV/c2)
15 GeV2/c4 < M2(K+K-)max < 20 GeV2/c4(d)
0
2
4
6
8
10
1.5 2.0 2.5 3.0 3.5 4.0 4.5 5.0M(K+K-)max (GeV/c
2)
Events/(0.05 GeV/c2)
10 GeV2/c4 < M2(K+K-)min (i)
0
10
20
30
40
0.5 1.0 1.5 2.0 2.5 3.0 3.5 4.0M(K+K-)min (GeV/c
2)
Events/(0.05 GeV/c2)
20 GeV2/c4 < M2(K+K-)max (e)
FIG. 14. M�K�K��min �M�K�K��max� distributions in slices of M�K�K��max (M�K�K��min). Points with error bars are data, theopen histograms are the fit results with model KKK � B0 and the hatched histogram is the background component. Solid and dottedhistograms correspond to Solution 1 and Solution 2, respectively, (see Table V and text for details).
DALITZ ANALYSIS OF THE THREE-BODY CHARMLESS . . . PHYSICAL REVIEW D 71, 092003 (2005)
092003-19

0
5
10
15
20
25
30
35
-1.0 -0.5 0.0 0.5 1.0cos(θH)
Events/0.10
(a)
0
10
20
30
40
50
60
70
-1.0 -0.5 0.0 0.5 1.0cos(θH)
Events/0.10
(b)
FIG. 15. Helicity angle distributions for events in the (a) � mass region (�M�K�K��min < 1:05 GeV=c2�) and in the (b) fX�1500�region �1:05 GeV=c2 <M�K�K��min < 3:0 GeV=c2�. Points with error bars are data, the open histogram is the fit result with modelKKK � B0 and the hatched histogram is the background component.
A. GARMASH et al. PHYSICAL REVIEW D 71, 092003 (2005)
events equal to those found in the experiment, fit these MCsamples, and determine the relative fractions fl of quasi-two-body channels for each sample. The fl distributionsare then fit by a Gaussian function; the sigma of theGaussian determined from the fit is assigned as the statis-tical error.
VII. BRANCHING FRACTION RESULTS ANDSYSTEMATIC UNCERTAINTIES
In previous sections we determined the relative fractionsof various quasi-two-body intermediate states in three-body B� ! K����� and B� ! K�K�K� decays. Totranslate those values into absolute branching fractions, wefirst need to determine the branching fractions for thethree-body decays. To determine the reconstruction effi-ciency for the B� ! K����� and B� ! K�K�K� de-cays, we use a MC simulation where events are distributedover phase space according to the matrix elements ofmodel K��� C0 and model KKK � B0, respectively.The corresponding reconstruction efficiencies are 21:1�0:2% and 22:3� 0:2%. Results of the branching fractioncalculations for the total three-body charmless B� !K����� and B� ! K�K�K� decays [25] and all thequasi-two-body intermediate channels are summarized inTable VI, where the first quoted error is statistical, thesecond is systematic and the third is the model uncertainty.Branching fractions for R! h�h� decays are taken from[15].
For most of the quasi-two-body channels the differencein branching fractions from the two solutions is relativelysmall and treated as model error. However values for theB� ! K�
0�1430�0�� branching fraction are substantially
different for the two solutions and we quote both values inTable VI. For the B� ! �c0K� decay the central value iscalculated by combining measurements in �c0 ! ����
channel and the best fit in �c0 ! K�K� channel, the
092003
second solution in �c0 ! K�K� channel is used for modelerror estimation. As the interpretation of the fX�1300� andfX�1500� states is uncertain, we do not quote the corre-sponding branching fractions.
For quasi-two-body channels where no significant signalis observed, we calculate 90% confidence level upperlimits f90 for their fractions. To determine the upper limitwe use the following formula
0:90 �
Rf900 G�a; �; x�dxR10 G�a; �; x�dx
; (27)
where G�a; �; x� is a Gaussian function with the measuredmean value a for the signal fraction and its statistical error�. To account for the model uncertainty we determine theresonance’s contribution with different parameterizationsof the nonresonant amplitude and use the largest value toevaluate the upper limit. To account for the systematicuncertainty we decrease the reconstruction efficiency by1 standard deviation.
The dominant sources of systematic error are listed inTable VII. For the branching fractions of three-body B� !K����� and B� ! K�K�K� decays, we estimate thesystematic uncertainty due to variations of the reconstruc-tion efficiency over the Dalitz plot by varying the relativephases and amplitudes of the quasi-two-body states withintheir errors. The systematic uncertainty due to require-ments on event shape variables is estimated from a com-parison of their distributions for signal MC events andB� ! �D0�� events in the data. We estimate the uncer-tainty in the signal yield extraction from the fit to the �Edistribution by varying the parameters of the fitting func-tion within their errors. The uncertainty due to backgroundparametrization is estimated by varying the relative frac-tion of the B �B background component and the slope of theq �q background function within their errors. The uncer-tainty from the particle identification efficiency is esti-
-20

TABLE VII. Contributions to the systematic uncertainty (inpercent) for the three-body B� ! K����� and B� !K�K�K� branching fractions.
Source ErrorK����� K�K�K�
Efficiency nonuniformity 1.2 0.7Event shape requirements 2.5 1.7Signal yield extraction 5.4 2.1PID 6.0 6.0Charged track reconstruction 3.0 3.0MC statistics 1.0 1.0NB �B Estimation 1.0 1.0
Total 9.2 7.4
TABLE VI. Summary of branching fraction results. The first quoted error is statistical, the second is systematic and the third is themodel error. The branching fraction values in this table are obtained from the product of the appropriate fractions in Tables IV and Vwith the branching ratios obtained from the signal yields in Table I. Note that the yields in Table I include �c0 contributions. Thecharmless total fractions in this table exclude the �c0 contribution. The value given in brackets for the K�
0�1430�0�� channel
corresponds to the second solution (see text for details).
Mode B�B� ! Rh�� �B�R! h�h�� � 106 B�B� ! Rh�� � 106
K����� Charmless total . . . 46:6 � 2:1 � 4:3K��892�0��, K��892�0 ! K��� 6:55� 0:60� 0:60�0:38
�0:57 9:83� 0:90� 0:90�0:57�0:86
K�0�1430�
0��, K�0�1430�
0 ! K��� 27:9 � 1:8� 2:6�8:5�5:4 45:0� 2:9� 6:2�13:7
�8:7(5:12� 1:36� 0:49�1:91
�0:51) (8:26� 2:20� 1:19�3:08�0:82)
K��1410�0��, K��1410�0 ! K��� <2:0 . . .K��1680�0��, K��1680�0 ! K��� <3:1 . . .K�
2�1430�0��, K�
2�1430�0 ! K��� <2:3 . . .
��770�0K�, ��770�0 ! ���� 4:78� 0:75� 0:44�0:91�0:87 4:78� 0:75� 0:44�0:91
�0:87f0�980�K
�, f0�980� ! ���� 7:55� 1:24� 0:69�1:48�0:96 . . .
f2�1270�K�, f2�1270� ! ���� <1:3 . . .
Nonresonant . . . 17:3� 1:7� 1:6�17:1�7:8
K�K�K� charmless total . . . 30:6 � 1:2 � 2:3�K�, �! K�K� 4:72� 0:45� 0:35�0:39
�0:22 9:60� 0:92� 0:71�0:78�0:46
��1680�K�, ��1680� ! K�K� <0:8f0�980�K�, f0�980� ! K�K� <2:9f02�1525�K
�, f02�1525� ! K�K� <4:9a2�1320�K
�, a2�1320� ! K�K� <1:1Nonresonant . . . 24:0 � 1:5� 1:8�1:9
�5:7
�c0K�, �c0 ! ���� 1:37� 0:28� 0:12�0:34
�0:35 . . .�c0K
�, �c0 ! K�K� 0:86� 0:26� 0:06�0:20�0:05 . . .
�c0K� combined . . . 196� 35� 33�197
�26
DALITZ ANALYSIS OF THE THREE-BODY CHARMLESS . . . PHYSICAL REVIEW D 71, 092003 (2005)
mated using pure samples of kaons and pions from D0 !K��� decays, where the D0 flavor is tagged using D�� !D0��. The systematic uncertainty in charged track recon-struction is estimated using partially reconstructed D� !D� events and from comparison of the ratio of %!�����0 to %! && events in data and MC. The overallsystematic uncertainty for the three-body branching frac-tion is estimated to be �9:2% and �7:4% for theK����� and K�K�K� final states, respectively.
092003
VIII. DISCUSSION AND CONCLUSION
With a 140 fb�1 data sample collected with the Belledetector, we have performed the first amplitude analysis ofB meson decays to three-body charmless K����� andK�K�K� final states. Clear signals are observed in theB� ! K��892�0��, B� ! ��770�0K�, B� ! f0�980�K�
and B� ! �K� decay channels [26]. The model uncer-tainty for these channels is relatively small due to thenarrow width of the intermediate resonances and (invector-pseudoscalar decays) due to vector meson polariza-tion which provides clear signal signatures.
The branching fraction measured for the decay B� !K��892�0�� is significantly lower than that reported ear-lier [6,9]. The simplified technique used for the analysis ofthe B� ! K����� decay described in [6,9] has no sen-sitivity to the relative phases between different resonances,resulting in a large model error. The full amplitude analysispresented in this paper consistently treats effects of inter-ference between quasi-two-body amplitudes thus reducingthe model error. The analysis suggests the presence of anadditional (presumably nonresonant) amplitude in themass region of the K��892�0 that absorbs a significantfraction of the B signal. The B� ! K��892�0�� branchingfraction measured in our analysis is in better agreement
-21

A. GARMASH et al. PHYSICAL REVIEW D 71, 092003 (2005)
with theoretical predictions based on the QCD factoriza-tion approach [27].
The decay mode B� ! f0�980�K� is the first observed
example of a B decay to a charmless scalar-pseudoscalarfinal state. The mass M�f0�980�� � 976� 4�2
�3 MeV=c2
and width $�f0�980�� � 61 � 9�14�8 MeV=c2 obtained
from the fit are in agreement with previous measurements[15]. To check the sensitivity of the results to the parame-trization of the f0�980� lineshape, we repeat the fit with theFlatte lineshape [21]. In this case, because of limitedstatistics, we fix gK at the value reported by the E791Collaboration [28]: gK � 0:02� 0:04� 0:03. Since thecentral value for gK measured in [28] is consistent withzero, we also make a fit to data with gK fixed at zero.Finally we repeat the fit with both g� and gK floated. In allcases we obtain consistent results. The sensitivity to theB� ! f0�980�K� decay in the K�K�K� final state isgreatly reduced by the large B� ! �K� amplitude andby the scalar nonresonant amplitude. No statistically sig-nificant contribution from this channel to the K�K�K�
three-body final state is observed, thus only a 90% con-fidence level upper limit for the corresponding branchingfractions product is reported.
We report the first observation of the decay B� !��770�0K�. The statistical significance [29] of the signalexceeds 6� with all the models used to fit the B� !K����� signal. The measured branching fraction forthis channel agrees well with the theoretical prediction inQCD factorization [27]. This is one of the channels wherelarge direct CP violation is expected [27].
Because of the very narrow width of the � meson, thebranching fraction for the decay B� ! �K� is determinedwith a small model uncertainty. The obtained value is ingood agreement with previous measurements [30].
A clear signal is also observed for the decay B� !�c0K
� in both �c0 ! ���� and �c0 ! K�K� channels.Although quite significant statistically, the B� ! �c0K
�
signal constitutes only a small fraction of the total three-body signal and thus suffers from a large model error,especially in the K�K�K� final state, where the charmlessnonresonant amplitude in the �c0 mass region is enhancedcompared to the K����� final state due to the interfer-ence caused by the presence of the two identical kaons.
We also check possible contributions from B� !K�
2�1430�0��, B� ! K��1410�0��, B� !
K��1680�0��, and B� ! f2�1270�K� decays. In the
K�K�K� final states we check for the B� !f02�1525�K
�, B� ! a2�1320�K�, and B� ! ��1680�K�
signals. We find no statistically significant signal in any ofthese channels. As a result, we set 90% confidence levelupper limits for their branching fractions. In the factoriza-tion approximation, charmless B decays to pseudoscalar-tensor final states are expected to occur at the level of 10�6
or less [31].For other quasi-two-body channels the interpretation of
fit results is less certain. Although a signal for B� !
092003
K�0�1430�
0�� is observed with a high statistical signifi-cance, its branching fraction is determined with a largemodel error. Two solutions with significantly differentfractions of the B� ! K�
0�1430�0�� channel but similar
likelihood values are obtained from the fit to K�����
events. Study with MC simulation confirms the presence ofthe second solution. We prepare MC pseudoexperimentswhere the B� ! K����� signal is generated with thematrix element of model K��� C0 with parameters cor-responding to one of the solutions. In both cases the secondsolution is found in the fit to MC samples. It is also worthmentioning that the two solutions exist with all the param-eterizations of the nonresonant amplitudes we tested. Thismay indicate that in order to choose a unique solutionadditional external information is required. In this sense,the useful piece of information seems to be the phenome-nological estimation of the B� ! K�
0�1430�0�� branching
fraction. The analysis of B meson decays to scalar-pseudoscalar final states described in Ref. [32] suggeststhat the branching fraction for the B� ! K�
0�1430�0��
decay can be as large as 40� 10�6. Unfortunately, thepredicted value suffers from a large uncertainty that ismainly due to uncertainty in calculation of the K�
0�1430�decay constant fK�
0. Different methods used to estimate fK�
0
[32,33] give significantly different results. We may also tryto resolve the ambiguity by employing independent infor-mation from other experiments. For example, analysis ofthe real and imaginary parts of the amplitude separatelymay provide additional useful information. Following theidea by BaBar Collaboration [26] (see also discussionbelow), we employ LASS results on the partial waveanalysis of the elastic K � � scattering [34]. We comparethe total scalar K-� amplitude [which is a sum of theB� ! K�
0�1430�0�� amplitude and the K � � component
of the nonresonant amplitude Eq. (11)] with that measuredby LASS. From this comparison, we find that results of thebest fit (model K��� C0, solution I) to the K�����
signal events are in good qualitative agreement with theLASS data.
We cannot identify unambiguously the broad structuresobserved in the M������ ’ 1:3 GeV=c2 mass region inthe B� ! K����� decay denoted in our analysis asfX�1300� and at M�K�K�� ’ 1:5 GeV=c2 in the B� !K�K�K� decay denoted as fX�1500�. If approximated bya single resonant state, fX�1300� is equally well describedby a scalar or vector amplitude. Analysis with higherstatistics might allow a more definite conclusion. Thebest description of the fX�1500� is achieved with a scalaramplitude with mass and width determined from the fitconsistent with f0�1500� states [15].
Amplitude analysis often suffers from uncertainties re-lated to the nonunique parametrization of the decay am-plitude. In our case such an uncertainty originates mainlyfrom the parametrization of the nonresonant amplitude. Inthis analysis, we use a rather simplified empirical parame-
-22

DALITZ ANALYSIS OF THE THREE-BODY CHARMLESS . . . PHYSICAL REVIEW D 71, 092003 (2005)
trization with a single parameter. In the study of the B� !K����� decay by the BaBar Collaboration [26] a differ-ent approach is used. In their analysis, an attempt is madeto parametrize K�
0�1430�0�� and the nonresonant compo-
nent by a single amplitude suggested by the LASSCollaboration to describe the scalar amplitude in elasticK� scattering [34]. Although this approach is experimen-tally motivated, the use of the LASS parametrization islimited to the elastic region of M�K�� & 2:0 GeV=c2.Besides, an additional amplitude (a complex constant) isstill required for a satisfactory description of the data [26].
It is worth noting that fractions of the nonresonant decayin both B� ! K����� and B� ! K�K�K� decays arecomparable in size and comprise a significant fraction ofthe total three-body signals. Moreover, in the parametriza-tion used in this analysis the numerical values of theparameter [parameter 3 in Eqs. (11) and (12)] for theB� ! K����� and B� ! K�K�K� are very close.This may indicate that the nonresonant amplitudes inboth final states have a common nature, and simultaneousanalysis of these two decay modes may impose additionalconstraints. An attempt for such an analysis has been madein [35]. However, the proposed model considers only the�� � component [anr
2 in Eq. (11)] of the nonresonantamplitude and does not account for the K-� component[anr
1 in Eq. (11)], while in our analysis we find that the K �� component dominates (see Table IV).
In some cases the uncertainty in the parametrization ofthe nonresonant amplitude significantly affects the extrac-tion of relative fractions of other quasi-two-body channels.Further theoretical progress in this field might allow re-duction of this uncertainty.
Results of the B� ! K�K�K� Dalitz analysis can bealso useful in connection with the measurement of CPviolation in B0 ! K0
SK�K� decay reported recently by
the Belle [36] and BaBar [37] Collaborations. An isospinanalysis of B decays to three-kaon final states by Belle [3]
092003
and independent analysis with moments technique [38] byBaBar [39] suggest the dominance of the CP-even compo-nent in the B0 ! K0
SK�K� decay (after the B0 ! �K0
Ssignal is excluded). This conclusion can be checked inde-pendently by an amplitude analysis of the K0
SK�K� final
state, where the fraction of CP-odd states can be obtainedas a fraction of states with odd orbital momenta.Unfortunately, such an analysis is not feasible with thecurrent experimental data set. Nevertheless, the fact thatwe do not observe any significant vector amplitude otherthan B� ! �K� in the decay B� ! K�K�K� supportsthe conclusion.
ACKNOWLEDGMENTS
We thank the KEKB group for the excellent operation ofthe accelerator, the KEK Cryogenics group for the efficientoperation of the solenoid, and the KEK computer groupand the National Institute of Informatics for valuable com-puting and Super-SINET network support. We acknowl-edge support from the Ministry of Education, Culture,Sports, Science, and Technology of Japan and the JapanSociety for the Promotion of Science; the AustralianResearch Council and the Australian Department ofEducation, Science and Training; the National ScienceFoundation of China under contract No. 10175071; theDepartment of Science and Technology of India; theBK21 program of the Ministry of Education of Koreaand the CHEP SRC program of the Korea Science andEngineering Foundation; the Polish State Committee forScientific Research under Contract No. 2P03B 01324; theMinistry of Science and Technology of the RussianFederation; the Ministry of Education, Science and Sportof the Republic of Slovenia; the National Science Counciland the Ministry of Education of Taiwan; and the U.S.Department of Energy.
[1] G. Eilam, M. Gronau, and R. R. Mendel, Phys. Rev. Lett.74, 4984 (1995); S. Fajfer, R. J. Oakes, and T. N. Pham,Phys. Lett. B 539, 67 (2002).
[2] N. G. Deshpande, N. Sinha, and R. Sinha, Phys. Rev. Lett.90, 061802 (2003); However, this method might not workin practice, as explained in M. Gronau, Phys. Rev. Lett. 91,139101 (2003).
[3] A. Garmash et al. (Belle Collaboration), Phys. Rev. D 69,012001 (2004).
[4] T. Gershon and M. Hazumi, Phys. Lett. B 596, 163 (2004).[5] K. Abe et al. (Belle Collaboration), Report No. BELLE-
CONF-0317, 2003.[6] A. Garmash et al. (Belle Collaboration), Phys. Rev. D 65,
092005 (2002).
[7] E. Eckhart et al. (CLEO Collaboration), Phys. Rev. Lett.89, 251801 (2002).
[8] B. Aubert et al. (BaBar Collaboration), hep-ex/0206004;B. Aubert et al. (BaBar Collaboration), Phys. Rev. Lett.91, 051801 (2003).
[9] B. Aubert et al. (BaBar Collaboration), hep-ex/0303022.[10] S. Kurokawa, Nucl. Instr. and Meth. In Phys. Res. A 499, 1
(2003).[11] A. Abashian et al., Nucl. Instr. and Meth. In Phys. Res. A
479, 117 (2002).[12] R. Brun et al., GEANT 3.21, CERN Report No. DD/EE/
84-1, 1984.[13] H. Albrecht et al. (ARGUS Collaboration), Phys. Lett. B
229, 304 (1989).
-23
A. GARMASH et al. PHYSICAL REVIEW D 71, 092003 (2005)
[14] Events are generated with the CLEO group’s QQ programhttp://www.lns.cornell.edu/public/CLEO/soft/QQ.
[15] Particle Data Group, K. Hagiwara et al., Phys. Rev. D 66,10001 (2002) and 2003 off-year partial update for the2004 edition (http://pdg.lbl.gov).
[16] R. H. Dalitz, Philos. Mag. 44, 1068 (1953).[17] See ‘‘Review of Charm Dalitz-Plot Analyses’’ by D. Asner
in [15] and references therein.[18] J. Blatt and V. Weisskopf, Theoretical Nuclear Physics
(John Wiley & Sons, New York, 1952).[19] M. Wirbel, B. Stech, and M. Bauer, Z. Phys. C 29, 637
(1985).[20] H. Pilkuhn, The Interactions of Hadrons (North-Holland,
Amsterdam, 1967).[21] S. M. Flatte, Phys. Lett. B 63, 224 (1976).[22] M. G. Kendall and A. Stuart, The Advanced Theory of
Statistics, 2nd ed. (Hafner Publishing, New York, 1968).[23] In Dalitz analysis of D meson three-body decays it is
common to visualize results of the fit as projections onmass squared variables. Because of the large mass of the Bmeson, we find that visualization is more convenient interms of mass variables.
[24] E. M. Aitala et al. (E791 Collaboration), Phys. Rev. Lett.89, 121801 (2002).
[25] Note that B� ! �c0K� channel is excluded while calcu-
lating branching fraction for the total B� ! K�����
and B� ! K�K�K� three-body charmless decays.[26] At the time of the preparation of this manuscript for
publication, preliminary results on amplitude analysis ofB� ! K����� decay have been reported by BaBarCollaboration: hep-ex/0408032. All the quasi-two-bodybranching fraction results from Belle and BaBar analyses
092003
are in good agreement. The comparison of relative phasesis more uncertain due to differences in signal parametri-zations and limited statistics.
[27] See for example: M. Beneke and M. Neubert, Nucl. Phys.B675, 333 (2003); C.-W. Chiang, M. Gronau, Z. Luo, J. L.Rosner, and D. A. Suprun, Phys. Rev. D 69, 034001 (2004)and references therein.
[28] E. M. Aitala et al. (E791 Collaboration), Phys. Rev. Lett.86, 765 (2001).
[29] Statistical significance of the signal is calculated as������������������������������������2 ln�L0=Lmax�
p, where Lmax and L0 denote the maxi-
mum likelihood with the nominal signal yield and with thesignal yield fixed at zero, respectively.
[30] B. Aubert et al. (BaBar Collaboration), Phys. Rev. Lett.87, 151801 (2001);K.-F. Chen,A. Bozek et al. (Belle Collaboration), Phys. Rev. Lett.91, 201801 (2003).
[31] C. S. Kim, B. H. Lim, and S. Oh, Eur. Phys. J. C 22, 683(2002); C. S. Kim, J. P. Lee, and S. Oh, Phys. Rev. D 67,014002 (2003).
[32] V. L. Chernyak, Phys. Lett. B 509, 273 (2001).[33] K. Maltman, Phys. Lett. B 462, 14 (1999).[34] D. Aston et al. Nucl. Phys. B296, 493 (1988).[35] W. Ochs and P. Minkowski, Eur. Phys. J. C 39, 71 (2005).[36] K. Abe et al. (Belle Collaboration), Phys. Rev. Lett. 91,
261602 (2003); K. Abe et al. (Belle Collaboration), hep-ex/0409049.
[37] B. Aubert et al. (BaBar Collaboration), Phys. Rev. Lett.93, 181805 (2004).
[38] M. Pivk and F. R. Le Diberder, physics/0402083.[39] B. Aubert et al. (BaBar Collaboration), hep-ex/0408076.
-24
Copyright © 2022 FDOKUMEN