D7.1 – Impact areas and paths - PAsCAL project
110
Grant agreement no.: 815098 D7.1 – Impact areas and paths Date of publication: 30-11-2019 Disclaimer This report is part of a project that has received funding by the European Union’s Horizon 2020 research and innovation programme under grant agreement number 815098. The content of this report reflects only the authors’ view. The Innovation and Networks Executive Agency (INEA) is not responsible for any use that may be made of the information it contains. Ref. Ares(2019)7374640 - 29/11/2019
-
Upload
khangminh22 -
Category
Documents
-
view
2 -
download
0
Transcript of D7.1 – Impact areas and paths - PAsCAL project
Grant agreement no.: 815098
D7.1 – Impact areas and paths
Date of publication: 30-11-2019
Disclaimer This report is part of a project that has received funding by the European Union’s
Horizon 2020 research and innovation programme under grant agreement number 815098.
The content of this report reflects only the authors’ view. The Innovation and Networks Executive Agency (INEA) is not responsible for any use that may be made
of the information it contains.
Ref. Ares(2019)7374640 - 29/11/2019
D7.1 – Impact areas and paths Page 2
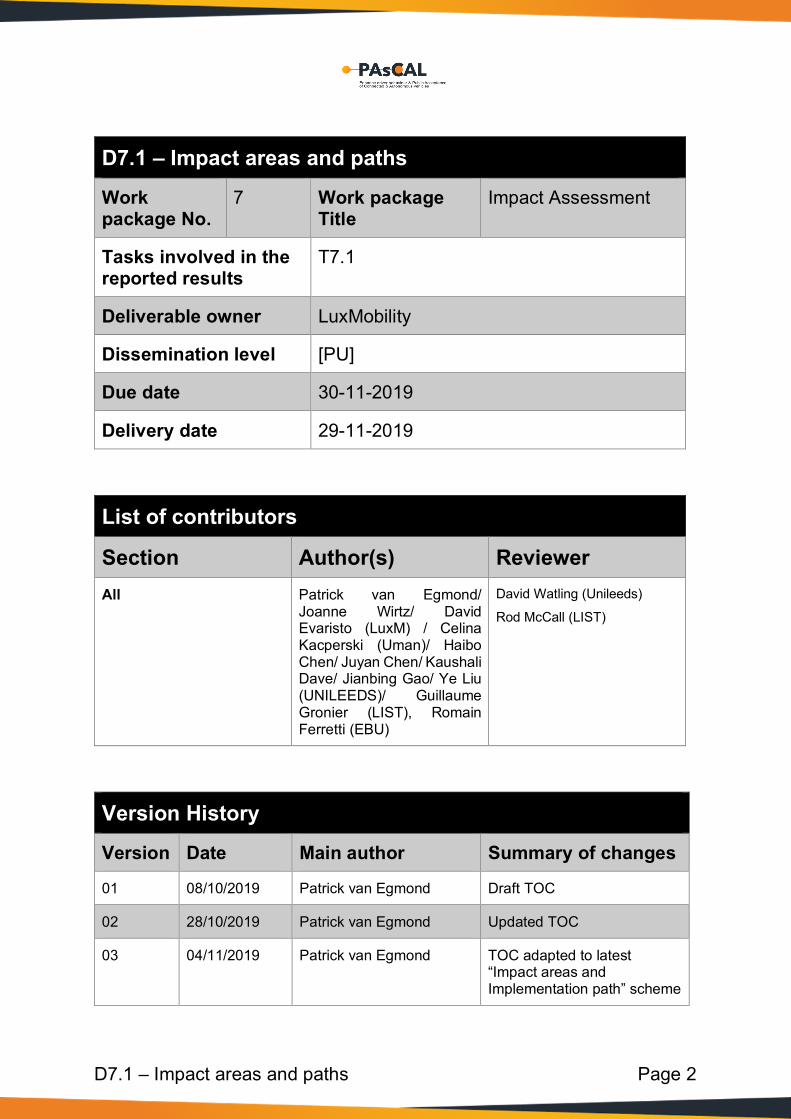
D7.1 – Impact areas and paths
Work package No.
7 Work package Title
Impact Assessment
Tasks involved in the reported results
T7.1
Deliverable owner LuxMobility
Dissemination level [PU]
Due date 30-11-2019
Delivery date 29-11-2019
List of contributors
Section Author(s) Reviewer All Patrick van Egmond/
Joanne Wirtz/ David Evaristo (LuxM) / Celina Kacperski (Uman)/ Haibo Chen/ Juyan Chen/ Kaushali Dave/ Jianbing Gao/ Ye Liu (UNILEEDS)/ Guillaume Gronier (LIST), Romain Ferretti (EBU)
David Watling (Unileeds)
Rod McCall (LIST)
Version History
Version Date Main author Summary of changes
01 08/10/2019 Patrick van Egmond Draft TOC
02 28/10/2019 Patrick van Egmond Updated TOC
03 04/11/2019 Patrick van Egmond TOC adapted to latest “Impact areas and Implementation path” scheme
D7.1 – Impact areas and paths Page 3
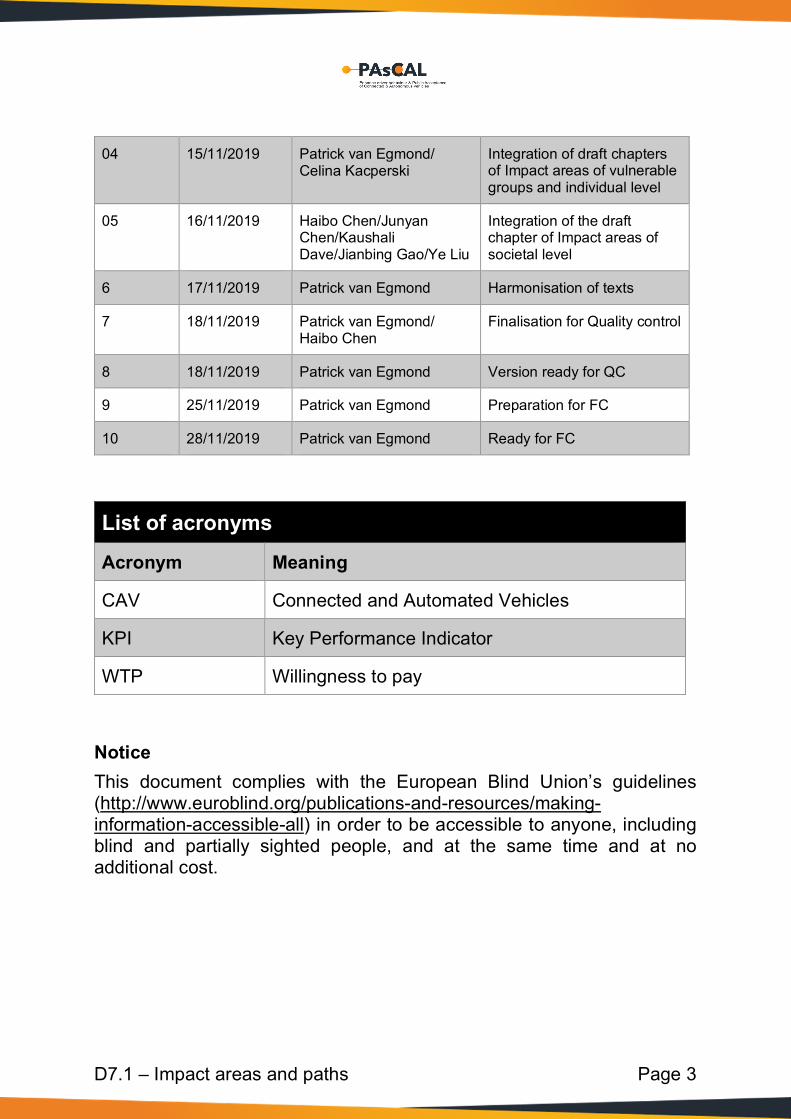
04 15/11/2019 Patrick van Egmond/ Celina Kacperski
Integration of draft chapters of Impact areas of vulnerable groups and individual level
05 16/11/2019 Haibo Chen/Junyan Chen/Kaushali Dave/Jianbing Gao/Ye Liu
Integration of the draft chapter of Impact areas of societal level
6 17/11/2019 Patrick van Egmond Harmonisation of texts
7 18/11/2019 Patrick van Egmond/ Haibo Chen
Finalisation for Quality control
8 18/11/2019 Patrick van Egmond Version ready for QC
9 25/11/2019 Patrick van Egmond Preparation for FC
10 28/11/2019 Patrick van Egmond Ready for FC
List of acronyms
Acronym Meaning
CAV Connected and Automated Vehicles
KPI Key Performance Indicator
WTP Willingness to pay
Notice This document complies with the European Blind Union’s guidelines (http://www.euroblind.org/publications-and-resources/making-information-accessible-all) in order to be accessible to anyone, including blind and partially sighted people, and at the same time and at no additional cost.
D7.1 – Impact areas and paths Page 4
Table of Contents
1 INTRODUCTION, IMPACT AREAS AND PATHS ........... 12
1.1 Purpose of the document ......................................................... 12
1.2 Intended audience of this document ...................................... 13
2 CONNECTED AND AUTOMATED VEHICLES AND SERVICES: IMPACT AREAS AND PATHWAYS .................. 14
2.1 Introduction ............................................................................... 14
2.2 PAsCAL Impact areas ............................................................... 15
2.2.1 Human factors and the human-machine interface ............... 15
2.2.2 Individual perceptions, behavioural intention and actual attitudes ............................................................................................ 20
2.2.2.1 Individual perceptions ...................................................... 20
2.2.2.2 Behavioural intentions and attitudes ............................... 20
2.2.2.3 Willingness to pay ............................................................ 21
2.2.2.4 Willingness to adopt ........................................................ 22
2.2.2.5 Willingness to let others use ............................................ 23
2.2.2.6 Changes in mobility patterns ........................................... 23
2.2.3 CAV and vulnerable group related impacts .......................... 26
2.2.4 CAV and societal related impact areas ................................ 27
2.3 Pathways between individual, vulnerable group and societal impact areas ....................................................................................... 28
3 CAV AND INDIVIDUAL IMPACT AREAS ........................ 30
3.1 Introduction ............................................................................... 30
3.2 Perceived safety and security ................................................. 30
3.2.1 Perceived safety.................................................................... 30
3.2.2 Perceptions of security and privacy ...................................... 33
D7.1 – Impact areas and paths Page 5
3.2.3 Perceived risks and impacts on attitudes and behaviour ..... 33
3.3 Functional design and reliability ............................................. 34
3.3.1 Perception on the functional design...................................... 35
3.3.2 Perceptions on reliability ....................................................... 35
3.3.3 Perceived ease of use and impact on attitudes and behaviour 36
3.4 Comfort and ergonomics ......................................................... 36
3.4.1 Comfort.................................................................................. 37
3.4.2 Ergonomics ........................................................................... 37
3.4.3 Perceived quality of travel and impact on attitudes and behaviour .......................................................................................... 41
3.5 Convenience in usage and self-actualisation ........................ 42
3.5.1 Convenience ......................................................................... 42
3.5.2 Self-actualization ................................................................... 43
3.5.3 Perceived usefulness and impact on attitudes and behaviour 44
3.6 Psychological skills and states and CAV ............................... 44
3.6.1 Psychological skills ............................................................... 45
3.6.2 Technical skills ...................................................................... 45
4 CAV AND VULNERABLE GROUPS IMPACT AREAS .... 46
4.1 Introduction ............................................................................... 46
4.1.1 Mobility and vulnerable groups considered .......................... 46
4.2 Mobility and adequacy .............................................................. 48
4.2.1 Mobility of vulnerable groups ................................................ 49
4.2.2 Adequacy .............................................................................. 49
4.3 Accessibility .............................................................................. 50
4.4 Affordability ............................................................................... 52

D7.1 – Impact areas and paths Page 6
4.5 Social Inclusion ......................................................................... 52
4.6 Human dignity and ethics ........................................................ 53
4.6.1 Human dignity ....................................................................... 54
4.6.2 Ethics..................................................................................... 55
5 CAV AND SOCIETAL IMPACT AREAS .......................... 57
5.1 Introduction ............................................................................... 57
5.2 Mobility and transport network ............................................... 57
5.2.1 Mobility .................................................................................. 57
5.2.2 Traffic control ........................................................................ 58
5.2.3 Network performance ............................................................ 58
5.3 Safety and security at societal level ....................................... 60
5.3.1 Safety at societal level .......................................................... 60
5.3.1.1 Crash avoidance .............................................................. 61
5.3.1.2 Roadway/environment awareness .................................. 62
5.3.1.3 Driving precision .............................................................. 62
5.3.2 Security at societal level ....................................................... 62
5.4 Socio-economic impacts .......................................................... 64
5.4.1 Employment .......................................................................... 65
5.4.2 Economy ............................................................................... 66
5.4.3 Business exploitation and partnerships ................................ 66
5.5 Quality of life and health .......................................................... 67
5.6 Public awareness ...................................................................... 68
5.7 Public acceptance ..................................................................... 71
5.7.1 Public acceptance in attitudes and values ............................ 72
5.7.2 Public acceptance in actions ................................................ 73
6 IDENTIFIED GAPS AND PATHS ..................................... 75
D7.1 – Impact areas and paths Page 7
6.1 Overview of identified gaps ..................................................... 75
6.2 Gaps and need for further research ........................................ 77
6.2.1 Safety and security ............................................................... 77
6.2.2 Functional design, comfort and ergonomics ......................... 78
6.2.3 Convenience and self-actualisation ...................................... 78
6.2.4 CAVs and vulnerable groups research gaps ........................ 79
6.2.5 CAVs and societal impact research gaps ............................. 80
6.2.5.1 Safety and security at the societal level .......................... 80
6.2.5.2 Socio-economic impacts .................................................. 80
6.2.5.3 Public Awareness ............................................................ 81
6.2.5.4 Public acceptance............................................................ 81
6.3 Impact paths .............................................................................. 81
6.3.1 From human factors in CAV to individual perceptions and attitudes ............................................................................................ 82
6.3.2 From individual impacts to societal and vulnerable group impact areas ..................................................................................... 83
6.3.3 The influence of psychological and physical abilities on individual perceptions and attitudes ................................................. 84
6.3.4 Integrating market take-up scenarios and business models in CAV development ............................................................................ 84
7 CONCLUSIONS .............................................................. 87
8 REFERENCES ................................................................ 88
8.1 Bibliography/reference list ....................................................... 88
8.2 Links to websites .................................................................... 108
ANNEX 1 PASCAL IMPACT AREAS AND PATHS ............. 109

D7.1 – Impact areas and paths Page 8
Table of Figures Figure 0.1 PAsCAL Impact areas and paths ........................................... 11
Figure 2.1: UX design, (Shaffer 2008/ Alonso, 2017) ............................. 16
Figure 2.2 : Adapted Pyramid of Maslov for CAV user needs ................ 19
Figure 2.3 Example of WTP (Bansal et al. (2016) ................................... 22
Figure 2.4. Example of a choice scenario (Krueger et al., 2016). ........... 23
Figure 2.5. Change in mobility patterns for three different types of demand populations, (Harper et al., (2016). .......................................................... 25
Figure 2.6: PAsCAL impact areas and paths .......................................... 29
Figure 3.1: An extract from the ISO standards 7250. .............................. 38
Figure 3.2: Conceptual framework for relating variables that influence human performance and workload (Extracted from Hart & Staveland, 1988). ....................................................................................................... 40
Figure 3.3: Paper version of NASA-TLX. ................................................ 41
Figure 4.1 The impact of the autonomous driving on vehicle-kilometres travelled if CAVs technology breakthrough (Trommer et al. 2016) ......... 51
Figure 4.2 Relative change of public transport and car trio numbers for difference distance if CAVs technology breakthrough (Trommer et al. 2016) ........................................................................................................ 51
Figure 4.3 The car availability changes if CAVs technology breakthrough (Trommer et al. 2016) .............................................................................. 52
Figure 4.4 People's choice of using CAVs if it was available now .......... 55
Figure 5.1 The effect of connected autonomous driving on travel time impact (Atkins, 2016) ............................................................................... 60
Figure 5.2 Safety and security in societal level (Schoitsch, 2016) .......... 61
Figure 5.3 Awareness of CAVs (adapted from Hawes, 2018) ................ 69
Figure 5.4 Prompted awareness of benefits from autonomous vehicles (adapted from Pettigrew et al., 2018) ...................................................... 69
Figure 5.5 Feelings about CAV (adapted from Hawes, 2018) ................ 70
Figure 5.6 The attitude to the use of public streets as a proving ground for CAVs (Penmetsa et al. 2019) .................................................................. 73
Figure 5.7 The attitude to safety using conventional streets with CAVs (Penmetsa et al. 2019) ............................................................................ 74
D7.1 – Impact areas and paths Page 9
Figure 6.1 PAsCAL implementation approach ........................................ 82
Figure 6.2 PAsCAL impact path from human factors to individual perceptions and attitudes ........................................................................ 83
Figure 6.3 PAsCAL impact path from individual to vulnerable group impact areas ........................................................................................................ 83
Figure 6.4 PAsCAL impact path from individual to societal impact areas ................................................................................................................. 84
Figure 6.5 PAsCAL impact path of interrelation between individual perceptions, attitudes, ability and skills ................................................... 84
Figure 6.6 : SAE Automation Levels (Source : Society of Automotive Engineers) ................................................................................................ 85
Figure 6.7 PAsCAL impact path from individual, vulnerable and societal impacts feeding back into human centred CAV developments............... 86
List of tables
Table 2.1 Summary of reported human factors problems for each level of autonomy ................................................................................................. 16
Table 2.2 Individual impact areas ............................................................ 20
Table 2.3 Attitude and behavioural impact areas .................................... 21
Table 2.4 Vulnerable group impact areas ............................................... 26
Table 2.5 Societal impact areas .............................................................. 27
Table 3.1 Safety impacts of CAV technologies ....................................... 31
Table 5.1 The effect of connected autonomous driving on transport network .................................................................................................... 59
Table 5.2 The potential impacts of security from societal level............... 63
Table 5.3 Overview of Socio-Economic Impacts from CAV .................... 65
Table 5.4 Summary of challenges for the adaptation of autonomous vehicles .................................................................................................... 67
Table 6.1 Executed research within the respective impact areas ........... 75
D7.1 – Impact areas and paths Page 10
Executive summary The main aim of the PASCAL project is to create the Guide2Autonomy that will improve the understanding of the implications of Connected and Autonomous Vehicles (CAV) on society as well as educate their future drivers, passengers and those who will have to share the road with them. This deliverable D7.1 “Impact areas and paths” identifies the different impact areas and pathways that allows us to assess the impacts in the different areas such as from the perspective of the human individual, wider public acceptance and societal needs, including vulnerable groups. It will lay the basis for an indicator based impact assessment framework to be developed in task 7.2. Gaps are defined for which further research is needed and to which PAsCAL will partly be able to contribute. The document will allow researchers to adopt a more human centred approach in their research evaluations and provide to policy makers a better understanding of how they can bring the different societal needs into the development and debate on the future of CAV. Until now, there is little academic research that focusses on the behavioural and associated social and societal impacts of CAVs (less than 6%) of the total research. On the basis of the PAsCAL literature research different human and societal impact areas were identified that can be classified as follow: • Features of CAV technology and services, including where potential
behavioural factors (i.e. motivators and barriers) are at stake; • Perceptions of individuals (e.g. users, drivers, pilots, cyclists),
acceptance of technology and willingness to use CAVs; • Impact areas related to the specific needs of vulnerable groups (e.g.
elderly, impaired, children), including a spatial division between urban and rural areas; and finally
• wider societal impact areas. The following scheme presents the PAsCAL impact areas and paths identified and how they influence each other (see Annex 1 for details).

D7.1 – Impact areas and paths Page 11
Figure 0.1 PAsCAL Impact areas and paths
Chapter 3 of this document focuses on the different CAV technology and services features, as well as the individual perceptions, attitudes and behavioral intentions. Chapter 4 describes the different vulnerable group related impact areas, whereas chapter 5 details the wider societal related impact areas. Chapter 6 lists identified research gaps and how in PAsCAL we intend to determine the individual, vulnerable group and societal impacts levels and influence on each other. The present version of the framework is probably the very first impact areas definition developed from the user and societal point of view. During the course of the project feedback will be collected and later updates will be made to ensure the acceptance and use of the framework in further CAV research.
D7.1 – Impact areas and paths Page 12
1 Introduction, impact areas and paths 1.1 Purpose of the document The PAsCAL project will create the Guide2Autonomy, a novel framework that will improve the understanding of the implications of Connected and Autonomous Vehicles (CAV) on society as well as educate their future drivers, passengers and those who will have to share the road with them. The project will make use of a strongly interdisciplinary mix of tools from both human and technological sciences, to capture the public’s acceptance and attitude, analyse and assess their concerns (WP3), model and simulate realistic scenarios for hands-on practices (WP4), develop training of potential newly needed skills (WP5) and validate its findings in a number of real-world trials (WP6). An integrated full-fledged human focussed evaluation will ensure results consistency, taking into account major obstacles/barriers that may hinder the social acceptance of CAVs, guarantee inclusion and will allow their exploitation in new business services and applications. The key elements of the PAsCAL work are the following:
1. A user-centric approach to CAVs, 2. Addressing human factors through simulators, 3. Exploring CAV acceptance in simulated environments, 4. Extending the understanding of public acceptance, 5. Addressing all transport modes, 6. Considering the human driver and the occupants.
WP7 acts as an assessor for the whole project and will be used by the other WPs as guidance to assess the long-term impact of the developed solutions. This work package will define the project's overall assessment framework and KPIs which can be refined (and extended) to suit the specific research questions and hypotheses formulated for the specific research activities in WP3, 4, 5, and 6. It is intended also to contribute to the structure of the Guide2Autonomy. The task 7.1, of which this deliverable is the output, intends to identify the different impact areas and pathways that allow to measure impacts in the different areas. It will lay the basis for an indicator based impact assessment framework to be developed in task 7.2.
D7.1 – Impact areas and paths Page 13
Input for this deliverable 7.1 is the initial user acceptance analysis from WP3 (Task 3.2) and the impact assessment frameworks developed in earlier initiatives such as the trilateral group on impact assessment and CARTRE. The knowledge base under development in the ARCADE CSA newly-funded by H2020 will also provide information. Gaps are defined for which further research is needed. Beyond the development of an indicator framework in task 7.2 that will allow for a targeted simulated and piloted CAV research. It will provide an indication to other work packages for which research of PAsCAL might fill some of those research gaps.
1.2 Intended audience of this document There are three major audiences for this report. Firstly, there are the PAsCAL partners responsible for the CAV simulations, piloting, skill and business case development. It will provide them with the basis for assessing and evaluating their research activities. Beyond the more traditional technical impacts, it will allow them to bring in a strong human and societal focus in the design of their research and evaluation. Secondly, it will allow the wider CAV research community to do likewise. This deliverable intends to provide to the wider CAV community an understanding on how to take a user-centric approach in CAV research and innovation. It will create a comprehensive approach to public acceptance and the understanding of societal impacts, with a specific focus on the different vulnerable groups. Finally, it will help policy makers to gain a better understanding of how they can bring the different societal needs into the development and debate on the future of CAV.
D7.1 – Impact areas and paths Page 14
2 Connected and automated vehicles and services: Impact areas and pathways
2.1 Introduction Up until now, there is little academic research that focusses on the behavioural and associated social and societal impacts of CAVs. In a recent survey of research executed in the field of connected and automated vehicles, it was found that social science references linked to CAVs represented less than 6% of the total. A little less than half of the research (45%) dealt with engineering in the field of CAV, whereas a third (33%) was related to computer science and mathematics. (Cavoli, C. et al., 2017). Even if recent progress in legal and regulatory issues is successful in pushing forward the wider uptake of fully automated vehicles, there remains a clear urgency to obtain a better understanding of the behavioural implications and wider impacts. PAsCAL targets a wide range of user groups to get a good representation of different social characteristics, “driver” behaviour and acceptance of CAVs across Europe. An initial list of individual users includes drivers (private or professional, experienced or new, road or non-road), passengers, and those who will have to share the space with them (e.g. pedestrians, cyclists). PAsCAL looks also more specifically at the needs of vulnerable groups (e.g. the elderly, the impaired). Finally, PAsCal is also researching impacts at the societal level, the transport network level, as well as public awareness and acceptances. In order for new CAV technologies and developments to be a success (in serving both individual and societal needs) they need to be integrated as early as possible into the design of future transport systems. In the frame of task 7.1, an in-depth literature research was carried out with a focus on the available social and behavioural documentation and studies related to CAV. On the basis of this work and the focus of the PAsCAL project, different impact areas were identified that can be classified as follow:
• Features of CAV technology and services, including where potential behavioural factors (i.e. motivators and barriers) are at stake;
• Perceptions of individuals (e.g. users, drivers, pilots, cyclists), acceptance of technology and willingness to use CAVs;
D7.1 – Impact areas and paths Page 15
• Impact areas related to the specific needs of vulnerable groups (e.g. elderly, impaired, children), including a spatial division between urban and rural areas; and finally
• wider societal impact areas.
2.2 PAsCAL Impact areas Following an initial user acceptance mapping from WP3 (i.e. task 3.1 and 3.2) and an analysis of impact pathways of earlier and present projects (e.g. AUTOPILOT, CARTRE, L3PILOT), it was possible to identify three distinct levels for which the PAsCAL project will define a set of KPIs in task 7.2:
1) At the level of the “human-machine” interface and human factors related to individual perceptions, attitudes and behaviours;
2) At the vulnerable group level based on the outcomes of individual outputs combined with the learning of a number of scenarios (e.g. shared CAV vs. private ownership based models);
3) At the societal level, likewise, based on the individual attitudes and scenarios yet focussing on the wider societal impacts (e.g. quality of life, socio-economic impacts and transport network effects).
The three different levels are briefly described in the following paragraphs.
2.2.1 Human factors and the human-machine interface In relation to the human-machine interface there are many impact areas where measurements can take place to improve CAVs from a technical point of view, taking into account the human factor.
D7.1 – Impact areas and paths Page 16
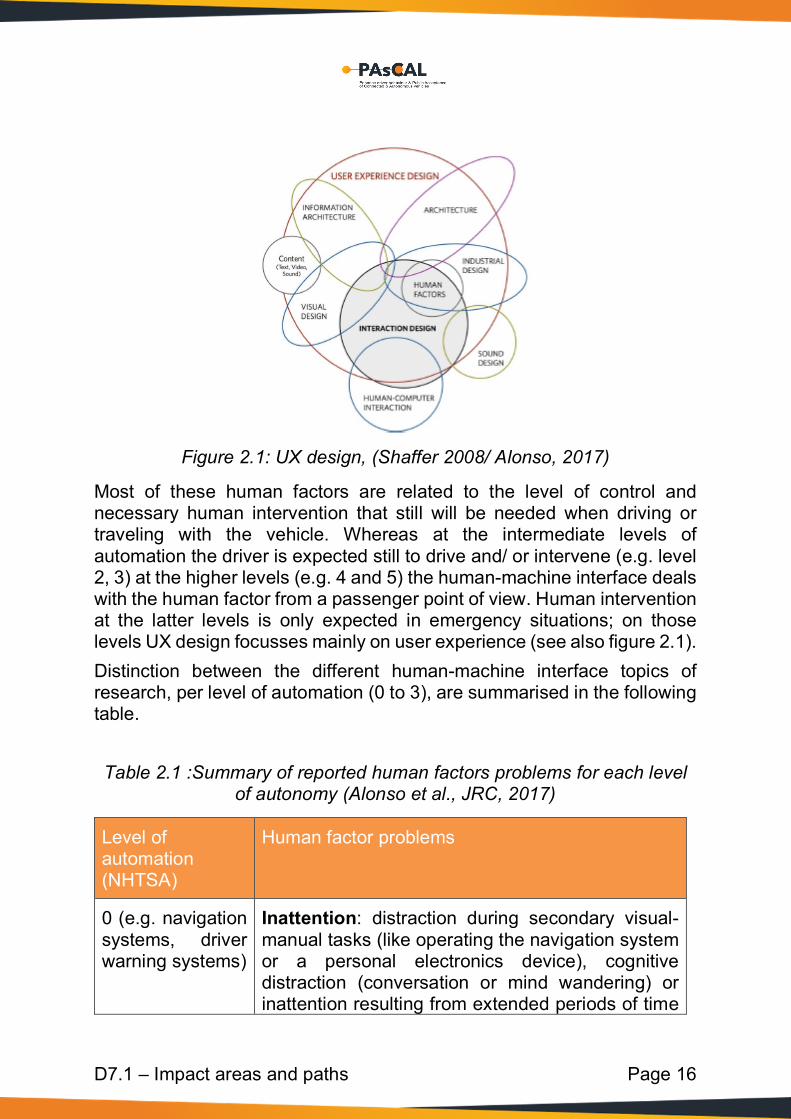
Figure 2.1: UX design, (Shaffer 2008/ Alonso, 2017)
Most of these human factors are related to the level of control and necessary human intervention that still will be needed when driving or traveling with the vehicle. Whereas at the intermediate levels of automation the driver is expected still to drive and/ or intervene (e.g. level 2, 3) at the higher levels (e.g. 4 and 5) the human-machine interface deals with the human factor from a passenger point of view. Human intervention at the latter levels is only expected in emergency situations; on those levels UX design focusses mainly on user experience (see also figure 2.1). Distinction between the different human-machine interface topics of research, per level of automation (0 to 3), are summarised in the following table. Table 2.1 :Summary of reported human factors problems for each level
of autonomy (Alonso et al., JRC, 2017)
Level of automation (NHTSA)
Human factor problems
0 (e.g. navigation systems, driver warning systems)
Inattention: distraction during secondary visual-manual tasks (like operating the navigation system or a personal electronics device), cognitive distraction (conversation or mind wandering) or inattention resulting from extended periods of time

D7.1 – Impact areas and paths Page 17
Level of automation (NHTSA)
Human factor problems
where the system performs well, which makes drivers feel they no longer need to pay close attention to the system. This last point relates to problems focusing attention when there is little or nothing to attend to, thus reducing active involvement and the task is simply to obey the navigation instructions. Trust: automation systems earn users’ trust following periods of impeccable performance, even reaching the point where they believe that the automation knows best (Hoff and Bashir, 2014 as cited in Casner et al., 2016). Quality of feedback: when presenting limited information about context and surroundings, it is easy for drivers to miss important clues when things go wrong. Skill atrophy: cognitive skills deteriorate when not practiced regularly. Complacency: unintendedly, some drivers may substitute the primary task of paying attention with the secondary task of listening for alerts and alarms (i.e. relying on alert systems to call when troubles appear). Nuisance: failing to alert or alerting too much is counterproductive, as is alerting in situations that users do not find alarming (Breznitz, 1984 as cited in Casner et al., 2016). Alert times: the effectiveness of alerts falls off when alert times are short, as driving requires a fast response.
1 (e.g. adaptive cruise control)
Vigilance: taking drivers out of active control makes it difficult to get them back into active control when it is necessary, as previous studies have reported reduced vigilance, increased drowsiness

D7.1 – Impact areas and paths Page 18
Level of automation (NHTSA)
Human factor problems
and longer reaction times to unexpected events when relieving drivers of even one aspect of the driving task (Dufour, 2014 as cited in Casner et al., 2016).
2 (e.g. traffic jam assist, park assist level 2)
Inattention: as automation performs more functions and becomes more reliable, drivers will inevitably do things other than pay attention to driving. Feedback: knowing the state of the automation is of paramount importance and this is not straightforward. On the one hand, users rely on their memory of having pushed a button, and habitually ignore system-status displays. On the other hand, automation functions sometimes turn off without any apparent reason, lacking an appropriate feedback.
3 (e.g. traffic jam chauffeur, highway chauffeur, highway pilot)
Rapid onboarding: users have great difficulty re-establishing driving context and this is especially worse when the situation is complex. Skill atrophy: cognitive skills deteriorate when not practiced regularly but hands-on skills seem to be resistant to forgetting (Casner et al., 2014). However, cognitive skills are needed first in order to determine which manual operations are required. Complexity: drivers are less trained compared to pilots of an airplane, which creates critical situations where the automation complexity results in unexpected behaviours. When drivers are unexpectedly asked to resume control of the car, they are likely to experience difficulties to get back in the loop, assess the situation and be able to respond in time.

D7.1 – Impact areas and paths Page 19
As the main aim of the PAsCAL project is to create a more user centric approach, by increasing public awareness and acceptance, human needs and perceptions should form the basis of both the defined impact areas and future KPIs. It will mitigate the risk that the CAV innovation¾which up to the present day has been dominated by engineering, mathematical and computer science perspectives¾will not bring the much needed user-centric approach beyond HMI research. The impact areas related to the “human-machine interface” and related human factors are therefore placed in a “pyramid of Maslow” for CAV features and services.
Figure 2.2 : Adapted Pyramid of Maslov for CAV user needs
The bottom of this pyramid reflects the user need that any CAV development should fulfil; the basic demands for mobility and transportation (figure 2.2). Most existing CAV research in relation to the “human-machine” interface and human factors relates to the next bottom three layers (i.e. safety and security, functional design and reliability, comfort and ergonomics). The last two layers reflect the need that any marketed CAV technology and related service should offer a certain level of convenience and ease of use and contribute to individual self-actualisation. Beyond the more traditional “human-machine” sets of indicators, PAsCAL will develop a human needs centred KPI framework that focusses on the actual take-up of the new CAV technologies. Beyond the present “needs” pyramid, it is therefore of paramount importance to consider also perceptions, behavioural intentions and attitudes.

D7.1 – Impact areas and paths Page 20
2.2.2 Individual perceptions, behavioural intention and actual attitudes
2.2.2.1 Individual perceptions Mobility and transportation systems are constantly evolving, and technological advances, such as the integration of connected and autonomous vehicles (CAVs) into the eco system, need to be carefully examined and their consequences analysed in-depth. The development of advanced vehicular technologies, smart vehicle options, and alternative fuel types should have the aim to positively affect both humans and our environment by enhancing driving experience, making it more inclusive and accessible, and by reducing the carbon footprint of vehicles and the transport system in total (Greenblatt & Shaheen, 2015; Kirk & Eng, 2011; Litman, 2019a). With this in mind, it is especially important to anticipate public acceptance in order to be able to predict and better shape adoption of these technologies. In order to gauge public acceptance, individual responses to a variety of perceived areas of impact need to be taken into consideration. The actual take-up of new CAV technology and services are determined by the individual’s perceptions, behavioural intentions and usage (Table 2.2). Beyond the actual human performance when traveling and/ or in the encounter with a CAV this will engender individual perceptions that, in line with the Technological Acceptance Model, can be categorised as follow:
• Perceived risks, • Perceived ease of use, • Perceived quality of travel, • Perceived usefulness.
2.2.2.2 Behavioural intentions and attitudes A greater understanding of consumer preferences and for example willingness to pay for these technology options is crucial to effectively forecast and plan the best possible adoption strategy. Each individual’s
Table 2.2 Individual impact areas

D7.1 – Impact areas and paths Page 21
acceptance of a new technology can be informed by the data available and perceived them, but also by experiences they might have made with other forms of automations and their own personalities and skills. The possible behavioural attitudes and intentions can be defined as follow (Table 2.3).
• (Willingness to) pay, • (Willingness to) adopt, • (Willingness to) have others to use, • Changed mobility patterns.
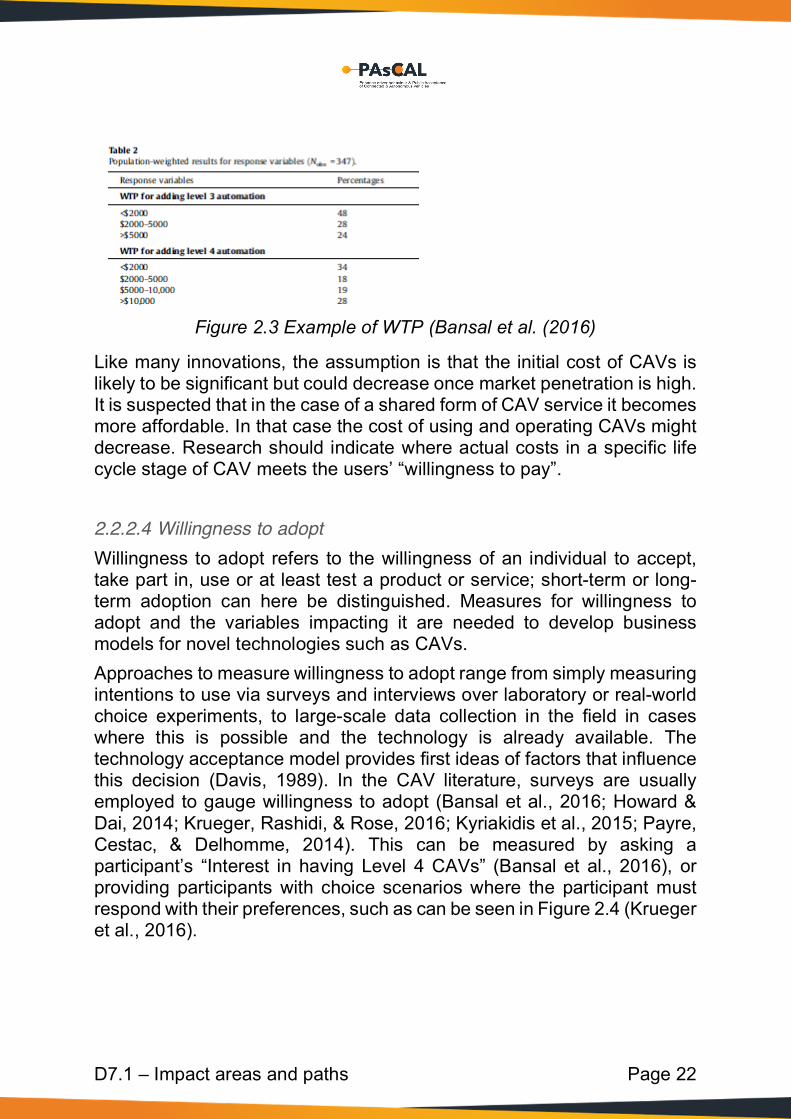
The different possible intentions and attitudes are shortly described in the following paragraphs. 2.2.2.3 Willingness to pay The cost of buying or using CAVs will much depend on the related ownership and business model. From a user perspective this relates to the topic of “Willingness to pay”. Willingness to pay is generally used to describe the maximum amount an individual is willing to hand over to procure a product or service. Accurately estimating consumers' willingness to pay can be extremely important to develop competitive strategies for novel technologies such as connected and autonomous vehicles. Approaches to measure willingness-to-pay range across differential conceptual foundations and methodological implications, including market data analyses, lab and field experiments, direct and indirect surveys such as conjoint or discrete choice analyses (Breidert, Hahsler, & Reutterer, 2006). In the CAV literature, surveys are usually employed to gauge willingness to pay, where participants are simply asked to provide a value in their country’s denomination that they would pay for either partial or full automation features in their vehicle (Bansal, Kockelman, & Singh, 2016; Kyriakidis, Happee, & de Winter, 2015; Schoettle & Sivak, 2014a). Results are then usually summarized in percentages, as shown in figure 2.3.
Table 2.3 Attitude and behavioural impact areas
D7.1 – Impact areas and paths Page 22
Figure 2.3 Example of WTP (Bansal et al. (2016)
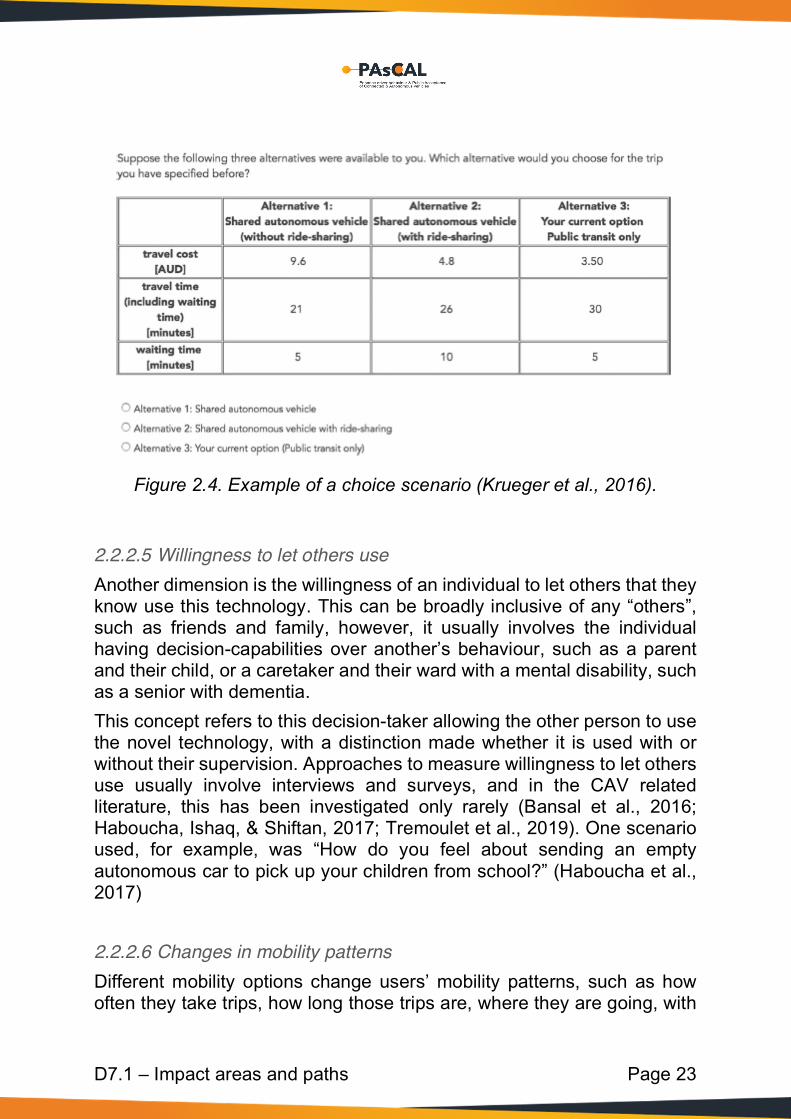
Like many innovations, the assumption is that the initial cost of CAVs is likely to be significant but could decrease once market penetration is high. It is suspected that in the case of a shared form of CAV service it becomes more affordable. In that case the cost of using and operating CAVs might decrease. Research should indicate where actual costs in a specific life cycle stage of CAV meets the users’ “willingness to pay”. 2.2.2.4 Willingness to adopt Willingness to adopt refers to the willingness of an individual to accept, take part in, use or at least test a product or service; short-term or long-term adoption can here be distinguished. Measures for willingness to adopt and the variables impacting it are needed to develop business models for novel technologies such as CAVs. Approaches to measure willingness to adopt range from simply measuring intentions to use via surveys and interviews over laboratory or real-world choice experiments, to large-scale data collection in the field in cases where this is possible and the technology is already available. The technology acceptance model provides first ideas of factors that influence this decision (Davis, 1989). In the CAV literature, surveys are usually employed to gauge willingness to adopt (Bansal et al., 2016; Howard & Dai, 2014; Krueger, Rashidi, & Rose, 2016; Kyriakidis et al., 2015; Payre, Cestac, & Delhomme, 2014). This can be measured by asking a participant’s “Interest in having Level 4 CAVs” (Bansal et al., 2016), or providing participants with choice scenarios where the participant must respond with their preferences, such as can be seen in Figure 2.4 (Krueger et al., 2016).
D7.1 – Impact areas and paths Page 23
Figure 2.4. Example of a choice scenario (Krueger et al., 2016).
2.2.2.5 Willingness to let others use Another dimension is the willingness of an individual to let others that they know use this technology. This can be broadly inclusive of any “others”, such as friends and family, however, it usually involves the individual having decision-capabilities over another’s behaviour, such as a parent and their child, or a caretaker and their ward with a mental disability, such as a senior with dementia. This concept refers to this decision-taker allowing the other person to use the novel technology, with a distinction made whether it is used with or without their supervision. Approaches to measure willingness to let others use usually involve interviews and surveys, and in the CAV related literature, this has been investigated only rarely (Bansal et al., 2016; Haboucha, Ishaq, & Shiftan, 2017; Tremoulet et al., 2019). One scenario used, for example, was “How do you feel about sending an empty autonomous car to pick up your children from school?” (Haboucha et al., 2017) 2.2.2.6 Changes in mobility patterns Different mobility options change users’ mobility patterns, such as how often they take trips, how long those trips are, where they are going, with
D7.1 – Impact areas and paths Page 24
how many others they ride in one vehicle, and others (Anderson et al., 2016; Greenblatt & Shaheen, 2015; Harper, Hendrickson, Mangones, & Samaras, 2016; Wadud, MacKenzie, & Leiby, 2016). In this sense, perceptions about, for example, the risk inherent in, or usefulness of CAVs, could change mobility users’ travel behaviours in terms of frequencies, or trip durations, or the purpose of the trip taken; greater mobility demand could be one possible result (Wadud et al., 2016). An analysis of the impacts is particularly important, also with an eye towards increases in individual mobility needs for vulnerable populations such as people with disabilities, senior drivers or people with medical conditions. See Figure 2.5 for a first idea of how such an analysis could be carried out for vehicle miles travelled for different populations (Harper et al., 2016).

D7.1 – Impact areas and paths Page 25
Figure 2.5. Change in mobility patterns for three different types of
demand populations, (Harper et al., (2016).
D7.1 – Impact areas and paths Page 26
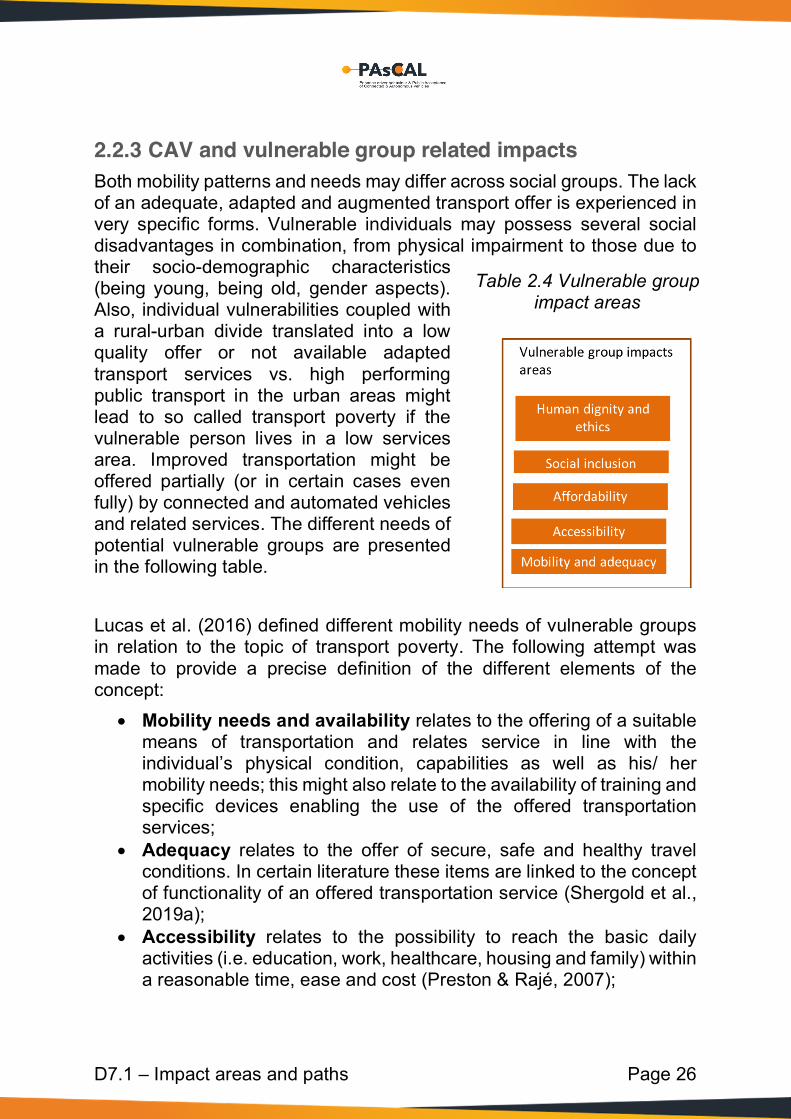
2.2.3 CAV and vulnerable group related impacts Both mobility patterns and needs may differ across social groups. The lack of an adequate, adapted and augmented transport offer is experienced in very specific forms. Vulnerable individuals may possess several social disadvantages in combination, from physical impairment to those due to their socio-demographic characteristics (being young, being old, gender aspects). Also, individual vulnerabilities coupled with a rural-urban divide translated into a low quality offer or not available adapted transport services vs. high performing public transport in the urban areas might lead to so called transport poverty if the vulnerable person lives in a low services area. Improved transportation might be offered partially (or in certain cases even fully) by connected and automated vehicles and related services. The different needs of potential vulnerable groups are presented in the following table. Lucas et al. (2016) defined different mobility needs of vulnerable groups in relation to the topic of transport poverty. The following attempt was made to provide a precise definition of the different elements of the concept:
• Mobility needs and availability relates to the offering of a suitable means of transportation and relates service in line with the individual’s physical condition, capabilities as well as his/ her mobility needs; this might also relate to the availability of training and specific devices enabling the use of the offered transportation services;
• Adequacy relates to the offer of secure, safe and healthy travel conditions. In certain literature these items are linked to the concept of functionality of an offered transportation service (Shergold et al., 2019a);
• Accessibility relates to the possibility to reach the basic daily activities (i.e. education, work, healthcare, housing and family) within a reasonable time, ease and cost (Preston & Rajé, 2007);
Table 2.4 Vulnerable group impact areas
D7.1 – Impact areas and paths Page 27
• Affordability relates to the part of the household budget spent on transport (Litman, 2017). This relates also to the time budget that an individual needs to spend on travelling.
Beyond the above mentioned needs literature mentions the need for social inclusion. A lack of transportation can, for example, be at the root of exclusion from the labour market. More accessible mobility networks as the result of availability of CAV and services might provide non-drivers a higher level of social inclusion. Finally, ethical issues play an important role in terms of vulnerable group needs related to mobility. Several pieces of literature, yet especially related policy underline that any CAV development should respect human dignity and ethics. (EC, 2019 (b)).Few standards are presently available on this topic. Beyond social inclusion CAV technology, services and underlying assumptions are expected threat all citizens equally and leave no one behind.
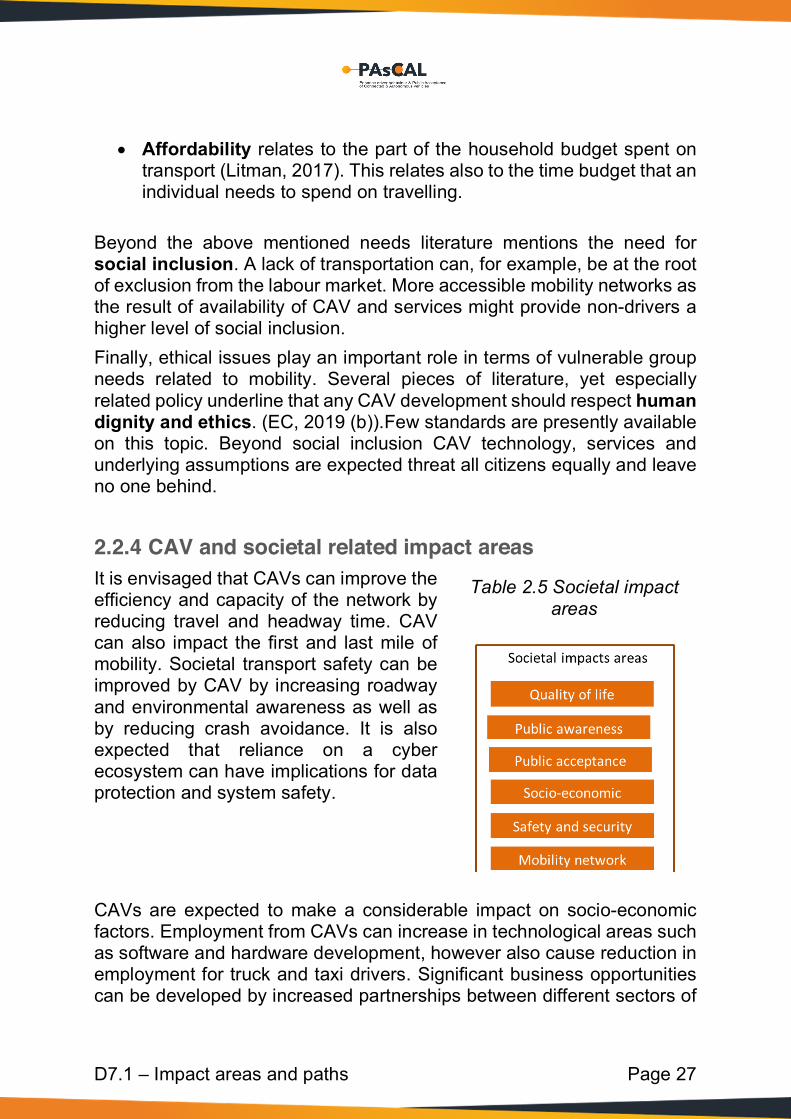
2.2.4 CAV and societal related impact areas It is envisaged that CAVs can improve the efficiency and capacity of the network by reducing travel and headway time. CAV can also impact the first and last mile of mobility. Societal transport safety can be improved by CAV by increasing roadway and environmental awareness as well as by reducing crash avoidance. It is also expected that reliance on a cyber ecosystem can have implications for data protection and system safety. CAVs are expected to make a considerable impact on socio-economic factors. Employment from CAVs can increase in technological areas such as software and hardware development, however also cause reduction in employment for truck and taxi drivers. Significant business opportunities can be developed by increased partnerships between different sectors of
Table 2.5 Societal impact areas

D7.1 – Impact areas and paths Page 28
industries. A difference in the cost and revenue structure in the industry can also be expected by the introduction of CAVs. CAVs offer a chance to improve the societal quality of life from reduced stress of driving and increased travel flexibility. Collaboration of industry with the government can result in increased public awareness of CAVs and increased public acceptance to use the system.
2.3 Pathways between individual, vulnerable group and societal impact areas
There are multiple interrelationships between the human factors in the “human-machine” interfaces, individual, vulnerable group and societal impact areas. Pathways within the PAsCAL project is understood to mean the interlinkages between different impact areas. In the figure 2.6 it is shown how the different impacts are placed within the different levels (i.e. individual, vulnerable group, societal). The individual perceptions, attitudes and intentions will be measured within the PAsCAL project through experiments, simulation and scenario based pilots as foreseen in the work packages 3, 4 and 6 of the PAsCAL project. Taking into account the attitudes and behavioural intentions, as well as the vulnerable group and societal needs, will allow us to realise both user-oriented and general public-oriented improvements to foster market take-up (WP8), exploitation and business models (WP9).

D7.1 – Impact areas and paths Page 29
Figure 2.6: PAsCAL impact areas and paths
The present schematic presentation of impact areas and paths within the PAsCAL project presents how the different impact areas influence each other. It should be noticed that beyond the human-machine interfaces, the individual perceptions are also influenced by vicarious experience of others, wider public awareness and acceptance. Also, physiological and physical abilities and skills (WP5) influence these perceptions. Following the definition of a set of KPIs for each of the different impact areas in task 7.2, and following PAsCAL research (i.e. experiments, simulations and pilots), we will not only be able to determine how the different impact areas positively or negatively influence each other, but also will be able to provide quantified information. In the following chapters the different impact areas are discussed in more detail. Chapter 3 will focus on the different CAV technology and services features, as well as the individual perceptions, attitudes and behavioral intentions. Chapter 4 will describe the different vulnerable group related impact areas, whereas chapter 5 will detail the wider societal related impact areas. Chapter 6 will briefly detail identified research gaps and how in PAsCAL we will determine the individual, vulnerable group and societal impacts and influence on each other.
D7.1 – Impact areas and paths Page 30
3 CAV and individual impact areas 3.1 Introduction Many studies are already examining the individual motivations for choosing to own or use shared autonomous vehicles, and are attempting to distinguish between the factors that lead to acceptance and the barriers that lead to rejection (Bansal et al., 2016; Haboucha et al., 2017; Howard & Dai, 2014; Kyriakidis et al., 2015; Millard-Ball, 2018; Nordhoff, de Winter, Kyriakidis, van Arem, & Happee, 2018; Schoettle & Sivak, 2014a). In the following chapter, based on existing literature, we introduce four areas of impact that we have identified as overarching factors that impact CAV adoption and willingness to pay. We also attempt to identify gaps and opportunities for further research.
3.2 Perceived safety and security Road traffic injuries are on the way to becoming the fifth leading cause of death by 2030 (World Health Organization, 2013). Automated driving systems could potentially increase safety – indeed, if the technology used is faultless or cannot be externally influenced, it could have the potential to be the optimal solution in terms of safety. However, the other side is also true – CAVs could potentially be a major risk source if the software solution fails or is infiltrated from outside sources (Kyriakidis et al., 2015).
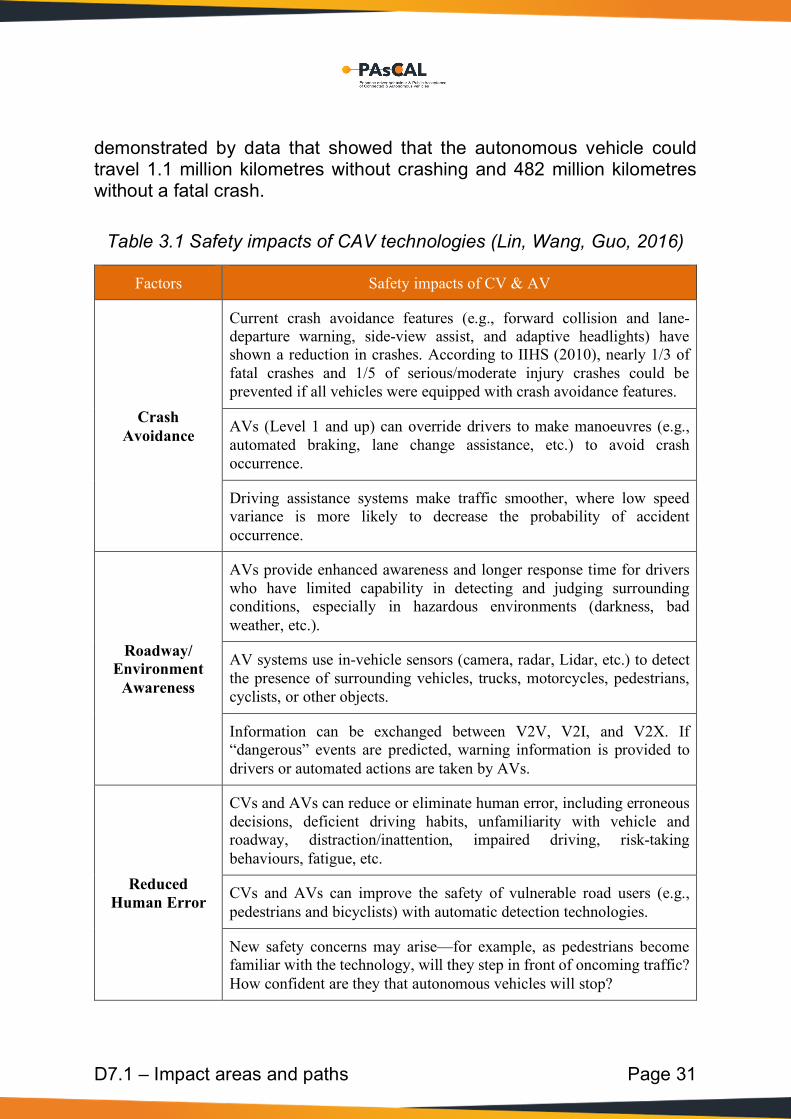
3.2.1 Perceived safety Autonomous vehicles, containing sensors, software, cartography, and computers, can effectively build a real-time model of the dynamic world in real driving situations (Zou & Levinson, 2003). They can effectively detect the situations around them. Differently from human drivers, they will not be distracted even after a long time driving and will know how and when to operate the vehicles with high precision (Levinson, 2015). Connected vehicles can be human-driven or autonomously-driven and are in certain cases in communication with other vehicles nearby. In the case of a connected autonomous vehicle, it will not only provide improved safety for those in the vehicle but is expected to improve the safety and environment for pedestrians, cyclists, and other drivers (see also table 3.1). According to Goodall’s research (Goodall, Noah, 2014), connected autonomous vehicles are considered to be safer than a human driver. This was
D7.1 – Impact areas and paths Page 31
demonstrated by data that showed that the autonomous vehicle could travel 1.1 million kilometres without crashing and 482 million kilometres without a fatal crash.
Table 3.1 Safety impacts of CAV technologies (Lin, Wang, Guo, 2016)
Factors Safety impacts of CV & AV
Crash Avoidance
Current crash avoidance features (e.g., forward collision and lane-departure warning, side-view assist, and adaptive headlights) have shown a reduction in crashes. According to IIHS (2010), nearly 1/3 of fatal crashes and 1/5 of serious/moderate injury crashes could be prevented if all vehicles were equipped with crash avoidance features.
AVs (Level 1 and up) can override drivers to make manoeuvres (e.g., automated braking, lane change assistance, etc.) to avoid crash occurrence.
Driving assistance systems make traffic smoother, where low speed variance is more likely to decrease the probability of accident occurrence.
Roadway/ Environment
Awareness
AVs provide enhanced awareness and longer response time for drivers who have limited capability in detecting and judging surrounding conditions, especially in hazardous environments (darkness, bad weather, etc.).
AV systems use in-vehicle sensors (camera, radar, Lidar, etc.) to detect the presence of surrounding vehicles, trucks, motorcycles, pedestrians, cyclists, or other objects.
Information can be exchanged between V2V, V2I, and V2X. If “dangerous” events are predicted, warning information is provided to drivers or automated actions are taken by AVs.
Reduced Human Error
CVs and AVs can reduce or eliminate human error, including erroneous decisions, deficient driving habits, unfamiliarity with vehicle and roadway, distraction/inattention, impaired driving, risk-taking behaviours, fatigue, etc.
CVs and AVs can improve the safety of vulnerable road users (e.g., pedestrians and bicyclists) with automatic detection technologies.
New safety concerns may arise—for example, as pedestrians become familiar with the technology, will they step in front of oncoming traffic? How confident are they that autonomous vehicles will stop?
D7.1 – Impact areas and paths Page 32
Factors Safety impacts of CV & AV
AV System Errors
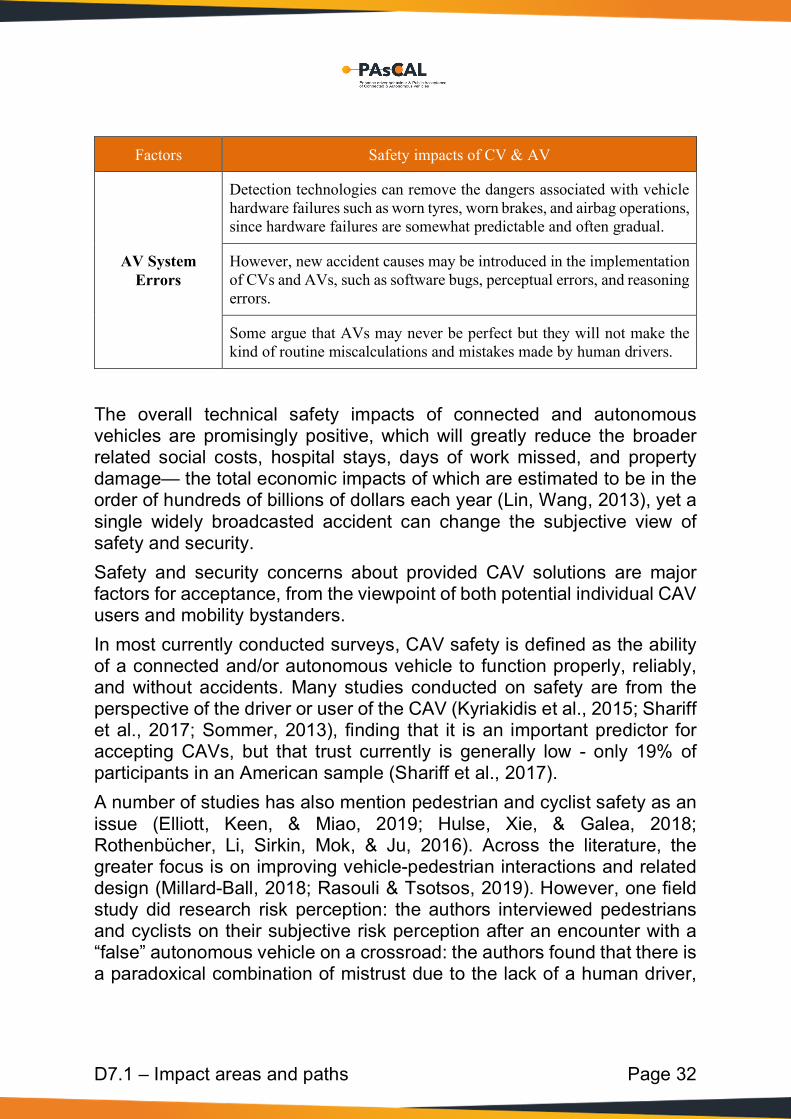
Detection technologies can remove the dangers associated with vehicle hardware failures such as worn tyres, worn brakes, and airbag operations, since hardware failures are somewhat predictable and often gradual.
However, new accident causes may be introduced in the implementation of CVs and AVs, such as software bugs, perceptual errors, and reasoning errors.
Some argue that AVs may never be perfect but they will not make the kind of routine miscalculations and mistakes made by human drivers.
The overall technical safety impacts of connected and autonomous vehicles are promisingly positive, which will greatly reduce the broader related social costs, hospital stays, days of work missed, and property damage— the total economic impacts of which are estimated to be in the order of hundreds of billions of dollars each year (Lin, Wang, 2013), yet a single widely broadcasted accident can change the subjective view of safety and security. Safety and security concerns about provided CAV solutions are major factors for acceptance, from the viewpoint of both potential individual CAV users and mobility bystanders. In most currently conducted surveys, CAV safety is defined as the ability of a connected and/or autonomous vehicle to function properly, reliably, and without accidents. Many studies conducted on safety are from the perspective of the driver or user of the CAV (Kyriakidis et al., 2015; Shariff et al., 2017; Sommer, 2013), finding that it is an important predictor for accepting CAVs, but that trust currently is generally low - only 19% of participants in an American sample (Shariff et al., 2017). A number of studies has also mention pedestrian and cyclist safety as an issue (Elliott, Keen, & Miao, 2019; Hulse, Xie, & Galea, 2018; Rothenbücher, Li, Sirkin, Mok, & Ju, 2016). Across the literature, the greater focus is on improving vehicle-pedestrian interactions and related design (Millard-Ball, 2018; Rasouli & Tsotsos, 2019). However, one field study did research risk perception: the authors interviewed pedestrians and cyclists on their subjective risk perception after an encounter with a “false” autonomous vehicle on a crossroad: the authors found that there is a paradoxical combination of mistrust due to the lack of a human driver,
D7.1 – Impact areas and paths Page 33
and trust due to the conceptual understanding that an algorithm can make more accurate decisions than humans (Rothenbücher et al., 2016). (Howard & Dai, 2014)’s study showed that for 75% of their participants, safety was the most important feature of CAVs, whereas 70% indicated liability of the systems to be the least attractive part of CAVs.
3.2.2 Perceptions of security and privacy In the CAV related literature, the term ‘security’ is generally used to encompass system functioning as well as control over the system. Plenty of literature exists about the potential of cyber-attacks (for an example, see (Sheehan, Murphy, Mullins, & Ryan, 2019)). From an individual user perspective, this is sometimes mentioned as a user concern, but rarely further inspected (Howard & Dai, 2014; Kyriakidis et al., 2015; Schoettle & Sivak, 2014b). More generally security seems to be related to the issue of privacy. Finally, the concept of privacy is taken into account in some studies (Kaur & Rampersad, 2018), including risk perception by users regarding data privacy (location tracking), personal autonomy, and worries about targeted and mass surveillance possibilities (Glancy, 2012; Schoettle & Sivak, 2014a). In one study, around 50% of the queried US Americans were comfortable with their vehicle transmitting information to other vehicles and 42% transmitting it to the vehicle manufacturer (Bansal & Kockelman, 2017).
3.2.3 Perceived risks and impacts on attitudes and behaviour
We consider in this section a general construct of ‘perceived risk’, which is fundamental to CAV use, as without allaying the concerns of future users in this regard, large-scale adoption is not feasible. The subjective perceptions of safety and security are often subsumed under the concept of “trust” in the literature (Choi & Ji, 2015; Kaur & Rampersad, 2018; Shariff, Bonnefon, & Rahwan, 2017), which also includes further constructs, namely vehicle-user transparency and users’ self-perceived technical competence (Choi & Ji, 2015); these will be covered in later sections. The evidence of the impact of risk perception on willingness to adopt CAVs varies between cases studied and the context provided (for a review, see

D7.1 – Impact areas and paths Page 34
(Kyriakidis et al., 2015)). For example, in a study of intention to use, 31% of people did not feel safe about CAV use, and 54% did not believe that such vehicles would function reliably (Sommer, 2013). In another study, 26% of participants particularly mentioned system/equipment failure and vehicle performance in unexpected situations to be a major concern in terms of willingness to use (Schoettle & Sivak, 2014a, 2014b) In terms of willingness to pay, in a survey by (Casley, Jardim, & Quartulli, 2013), 82% of participants chose safety as the most important feature of a CAV, while more than 71% were not willing to spend more than an added $5,000 to purchase an owned vehicle with the necessary technology - far less than they estimated it would actually cost. Being male (as compared to female), driving more (as compared to driving less), and being a common user of advanced cruise control, all increased the willingness to pay for automation (Kyriakidis et al., 2015). Finally, parents interviewed in one study indicated that they might let their children drive in autonomous vehicles if it entailed features such as video feeds, seatbelt checks, automated locking, secure passenger identification and remote access to vehicle information (Tremoulet et al., 2019). Few scientific studies exist on this topic, though many news outlets have already considered this question relevant (Graham, 2014; Humanising Autonomy, 2017; Marshall, 2017).
3.3 Functional design and reliability From a user perspective the functional design and reliability of CAV and relevant services relates much to the concept of “ease of use”. This can be defined as “the degree to which a person believes that using a particular system would be free from effort” based on the proposed definition by (Davis, 1989), as a part of the technology acceptance model. Elements include how quickly a system or technology can be learned by its users, the complexity of and fit with the context in which it functions, as well as barrier perception. Therefore, a large part of perceived ease of use of CAVs is based on the application of functional design, increases in reliability, and convenience, but is also influenced by users’ self-efficacy (Bansal et al., 2016). A meta-analysis across technologies uncovered that within the ease of use concept, adoption of a broad range of innovations could be predicted by those innovations’ complexity, compatibility with existing products, and relative advantage in comparison with other similar products (Tornatzky &

D7.1 – Impact areas and paths Page 35
Klein, 1982). However, some literature has found evidence that perceived ease of use is not always a necessary precondition to technology adoption (Wu & Wang, 2005). In the context of CAVs specifically, one study used a field trial, and after users experienced a drive in a real-life autonomous shuttle, they reported an increase in their perception of ease of use, in the sense that they reported that it had been easier to use than previously imagined (Distler, Lallemand, & Bellet, 2018). A survey study found that on average, participants who had some experience with automation found driverless vehicles to be easier to use (Nordhoff, de Winter, Kyriakidis, et al., 2018).
3.3.1 Perception on the functional design Plenty of research has been carried out on human-machine interaction in the context of CAV-driver interaction (for examples, see Debernard, Chauvin, Pokam, & Langlois, 2016; Saffarian, de Winter, & Happee, 2012), however design impacts on ease of use have seldom been investigated. In one study, participants, when interacting with an artificial driving agent, preferred human-like appearances (as compared to gadget-like) and high autonomy (as opposed to low autonomy) of the agent. This increased perceived intelligence and trustworthiness, possibly due to the greater ease of interaction (Lee, J.-G., Kim, Lee, & Shin, 2015). On the other hand, participants in a simulated drive reported that they did not perceive the use of already-known cars vs higher autonomy cars in any way easier or more difficult (Rödel et al., 2014). In terms of the design of the service, one study showed that an on-demand service decreased the perceived utility of a self-driving bus, due to the extra effort required in calling it (Wien, n.d.).
3.3.2 Perceptions on reliability With an increasing number of connected vehicles with a certain level of automation coming on the market, the issue of perceived reliability will attract more attention. Concerns are specifically focused on the possibility of equipment failure, vehicles getting confused by unexpected situations and vehicle interactions with other road users such as pedestrians and bicycles (Brinkley et al., 2018).

D7.1 – Impact areas and paths Page 36
3.3.3 Perceived ease of use and impact on attitudes and
behaviour With regards to impacting attitudes and behaviours, ease of use, in the manner of perceived behavioural control, significantly explained intention to use in a study conducted with connected and autonomous shuttles (Moták et al., 2017). In terms of willingness to pay, women and older drivers were more willing to pay for an Intelligent Speed Adaptation System (ISAS) that was rated by them as easy to use than were men and younger drivers (Piao, Mcdonald, Henry, Vaa, & Tveit, 2005).
3.4 Comfort and ergonomics Comfort and ergonomics can be approached from two different perspectives:
1. Physical comfort and ergonomics, which refers to the anthropological aspect of the interaction between the user and the CAV;
2. Cognitive comfort and ergonomics, which refers to mental workload of the interaction between the user and the CAV.
The provision of comfort and ergonomics in the design of the CAV and services will contribute to the perceived quality of travel. The definition for quality of travel can be adapted from the similar concept of quality of life (Costanza et al., 2008), in that it is a term for the quality of various experiences during travel; here, it refers to a subjective expectation of an individual for a good travel experience, and takes into account both negative and positive features of CAV travel. A major component for quality of travel is comfort, but it also includes an individual’s need for self-actualization. To some extent, features of safety & security, functional design & reliability and convenience certainly also play a role; however, they will only be covered here in the context of what they mean for comfort. In a study of participants actually experiencing an autonomous vehicle, the strongest rated item was expressed as “taking a ride in the shuttle was fun an enjoyable” (Nordhoff, de Winter, Madigan, et al., 2018).

D7.1 – Impact areas and paths Page 37
3.4.1 Comfort Increase or lack of comfort have been studied in multiple different fashions; for example comfort from the perspective of safeguards (Kaur & Rampersad, 2018), or from the perspective of flexibility, traffic optimization and inclusive transport participation (Fraedrich & Lenz, 2013) Previous literature has for example defined temperature, rate of acceleration/deceleration (‘jerk’, the first derivative of acceleration), seating type, perceived personal security and crowding level, as indicators for quality of travel (Le Vine, Zolfaghari, & Polak, 2015). Additionally, the slowness of autonomous travel and its strategic disadvantage in pedestrian interactions have been suggested as potential detractors to adoption (Millard-Ball, 2018). In terms of reduction of travel times, CAVs could increase comfort in particular for long-distance travel durations, such as trains already do today; however, in two studies, participants from Asia and North America reported that they did not think CAVs would contribute to reduction of travel times (Schoettle & Sivak, 2014b, 2014a). Another important factor for comfort could be the feeling of control; studies have shown that driving a CAV can increase anxiety and feelings of loss of control, and participants often feel relief after being returned control (Hohenberger, Spörrle, & Welpe, 2017; Howard & Dai, 2014), in particular being able to take over control from a driverless vehicle by a button inside the vehicle to stop it (Nordhoff, de Winter, Kyriakidis, et al., 2018).
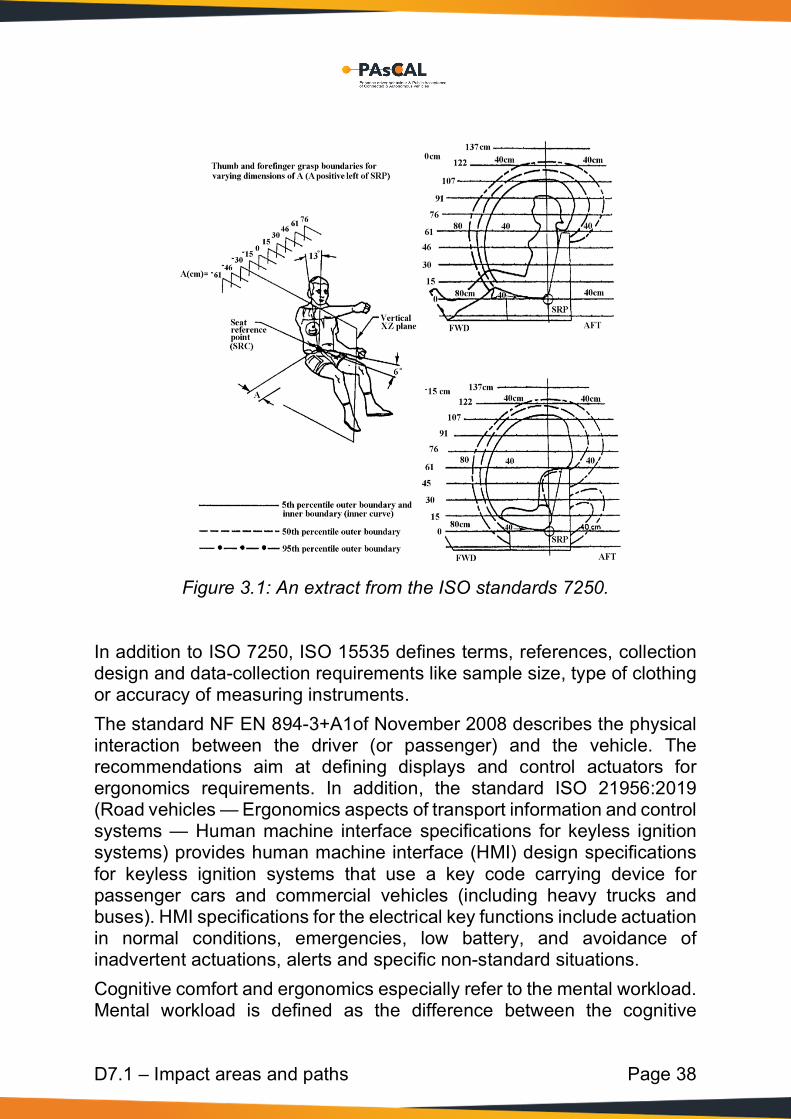
3.4.2 Ergonomics Several standards in physical ergonomics offer a framework for the design of products and services. From an individual point of view, the ISO 7250-1:2017 (Basic human body measurements for technological design — Part 1: Body measurement definitions and landmarks) and ISO 15535:2012 (General requirements for establishing anthropometric databases) standards present the individual anthropometric dimensions of the female and male population. These dimensions ensure user-centred product design (figure 3.1). They serve also as a guide on how to take anthropometric measurements and give information to the ergonomist and designer on the anatomical and anthropometrical bases and principles of measurement which are applied in the solution of design tasks.
D7.1 – Impact areas and paths Page 38
Figure 3.1: An extract from the ISO standards 7250.
In addition to ISO 7250, ISO 15535 defines terms, references, collection design and data-collection requirements like sample size, type of clothing or accuracy of measuring instruments. The standard NF EN 894-3+A1of November 2008 describes the physical interaction between the driver (or passenger) and the vehicle. The recommendations aim at defining displays and control actuators for ergonomics requirements. In addition, the standard ISO 21956:2019 (Road vehicles — Ergonomics aspects of transport information and control systems — Human machine interface specifications for keyless ignition systems) provides human machine interface (HMI) design specifications for keyless ignition systems that use a key code carrying device for passenger cars and commercial vehicles (including heavy trucks and buses). HMI specifications for the electrical key functions include actuation in normal conditions, emergencies, low battery, and avoidance of inadvertent actuations, alerts and specific non-standard situations. Cognitive comfort and ergonomics especially refer to the mental workload. Mental workload is defined as the difference between the cognitive

D7.1 – Impact areas and paths Page 39
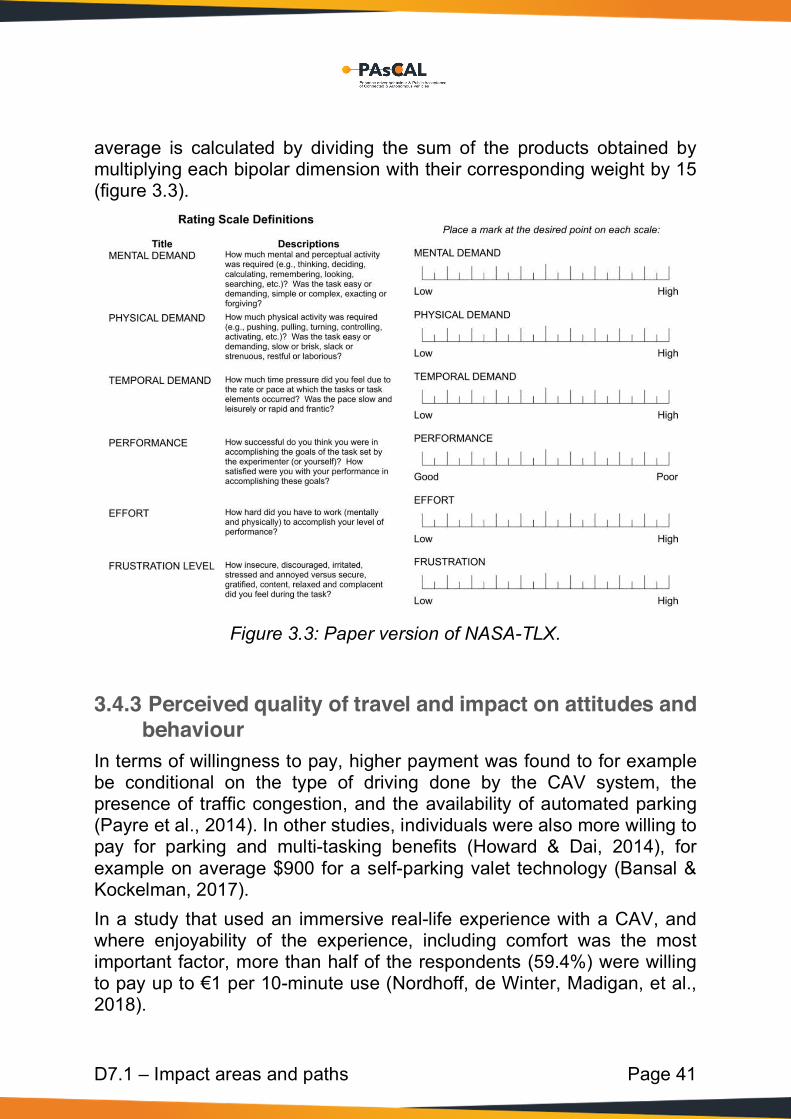
resources demanded by the task and the cognitive resources available to and assigned by the user (Gopher and Donchin, 1986). It is measured by subjective, self-reported measures, either in isolation or together with performance measures (e.g., reaction time), or physiological measures such as heart-rate (Cain, 2007; O’Donnell and Eggemeier, 1986), eye movement data (Di Stasi et al., 2011), optical brain measures (Ayaz et al., 2012) or combined physiological measures (Ryu and Myung, 2005). Subjective measures are popular because of their ease of use and low cost, and because their use is relatively unobtrusive in situations (De Waard, 1996; O’Donnell and Eggemeier, 1986). The standard ISO 10075-1:2017 (Ergonomic principles related to mental workload — Part 1: General issues and concepts, terms and definitions) defines terms in the field of mental workload, covering mental stress and mental strain, and short- and long-term, positive and negative consequences of mental strain. It also specifies the relations between these concepts involved. According to the standard, mental stress is the “total of all assessable influences impinging upon a human being from external sources and affecting that person mentally”. One of the most famous methods for mental workload evaluation is the NASA TLX framework (Hart & Staveland, 1988) (figure 3.2).

D7.1 – Impact areas and paths Page 40
Figure 3.2: Conceptual framework for relating variables that influence human performance and workload (Extracted from Hart & Staveland,
1988).
The NASA-TLX is a multidimensional rating scale that has six bipolar dimensions:
• mental demand (MD); • physical demand (PD); • temporal demand (TD); • own performance (P); • effort (E); • frustration (F).
NASA-TLX includes a two-part evaluation. The first part involves calculating weights of the six dimensions following a set of 15 paired comparisons of the six dimensions. The minimum and maximum weight scores for an individual dimension are 0 and 5, respectively. Therefore, the dimension with the highest weight is the most important contributing factor for the perceived mental workload. The second part includes rating six bipolar scales on a continuous 12 cm line. Subsequently, a weighted
D7.1 – Impact areas and paths Page 41
average is calculated by dividing the sum of the products obtained by multiplying each bipolar dimension with their corresponding weight by 15 (figure 3.3).
Figure 3.3: Paper version of NASA-TLX.
3.4.3 Perceived quality of travel and impact on attitudes and
behaviour In terms of willingness to pay, higher payment was found to for example be conditional on the type of driving done by the CAV system, the presence of traffic congestion, and the availability of automated parking (Payre et al., 2014). In other studies, individuals were also more willing to pay for parking and multi-tasking benefits (Howard & Dai, 2014), for example on average $900 for a self-parking valet technology (Bansal & Kockelman, 2017). In a study that used an immersive real-life experience with a CAV, and where enjoyability of the experience, including comfort was the most important factor, more than half of the respondents (59.4%) were willing to pay up to €1 per 10-minute use (Nordhoff, de Winter, Madigan, et al., 2018).

D7.1 – Impact areas and paths Page 42
3.5 Convenience in usage and self-actualisation Beyond the provision of a certain level of comfort and ergonomics, the CAV user should perceive it as useful. Perceived usefulness, adapted from the concept proposed by (Davis, 1989), can be defined as “the degree to which a person believes that using a particular system would enhance their life, performance or goal-achievement”. It is considered to be a variable that is fundamental and influential in the decision to use technologies. In particular, relevant outcomes from the perspective of the user that have been identified in the context of usefulness are perceived effectiveness, productivity and time savings (Davis, 1989). In one study, after users experienced a drive in a real-life autonomous shuttle, perceived usefulness decreased, corresponding to a certain scepticism concerning CAV’s usefulness for everyday mobility requirements; possibly this was a result of the experience of a 20km/h driving speed and the use of a mobile app prototype to plan the trip (Distler et al., 2018). However, in another study, usefulness was perceived much higher in light traffic situations and somewhat higher in heavy traffic situations, in cases where the driving system was instructive rather than informing (Cramer et al., 2008).
3.5.1 Convenience Convenience is generally used in the literature around CAVs in two ways: the addition of amenities or services that increase accessibility and decrease frustration, and those that save resources. Examples are the increase in last-mile services; avoiding the need to find parking spots (Howard & Dai, 2014) (Greenblatt & Shaheen, 2015); higher work efficiency by provisions made for multitasking, such as access to wi-fi and availability of real-time information applications (Shin, Bhat, You, Garikapati, & Pendyala, 2015); and reduced traffic leading to lower travel times (Roncoli, Papageorgiou, & Papamichail, 2015). In a survey of users from Asia, the majority of respondents did not believe CAVs would be capable of reducing traffic congestion or shortening travel time (Schoettle & Sivak, 2014b). A survey study in Europe, on the other hand, found that on average, participants who had some experience with automation found driverless vehicles to be convenient, and that

D7.1 – Impact areas and paths Page 43
participants could imagine using 100% electric driverless vehicles in connection with public transport (Nordhoff, de Winter, Kyriakidis, et al., 2018). Perceived usefulness might also increase in relation to financial or time resources saved: for example if driving becomes cheaper, for example due to lower insurance rates (Schoettle & Sivak, 2014a), or if demand and supply are balanced perfectly so that systems can suggest the best possible time and route to drive to experience optimal travel time/cost (Gruel & Stanford, 2016).
3.5.2 Self-actualization At high market penetration rates, automated vehicles could increase accessibility to jobs, provide better job opportunities, leisure, and resources for both low and high-income groups, and increase disposable income along with travel (Childress, Nichols, Charlton, & Coe, 2015). In this manner, perceived usefulness could also be affected. The idea of additional leisure time due to the introduction of CAVs could lead to an increase in quality time; this has been reported in many surveys on CAVs (Haboucha et al., 2017; Howard & Dai, 2014; Schoettle & Sivak, 2014a, 2014b); for example, in one study, authors introduced items such as “It is more fun to drive an autonomous vehicle compared to a conventional car” (Haboucha et al., 2017). However, in another study, 41%, of respondents said they would watch the road even though they would not be driving (Schoettle & Sivak, 2014a). Additionally, users might feel that using CAVs might benefit the environment, (Fagnant & Kockelman, 2014; Greenblatt & Shaheen, 2015; Haboucha et al., 2017) and impact sustainability positively (Fraedrich & Lenz, 2013). A higher personal identification due to value overlap on environmental and sustainability values could result in higher enjoyment, and could positively impact the quality of travel experiences. It has been found that participants may declare higher willingness to adopt because CAVs might have a positive impact on environmental friendliness (Howard & Dai, 2014), and those with a greater concern for the environment were found to be more likely to prefer shared autonomous vehicle solutions (Haboucha et al., 2017).
D7.1 – Impact areas and paths Page 44
Finally, an identification with novel technologies, an identity of being an early adopter and technological interest might positively impact travel experience (Haboucha et al., 2017)
3.5.3 Perceived usefulness and impact on attitudes and behaviour
Almost 46% of the people surveyed in a study on perceived usefulness indicated that CAVs will be useful in meeting their driving needs, and that usefulness judgements might play the major role in final adoption patterns (Panagiotopoulos & Dimitrakopoulos, 2018). In another study, perceived usefulness accounted for 21% of the variance explaining the intention to use CAVs (Moták et al., 2017). In a study where participants experienced a CAV themselves, many were not willing to use the shuttle again to replace current options, mostly due to the speed of the shuttle being restricted (Nordhoff, de Winter, Madigan, et al., 2018); in a similar study, participants agreed that it would be a potentially useful addition to the public transportation network for smaller routes that may not be served by large buses (Eden, Nanchen, Ramseyer, & Evéquoz, 2017). A study of potential users in New York city who commuted daily by car found that the average household was willing to pay a significant amount for automation due to the perceived usefulness: perceived benefits here were fewer traffic jams, increased mobility independence, and easier and quicker parking, as well as increased productivity through multi-tasking. Participants were willing to pay about $3500 on average for partial automation and $4900 for full automation. Substantial heterogeneity in preferences was found, as some were willing to pay above $10,000 for full automation, while many were not willing to pay any amount (Daziano, Sarrias, & Leard, 2017).
3.6 Psychological skills and states and CAV A variety of psychological and technical skills and states can impact technology use and adoption willingness.
D7.1 – Impact areas and paths Page 45
3.6.1 Psychological skills In the context of CAVs, it is important to measure which self-perceived skills influence users’ decision making and which psychological states impact choices that users make while in the vehicle. Both of these can affect attitudes of individuals towards CAVs, such as their risk perception or ease of use perception. On one hand, the CAV related literature has looked at concepts such as technological self-efficacy (Bandura, 1977; Bansal et al., 2016), confidence (Lee & Coughlin, 2015; Souders & Charness, 2016) and locus of control (Payre et al., 2014). Aside from this, experience with driving itself, and with previous autonomous systems is often measured as a stand-in for self-efficacy or confidence (Bansal et al., 2016; Krueger et al., 2016; Rödel, Stadler, Meschtscherjakov, & Tscheligi, 2014; Schoettle & Sivak, 2014a). On the other hand, sometimes personality tests are included in surveys to see if they are predictors of adoption, such as the Big Five Inventory (Kyriakidis et al., 2015), or the Sensation Seeking Scale (Bansal et al., 2016; Payre et al., 2014). Finally, sometimes, psychological states seem to be important for acceptance of CAV systems, such as cognitive load or emotional states (Cramer, Evers, Kemper, & Wielinga, 2008), including anxiety (Bansal et al., 2016)
3.6.2 Technical skills In relation to technological skills, several researchers have found that technologically experienced individuals are more positive about autonomous vehicles (Bansal et al., 2016; Lavieri et al., 2017; Zmud & Sener, 2017). In one study, confidence accounted for a small part of the variance explained in willingness to use, possibly moderated via ease of use of the system itself (Moták et al., 2017). Normative and affective aspects, such as values regarding the environment, or financial concerns, proved to be very important in judgements about ease of use as well (Kyriakidis et al., 2015). Additionally, reaction of users to assistive system in cars have been shown to depend on the driver’s cognitive load as well as emotional state (Cramer et al., 2008).
D7.1 – Impact areas and paths Page 46
4 CAV and Vulnerable groups impact areas 4.1 Introduction
4.1.1 Mobility and vulnerable groups considered Mobility is highly correlated to the characteristics of the local spatial context as well as social and cultural construct of society. In order to identify the vulnerable groups to consider, it is proposed to assess the different types of potential exclusion in this regard. In this regard the following categories of exclusion can be distinguished (adapted from Church et al., 2000):
1. Physical exclusion appears when physical barriers limit a person’s ability to access the transport system. This exclusion is due to a mismatch between the physical abilities of a person and the physically offered services.
2. Organizational exclusion, when management strategies and operational models of the service provider do not allow certain groups to use the transport services.
3. Fear-based exclusion, when safety and security concerns lead to a situation in which a certain group of persons avoid the transport system (e.g., as a result of difficulties of wayfinding, fear of getting lost, fear of harassment, etc.).
4. Spatial exclusion, when poor transport services limit the accessibility to specific facilities/services (e.g., shopping, health, leisure, etc.) from a specific area or region.
5. Time-based exclusion, when the time of transport is incompatible with the available time.
6. Economic exclusion, when costs of transport (e.g., pricing, time, etc.) limit access to usage.
While their underlining characteristics can be temporary/transitional (e.g. linked to a specific age or unemployment) or permanent (as the result of a disability), the total group of persons considered vulnerable is rather large in Europe. As an indication in 2017, 22.4% of the population in the EU-28, were at risk of poverty or social exclusion as the result of being part of a vulnerable group (Eurostat 2019). The following vulnerable groups have been identified within the PAsCAL project:
• Elderly,

D7.1 – Impact areas and paths Page 47
• Children and young people, • People with reduced mobility with an additional focus on the visual
impaired, • Women as the result of gender related aspects in transport, • People with low income, • People living in low service (often rural) areas, • Migrants and ethnic minorities.
When looking at age classes, part of the elderly population endures different forms of challenges when traveling, due to diminishing physical and/or cognitive capabilities as well as the progressive digitalisation of services (Eurostat 2015). A large group of elderly is even held back from traveling as a result of these challenges. The experienced limitations of children and young people are due to the lack of autonomy and parents’ responsibility (Barker, 2006). Gender inequality related aspects relate to all topics of mobility and transport offer. It can be related to cultural and social norms, as well as the design of vehicles and transport services. Within PAsCAL gender is considered of high importance of CAV acceptance and usage. Across objectives, therefore, a special focus will be devoted to the role of sex and psychological gender. Based on information system research (Venkatesh, V., & Morris, M. G., 2000), it is expected that women may be less likely to accept CAVs due to lower levels of technology acceptance in general. Bissell et al. (2018) argue that CAV can have a significant effect on inequalities as technological development of motor vehicles and robotics engineering is a male-dominated field and women may be further marginalised in the ongoing evolution of autonomous vehicles. People with reduced mobility are a particular vulnerable segment, since they experience various forms of transport poverty, depending on individual particular type of disability. Even if improvements have been made since, 7.3% and 4.4% of the total EU population (aged 15 and over) reported a disability in mobility and transport life areas, respectively) (Eurostat 2015/ reporting 2012 figures). In PAsCAL we will have a specific focus on people with reduced mobility, specifically as a result of the recognized digital divide. The European Parliament and the Council of the European Union (2006) made the following distinction:

D7.1 – Impact areas and paths Page 48
1. Reduced vision (vision impaired) – key challenges include situational awareness, wayfinding in terminals, acquisition of tickets, or understanding any visual-based information.
2. Reduced hearing (hard of hearing) – key challenges include understanding any sound-based information, which is of relevance in emergency situations, or even to detect any risk.
3. Reduced movement (mobility impaired) – key challenges are linked with the need to overcome different heights (e.g. different levels of the terminal, entering or exiting vehicles), or to overcome gaps (e.g. between terminal quay and vehicle).
4. Environmentally challenged (allergic) – key challenges are related with higher-than-average concentrations of pollutants in or around vehicles and terminals. People with health conditions can be particularly affected in these areas.
5. Psychologically/mentally cognitively challenged – a key challenge is related with the ability of the person to understand how to use the transport system, including knowing what ticket to buy, wayfinding in the terminal, or situation awareness.
Other vulnerable groups are migrants, ethnic minorities and people with low income. Finally, it should be stated that not all persons of an identified vulnerable group experience the same level of exclusion. In several cases they might even not to be considered vulnerable at all. On the other hand, the risk of exclusion can be higher as the result of a cumulative effect, for example elderly persons living in low service rural areas. For each of the vulnerable group impact areas were defined in chapter 2. The needs and the impacts of the different vulnerable groups are further specified in the following paragraphs.
4.2 Mobility and adequacy Public and private transport are growing to each other. Also, the introduction of CAV services whether originally considered as public or private will reinforce this trend. The traditional car manufacturers and traditional public transport operators become providers of mobility services and invest in or cooperate with new mobility services such as for example carsharing. Even if new technologies alone will not spontaneously make our lives better without upgrading our transport systems and policies (EC, 2018) they should be able to improve up to a certain level mobility and adequacy.

D7.1 – Impact areas and paths Page 49
4.2.1 Mobility of vulnerable groups The choice is made to speak about improved mobility, instead of availability. This allows to better link the topics to the actual needs of the vulnerable groups. Vulnerable groups using public transport such as taxis, busses and trains often rely on human drivers and assistance. They recognize the situations in which the vulnerable groups need assistance and are available to give information if needed. It is expected that in autonomous, self-driving vehicles for use in public transport this kind of assistance will disappear. Specifically, for elderly and the impaired this development might have serious consequences in term of mobility and adequacy when introducing new or augmented CAV services. On the other hand, if the adequacy requirements are respected and implemented, this development might lead to a major improvement of their mobility.
4.2.2 Adequacy In terms of adequacy this means that beyond the respect of the safety and security of the vulnerable groups the new CAV features and services should cater for the specific needs of the vulnerable groups (e.g. wayfinding, availability of safety indication, specific needs or help when accessing the vehicle). The CAVs and services are expected to be compatible with specific mobility devices of the vulnerable groups (e.g. pedestrian navigation apps and wheelchairs) (Denninghaus, 2016). the idea of compatibility is sometimes indicated in literature as the “possibility of adaptability” (Shergold et al. 2019 a,b,c). In relation to mobility of children and young persons’ there is a great difference depending on the local context and cultural habits (Shaw et al. 2015). In certain countries children experience more freedom of movement (e.g. Nordic countries) as the result of culture based parents’ trust. At the end there is a great demand of CAV technology to fulfil its promises of improved mobility and adequacy for all, including the different vulnerable groups. It is recognized that there is a clear challenge in measuring personal mobility impacts and translating these findings into general recommendation for the variety of sub-populations such as the different vulnerable groups and might be affected in different ways (Innamaa et al. CARTRE, 2018)

D7.1 – Impact areas and paths Page 50
4.3 Accessibility Accessibility in relation to vulnerable groups is determined as how the CAV and related services provide suitable transport to key activities such as education, employment, health and leisure (e.g. visiting friends, shopping). A low level of accessibility withholds the person to participate normally to society. Beyond matching the CAV services offered with the accessibility needs it is of importance to look at the evolving abilities and skills. It is advised not to assess only against current driving ability. For example when assessing accessibility of CAV by elderly there should be a differentiation between those that have driven in the past (low, moderate and high mileage drivers), those that have driven in the past and no longer drive, and those that have not driven in the past (e.g. elderly women) (Flourish project, 2019). In order to clearly understand the mobility impacts caused by CAVs, Germany and USA did some investigations to explore the impact of autonomous driving on vehicle-kilometres travelled, the relative change of public transport and car trio numbers for difference distance, and car availability changes under the conditions of the breakthrough of CAVs technology, as shown in Figure 4.1. The autonomous driving on vehicle-kilometres increase by 8.6% for both Germany and USA. The CAVs will increase the car trips and decrease the public transport for both Germany and USA. As a result, using CAVs on short trips, normally of walking distance, and on longer trips can lead to an overall increase of vehicle-kilometres travelled of about 9% (Trommer et al. 2016). The public transport trips can significantly decrease over the whole travel distance level, especially for the travel distance longer than 64 km, the decrease can be more than 30% (Trommer et al. 2016). The overall increase in daily trips is 4.14% promoted by the CAVs (Truong et al., 2017).
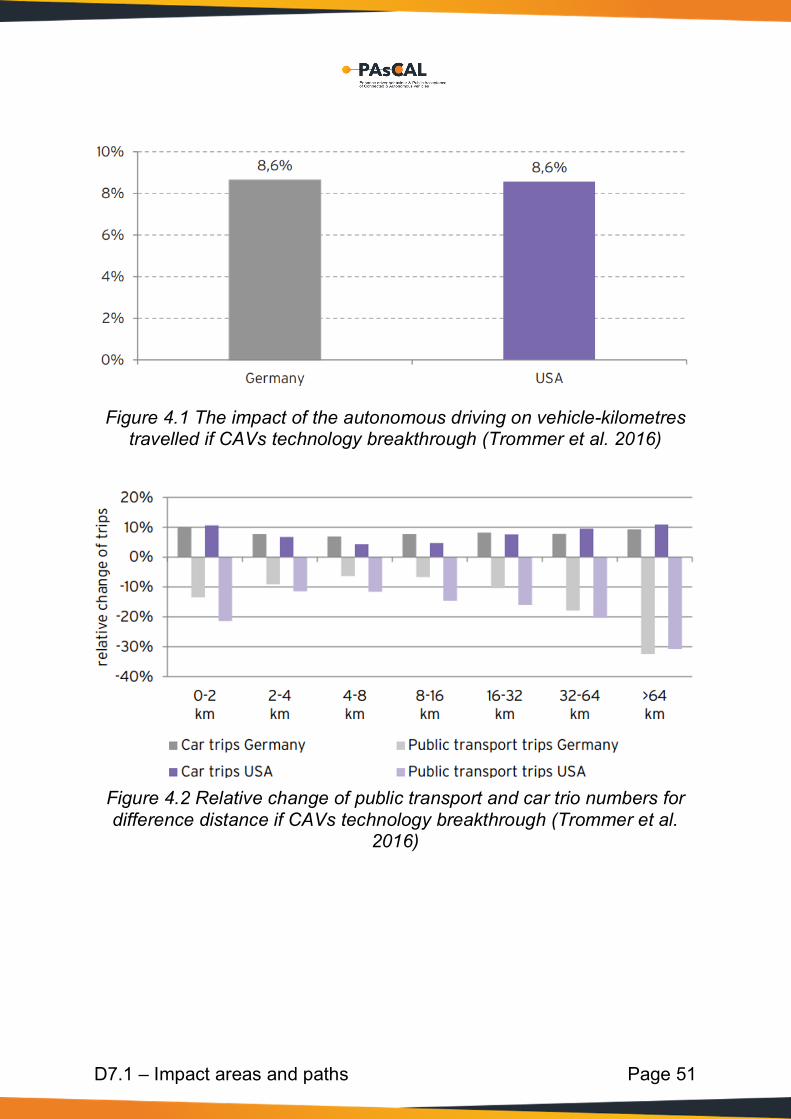
D7.1 – Impact areas and paths Page 51
Figure 4.1 The impact of the autonomous driving on vehicle-kilometres
travelled if CAVs technology breakthrough (Trommer et al. 2016)
Figure 4.2 Relative change of public transport and car trio numbers for difference distance if CAVs technology breakthrough (Trommer et al.
2016)

D7.1 – Impact areas and paths Page 52
Figure 4.3 The car availability changes if CAVs technology breakthrough
(Trommer et al. 2016)
4.4 Affordability To be able to penetrate markets, Connected and Autonomous Vehicles (CAVs) next to adequate, reliable and available should also be affordable. (Clements et al., 2017). Transport affordability in relation to vulnerable groups refers to the financial costs of households for transportation and specifically the ones related to education, employment, healthcare and basic social activities (adopted from Litman, 2017). Often are vulnerable groups due to their place of housing or impairment condemned to ownership or being a passenger of a private car to fulfil part of the basic household needs. Nevertheless, affordability of CAV should not only be viewed from the point of view of private ownership, yet also in distinction to new shared forms of CAV services, and the costs in comparison to the preceding situations and costs of insurance (Cavoli et al. 2017).
4.5 Social Inclusion Social inclusion the process of improving the terms on which individuals and groups take part in society. Having non fulfilled transport needs does not necessarily lead to social exclusion. It is possible to be socially excluded but still have good access to transport or to be transport disadvantaged but highly socially included. Nevertheless, when there is a mismatch between the basic needs and the available transport offer there
D7.1 – Impact areas and paths Page 53
is a higher risk on social exclusion. Most vulnerable groups to social exclusion are specifically the elderly, the impaired, as well as ethnic minorities and migrants. In combination with gender aspects and or low income this can further decrease the level of social exclusion. The impact of the provision of CAV services on reducing multiple social disadvantages and as a result improve social inclusion should receive specific attention. Bissell et al. (2018) argue that while autonomous vehicles are expected to reduce the transport disadvantage of certain social groups, such as the elderly and the disabled, new mobility systems could intensify social segregation as certain networked automated transport systems might be multi-tiered in terms of services, flows and affordability, resulting in greater access to certain sections of the society, more than others. Studies indicate that among the top four reasons attributed to restricted access to education in the UK is the lack of available and frequent local transport, while 36% of disabled respondents cite infrequent public transport as a limiting factor on mobility (Hawes, 2019). It is envisaged that by improving mobility in the UK through CAV, there is a significant potential to improve access to education and enable people with disabilities to have better access to jobs (Hawes, 2019). It is also anticipated that CAVs would have significant positive impact on access to employment, access to education, access to health services and access to discretionary travel for social purposes (Zmud and Reed, 2018). Zmud and Reed (2018) argue that the availability of connected and automated vehicles can influence the availability, cost and efficiency of mobility services with an impact on social well-being. An increase in urban sprawl with negative environmental and social effects have also been envisaged with the increase in autonomous vehicle use (Bissell et al., 2018). The method of CAV deployment can have different effects on how the benefits of automation are distributed. Moreover, the availability of connectivity can determine the services where CAV can be successfully applied.
4.6 Human dignity and ethics In its communication of May 2018, the European Commission states that “automated vehicles will have to be safe, respect human dignity and personal freedom of choice” (EC, 2018). Human dignity is the recognition
D7.1 – Impact areas and paths Page 54
that human beings possess a special value intrinsic to their humanity and as such are worthy of respect simply because they are human beings.
4.6.1 Human dignity CAVs can transform people’s life according to a new research published by the Society of Motor Manufacturers and Traders (2017). Canvassing the views of more than 3,600 respondents, the research found that this new technology could offer beyond a basic level of social inclusion freedom to some of the society’s most disadvantaged, including with those with disabilities, older people and the young. This research showed that CAVs have the potential to reduce social exclusion significantly. About 57% people surveyed said this new technology would improve their quality of life. For young people, the impact could be even greater, with 71% of those aged 17 to 24 believing their lives could be improved. Moreover, consumers are also increasingly seeing the benefits of CAVs, with 56% feeling positive about them. The survey identified that people liked the increased freedom provided by CAVs to engage in other activities instead of driving, for example working, reading or resting on longer journeys (Fürst and Bechter, 2016). As well as the benefits to the driving experience and the journey itself offered by CAVs, there are broader benefits relating to quality of life. Out of the respondents who stated that having a fully connected and autonomous vehicle would improve their quality of life by enabling them to leave the house more often and improve their social life, 95% would expect to go out at least once more per week. Young people were most excited, with almost half (49%) saying they would get into a CAV today if one were available. As for all the people, the biggest attraction of owning a CAV is the freedom to travel spontaneously and socialise with friends and family, with 88% of people who believe CAVs can improve their social life (see figure 4.4). People with mobility-related disabilities are among those set to benefit the most, with almost half (49%) saying a CAV would allow them to pursue hobbies outside of home or go out to restaurants more often (46%). Meanwhile, 39% of people said they would benefit from having better access to healthcare. Adults in this group are nearly three times as likely as the rest of the population to lack a formal qualification, and are less likely to be in paid employment. With car ownership lower in this group than the average population, CAVs offer the potential to access education and better paid jobs.
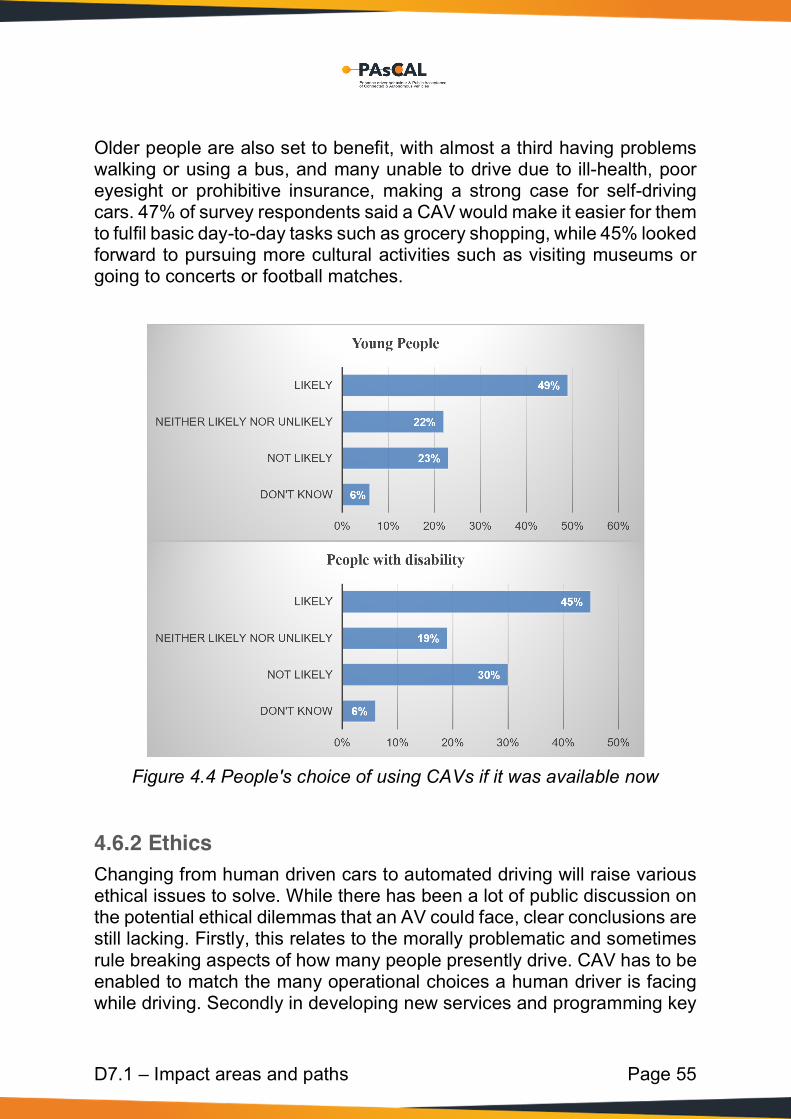
D7.1 – Impact areas and paths Page 55
Older people are also set to benefit, with almost a third having problems walking or using a bus, and many unable to drive due to ill-health, poor eyesight or prohibitive insurance, making a strong case for self-driving cars. 47% of survey respondents said a CAV would make it easier for them to fulfil basic day-to-day tasks such as grocery shopping, while 45% looked forward to pursuing more cultural activities such as visiting museums or going to concerts or football matches.
Figure 4.4 People's choice of using CAVs if it was available now
4.6.2 Ethics Changing from human driven cars to automated driving will raise various ethical issues to solve. While there has been a lot of public discussion on the potential ethical dilemmas that an AV could face, clear conclusions are still lacking. Firstly, this relates to the morally problematic and sometimes rule breaking aspects of how many people presently drive. CAV has to be enabled to match the many operational choices a human driver is facing while driving. Secondly in developing new services and programming key
D7.1 – Impact areas and paths Page 56
ethical values need to be embedded and correctly matched with the freedom of choice. It is being wrongly assumed that AVs would be able to know certain characteristics of individuals and the consequences of every action with certainty. The request which is being made by our society is that AVs avoid making ethically wrong decisions, rather than requiring them to positively take ethically correct decisions (Hars, 2016 in Alonso/ JRC 2017).
D7.1 – Impact areas and paths Page 57
5 CAV and societal impact areas 5.1 Introduction CAVs are expected to bring significant impacts on various factors at the societal level. These impacts can be found for example on mobility, safety, security, quality of life as well as well as public awareness and public acceptance of the technology. Each of the societal impact areas defined are shortly discussed in the following paragraphs.
5.2 Mobility and transport network CAVs provide several advantages for people which have a considerable impact on the society. The efficiency and capacity of network can be improved by a reduction in headway time. Minelli demonstrated that the average travelling time generally increase due to the adoption of CAVs. The CAVs also accelerate the development of “the first and last mile mobility” (Ohnemus et al. 2016). Such as, the shared autonomous vehicles would make door-to-door travel easier, combined with public transport systems, which can substantially increase the synergies among different modes of mobility. This section outlines the impact of CAVs on mobility and transport network.
5.2.1 Mobility Societal mobility can be significantly improved if vehicles safely perform driving actions themselves at a high autonomous driving level (level three and up). This can provide more opportunities for millions of people (Lin, Wang, and Guo 2016), such as elderly, children, the disabled, blind and people without a driving license. In case of long-distance driving, CAVs also permit higher driving speed, which can be difficult to manoeuvre in case of human driving. The high cruising speed greatly enhances the traffic flow and decreases the journey time (Lin, Wang, and Guo 2016). The mobility options and travel horizons can be increased for large number of people if CAVs can join the road network for equal opportunity use (Lin, Wang, and Guo, 2016). CAVs is also an effective approach to decrease congestion, as indicated by Minelli (Minelli, 2015), which will greatly influence the mode choice for different market penetrations of CAVs. CAVs will also significantly promote the development of shared mobility that has the potential of providing door-
D7.1 – Impact areas and paths Page 58
to-door transport, by using less than 10% private cars and parking places (Burghout, 2014). This view is also supported by Minelli (Minelli, 2015), who states that CAVs can also accelerate the development of “the first and last mile mobility” (Ohnemus et al. 2016), such as, shared autonomous vehicles making door-to-door travel easier, combined with the public transport systems. CAVs thus can effectively contribute to a sustainable transport system. Some modelling forecasts of autonomous transport claim to reduce the number of vehicles on the road, however, if the use of the public transport system is reduced, autonomous vehicles could increase congestion (Bissell et al., 2018).
5.2.2 Traffic control CAVs can communicate with other vehicles and traffic controllers, such as the traffic flow density, traffic lights, and accidents. Meantime, the controllers can get the comprehensive information of vehicle situation. The controllers can optimize the traffic control strategies by using the received vehicle information, such as changing the traffic light duration, splitting traffic flow. Meantime, the CAVs can get the controller command simultaneously to get a longer response time (Lin, Wang, and Guo 2016). The CAVs also promote the achievement of “stop-and-go”, such that all the vehicles in the flow act almost in the same time, which is helpful for the traffic control. It was demonstrated using experiment, that traffic control is available when small fractions of vehicles are CAVs (Stern, 2018). Additionally, the shared vehicle information can control/improve the string stability of the traffic flow, preventing the formation and propagations of shockwaves (Talebpour et al., 2016).
5.2.3 Network performance Compared with conventional driving, connected autonomous driving can effectively decrease road congestion and increase road capacity, by decreasing minimum gaps and headway time between them. Table 5.1 shows the effect of the connected autonomous driving on the transport network. The maximum flow of the traffic increases by 23.81% if all the vehicles are autonomous driving. Meantime, the critical density of the traffic increases from 25.22/km to 37.44/km, with the value increasing by 48.45%. This can significantly improve traffic conditions, with less possibility of congestions. The benefits of driverless cars are more and more obvious with an increasing penetration. Figure 5. shows the average
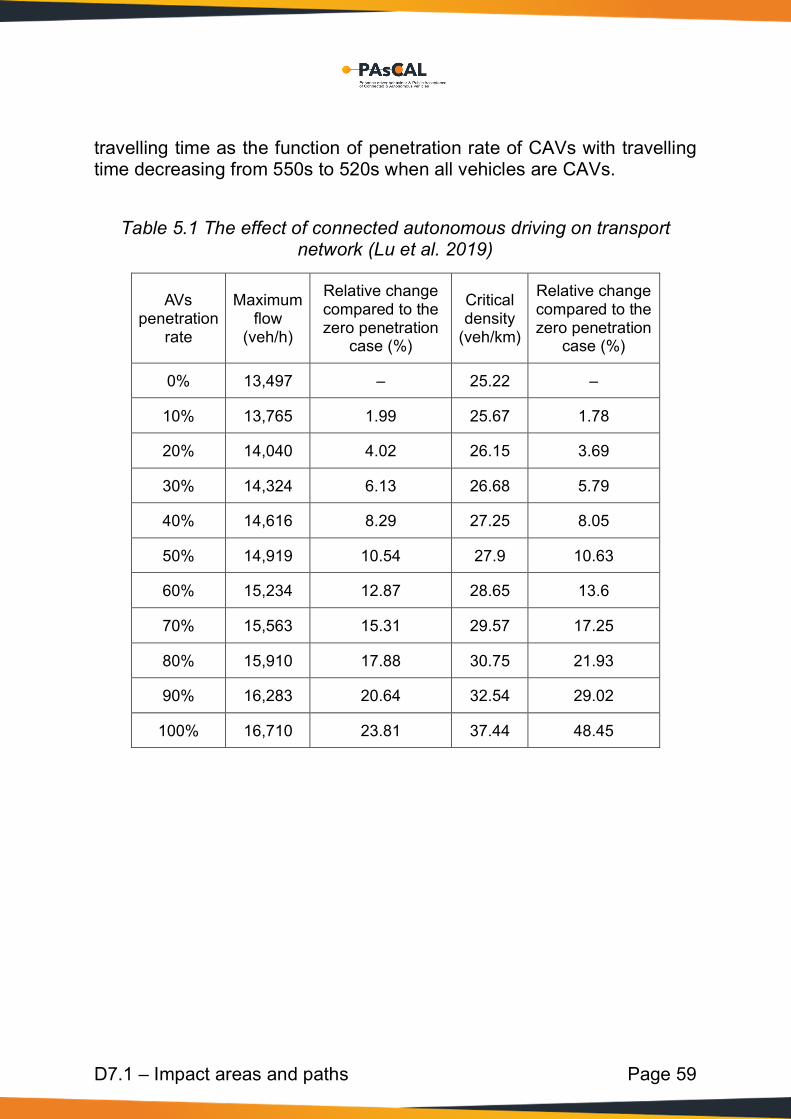
D7.1 – Impact areas and paths Page 59
travelling time as the function of penetration rate of CAVs with travelling time decreasing from 550s to 520s when all vehicles are CAVs.
Table 5.1 The effect of connected autonomous driving on transport network (Lu et al. 2019)
AVs penetration
rate
Maximum flow
(veh/h)
Relative change compared to the zero penetration
case (%)
Critical density
(veh/km)
Relative change compared to the zero penetration
case (%)
0% 13,497 – 25.22 –
10% 13,765 1.99 25.67 1.78
20% 14,040 4.02 26.15 3.69
30% 14,324 6.13 26.68 5.79
40% 14,616 8.29 27.25 8.05
50% 14,919 10.54 27.9 10.63
60% 15,234 12.87 28.65 13.6
70% 15,563 15.31 29.57 17.25
80% 15,910 17.88 30.75 21.93
90% 16,283 20.64 32.54 29.02
100% 16,710 23.81 37.44 48.45
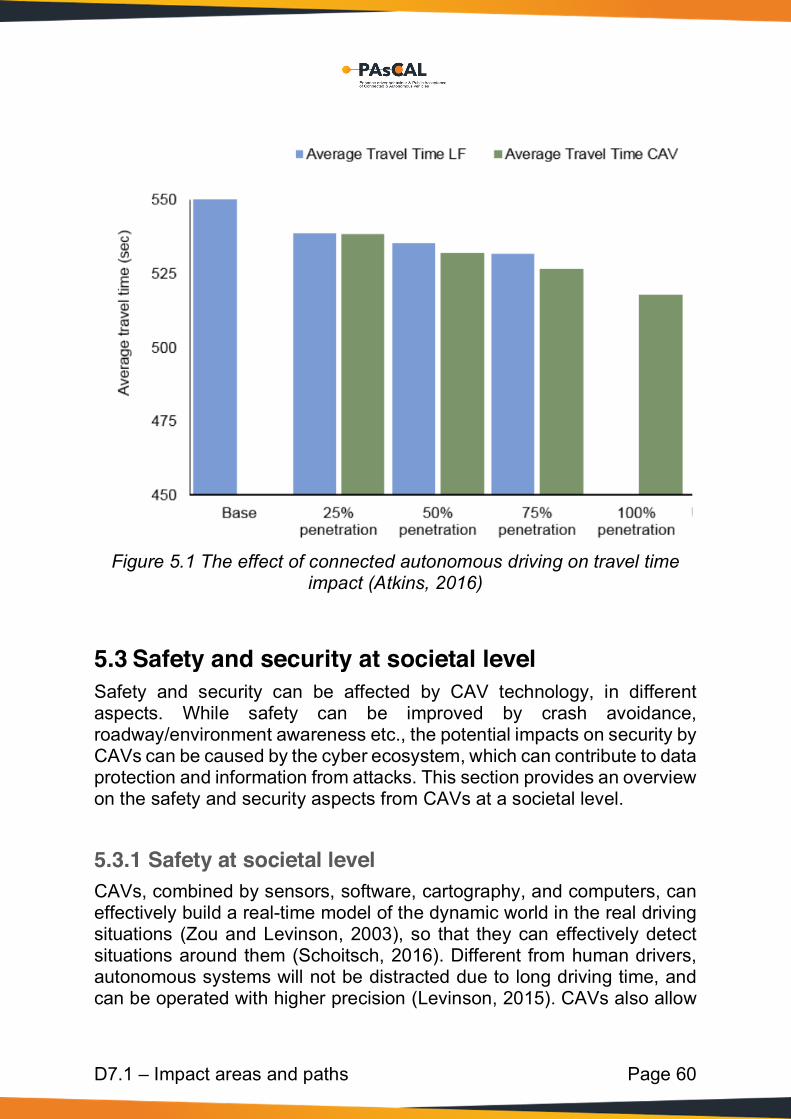
D7.1 – Impact areas and paths Page 60
Figure 5.1 The effect of connected autonomous driving on travel time
impact (Atkins, 2016)
5.3 Safety and security at societal level Safety and security can be affected by CAV technology, in different aspects. While safety can be improved by crash avoidance, roadway/environment awareness etc., the potential impacts on security by CAVs can be caused by the cyber ecosystem, which can contribute to data protection and information from attacks. This section provides an overview on the safety and security aspects from CAVs at a societal level.
5.3.1 Safety at societal level CAVs, combined by sensors, software, cartography, and computers, can effectively build a real-time model of the dynamic world in the real driving situations (Zou and Levinson, 2003), so that they can effectively detect situations around them (Schoitsch, 2016). Different from human drivers, autonomous systems will not be distracted due to long driving time, and can be operated with higher precision (Levinson, 2015). CAVs also allow

D7.1 – Impact areas and paths Page 61
the communication between other vehicles nearby, which can be helpful to increase the driving safety. However, it can also provide more opportunities to be attacked, which can make both the passengers and other road users in danger as illustrated in the following figure 5.2.
Figure 5.2 Safety and security in societal level (Schoitsch, 2016)
Based on the CAV technology, safety can be improved not only for those in the vehicles, but also for the pedestrians, bicyclists, and other drivers on the road. The overall safety impacts of CAVs are promisingly positive, which will greatly reduce the broader related social costs – cost of life, hospital stays, days of work missed, and property damage. These costs saved total in the hundreds of billions of dollars each year (Lin and Wang, 2013). 5.3.1.1 Crash avoidance It has been demonstrated by many researches and demonstrations that CAVs are a low risk transport mode, which helps to prevent large amounts of crashes and fatal accidents, in turn it effectively decreases the possibility of traffic delays (Bagloee et al. 2016). According to Insurance Institute for Highway Safety (2010), nearly 1/3 of fatal crashes and 1/5 of serious/moderate injury crashes can be dropped if CAVs are introduced. Bagloee et al. (2016) show that the adoptions of CAV technology are more likely to decrease the probability of accident occurrence, further making traffic smoother. As described earlier it was demonstrated (among other Goodall, 2014), that CAVs are considered to be safer than a human driver from technical aspects. Based on these studies, the safety benefits of CAV technology help to decrease the number of crashes, further preventing the burden of workplace losses, emergency service costs, congestion burden,

D7.1 – Impact areas and paths Page 62
insurance administration costs and property damage. Additionally, many accidents are caused by fatigue driving caused by bad sleep quality, long driving time or bad driving conditions. As CAVs can be free from these bad situations, the possibility of having an accident dramatically decreases. It also seems likely that as technologies improve and proliferate, crashes can continue to decrease. 5.3.1.2 Roadway/environment awareness CAVs can provide enhanced awareness and a longer response time for drivers who have a weak capability of detecting and judging surrounding situations, especially in hazardous environments (such as darkness, bad weather etc.). The CAVs technology can also detect the presence of surrounding vehicles (trucks, motorcycles, buses, and tram) and other objects (pedestrians, bicyclists, and other hazards). If “dangerous” situations are detected, the notice information will be provided to the CAVs system, which will take actions to avoid crash occurrence (Lin, Wang, and Guo, 2016). 5.3.1.3 Driving precision Studies showed that human error is primarily blamed for more than 90% of vehicle crashes, which means that driver behaviour is the most important factor for traffic safety (Maddox 2012; Bagloee et al. 2016; Lin, Wang, and Guo 2016). The statistics for road accident in the US also support the opinion (Aufrère et al. 2003). For human driving, it is impossible to avoid error during driving however, CAVs can effectively drop the driving errors to a rather low level, without being interfered by human. According to the studies (Lin, Wang, and Guo, 2016), CAVs can reduce or eliminate human error, including erroneous decisions, deficient driving habits, unfamiliarity with vehicle and roadways, distraction/inattention, impaired driving, risk-taking behaviours, fatigue, etc. Additionally, CAV technology can improve the safety of vulnerable road users (e.g., pedestrians and bicyclists) by decreasing the accidents between vehicles and other road users.
5.3.2 Security at societal level For the adoption of CAVs, public acceptance and customer trust significantly depends on the security of cyber ecosystem. The CAVs have

D7.1 – Impact areas and paths Page 63
a high possibility of being attacked compared with other vehicles (Schoitsch 2016) due to more communications and data share with the vehicles and control systems nearby. For example, terrorists can hack into CAV systems and cause accidents for their targets (e.g. targeted hijacking of valuable vehicles). Hackers can operate the vehicle operation systems by attacking, such as car locking systems, sensors, engine controls, brake functions, and others (Lin, Wang, and Guo, 2016). According to the studies (Parkinson et al. 2017), cyber security is a huge contributing factor affecting CAV security. As the reference showed (Parkinson et al. 2017), the potential security issues can be caused by different sources, such as CAV intelligent systems, traffic control systems, CAVs nearby and other road users. CAVs could increase privacy data theft, due to large quantity of personal data generated without the permission of the CAV users. In addition, the highly connected vehicles and the pressures of on time-to-market make the CAVs a good platform for hackers to attack, due to lack of enriched experience of software. This can cause several cyber security vulnerabilities (Haas and Möller, 2017). The CAVs thus need to be protected against cyber-attacks, wireless carjacking, etc. Otherwise, the connected vehicles, and self-driving cars, can become prime targets for criminals. As it is almost impossible to eliminate all vulnerabilities in the system or achieve perfect security, data and information must be protected to decrease external and internal attacks to provide a relative safe cyber ecosystem. So related companies and CAV users must both ensure and protect the flow of data across their organizations (Lin, Wang, and Guo, 2016). In the following table all the possible societal impacts are listed (Table 5.2).
Table 5.2 The potential impacts of security from societal level
Knowledge gap Potential impacts Unknown implications of exploiting navigation mechanisms
Targeted hijacking of valuable vehicles Large safety concerns for public citizens
How many sensors are required to provide sufficient redundancy
Insufficient use of sensors may allow a cyber-attack to create "blind spots" with large potential consequences

D7.1 – Impact areas and paths Page 64
Knowledge gap Potential impacts Overuse of sensor devices would inflate manufacturing cost, but may increase end-user confidence
A comprehensive analysis of how and to what effect ECUs can be compromised
Presents danger to citizens as the vehicle could conduct unsafe operations
What personal data will be generated and stored on a vehicle, and to what extent it can be exploited
Large volumes of personal data might be generated without the passengers' knowledge Monetization of CAVs would increase data theft
How will control be passed back to the vehicle if it detects a cyber threat and how will it pass control back to the driver
Dangerous to passengers and other vehicles
How the added computational resources of a CAV can be utilized in digital forensics
Inability to prove attacks/theft could impact on the ability to prosecute criminals Ability to modify historical information (e.g. milometer) would result in a lack of public trust
5.4 Socio-economic impacts CAVs can have a significant impact on the socio-economic structure as it can bring changes in the employment structure, business opportunities and partnerships as well as social interaction and inclusion. It is expected that CAV technology can make more people socially active with better accessibility to education and employment. However, CAVs can also reduce employment for certain section of the society while creating new employment opportunities for others. The socio-economic impacts from CAV can be summarised as follows (Table 5.3):
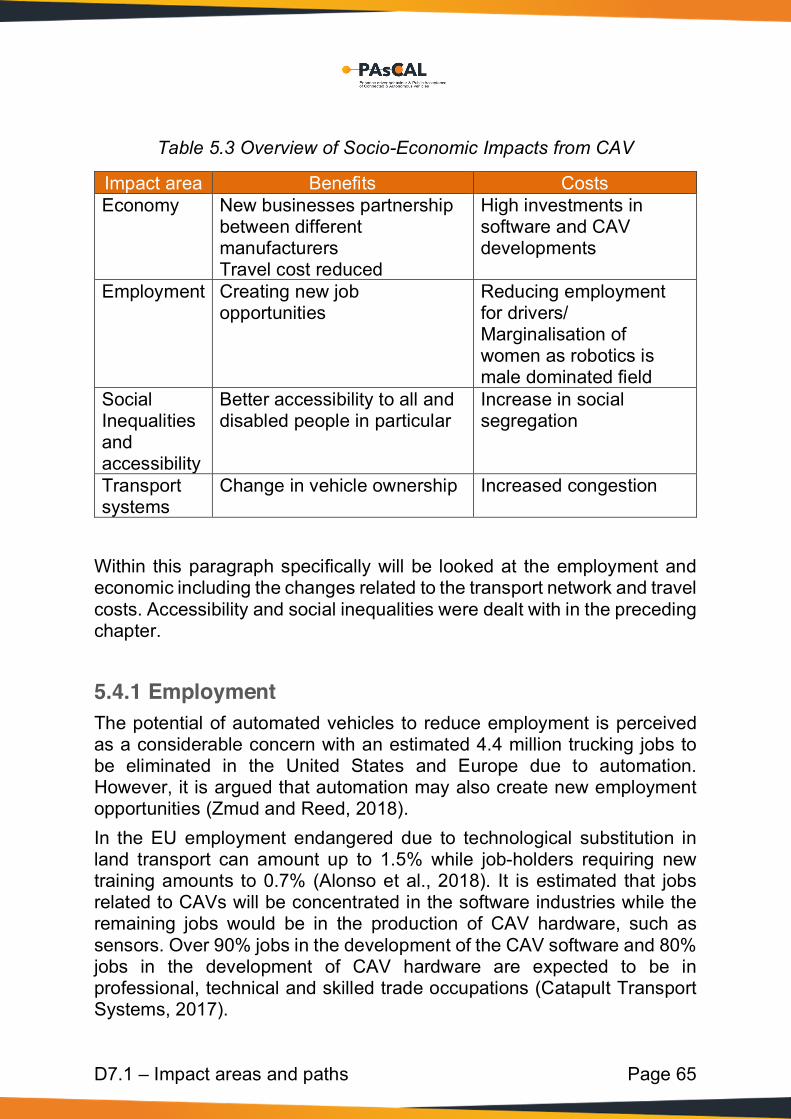
D7.1 – Impact areas and paths Page 65
Table 5.3 Overview of Socio-Economic Impacts from CAV
Impact area Benefits Costs Economy New businesses partnership
between different manufacturers Travel cost reduced
High investments in software and CAV developments
Employment Creating new job opportunities
Reducing employment for drivers/ Marginalisation of women as robotics is male dominated field
Social Inequalities and accessibility
Better accessibility to all and disabled people in particular
Increase in social segregation
Transport systems
Change in vehicle ownership Increased congestion
Within this paragraph specifically will be looked at the employment and economic including the changes related to the transport network and travel costs. Accessibility and social inequalities were dealt with in the preceding chapter.
5.4.1 Employment The potential of automated vehicles to reduce employment is perceived as a considerable concern with an estimated 4.4 million trucking jobs to be eliminated in the United States and Europe due to automation. However, it is argued that automation may also create new employment opportunities (Zmud and Reed, 2018). In the EU employment endangered due to technological substitution in land transport can amount up to 1.5% while job-holders requiring new training amounts to 0.7% (Alonso et al., 2018). It is estimated that jobs related to CAVs will be concentrated in the software industries while the remaining jobs would be in the production of CAV hardware, such as sensors. Over 90% jobs in the development of the CAV software and 80% jobs in the development of CAV hardware are expected to be in professional, technical and skilled trade occupations (Catapult Transport Systems, 2017).
D7.1 – Impact areas and paths Page 66
5.4.2 Economy The economic benefits of CAV on different industries have been estimated to be Only for the UK, these benefits are estimated to be a £51 billion UK opportunity by 2030 (annual economic benefit) (Leech et al., 2015). This figure comes from: A £40 billion opportunity coming from consumers (£20 billion from a decreased value of travel time, £15 billion from more efficient trips and £5 billion from reduced costs including insurance, running costs and parking), £2 billion coming from producer profits as a result of increased demand and local content, £16 billion wider impacts (e.g. reduced travel and freight costs, telecommunication data traffic increases, growth in revenues from sectors like digital media, electronics, etc.), £2 billion from taxation, and £2 billion from improved safety (assuming a 50% decrease of human error related accidents); to which £11 billion are discounted, corresponding to infrastructure investments and rise in road maintenance costs (Alonso et al., 2018). In the US, the economy is anticipated to change in almost every industry with freight transport, land development, automotive industry, electronics and software technology expected to have increased growth while insurance, personal transportation, auto repair, medical, construction, traffic policing and legal profession expected to have a negative consequence from CAVs (Clements and Kockelman, 2017). Hussain et al. (2018) states that the introduction of autonomous vehicles will reduce the cost of travel while another strategic shift would be in higher investments in software and artificial intelligence, in comparison to the car itself.
5.4.3 Business exploitation and partnerships Alonso et al. (2018) indicate that changes in the value chain and share in the vehicle will require the vehicle manufacturers to make substantial adaptations in their manufacturing processes and organisations. This will result in partnerships between different manufacturers that are associated with the content, hardware and software components of the vehicle. Moreover, mobility as a service will open up for disabled, elderly and young people. The automated driving technologies could strengthen mobility practices by reducing the cost of the driver and changing vehicle ownership.
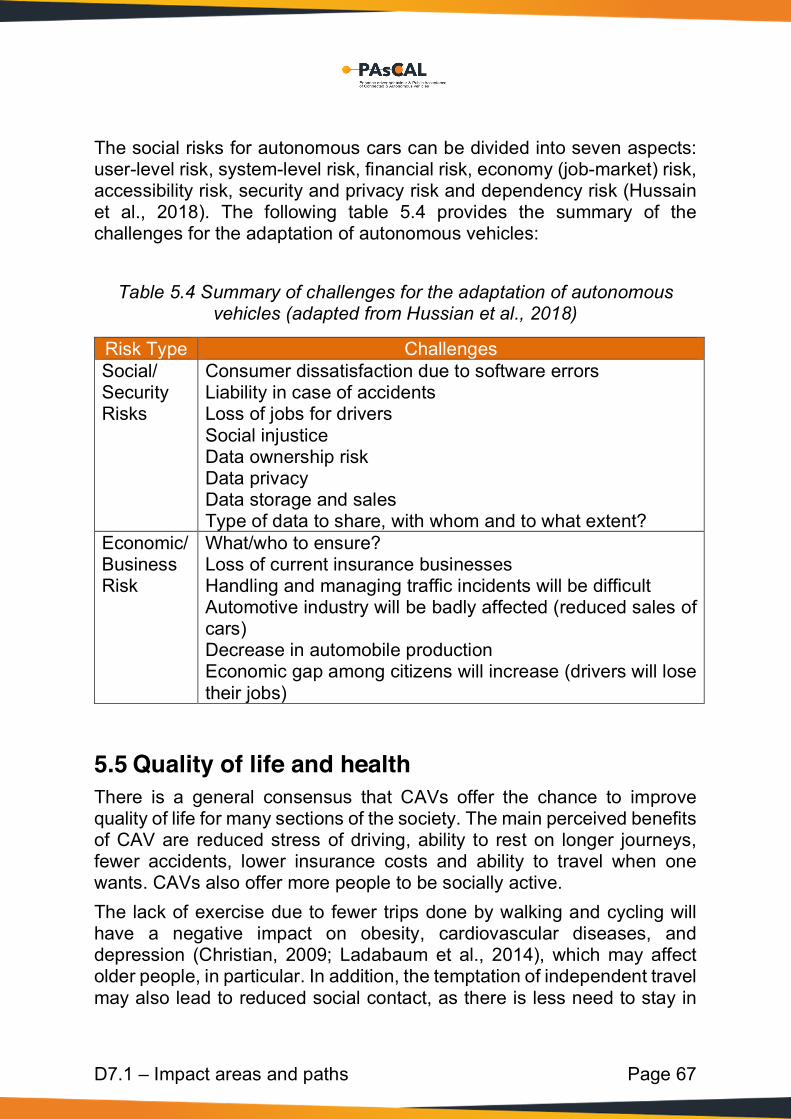
D7.1 – Impact areas and paths Page 67
The social risks for autonomous cars can be divided into seven aspects: user-level risk, system-level risk, financial risk, economy (job-market) risk, accessibility risk, security and privacy risk and dependency risk (Hussain et al., 2018). The following table 5.4 provides the summary of the challenges for the adaptation of autonomous vehicles:
Table 5.4 Summary of challenges for the adaptation of autonomous vehicles (adapted from Hussian et al., 2018)
Risk Type Challenges Social/ Security Risks
Consumer dissatisfaction due to software errors Liability in case of accidents Loss of jobs for drivers Social injustice Data ownership risk Data privacy Data storage and sales Type of data to share, with whom and to what extent?
Economic/ Business Risk
What/who to ensure? Loss of current insurance businesses Handling and managing traffic incidents will be difficult Automotive industry will be badly affected (reduced sales of cars) Decrease in automobile production Economic gap among citizens will increase (drivers will lose their jobs)
5.5 Quality of life and health There is a general consensus that CAVs offer the chance to improve quality of life for many sections of the society. The main perceived benefits of CAV are reduced stress of driving, ability to rest on longer journeys, fewer accidents, lower insurance costs and ability to travel when one wants. CAVs also offer more people to be socially active. The lack of exercise due to fewer trips done by walking and cycling will have a negative impact on obesity, cardiovascular diseases, and depression (Christian, 2009; Ladabaum et al., 2014), which may affect older people, in particular. In addition, the temptation of independent travel may also lead to reduced social contact, as there is less need to stay in

D7.1 – Impact areas and paths Page 68
touch with others to get support. Independence is highly valued among older people, as senior respondents of a survey emphasized that they wanted to continue to be able to do things for themselves; however, good social relationships and mutual help and support have been reported as equally important, and there may be a fine line between the benefit of being independent and risking loneliness (Gabriel et al., 2004). It is therefore important to comprehensively design the role of automated transport in the future, which might also require restricting the use of automated services to bridge actual mobility gaps and avoid unnecessary transport and related external effects. The CAVs thus have the potential to improve the mobility of disadvantaged groups while generally contributing to a better quality of life.
5.6 Public awareness Public awareness of CAVs is argued to increase for more people to adapt to CAVs. In a survey conducted in the UK, 55% of the respondents identified themselves as partially or very aware of the CAV technology (Hawes, 2018). In order to increase public awareness of CAVs, the study suggests that government and industry should run information campaigns to provide highlights of the CAV technology. It is expected that by providing more information on autonomous vehicles, the likeliness of CAV acceptance can increase in the public. Young people, elderly and the disabled suffer most from restrictions to their mobility. The study revealed that all these three groups identified CAV as a potential solution to increase their mobility as well as their quality of life. The study shows that over 50% of respondents feel their mobility is restricted while 48% respondents said that reducing the stress of driving is the greatest benefit of CAV. 55% respondents said that they were aware of the CAV technology but mostly unaware of its potential benefits (Hawes, 2018). 57% of young people and 51% of respondents with disability stated that they were very or somewhat aware of CAVs while 45% elderly respondents stated that they were somewhat aware of CAVs. Only 7% of the respondents claimed that they were very aware of the CAV technologies. However, 20% respondents claimed no awareness of CAVs. The survey thus shows that awareness of CAVs is lower among older population (figure 5.3) (Hawes, 2018).
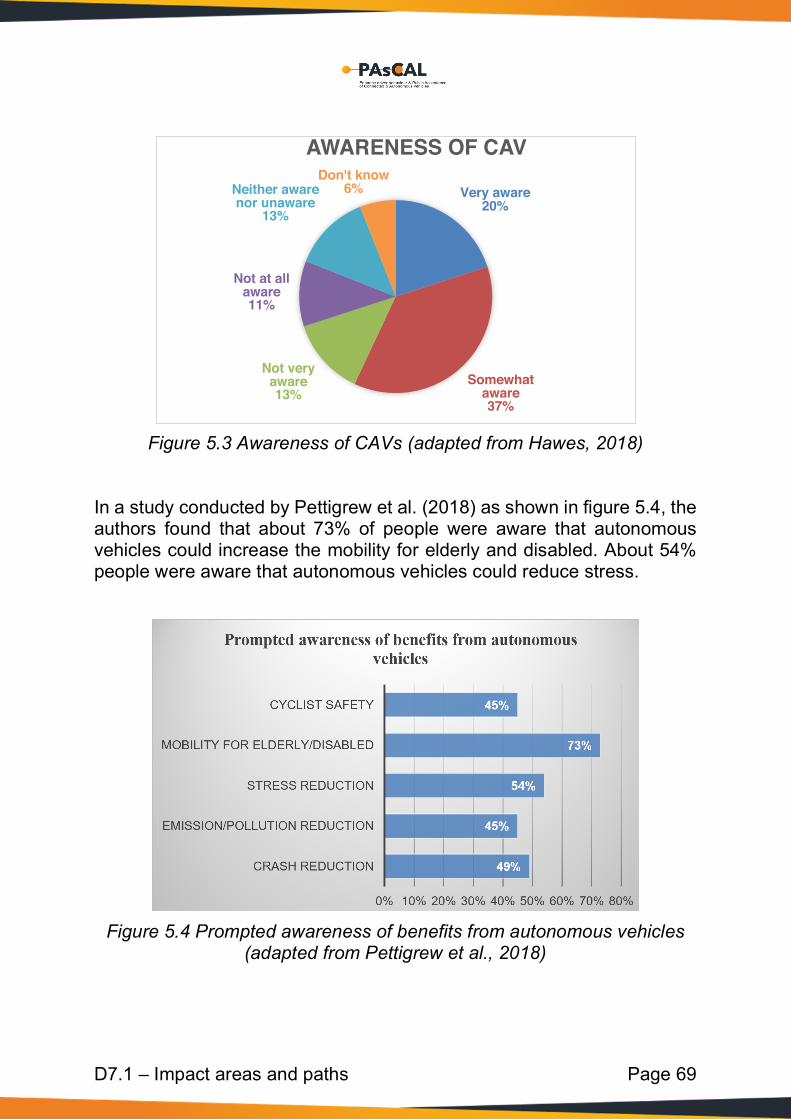
D7.1 – Impact areas and paths Page 69
Figure 5.3 Awareness of CAVs (adapted from Hawes, 2018)
In a study conducted by Pettigrew et al. (2018) as shown in figure 5.4, the authors found that about 73% of people were aware that autonomous vehicles could increase the mobility for elderly and disabled. About 54% people were aware that autonomous vehicles could reduce stress.
Figure 5.4 Prompted awareness of benefits from autonomous vehicles
(adapted from Pettigrew et al., 2018)
Very aware20%
Somewhat aware37%
Not very aware13%
Not at all aware11%
Neither aware nor unaware
13%
Don't know6%
AWARENESS OF CAV
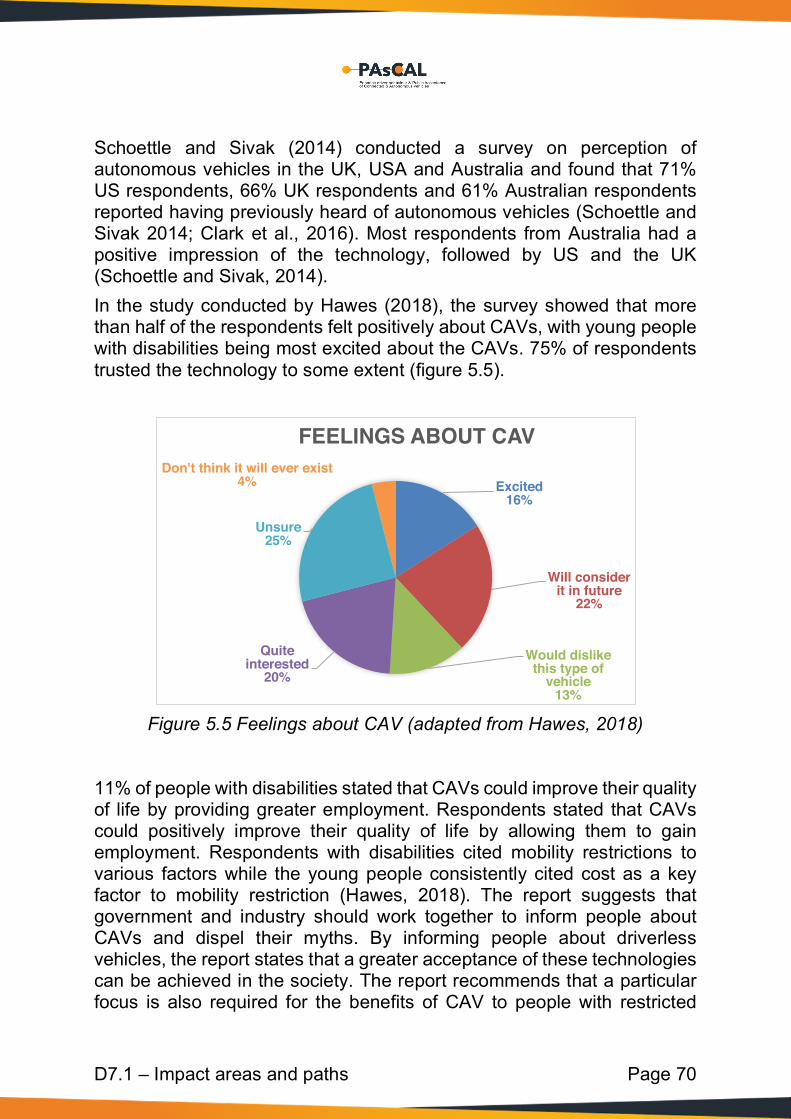
D7.1 – Impact areas and paths Page 70
Schoettle and Sivak (2014) conducted a survey on perception of autonomous vehicles in the UK, USA and Australia and found that 71% US respondents, 66% UK respondents and 61% Australian respondents reported having previously heard of autonomous vehicles (Schoettle and Sivak 2014; Clark et al., 2016). Most respondents from Australia had a positive impression of the technology, followed by US and the UK (Schoettle and Sivak, 2014). In the study conducted by Hawes (2018), the survey showed that more than half of the respondents felt positively about CAVs, with young people with disabilities being most excited about the CAVs. 75% of respondents trusted the technology to some extent (figure 5.5).
Figure 5.5 Feelings about CAV (adapted from Hawes, 2018)
11% of people with disabilities stated that CAVs could improve their quality of life by providing greater employment. Respondents stated that CAVs could positively improve their quality of life by allowing them to gain employment. Respondents with disabilities cited mobility restrictions to various factors while the young people consistently cited cost as a key factor to mobility restriction (Hawes, 2018). The report suggests that government and industry should work together to inform people about CAVs and dispel their myths. By informing people about driverless vehicles, the report states that a greater acceptance of these technologies can be achieved in the society. The report recommends that a particular focus is also required for the benefits of CAV to people with restricted
Excited16%
Will consider it in future
22%
Would dislike this type of
vehicle13%
Quite interested
20%
Unsure 25%
Don't think it will ever exist4%
FEELINGS ABOUT CAV
D7.1 – Impact areas and paths Page 71
mobility (Hawes, 2018). The report shows that the UK lags behind countries such as China in CAV awareness, where more emphasis is placed on in-car technology than on price or vehicle performance. UK consumers however have a positive interest in the potential benefits that CAV could bring. The ability to attend higher education, gain better access to jobs and have an improved social life were considered as some of the main advantages that CAV could bring. The report also states that innovation in software, hardware and services to realise the full potential of CAVs will require new technology, company collaborations and pooling capabilities. To improve public awareness, government and industry are required to work together where investments, partnerships and education can create an environment to develop innovation and technological capabilities.
5.7 Public acceptance Connected and automated vehicles can bring some changes in the aspects of society and economy, which can significantly affect public acceptance of the technology. Public acceptance is dependent on the safety, security, economy and quality of life aspects from CAVs. Public acceptance not only involves the CAV users, but also other road users. The adaptations of the CAVs technology may also pose threat to the other road users (e.g. bicycles and pedestrians). Connected and autonomous vehicles, as a new mobility mode, offer a multitude of advantages to the traveller and therefore influence their daily routines. It is therefore important to see the aspects of consumer and user perception. At the start of the popularisation stage, the public may have less trust in CAVs, and the users are not confident to be the passengers of the non-human controlled vehicles. Successful demonstrations are necessary to show the benefits of the technology and establish confidence in CAVs to the public (Lin and Wang 2013). More and more governments take actions to support the development of CAVs to promote public acceptance (Department for Transport, 2015). Becker and Axhausen (2017) summarised 16 surveys about public acceptance of CAVs over different countries, concluding that majority of the public are willing to use CAVs. The public acceptance of CAVs include different dimensions: attitude dimension, actions dimension and values dimension (Fraedrich and Lenz 2016). Attitudes are vital for the public acceptance investigations, since
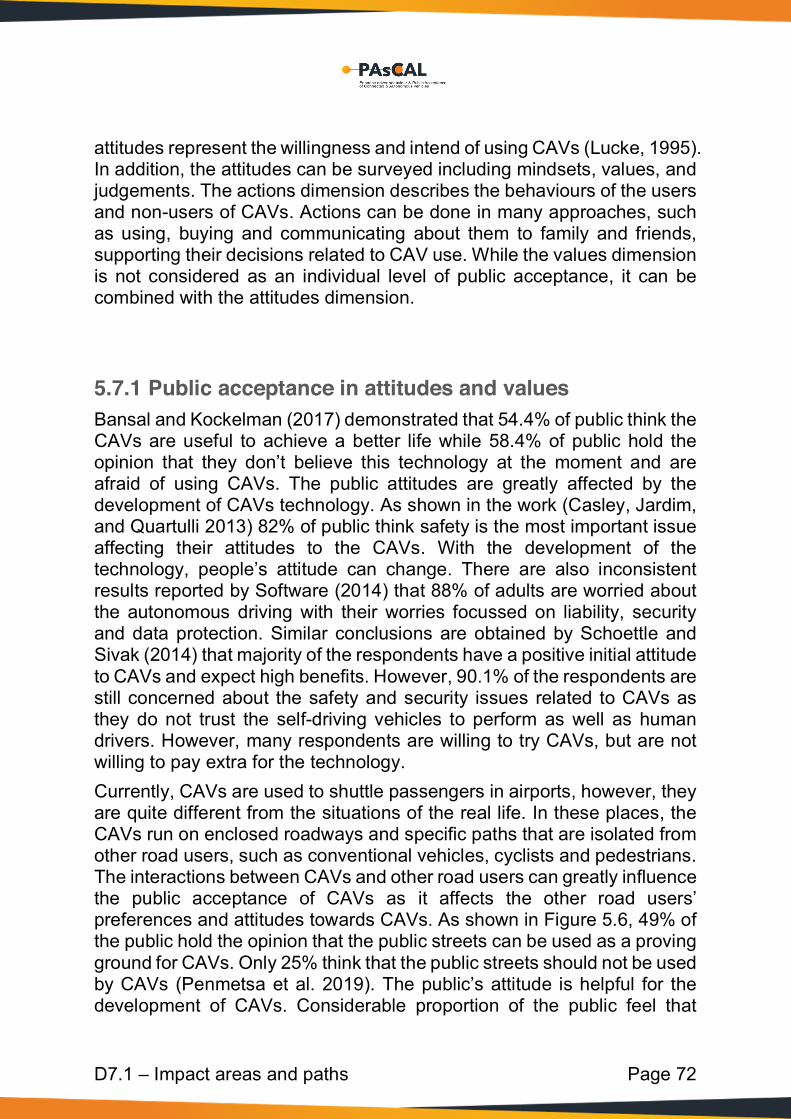
D7.1 – Impact areas and paths Page 72
attitudes represent the willingness and intend of using CAVs (Lucke, 1995). In addition, the attitudes can be surveyed including mindsets, values, and judgements. The actions dimension describes the behaviours of the users and non-users of CAVs. Actions can be done in many approaches, such as using, buying and communicating about them to family and friends, supporting their decisions related to CAV use. While the values dimension is not considered as an individual level of public acceptance, it can be combined with the attitudes dimension.
5.7.1 Public acceptance in attitudes and values Bansal and Kockelman (2017) demonstrated that 54.4% of public think the CAVs are useful to achieve a better life while 58.4% of public hold the opinion that they don’t believe this technology at the moment and are afraid of using CAVs. The public attitudes are greatly affected by the development of CAVs technology. As shown in the work (Casley, Jardim, and Quartulli 2013) 82% of public think safety is the most important issue affecting their attitudes to the CAVs. With the development of the technology, people’s attitude can change. There are also inconsistent results reported by Software (2014) that 88% of adults are worried about the autonomous driving with their worries focussed on liability, security and data protection. Similar conclusions are obtained by Schoettle and Sivak (2014) that majority of the respondents have a positive initial attitude to CAVs and expect high benefits. However, 90.1% of the respondents are still concerned about the safety and security issues related to CAVs as they do not trust the self-driving vehicles to perform as well as human drivers. However, many respondents are willing to try CAVs, but are not willing to pay extra for the technology. Currently, CAVs are used to shuttle passengers in airports, however, they are quite different from the situations of the real life. In these places, the CAVs run on enclosed roadways and specific paths that are isolated from other road users, such as conventional vehicles, cyclists and pedestrians. The interactions between CAVs and other road users can greatly influence the public acceptance of CAVs as it affects the other road users’ preferences and attitudes towards CAVs. As shown in Figure 5.6, 49% of the public hold the opinion that the public streets can be used as a proving ground for CAVs. Only 25% think that the public streets should not be used by CAVs (Penmetsa et al. 2019). The public’s attitude is helpful for the development of CAVs. Considerable proportion of the public feel that
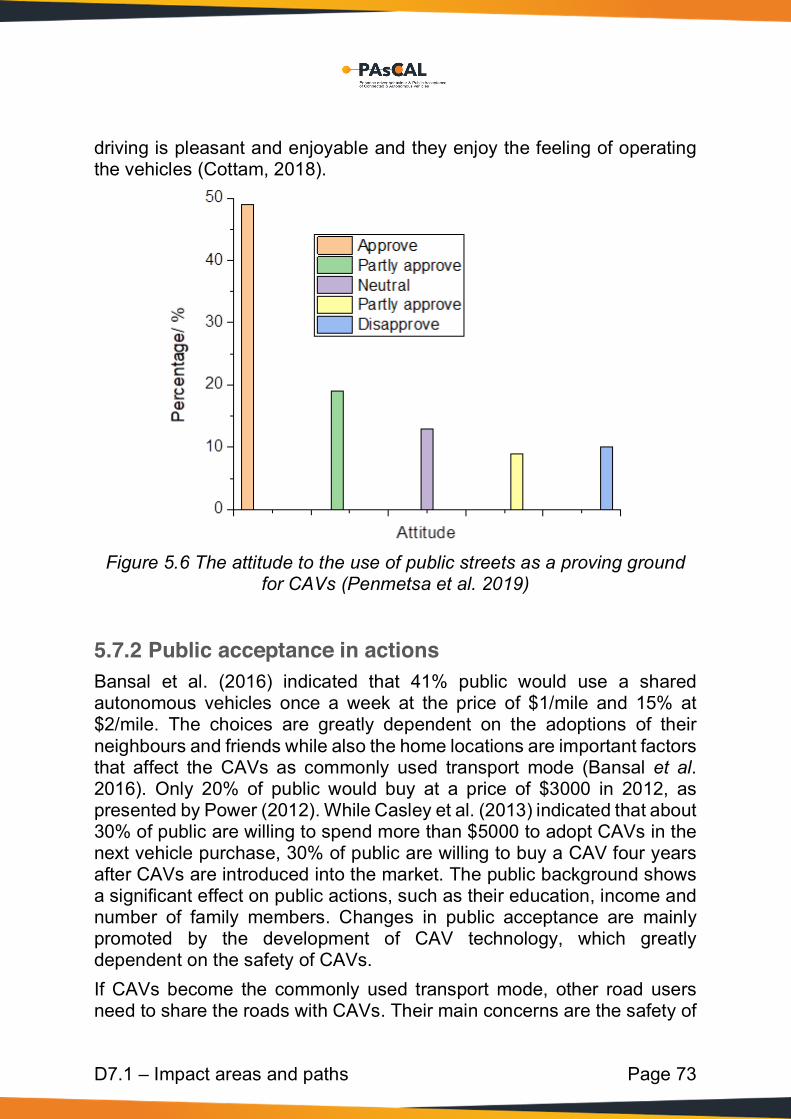
D7.1 – Impact areas and paths Page 73
driving is pleasant and enjoyable and they enjoy the feeling of operating the vehicles (Cottam, 2018).
Figure 5.6 The attitude to the use of public streets as a proving ground
for CAVs (Penmetsa et al. 2019)
5.7.2 Public acceptance in actions Bansal et al. (2016) indicated that 41% public would use a shared autonomous vehicles once a week at the price of $1/mile and 15% at $2/mile. The choices are greatly dependent on the adoptions of their neighbours and friends while also the home locations are important factors that affect the CAVs as commonly used transport mode (Bansal et al. 2016). Only 20% of public would buy at a price of $3000 in 2012, as presented by Power (2012). While Casley et al. (2013) indicated that about 30% of public are willing to spend more than $5000 to adopt CAVs in the next vehicle purchase, 30% of public are willing to buy a CAV four years after CAVs are introduced into the market. The public background shows a significant effect on public actions, such as their education, income and number of family members. Changes in public acceptance are mainly promoted by the development of CAV technology, which greatly dependent on the safety of CAVs. If CAVs become the commonly used transport mode, other road users need to share the roads with CAVs. Their main concerns are the safety of
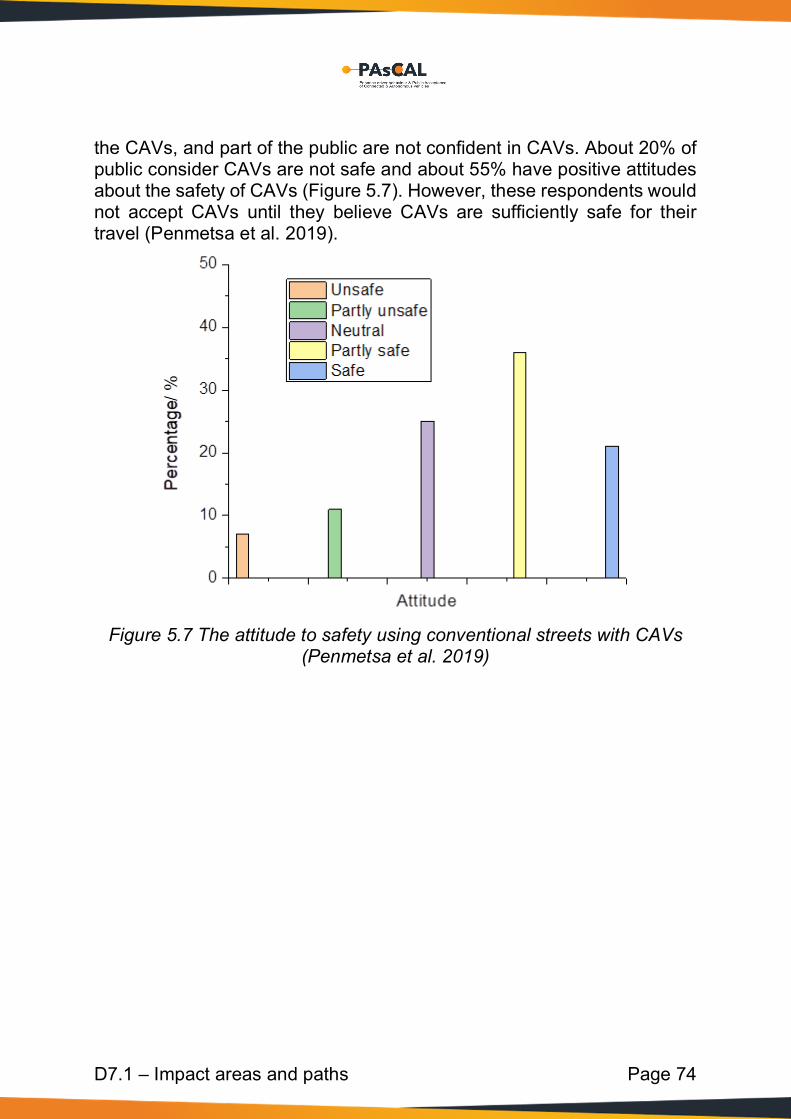
D7.1 – Impact areas and paths Page 74
the CAVs, and part of the public are not confident in CAVs. About 20% of public consider CAVs are not safe and about 55% have positive attitudes about the safety of CAVs (Figure 5.7). However, these respondents would not accept CAVs until they believe CAVs are sufficiently safe for their travel (Penmetsa et al. 2019).
Figure 5.7 The attitude to safety using conventional streets with CAVs
(Penmetsa et al. 2019)
D7.1 – Impact areas and paths Page 75
6 Identified gaps and paths 6.1 Overview of identified gaps Based on the literature research effectuated in task 7.1 several research gaps were identified that prevent a full understanding of the individual perceptions, acceptance, attitudes, vulnerable group and wider societal impacts. The following table provides an overview of the detected shortcomings in research for each of the PAsCAL impact areas. The table 6.1 provides an expert assessment based on the literature research, their references, and influences of the previous listed impact areas in present CAVs development.
Table 6.1 Executed research within the respective impact areas
Individual user Vulnerable groups Spatial/ Societal
Impact areas
Driv
er/
Pass
enge
r
Pede
stria
ns
Cycl
ists
Elde
rly
Impa
ired
Child
ren
Gen
der
Inco
me
(Eth
nic)
Min
.
High
way
Urba
n
Rura
l
Soci
ety
Safety and Security
✓✓✓ ✓ ✓ ✓ ✓ ✓ ✓ -- × ✓✓✓ ✓✓ × --
Functional design
✓✓✓ ✓ ✓ ✓ ✓ ✓ ✓ -- × ✓✓✓ ✓✓ × --
Reliability ✓✓✓ ✓ ✓ ✓ ✓ ✓ ✓ -- × ✓✓✓ ✓✓ × --
Comfort ✓✓✓ ✓ ✓ ✓ ✓ ✓ ✓ -- × ✓✓✓ ✓✓ × --
Ergonomics ✓✓✓ -- -- ✓ ✓ ✓ ✓ -- × ✓✓✓ ✓✓ × --
Convenience ✓ -- -- ✓ ✓ ✓ ✓ × × ✓ ✓ × --
Self-actualisation
✓ -- -- × × × × × × ✓ ✓ × --
Perceived risks ✓✓ ✓ ✓ ✓ ✓ ✓ ✓ -- × ✓✓✓ ✓✓ × --
Ease of use ✓✓ -- -- ✓ ✓ ✓ ✓ -- × ✓✓✓ ✓✓ × --
Quality of travel ✓ -- -- ✓ ✓ ✓ ✓ -- × ✓ ✓ × --
Perceived usefulness
✓ -- -- ✓ ✓ ✓ ✓ -- × ✓ ✓ × --

D7.1 – Impact areas and paths Page 76
Individual user Vulnerable groups Spatial/ Societal
Impact areas
Driv
er/
Pass
enge
r
Pede
stria
ns
Cycl
ists
Elde
rly
Impa
ired
Child
ren
Gen
der
Inco
me
(Eth
nic)
Min
.
High
way
Urba
n
Rura
l
Soci
ety
Willingness to pay
✓✓ -- -- ✓ ✓ -- ✓ ✓ × ✓✓ ✓✓ × --
Willingness to adopt
✓✓ -- -- ✓ ✓ ✓ ✓ × × ✓✓ ✓✓ × --
Willingness to have other to
use
× -- -- × × × × -- × × × × --
Changed mobility
✓✓ ✓ ✓ ✓ ✓ ✓ ✓ × × ✓✓✓ ✓✓ × --
Mobility and Adequacy
✓ -- -- ✓ ✓ ✓ ✓ × × ✓ ✓ × --
Accessibility ✓ -- -- ✓ ✓ ✓ ✓ × × ✓ ✓ × --
Affordability ✓ -- -- × × × × × × ✓ ✓ × --
Social Inclusion ✓ -- -- ✓ ✓ ✓ ✓ ✓ × × × × ✓
Human dignity ✓ ✓ ✓ ✓ ✓ ✓ ✓ × × -- -- -- ✓
Ethics ✓ ✓ ✓ ✓ ✓ ✓ × × × -- -- -- ✓
Mobility and transport network
-- -- -- -- -- -- -- -- -- ✓✓ ✓✓ ✓ ✓✓
Safety and security at
societal level
✓✓ ✓✓ ✓ ✓ ✓ ✓ ✓ -- × ✓✓ ✓✓ × ✓✓
Socio-economic impacts
✓ ✓ ✓ ✓ ✓ × × ✓ × ✓ ✓ × ✓✓
Quality of life ✓✓ ✓✓ ✓ ✓✓ ✓✓ ✓ ✓ ✓ × ✓ ✓ × ✓✓
Public acceptance
✓ ✓ ✓ ✓ ✓ × ✓✓ ✓✓ × ✓✓ ✓✓ ✓ ✓✓
Public awareness
× × × ✓ ✓ -- × ✓ × × × × ✓✓

D7.1 – Impact areas and paths Page 77
✓✓✓: widely investigated;
✓✓: partly investigated;
✓: seldom investigated; ×: not investigated; -- not related. Probably as a result of the present CAV research dominated by simulation and piloting with a focus on the “human-machine” interfaces and relatively low market penetration of CAV, the higher layers of convenience and self-actualisation, as well as the vulnerable group and higher societal impact areas are still little researched. Based on the above specification of levels of research in relation to the different impact areas there seems also to be a clear deficiency of research of CAV and rural areas. Finally, the table shows also that there are strong interconnections between the different impact levels and areas. In the following paragraphs the most relevant gaps are described in more detail.
6.2 Gaps and need for further research
6.2.1 Safety and security Room for improvement exists in this impact area, particularly regarding clearer definitions of safety concerns. While commonly, system and equipment failure and reliability as well as accident occurrence are used as part of the items used, it could be helpful to ask potential users about more specific scenarios that they perceive as most risky. Further studies from the perspective of non-users would also be welcome, as the focus is often on the more objective analysis of communication improvement between CAVs and pedestrians/bicyclists, and not necessarily investigating the perceived risks in the interaction. A major gap can be identified in the literature surrounding risk perceptions around security. This is not often investigated, and it seems like the overlap between objective existing risks and subjectively perceived risks should be better analysed.
D7.1 – Impact areas and paths Page 78
Finally, safety concerns of groups that are at heightened risk of assault could be further studied, in particular women and members of the LGBTQ community as well as other minority groups.
6.2.2 Functional design, comfort and ergonomics Especially at the ease of use levels, the distinction between the different levels of autonomy becomes of greater importance; while most literature in the behavioural sciences deals with Level 5 or advanced Level 4 autonomy, in terms of ease of use, major differences exist: Level 5 should arguably - due to its complete removal of human intervention – always receive highest ease of use scores; Level 3 and 4 on the other hand – due to loss of control but need for human intervention - might feel less functionally convenient and reliable than even vehicles that have no self-driving functionality. This should be further investigated. One could also consider how the design of the entire CAV mobility infrastructure (as opposed to simply the CAV itself or the software system inside the CAV) plays a role in perceived ease of use. This could include the mobile applications used to summon a CAV, the infrastructure in existence providing a smooth transition from start to destination, and the ability to enter and exit the vehicle. Not much research has focused on these ideas.
6.2.3 Convenience and self-actualisation Similarly to the issues facing the measurement of ease of use, the distinction between the different levels of autonomy becomes of great importance for perceived usefulness; again, most literature in the behavioural sciences deals with Level 5 or advanced Level 4 autonomy; however, usefulness of CAVs certainly increases with its autonomy level, and measures on lower levels of autonomy might show very different results. This should be kept in mind and further investigated. It would also be important to look at convenience with regards to the summoning, entering/exiting and changing of vehicles - if this is not provided in an accessible and time efficient manner, users might not find it more convenient than current mobility options such as owned cars or public transport, and not use it, and not be willing to pay for it.
D7.1 – Impact areas and paths Page 79
6.2.4 CAVs and vulnerable groups research gaps Most research related to vulnerable groups investigate the topics of safety, accessibility and social inclusion. Significant literature can also be found in improved accessibility for elderly and disabled people (Hawes, 2019; Alonso et al. 2018). However, few studies about the other impacts of CAVs on these vulnerable groups in different aspects are available to review. The interests and mobility need of the vulnerable groups such as elderly, impaired users, and children, etc. are directly related to CAVs. Little work is however available on adequacy, affordability and wider topic of human dignity. While impacts on accessibility in more general terms have been widely studied, the effect on CAVs on affordability of various mobility services for different sections of the society also need to be studied in more detail. Most studies relate rather to “wiliness to pay” than the topic of affordability. In relation to the business models it should be looked at more generally how CAV could make transportation more affordable for the vulnerable groups, specifically for the low income groups. This lack of research may be explained by the fact that CAVs are still mostly in the conceptual development phase and pilot projects are limited. The possibilities for the broader idea of social inclusion are well researched. There are also many investigations and surveys that focus on the effect of CAVs on quality of travel of young people, older people and people with disability. It is often mentioned. The rapid development of CAVs can have a significant potential to improve the mobility of partially sighted/blind people, contributing to a better quality of life for them. nevertheless, even if the situation of the partially sighted/blind people are often mentioned yet in actual research on potential improvement only scarcely considered in the surveys. Based on the literature review, most studies are focussed on adults, however, children can also be significantly affected by CAVs. Middle school students who can still not legally own a driving license but are to travel without any interactions with adults and want to be free of the inconveniences of public transport can benefit from CAVs. Very little literature and research was actually found on a possible rural-urban divide. Many people living in urban and suburban areas, which have developed transport systems. The introduction of CAVs can have significant impacts on people living or working there. In addition, the infrastructures of these areas will be well established to meet the requirements of CAVs, such as road sensors, road cameras etc. For
D7.1 – Impact areas and paths Page 80
people living in the countryside or rural areas, where transit networks are poorly covered (e.g. railroads and buses), CAVs could provide an alternative mobility mode to travel, with less cost and more conveniences.
6.2.5 CAVs and societal impact research gaps CAVs have a significant potential in improving the mobility, safety and quality of life of people. While the literature review shows that CAVs can further develop transport networks, avoid crashes and allow for wider social mobility and gain to education and employment, there are also concerns on increased congestion due to reduced use of public transport, cyber security issues and reduced social interaction with older people due to independent travel methods. At the wider societal level research in several parts of the impact areas, such as, safety and security and wider societal topics like quality of life are limited to date. In turn, they can also have a great influence on the development of the CAVs. 6.2.5.1 Safety and security at the societal level With the penetration of CAVs, CAVs can also be available for rural areas, where the public transport network is not well developed. Thus, people in these areas can significantly benefit from CAVs. However, safety and security impacts are seldom examined by previous studies, and if so mainly focussing on highways. In the rural areas yet also urban area the infrastructure is not well developed, which can have significant potential of safety issues in the process of developments of CAVs. 6.2.5.2 Socio-economic impacts While the literature review has examined the impact of CAVs on socio-economic aspects, these have especially been focussed on loss of existing jobs and creation of new job opportunities. Several studies conducted in the US focus mainly on job losses of truck and taxi drivers (Zmud and Reed, 2018). However, the literature does not provide a detailed analysis of the impact of CAVs on the interaction with other conventional vehicles and modes of transport, its implication for businesses. The impact of CAV on these and any specific benefits or losses caused to this need to be further analysed.

D7.1 – Impact areas and paths Page 81
6.2.5.3 Public Awareness Several enquiries have been undertaken to understand the public acceptance and awareness at large. Some of those studies have also examined the impact of public awareness of CAVs on elderly, young and disabled and the impact on their travel, yet the depth remains quite limited. A more detailed study that examines awareness and acceptance among all societal groups, including the vulnerable ones is required to examine the awareness of CAVs and its role in urban and rural mobility. 6.2.5.4 Public acceptance The public acceptance of CAVs is largely dependent on the perception of impacts of this technology on mobility, safety, economy and quality of life. Non-vehicle users such as pedestrians and cyclists can have some divergence with CAVs users since the non-vehicle users may take CAVs as threat to their safety. Also, they can be the potential customers of CAVs if the experiences of CAVs are better than their current transport modes. Meantime, in the development of the CAVs, non-vehicle users will be involved in the decision-making in policy and markets. So, more investigations should be done about the acceptance of the CAV technology in non-vehicle users. The literature review shows that there is considerable awareness of the CAV technology, especially in the developed countries. However, wider studies need to be conducted to examine the awareness, acceptance and following socio-economic impacts of this technology across different countries and social strata.
6.3 Impact paths Even if some modelling exercise took place in earlier projects (e.g. CARTRE, ARCADE and AUTOPILOT) and other research, CAVs have often two sides for each impact area. For example, CAVs can effectively decrease driving error to improve safety, however, CAVs can also make it possible to be controlled by hackers, which will be a risk to the safety. In addition, pedestrians, cyclists, other drivers and roadworkers are also among the main road users that will interact with CAVs. So, the interaction

D7.1 – Impact areas and paths Page 82
between CAVs users and other road users will only increase. In task 7.2 a set of indicators and KPI’s will be defined for each impact areas. They will also form the basic KPI’s for each step in the PAsCAL implementation. Within the PAsCAL project a step-by-step approach will be followed to improve the understanding of each impact at the user, vulnerable group and societal level and how they interrelated.
Figure 6.1 PAsCAL implementation approach
The following paragraphs shortly describes the different impact paths and how the PAsCAL project will contribute with its research.
6.3.1 From human factors in CAV to individual perceptions and attitudes
CAV research will still have to deal with many of these so called human factors even at the intermediate levels of automation (e.g. levels 2, 3). The presence of a driver or conductor will be needed to take control. In some simulations and pilots within PAsCAL (e.g. the flight simulator and the public transport pilot) higher levels of automation (i.e. levels 4 and 5) will be simulated. PAsCAL simulations and pilots will measure from a technical point of view the human factors in any “'human-machine interface”. This includes topics such as driver re-engagement issues in partially or highly automated CAVs and needed in-car driving skills. PAsCAL will specifically contribute to the understanding of experiences which includes items like perceived risk and ease of use as a result of CAV’s design. This will be in line with our user centric approach focus on perceptions and attitudes. This will specifically contribute to and improved understanding of the following impact path between the user centred features of CAV, perceptions and attitudes (figure 6.2 and chapter 1 for details).

D7.1 – Impact areas and paths Page 83
Figure 6.2 PAsCAL impact path from human factors to individual
perceptions and attitudes
6.3.2 From individual impacts to societal and vulnerable group impact areas
PAsCAL will likewise address known and novel barriers for current non-drivers and vulnerable groups (e.g. the elderly, blind and partially-sighted people) by using discrete choice experiments (WP3), simulations (WP4), validated in real-world pilots (WP6). It will therewith be made sure that the results will be specific to the different groups, including the vulnerable groups and spatial impact areas (figure 6.37 and Chapter 2 for details).
Figure 6.3 PAsCAL impact path from individual to vulnerable group
impact areas
The surveys, simulator studies, pilots and the large data sets available will span a wide range of valuable data sets and likewise will provide insights in wider public acceptance, behaviour and societal related phenomena (figure 6.4 and Chapter 2 for details).

D7.1 – Impact areas and paths Page 84
Figure 6.4 PAsCAL impact path from individual to societal impact areas
6.3.3 The influence of psychological and physical abilities on individual perceptions and attitudes
Individual perceptions and in a second step attitudes and behavioural intentions are not only influenced by vicarious experience and wider public awareness, yet also by the psychological and physical abilities and skills. PAsCAL will specifically research this linkages yet also investigate how new "driver" training and education solutions could improve the user’s skills both for new and experienced drivers (WP5). The data analysis will allow again in combination with the outcomes of the initial experimentation phase (WP3) reveal its influence on perceptions (figure 6.5 and Chapter 2 for details).
Figure 6.5 PAsCAL impact path of interrelation between individual
perceptions, attitudes, ability and skills
6.3.4 Integrating market take-up scenarios and business models in CAV development
The technology is almost ready at least for the simpler use cases but there are many other barriers, especially regulation and social acceptance. Basically, industry foresee two types of market penetration scenarios.

D7.1 – Impact areas and paths Page 85
Each of them will have a different impact on the individual, vulnerable groups and wider society. The first scenario foresees a replacement of the present private vehicle fleet. It is expected that most likely this will worsen the present mobility situation caused by the fact that a large proportion of the population who cannot currently drive (e.g. elderly people, young persons, disabled) might want to start owning and using a CAV (Cavoli, 2017). There will be a modal share transfer from public transport to private vehicles. It might also lead to urban sprawl. When there are no driver functionalities to be executed, the time spent could become value time for working and other activities. The other modal foresees a replacement of the present private vehicles with a “shared” fleet. Shared CAVs integrated into the public transport system could further optimise and provide a better match to the mobility needs. The most important thing to keep in mind is that there will likely be a long transition for both market take-up and business models for two main reasons:
• There will be a variety of connectivity and automation degrees (Figure 6.6);
• CAVs will coexist with traditional vehicles for many years.
Figure 6.6 : SAE Automation Levels (Source : Society of Automotive
Engineers)
Solely investigating the individual perceptions and attitudes in relation to the different CAV features will not allow to understand fully the impact levels of both vulnerable groups and society. PAsCAL will therefore cross-
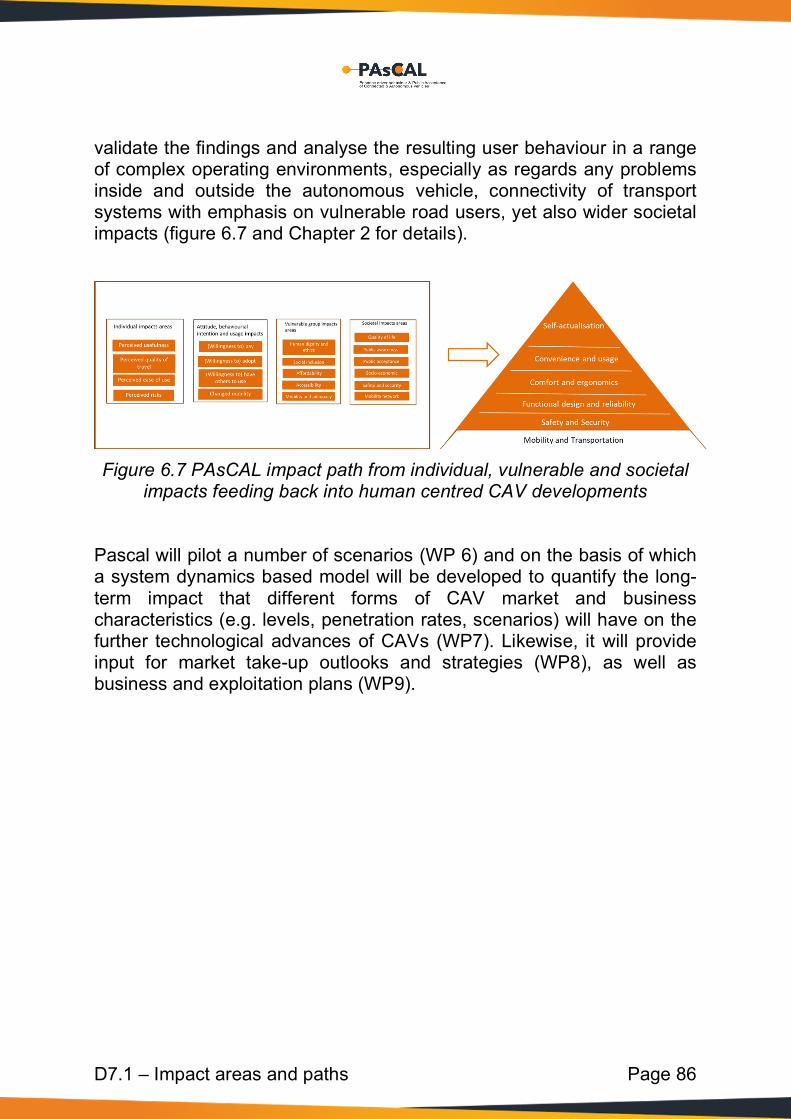
D7.1 – Impact areas and paths Page 86
validate the findings and analyse the resulting user behaviour in a range of complex operating environments, especially as regards any problems inside and outside the autonomous vehicle, connectivity of transport systems with emphasis on vulnerable road users, yet also wider societal impacts (figure 6.7 and Chapter 2 for details).
Figure 6.7 PAsCAL impact path from individual, vulnerable and societal
impacts feeding back into human centred CAV developments
Pascal will pilot a number of scenarios (WP 6) and on the basis of which a system dynamics based model will be developed to quantify the long-term impact that different forms of CAV market and business characteristics (e.g. levels, penetration rates, scenarios) will have on the further technological advances of CAVs (WP7). Likewise, it will provide input for market take-up outlooks and strategies (WP8), as well as business and exploitation plans (WP9).
D7.1 – Impact areas and paths Page 87
7 Conclusions The present framework of impact areas and paths provides the foundation of the PAsCAL evaluation framework that will be used for assessing the human and societal impacts of connected and automated vehicle developments and definition of the KPI’s. It will help to harmonise the individual evaluations of the different surveys, experiments, simulators and pilots. There are high expectations and claims for the contribution of CAV to societal goals, including benefits for vulnerable groups. The present framework will allow to maximize the PAsCAL project outcomes in this matter yet also provide new insights. The potential impacts of CAV are multiple and highly interlinked to the take-up scenarios chosen. The present framework will allow to steer CAV development into the interest of the individual user and society as a whole. In that respect it will policy makers in their decision making and taking for improved CAV policies and scenario-based planning. The present version of the framework is probably the very first impact areas definition from the user and societal point of view. The impact areas and paths were defined for the purposes of the PAsCAL project yet will allow other researchers to use them as well in their research on perceptions, attitudes and societal impacts. Therefore, during the course of the project feedback will be collected and later updates will be made to ensure the acceptance and use of the framework in other CAV research.

8 References
8.1 Bibliography/reference list Alonso Raposo, M., Ciuffo, B., Makridis, M. and Thiel, C. (2017). ‘The r-evolution of driving: from Connected Vehicles to Coordinated Automated Road Transport (C-ART)’, Part I: Framework for a safe & efficient Coordinated Automated Road Transport (C-ART) system, EUR 28575 EN, doi:10.2760/22567. Alonso Raposo, M., Grosso M., Despres J., Fernandez M.E., Galassi C., Krasenbrink A., Krause J., Levati L., Mourtzouchou A., Saveyn B., Thiel C. and Ciuffo B. (2018). ‘An analysis of possible socio-economic effects of a Cooperative, Connected and Automated Mobility (CCAM) in Europe – Effects of automated driving on the economy, employment and skills’, EUR 29226 EN, Publications Office of the European Union, Luxembourg, 2018, ISBN 978-92-79-85857-4, doi:10.2760/777, JRC111477. Alsnih, R., Hensher, D.A.J.T.R.P.A.P., Practice (2003). ‘The mobility and accessibility expectations of seniors in an aging population’, 37, 903-916 Amin, S., Mahasan, S. (2014). Relationship Between Consumers Perceived Risks and Consumer Trust: A Study of Sainsbury Store. Middle-East Journal of Scientific Research 19 (5): 647-655.
Anderson, J., Kalra, N., Stanley, K., Sorensen, P., Samaras, C., & Oluwatola, O. (2016). Autonomous Vehicle Technology: A Guide for Policymakers. doi: 10.7249/RR443-2 Atkins (2016), 'Research on the Impacts of Connected and Autonomous Vehicles (CAVs) on Traffic Flow ', Review of. Summary Report. Aufrère, R., Gowdy, J., Mertz, C., Thorpe, C., Wang, C., Yata, T. (2003) Perception for collision avoidance and autonomous driving, Mechatronics, vol. 13, no. 10 SPEC., pp. 1149–1161. Ayaz, H., Shewokis, P. A., Bunce, S., Izzetoglu, K., Willems, B., & Onaral, B. (2012). Optical brain monitoring for operator training and mental workload assessment. NeuroImage, 59(1), 36–47. https://doi.org/10.1016/J.NEUROIMAGE.2011.06.023
D7.1 – Impact areas and paths Page 89
Bagloee, S.A., Tavana, M., Asadi, M. et al. (2016). Autonomous vehicles: challenges, opportunities, and future implications for transportation policies Journal of Modern Transportation 24: 284. https://doi.org/10.1007/s40534-016-0117-3 Bansal, P., Kockelman K.M., Singh (2016). Assessing public opinions of and interest in new vehicle technologies: An Austin perspective, Transportation Research Part C 67 (2016) 1–14 Bansal, P., Kockelman K.M. (2017). 'Forecasting Americans’ long-term adoption of connected and autonomous vehicle technologies', Transportation Research Part A: Policy and Practice 95:49-63. Barker, J. (2006). ‘Are we there yet? Exploring Aspects of Automobility in Children's Lives’. Brunel University. Becker, F. and Axhausen K.W. (2017). 'Literature review on surveys investigating the acceptance of automated vehicles', Transportation 44 (6):1293-306. Berg, J., Levin, L., Abramsson, M., Hagberg, J. (2015). '"I want complete freedom”: car use and everyday mobility among the newly retired', European Transport Research Review 7:31
Bergmann, L. T., Schlicht, L., Meixner, C., König, P., Pipa, G., Boshammer, S., & Stephan, A. (2018). Autonomous Vehicles Require Socio-Political Acceptance—An Empirical and Philosophical Perspective on the Problem of Moral Decision Making. Frontiers in Behavioral Neuroscience, 12. doi: 10.3389/fnbeh.2018.00031 Bissell D., Birtchnell T., Elliott A. and Hsu E.L. (2018). ‘Autonomous automobilities: The social impacts of driverless vehicles’, Current Sociology: 1-19.
Brand, C., & Boardman, B. (2008). Taming of the few—The unequal distribution of greenhouse gas emissions from personal travel in the UK. Energy Policy, 36(1), 224–238. doi: 10.1016/j.enpol.2007.08.016
Brand, C., & Preston, J. M. (2010). ‘60-20 emission’—The unequal distribution of greenhouse gas emissions from personal, non-business travel in the UK. Transport Policy, 17(1), 9–19. doi: 10.1016/j.tranpol.2009.09.001

D7.1 – Impact areas and paths Page 90
Breidert, C. Hahsler, M., Reutterer, T. (2006). Review of methods for measuring willingness-to-pay, Preprint to appear in Innovative Marketing.
Brinkley, J., Daily, S., & Gilbert, J. (2018). A survey of visually impaired consumers about self-driving vehicles. Journal on Technology and Persons with Disabilities, 6, 274–283. Brown, B., Drew M., Erenguc C., Hasegawa M., Hill R., Schmith S., and Ganula B. (2014). 'Global Automotive Consumer Study: The Changing Nature of Mobility—Exploring Consumer Preferences in Key Markets around the World', Technical Report, Deloitte. Retrieved from: https://www2. deloitte.com.
Bruderer Enzler, H. (2017). Air travel for private purposes. An analysis of airport access, income and environmental concern in Switzerland. Journal of Transport Geography, 61, 1–8. doi: 10.1016/j.jtrangeo.2017.03.014
Buckley, L., Kaye, S.-A., & Pradhan, A. K. (2018). Psychosocial factors associated with intended use of automated vehicles: A simulated driving study. Accident Analysis & Prevention, 115, 202–208. doi: 10.1016/j.aap.2018.03.021
Burghout, W., Rigole, P. J., & Andreasson, I. J. (2014). Impacts of shared autonomous taxis in a metropolitan area. Paper presented at the TRB annual meeting, Washington D.C Cain, B. (2007). A Review of the Mental Workload Literature. Defence Research and Development Toronto (Canada), (1998), 4-1-4–34. Retrieved from http://www.dtic.mil/cgi-bin/GetTRDoc?Location=U2&doc=GetTRDoc.pdf&AD=ADA474193
Casley, S. V., Jardim, A. S., & Quartulli, A. (2013). A study of public acceptance of autonomous cars. Bachelor Thesis, Worcester Polytechnic Institute.
Casner, S.M., Geven, R.W., Recker, M.P., and Schooler, J.W. (2014). ‘The retention of manual flying skills in the automated cockpit’, Human Factors 56, No 8, pp. 1506–1516.
Casner, S.M., Hutchins, E.L. and Norman, D. (2016). ‘The Challenges of Partially Automated Driving’, Communications of the ACM, Vol. 59, No 5.

D7.1 – Impact areas and paths Page 91
Catapult Transport Systems (2017). Market Forecast: for connected and autonomous vehicles, Catapult Transport Systems, UK. Cavoli, C. Phillips,B., Cohen, T. Jones, P. (2017). Social and behavioural questions associated with Automated Vehicles; A Literature Review CEDR Conference of European Directors of Roads (2019). Impacts of connected and automated vehicles – State of the art, Deliverable D3.1. MANTRA: Making full use of Automation for National Transport and Road Authorities – NRA Core Business.
Chater, N., Misyak, J., Watson, D., Griffiths, N., & Mouzakitis, A. (2018). Negotiating the Traffic: Can Cognitive Science Help Make Autonomous Vehicles a Reality? Trends in Cognitive Sciences, 22(2), 93–95. doi: 10.1016/j.tics.2017.11.008
Childress, S., Nichols, B., Charlton, B., & Coe, S. (2015). Using an Activity-Based Model to Explore the Potential Impacts of Automated Vehicles. Transportation Research Record, 2493(1), 99–106. doi: 10.3141/2493-11
Choi, J. K., & Ji, Y. G. (2015). Investigating the Importance of Trust on Adopting an Autonomous Vehicle. International Journal of Human–Computer Interaction, 31(10), 692–702. doi: 10.1080/10447318.2015.1070549 Christian, T.J. (2009). 'Opportunity costs surrounding exercise and dietary behaviors: Quantifying trade-offs between commuting time and health-related activities', SSRN Working Paper. Church, A., Frost, M., Sullivan, K. (2000). Transport and social exclusion in London. In Transport policy 7 (3), pp. 195–205. Clark, B.; Parkhurst, G. & Ricci, M. (2016) Understanding the socioeconomic adoption scenarios for autonomous vehicles: A literature review. University of the West of England, Bristol. Clements L.M. and Kockelman K.M. (2017). ‘Economic Effects of Automated Vehicles’, Transportation Research Record: Journal of the Transportation Research Board 2606: 106-114.
Cohen, S. A., & Gössling, S. (2015). A darker side of hypermobility. Environment and Planning A: Economy and Space, 47(8), 166–1679. doi: 10.1177/0308518X15597124

D7.1 – Impact areas and paths Page 92
Continental (2013). "German Motorists Want Automated Freeway Driving", https://www.continental.com/en/press/german-motorists-want-automated-freeway-driving-7398. Continental (2014). "Motorists Worldwide Open to Automated Driving", https://www.continental.com/en/press/motorists-worldwide-open-to-automated-driving-7460.
Costanza, R., Fisher, B., Ali, S., Beer, C., Bond, L., Boumans, R., Snapp, R. (2008). An Integrative Approach to Quality of Life Measurement, Research, and Policy. S.A.P.I.EN.S. Surveys and Perspectives Integrating Environment and Society (1.1). Retrieved from http://journals.openedition.org/sapiens/169
Cottam, B. J., (2018). Transportation Planning for Connected Autonomous Vehicles: How It All Fits Together, Transportation Research Record: Journal of the Transportation Research Board.
Cramer, H., Evers, V., Kemper, N., & Wielinga, B. (2008). Effects of Autonomy, Traffic Conditions and Driver Personality Traits on Attitudes and Trust towards In-Vehicle Agents. 2008 IEEE/WIC/ACM International Conference on Web Intelligence and Intelligent Agent Technology, 3, 477–482. doi: 10.1109/WIIAT.2008.326 C-Roads Platform Working Group – 3 (2018). Evaluation and assessment Plan, www.c-roads.eu.
Davis, F. D. (1989). Perceived Usefulness, Perceived Ease of Use, and User Acceptance of Information Technology. MIS Quarterly, 13(3), 319. doi: 10.2307/249008
Daziano, R. A., Sarrias, M., & Leard, B. (2017). Are consumers willing to pay to let cars drive for them? Analyzing response to autonomous vehicles. Transportation Research Part C: Emerging Technologies, 78, 150–164. doi: 10.1016/j.trc.2017.03.003 de Waard, D. (1996). The Measurement of Drivers ’ Mental Workload. University of Groningen, The Netherlands. https://doi.org/10.1016/j.apergo.2003.11.009
Debernard, S., Chauvin, C., Pokam, R., & Langlois, S. (2016). Designing Human-Machine Interface for Autonomous Vehicles. IFAC-PapersOnLine, 49(19), 609–614. doi: 10.1016/j.ifacol.2016.10.629

D7.1 – Impact areas and paths Page 93
Delbosc, A., & Currie, G. (2013). Causes of Youth Licensing Decline: A Synthesis of Evidence. Transport Reviews, 33(3), 271–290. doi: 10.1080/01441647.2013.801929 Denninghaus (2016). Action for Accessibility and Usability of Public and Private Transport of the Future by People with Visual Impairment and Blindness. Safe Mobility in the Future – Version 3. Department for Transport (2015). "The Pathway to Driverless Cars: Summary report and action plan", https://assets.publishing.service.gov.uk/government/uploads/system/uploads/attachment_data/file/401562/pathway-driverless-cars-summary.pdf Di Stasi, L. L., Antolí, A., Gea, M., & Cañas, J. J. (2011). A neuroergonomic approach to evaluating mental workload in hypermedia interactions. International Journal of Industrial Ergonomics, 41(3), 298–304. https://doi.org/10.1016/J.ERGON.2011.02.008
Dikmen, M., Burns, C. M. (2016). Autonomous Driving in the Real World: Experiences with Tesla Autopilot and Summon. Proceedings of the 8th International Conference on Automotive User Interfaces and Interactive Vehicular Applications, 225–228. doi: 10.1145/3003715.3005465 Directorate General for Internal Policies of the European Parliament (2015), Social Inclusion in public transport. Study. European Union.
Distler, V., Lallemand, C., & Bellet, T. (2018). Acceptability and Acceptance of Autonomous Mobility on Demand: The Impact of an Immersive Experience. Proceedings of the 2018 CHI Conference on Human Factors in Computing Systems - CHI ’18, 1–10. doi: 10.1145/3173574.3174186
Du, N., Tilbury, D., Robert, L., Yang, X. J., Pradhan, A., & others. (2018). A Cross-Cultural Study of Trust Building in Autonomous Vehicles.
Eden, G., Nanchen, B., Ramseyer, R., & Evéquoz, F. (2017). Expectation and Experience: Passenger Acceptance of Autonomous Public Transportation Vehicles. In R. Bernhaupt, G. Dalvi, A. Joshi, D. K. Balkrishan, J. O’Neill, & M. Winckler (Eds.), Human-Computer Interaction – INTERACT 2017 (pp. 360–363). doi: 10.1007/978-3-319-68059-0_30

D7.1 – Impact areas and paths Page 94
Elliott, D., Keen, W., & Miao, L. (2019). Recent advances in connected and automated vehicles. Journal of Traffic and Transportation Engineering (English Edition), 6(2), 109–131. doi: 10.1016/j.jtte.2018.09.005 European Commission (2018). On the road to automated mobility: An EU strategy for mobility of the future. Communication from the Commission to the European Parliament, the council, the European Economic and Social committee, the Committee of the Regions. European Commission (2019) (a). The future of road transport: Implications of automated, connected, low-carbon and shared mobility. Publications Office of the European Union. European Commission (2019) (b). Independent High-level expert group on artificial Intelligence: Policy and investment recommendations for trustworthy AI.
Fagnant, D. J., & Kockelman, K. M. (2014). The travel and environmental implications of shared autonomous vehicles, using agent-based model scenarios. Transportation Research Part C: Emerging Technologies, 40, 1–13. doi: 10.1016/j.trc.2013.12.001 Flourish Project (2019). Standardised assessment framework (SAF). Deliverable WP3. D7
Fraedrich, E., & Lenz, B. (2013). Automated driving—Individual and societal aspects. Paper from the TRB 93rd Annual Meeting. Fraedrich, E., and Lenz, B. (2016). "Societal and individual acceptance of autonomous driving." In Autonomous Driving, 621-40. Springer. Fürst, S., Bechter, M. (2016). AUTOSAR for Connected and Autonomous Vehicles: The AUTOSAR Adaptive Platform. 2016 46th Annual IEEE/IFIP International Conference on Dependable Systems and Networks Workshop (DSN-W), pp. 215-217. Gabriel, Z., Bowling, A.J.A., Society (2004). Quality of life from the perspectives of older people. 24, 675-691. Gehrke, S., Felix, A., Reardon, T.J.M.A.P.C. (2018). Fare choices: A survey of ride-hailing passengers in metro Boston.
Glancy, D. J. (2012). Privacy in Autonomous Vehicles Symposium Article. Santa Clara Law Review, 52(4), 1171–1240. Retrieved from https://heinonline.org/HOL/P?h=hein.journals/saclr52&i=1227

D7.1 – Impact areas and paths Page 95
Goodall, Noah J. (2014). "Machine ethics and automated vehicles." In Road vehicle automation, 93-102. Springer. Gopher, D., & Donchin, E. (1986). Workload: An examination of the concept. In Handbook of perception and human performance, Vol. 2: Cognitive processes and performance. (pp. 1–49). Oxford, England: John Wiley & Sons.
Gössling, S., Cohen, S., Higham, J., Peeters, P., & Eijgelaar, E. (2018). Desirable transport futures. Transportation Research Part D: Transport and Environment, 61, 301–309. doi: 10.1016/j.trd.2018.01.008
Graham, G. (2014, December 8). Parents will wave off children to school in driverless cars, says minister. Retrieved from https://www.telegraph.co.uk/news/uknews/road-and-rail-transport/11281220/Parents-will-wave-off-children-to-school-in-driverless-cars-says-minister.html
Greenblatt, J. B., & Shaheen, S. (2015). Automated Vehicles, On-Demand Mobility, and Environmental Impacts. Current Sustainable/Renewable Energy Reports, 2(3), 74–81. doi: 10.1007/s40518-015-0038-5
Gruel, W., & Stanford, J. M. (2016). Assessing the Long-term Effects of Autonomous Vehicles: A Speculative Approach. Transportation Research Procedia, 13, 18–29. doi: 10.1016/j.trpro.2016.05.003
Haas, R. E., Möller, D. P. F., (2017). Automotive connectivity, cyber-attack scenarios and automotive cyber security Published in IEEE International Conference 2017, DOI:10.1109/eit.2017.8053441
Haboucha, C. J., Ishaq, R., & Shiftan, Y. (2017). User preferences regarding autonomous vehicles. Transportation Research Part C: Emerging Technologies, 78, 37–49. doi: 10.1016/j.trc.2017.01.010 Haindl, G., Risser, R. (2007). Life Quality of Senior Citizens in Relation to Mobility Conditions (SIZE). A Study in 8 European Countries (January 2003–April 2006). 11th International Conference on Mobility and Transport for Elderly and Disabled Persons (TRANSED) Transport CanadaTransportation Research Board.
Harper, C. D., Hendrickson, C. T., Mangones, S., & Samaras, C. (2016). Estimating potential increases in travel with autonomous vehicles for the non-driving, elderly and people with travel-restrictive medical conditions.

D7.1 – Impact areas and paths Page 96
Transportation Research Part C: Emerging Technologies, 72, 1–9. doi: 10.1016/j.trc.2016.09.003 Hart, S. G., & Staveland, L. E. (1988). Development of NASA-TLX (Task Load Index): Results of empirical and theoretical research. Human Mental Workload, 1, 139–183. https://doi.org/10.1016/s0166-4115(08)62386-9
Hartwich, F., Witzlack, C., Beggiato, M., & Krems, J. F. (2018). The first impression counts – A combined driving simulator and test track study on the development of trust and acceptance of highly automated driving. Transportation Research Part F: Traffic Psychology and Behaviour. doi: 10.1016/j.trf.2018.05.012 Hawes M. (2018), ‘Connected and Autonomous Vehicles: Revolutionising Mobility in Society’, SMMT Report Hawes M. (2019). ‘Connected and Autonomous Vehicles: Winning the Global Race to Market’, SMMT Report, Frost and Sullivan
Hewitt, C., Politis, I., Amanatidis, T., & Sarkar, A. (2019). Assessing public perception of self-driving cars: The autonomous vehicle acceptance model. Proceedings of the 24th International Conference on Intelligent User Interfaces - IUI ’19, 518–527. doi: 10.1145/3301275.3302268
Hoff, K.A.,Bashir, M. (2014), ‘Trust in automation: Integrating empirical evidence on factors that influence trust’, Human Factors 57, No 3, pp. 407–434.
Hohenberger, C., Spörrle, M., & Welpe, I. M. (2017). Not fearless, but self-enhanced: The effects of anxiety on the willingness to use autonomous cars depend on individual levels of self-enhancement. Technological Forecasting and Social Change, 116, 40–52. doi: 10.1016/j.techfore.2016.11.011 Holley-Moore, G., Creighton, H.J.L., UK: International Longevity Centre-UK (2015). The future of transport in an ageing society.
Howard, D., Dai, D. (2014). Public perceptions of self-driving cars: The case of Berkeley, California. Transportation Research Board 93rd Annual Meeting, 14, 1–16.
Hulse, L. M., Xie, H., & Galea, E. R. (2018). Perceptions of autonomous vehicles: Relationships with road users, risk, gender and age. Safety Science, 102, 1–13. doi: 10.1016/j.ssci.2017.10.001
D7.1 – Impact areas and paths Page 97
Humanising Autonomy. (2017). Child-Friendly Autonomous Vehicles. Retrieved November 7, 2019, from Medium website: https://medium.com/@HumanisingAutonomy/child-friendly-autonomous-vehicles-2880ca74165f Hussain R., Lee J.Y., Zeadally S. (2018). ‘Autonomous Cars: Social and Economic Implications’, IT Professional, IEEE Computer Society 1520-9202: 70-77 Innamaa, S., Kuisma, S. (2018). Key performance indicators for assessing the impacts of automation in road transportation; Results of the Trilateral key performance indicator survey. Research Report : VTT-R- 01054-18 Innamaa, S., Smith, S., Barnard Y., Rainville, L., Rakoff, H., Horiguchi, R., Gellerman, H. (2018). Trilateral Impact Assessment Framework for Automation in Road Transportation. Trilateral Impact Assessment Sub-Group for ART V2.0 CARTRE Ipsos, MORI (2014). "Ipsos MORI Loyalty Automotive Survey." In.: Technical Report. 26. ISO 15535:2012 General requirements for establishing anthropometric databases. (2012). ISO 7250-1:2017 Basic human body measurements for technological design — Part 1: Body measurement definitions and landmarks. (2017).
Kaur, K., & Rampersad, G. (2018). Trust in driverless cars: Investigating key factors influencing the adoption of driverless cars. Journal of Engineering and Technology Management, 48, 87–96. doi: 10.1016/j.jengtecman.2018.04.006
Kirk, B., & Eng, P. (2011). Connected vehicles: An executive overview of the status and trends. Globis Consulting, November, 21.
Körber, M., Baseler, E., & Bengler, K. (2018). Introduction matters: Manipulating trust in automation and reliance in automated driving. Applied Ergonomics, 66, 18–31. doi: 10.1016/j.apergo.2017.07.006 KPMG (2013). "Self-driving cars: Are we ready?", https://www.kpmg.com/US/en/IssuesAndInsights/ArticlesPublications/Documents/self-drivingcars-are-we-ready.pdf

D7.1 – Impact areas and paths Page 98
KPMG (2019). Assessing countries’ 2019 Autonomous Vehicles Readiness Index: Assessing countries’ preparedness for autonomous vehicles Krueger, R., Rashidi, T.H., Rose., J.M. (2016). "Preferences for shared autonomous vehicles." Review of. Transportation Research Part C: Emerging Technologies 69:343-55.
Kyriakidis, M., Happee, R., & de Winter, J. C. F. (2015). Public opinion on automated driving: Results of an international questionnaire among 5000 respondents. Transportation Research Part F: Traffic Psychology and Behaviour, 32, 127–140. doi: 10.1016/j.trf.2015.04.014 L3Pilot project (2018). From Research Questions to Logging Requirements, Deliverable D3.1Version: 1.0 Final draft, ART-02-2016 – Automation pilots for passenger cars, H2020 Contract number 723051 Ladabaum, U., Mannalithara, A., Myer, P.A., Singh, G.J.T.A.j.o.m. (2014). Obesity, abdominal obesity, physical activity, and caloric intake in US adults: 1988 to 2010. 127, 717-727. e712.
Lavieri, P. S., Garikapati, V. M., Bhat, C. R., Pendyala, R. M., Astroza, S., Dias, F. F. (2017). Modeling Individual Preferences for Ownership and Sharing of Autonomous Vehicle Technologies. Transportation Research Record: Journal of the Transportation Research Board, 2665(1), 1–10. doi: 10.3141/2665-01
Le Vine, S., Zolfaghari, A., & Polak, J. (2015). Autonomous cars: The tension between occupant experience and intersection capacity. Transportation Research Part C: Emerging Technologies, 52, 1–14. doi: 10.1016/j.trc.2015.01.002
Lee, C., & Coughlin, J. F. (2015). PERSPECTIVE: Older Adults’ Adoption of Technology: An Integrated Approach to Identifying Determinants and Barriers. Journal of Product Innovation Management, 32(5), 747–759. doi: 10.1111/jpim.12176
Lee, J.-G., Kim, K. J., Lee, S., & Shin, D.-H. (2015). Can Autonomous Vehicles Be Safe and Trustworthy? Effects of Appearance and Autonomy of Unmanned Driving Systems. International Journal of Human–Computer Interaction, 31(10), 682–691. doi: 10.1080/10447318.2015.1070547
D7.1 – Impact areas and paths Page 99
Leech, J., Whelan, G., Bhaiji, M., Hawes, M., Scharring, K. (2015), Connected and Autonomous Vehicles - The UK Economic Opportunity, KPMG and SMMT driving the motor industry. Levinson, D. (2015). "Climbing mount next: the effects of autonomous vehicles on society." Review of. Minn. JL Sci. & Tech. 16:787. Lin, P, Wang. Z. (2013). "Impact of automated vehicles on highway safety and operations." Review of. White paper for Tampa Hillsborough Expressway Authority. Lin, P., Beaubien, R., Lower, R.l., Voorhies., K.O. (2013). 'Connected vehicles and autonomous vehicles: where do ITE members stand?' Institute of Transportation Engineers. ITE Journal 83 (12):31. Lin, P., Wang, Z., Guo. R. (2016). "Impact of connected vehicles and autonomous vehicles on future transportation." Review of. Bridging the East and West:46-53.
Litman, T. (2019a). Developing Indicators for Sustainable and Livable Transport Planning. 110.
Litman, T. (2019b). The Future Isn’t What It Used to Be. 46. Litman, Todd (2017). Transportation affordability. Evaluation and Improvement Strategies. Victoria Transport Policy Institute. Lu, Q., Tettamanti, T., Hörcher, D., Varga, I. (2019). "The impact of autonomous vehicles on urban traffic network capacity: an experimental analysis by microscopic traffic simulation." Review of. Transportation Letters:1-10.
Lu, Z., Happee, R., Cabrall, C. D. D., Kyriakidis, M., & de Winter, J. C. F. (2016). Human factors of transitions in automated driving: A general framework and literature survey. Transportation Research Part F: Traffic Psychology and Behaviour, 43, 183–198. doi: 10.1016/j.trf.2016.10.007 Lucas, K. (2012). Transport and social exclusion: Where are we now?, Transport Policy Lucas, K., Verlinghieri, E., Mattioli, G., Guzman, A. (2016). Transport poverty and its adverse social consequences. ICE Publishing Lucke, D. (1995). "Akzeptanz." Review of. Legitimität in der" Abstimmungsgesellschaft". Opladen: Leske+ Budrich.
D7.1 – Impact areas and paths Page 100
Maddox, J. (2012). Improving driving safety through automation,congressional robotics caucus, National Highway Traffic Safety Administration
Madigan, R., Louw, T., Wilbrink, M., Schieben, A., & Merat, N. (2017). What influences the decision to use automated public transport? Using UTAUT to understand public acceptance of automated road transport systems. Transportation Research Part F: Traffic Psychology and Behaviour, 50, 55–64. doi: 10.1016/j.trf.2017.07.007
Marshall, A. (2017). Who’s Ready to Put Their Kid on a Self-Driving School Bus? Wired. Retrieved from https://www.wired.com/story/self-driving-school-bus/
Martin, G. (2018). An Ecosocial Frame for Autonomous Vehicles. Capitalism Nature Socialism, 1–16. doi: 10.1080/10455752.2018.1510531
Maurer, M., Gerdes, J. C., Lenz, B., Winner, H., & others. (2016). Autonomous driving (Vol. 10).
Menon, N., Barbour, N., Zhang, Y., Pinjari, A. R., & Mannering, F. (2019). Shared autonomous vehicles and their potential impacts on household vehicle ownership: An exploratory empirical assessment. International Journal of Sustainable Transportation, 13(2), 111–122. doi: 10.1080/15568318.2018.1443178
Millard-Ball, A. (2018). Pedestrians, Autonomous Vehicles, and Cities. Journal of Planning Education and Research, 38(1), 6–12. doi: 10.1177/0739456X16675674 Millonig, A.J.G. (2019). Connected and automated vehicles: chances for elderly travellers. 1-8. Minelli, S., Pedram I., and Saiedeh R. (2015). "Evaluation of connected vehicle impact on mobility and mode choice." Journal of traffic and transportation engineering (English edition) 2.5: 301-312.
Moták, L., Neuville, E., Chambres, P., Marmoiton, F., Monéger, F., Coutarel, F., & Izaute, M. (2017). Antecedent variables of intentions to use an autonomous shuttle: Moving beyond TAM and TPB? Revue Européenne de Psychologie Appliquée/European Review of Applied Psychology, 67(5), 269–278. doi: 10.1016/j.erap.2017.06.001
D7.1 – Impact areas and paths Page 101
MUIR, B. M. (1994). Trust in automation: Part I. Theoretical issues in the study of trust and human intervention in automated systems. Ergonomics, 37(11), 1905–1922. doi: 10.1080/00140139408964957 NF EN 894-3+A1 Novembre 2008 X35-101-3 Sécurité des machines - Exigences ergonomiques pour la conception des dispositifs de signalisation et des organes de service - Partie 3 : organes de service. (2008). Nordbakke, S., Schwanen, T.J.T. (2015). Transport, unmet activity needs and wellbeing in later life: exploring the links. 42, 1129-1151.
Nordhoff, S., de Winter, J., Kyriakidis, M., van Arem, B., & Happee, R. (2018). Acceptance of Driverless Vehicles: Results from a Large Cross-National Questionnaire Study. Journal of Advanced Transportation, 2018, 1–22. doi: 10.1155/2018/5382192
Nordhoff, S., de Winter, J., Madigan, R., Merat, N., van Arem, B., & Happee, R. (2018). User acceptance of automated shuttles in Berlin-Schöneberg: A questionnaire study. Transportation Research Part F: Traffic Psychology and Behaviour, 58, 843–854. doi: 10.1016/j.trf.2018.06.024
Nordhoff, S., van Arem, B., & Happee, R. (2016). Conceptual model to explain, predict, and improve user acceptance of driverless podlike vehicles. Transportation Research Record, 2602(1), 60–67. Nyholm, S., Smids, J. (2018). Automated cars meet human drivers: responsible human-robot coordination and the ethics of mixed traffic O’Donnell, R.D., & Eggemeier, F.T. (1986). Workload assessment methodology. In: Boff, K.R., Kaufman, L., Thomas, J.P. (Eds.), Handbook of Perception and Human Performance. Cognitive Process and Performance, vol. II. Wiley, New York, pp. 1-9. Ohnemus, M. and Anthony P. (2016). 'Shared autonomous vehicles: Catalyst of new mobility for the last mile?' Built Environment 42(4): 589-602.
Pakusch, C., Stevens, G., & Bossauer, P. (n.d.). Shared Autonomous Vehicles: Potentials for a Sustainable Mobility and Risks of Unintended Effects. 258–245. doi: 10.29007/rg73

D7.1 – Impact areas and paths Page 102
Panagiotopoulos, I., & Dimitrakopoulos, G. (2018). An empirical investigation on consumers’ intentions towards autonomous driving. Transportation Research Part C: Emerging Technologies, 95, 773–784. doi: 10.1016/j.trc.2018.08.013 Parkinson, S., Ward, P., Wilson, K., Miller. J. (2017). "Cyber threats facing autonomous and connected vehicles: Future challenges." Review of. IEEE Transactions on Intelligent Transportation Systems 18 (11):2898-915.
Payre, W., Cestac, J., & Delhomme, P. (2014). Intention to use a fully automated car: Attitudes and a priori acceptability. Transportation Research Part F: Traffic Psychology and Behaviour, 27, 252–263. doi: 10.1016/j.trf.2014.04.009 Penmetsa, P., Adanu,E.K., Wood, D., Wang, T., Jones., S.L. (2019). "Perceptions and expectations of autonomous vehicles–A snapshot of vulnerable road user opinion." Review of. Technological Forecasting and Social Change 143:9-13. Pettigrew S., Fritschi, L., Norman, R. (2018). The Potential Implications of Autonomous Vehicles in and around the Workplace. J. Environ. Res. Public Health, 15(9), 1876; https://doi.org/10.3390/ijerph15091876
Piao, J., Mcdonald, M., Henry, A., Vaa, T., & Tveit, O. (2005, October 13). An assessment of user acceptance of intelligent speed adaptation systems. 1045–1049. doi: 10.1109/ITSC.2005.1520195 Power, J.D. (2012), "Vehicle Owners Show Willingness to Spend on Automotive Infotainment Features", Westlake Village : s.n., Technical Report. Preston, J. and Rajé, F. (2007). Accessibility, mobility and transport-related social exclusion. Journal of Transport Geography.
Rasouli, A., & Tsotsos, J. K. (2019). Autonomous Vehicles That Interact with Pedestrians: A Survey of Theory and Practice. IEEE Transactions on Intelligent Transportation Systems, 1–19. doi: 10.1109/TITS.2019.2901817
Rödel, C., Stadler, S., Meschtscherjakov, A., & Tscheligi, M. (2014). Towards Autonomous Cars: The Effect of Autonomy Levels on Acceptance and User Experience. Proceedings of the 6th International Conference on Automotive User Interfaces and Interactive Vehicular Applications - AutomotiveUI ’14, 1–8. doi: 10.1145/2667317.2667330

D7.1 – Impact areas and paths Page 103
Roncoli, C., Papageorgiou, M., & Papamichail, I. (2015). Traffic flow optimisation in presence of vehicle automation and communication systems – Part I: A first-order multi-lane model for motorway traffic. Transportation Research Part C: Emerging Technologies, 57, 241–259. doi: 10.1016/j.trc.2015.06.014
Rothenbücher, D., Li, J., Sirkin, D., Mok, B., & Ju, W. (2016). Ghost driver: A field study investigating the interaction between pedestrians and driverless vehicles. 2016 25th IEEE International Symposium on Robot and Human Interactive Communication (RO-MAN), 795–802. doi: 10.1109/ROMAN.2016.7745210 Ryu, K., & Myung, R. (2005). Evaluation of mental workload with a combined measure based on physiological indices during a dual task of tracking and mental arithmetic. International Journal of Industrial Ergonomics, 35(11), 991–1009. https://doi.org/10.1016/J.ERGON.2005.04.005
Saffarian, M., de Winter, J. C. F., & Happee, R. (2012). Automated Driving: Human-Factors Issues and Design Solutions. Proceedings of the Human Factors and Ergonomics Society Annual Meeting, 56(1), 2296–2300. doi: 10.1177/1071181312561483
Schäfer, A. (Ed.). (2009). Transportation in a climate-constrained world. Cambridge, Mass: MIT Press. Schoettle, B. and Sivak, M. (2014). "A survey of public opinion about autonomous and self-driving vehicles in the US, the UK, and Australia." In.: University of Michigan, Ann Arbor, Transportation Research Institute. Schoettle, B. and Sivak, M. (2015), "Motorists' preferences for different levels of vehicle automation." In.: University of Michigan, Ann Arbor, Transportation Research Institute.
Schoettle, B., & Sivak, M. (2014a). A survey of public opinion about autonomous and self-driving vehicles in the US, the UK, and Australia. 42.
Schoettle, B., & Sivak, M. (2014b). Public opinion about self-driving vehicles in China, India, Japan, the US, the UK, and Australia. 35. Schoitsch, E. (2016). "Autonomous vehicles and automated driving status, perspectives and societal impact." Review of. Information technology,
D7.1 – Impact areas and paths Page 104
society and economy strategic cross-influences. 24th Interdisciplinary Information Management Talks 45 (1):405-24.
Shariff, A., Bonnefon, J.-F., & Rahwan, I. (2017). Psychological roadblocks to the adoption of self-driving vehicles. Nature Human Behaviour, 1(10), 694–696. doi: 10.1038/s41562-017-0202-6 Shaw, B., Bicket, M., Elliott, B., Fagan-Watson, B., Mocca, E., Hillman, M. (2015). Children’s Independent Mobility: an international comparison and recommendations for action. Policy Studies Institute.
Sheehan, B., Murphy, F., Mullins, M., & Ryan, C. (2019). Connected and autonomous vehicles: A cyber-risk classification framework. Transportation Research Part A: Policy and Practice, 124, 523–536. doi: 10.1016/j.tra.2018.06.033 Shergold, I., Alford, C., Caleb-Solly, P., Eimontaite, I., Morgan, P., Voinescu, A. (2019) (a). Overall Findings from Research with Older People participating in Connected Autonomous Vehicle trials. Flourish Project Shergold, I., Alford, C., Caleb-Solly, P., Eimontaite, I., Morgan, P., Voinescu, A. (2019) (b) Findings from Workshops held with older people considering participating in Connected Autonomous Vehicle trials. Flourish Project Shergold, I., Ashley, H., Alford, C., Caleb-Solly, P., Eimontaite, I., Morgan, P., Voinescu, A., Goterfelt, F., Morgan, P., Prof. Parkhurst, G., Vanson, T., Wilson, M. (2019). User needs final report WP3 D10, Flourish Project
Shin, J., Bhat, C. R., You, D., Garikapati, V. M., & Pendyala, R. M. (2015). Consumer preferences and willingness to pay for advanced vehicle technology options and fuel types. Transportation Research Part C: Emerging Technologies, 60, 511–524. doi: 10.1016/j.trc.2015.10.003
Siegel, J. E., Erb, D. C., & Sarma, S. E. (2018). A Survey of the Connected Vehicle Landscape—Architectures, Enabling Technologies, Applications, and Development Areas. IEEE Transactions on Intelligent Transportation Systems, 19(8), 2391–2406. doi: 10.1109/TITS.2017.2749459 Siren, A., Haustein, S.J.T.P. (2013). Baby boomers’ mobility patterns and preferences: What are the implications for future transport? 29, 136-144.

D7.1 – Impact areas and paths Page 105
Seapine. (2014). "Study Finds 88 Percent of Adults Would Be Worried about Riding in a Driverless Car." Review of Software.
Sommer, K. (2013). Continental mobility study 2011. Continental AG.
Souders, D., & Charness, N. (2016a). Challenges of Older Drivers’ Adoption of Advanced Driver Assistance Systems and Autonomous Vehicles. In J. Zhou & G. Salvendy (Eds.), Human Aspects of IT for the Aged Population. Healthy and Active Aging (Vol. 9755, pp. 428–440). doi: 10.1007/978-3-319-39949-2_41
Souders, D., & Charness, N. (2016b). Challenges of Older Drivers’ Adoption of Advanced Driver Assistance Systems and Autonomous Vehicles. In J. Zhou & G. Salvendy (Eds.), Human Aspects of IT for the Aged Population. Healthy and Active Aging (pp. 428–440). doi: 10.1007/978-3-319-39949-2_41
Stern, R., Cui, S., Delle Monache, M.L., Bhadani, R., Bunting, M., Churchill, M., Hamilton, N., Haulcy, R., Pohlmann, H., Wu, F., Piccoli, B., Seibold, B., Sprinkle, J., Work, D. (2018). Dissipation of stop-and-go waves via control of autonomous vehicles: field experiments. Transp. Res. Part C 7 (1), 42–57.
Straub, E. R., & Schaefer, K. E. (2019). It takes two to Tango: Automated vehicles and human beings do the dance of driving – Four social considerations for policy. Transportation Research Part A: Policy and Practice, 122, 173–183. doi: 10.1016/j.tra.2018.03.005
Taiebat, M., Brown, A. L., Safford, H. R., Qu, S., & Xu, M. (2018). A Review on Energy, Environmental, and Sustainability Implications of Connected and Automated Vehicles. Environmental Science & Technology, acs.est.8b00127. doi: 10.1021/acs.est.8b00127
Talebpour, A., Mahmassani, H.S. (2016). Influence of connected and autonomous vehicles on traffic flow stability and throughput. Transp. Res. Part C 71, 143–163.
Thomopoulos, N., & Givoni, M. (2015). The autonomous car—a blessing or a curse for the future of low carbon mobility? An exploration of likely vs. desirable outcomes. European Journal of Futures Research, 3(1), 14. doi: 10.1007/s40309-015-0071-z
D7.1 – Impact areas and paths Page 106
Tornatzky, L. G., & Klein, K. J. (1982). Innovation characteristics and innovation adoption-implementation: A meta-analysis of findings. IEEE Transactions on Engineering Management, EM-29(1), 28–45. doi: 10.1109/TEM.1982.6447463 Townera, E., Congiua, M., Daverna, T., Harrisb, A. (2013). Dementia and driving: Guide to mobility for health professionals, carers, families, friends and people with dementia. Australasian Road Safety Research Policing Education Conference, 2013, Brisbane, Queensland, Australia.
Tremoulet, P. D., Seacrist, T., Ward McIntosh, C., Loeb, H., DiPietro, A., & Tushak, S. (2019). Transporting Children in Autonomous Vehicles: An Exploratory Study. Human Factors, 0018720819853993. doi: 10.1177/0018720819853993 Trommer, S., Kolarova, V., Fraedrich, E., Kröger, L., Kickhöfer, B., Kuhnimhof, T., Lenz, B., Phleps P. (2016). "Autonomous driving-the impact of vehicle automation on mobility behaviour." Review of. Projektbericht. Truong, Long T., et al. (2017). "Estimating the trip generation impacts of autonomous vehicles on car travel in Victoria, Australia." Transportation 44.6: 1279-1292.
Ummel, K. (2014). Who Pollutes? A Household-Level Database of America’s Greenhouse Gas Footprint. SSRN Electronic Journal. doi: 10.2139/ssrn.2622751
Urry, J. (2012). Social networks, mobile lives and social inequalities. Journal of Transport Geography, 21, 24–30. doi: 10.1016/j.jtrangeo.2011.10.003 Van den Berg, P., Kemperman, A., de Kleijn, B., Borgers, A.J.T.B., Society (2016). Ageing and loneliness: the role of mobility and the built environment. 5, 48-55. Venkatesh, V., & Morris, M. G. (2000). Why don't men ever stop to ask for directions? Gender, social influence, and their role in technology acceptance and usage behaviour. MIS quarterly, 115-139 Vergragt, P.J., Brown, H.S. (2007). Sustainable mobility: from technological innovation to societal learning. Journal of Cleaner Production 15, 1104-1115.
D7.1 – Impact areas and paths Page 107
Wadud, Z., MacKenzie, D., & Leiby, P. (2016). Help or hindrance? The travel, energy and carbon impacts of highly automated vehicles. Transportation Research Part A: Policy and Practice, 86, 1–18. doi: 10.1016/j.tra.2015.12.001 Wasfi, R., Levinson, D., El-Geneidy, A.J.J.o.T.L. (2012). Measuring the transportation needs of seniors. 6, 08-32. Weber, H. Rösener, C., Prof. Dr.-Ing. Eckstein, L., Dr.-Ing. Zlocki, A. (2018). Evaluation methodology of automated driving, Presentation 25th ITS World Congress Copenhagen.
Werwitzke, C. (n.d.). Renaults EZ-POD: Mini-Stromer für Personen und Güter—Electrive.net. 3.
Wien, J. (2019). An assessment of the willingness to choose a self- driving bus for an urban trip. 8. Wien—An assessment of the willingness to choose a self-.pdf. (n.d.). Retrieved from https://pdfs.semanticscholar.org/1ce2/0932c916795dc1b32e2030ad3238322041cc.pdf
World Health Organization. (2013). Global status report on road safety 2013: Supporting a decade of action. World Health Organization.
Wu, J.-H., & Wang, S.-C. (2005). What drives mobile commerce? An empirical evaluation of the revised technology acceptance model. Information & Management, 42(5), 719–729. doi: 10.1016/j.im.2004.07.001
Yang, X. J., Pradhan, A., Tilbury, D., Robert, L., & others. (2018). Human Autonomous Vehicles Interactions: An Interdisciplinary Approach. Yen, I.H., Shim, J.K., Martinez, A.D., Barker, J.C.J.J.o.a.r. (2012). Older people and social connectedness: How place and activities keep people engaged.
Zijlstra, T., & Vanoutrive, T. (2018). The employee mobility budget: Aligning sustainable transportation with human resource management? Transportation Research Part D: Transport and Environment, 61, 383–396. doi: 10.1016/j.trd.2017.10.005 Zmud, J., Sener, I., N., Wagner. J. (2016). "Consumer acceptance and travel behavior: impacts of automated vehicles." In.: Texas A&M Transportation Institute.

D7.1 – Impact areas and paths Page 108
Zmud, J. P., & Sener, I. N. (2017). Towards an Understanding of the Travel Behavior Impact of Autonomous Vehicles. Transportation Research Procedia, 25, 2500–2519. doi: 10.1016/j.trpro.2017.05.281 Zmud J.P. and Reed N. (2018), ‘Synthesis of the Socioeconomic Impacts of Connected and Automated Vehicles and Shared Mobility’, in Ricci A. (ed.), Socioeconomic Impacts of Automated and Connected Vehicles, The National Academies Press, Washington D.C. Zou, X., Levinson. D.M. (2003). Vehicle-based intersection management with intelligent agents. Paper presented at the ITS America Annual Meeting Proceedings.
8.2 Links to websites ARCADE (2019) https://connectedautomateddriving.eu/arcade-project/ CARTE (2019) https://connectedautomateddriving.eu/about-us/cartre/ AUTOPILOTE (2019) https://autopilot-project.eu/ Eurostat (2015): Disability statistics introduced. Retrieved November 8, 2019, https://ec.europa.eu/eurostat/statistics-explained/index.php/Disability_statistics_introduced Eurostat (2019): Archive: People at risk of poverty or social exclusion. Retrieved November 2, 2019, https://ec.europa.eu/eurostat/statistics-explained/index.php/People_at_risk_of_poverty_or_social_exclusion SMMT (2017) – www.smmt.co.uk/2017/01/uk-new-car-market-achievesrecord-2-69-million-registrations-in-2016-with-fifth-year-of-growth/ .
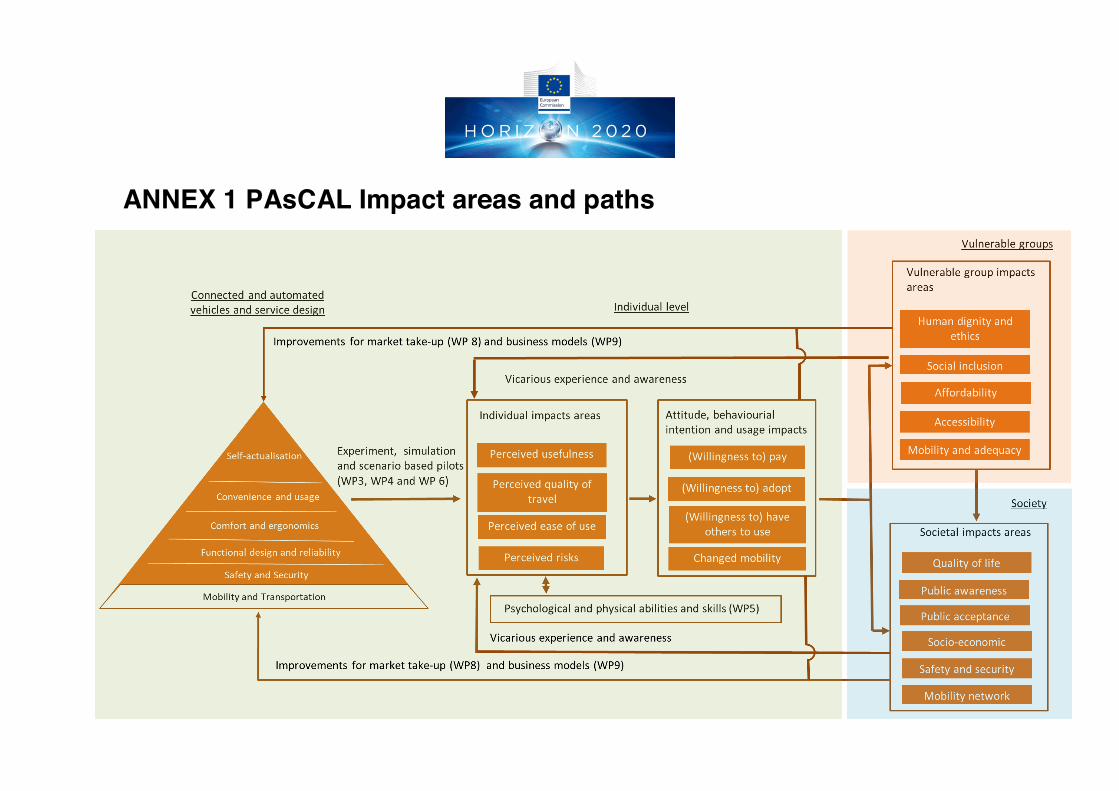
ANNEX 1 PAsCAL Impact areas and paths
--- End of the document ---