Cytocompatibility of direct water synthesized cadmium selenide quantum dots in colo-205 cells
11
RESEARCH PAPER Cytocompatibility of direct water synthesized cadmium selenide quantum dots in colo-205 cells Marcos R. Rodriguez-Torres . Christian Velez . Beatriz Zayas . Osvaldo Rivera . Zikri Arslan . Maxine N. Gonzalez-Vega . Daysi Diaz-Diestra . Juan Beltran-Huarac . Gerardo Morell . Oliva M. Primera-Pedrozo Received: 3 March 2015 / Accepted: 3 June 2015 Ó Springer Science+Business Media Dordrecht 2015 Abstract Cadmium selenide quantum dots (CdSe QDs), inorganic semiconducting nanocrystals, are alluring increased attraction due to their highly refined chemistry, availability, and super tunable optical prop- erties suitable for many applications in different research areas, such as photovoltaics, light-emitting devices, environmental sciences, and nanomedicine. Specifically, they are being widely used in bio-imaging in contrast to organic dyes due to their high brightness and improved photo-stability, and their ability to tune their absorption and emission spectra upon changing the crystal size. The production of CdSe QDs is mostly assisted by trioctylphosphine oxide compound, which acts as solvent or solubilizing agent and renders the QDs soluble in organic compounds (such as toluene, chloroform, and hexane) that are highly toxic. To circumvent the toxicity-related factor in CdSe QDs, we report the synthesis of CdSe QDs capped with thioglycolic acid (TGA) in an aqueous medium, and their biocompatibility in colo-205 cancer cells. In this study, the [Cd 2? ]/[TGA] ratio was adjusted to 11:1 and the Se concentration (10 and 15 mM) was monitored in order to evaluate its influence on the optical properties and cytocompatibility. QDs resulted to be quite stable in water (after purification) and RPMI cell medium and no precipitation was observed for long contact times, making them appealing for in vitro experiments. The spectroscopy analysis, advanced electron microscopy, and X-ray diffractometry studies indicate that the final products were successfully formed exhibiting an improved optical response. Colo-205 cells being exposed to different concentrations of TGA-capped CdSe QDs for 12, 24, and 48 h with doses ranging from 0.5 to 2.0 mM show high tolerance reaching cell viabilities as high as 93 %. No evidence of cellular apoptotic pathways was observed as pointed out by our M. R. Rodriguez-Torres Á O. Rivera Á M. N. Gonzalez-Vega Á O. M. Primera-Pedrozo (&) Nanomaterials Science Laboratory, School of Science and Technology, Universidad Metropolitana, San Juan, PR, USA e-mail: [email protected] C. Velez Á B. Zayas ChemTox Laboratory, School of Environmental Affairs, Universidad Metropolitana, San Juan, PR, USA Z. Arslan Department of Chemistry, Jackson State University, Jackson, MS, USA D. Diaz-Diestra Á J. Beltran-Huarac Á G. Morell Molecular Science Research Center, University of Puerto Rico, San Juan, PR 00926, USA D. Diaz-Diestra Department of Chemistry, University of Puerto Rico, San Juan, PR 00936, USA J. Beltran-Huarac Á G. Morell Department of Physics, University of Puerto Rico, San Juan, PR 00936, USA 123 J Nanopart Res (2015)17:266 DOI 10.1007/s11051-015-3064-8
Transcript of Cytocompatibility of direct water synthesized cadmium selenide quantum dots in colo-205 cells

RESEARCH PAPER
Cytocompatibility of direct water synthesized cadmiumselenide quantum dots in colo-205 cells
Marcos R. Rodriguez-Torres . Christian Velez . Beatriz Zayas .
Osvaldo Rivera . Zikri Arslan . Maxine N. Gonzalez-Vega . Daysi Diaz-Diestra .
Juan Beltran-Huarac . Gerardo Morell . Oliva M. Primera-Pedrozo
Received: 3 March 2015 / Accepted: 3 June 2015
� Springer Science+Business Media Dordrecht 2015
Abstract Cadmium selenide quantum dots (CdSe
QDs), inorganic semiconducting nanocrystals, are
alluring increased attraction due to their highly refined
chemistry, availability, and super tunable optical prop-
erties suitable for many applications in different
research areas, such as photovoltaics, light-emitting
devices, environmental sciences, and nanomedicine.
Specifically, they are being widely used in bio-imaging
in contrast to organic dyes due to their high brightness
and improved photo-stability, and their ability to tune
their absorption and emission spectra upon changing
the crystal size. The production of CdSe QDs is mostly
assisted by trioctylphosphine oxide compound, which
acts as solvent or solubilizing agent and renders the
QDs soluble in organic compounds (such as toluene,
chloroform, and hexane) that are highly toxic. To
circumvent the toxicity-related factor in CdSe QDs, we
report the synthesis of CdSe QDs capped with
thioglycolic acid (TGA) in an aqueous medium, and
their biocompatibility in colo-205 cancer cells. In this
study, the [Cd2?]/[TGA] ratio was adjusted to 11:1 and
the Se concentration (10 and 15 mM) was monitored in
order to evaluate its influence on the optical properties
and cytocompatibility. QDs resulted to be quite stable
in water (after purification) and RPMI cell medium and
no precipitation was observed for long contact times,
making them appealing for in vitro experiments. The
spectroscopy analysis, advanced electron microscopy,
and X-ray diffractometry studies indicate that the final
products were successfully formed exhibiting an
improved optical response. Colo-205 cells being
exposed to different concentrations of TGA-capped
CdSe QDs for 12, 24, and 48 h with doses ranging from
0.5 to 2.0 mM show high tolerance reaching cell
viabilities as high as 93 %. No evidence of cellular
apoptotic pathways was observed as pointed out by our
M. R. Rodriguez-Torres � O. Rivera �M. N. Gonzalez-Vega � O. M. Primera-Pedrozo (&)
Nanomaterials Science Laboratory, School of Science and
Technology, Universidad Metropolitana, San Juan, PR,
USA
e-mail: [email protected]
C. Velez � B. ZayasChemTox Laboratory, School of Environmental Affairs,
Universidad Metropolitana, San Juan, PR, USA
Z. Arslan
Department of Chemistry, Jackson State University,
Jackson, MS, USA
D. Diaz-Diestra � J. Beltran-Huarac � G. Morell
Molecular Science Research Center, University of Puerto
Rico, San Juan, PR 00926, USA
D. Diaz-Diestra
Department of Chemistry, University of Puerto Rico,
San Juan, PR 00936, USA
J. Beltran-Huarac � G. Morell
Department of Physics, University of Puerto Rico,
San Juan, PR 00936, USA
123
J Nanopart Res (2015) 17:266
DOI 10.1007/s11051-015-3064-8

Annexin V assays at higher concentrations. Moreover,
confocal microscopy analysis conducted to evaluate the
intracellular uptake of TGA-CdSe QDs reveal that the
TGA-CdSe QDs were uniformly distributed within the
cytosolic side of cell membranes. Our results also
suggest that under controlled conditions, direct water-
soluble TGA-CdSe QDs can be potentially employed
for bio-imaging colo-205 cancer cells with minimal
adverse effects.
Keywords CdSe QDs �Water � Cell viability � Colo-205 � Annexin V � Bio-imaging � Biomedicine
Introduction
In recent years, many efforts have been made to
synthesize cadmium selenide (CdSe) metal-based
quantum dots (QDs) for potential applications in
nanomedicine due to their size-dependent fluores-
cence, anti-photobleaching, long-term imaging, high
brightness, tunable absorption and emission, and rapid
detection, when contrasted to the conventional organic
dyes (Walling et al. 2009; Jaiswal et al. 2003; Xue
et al. 2011; Jamieson et al. 2007; Yu et al. 2006).
Nonetheless, CdSe QDs present a significant disad-
vantage when used as bio-imaging agent since they
suffer instability and are vulnerable to the release of
Cd2? ions into biological settings (Derfus et al. 2004),
which is critical to evaluate their biocompatibility in
human cells. Worse yet, it has been reported that such
ions tend to be accumulated into the nervous system,
kidneys, and specifically in the liver (Arslan et al.
2011). To tackle this drawback, some alternative
stabilizing surface coating approaches to both substan-
tially reduce the leeching of Cd2? ions and effectively
protect the core materials from oxidation, as well as
new synthetic procedures able to control the [Me-
tal:Se:ligand] ratios without causing any optical detri-
ment, have been proposed (Arslan et al. 2011;
Primera-Pedrozo et al. 2012; Xue et al. 2011). CdSe
QDs can be in fact capped with different ligands or
biomolecules, such as glutathione (GSH) or thiogly-
colic acid (TGA), thus relatively reducing their
cytotoxicity (Aldeek et al. 2008; Gaponik et al.
2002). Parallelly, it has been demonstrated that their
bioconjugation through folic acid endows QDs with
further stability and biocompatibility (Xue et al. 2011).
Nevertheless, recent studies reveal that CdSe QDs still
cause irreversible cellular damage and eventually
cellular death by apoptosis (Chan et al. 2006; Fang
et al. 2012). News methods to synthesize CdSe QDs
directly in water with an efficient capping ligand at a
suitable [Metal:Se:ligand] ratio capable to be tolerated
by human cells and to be used as potential nano-probes
for detecting cancer cells are still a challenge.
Among the most common cancer types, colorectal
cancer is of considerable national interest due to the high
mortality rate that it causes per year, with an estimated
burden of*21cases out of 100,000 in theUS (Rimet al.
2009). Although many techniques, such as fluorescence
microscopy, endoscopy, and NIR-light-induced sur-
face-enhanced Raman scattering have appeared in
literature to detect colorectal cancer cells, optical-
sectioned fluorescence microscopy has demonstrated in
practice to be more efficient to detect and analyze live
cells due to its improved axial resolution, super
resolution, and low-temperature operability (Dailey
et al. 2006). In this line, recent reports have validated
that CdSe/CdS/ZnS QDs conjugated with antibodies
can detect cancerous tissues inside live animals upon
spraying QDs bioconjugates in the colon section, which
allowed for a rapid andmultiplex cancer diagnosis (Park
et al. 2014). Similar findings on the cytotoxic effects of
CdSe QDs have been reported working with different
cellular lines, ranging from human cells (including
neuroblastoma, osteoblast, hepatocyte line, andvascular
endothelial) to bacteria such as E. coli (Jayagopal et al.
2007; Lu et al. 2006; Yan et al. 2011). However, no
study focusing on the cytocompatibility or cytotoxic
effect of TGA-capped CdSe QDs in colo-205 cancer
cells has been reported to date. We herein report the
optimized direct water synthesis and characterization of
CdSe QDs using TGA as a capping agent varying the
concentrations of selenium (Se IV), and the correlated
study of their cytotoxicity in colo-205 cancer cells. The
intracellular uptake study and apoptosis Annexin V
assay analysis of cells exposed to TGA-capped CdSe
QDs are also discussed.
Materials and methods
Reagents and solutions
Deionized water (18.2 MX) was obtained from an
Aries Filter Works Reverse Osmosis System.
266 Page 2 of 11 J Nanopart Res (2015) 17:266
123

Cadmium chloride (CdCl2, 99.99 %, trace metals
basis), thioglycolic acid (TGA, C98 %), sodium
borohydride (NaBH4,C98.0 %) and selenium powder
(99.999 %, metal basis) were obtained from Alfa
Aesar. Dimethyl sulfoxide (DMSO, 99.9 %) was
purchased from VWR. Nitric Acid (HNO3,
67–70 %, trace metal grade, OmniTrace) and HCl
(trace metal grade, 34–37 %, Fisher Scientific) were
used for the selenium stock solution preparation. A 3:1
solution of aqua regia was prepared using HCl (37 %,
Sigma-Aldrich) and nitric acid (65 %, J.T. Baker),
respectively. A 5.0 N sodium hydroxide (NaOH)
solution was prepared by diluting NaOH (10.0 N
standardized solution), purchased from Alfa Aesar.
The solutions in each synthetic protocol were purged
with 99.99 % pure nitrogen gas obtained from Linde
Gas Corporation. Selenium stock solution was pre-
pared by dissolving 4.0 g of selenium powder in
8.0 mL of concentrated HNO3 in a 125-mL Erlen-
meyer flask. The solution was heated in order to
evaporate the excess of acid. One hundred (100 mL)
of 10 % v/v HCl was then added to reduce Se(VI) to
Se(IV). The final concentration of the stock solution
was adjusted to 0.5 M.
Synthesis of CdSe QDs at different Cd/Se ratios
The synthesis was performed following our previous
synthetic methodology (Arslan et al. 2011; Primera-
Pedrozo et al. 2012) with some modifications. Briefly,
the glassware was roughly cleaned with aqua regia for
12 h and then rinsed thoroughly with ultra-high pure
water (dH2O). An aqueous solution of Se (IV) was
used as the selenium source. A cadmium chloride
solution was used as the cadmium source. 500 lL of
CdCl2 was added to 250 mL of dH2O under constant
stirring in a three-neck round flask (flask 1). Concen-
trated TGA (500 lL) was then added to the solution,
which turned turbid. The pH level was adjusted to
*9.5 by adding a solution of NaOH 5.0 N. After
reaching the desired pH value, the solution turned
clear, indicating that the cadmium and the ligand
dissolved completely. In a separate three-neck round
flask (flask 2), a Se (IV) solution was added. Different
concentrations of selenium (10 and 15 mM) were used
for each synthesis. Flask 2 was connected to flask 1
using a Teflon tubing. Both flasks were then purged
with pure nitrogen gas for 30 min in order to remove
all the surrounding oxygen. Ten milliliter (10 mL) of
freshly prepared 10 % w/v NaBH4 (in 0.1 % w/v
NaOH) was added to flask 2 using a plastic syringe,
whereas the N2 flow was kept on in order to generate
hydrogen selenide gas. The solution was added
dropwise in order to favor the formation of monodis-
persed QDs. The color change in flask 1, as the NaBH4
solution was added, indicated that the formation of
QDs in flask 1 started almost instantly. After 20 min of
reaction, the N2 flow was shut off and flask 1 was left
under reflux overnight. As for the time interval
measures, the synthesis was stopped every 20 min of
reflux process in order to obtain smaller QDs.
Purification
DMSO was used as a solvent in the purification
process of CdSe QDs. The temperature of both the
QDs and DMSO was decreased using an ice bath for
10 min. One hundred milliliter (100 mL) of QDs was
distributed in five 50-mL polystyrene centrifuge tubes
(20 mL per tube), then 20 mL of DMSO was added to
each tube and they were kept in the ice bath for
10 min. The products were then centrifuged in an IEC
FL40R Centrifuge (Thermo Electron Corporation) for
30 min at 6000 rpm with a temperature of 4 �C. Thesupernatant was carefully removed from each tube and
the pellets were re-dispersed into 1 mL of dH2O. All
the tube-contained solutions were then combined in a
15-mL polystyrene centrifuge tube. The concentration
of solutions was increased 10 times from the stock
solution by adding dH2O up to a final volume of
10 mL (100 mL of QDs to 10 mL).
Determination of cadmium and selenium
concentration by ICP-MS
The concentrations and ratios of cadmium/selenium
were determined using a Varian 820MS ICP-MS
instrument (Varian, Australia). CdSe QDs suspensions
were purified as described on the previous section.
One milliliter (1 mL) of concentrated HNO3 was
added to 100 lL of the CdSe QDs (910) in a 15-mL
tube. The solution was heated up to 100 �C for 10 min,
and then exposed to a fume hood for 24 h. The final
volume was fixed at 10 mL with 5 % v/v HNO3.
Quantification process was performed using 206Cd and208Cd isotopes for Cd, and 78Se and 82Se isotopes for
Se. The concentrations for Cd and Se are reported as
the average standard deviation of both isotopes.
J Nanopart Res (2015) 17:266 Page 3 of 11 266
123

Characterization
The absorbance spectra of the CdSe QDs were
obtained using a DR 5000 UV–Vis spectrophotometer.
The stock solutions were diluted 20 times in dH2O in
optically transparent cuvettes. The fluorescence spec-
tra were obtained using a Varian Cary Eclipse
Fluorescence Spectrophotometer. The diffraction pat-
terns were collected using a Rigaku Miniflex X-ray
Powder Diffractometer in 2h configuration ranging
from 20� to 80� with a scanning speed of 0.1� min-1
per one scan. FT-IR spectra were recorded using an
IRAffinity-1 Fourier transform infrared spectropho-
tometer (Shimadzu) in the 100–4000 cm-1 range.
XRD and FT-IR measurements were conducted using
powdered QDs. The morphology and size distribution
were analyzed using a Carl Zeiss Leo 922 transmission
electron microscope (TEM). TEM samples were
prepared by dripping a stable suspension of TGA-
CdSe QDs onto a lacey carbon Cu-supported grid
(01895-F Ted Pella, Inc.). Bright-field TEM images at
different magnifications were acquired under a con-
tinuous accelerating voltage of 200 kV.
Cytotoxic experiments
QDs stability in cell culture medium (RPMI 1640)
It is of utmost importance that the QDs remain stable
under different conditions, as they are exposed to
temperature and medium changes. In order to deter-
mine their stability, QDs at 0.5, 1.0, and 1.0 mM were
dispersed in RPMI-1640 culture medium monitoring
their UV–Vis absorbance and fluorescence. After-
ward, they were exposed to cell culture conditions
(37�, 5 % CO2) for 48 h. Their corresponding UV–Vis
and fluorescence spectra were analyzed before and
after exposure, and analyzed again in order to detect
any optical change.
Cell culture
The cellular line used in this study was the colo-205
human colorectal adenocarcinoma (ATCC CCL-222).
Cells were maintained in RPMI 1640 (ATCC, Manas-
sas VA) containing 10 % fetal bovine serum (ATCC).
Cells were maintained at 37 �C with humidified
atmosphere of 95 % air and 5 % CO2. Cells at a
density of 2.5 9 105 cells/mLwere cultured in 12.5-cm2
flasks in duplicate and incubated for 4 h to allow cells
to adhere in a normal fashion before being exposed to
the testing compounds. Cell cultures contained a total
volume of 5 mL including modified RPMI 1640
medium (10 % FBS) and the CdSe QDs.
QD Biocompatibility in colo-205 cells
Cell viability over a period of 48 h was evaluated.
Two experimental groups were prepared; cells were
divided and seeded in two 50-mL centrifuge tubes for
a total of 5 9 106 cells. Cells in RPMI-1640 medium
only were used as the control group, while the other
experimental group was exposed to 0.5, 1.0, and
2.0 mM of CdSe QDs. Both tubes were kept at the
same conditions as the stock culture. Samples of each
experimental culture were taken at 12, 24, and 48 h.
After fluorescence analysis, cells were stained with
trypan blue exclusion and counted using a Countess
automated cell counter (Life, technologies, Carlsbad,
Ca.) to assess viability. One-way ANOVA and post
hoc Tukey tests were also performed using Graph pad
program.
Annexin V
Approximately, 1 9 106 cells were treated for 48 h
with a QDs concentration of 2 mM. Positive controls
were camptothecin at a 10 lM concentration and
2 mM Cd2?. After 48 h of exposure, cells were
stained with Annexin V conjugate and propidium
iodide (Biotium, Hayward, CA) as directed by the
manufacturer. QDs were then analyzed using a Nucleo
Counter NC3000 (Chemometec, Allerød, Denmark).
Experiments were performed using CdSe QDs pre-
pared at 10 and 15 mM of Se (IV).
Cell uptake
Treated cells used for biocompatibility assessment
were also used for intracellular uptake determination.
Intracellular uptake of TGA-CdSe QDs in colo-205
cells was determined using a fluorescence microscope
Zeiss LSM 510 on an Axiovert 200 M microscope.
Cells were washed two times and re-dispersed in PBS
to remove any excess QDs in suspension. The QDs
used were synthesized as explained in the synthesis
section; however, they were refluxed each 20 min in
order to obtain detectable fluorescence emission.
266 Page 4 of 11 J Nanopart Res (2015) 17:266
123
Results and discussion
Stable TGA-capped CdSe QDs were obtained with no
visual evidence of bulk material or precipitation
during 6 months after preparation. As discussed in
the experimental section, QDs were synthesized
directly in water in an oxygen-free environment under
reflux process overnight. TGA was used as a stabilizer
with a [TGA]/[Cd2?] molar ratio of 11:1, and
cadmium concentrations were kept constant. In order
to study the effects of selenium concentrations on the
optical properties, two suspensions were prepared, one
at 10 mM of Se(IV) and the other at 15 mM (see inset
of Fig. 1). These show the typical red color of CdSe
QDs at this particular size regime (Robel et al. 2006).
The color change is ascribed to the quantum confine-
ment effects, indicating that the suspensions exhibit
different crystal sizes. These results were confirmed
by their corresponding absorption spectra displayed in
Fig. 1. Two broadband absorption edges were
observed at *2.31 eV (535 nm, 10 mM) and
*2.24 eV (553 nm, 15 mM), and attributed to the
energy transfer of the s–p electron–hole pairs in CdSe
(Robel et al. 2006). By comparing such spectra to the
sizing curve reported by Yu et al. we obtain particle
diameters falling in the range of 2.5–4.0 nm (Yu et al.
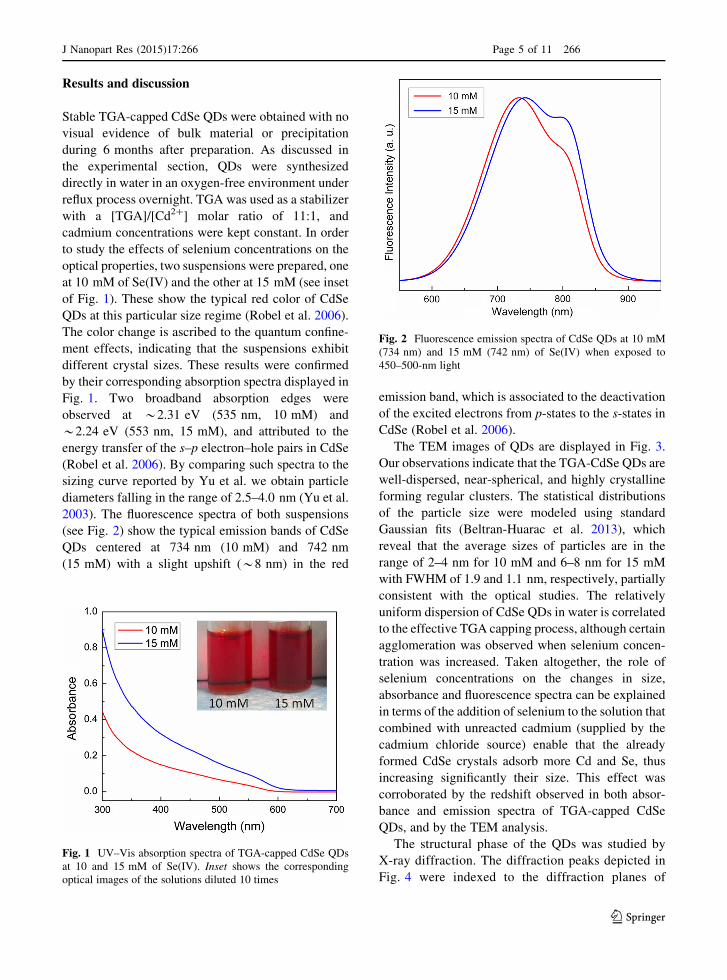
2003). The fluorescence spectra of both suspensions
(see Fig. 2) show the typical emission bands of CdSe
QDs centered at 734 nm (10 mM) and 742 nm
(15 mM) with a slight upshift (*8 nm) in the red
emission band, which is associated to the deactivation
of the excited electrons from p-states to the s-states in
CdSe (Robel et al. 2006).
The TEM images of QDs are displayed in Fig. 3.
Our observations indicate that the TGA-CdSe QDs are
well-dispersed, near-spherical, and highly crystalline
forming regular clusters. The statistical distributions
of the particle size were modeled using standard
Gaussian fits (Beltran-Huarac et al. 2013), which
reveal that the average sizes of particles are in the
range of 2–4 nm for 10 mM and 6–8 nm for 15 mM
with FWHM of 1.9 and 1.1 nm, respectively, partially
consistent with the optical studies. The relatively
uniform dispersion of CdSe QDs in water is correlated
to the effective TGA capping process, although certain
agglomeration was observed when selenium concen-
tration was increased. Taken altogether, the role of
selenium concentrations on the changes in size,
absorbance and fluorescence spectra can be explained
in terms of the addition of selenium to the solution that
combined with unreacted cadmium (supplied by the
cadmium chloride source) enable that the already
formed CdSe crystals adsorb more Cd and Se, thus
increasing significantly their size. This effect was
corroborated by the redshift observed in both absor-
bance and emission spectra of TGA-capped CdSe
QDs, and by the TEM analysis.
The structural phase of the QDs was studied by
X-ray diffraction. The diffraction peaks depicted in
Fig. 4 were indexed to the diffraction planes of
Fig. 1 UV–Vis absorption spectra of TGA-capped CdSe QDs
at 10 and 15 mM of Se(IV). Inset shows the corresponding
optical images of the solutions diluted 10 times
Fig. 2 Fluorescence emission spectra of CdSe QDs at 10 mM
(734 nm) and 15 mM (742 nm) of Se(IV) when exposed to
450–500-nm light
J Nanopart Res (2015) 17:266 Page 5 of 11 266
123

cubic CdSe phase [(111), (220), and (311)] accord-
ing to the JCPDS file No. 19-0191 (Zhai et al.
2011). The relatively sharp peaks found and the
absence of impurities in the XRD patterns indicates
that the CdSe phase is of high crystalline quality
and purity. To evaluate the stoichiometric ratios of
Cd and Se in purified CdSe QDs, we conducted
ICP-MS spectroscopy. The main results are sum-
marized in Table 1. The analysis shows Cd/Se
ratios of *1.28 (10 mM) and *1.32 (15 mM)
closely compatible with those reported for CdSe
(Lewinski et al. 2010).
To further confirm the successful bonding of TGA
capping ligandonto theQDs surfaces,we conductedFT-
IR analysis. The FT-IR spectra of QDs are depicted in
Fig. 5. Note that in our synthetic procedure the pH levels
were adjusted to 9.3–9.6 to deprotonate the carboxylic
end of the TGA, and in turn to reinforce the bonding.
TGA possesses S–H bonds that show vibrations modes
in the range of 2400–2542 cm-1 (Fig. 5, top). However,
the spectra of the QDs show that such vibrational modes
vanishwhenTGA-cappedCdSe regardless of theSe(IV)
volume were used, indicating the successful formation
ofS–Cdbonds between the ligandandQDs (Jiang and Ju
2007). It was also observed that the characteristic mode
of the C=O functional group of TGA was shifted from
*1700 cm-1 to 1560 cm-1 for both suspensions
(Primera-Pedrozo et al. 2012). No strong OH- vibra-
tions were detected. The presence of carboxylate
moieties in the range of 1400–1470 and
1616–1663 cm-1 can be assigned to the symmetric
ms(COO–) and asymmetric mas(COO–) vibrational
modes. The moieties detection is a clear indicator of
the successful deprotonation process of the carboxylic
acid in TGA. The presence of these bands in the FT-IR
Fig. 3 Bright-field TEM
images of TGA-capped
CdSe QDs at (a, b) 10 mM
and (d, e) 15 mM of Se(IV),
and their corresponding (c,f) statistical distributions ofparticle size peaking at *3
and 8 nm, respectively
Fig. 4 XRD patterns of powdered CdSe QDs at 10 and 15 mM
of Se(IV). No parasitic phases were observed
Table 1 Elemental composition of Cd and Se in purified CdSe
QDs extracted from ICP-MS analysis
Se(IV) (mM) Cd (mM) Se (mM) Cd/Se ratio
10 62 48 1.28
15 83 63 1.32
266 Page 6 of 11 J Nanopart Res (2015) 17:266
123

spectra confirms the existence of carboxylate moieties
on theQDs surface, as reported in previous studies on the
absorption of carboxylic acids on metal surfaces
(Primera-Pedrozo et al. 2012). It was also observed a
low-frequency vibrational mode located at 669 cm-1,
which was assigned to the C–S stretching mode, further
confirming the TGA bonding onto the QDs surface.
Additional band assignments observed in CdSe QDs are
summarized in Table 2.
For the effective use of nanoparticles and QDs in
biomedicine, their stabilities in cell media are of great
importance. As previously reported (Kinkeada and
Hegmann 2009) the emission and absorption spectra
of QDs strongly depend on their dimension at the
nanoscale. In the present study, it is shown that TGA-
capped CdSe QDs dispersed in water with sizes of 2–4
and 6–8 nm exhibit prominent emission bands peak-
ing at 734 and 742 nm, respectively. Thus, in order to
evaluate the optical stability in RPMI media, CdSe
QDs at 15 mM (Se) were exposed to RPMI media for
48 h at 37 �C and 5 % CO2 atmosphere, the same
concentrations and conditions used for in vitro exper-
iments. The UV–Vis absorption spectra of CdSe (see
Fig. 6) show that QDs are highly stable in the cell
culture. From the absorption profile, only a negligible
redshift (*3 nm) was observed. Fluorescence emis-
sion (Fig. 7a, b) evidences that the CdSe QDs (before
and after exposure of RPMI media) remain stable with
a slight shift of *20 nm, which can be attributed to
the interaction of the QDs with the surrounding media
(RPMI). These results support the excellent optical
stability that the QDs possess before and after
purification and exposure to cell media, which is vital
for biological applications. No apparent aggregation
was observed after 48 h in cell media that may
influence the QDs–cell interactions and uptake
process.
The cytotoxic effect of TGA-capped CdSe QDs
was assessed by viability assay exposing colo-205
cells to QDs (12, 24 and 48 h) through trypan blue
staining. The cell viability results for CdSe QDs at 10
and 15 mM of Se(IV) are depicted in Fig. 8. They
indicate that the cancer cells can tolerate the QDs
(from 0.5 to 2.0 mM) with high values of viability
even after 48 h of contact. Specifically, the control
samples presented an average of 91.7 % of viable
Fig. 5 FT-IR spectra of pure TGA and TGA-capped CdSe QDs
at 10 and 15 mM of Se(IV) at room temperature. Inset chemical
structure of TGA
Table 2 Bands assignments of the vibrational modes in
purified TGA-capped CdSe QDs obtained from FT-IR spectra
FT-IR spectral region (cm-1) Band assignment
*660 C–S
1400–1470 cm-1 ms(COO–)
1560 cm-1 C = O
1616–1663 cm-1 mas(COO–)
2400–2542 cm-1 S–Ha
a This band is only present in pure TGA
Fig. 6 UV–Vis absorption spectra before and after exposure
with RPMI media showing the stability of CdSe QDs at 15 mM
Se in RPMI cell media for 48 h at 37 8C under humidified
atmosphere conditions of 95 % air and 5 % CO2
J Nanopart Res (2015) 17:266 Page 7 of 11 266
123

cells, whereas the samples at 0.5, 1.0, and 2.0 mM
presented an average viability of 89.9, 92.8, and 90.7,
respectively. No substantial difference between the
experimental and control samples were observed, thus
reflecting that the QDs cause a negligible adverse
effect against the cellular membrane. The ANOVA
test indicated that there is no statistically significant
difference attributed to QDs concentrations and excess
of selenium in the QDs (P\ 0.05).
With the emerging use of CdSe QDs as potential
nano-probes, it is crucial to understand the cytotoxic
effects that can produce the release of Cd ions in
unstable nanocrystals toward biological settings. Cd
ions are known to have cytotoxic effect when is
bonded to the sulphydryl groups of proteins and the
depletion of cellular glutathione levels occurs.
Although cadmium (a redox inactive metal) is inca-
pable of directly generating free radicals, it promotes
the indirect formation of reactive oxygen species
(ROS), which in turn induce DNA damage, lipid
peroxidation, and protein modification (Waisberg
et al. 2003). Even though, the mechanism of cad-
mium’s indirect ROS formation is not well under-
stood, it is believed that cadmium can replace iron and
cooper in a variety of cytosolic and integral membrane
proteins, increasing free iron and copper concentra-
tions, which directly participate in cellular oxidative
stress via Fenton reaction. (Hiraishi et al. 1991; Price
and Joshi 1983). These reactive oxygen species
stimulate the release of cytochrome c that promotes
caspase-dependent apoptosis (Petrosillo et al. 2003).
In order to evaluate whether an apoptotic mecha-
nism was activated or not among the cell cultures with
a small reduction in viability, the Annexin V assay was
performed to determine possible Cd?2-related toxicity
in cell cultures using QDs and Cd?2 ions at 2.0 mM
(Fig. 9). Four groups were systematically measured
using a second positive control to generate comparable
Fig. 7 Fluorescence
emission spectra of CdSe
QDs at 15 mM Se before
(a) and after (b) exposurewith RPMI media, and
excited with 450–500-nm
light
Fig. 8 Cell viability of colo-205 cancer cells determined by trypan blue exclusion test when exposed to TGA-capped CdSe QDs at
(a) 10 mM and (b) 15 mM of Se(IV)
266 Page 8 of 11 J Nanopart Res (2015) 17:266
123

and reliable results. They show that the percent of
apoptotic cells present in the CdSe at 10 mM (average
of *25.0 %) and 15 mM (average of *26.3 %) is
slightly higher than that found in the control (average
of *15.0 %). As expected, the camptothecin positive
control shows a large percent of apoptotic cells
(average of *98.0 %), whereas the Cd?2 experimen-
tal group showed a certain degree of apoptotic activity
(average *96.0 %). The comparison between camp-
tothecin and Cd?2 shows the relative apoptotic
capability of cadmium ions to be released by the
destabilization of the nanocrystal. Both results indi-
cate that there are no abnormal levels of apoptotic cell
percentage (less than 10.0 % for 10 mM and 11.3 %
for 15 mM), when compared to the camptothecin and
Cd?2 group, evidencing that the QDs do not cause
apoptosis induction under the testing parameters
covered in this study. Taken altogether, the method
developed in this study shows that the TGA is an
effective biocompatible ligand capable of stabilizing
the highly crystalline CdSe QDs, and prevents the
toxic emissions of reactive oxygen species that would
normally lead to the induction of apoptosis.
Accordingly, both the cell viability and Annexin V
assays suggest that the TGA-capped CdSe QDs are
non-toxic. To further confirm the biocompatibility of
the QDs, study their interaction with the colo-205
human cancer cells, and evaluate their bio-imaging
ability, we performed intracellular uptake measure-
ments monitored by confocal microscopy. The cells
after 48 h of contact were thoroughly washed and
purified with PBS in order to eliminate any excess of
QDs adsorbed on the cell membrane. Unfortunately,
no detectable emission coming out from the cells was
observed, which can be ascribed to the fact that the as-
synthesized QDs were uptaken by the cells and that
they appear to have a low quantum yield. Varying our
synthetic protocol, we synthesized a new set of QDs
that can prominently emit light with higher values of
quantum yield. Under the same conditions as
described above, we observed that the re-suspended
cells can emit light more efficiently indicating that the
TGA-capped CdSe QDs can penetrate into the live
cells without causing cell death, and to be eventually
located in the cytosolic regions of cell membrane,
consistent with cell viability and Annexin V assays.
The fluorescence confocal images of colo-205 cells
Fig. 9 Annexin V assay tested on TGA-capped CdSe QDs at 10
and 15 mM of Se(IV) showing no apoptosis-induced mecha-
nism and Cd2? as positive control
Fig. 10 a–c Fluorescence confocal microscopy images of colo-2015 cancer cells when exposed to TGA-capped CdSe QDs at 15 mM
of Se(IV) for 48 h. Photos taken at Confocal Imaging Facility at UPR (CIF-UPR)
J Nanopart Res (2015) 17:266 Page 9 of 11 266
123

exposed to the QDs (15 mM) at 2.0 mMwith a heating
time interval of 20 min are depicted in Fig. 10.
Conclusions
In summary, we have successfully synthesized TGA-
capped CdSe QDs directly in water. Our findings
indicate that the QDs are non-cytotoxic until a
concentration of 2.0 mM, are located within the
cytosolic side of cellular membrane, and can be used
as bio-imaging agents to efficiently detect colo-205
human cancer cells regardless of the selenium con-
centration (10 and 15 mM) used for their synthesis.
This work brings forth new vistas to further implement
the use of water-soluble biocompatible Cd-based QDs
for bio-imaging cancer cells, which is critical for the
theranostics of the most common cancer types that
cause significant mortality over the world population.
Acknowledgments We gratefully acknowledge the financial
support of theNSF-REU:PuertoRicoResearchTraining inCross-
Disciplinary Chemical Sciences (NSF funding CHE 126282).
UPR-IFN support under Grant award number, EPS 1002410 is
also appreciated. Research reported in this publication was also
supported in part by an Institutional Development Award (IDeA)
to Dr. Zayas from the National Institute of General Medical
Sciences of the National Institutes of Health under grant number
P20 GM103475. The content is solely the responsibility of the
authors and does not necessarily represent the official views of the
National Institutes of Health. We thank Dr. Lymarie Fuentes for
her help regarding to fluorescence experiments. J.B-H. thanks PR
NASA EPSCoR (NASA Cooperative Agreement
NNX13AB22A) for financial support. We thank Bismark
Madera for the confocal images taken at CIF-UPR.
References
Aldeek F, Balan L, Lambert J, Schneider R (2008) The influence
of capping thioalkyl acid on the growth and photolumi-
nescence efficiency of CdTe and CdSe quantum dots.
Nanotechnology 19:475401
Arslan Z, Ates M, McDuffy W, Agachan MS, Farah IO, Yu
WW, Bednar AJ (2011) Probing metabolic stability of
CdSe nanoparticles: alkaline extraction of free cadmium
from liver and kidney samples of rats exposed to CdSe
nanoparticles. J Hazard Mater 192:192–199
Beltran-Huarac J, Wang J, Tanaka H, Jadwisienczak WM,
Weiner BR, Morell G (2013) Stability of the Mn photolu-
minescence in bifunctional ZnS:0.05Mn nanoparticles.
J Appl Phys 114:053106
Chan WH, Shiao NH, Lu PZ (2006) CdSe quantum dots induce
apoptosis in human neuroblastoma cells via mitochondrial-
dependent pathways and inhibition of survival signals.
Toxicol Lett 167:191–200
Dailey ME, Mander E, Soll DR, Terasaki M (2006) Confocal
microscopy in living cells. In: Pawley JB (ed) Handbook of
biological confocal microscopy, 3rd edn. Springer, New
York, pp 381–413
Derfus AM, Warren WCM, Bhatia SN (2004) Probing the
cytotoxicity of semiconductor quantum dots. Nano Lett
4:11–18
Fang TT, Li X, Wang QS, Zhang ZJ, Liu P, Zhang CC (2012)
Toxicity evaluation of CdTe quantum dots with different
size on Escherichia coli. Toxicol Vitro 26:1233–1239
Gaponik N, Talapin DV, Rogach AL et al (2002) Thiol-capping
of CdTe nanocrystals: an alternative to organometallic
synthetic routes. J Phys Chem B 106:7177–7185
Hiraishi H, Terano A, Ota S, Mutoh H, Razandi M, Sugimoto T,
Ivey KJ (1991) Role for iron in reactive oxygen species-
mediated cytotoxicity to cultured rat gastric mucosal cells.
Am J Physiol 260:G556–G563
Jaiswal JK, Mattoussi H, Mauro JM, Simon SM (2003) Long-
termmultiple color imaging of live cells using quantum dot
bioconjugates. Nat Biotechnol 21:47–51
Jamieson T, Bakhshi R, Petrova D, Pocock R, Imani M, Seifa-
lian AM (2007) Biological applications of quantum dots.
Biomaterials 28:4717–4732
Jayagopal A, Russ PK, Haselton FR (2007) Surface engineering
of quantum dots for in vivo vascular imaging. Bioconjug
Chem 18(1424):1433
Jiang H, Ju H (2007) Enzyme-quantum dots architecture for
highly sensitive electrochemiluminescence biosensing of
oxidase substrates. Chem Commun 4:404–406
Kinkeada B, Hegmann T (2009) Effects of size, capping agent,
and concentration of CdSe and CdTe quantum dots doped
into a nematic liquid crystal on the optical and electro-optic
properties of the final colloidal liquid crystal mixture.
J Mater Chem 20:448–458
Lewinski NA, Zhu H, Jo H-J et al (2010) Quantification of water
solubilized CdSe/ZnS quantum dots in daphnia magna.
Environ Sci Technol 44:1841–1846
Lu HY, Shiao NH, Chan WH (2006) CdSe quantum dots induce
apoptosis via activation of JNK and PAK2 in human
osteoclast cell line. Med Biol Eng 26:89–96
Park Y, Ryu YM, Wang T et al (2014) Spraying quantum dot
conjugates in the colon of live animals enabled rapid and
multiplex cancer diagnosis using endoscopy. ACS Nano
8:8896–8910
Petrosillo G, Ruggiero FM, Paradies G (2003) Role of reactive
oxygen species and cardiolipin in the release of cyto-
chrome c from mitochondria. FASEB J 17:2202–2208
Price DJ, Joshi JG (1983) Ferritin. Binding of beryllium and
other divalent metal ions. J Biol Chem 258:10873–10880
Primera-Pedrozo OM, Arslan Z, Rasulev B, Leszczynski J
(2012) Room temperature synthesis of PbSe quantum dots
in aqueous solution: stabilization by interactions with
ligands. Nanoscale 4:1312–1320
Rim SH, Seeff L, Ahmed F, King JB, Coughlin SS (2009)
Colorectal cancer incidence in the United States,
1999–2004: an update analysis of data from the national
program of cancer registries and the surveillance, epi-
demiology, and end results program. Cancer
115:1967–1976
Robel I, Subramanian V, Kuno M, Kamat PV (2006) Quantum
dot solar cells. Harvesting light energy with CdSe
266 Page 10 of 11 J Nanopart Res (2015) 17:266
123

nanocrystals molecularly linked to mesoscopic TiO2 films.
J Am Chem Soc 128:2385–2393
Waisberg M, Joseph P, Hale B, Beyersmann D (2003) Molec-
ular and cellular mechanisms of cadmium carcinogenesis.
Toxicology 192:95–117
Walling MA, Novak JA, Shepard JR (2009) Quantum dots for
live cell and in vivo imaging. Int J Mol Sci 10:441–491
Xue M, Wang X, Wang H, Tang B (2011) The preparation of
glutathione-capped CdTe quantum dots and their use in
imaging of cells. Talanta 83:1680–1686
Yan M, Zhang Y, Xu K, Fu T, Qin H, Zheng X (2011) An
in vitro study of vascular endothelial toxicity of CdTe
quantum dots. Toxicology 282:94–103
Yu WW, Qu L, Guo W, Peng X (2003) Experimental determi-
nation of the extinction coefficient of CdTe, CdSe, and CdS
nanocrystals. Chem Mater 15:2854–2860
Yu WW, Chang E, Drezek R, Colvin VL (2006) Water-soluble
quantum dots for biomedical application. Biochem Bio-
phys Res Commun 348:781–786
Zhai C, Zhang H, Du N, Chen B, Huang H, Wu Y, Yang D
(2011) One-pot synthesis of biocompatible CdSe/CdS
quantum dots and their applications as fluorescent biolog-
ical labels. Nanoscale Res Lett 6:31–35
J Nanopart Res (2015) 17:266 Page 11 of 11 266
123


![[MI 611-205] PH10 DolpHin Series pH Sensors and ORP10 ...](https://static.fdokumen.com/doc/165x107/63374b82479381eb2301dd3f/mi-611-205-ph10-dolphin-series-ph-sensors-and-orp10-.jpg)