Identification of the sequences in HMG-CoA reductase required for karmellae assembly
Upload
independentCategory
view
3download
0
ABSTACT: The cyclic fluctuations of HMG-CoA reductase activ-ity and mRNA are reportedly related to feeding the cells in cul-ture or to variations in food consumption by the animals over a24-h cycle. In this work, we demonstrate cyclic increments inHMG-CoA reductase activity in smooth muscle cells (SMC) notassociated with the culture feeding. Since reductase activity alsoshows a marked rise preceding the S phase, one of the majorgoals of the present work was to evaluate this dual role of reduc-tase activity and mRNA fluctuations related to the cell cycle andto food intake in the SMC-C/SMC-Ch cultures derived from con-trol-fed (SMC-C) and cholesterol-fed (SMC-Ch) chicks. The pe-riod and amplitude oscillations in HMG-CoA reductase activityvaried depending on culture conditions: lipoprotein-deficientserum vs. FBS, young vs. senescent cells, or confluent vs. non-confluent cultures. The HMG-CoA reductase mRNA concentra-tion showed a marked rise after feeding not correlated to the fluc-tuation activity, suggesting posttranscriptional modulation. Re-ductase activity and mRNA were down-regulated in SMC-Ch.Since the nutritional culture conditions were the same in bothcell lines, these findings indicate that consumption of a high-cho-lesterol diet by the animals prior to the establishment of the SMCcultures induced changes in the HMG-CoA reductase gene ex-pression in aortic SMC.
Paper no. L9929 in Lipids 41, 1089–1099 (December 2006).
The enzyme HMG-CoA reductase (EC 1.1.1.34), from the en-doplasmic reticulum, catalyzes the conversion of HMG-CoAto mevalonate, the rate-limiting step in cholesterol biosynthesis(1). The rate of cholesterol biosynthesis from different tissueswas shown to have a diurnal rhythm many years ago (2–4).These rhythmic changes are associated with changes in HMG-CoA reductase activity (1,2,5,6). In rodent liver, diurnal varia-tion of hepatic cholesterol synthesis is driven primarily byvarying the steady-state mRNA levels for HMG-CoA reduc-tase (6–11). The diurnal rhythm of HMG-CoA reductase fromchick liver and intestine has also been observed in our labora-tory. In this animal, both reductase activities were maximal dur-
ing the light period, in agreement with chick feeding habits.However, chick liver and intestine reductase do not show diur-nal rhythm at hatching (5) or during the first week of life, whenthe chick is still reabsorbing the yolk (12) and thereby devel-oping a transient hypercholesterolemia, which becomes almostthree times higher in cholesterol-fed chicks (13). Indeed, therise in reductase activity is depressed in hypercholesterolemicchicks (13) and following cholesterol or mevalonate feeding incell cultures (14). Moreover, the diurnal rhythm of mevalonatemetabolism by sterol and nonsterol pathways and of meval-onate-activating enzymes has been demonstrated (15). Themultivalent feedback regulation of HMG-CoA reductase in-volves cholesterol and one or more of the other products thatare synthesized from mevalonate (16). Both cholesterol andmevalonate are required for the depression of reductase activ-ity at the transcriptional, posttranscriptional, and posttransla-tional levels (17–20). The diurnal variation in activity is a goodexample of short-term physiological regulation of hepaticHMG-CoA reductase (1,2) and is due to changes in the state ofphosphorylation of the enzyme; however it has been reportedthat the diurnal variation in hepatic HMG-CoA reductase is dueto changes in enzyme protein levels rather than changes in thephosphorylation state of the enzyme (21). It has also beendemonstrated in vivo that the short-term changes in enzyme ac-tivity are due to changes in the quantity of enzyme rather thanto a modulation of the catalytic activity (22).
On the other hand, HMG-CoA reductase activity regulationparticipates in cell division (23–26), as reflected by a markedrise in HMG-CoA reductase activity just preceding the S phaseof the cell cycle (25). However, parallel changes in HMG-CoAreductase activity have been observed in synchronized and un-synchronized cells (14). In fact, HMG-CoA reductase activitywas low at the time of the medium change and increased 10- to20-fold 5–10 h after medium change, returning to basal levelsby 24 h in both synchronized and unsynchronized cells. Thus,other factors besides the cell cycle may also play a role. If therise in HMG-CoA reductase activity is blocked by a competi-tive inhibitor such as compactin, the cells will not enter the Sphase (23). The arrest in the cell cycle cannot be overcome bythe addition of cholesterol, but rather by the addition of meval-onate (24,25). Studies in a rat embryo fibroblast cell line, syn-chronized by double thymidine (dThd) block and cultured incholesterol-containing medium, have demonstrated cyclic vari-ations of HMG-CoA reductase activity with two maxima in theS and G2M phases (26). In this culture model, the cyclic varia-
Copyright © 2006 by AOCS Press 1089 Lipids, Vol. 41, no. 12 (2006)
*To whom correspondence should be addressed at Dept. of Biochemistry andMolecular Biology, Faculty of Sciences, C/ Fuentenueva s/n, University ofGranada, 18071 Granada, Spain. E-mail: [email protected] first two authors listed contributed equally to this work.Abbreviations: dNTP, deoxy nucleotide 5′-triphosphate; dThd, double thymi-dine; LPDS, lipoprotein-deficient serum; PI, propidium iodide; RT-PCR, re-verse transcription-polymerase chain reaction; SMC, smooth muscle cell;SMC-C, smooth muscle cell–control fed chicks; SMC-Ch, smooth musclecell–cholesterol fed chicks; SRE, sterol regulatory element; SREBP sterolregulatory element-binding protein.
ARTICLES
Cyclic Fluctuations of 3-Hydroxy-3-methylglutaryl-CoAReductase in Aortic Smooth Muscle Cell Cultures
Mª José Alejandre, Sonia Perales, Ángel Carazo,Rogelio Palomino-Morales, and Ana Linares*
Department of Biochemistry and Molecular Biology, Faculty of Sciences, University of Granada, 18071 Granada, Spain
tions of the enzyme activities appeared to be due more to in-creased synthesis at given times of the cycle than to periodicdephosphorylation.
Although it has been well established that the diurnalrhythm of hepatic HMG-CoA reductase is associated with vari-ations in food consumption over a 24-h cycle in the whole ani-mal (5,6,8,27,28), the marked change that the reductase activ-ity shows in cell cultures is not so well established and cannotbe explained by the contribution of nutrients. This fluctuationof reductase in cell cultures has been associated with feedingthe cells or with the cell cycle and DNA replication. Early ex-periments (27) demonstrated a small increase of the reductaseactivity in cultured fibroblasts 19 h after changing to freshmedia supplemented with FBS, whereas a large (fivefold) in-crease occurred in reductase activity after changing to freshmedia supplemented with lipoprotein-deficient serum (LPDS).Moreover, early experiments (14) also demonstrated thatHMG-CoA reductase activity increased in a murine macro-phage-like cell line (J774) under normal culture conditions (inthe presence of 10% FBS) and that this variation was associ-ated with feeding the cells. These authors also demonstratedthe increase of reductase activity in confluent and unsynchro-nized cultures, emphasizing that other exogenous factors be-sides the cell cycle could play a role. On the other hand, sev-eral investigators have observed that HMG-CoA reductase ac-tivity is high in rapidly dividing cells but declines as cells reachconfluence (28,29). This view contrasts with the results re-ported previously (14) since these authors reported that reduc-tase activity increased in confluent cells where no transientchanges in DNA synthesis or in cell number were observed.Also, marked fluctuations during the various phases of the cellcycle have been reported in HMG-CoA reductase activity, inthe G1 phase when quiescent, growth-inhibited cells are stimu-lated by replenishment of growth factors or serum in synchro-nized cultures (29), increasing to twice that of the unsynchro-nized cells examined concomitantly.
Thus, the cyclic fluctuations of HMG-CoA reductase activ-ity and mRNA levels are related to feeding the cells in cultureor variations in food consumption over a 24-h cycle in the ani-mals. Since HMG-CoA reductase activity also shows a markedrise just preceding the S phase of the cell cycle, one of themajor objectives of the present work was to evaluate the varia-tions in HMG-CoA reductase activity and mRNA concentra-tion in an in vivo/in vitro model of arterial smooth muscle cell(SMC) cultures and to investigate the relationships betweenHMG-CoA reductase, food availability, and cell division. Inour laboratory, we isolated SMC from cholesterol-fed chicks(SMC-Ch), which are very proliferative in culture comparedwith SMC isolated from control-fed chicks (SMC-C). Thus,DNA synthesis in the S phase was fourfold higher; moreover,after 20 d of culture, SMC-Ch cells increased their cholesterolcontent to double that of SMC-C, producing SMC-Ch culturesunder conditions mimicking a very early atherosclerosis modelat the SMC level (30). We have studied cholesterol synthesisand HMG-CoA mRNA concentrations in these cultures andshowed great differences between SMC-C and SMC-Ch
(31,32). In this study, we demonstrate the existence of cyclicfluctuations of HMG-CoA reductase activity in nonsynchro-nized SMC cultures that are not correlated to the cultured feed-ing or to the increase of mRNA, suggesting the existence ofposttranscriptional modulation of the HMG-CoA reductase andof relationships between HMG-CoA reductase activity and celldivision.
MATERIALS AND METHODS
Animals. Newly hatched White Leghorn male chickens (Gal-lus domesticus) were provided by a commercial hatchery andfed ad libitum in a chamber with a light cycle from 0900 to2100 hours and controlled temperatures of 29–31°C. Twogroups of chicks that were 10 d old were used. The controlgroup was kept on a standard diet (Sanders A-00) whereas thetreated, or diet-group, was fed on the same diet supplementedwith 5% w/w powdered cholesterol (pure grade; PanreacQuímica, Spain) mixed homogeneously. The diet was startedat hatching and kept on until the chicks were killed (10 d after).Water was available at all times. None of the chicks died a nat-ural death during the treatment nor developed any illness.
SMC cultures. SMC were isolated from the aortic arch ofthe chicks as described before (33,34) with slight modifications(30) and cultured in DMEM containing D-glucose (4.5 g/L)and L-glutamate (584 g/L) and supplemented with 1% of an-tibiotic cocktail composed of penicillin (100 µg/mL) and am-photericin (0.25 µg/mL) (Sigma Chemical Co.) and 10%(vol/vol) of whole serum (FBS). When specified, delipidizedserum (LPDS) was substituted for whole serum during the in-cubation period. Medium was buffered with bicarbonate, andcultures were kept at 37°C in a humidified atmosphere of 95%air and 5% CO2. Medium was renewed every 48 h, and cellswere passaged by trypsinization (0.05% trypsin–0.02% EDTAin PBS). All experiments were conducted using 3 or 4 passages(young cultures) or 13–15 passages (senescent cultures). Cellswere seeded at approximately 2 × 10⁴ cells per dish (60 mm)containing 4 mL fresh medium.
Cells were identified as vascular SMC by their “hill-and-valley” pattern of confluence (34) and by positive staining tosmooth muscle actin and myosin (35). Cell number and viabil-ity were checked using the trypan blue exclusion test (Sigma).Cell viability was usually about 90%.
For culture, exponentially growing cells from three passageswere synchronized by double-excess thymidine block (36).After 15 h in medium containing 2 mM thymidine, the cultureswere washed two times with PBS saline solution and incubatedagain in normal medium for 8, 9, or 10 h. Synchronization wasachieved by a second thymidine treatment for 15 h. At the endof this thymidine block, cells were carefully washed three timeswith 3 mL of PBS, and normal fresh medium was added. At alltime points, cells were examined by light microscopy and mon-itored for viability by determining trypan blue exclusion. Cellviability was about 90%, and the senescent aspect of the cul-tures follows the normal evolution through 15 passages.
LPDS was prepared from the plasma of standard diet-fed
1090 M.J. ALEJANDRE ET AL.
Lipids, Vol. 41, no. 12 (2006)
chickens, using a single spin gradient density ultracentrifuga-tion according to Poumay and Ronveaux-Dupal (37).
Flow cytometry. Cell fixation was carried out as describedpreviously (38). The cells were harvested and washed withPBS containing 10% FBS. Cell pellets were resuspended in250 µL PBS, followed by 250 µL PBS containing 2%paraformaldehyde. After incubation for 15 min at 4°C, cellswere washed, resuspended in 5 mL of ice-cold 70% ethanol,and refrigerated overnight at –20°C. Then, cells were processedfor cellular DNA content and cell-cycle distribution of SMCpopulations. Fixed cells were resuspended in PBS containing200 µg/mL ribonuclease and 5 µg/mL propidium iodide (PI)and then incubated for 30 min at room temperature. Cells wereanalyzed for red (PI, allowing DNA quantification) fluores-cence using a dual laser flow cytometry FACS Vantage (Bec-ton Dickinson Immunocytometry System, San José, CA.), witha Coherent Enterprise laser (160 mW, 488 nm and 60 mW,UV). The laser was regulated to 488 nm and 15 mW with thesample in the detector, FL2-regulated to 495 nm (lineal), with afilter 585/42 BP. Five thousand cells were analyzed (300cells/s); data were processed on the CellFiT (v. 2.01.2 BectonDickinson).
Assay of HMG-CoA reductase activity in SMC cultures.HMG CoA reductase activity was measured essentially as de-scribed by Goldstein et al. (39) but adapted to SMC as de-scribed below. After three washings of a cell monolayer (1 ×10⁶ cells) with PBS, cells were scraped with a rubber police-man, pelleted at 400 × g then disrupted by incubation in bufferA (5 mM EDTA, 200 mM KCl, 5 mM DTT, 0.25% Brij 97, and50 mM phosphate buffer pH 7.4) for 15 min at 37°C. After cen-trifugation at 10,000 × g for 10 min, the protein concentrationin the supernatant was determined according to Bradford (40),and about 60–100 µg of protein was used for assay of HMG-CoA reductase activity. The 10,000 × g supernatant was prein-cubated for 5 min at 37°C in the presence of an NADPH-gen-erating system in buffer B (12 mM DTT, 60 mM glucose-6-phosphate, 7.5 mM NADP, 20 µg/mL glucose-6-phosphatedehydrogenase, and 300 mM phosphate buffer pH 7.4), thenincubated with 40 µM [3-14C]HMG-CoA (specific activity:5550 dpm/nmol) for 15 min in a final volume of 30 µL. The re-action was stopped by adding 5 µL of 5 M HCl and 20 µL of asolution containing 50 mg/mL of mevalonolactone, which actsas a marker for visualization on the TLC sheets.
Samples were then incubated for 30 min at 37°C to permitmevalonic acid to lactonize. The protein-free supernatant solu-tion was chromatographed on a thin layer plate of silica gel Gand developed in benzene/acetone (1:1, vol/vol). The plates werethen placed in an iodine chamber and the mevalonolactone band(Rf 0.4–0.6) was scraped off and transferred to scintillation vialsfor measurement of radioactivity. Reductase activity was ex-pressed as pmol of mevalonic acid synthesized/min/mg protein.
Data analysis. Data are expressed as mean ± SEM. Resultswere analyzed by Student’s t-test.
Competitive reverse transcription-polymerase chain reac-tion (c-RT-PCR). Cloning was carried out in Escherichia colistrain JM101 (F traD36 proA+ proB+ lacI lacZ∆M15/supE thi
∆(lac-proAB)) using the pGEM-T vector system I (Promega,Madison, WI). Escherichia coli was cultured in Luria–Bertanibroth containing the appropriate antibiotic (ampicillin, 50µg/mL). Oligonucleotide primers were synthesized with GibcoBRL (Barcelona, Spain) custom primers.
Total cytoplasmic RNA from both the SMC-C and SMC-Ch culture lines was isolated by the acid guanidinium isothio-cyanate method as described elsewhere (41,42) with the slightmodifications described previously (32).
The construction and sequencing of a chick HMG-CoA re-ductase cDNA (complementary DNA) fragment was carriedout as described by Carazo et al. (32). This gave a fragmentwithout primers (22 pb) of 199 pb, which was gel purified; bothstrands were sequenced by the chain-termination DNA se-quencing method of Sanger et al. (43) using AmpliTaq‚ FS anddeoxy nucleotide 5´-triphosphates (dNTP) (ABI PrismTM fluo-rescence labeled; PerkinElmer/Applied Biosystems Division,Foster City, CA) in a Dye Terminator Cycle Sequencing ReadyReaction (PerkinElmer/Applied Biosystems Division). The de-sign and synthesis of chick HMG-CoA reductase homologousprimers was carried out as described by Carazo et al. (32). Toconstruct a chick HMG-CoA reductase mRNA standard (com-petitive template), we designed composite primers as describedby Carazo et al. (32).
RT-PCR was carried out in a single reaction tube using Tthpolymerase (GeneCraft GmbH, Münster, Germany), a ther-mostable DNA polymerase that shows RT activity, by usingMn2+ (44,45). All RT and PCR reactions took place in a DNAThermal Cycler 480 (Techne, Princeton, NJ). The RT reactionwas set up in 20 µL containing the appropriate amount of totalcytoplasmic RNA; 10× RT buffer [670 mM Tris-HCl, pH 8.8,166 mM (NH4)2SO4, 0.1% Tween-20]; 1 mM MnCl2; 0.25 mMdNTP; 1.25 pmol/µL downstream primer; and 0.12 units/µL ofTth polymerase and then incubated at 72°C for 30 min. Com-petitor DNA, as indicated above, was added before amplifica-tion. For the amplification reaction, 30 µL of a mix containing5× PCR buffer [33.5 mM Tris-HCl, pH 8.8, 83 mM(NH4)2SO4, 3.75 mM EGTA, 25% glycerol, 0.196 Tween-20],1.5 mM MgCl2, 0.2 mM dNTP, 0.5 pm/µL of both primers (up-stream and downstream), and 0.05 units/µL Tth polymerasewere added per reaction. Thirty cycles were routinely per-formed with 1 min denaturation at 95°C, 1 min annealing at52°C, and 1 min per cycle of PCR at 72°C.
Separation and quantification of PCR products. PCR prod-ucts were loaded directly onto a 2% agarose gel and elec-trophoresed at 5 V/cm for 1.5 or 2 h. DNA was visualized andphotographed under UV light (320 nm) after ethidium bromidestaining (45). The picture was digitized and analyzed using theQuantiScan Program (Biosoft, Milltown, NJ). This DNA quan-tification system is very sensitive and is able to detect nanogramamounts of DNA. Reactions containing the different masses ofDNA were performed in triplicate. All the ethidium bromide col-orimetric data included fall into the range where the DNA quan-tity ratio was linear. A plot of the log of the ratio of target to com-petitor product against the log of the competitor concentrationshould give a straight line with a slope of –1 (46).
HMG-COA REDUCTASE IN SMC CULTURES 1091
Lipids, Vol. 41, no. 12 (2006)

Competitive RT-PCR analysis involves titrating the standardwith a constant amount of sample SMC cytoplasmic RNA perreaction tube (25 ng from young cells and 50 ng from senes-cent cells). The amount of competitor used at which the ratioof target to competitor PCR products is equal to unity (log ratio= 0; the equivalence point) can be used to calculate the initialnumber of molecules in the target sequence.
RESULTS
Cell cycle analysis. We prepared unsynchronized SMC culturesof different passage numbers: early-passage cultures or young(3 or 4 passages) with exponentially growing cells or confluentcultures, late-passages cultures or senescent (13–15 passages),and synchronized cultures. Flow cytometry was used to ana-lyze the cell cycle by cell DNA content in SMC-C cultures.Figure 1 shows the cell cycle of three passages of exponentiallygrowing cells from unsynchronized cultures (50–60% of con-fluence) and the cell cycles of cultures with 100% confluency.Both in exponential growth and at confluency, the proportionof the cells in S phase was the same (almost 30%). Exponentialgrowth SMC cultures show 50% of the cells in G0/G1 phaseand 30% in G2/M phase; however, at confluence in the SMCcultures the proportion of the cells in the G0/G1 phase is higher(70%) and in G2/M phase is lower (10%) (Fig. 1).
Cell-synchrony experiments were performed by double ex-cess dThd block after previous determination of the thymidineconcentration range (0–4 mM) that was nontoxic for the cells.Figure 2 shows the cell cycle of three passages in exponentiallygrowing SMC cultures synchronized by dTHd block at differ-ent times of incubation in normal medium between the first andthe second 15-h dThd block. The cells were 80% blocked bythymidine at the G0/G1 phase with an interblockage period of8–9 h (Fig. 2). When released from thymidine block, 20% ofthe cells entered the S phase, followed by less than 10% of thecells entering the G2/M phase. Slight differences were foundafter 10 h of interblockage time. All experiments carried out
with synchronized cultures were performed within 9 h of in-terblockage.
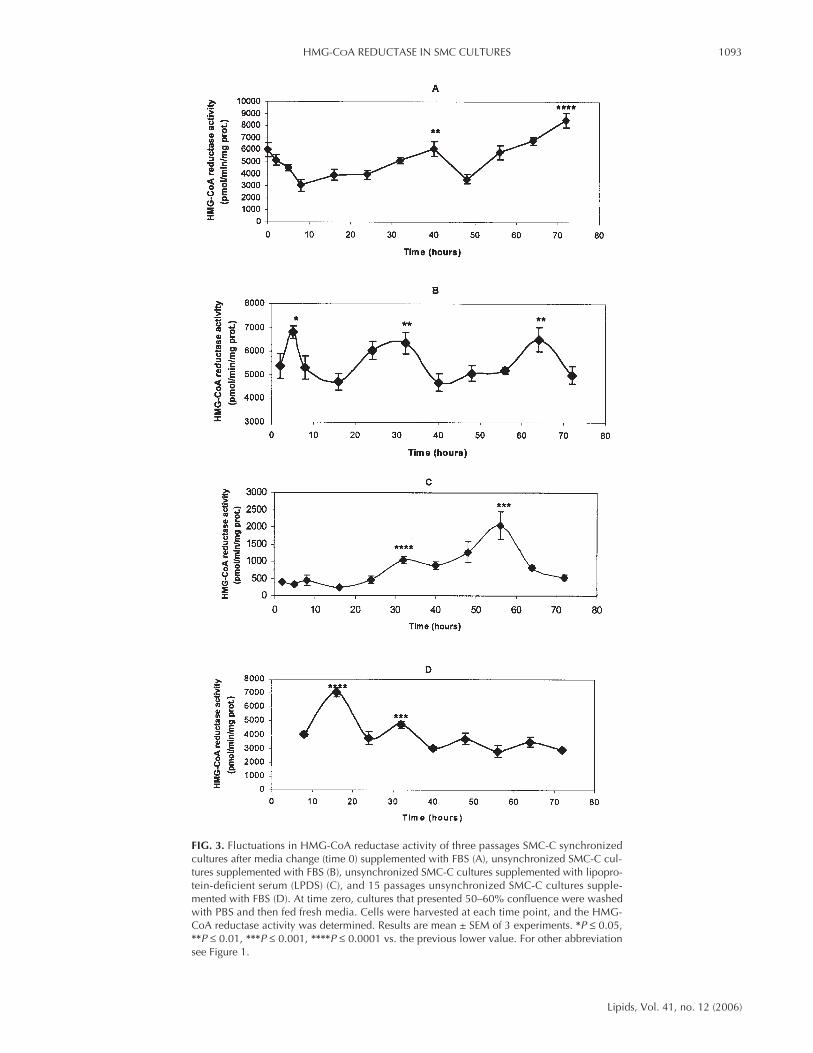
Effect of medium change on HMG-CoA reductase activity.Control SMC (SMC-C) cultures isolated from control chickswere prepared and at the third passage were assayed for HMG-CoA reductase activity. SMC-C shows cyclic fluctuations inHMG-CoA reductase activity although the period and ampli-tude of oscillations vary depending on culture conditions(LPDS or FBS, young or senescent, synchronized or unsyn-chronized). Figure 3 represents HMG-CoA reductase activitymeasured at different times during 72 h after the mediumchange (time zero) in synchronized cultures with FBS (A), un-synchronized cultures with FBS (B), unsynchronized cultureswith LPDS (C), and 15 passages of unsynchronized cultureswith FBS (D). Figure 3A shows the fluctuations of HMG-CoAreductase activity in synchronized cultures decreasing at thetime of the medium change followed by a 50% increase in ac-tivity at 40 h and more than 50% at 72 h. Figure 3B shows thatunsynchronized SMC-C cultures with FBS present a peak ofHMG-CoA reductase activity after 5 h of the medium change(increasing around 30%). This first peak is followed by twomore peaks at 32 and 64 h of around 30% of reductase activity.However, in the presence of LPDS (Fig. 3C), the absence ofcholesterol produces a great induction of the reductase activityafter 58 h of media change. HMG-CoA reductase activity mea-sured in 15-passage cultures (Fig. 3D) shows the first peak 16h after the medium change, followed by very low activity af-terward that was minimal at 72 h.
Changes on HMG-CoA reductase activity in SMC-Ch andSMC-C cultures. SMC-C cultures and SMC cultures from cho-lesterol-fed chicks (SMC-Ch) at the third passage were assayedfor HMG-CoA reductase activity. Table 1 shows HMG-CoAreductase activity measured at different times after the mediumchange for 12 h, reflecting first that the reductase activity washigher in SMC-C than in SMC-Ch at each time studied. More-over, Table 1 shows the rise in reductase activity at the time of
1092 M.J. ALEJANDRE ET AL.
Lipids, Vol. 41, no. 12 (2006)
FIG. 1. Cell cycle of third passage smooth muscle cell–control fed(SMC-C) cultures at different confluence. Cells were fixed in ethanoland stained with propidium iodide prior to DNA content analysis byflow cytometry.
FIG. 2. Cell cycle of synchronized SMC-C cultures. Three passage cul-tures were grown in DMEM with 10% FBS and synchronized by thedouble double thymidine (dThd) block procedure with 8, 9, and 10 h ofinterblockage. Four hours after the second block was released, cellswere fixed in ethanol and stained with propidium iodide prior to DNAcontent analysis by flow cytometry. For other abbreviation see Figure 1.
HMG-COA REDUCTASE IN SMC CULTURES 1093
Lipids, Vol. 41, no. 12 (2006)
FIG. 3. Fluctuations in HMG-CoA reductase activity of three passages SMC-C synchronizedcultures after media change (time 0) supplemented with FBS (A), unsynchronized SMC-C cul-tures supplemented with FBS (B), unsynchronized SMC-C cultures supplemented with lipopro-tein-deficient serum (LPDS) (C), and 15 passages unsynchronized SMC-C cultures supple-mented with FBS (D). At time zero, cultures that presented 50–60% confluence were washedwith PBS and then fed fresh media. Cells were harvested at each time point, and the HMG-CoA reductase activity was determined. Results are mean ± SEM of 3 experiments. *P ≤ 0.05,**P ≤ 0.01, ***P ≤ 0.001, ****P ≤ 0.0001 vs. the previous lower value. For other abbreviationsee Figure 1.

medium change not only in SMC-C but also in SMC-Ch cul-tures.
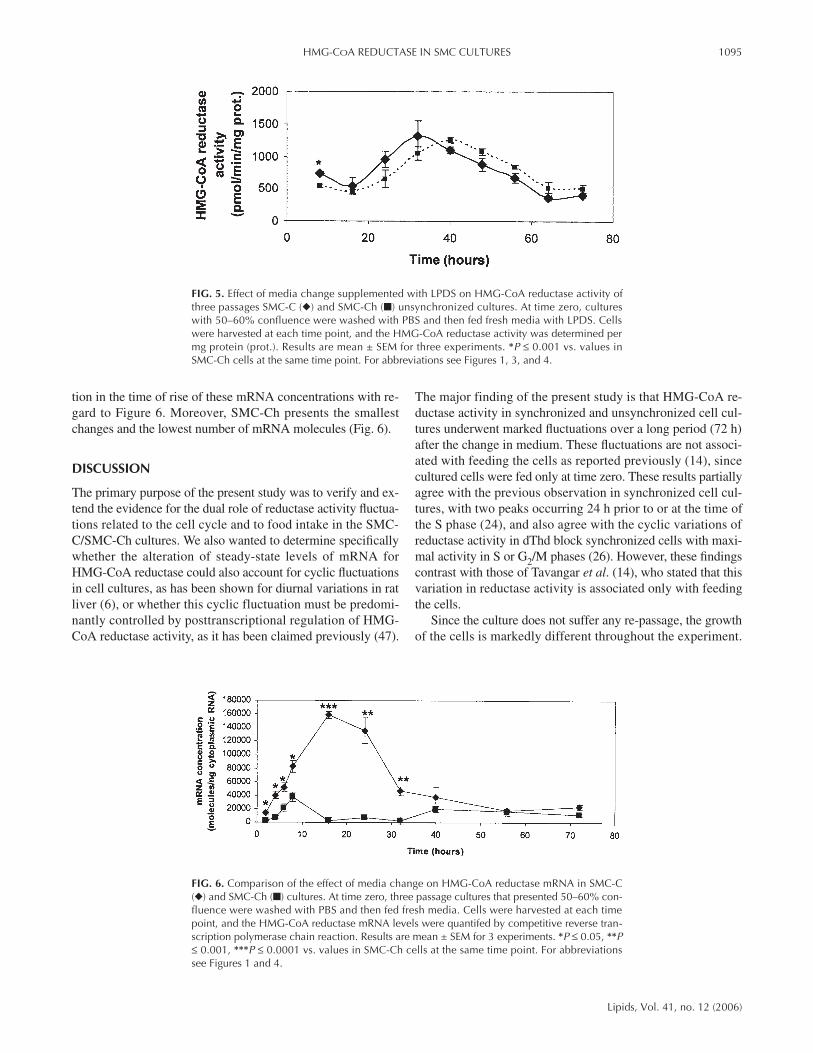
In senescent cultures (15 passages; Fig. 4), both SMC-C andSMC-Ch present lower reductase activity than in young cul-tures, and an activity peak only at 30 h after a change inmedium, followed by return to basal values at 48 h. In experi-ments performed with LPDS, HMG-CoA reductase activitywas induced 30 h after the medium change in SMC-C (P ≤0.05) and 40 h after the medium change in SMC-Ch cultures(P ≤ 0.0001) (Fig. 5).
HMG-CoA reductase gene expression in SMC-C and SMC-Ch cultures after medium change. To measure the HMG-CoAreductase gene expression in chick aorta SMC at several timesafter re-feeding cultures, the HMG-CoA mRNA of SMC-Chand SMC-C of three passage cultures was measured by RT-
PCR. The quantification of HMG-CoA reductase mRNAshowed that the mRNA levels from young SMC-C culturesrose markedly after 16 h of medium change (P ≤ 0.0001), re-turning to basal values by 56 h (Fig. 6). This rise in the numberof HMG-CoA reductase mRNA molecules occurred also inyoung SMC-Ch cultures after a change of medium but regis-tered far lower levels with smaller increases in reductasemRNA after 8 h of medium change in SMC-Ch (P ≤ 0.001)(Fig. 6).
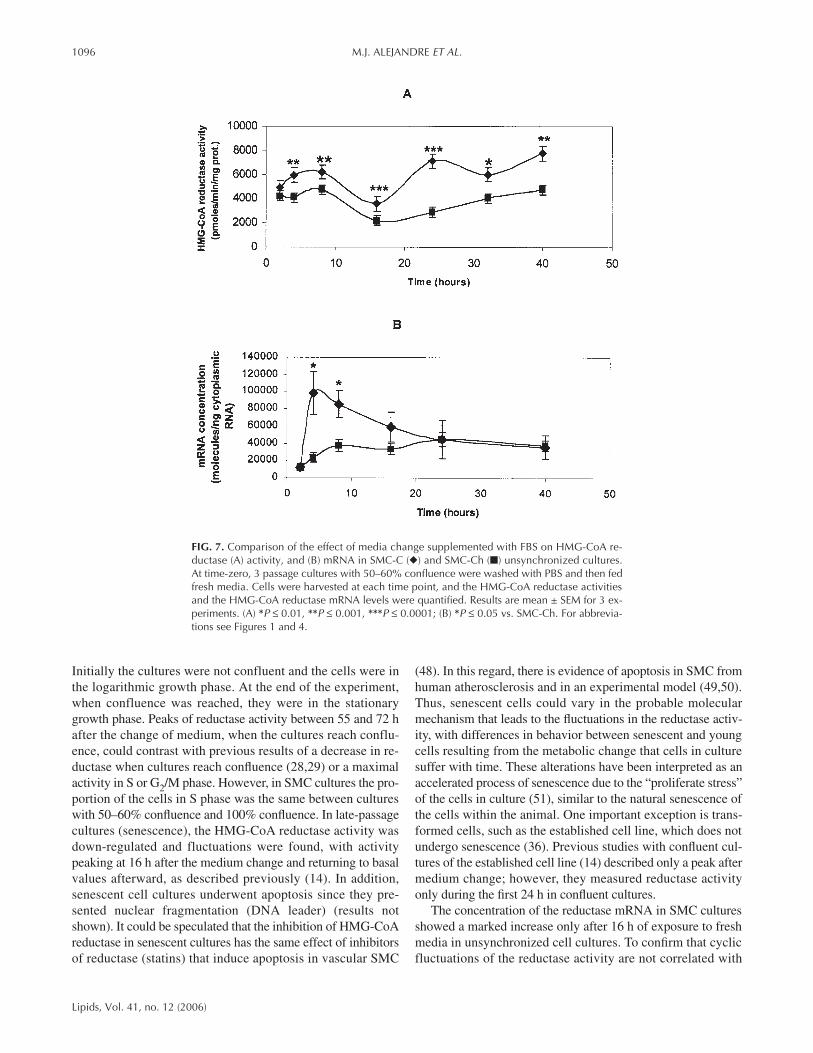
Under normal culture conditions, HMG-CoA reductase ac-tivity varied widely among experiments. To examine whetherthe cyclic fluctuation found in HMG-CoA reductase activityafter medium change in SMC-C cultures occurred also inSMC-Ch, and to determine their possible correspondence withchanges in mRNA concentration, we prepared three passagecultures isolated from cholesterol-fed chicks (SMC-Ch) andcontrol-fed chicks (SMC-C). The reductase activity was mea-sured after medium change (time zero) in SMC-C and SMC-Ch cultures at different times during 40 h. A parallel experi-ment was performed to measure the reductase mRNA concen-tration (Fig. 7). Although the magnitude of the fluctuationsvaried somewhat among SMC-C and SMC-Ch (Fig. 7A), in-creases of reductase activity fluctuated over the study period.The greatest change and the highest reductase activity occurredin SMC-C with cultures of three passages vs. SMC-Ch (Fig.7A). Figure 7B shows a comparison in HMG-CoA reductasemRNA in both SMC-C and SMC-Ch cultures; the increases ofreductase mRNA after medium change in SMC-Ch and SMC-C young cultures was similar to the results shown in Figure 6.SMC-C cultures showed a large rise after a change in medium,returning to basal values afterward. However, there was varia-
1094 M.J. ALEJANDRE ET AL.
Lipids, Vol. 41, no. 12 (2006)
TABLE 1 HMG-CoA Reductase Activity in Aortic Smooth Muscle Cell (SMC)Cultures from Control Fed Chicks (C-SMC) and CholesterolFed Chicksa (Ch-SMC)
HMG-CoA reductase activity(pmol·min–1·mg prot–1)
Time (h) SMC-C SMC-Ch
2 9766.2 ± 689 6310.7 ± 520
6 7669.9 ± 888 5856.9 ± 528
12 8433.9 ± 1015 6943.4 ± 616aAt time zero, monolayers of three passage cultures that presented 60% con-fluence were washed with PBS and then fed fresh media. Cells were har-vested and the reductase activity was measured at 2, 6, and 12 h after themedia change. Results are mean ± SEM for 2 experiments with at least 5 val-ues each for each experiment.
FIG. 4. Variations in HMG-CoA reductase activity of 15 passages SMC-C (◆) and smooth mus-cle cell–cholesterol-fed (SMC-Ch) (■) unsynchronized cultures after media change supple-mented with FBS. At time-zero, cultures with 50–60% of confluence were washed with PBSand then fed with fresh media. Cells were harvested at each time point, and the HMG-CoA re-ductase activity was determined. Results are mean ± SEM for 3 experiments. *P ≤ 0.001, **P ≤0.0001 vs. SMC-Ch. For other abbreviation see Figure 1.
tion in the time of rise of these mRNA concentrations with re-gard to Figure 6. Moreover, SMC-Ch presents the smallestchanges and the lowest number of mRNA molecules (Fig. 6).
DISCUSSION
The primary purpose of the present study was to verify and ex-tend the evidence for the dual role of reductase activity fluctua-tions related to the cell cycle and to food intake in the SMC-C/SMC-Ch cultures. We also wanted to determine specificallywhether the alteration of steady-state levels of mRNA forHMG-CoA reductase could also account for cyclic fluctuationsin cell cultures, as has been shown for diurnal variations in ratliver (6), or whether this cyclic fluctuation must be predomi-nantly controlled by posttranscriptional regulation of HMG-CoA reductase activity, as it has been claimed previously (47).
The major finding of the present study is that HMG-CoA re-ductase activity in synchronized and unsynchronized cell cul-tures underwent marked fluctuations over a long period (72 h)after the change in medium. These fluctuations are not associ-ated with feeding the cells as reported previously (14), sincecultured cells were fed only at time zero. These results partiallyagree with the previous observation in synchronized cell cul-tures, with two peaks occurring 24 h prior to or at the time ofthe S phase (24), and also agree with the cyclic variations ofreductase activity in dThd block synchronized cells with maxi-mal activity in S or G2/M phases (26). However, these findingscontrast with those of Tavangar et al. (14), who stated that thisvariation in reductase activity is associated only with feedingthe cells.
Since the culture does not suffer any re-passage, the growthof the cells is markedly different throughout the experiment.
HMG-COA REDUCTASE IN SMC CULTURES 1095
Lipids, Vol. 41, no. 12 (2006)
FIG. 5. Effect of media change supplemented with LPDS on HMG-CoA reductase activity ofthree passages SMC-C (◆) and SMC-Ch (■) unsynchronized cultures. At time zero, cultureswith 50–60% confluence were washed with PBS and then fed fresh media with LPDS. Cellswere harvested at each time point, and the HMG-CoA reductase activity was determined permg protein (prot.). Results are mean ± SEM for three experiments. *P ≤ 0.001 vs. values inSMC-Ch cells at the same time point. For abbreviations see Figures 1, 3, and 4.
FIG. 6. Comparison of the effect of media change on HMG-CoA reductase mRNA in SMC-C(◆) and SMC-Ch (■) cultures. At time zero, three passage cultures that presented 50–60% con-fluence were washed with PBS and then fed fresh media. Cells were harvested at each timepoint, and the HMG-CoA reductase mRNA levels were quantifed by competitive reverse tran-scription polymerase chain reaction. Results are mean ± SEM for 3 experiments. *P ≤ 0.05, **P≤ 0.001, ***P ≤ 0.0001 vs. values in SMC-Ch cells at the same time point. For abbreviationssee Figures 1 and 4.
Initially the cultures were not confluent and the cells were inthe logarithmic growth phase. At the end of the experiment,when confluence was reached, they were in the stationarygrowth phase. Peaks of reductase activity between 55 and 72 hafter the change of medium, when the cultures reach conflu-ence, could contrast with previous results of a decrease in re-ductase when cultures reach confluence (28,29) or a maximalactivity in S or G2/M phase. However, in SMC cultures the pro-portion of the cells in S phase was the same between cultureswith 50–60% confluence and 100% confluence. In late-passagecultures (senescence), the HMG-CoA reductase activity wasdown-regulated and fluctuations were found, with activitypeaking at 16 h after the medium change and returning to basalvalues afterward, as described previously (14). In addition,senescent cell cultures underwent apoptosis since they pre-sented nuclear fragmentation (DNA leader) (results notshown). It could be speculated that the inhibition of HMG-CoAreductase in senescent cultures has the same effect of inhibitorsof reductase (statins) that induce apoptosis in vascular SMC
(48). In this regard, there is evidence of apoptosis in SMC fromhuman atherosclerosis and in an experimental model (49,50).Thus, senescent cells could vary in the probable molecularmechanism that leads to the fluctuations in the reductase activ-ity, with differences in behavior between senescent and youngcells resulting from the metabolic change that cells in culturesuffer with time. These alterations have been interpreted as anaccelerated process of senescence due to the “proliferate stress”of the cells in culture (51), similar to the natural senescence ofthe cells within the animal. One important exception is trans-formed cells, such as the established cell line, which does notundergo senescence (36). Previous studies with confluent cul-tures of the established cell line (14) described only a peak aftermedium change; however, they measured reductase activityonly during the first 24 h in confluent cultures.
The concentration of the reductase mRNA in SMC culturesshowed a marked increase only after 16 h of exposure to freshmedia in unsynchronized cell cultures. To confirm that cyclicfluctuations of the reductase activity are not correlated with
1096 M.J. ALEJANDRE ET AL.
Lipids, Vol. 41, no. 12 (2006)
FIG. 7. Comparison of the effect of media change supplemented with FBS on HMG-CoA re-ductase (A) activity, and (B) mRNA in SMC-C (◆) and SMC-Ch (■) unsynchronized cultures.At time-zero, 3 passage cultures with 50–60% confluence were washed with PBS and then fedfresh media. Cells were harvested at each time point, and the HMG-CoA reductase activitiesand the HMG-CoA reductase mRNA levels were quantified. Results are mean ± SEM for 3 ex-periments. (A) *P ≤ 0.01, **P ≤ 0.001, ***P ≤ 0.0001; (B) *P ≤ 0.05 vs. SMC-Ch. For abbrevia-tions see Figures 1 and 4.
fluctuations of mRNA concentrations, these experiments wererepeated by assaying reductase activity and concomitantlymeasuring the mRNA concentration. Although with wide vari-ations in amplitude and periods of the cyclic activity amongexperiments, similar results were found in three additional ex-periments (not shown). We confirmed our observation of sev-eral peaks for reductase activity and one peak for mRNA con-centration. The first peak of reductase activity could be ex-plained by correlating feeding cells with the mRNAconcentration rise, but the following fluctuations in reductaseactivity, which did not correlate with fluctuations in mRNAconcentration, could not be explained by a contribution of ex-ogenous nutrients and were strongly suggestive of a posttran-scriptional modulation of the HMG-CoA reductase activity.The posttranscriptional modulation could be related to DNAsynthesis, because the S phase of the cell cycle in confluent cul-tures was the same as in 50% confluence. The posttranscrip-tional modulation of reductase activity has previously beensuggested (52) for feedback regulation of hepatic HMG-CoAreductase activity by dietary cholesterol.
Our results from the experiments with SMC-C vs. SMC-Chalso showed the effect of a high-cholesterol diet on the cyclicfluctuations of HMG-CoA reductase. In fact, we showed previ-ously that SMC-Ch develops the characteristics ofmacrophage-like foam cells after 30 d in culture under the sameculture conditions as the SMC-C (30). The SMC cultures usedin these studies were young (three passages), and the SMC-Cand SMC-Ch characteristics studied previously were identicaleven with respect to the intracellular cholesterol concentrationthat would become double in SMC-Ch after 20 d in culture, butit was identical during the first 14 d of culture (30). In the pre-sent study, we found a sharp decrease in HMG-CoA reductaseactivity and mRNA concentration in SMC-Ch vs. SMC-C inthree-passages cultures, this not being dependent on the intra-cellular cholesterol concentration. These observations were re-peated in experiments with senescent cultures except that, inthe experiments with LPDS, the induction of reductase activitywas similar in the two cultures.
These results suggest that the cholesterol diet induceschange in HMG-CoA reductase gene expression in SMC cul-tures before the morphologic transformation of the SMC in theartery wall (53). SMC in vivo were shown to increase choles-terol biosynthesis significantly and decrease the intracellularcholesterol efflux associated with phenotype changes in SMCin culture (54,55). In this work, however, it should be noted thatwe are making a comparison with an SMC-C culture that un-derwent the same phenotype modulation by cultured conditionsas the SMC-Ch. Thus, changes in HMG-CoA reductase activ-ity and gene expression at transcriptional levels in SMC-Chmust be due to the cholesterol feeding of the chicks. These ob-servations may be explained by the nutritional control by sterolregulatory element-binding proteins (SREBP), a family of tran-scription factors that bind to the sterol regulatory element(SRE) in the promoter of the HMG-CoA reductase gene. Thesetranscription factors have been defined as key regulators of nu-tritional homeostasis and, in response to diet, SREBP gene reg-
ulation depends on changes in the levels of oxysterols, in-sulin/glucose, and PUFA (56).
Although the reductase activity and the mRNA concentra-tion proved lower in SMC-Ch than in SMC-C, the fluctuationsin the activity and the increase in reductase mRNA concentra-tion after the medium change do not disappear in SMC-Ch.Even in senescent cultures, which present a high intracellularconcentration of cholesterol in SMC-Ch (30), the reductase ac-tivity was not completely inhibited. Moreover, in cultures withLPDS induction the reductase activity underwent the same risein SMC-C as in SMC-Ch after the change of the medium withFBS. These data agree with our results concerning the synthe-sis of cholesterol in the previously reported model of SMC-C/SMC-Ch cultures (31) and contrast with the general estab-lished decrease of HMG-CoA reductase activity and mRNA inhypercholesterolemic animals (57,58) or the depression of thediurnal rhythm after cholesterol-diet feeding (12–16). A possi-ble explanation is that SRE function as conditional positive el-ements and are necessary for activated transcription in sterol-deprived cells but are not required for basal transcription thatoccurs in cholesterol-loaded cells (55). These differences of thereductase activity and the mRNA concentration between SMC-C and SMC-Ch are more important in young cultures than insenescent ones. Since in three-passage cultures the intracellularcholesterol in SMC-C and SMC-Ch was the same, other expla-nations must be considered regarding the transformation of theaortic SMC by cholesterol diet in the chick prior to cell harvest.
The failure to abolish the fluctuations of reductase activityin young SMC-C cultures could have a plausible explanationin the continued cell proliferation after confluence (30). Thecell cycle of SMC-C in different confluence states of the cul-tures presents the same proportion of the cells in the S phase aswhen 100% confluence of the culture is reached. The mRNAconcentration from young SMC-C cultures presents a peakonly several hours after the medium change. However, it de-creases to baseline when the cultures are confluent, so at tran-scriptional levels the HMG-CoA reductase regulation is af-fected by the degree of confluence of the culture and could beunrelated to S phase of the cell cycle.
In conclusion, in cultured aortic SMC, the HMG-CoA re-ductase activity shows fluctuations not associated with feedingthe cells and that must be modulated at the posttranscriptionallevel. This fluctuation in activity changes with the culture con-ditions: young vs. senescent; synchronized vs. unsynchronized;LPDS vs. FBS; and confluent vs. nonconfluent. Moreover, ahigh-cholesterol diet in the animals before obtaining the SMCcultures induced changes in the HMG-CoA reductase gene ex-pression. Thus, the mRNA concentration was down-regulatedin SMC-Ch vs. SMC-C. Since the nutritional culture condi-tions, the intracellular cholesterol concentration, and the ultra-structural morphology were the same during the first days ofculture, this change in reductase gene expression must havebeen induced by the cholesterol diet in the aortic SMC in vivo,probably at the SREBP gene-expression level. New studieswould be necessary to demonstrate the implication of theSREBP’s gene expression as well as if new protein synthesis is
HMG-COA REDUCTASE IN SMC CULTURES 1097
Lipids, Vol. 41, no. 12 (2006)

required for the increase in the enzyme activity or if somepeaks of activity correlate with other regulatory events.Changes in mRNA stability may also contribute to the changesobserved in HMG-CoA reductase mRNA.
ACKNOWLEDGMENTS
We thank Maria Romero for kind help in cell cultures. This workwas supported partly by Junta de Andalucía (Group code CTS 168)and also from the Research grants from Dirección General de Inves-tigación, Ciencia y Tecnología (DGICYT: Grant Nº PB931160) andthe Instituto de Salud Carlos III (Grant Nº PI030829).
REFERENCES
1. Rodwell, V.W., Nordstrom, J.L., and Mitschelen, J.J. (1976)Regulation of HMG-CoA Reductase, Adv. Lipid Res. 14, 1–74.
2. Kandutsch, A.A., and Saucier, S.E. (1969) Prevention of Cyclicand Triton-Induced Increases and Sterol Synthesis byPuromycin, J. Biol. Chem. 244, 2299–2305.
3. Arce, V., Aguilera, J.A., Linares, A., and García-Peregrín, E.(1993) Diurnal Rhythm of the in vivo Acetate Metabolism toCO2 and Nonsaponifiable Lipids by Neonatal Chick, Arch. Int.Physiol. Biochim. Biophys. 101, 285–288.
4. Jurevics, H., and Morell, P. (1994) Sources of Cholesterol forKidney and Nerve During Development, J. Lipid Res. 35,112–120.
5. Ramírez, H., Alejandre, M.J., and García-Peregrín, E. (1982)Development of the Diurnal Rhythm of Chick 3-Hydroxy-3-methylglutaryl-CoA Reductase, Lipids 17, 434–436.
6. Juverics, H., Hostettler, J., Barrett, Ch., Morell, P., and Toews,A.D. (2000) Diurnal and Dietary-Induced Changes in Choles-terol Synthesis Correlate with Levels of mRNA for HMG-CoAReductase, J. Lipid Res. 41, 1048–1053.
7. Clarke, C.F., Edwards, P.A., Lan, S.F., Tanaka, R.D., and Fo-gelman, A.M. (1983) Regulation of 3-Hydroxy-3-methylglu-taryl-Coenzyme A Reductase mRNA Levels in Rat Liver, Proc.Natl. Acad. Sci. USA 80, 3305–3308.
8. Clarke, C.F., Fogelman, A.M., and Edwards, P.A. (1984) Diur-nal Rhythm of Rat Liver mRNAs Encoding 3-Hydroxy-3-methylglutaryl-Coenzyme A Reductase. Correlation of Func-tional and Total mRNA Levels with Enzyme Activity and Pro-tein, J. Biol. Chem. 259, 10439–10447.
9. Fukuda, H., and Iritani, N. (1991) Diurnal Variations of Li-pogenic Enzyme mRNA Quantities in Rat Liver, Biochim. Bio-phys. Acta 1086, 261–264.
10. Iritani, N. (1992) Nutritional and Hormonal Regulation of Li-pogenic-Enzyme Gene Expression in Rat Liver, Eur. J.Biochem. 205, 433–442.
11. Patel, D.D., Knight, B.L., Wiggins, D., Humphreys, S.M., andGibbons, G.F. (2001) Disturbances in the Normal Regulation ofSREBP-Sensitive Genes in PPARa-Deficient Mice, J. Lipid Res.42, 328–337.
12. Noble, R.C., and Cocchi, M. (1990) Lipid Metabolism and theNeonatal Chicken, Prog. Lipid Res. 29, 107–140.
13. Ramirez, H., Alejandre, M.J., Zafra, M.F., Segovia, J.L., andGracía-Peregrín, E. (1984) Relationship Between Inhibition of3-Hydroxy-3-methylglutaryl-CoA Reductase by CholesterolFeeding and Short-Term Change in Membrane Fluidity DuringNeonatal Development, Int. J. Biochem. 16, 291–295.
14. Tavangar, K., and Kraemer, F.B. (1988) The Regulation of Hy-droxymethylglutaryl-CoA Reductase in Cultured Cells,Biochim. Biophys. Acta 970, 251–261.
15. Gonzalez-Pacanowska, D., Aguilera, J.A, Arce, V., García-Martínez, J., Linares, A., and García-Peregrín, E. (1985) Studieson the Diurnal Rhythm of Mevalonate Metabolism by Sterol and
Nonsterol Pathways and of Mevalonate-Activating Enzymes,Int. J. Biochem. 17, 275–278.
16. Goldstein, J.L., and Brown M.S. (1990) Regulation of Meval-onate Pathway, Nature 343, 425–430.
17. Vallet, S.M., Sanchez, H.B., Rosenfeld, J.M., and Osborne, T.F.(1996) A Direct Role for Sterol Regulatory Element BindingProtein in Activation of 3-Hydroxy-3-methylglutaryl CoenzymeA Reductase Gene, J. Biol. Chem. 271, 12247–12253.
18. Choi, J.W., and Peffley, D.M. (1995) 3′-Untranslated SequencesMediate Post-Transcriptional Regulation of 3-Hydroxy-3-methylglutaryl-CoA Reductase mRNA by 25-Hydroxycholes-terol, Biochem. J. 30, 233–238.
19. Clarke, P.R., and Hardie, D.G. (1990) Regulation of HMG-CoAReductase: Identification of the Site Phosphorylated by theAMP-Activated Protein Kinase in vitro and in Intact Rat Liver,EMBO J. 9, 2439–2446.
20. Kumagai, H., Chun, M.T., and Simoni, R.D. (1995) MolecularDissection of the Role of the Membrane Domain in the Regu-lated Degradation of 3-Hydroxy-3-methylglutaryl Coenzyme AReductase, J. Biol. Chem. 270, 19107–19113.
21. Ness, G.C., and Chambers, C.M. (1996) The Diurnal Variationof Hepatic HMG-CoA Reductase Activity Is Due to Changes inthe Level of Immunoreactive Protein, Arch. Biochem. Biophys.323, 41–44.
22. Jenke, H.S., Löwel, M., and Berndt, J. (1981) In vivo Effect ofCholesterol Feeding on Short Term Regulation of Hepatic Hy-droxymethylglutaryl Coenzyme A Reductase During the Diur-nal Cycle, J. Biol. Chem. 266, 9622–9625.
23. Brown, M.S., Faust, J.R., and Goldstein, J.L. (1978) Inductionof 3-Hydroxy-3-methylglutaryl Coenzyme A Reductase Activ-ity in Human Fibroblasts Incubated with Compactin (ML-236B), a Competitive Inhibitor of the Reductase, J. Biol. Chem.253, 1121–1128.
24. Quesney-Huneeus, V., Wiley, M.H., and Siperstein, M.D.(1979) Essential Role for Mevalonate Synthesis in DNA Repli-cation, Proc. Natl. Acad. Sci. USA 76, 5056–5060.
25. Quesney-Huneeus, V., Galick, H.A., Siperstein, M.D., Erick-son, S.K., Spencer, T.A., and Nelson, J.A. (1983) The Dual Roleof Mevalonate in the Cell Cycle, J. Biol. Chem. 258, 378–385.
26. Roussillon, S., Astruc, M., Defay, R., Tabacik, C., Descomps,B., and Crastes de Paulet, A. (1983) DNA and CholesterolBiosynthesis in Synchronized Embryonic Rat Fibroblast. Tem-poral Relationships Between HMG-CoA Reductase Activity,Sterol Biosynthesis and Thymidine Incorporation into DNA,Biochim. Biophys. Acta 763, 1–10.
27. Brown, M.S., Dana, S.E., and Goldstein, J.L. (1973) Regulationof 3-Hydroxy-3-methyl-glutaryl Coenzyme A Reductase Activ-ity in Human Fibroblasts by Lipoproteins, Proc. Natl. Acad. Sci.USA 70, 2162–2166.
28. Cohen, D.C., Massoglia, S.L., and Gospodarowicz, D. (1982)Correlation Between Two Effects of High Density Lipoproteinson Vascular Endothelial Cells. The Induction of 3-Hydroxy-3-methylglutaryl Coenzyme A Reductase Activity and the Sup-port of Cellular Proliferation, J. Biol. Chem. 257, 9429–9437.
29. Harwood, H.J., Jr., Schneider, M., and Stacpoole, P.W. (1984)Measurement of Human Leukocyte Microsomal HMG-CoA Re-ductase Activity, J. Lipid Res. 25, 967–978.
30. Carazo, A., Alejandre, M.J., Díaz, R., Ríos, A., Castillo, M., andLinares, A. (1998) Changes in Cultured Arterial Smooth Mus-cle Cells Isolated from Chicks upon Cholesterol Feeding, Lipids33, 181–190.
31. Carazo, A., Alejandre, M.J., Louktibi, A., and Linares, A.(2001) The Reversal of the Inhibition on Lipids Synthesis by L-659,699 in Arterial Smooth Muscle Cells Cultures, Mol. Cell.Biochem. 221, 25–31.
32. Carazo, A., Alejandre, M.J., Suárez, M.D., and Linares, A.(2000) Alterations in 3-Hydroxy-3-methylglutaryl-CoA Reduc-
1098 M.J. ALEJANDRE ET AL.
Lipids, Vol. 41, no. 12 (2006)

tase mRNA Concentration in Cultured Chick Aortic SmoothMuscle Cells, Lipids 35, 587–593.
33. Habenicht, A.J.R., Glonset, J.A., and Ross, R. (1980) Relationof Cholesterol and Mevalonic Acid to the Cell Cycle in SmoothMuscle and Swiss 3T3 Cells Stimulated to Divide by Platelet-Derived Growth Factor, J. Biol. Chem. 255, 5134–5140.
34. Ross, R. (1971) The Smooth Muscle Cell II. Growth of SmoothMuscle in Culture and Formation of Elastic Fibres, J. Cell Biol.50, 172–186.
35. Chamley-Campbell, J.H., Campbell, G.R., and Ross, R. (1979)The Smooth Muscle Cell in Culture, Physiol. Rev. 58, 1–61.
36. Stein, G.S., Stein, J.L., Lian, J.B., Last, T.J., Owen, T., and Mc-Cabe, L. (1995) Cell Synchronization as a Basis for Investigat-ing Control of Proliferation in Mammalian Cells, Cell Growthand Apoptosis. A Practical Approach (Studzinski, G.P., ed.), pp.93–210, Oxford, University Press, New York.
37. Poumay, Y., and Ronveaux-Dupal, M.F. (1985) Rapid Prepara-tive Isolation of Concentrated Low Density Lipoproteins and ofLipoprotein-Deficient Serum Using Vertical Rotor Gradient, J.Lipids Res. 26, 1476–1480.
38. Hanon, E., Vanderplasschen, A., and Pastoret, P.P. (1996) TheUse of Flow Cytometry for Concomitant Detection of Apopto-sis and Cycle Analysis, Biochemica 2, 25–27.
39. Goldstein, J.L., Basu, S.K., and Brown, M.S. (1983) Receptor-Mediated Endocytosis of Low-Density-Lipoprotein in CulturedCells, Methods Enzymol. 98, 241–260.
40. Bradford, M. (1976) A Rapid and Sensitive Method for theQuantitation of Microgram Quantities of Protein Utilizing thePrinciple of Protein-Dye Binding, Anal. Biochem. 72, 248–254.
41. Chomczinski, P., and Sacchi, N. (1987) Single-step Methods ofRNA Isolation by Acid Guanidinium Thiocyanate-Phenol-Chlo-roform Extraction, Anal. Biochem. 162, 156–159.
42. Jiang, Y.H., Davidson, L.A., Lupton, J.R., and Chapkin, R.S.(1996) Rapid Competitive PCR Determination of Relative GeneExpression in Limiting Tissue Samples, Clin. Chem. 42,227–231.
43. Sanger, F., Nicklen, S., and Coulson, A.R. (1977) DNA Se-quencing with Chain-Terminating Inhibitors, Proc. Natl. Acad.Sci. USA 74, 5463–5467.
44. Myers, T.W., and Geldfand, D.H. (1991) Reverse Transcriptionand DNA Amplification by a Thermus thermophilus DNA Poly-merase, Biochemistry 30, 7661–7666.
45. Gebhardt, A., Peters, A., Gerding, D., and Niendorf, A. (1994)Rapid Quantitation of mRNA Species in Ethidium Bromide-Stained Gels of Competitive RT-PCR Products, J. Lipids Res.35, 977–981.
46. Raeymaekers, L. (1993) Quantitative PCR: Theoretical Consid-erations with Practical Implications, Anal.Biochem. 214,582–585.
47. Spady, D.K., and Cuthbert, J.A. (1992) Regulation of Hepatic
Sterol Metabolism in the Rat. Parallel Regulation of Activityand mRNA for 7-Alpha-hydroxylase but Not 3-Hydroxy-3-methylglutaryl-Coenzyme A Reductase or Low DensityLipoprotein Receptor, J. Biol. Chem. 267, 5584–5591.
48. Blanco-Colio, L.M., Villa, A., Ortego, M., Hernandez-Presa,M.A., Pascual, A., Plaza, J.J., and Egido, J. (2002) 3-Hydroxy-3-methyl-glutaryl Coenzyme A Reductase Inhibitors, Atorvas-tatin and Simvastatin, Induce Apoptosis of Vascular SmoothMuscle Cells by Downregulation of Bcl-2 eEpression and RhoA Prenylation, Atherosclerosis 161, 17–26.
49. Han, D.K., Haudenschild, C.C., Hong, M.K., Tinkle, T.B.,Leon, M.B., and Liau, G. (1995) Evidence for Apoptosis inHuman Atherogenesis and in a Rat Vascular Injury Model, Am.J. Pathol. 147, 267–277.
50. Bennet, M.R., Evan, G.I., and Schwartz, S.M. (1995) Apoptosisof Human Vascular Smooth Muscle Cells Derived from NormalVessels and Coronary Atherosclerotic Plaques, J. Clin. Invest.95, 2266–2274.
51. Goldstein, S. (1990) Replicative Senescence: The Human Fi-broblast Comes of Age, Science 249, 1129–1133.
52. Ness, G.C., Keller, R.K., and Pendleton, L.C. (1991) FeedbackRegulation of Hepatic 3-Hydroxy-3-methylglutaryl-CoA Re-ductase Activity by Dietary Cholesterol Is Not Due to AlteredmRNA Levels, J. Biol. Chem. 266, 14854–14857.
53. Linares, A., Perales, S., Palomino-Morales, R.J., Castillo, M.,and Alejandre, M.J. (2006) Nutritional Control, Gene Regula-tion and Transformation of Vascular Smooth Muscle Cells inAtherosclerosis, Cardiovasc. Hematol. Disord. Drugs Targets6, 151–168.
54. Dusserre, E., Bourdillon, M.C., Pulcini, T., and Berthezene, F.(1994) Decrease in High Density Lipoprotein Binding Sites IsAssociated with Decrease in Intracellular Cholesterol Efflux inDedifferentiated Aortic Smooth Muscle Cells, Biochim. Bio-phys. Acta 1212, 235–244.
55. Dusserre, E., Bourdillon, M.C., Ciavatti, M., Covacho, C., andRenaud, S. (1993) Lipids Biosynthesis in Cultured ArterialSmooth Muscle Cells Is Related to Their Phenotype, Lipids 28,589–592.
56. Osborne, T.F. (2000) Sterol Regulatory Element-Binding Pro-teins (SREBPs): Key Regulators of Nutritional Homeostasis andInsulin Action, J. Biol. Chem. 275, 32379–32382.
57. Simonet, W.S., and Ness, G.C. (1989) Post-transcriptional Reg-ulation of 3-Hydroxy-3-methylglutaryl-Coenzyme A ReductasemRNA in Rat Liver, J. Biol. Chem. 264, 569–573.
58. Sheng, Z., Otani, H., Brown, M.S., and Golstein, J.L. (1995) In-dependent Regulation of Sterol Regulatory Element-BindingProtein 1 and 2 in Hamster Liver, Proc. Natl. Acad. Sci. USA 92,935–938.
[Received January 26, 2006; accepted November 27, 2006]
HMG-COA REDUCTASE IN SMC CULTURES 1099
Lipids, Vol. 41, no. 12 (2006)
Copyright © 2022 FDOKUMEN