
CWE Flow Based Market- coupling project: Parallel Run ...
57
CWE Flow Based Market- coupling project: Parallel Run performance report
-
Upload
khangminh22 -
Category
Documents
-
view
3 -
download
0
Transcript of CWE Flow Based Market- coupling project: Parallel Run ...

CWE Flow Based Market- coupling project:
Parallel Run performance report
2
EXECUTIVE SUMMARY
While the FB parallel run has been carried out for 18 months and FB is now entering the last stage of the approval process, some specific aspects of the method and remarkable outputs of FB market coupling need to be addressed in more detail:
• The need to rely on a so-‐called LTA coverage algorithm (chapter 2.2)
• Individual days from the daily parallel run where the FBMC (Flow Based Market Coupling) resulted in either a lower or significantly higher market surplus (i.e. sum of DA Seller + Buyer welfare) than ATC MC. Chapter 3.2 focusses on the days resulting in welfare loss, whereas chapter 3.3 focusses on some days resulting in remarkable welfare gains. The aim of the analysis is to:
o Better understand the parallel run results;
o Clarify the methodological differences between ATC and FB
o Identify improvements for the FB method or process;
LTA coverage
An observation from the FB parallel run is the frequent usage of a so-‐called “automatic LTA coverage” algorithm, an automated process through which the FB domain is artificially enlarged to cover the LTA domain in cases where it was not covered already. This process is a strict alignment with the current situation in ATC MC, where the eventual daily NTCs cannot be curtailed below the LTAs. In FB, this usage can be explained in the majority of cases by the notion of “unlikely corners” that correspond to operating conditions/market configurations that are seen to be unrealistic when getting closer to real time, and for which the natural FB process cannot provide representative capacities. However, for a certain number of hours the LTA coverage algorithm is required to cover the LTA domain in “likely corners” – i.e., where operating conditions may reasonably be expected to apply. The project parties have set an objective that the occurrence of needing to apply LTA coverage tools for “likely corners” should be reduced to near 0% of hours in the future, e.g. comparable to risk of red flag in the ATC environment. The extent to which LT rights are automatically covered (by means of adding “virtual critical branches” or adjusting the FAV) raises legitimate concern since it could imply, in some cases, very limited capacities available for DA MC. Such situation could become particularly sensitive if: -‐ Automatic LTA coverage is in a likely corner important for a smaller market that depends on a
certain level of import (or export) capacities for reliable DA price formation -‐ This is combined with a change of behaviour of market players regarding an increased usage of LT
nomination could result in very limited capacities for DA market coupling (or in extreme LT nomination assumptions even to zero capacity).

3
While the behaviour of market parties is difficult to anticipate and the evaluation of origin is complex, project parties are committed to ensure that FB does not jeopardise the quality of price formation in all markets, maintaining a special attention to the consistency between LTA and FBP in likely market directions and to put in place appropriate mitigation measures. In this regard, the project parties are to begin evaluating the implementation of FTRs.
Welfare investigations
Negative welfare investigation
For the benefit of the welfare analyis, a simplified framework has been used to structure and understand, on a case-‐by-‐case basis, where the concrete differences lay, and then to identify potential improvements.
A part of the cause of loss in market surplus is a direct result from fundamental differences between ATC and Flow Based method. Flow Based provides the ability to more accuratly monitor available capacities based on among others the number of timestamps and lines observed. It thereby better includes the increased complexities for TSOs' grid operation and in the same time fosters a stricter application of TSOs risk policies, meaning a better control on the events potentially affecting the grid. For example for some days remedial actions that may be implicitly assumed in ATC operation are explicitly excluded from the FB method, as a strict application of a TSO risk policy.
These fundamental differences are an integral part of the change to the Flow based method. For some cases the ‘better’ results in ATC may have been actually achieved with internal redispatch or some “extreme” remedial actions, which is not reflected when defining the height of welfare gain. The observed losses of welfare gain could therefore be seen:
1-‐ in the context of some real-‐time situations resulting from ATC MC and implying additional costs or operational risks legitimately not taken into account when computing FB parameters.
2-‐ and also with the awareness that under FB MC a more sophisticated/ better reflection of grid operational circumstances and stricter application of TSOs risks policies were taken into account when delivering the grid capacities for market coupling.
Looking at the overall results it can be seen that these fundamental differences are in favor of Flow Based, in general leading to better results in terms of security of supply as well as market surplus compared to ATC.
Positive welfare investigation
The different business days that have been investigated are all characterized by the following aspects: • These days have relatively high RES infeed • In NTC, mainly the Dutch import and German export are lowered as a consequence • Except for May 8th they are weekend days
In Flow based methodology, the Dutch import and German export capacities are not lowered – to the same extent – due to physics of the grid and the differences in methodology with NTC. This is the main driver of the significant differences observed in social welfare between ATC and Flow based.

4
The results from the Security of Supply assessment done for all these days support this as it can be concluded that the situations would be manageable with Flow based.
Next steps
For the majority of the causes for loss in social welfare in Flow Based compared to ATC, improvements have been identified and planned. For instance, CWE TSOs have launched short-‐term actions related to the quality of D2CFs and to the application of more coordination in the usage of Remedial Actions.
Finally, it has to be noted that in general TSOs are continuously investigating possibilities to further advance methodologies to ensure that the capacities provided reflect optimally the grid capabilities in real-‐time, including TSOs’ security standards and the potential to better optimise the use of Remedial Actions. This is ongoing work and will continue after Flow Based Go Live. In parallel, an on-‐going monitoring framework, independent from the provision of ATCs (and in this respect applicable after Go Live) is proposed at the end of the document.

5
Contents 1 Introduction ........................................................................................................................................................................... 7 2 Parallel Run performance ...................................................................................................................................................... 7
2.1 FB and ATC domains comparison ................................................................................................................................... 7 2.2 Focus on LTA coverage ................................................................................................................................................... 8
2.2.1 Rationale behind the coverage of LTA .................................................................................................................... 8 2.2.2 LTA coverage in practice: FAV and virtual CBs ...................................................................................................... 10 2.2.3 Frequency of applying automatic LTA inclusion .................................................................................................... 12 2.2.4 Market impact of LTA coverage ............................................................................................................................ 14 2.2.4.1 Examples of LTA violations ..................................................................................................................................... 16 2.2.5 LTA impact on DA market welfare ........................................................................................................................ 17 2.2.6 Discussion .............................................................................................................................................................. 18 2.2.6.1 LTA interaction with LT nominations .................................................................................................................... 18 2.2.6.2 Mitigations ............................................................................................................................................................ 23 2.2.7 Outlook .................................................................................................................................................................. 23
2.3 General conclusion on ATC/LTA – FB comparison ........................................................................................................ 24 3 Special welfare investigations .............................................................................................................................................. 25
3.1 Reminder: methodological differences between ATC and Flow Based (FB) ................................................................. 25 3.1.1 Harmonization and coordination .......................................................................................................................... 25 3.1.2 Accuracy of the models ......................................................................................................................................... 26 3.1.3 Usage of Common Grid Model (CGM) in D-‐2 (D2CF) ............................................................................................ 27 3.1.4 Monitored elements ............................................................................................................................................. 28 3.1.5 Reliability margins (FRM) ...................................................................................................................................... 29 3.1.6 Remedial Actions (RA): .......................................................................................................................................... 30 3.1.7 High-‐level differences between ATC and FB: a simplified framework .................................................................. 31
3.2 “Negative Welfare” investigations ............................................................................................................................... 32 3.2.1 Presentation of the study ...................................................................................................................................... 32 3.2.2 Case by case analyses ............................................................................................................................................ 33 3.2.3 Synthesis ............................................................................................................................................................... 43
3.3 Remarkable welfare gains ............................................................................................................................................ 44 3.3.1 Principles of the investigations ............................................................................................................................. 44 3.3.2 Case by case analysis ............................................................................................................................................. 45 3.3.3 Conclusion on “highly positive welfare” days ....................................................................................................... 48
4 Next steps ............................................................................................................................................................................ 48 4.1 Identified improvements and associated work plan .................................................................................................... 48
4.1.1 Inputs quality ........................................................................................................................................................ 48 4.1.2 Synthesis on section 3.1 ........................................................................................................................................ 50

6
4.2 Monitoring FB performance after Go Live .................................................................................................................... 52 4.2.1 Ex-‐post monitoring ................................................................................................................................................ 53 4.2.2 Operational (process) monitoring ......................................................................................................................... 54 4.2.3 Operational (FB parameters) monitoring .............................................................................................................. 55

7
1 Introduction The FB parallel run has been carried out for 18 months and FB is now entering the last stage of the approval process. During this period project parties demonstrated that globally the FB method results in a significant increase in welfare (95M€ for 20131) and that CWE prices converge more frequently to a single CWE price. However some specific aspects of the method and remarkable outputs of FB market coupling needed to be addressed in more details :
-‐ The need to rely on a so-‐called LTA coverage algorithm (chapter 2.2)
-‐ The observed days resulting in welfare losses from ATC to FB (chapter 3.2)
-‐ Some observed days resulting in remarkable welfare gains (chapter 3.3)
The last chapter of this report will then build upon the previous elements in order to provide explanations related to the differences observed in the respective ATC and FB approaches and to, on some aspects, propose some improvements with associated workplan.
2 Parallel Run performance
2.1 FB and ATC domains comparison An extensive comparison of the two models is already carried out in the parallel run, so a complementary approach is proposed below to gain insight in the differences between ATC solutions and FB domains more directly. We propose a “distance” (or “slack”) between the FB domain and the ATC clearing point, with the following conventions: For all hours and all cb
• Where o RAM_cb is the margin of the critical branch cb o PTDF_z/cb is the flow factor of critical branch cb for net position z o Nex_z/ATC is the net position of the observed CWE day ahead market results
Slack_cb is the remaing slack on the critical branch cb
• Positive distance (ATC inside): maximum hourly slack • Negative distance (ATC outside): minimum hourly slack
For each hour and each presolved CB a slack_cb is calculated. The maximum value of all slack_cb values is determined as well as the minimum value. If the minimum value is zero or positive, the ATC MC point was inside the FB domain. By not looking strictly at ATC violations, it is believed that this indicator provides a fairer, more global approach on parallel run performance.
1 See approval document chapter 9: http://www.casc.eu/media/140801%20CWE%20FB%20MC%20Approval%20document.pdf
∑ ⋅−=z
ATCz
cbzcbcb nexPTDFRAMslack
∑ ⋅−=z
ATCz
cbzcbcb nexPTDFRAMslack

8
Two striking observations can be made on this graph: -‐ Existence of “negative” values -‐ The important variability of FB parameters when compared to ATC The ambition of the present report is to bring elements of understanding with respect to the two abovementioned observations.
2.2 Focus on LTA coverage
2.2.1 Rationale behind the coverage of LTA “LTA coverage” method consists in enlarging the FB domain so as to cover long term allocated capacities when they are not fully encompassed by the former. Note that a similar process exists today in ATC, although in this process daily ATCs are adjusted to be at least equal to the LTA2. This coverage is performed automatically during the final step of the capacity calculation process (just before adjustment to LT nominations), in case some parts of the FB domain are exceeded by LT allocated capacities (which means that the realization of some long term rights would result in overloads on some flow based critical branches, that is a so called “LTA check failure”). There are two ways to perform this automatic inclusion:
2 An observation can be made that under ATC this process was never required (with the exception of two days in February 2011 where capacities were reduced below the levels of LT allocation)
-‐800
-‐600
-‐400
-‐200
0
200
400
600
800
01-‐Jan-‐13
15-‐Jan-‐13
07-‐Feb
-‐13
21-‐Feb
-‐13
09-‐M
ar-‐13
02-‐Apr-‐13
17-‐Apr-‐13
04-‐M
ay-‐13
30-‐M
ay-‐13
16-‐Jun
-‐13
03-‐Jul-‐13
17-‐Jul-‐13
02-‐Aug-‐13
18-‐Aug-‐13
01-‐Sep
-‐13
20-‐Sep
-‐13
08-‐Oct-‐13
22-‐Oct-‐13
07-‐Nov-‐13
21-‐Nov-‐13
05-‐Dec-‐13
19-‐Dec-‐13
02-‐Jan-‐14
19-‐Jan-‐14
03-‐Feb
-‐14
18-‐Feb
-‐14
05-‐M
ar-‐14
20-‐M
ar-‐14
03-‐Apr-‐14
19-‐Apr-‐14
03-‐M
ay-‐14
17-‐M
ay-‐14
01-‐Jun
-‐14
15-‐Jun
-‐14
29-‐Jun
-‐14
13-‐Jul-‐14
27-‐Jul-‐14
10-‐Aug-‐14
slack (= RAM -‐PT
DF * ne
x)
Min of neg
Max of pos
Values
applyingDate
Max of pos Min of neg
9
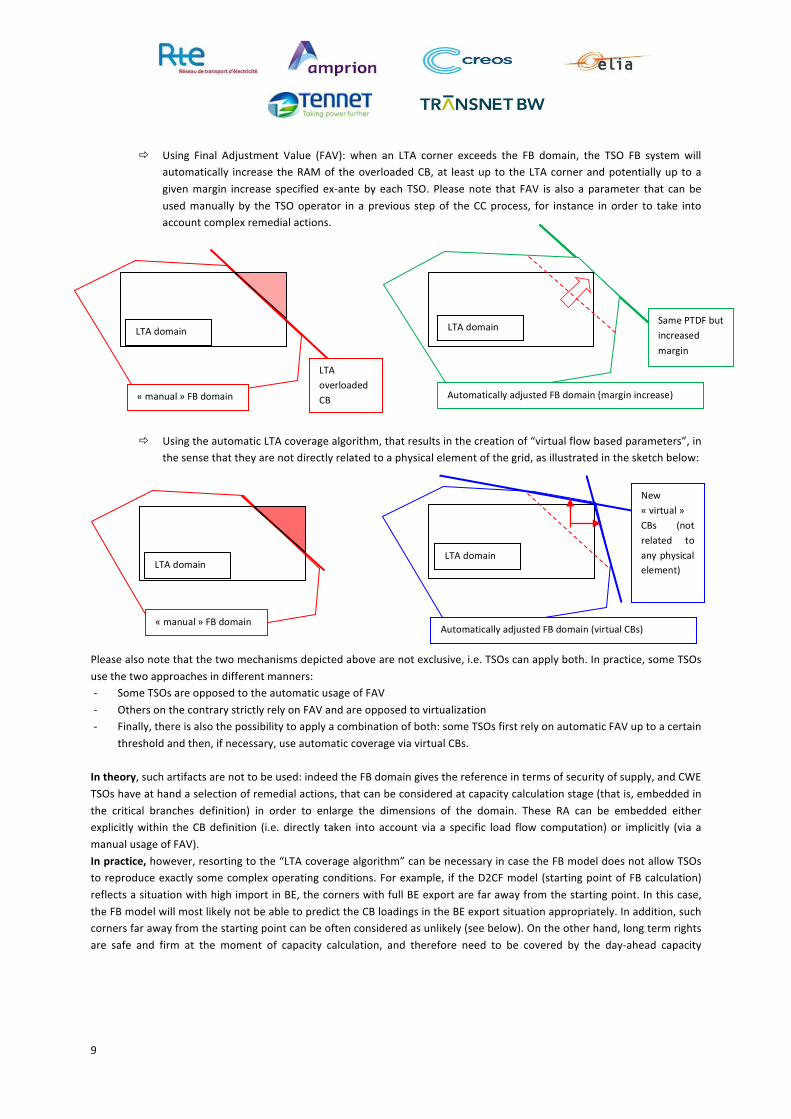
ð Using Final Adjustment Value (FAV): when an LTA corner exceeds the FB domain, the TSO FB system will automatically increase the RAM of the overloaded CB, at least up to the LTA corner and potentially up to a given margin increase specified ex-‐ante by each TSO. Please note that FAV is also a parameter that can be used manually by the TSO operator in a previous step of the CC process, for instance in order to take into account complex remedial actions.
ð Using the automatic LTA coverage algorithm, that results in the creation of “virtual flow based parameters”, in the sense that they are not directly related to a physical element of the grid, as illustrated in the sketch below:
Please also note that the two mechanisms depicted above are not exclusive, i.e. TSOs can apply both. In practice, some TSOs use the two approaches in different manners: -‐ Some TSOs are opposed to the automatic usage of FAV -‐ Others on the contrary strictly rely on FAV and are opposed to virtualization -‐ Finally, there is also the possibility to apply a combination of both: some TSOs first rely on automatic FAV up to a certain
threshold and then, if necessary, use automatic coverage via virtual CBs.
In theory, such artifacts are not to be used: indeed the FB domain gives the reference in terms of security of supply, and CWE TSOs have at hand a selection of remedial actions, that can be considered at capacity calculation stage (that is, embedded in the critical branches definition) in order to enlarge the dimensions of the domain. These RA can be embedded either explicitly within the CB definition (i.e. directly taken into account via a specific load flow computation) or implicitly (via a manual usage of FAV). In practice, however, resorting to the “LTA coverage algorithm” can be necessary in case the FB model does not allow TSOs to reproduce exactly some complex operating conditions. For example, if the D2CF model (starting point of FB calculation) reflects a situation with high import in BE, the corners with full BE export are far away from the starting point. In this case, the FB model will most likely not be able to predict the CB loadings in the BE export situation appropriately. In addition, such corners far away from the starting point can be often considered as unlikely (see below). On the other hand, long term rights are safe and firm at the moment of capacity calculation, and therefore need to be covered by the day-‐ahead capacity
LTA domain
LTA domain
LTA domain
LTA domain
« manual » FB domain
Automatically adjusted FB domain (margin increase)
Automatically adjusted FB domain (virtual CBs)
New « virtual » CBs (not related to any physical element)
« manual » FB domain
LTA overloaded CB
Same PTDF but increased margin

10
domain3: which is why CWE TSOs have designed and implemented an algorithm that ensures the coverage of the previously exceeding “LTA corner”, but in the same time minimizing the distortion of the initial FB domain. So, LTAs do not overcommit the grid. In addition, it was initially expected that this process of LTA coverage would be mainly triggered in order to cover so-‐called “unlikely” market directions. Indeed the FB process is sophisticated and time consuming, and it can prove difficult to optimize the CBs over the 16 LTA corners. Therefore TSOs are focusing on the market directions that are more likely to happen when they enlarge the FB domain, which results in “LTA coverage principles” having a marginal market impact. It can though happen that “likely corners” need to be automatically covered, because of modelling assumptions are taken in the flow-‐based calculation and these lead sometimes to overloads in the calculations which would not occur in real time. This is unavoidable for any methodology based on assumptions (also the case with ATC) but the occurrence should be rare considering that LTA are rather conservative compared to the actual capacities. Circumstantial justifications for the usage of the LTA coverage algorithm during the parallel run are proposed in section 1.2.3 of the present document. This LTA coverage algorithm has been implemented in the new version of the FB system used by TSOs since February 12th. Its usage is the object of careful analysis and is carefully monitored by CWE regulators (via monitoring information described in section 4.2.1). The general principle is that CWE TSOs are making their best efforts not to use this last resort measure, but may have reasons to do so in some cases (essentially to cover unlikely corners), and in any case these occurrences affect the market only in a moderate way.
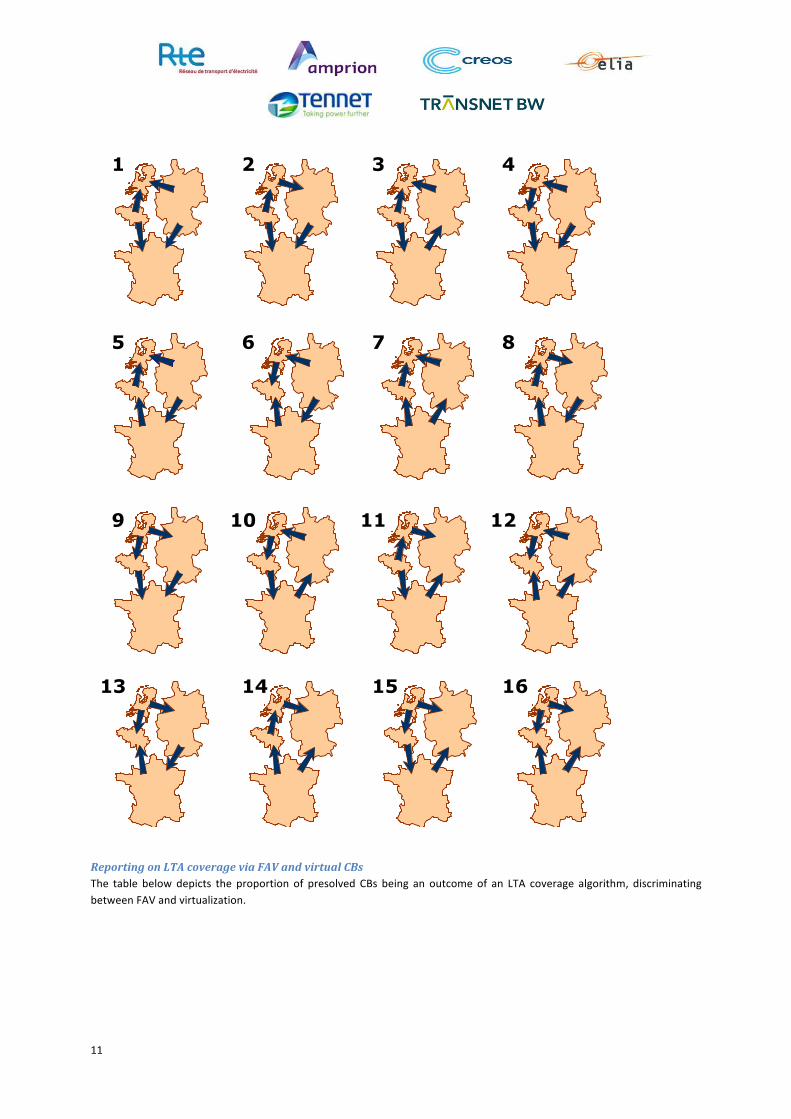
2.2.2 LTA coverage in practice: FAV and virtual CBs In the following section extensive reference to the 16 CWE “corners” will be made. These corners correspond to exchange patters as indicated in the figure below.
3 In that light, the process is fully consistent with the current computation of daily NTCs that cannot be inferior to LTA rights.
11
Reporting on LTA coverage via FAV and virtual CBs The table below depicts the proportion of presolved CBs being an outcome of an LTA coverage algorithm, discriminating between FAV and virtualization.
1 2 3 4
5 6 7 8
9 10 11 12
13 14 15 16

12
-‐ Note: By construction of the algorithm, Virtualization leads to high number of CBs, which further increases the number of presolved CBs4. If for example one CBCO virtualized could lead to 7 additional virtual CBs, a full 24 hour day generates 168 virtual CBs (and more than 5000 for one month).
2.2.3 Frequency of applying automatic LTA inclusion As explained in the previous section the LTA should typically be covered by the DA Flow based domain. Figure 1 considers the frequency with which the LTA coverage algorithm is applied. Please note that due to technical limitations we could not distinguish between automatic or manual application of FAV. Therefore the reported values contain both. For the period of 12 February 2014 to 7 October 2014 this was applied for 3090 hours, or 56% of the time. This seems rather high, considering the LTA should typically be covered to begin with. Mind that the LTA algorithm will typically be triggered for the unlikely corners, which is not representative of a market impact. In order to better focus on instances where LTA inclusion is impacting the results, we consider the hours where one of the virtual (LTA covering) branches is limiting the market. If this is the case we consider that the LTA corner covered was a likely corner5. Using this indicator, we find that likely LTA corners are limiting the market 323 hours, or 6.9% of the time. Please note that the active CBs do not necessarily correspond to a likely corner. In the illustration below an unlikely corner is covered by virtual CBs, and one of the virtual CBs becomes active. However the clearing point is far from the unlikely corner, hence even active virtual CBs might correspond to unlikely corners, and this indicator is also not always representative of a market impact
Figure 1 Illustration of how an active CB can still correspond to an unlikely corner.
5 Note this is a biased assumption: active virtual CBs do not necessarily cover likely corners, cf. Figure 1
LTA domain
“manual” FB domain
Clearing point

13
Figure 1 the number of hours per day for which LTA had to be covered by applying the LTA coverage algorithm
Figure 2 the number of hours per day for which a LTA covering CB was limiting the market
0
4
8
12
16
20
24
12 Feb
20 Feb
27 Feb
07 M
ar15 M
ar22 M
ar29 M
ar05 Apr
14 Apr
21 Apr
28 Apr
05 M
ay12 M
ay19 M
ay27 M
ay03 Ju
n10 Ju
n17 Ju
n24 Ju
n01 Ju
l08 Ju
l15 Ju
l22 Ju
l29 Ju
l05 Aug
12 Aug
19 Aug
26 Aug
02 Sep
09 Sep
16 Sep
23 Sep
30 Sep
07 Oct
Freq
uency (num
ber o
f hou
rs)
Number of hours with automatic LTA covering
virtually covered CB FAV covered CB
0
4
8
12
16
20
24
12 Feb
20 Feb
27 Feb
07 M
ar15 M
ar22 M
ar29 M
ar05 Apr
14 Apr
21 Apr
28 Apr
05 M
ay12 M
ay19 M
ay27 M
ay03 Ju
n10 Ju
n17 Ju
n24 Ju
n01 Ju
l08 Ju
l15 Ju
l22 Ju
l29 Ju
l05 Aug
12 Aug
19 Aug
26 Aug
02 Sep
09 Sep
16 Sep
23 Sep
30 Sep
07 Oct
Freq
uency (num
ber o
f hou
rs)
Number of hours with active automatic LTA covering
virtually covered CB FAV covered CB

14
2.2.4 Market impact of LTA coverage
Focus on corners “likeliness” per TSO
i. Amprion, TNG, TTG and TTB These 4 TSOs determine the likely corners by statistical analysis. Frequency of occurrence considering a period of time determines if a corner is likely and unlikely. The TSOs use the information from the Vulcanus data base (realized schedules) in order to assess, which corners have been chosen by the Market in the past months. The corners which have occurred with higher frequency are considered as likely. The 4 above TSOs today consider corners 4 (import FR, export DE), 5 (import NL, export DE), 6 (import BE, export DE), 7 (import NL, export FR) and 12 (import BE, export FR) to be a “likely” market direction. This categorization is taken into account ex ante by the operators on shift, as an indication as to which market directions can be the object of thorough optimization, especially in terms of phase-‐shifters coordinated settings.
ii. Elia: Elia will consider a corner as likely if at least 3 of the following conditions are fulfilled: 1. The total distance (seen for all hubs) between the corner and the reference program is less than 3000 MW. 2. The corner makes sense from operational experience. It makes sense that the market could go in this direction. 3. The corner has appeared in the last days. 4. The difference on Belgian net position between the reference program and the corner is less than 2000 MW. In likely corners Elia will add RA (remedial actions) until LTA is covered, in unlikely corners RA will be added to cover LTA up to an overload of maximum 200 MW, the remaining overload will be covered with a FAV.
iii. RTE: RTE expects that in the majority of hours all 16 corners of NTC will be covered by its own CBs. In exceptional situations, it could happen that LTA or NTC corners are not covered, in case of really big shift of Net Positions (example: 6000 MW of change in DE/FR to reach the LTA corner from full NTC export to full LTA import). If the RA applied are correct, RTE cannot do anything more at capacity calculation stage and will accept the (very unlikely) risk that the shift is actually happening. In brief, RTE does not decide ex-‐ante on the (un)-‐likeliness of a given corner, but rather determines during the operational process which market directions are the most plausible. We finally observe that although different TSOs have adopted different approaches to define the likely corners, for the majority of the cases the different approaches identify the same likely corners.
Circumstantial justifications for LTA coverage As mentioned in a previous section, an essential cause for TSOs to rely on automatic LTA coverage (either FAV or virtual CBs) lies in the fact that the latter put their effort on so-‐called likely corners (determined ex-‐ante or on the job). Indeed, optimizing all market directions at once is not feasible and trying to do so would be counter-‐productive. This assumption holds true in practice, and the corners that are “LTA covered” are in the majority unlikely. However, for the cases where LTA automatic coverage has been used on likely corners, we present in the table below a weekly review, per TSO, that depicts the main causes for not being able to overcome LTA corners in likely directions.

15
Week TSO Max LTA Overload (>100MW)
Likely/Unlikely Corner
Justification
22 Amprion 148 Likely No dedicated RA6 available for this line
22 TTB 130 Likely Due to operational problems in the night the morning shift could not solve and coordinate the LTA in corner 3 by missing a coordinated PST from another TSO. For the other LTA overloads we used the coordinated PSTs from TTG.
23 RTE 1546 Likely Bad utilisation of Algorithm for creating the External Constraint (EC) file from RTE, linked to the parallel run operational conditions. This situation will not be possible post go-‐live.
24 Amprion 132 Likely Known line for which no dedicated RA are available to cover the LTA Overloads.
25 RTE 1539 Likely Bad utilisation of Algorithm for creating the ECfile from RTE, due to missing inputs (no NTC inputs => Only Refprog +/-‐ 4000 MW, without coverage of LTA in counter-‐tendency direction)
26 Amprion 294 Likely No dedicated RA available for this line
27 Amprion 291 Likely No dedicated RA available for this line
28 Amprion 396 Likely No dedicated RA available for this line
29 Amprion 273 Likely No dedicated RA available for this line
30 Amprion 427 Likely No dedicated RA available for this line
31 Amprion 417 Likely No dedicated RA available for this line
31 TTB 133 Likely Raised in Corner 7, RA applied But not sufficient to cover the overload.
31 TTB 293 Likely Raised in Corner 5, RA applied But not sufficient to cover the overload.
31 TTB 122 Likely Raised in Corner 7, RA applied But not sufficient to cover the overload.
32 Amprion 679 Likely For the concerned line we have no remedial action which could fix the overloads
Amprion 500 Likely No dedicated RA available for this line
33 RTE 204 Likely Imperfections in the model and wrong assumptions in the D2CF led to the impossibility to cover all LTA corners.
33 TTG 422 Likely Incorrect transfer of outage planning into the D2CF lead to unrealistic and high overloads, which could not be covered solved during FB process. . The overloads in likely corners were lower than the maximum mentioned here (422 MW from unlikely corner). In the end TTG branches were not limiting the market. TTG will add additional check on D2CF to prevent this
6 For the cases where it is mentioned that “no RA was available”, this means that no RAs (which may be costly or non-‐costly) are available that TSOs are willing to consider during capacity calculation stage. However, in such cases the offered capacities were operationally secure based on other RAs available to TSOs implicitly assumed in the NTC calculation but not taken into account in the normal FB calculation.

16
error.
33 TTB 325 Likely D2CF issues which prevented the ability to solve the issue encountered
34 Amprion 500 Likely No dedicated RA available for this line
CWE partners are continuously working on mitigations for some of the aspects mentioned above. These improvements shall be addressed in the last section of the present report. One can already keep in mind that the LTA violations linked to technical issues (for example RTE weeks 23 and 25) shall be tackled before going live.
Quantitative market impact (virtual CBs only) A final aspect of this “LTA analysis” is to focus on the actual market impact, and especially to assess whether the automatic inclusion of LTA capacities through virtualization significantly affects day-‐ahead market welfare (DA MW) along the period of the daily parallel run:
2.2.4.1 Examples of LTA violations A selection of worst LTA overloads in January and February 2015 was analysed in detail. In particular, it was investigated 1) whether the day reflects a typical situation, 2) how the situation translates to ATC and FB, 3) whether real-‐time mitigations were applied and the comparison between ATC and FB, and 4) how the cause for the overloads is linked to the presented framework.
January 10th, 2015 The day is characterised by very high wind infeed (30GW) in Germany. The forecasts predict a stressed grid situation in Germany leading to the reduction of the NTC from Germany to the Netherlands to the minimum. The same forecasts are reflected in the FB computation, which shows several overloads in the initial computation. In real-‐time several non-‐costly and costly remedial actions had to be applied in order to keep the grid stable. In particular, the same remedial actions were applied in ATC and FB. The LTA violation is therefore caused by the increased accuracy of the method.
January 28th, 2015 The day is characterised by very high wind infeed (27GW) in Germany leading to high exports from Germany. Due to the wind forecasts the capacities for the export from Germany was reduced to the minimum, which could heal the overloads in the NTC verification process. In the FB process it became apparent, also due to additionally monitored branches, that all tie-‐lines between Germany and the Netherlands were highly loaded. Thus, PSTs have a small effect as they can only shift the flow from one tie-‐line to the other. In real-‐time planned outages for maintenance were postponed and several non-‐costly and costly remedial actions had to be applied. The LTA violation relates to the increased accuracy of the method, the usage of the Common Grid Model and the monitored elements.
February 7th, 2015 The day is characterised by very high wind infeed (24GW) in Germany and simultaneously a high load demand in France leading to flow patterns from the North of Germany through the Netherland and Belgium to France. The remedial actions were optimised for this flow pattern in FB computation. LTA violations then occurred in a different corner, in which Belgium imports additionally from France. This was not the expected market direction, thus no remedial actions in this corner were applied and expected commercial exchanges were optimised. In real-‐time the flow pattern was realised as expected. The LTA violation relates to the harmonisation and coordination towards the expected market direction and the increased accuracy of the model.

17
2.2.5 LTA impact on DA market welfare Intuitively one might be inclined to think that in case the LTA domain was not initially covered by the FB domain, an active virtual branch implies welfare loss under FB. In Figure 3 we illustrate FB solutions where a virtual branch is active, and compare this with the ATC solution. The illustrations show that it is still possible to find a solution on an active virtual branch that is outside the ATC domain, and therefore FB would yield more welfare than ATC. Therefore the statistics presented in the previous section are insufficient to conclude that the welfare will adversely be impacted by the presence of active virtual branches.
Figure 3 Illustration how solutions where LTA inclusion under FB was necessary can either result in more (LHS) or less (RHS) welfare than could be obtained under ATC. In order to definitively assess the impact on welfare we consider the welfare figures using an hourly resolution: for each hour we consider the difference in welfare between the FB and ATC solutions (FB-‐ATC)7. We now limit our analysis to those hours where we know the virtual CBs were active, in order to learn the impact on welfare. Results are presented in Figure 4
7 It is important to realize block orders can create a bias in this analysis, since they can transfer surplus from one hour to the next.
ATCLTA FB solution
ATC solution ATCLTA
FB solution
ATC solution

18
Figure 4 hourly change in welfare for those hours where the market was constrained by a virtual CB As discussed both effects are observed: hourly welfare can either increase or decrease compared to the ATC solution. We find that of the 323 hours for which virtual CBs limited the market vs 2513 hours for which normal CBs limited the market: Virtual CBs limiting the market Normal CBs limiting the market
Resulting in a loss of welfare 185 hours (-‐2.3M€) 413 hours (-‐3.2M€)
Resulting in a gain in welfare 138 hours (+1.4M€) 2513 hours (+27.3M€)
Hence the net effect is a loss of 0.9M€; The overall gain in welfare during the period that is studied was 28.2M€.
2.2.6 Discussion
2.2.6.1 LTA interaction with LT nominations In a situation where LT rights are fully nominated the situation where the DA market is forced to move in a set direction. Instead the zero exchange solution is feasible, and the corresponding illustration under full nominations becomes:
-‐80k
-‐60k
-‐40k
-‐20k
0k
20k
40k
60k
80k
12 Feb
27 Feb
15 M
ar
29 M
ar
14 Apr
28 Apr
12 M
ay
27 M
ay
10 Ju
n
24 Ju
n
08 Ju
l
22 Ju
l
05 Aug
19 Aug
Chan
ge in welfare (FB-‐ATC)
Change in welfare during hours constrained by virtual CBs

19
Figure 5 illustration of FB domain after inclusion of LTA and translation by LTN At first glance the illustration shows that there is no immediate capacity available in the A→B and A→C directions for the DA timeframe. Please note that this observation of no available capacity for A to export is valid under a specific assumption on the exchanges between B and C. In a CWE configuration it would be valid also under specific assumptions involving a fourth country. If the market can deviate from these assumptions export capacity for country A could be made available. The assumptions on 4 markets simultaneously can be reflected by considering the LTA corners explicitly: here we can assume full LT nominations in the direction of a corner. The impact on BE import specifically is illustrated in Figure 2 and Figure 3. The indicated red lines indicate what BE can import on both the DA and LT time frame combined. The blue line reflects what is available for DA, assuming all LT rights in the direction of the mentioned corner are nominated.
A→B
A→C
C→A
B→A
no A→Bor A→Ccapacity

20
Figure 2 Impact on BE import assuming full nomination of LT rights on corner 6 (or corner 12, which results in the same figure).
-‐5000
-‐4500
-‐4000
-‐3500
-‐3000
-‐2500
-‐2000
-‐1500
-‐1000
-‐500
0
500
19 Feb
26 Feb
07 M
ar18 M
ar25 M
ar03 Apr
13 Apr
20 Apr
28 Apr
06 M
ay13 M
ay23 M
ay31 M
ay07 Ju
n15 Ju
n23 Ju
n30 Ju
n08 Ju
l16 Ju
l23 Ju
l31 Ju
l08 Aug
15 Aug
23 Aug
31 Aug
07 Sep
16 Sep
24 Sep
full nomination
zero nomination

21
Figure 3 Impact on BE import assuming full nomination of LT rights on corner 4. Today under ATC the LTA domain is typically more than covered (with the exception of the “red flag” days of February 2011). Furthermore the capacities allocated during the yearly and monthly auctions are often less than the LT NTCs (following the so called “split rules”) where an amount of ATC is indicatively left for the DA MC. This leaves additional capacity for DA, providing resilience to smaller markets benefitting price formation: especially the smaller markets can be adversely impacted when no cross border capacity is available. Either the capacity is sufficient to converge with neighbouring areas, or the capacity increases liquidity in the market, contributing to more reliable prices. As long as explicit nominations remain at levels that are close to zero and most of the capacity will be allocated via market coupling there is no immediate issue. In case a strong increase in explicit nominations occurs, the price formation of smaller markets is at risk, especially for periods where only LTA is covered. As illustrated below for the Belgian borders, changes in nomination behaviour can happen, and have been observed in the recent past (not linked to FB).
-‐5000
-‐4500
-‐4000
-‐3500
-‐3000
-‐2500
-‐2000
-‐1500
-‐1000
-‐500
0
19 Feb
26 Feb
07 M
ar18 M
ar25 M
ar03 Apr
13 Apr
20 Apr
28 Apr
06 M
ay13 M
ay23 M
ay31 M
ay07 Ju
n15 Ju
n23 Ju
n30 Ju
n08 Ju
l16 Ju
l23 Ju
l31 Ju
l08 Aug
15 Aug
23 Aug
31 Aug
07 Sep
16 Sep
24 Sep
full nomination
zero nomination

22
0
200
400
600
800
1,000
1,200
1,400
1,600
January February March April May June July August September October
Long-‐Term capaci^es and nomina^ons in NL-‐BE direc^on
Yearly Nominatons Monthly Nominatons NTC Long-‐Term Capacity
0
500
1,000
1,500
2,000
2,500
3,000
3,500
January February March April May June July August September October
Long-‐Term capaci^es and nomina^ons in FR-‐BE direc^on
Yearly Nominatons Monthly Nominatons NTC Long-‐Term Capacity

23
2.2.6.2 Mitigations If the risk of markets being adversely impacted by LT nomination increase is considered too high, mitigations measures should be considered. Such mitigations could either target the levels of the nomination (e.g. the implementation on some or all borders of FTRs), or consider a reference different from the LTA to be structurally covered (e.g. automatic LT NTC inclusion, better usage of remedial actions to safeguard the LTA is well contained within the FB domain in likely market directions). Finally a natural mitigation is in place, namely FB capacity allocation itself: if appropriate exchanges on other borders are made, the market coupling solution is not necessarily stuck in the LTA inclusion vertex. Furthermore as explained above the exchanges between countries B and C could also deviate from the assumptions related to the LTA covered corner. This could allow further exchanges from A to B or C. Of course to have “intuitive” results, this capacity only materializes if market directions coincide with the directions that relieve the congestions.
2.2.7 Outlook The situation observed during the parallel run that the LTA domain is not structurally covered by the FB domain was not expected in such extent by all parties: the LTA domain was assessed to be safe, and was expected to be fully contained in the FB domain. However one should keep in mind that LT rights do not anticipate the actual market direction in D-‐1.Starting from the reference point in the D-‐2 base case, some configurations of exchanges in CWE will be physically unattainable (if for instance the D2CF is based on a strong export tendency for France, all the LTA corners based on a double FR import will be physically impossible, due to a completely unrealistic shift in the FR position from the base case export position to the import LTA corner). The corners that cannot physically materialize when getting close to real time are called « unlikely ». In brief, the actual physical feasibility of a given LTA corner depends on the situation closer to real time, which cannot be assessed when defining the LT rights. This being said, it is deemed understandable that a model “closer to the physics of the grid” will (and should) reflect this impossibility to reach some LTA corners. It has indeed been observed that for the majority of the time the LTA violations relate to unlikely corners, not resulting in a market impact. For the cases where the violations concerned likely corners justifications have been provided, associated with improvement plans in some cases (cf. section 4). CWE partners have set an objective that the occurrence of needing to apply LTA coverage tools for “likely corners” should be reduced to near 0% of hours in the future, e.g. comparable to risk of red flag in the ATC environment. The remaining discrepancies between LTA rights in likely corners and FB parameters shall however not lead to conclude that LT capacities should be curtailed as a consequence of FB implementation in DA LT rights are defined today on the basis of an independent process that is by the way approved by each NRA. There are no concrete facts leading to a need to review drastically the method for LT definition (and should the case arise, it would go through a formal NRA approval process) as globally the TSOs are able to cope with the current LTA in line with their security standards. This does not mean of course that the LT capacities themselves will never change: new operating conditions and changes in the general TSO environment will result in different levels of capacities, even at “iso-‐method”. However, this confirms that LTA remain an independent reference with respect to daily FB parameters. In addition, levels of LT capacities and variations of the latter are strictly monitored by NRAs and systematically justified by the TSOs.

24
2.3 General conclusion on ATC/LTA – FB comparison ATC-‐FB comparisons over the parallel run period have confirmed the first observations and expectations generated during the experimental phase. Globally, FB creates trading opportunities which results in significant welfare gains (expectation of
about 95M€/year8) and increased convergence rate, as a result of an (on average) “bigger” security domain which is bigger on average. This increase is made possible by the implementation of a model that better takes into account the actual physical constraints of the grid, and therefore allows TSOs to get closer to its actual limits. As a consequence of the better representation of the physical constraints, and due to this adherence to physical conditions, capacities offered to the market are more volatile than in ATC, which is directly demonstrated by the variability of welfare gains on a daily basis. Another fundamental aspect observation from the FB parallel run of FB performance is that the ATC clearing point as observed in the CWE market coupling frequently violates the FB domain. Similarly, it has been observed frequent usage of a so-‐called “LTA coverage” algorithm, generating in some instances virtual CBs. This usage, that is by the way fully in line with existing procedures in ATC, can be explained in the majority of cases by the notion of “unlikely corner”, which is confirmed by the “moderate” impact that virtual CBs eventually have on welfare (moderate in the sense that welfare gains are not more negatively affected by virtual CBs than by normal CBs). The coverage of “LTA likely corners” by virtual CBs has been in addition duly justified, and one will see below that mitigations are on the way for the majority of cases (c.f. section 3 of the current report). The extent to which LT rights are automatically covered (by means of adding “virtual critical branches” or adjusting the FAV) raises legitimate concern since it could affect, in some cases, the capacities available for DA MC. Such situation could become particularly sensitive if: -‐ Automatic LTA coverage is in a likely corner important for a smaller market that depends on a certain level of import (or
export) capacities for reliable DA price formation -‐ This is combined with a change of behaviour of market players regarding an increased usage of LT nomination could
result in very limited capacities for DA market coupling (or in extreme LT nomination assumptions even to zero capacity).
While the behaviour of market parties is difficult to anticipate, project parties are committed to ensure that FB does not jeopardise the quality of price formation in all markets, maintaining a special attention to the consistency between LTA and FBP in likely market directions and to put in place mitigation measures against changes in market behaviour. In this regard, the project parties are to begin evaluating the implementation of FTRs. To finish, CWE partners understand the need, on NRA and market side, to better understand the differences between the two models and propose in this respect to develop a pragmatic approach, by focusing on some “extreme” cases of the parallel run, in terms of welfare gains and losses.
8 See approval document chapter 9: http://www.casc.eu/media/140801%20CWE%20FB%20MC%20Approval%20document.pdf

25
3 Special welfare investigations
3.1 Reminder: methodological differences between ATC and Flow Based (FB)
3.1.1 Harmonization and coordination Flow Based is coordinated at the input level (inputs such as CBCO, GSK are used to provide a common set of FB parameters via a centralized computational step) while ATC is coordinated at the output level (joint verification performed on NTCs provided individually).
This sophistication / complexity under FB has been more challenging to integrate into operational procedures and tooling but is required in order to guarantee the quality of the FB results. The coordination process is already running and TSOs continuously improve the regional coordination.
Definition of NTCs on a local basis
Provision of final NTCs
Definition (or update) of local inputs: D2CF / CB(CO) / GSK
Coordinated Verification process Centralized computation of FB parameters
Provision of final FB parameters: PTDFs and RAM per CB(CO)
Iterative steps (coordination between TSOs)
Coordination principles and inputs management differ fundamentally in ATC and FB

26
3.1.2 Accuracy of the models Technical constraints and remedial actions are taken explicitly into account in the centralized FB calculation (cf. previous forum workshop) In short: FB is closer to the physics of the grid
ATC constraints are « artificial » representations of the grid transfer capabilities: Simultaneously feasible Taking implicitly into account actual physical constraints
FB constraints remain an approximation but: -‐ Take into account explicitly the physical constraints via the PTDF
-‐ Take into account influences resulting from all exchanges

27
3.1.3 Usage of Common Grid Model (CGM) in D-‐2 (D2CF) The ATC process uses two D2CF grid models “only” for verification of individual NTC values (3h30 and 10h30 timestamps are used); FB uses 24 D2CF grid models as a direct technical input for the capacity calculation process.
ð The gain in reliability of the capacity calculation process is significant, but this puts higher requirements on the quality of the D2CF under FB (the sophistication of the FB model will also result in a higher sensitivity to the potential D-‐2 forecast inaccuracies)
Definition of NTCs on a local basis
Provision of final NTCs
Definition (or update) of local inputs: 24 individual D2CF per TSO / CB(CO) / GSK
Coordinated Verification process, based on 2 merged D2CF per day (3h30 and 10h30)
Centralized computation of FB parameters, on the basis of 24 merged D2CF
Provision of final FB parameters: PTDFs and RAM per CB(CO)
Iterative steps (coordination between
CGM usage differs fundamentally under ATC and FB

28
3.1.4 Monitored elements In the Flow Based capacity calculation, the number of monitored branches has increased with respect to today’s ATC capacity calculation: -‐ Operating conditions have evolved dramatically (e.g. RES penetration) so in any case TSOs need to change their capacity
calculation process, and especially to adjust the set of monitored elements, which is done through FB. -‐ The set of branches monitored under ATC made sense at the moment of its design (i.e. fewer loop flows and lower
variability in the exchanges). -‐ Monitoring of elements in Flow Based is done in a more integral manner compared to ATC, so the monitoring of
relevant set of CBs is more sophisticated in Flow Based. It can be reminded here that FB offers in this respect a significant gain of transparency by: -‐ Explicitly identifying the constraints limiting the capacity domain -‐ Objectively quantifying the sensitivities of these constraints with regard to the cross-‐border exchanges, and associating
a “significance threshold” (currently 5% in CWE) to it.

29
3.1.5 Reliability margins (FRM) Due to the possibility to come closer to the physical limits under FB, TSOs need to apply a clear method (statistical analysis) to assess the flow reliability margins (FRM), on a CB per CB basis, and not any more per border as with the current TRM (Transmission Reliability Margin).
Definition of TRM, border per border, in deduction of the Total Transfer Capacities
-‐ Uncertainties are globally taken into account at “output” level (NTC)
FRM are based on statistical analysis for each individual CBCO, and then subtracted from its Fmax
-‐ Uncertainties are individually taken into account at “input” level (CB)
Hedging against uncertainties differs fundamentally under ATC and FB

30
3.1.6 Remedial Actions (RA): TSO’s local risk policies describe the range of RA that can be taken into account during the capacity calculation process (number of PST taps, topological actions, amount of redispatching etc...). The complete range of available RA are not “given” to the capacity calculation, because TSOs need according to their local risk policies and legal obligations to keep at hand some RA in order to cope safely with real-‐time events. There is of course the risk that if RA and FRM are not consistent TSOs would in some cases double hedge some risks, which can be a source of improvement for further development of the FB method. In FB, RAs can be included explicitly within the critical branches definition (the impact of each RA is directly translated into the FB domain after a load flow computation). This means that TSOs can strictly apply their risk policies in this respect. In ATC, the consideration of RA is implicit (TSOs assume indirectly the positive effect of RA on their NTCs). In practice, the ATC approach does not allow a strict implementation of RA, according to their risk policies. The RAs that can be considered at D-‐2 for capacity calculation are the same under both ATC and FB. As a result, it happened that some XB exchanges observed in reality were actually supported by RA (extreme PST taps, costly redispatching) that TSOs did not consider when computing the NTC capacities two days before.
ð In such cases, the welfare comparison between ATC and FB is incomplete, because the cost of the RA eventually supporting the high level of NTCs in real time is not taken into account in the welfare computation. It is therefore unknown if the cost of the RA is outweighed by the welfare gains or not.
ð Such cases are isolated and can account for, punctually, welfare decreases from ATC to FB. ð Nevertheless, the parties aim to continue to work on the application of RA in order to maximise market
efficiency consistent with system security, including issues on further harmonization of risk policy and transparency, and associated costs.

31
3.1.7 High-‐level differences between ATC and FB: a simplified framework FB is a more harmonized, formalized and sophisticated capacity calculation process, performed today independently from the ATC process -‐ Starting from the ATC solution as a reference, differences in FB results could then be interpreted according to the
previous 6 main factors. -‐ These differences will, in the majority of cases, not be attributed to a single factor, but will rather result from a
combination of some of them. Besides, the factors are not independent between themselves. This means that one should be careful not to fall into simplistic assumptions when analysing differences between ATC and FB.
-‐ This framework can however help to structure and understand, on a case-‐by-‐case basis, where the concrete differences lay, and then to identify potential improvements
ð The FB formalism allows for a more explicit application of TSOs’ risk policies in FB than in ATC. This inevitably leads to discrepancies in the results, sometimes under FB to the detriment of the market but in the clear majority of cases to its benefit
A: harmonization & coordination
B: Physics of the grid F: RA
E: FRM C: CGM (D2CF)
D: monitored CBCO

32
3.2 “Negative Welfare” investigations
3.2.1 Presentation of the study Days of the daily parallel run where the FBMC (Flow Based Market Coupling) resulted in a lower market surplus (i.e. sum of DA Seller + Buyer welfare) than the ATC MC were also subject to an extensive study.
This study may also better explain the cases where ATCs and LTAs fall outside the FB domain Such situations need to be accounted for, but also provide opportunities to better illustrate fundamental differences between ATC and FB approaches. Studies were performed by the service providers SSC, Coreso and external support. The idea was to define a systematic approach to investigate these situations and to identify “clusters” or “patterns” in order to foster a better understanding of FB and opportunities for improvement. Ten days were covered by the study and will be elaborated upon in the following section. 10-‐3-‐2014 è -‐30 476 EUR 18-‐3-‐2014 è -‐158 900 EUR 22-‐3-‐2014 è -‐170 788 EUR 25-‐3-‐2014 è -‐45 172 EUR 26-‐3-‐2014 è -‐34 367 EUR 27-‐3-‐2014 è -‐18 7407 EUR 28-‐3-‐2014 è -‐518 856 EUR 16-‐4-‐2014 è -‐73 359 EUR 22-‐4-‐2014 è -‐353 898 EUR 23-‐4-‐2014 è -‐36 715 EUR 24-‐4-‐2014 è -‐283 456 EUR
ð Project partners propose not to follow a similar approach for the other 300-‐plus days when FB generated more market surplus than ATC, however it is acknowledged that investigating days when very high amounts of welfare have been generated could also be instructive (see section 2.3).
This day could not be analysed (missing data)
Daily loss of market surplus, from ATC to FB (congestion rent variation not taken into account)

33
3.2.2 Case by case analyses
Approached followed: Basis for the analysis: two adjusted D2CF files in order to ‘step back’ into the capacity calculation process
ð one reflecting the ATC MC point and the other reflecting the FB MC point (whereas the other information of the reference day remains as is)
ð ATC adjusted D2CF, shifted by means of the GSK to represent the ATC MC ð FB adjusted D2CF, shifted by means of the GSK to represent the FBMC
One original D2CF
One “ATC shifted” D2CF One “FB shifted” D2CF
ATC MC results (net positions) FB MC results (net positions)
GSK GSK
Analyses and comparison of the two situations leading to: -‐ Better understanding of // run results. -‐ Clarification of methodological differences between ATC and FB -‐ Identification of improvements for the FB method

34
March 18th Problems due to a bad reference day: the big change in the renewable infeed between the reference day and the target day could not be properly reflected in the D2CF due to the concept of ‘reference days’, which caused unrealistic overloads in the grid model German vertical load is 5000 MW higher in SN (Snap shot: real-‐time “picture” of the grid) than in D2CF Very large differences in production and loading for German TSO areas compared to D2CF; 5000MW for only one of the TSOs. This is caused by a fairly large difference in renewable infeed compared to the reference day. Active CBCO is impacted by these differences. For this limiting CBCO: Remedial Actions cannot cover this big difference. The only RA available for the CBCO is opening one bus bar coupler, which normally reduces the N-‐1 loading by approximately 10%. Active CBCO was not constraining in real time
ð Mitigation measure: on-‐going base-‐case improvements
A: harmonization & coordination
B: Physics of the grid F: RA
E: FRM C: CGM (D2CF)
D: monitored CBCO

35
March 22nd -‐ In real time there were less power transfers from east to west of Germany than forecasted in the D2CF. These reduced
power transfers relieve the active CB, also the CBs that are violated by the ATC NP. As such, no constraints were observed in real time (on those CBs)
-‐ PST coordination: German TSO proposal was accepted by all, but was not implemented in the CB file of another TSO (linked to an temporary technical issues to implement this in CB files)
-‐ The proposed tap position was not optimal concerning the realized market direction. With a different set of tap positions (available at capacity calculation stage), the FB domain could have been larger; as large as the ATC domain (ATC violations nullify with a non-‐zero FRM). However we have to keep in mind that for TSOs it’s not always possible to forecast market behaviour and therefore sometimes TSOs have to take a choice, which parts of the ATC domain to cover. Sometimes this turns out non-‐optimal in real time; this is similar for ATC and Flow Based.
-‐ Under ATC only international tie-‐lines are monitored by this specific TSO, and as such the internal CB was not limiting the ATC domain. • Big gap between D2CF and SN especially within Germany • Due to this gap, lines are highly loaded under N-‐1 conditions in the D2CF
ð Mitigation measure: on-‐going base-‐case improvements, and progressive implementation of full FB coordination.
A: harmonization & coordination
B: Physics of the grid F: RA
E: FRM C: CGM (D2CF)
D: monitored CBCO

36
March 25th -‐ Highly-‐loaded internal line (with 7.6% impact of cross-‐border trades), with a high FRM value (subject to volatile flows) -‐ Applicable TSO indicated that the FRM value resulting from the new analysis for this line is roughly 130 MW lower,
which would have relieved the constraint -‐ PSTs have no impact on this CBCO -‐ Under ATC this internal line is monitored, but due to lower reliability margin under ATC overload was not detected
during capacity calculation phase -‐ In real-‐time the situation was secure; redispatch was applied for TSO’s n-‐1 violations with another TSOs’ control block
which had also a positive effect on the parallel lines -‐ Redispatch is at the cost of welfare, thereby providing an offset between the ATC and FB welfare figures Mitigation measure: FRM has been adjusted based on new FRM studies, recently performed. In line with this values have been lowered for this specific branch.
A: harmonization & coordination
B: Physics of the grid F: RA
E: FRM
D: monitored CBCO
C: CGM (D2CF)

37
March 26th and 27th -‐ Highly-‐loaded internal line (with 6% impact of cross-‐border trades) -‐ PSTs have no impact on this CBCO -‐ Under ATC this internal line is not monitored, and as such the CB was not limiting the ATC domain -‐ In real-‐time the situation was secure
ð Mitigation measure (temporary): as of May 1, involved TSO applies a 500 MW margin RAM increase using a FAV for this CBCO to analyse whether possible modelling errors or methodological shortcomings are either originated in Flow Based or ATC9.
9 This especially allows taking implicitly into account some RA associated to the control of the flows on the line monitored in FB and not in ATC.
A: harmonization & coordination
B: Physics of the grid F: RA
E: FRM
D: monitored CBCO
C: CGM (D2CF)
A: harmonization & coordination
B: Physics of the grid F: RA
E: FRM
D: monitored CBCO
C: CGM (D2CF)

38
March 28th -‐ The D2CF was of good quality -‐ A RA applied in FB was put in by mistake: the operator assumed that the average of the PST tap positions (being three
of them) should be within the range of 6 taps (but he set them at -‐8, 0, 8 è average: 16/3 < 6). -‐ With the PST coordination proposed by German TSOs (it was used by them, but not by another TSO), the FB domain
could have been larger but not as large as ATC -‐ The ATC domain was, from a FB point of view (with a non-‐zero FRM) not secure at the capacity calculation stage (with
its limited amount of tap positions) -‐ In real-‐time the ATC domain was secure (more tap positions available)
ð Mitigation measure: better application and coordination of Remedial Actions in the capacity calculation stage. An agreement between the coordination centres has been reached and in general it should be reminded that RA coordination is continuously improved via a dedicated TF
A: harmonization & coordination
B: Physics of the grid F: RA
E: FRM
D: monitored CBCO
C: CGM (D2CF)

39
April 16th -‐ Unexpected high changes of generation forecasts within the D2CF: a big difference between the renewable infeed
between target date and reference date for the individual German TSOs can be observed -‐ This led to non-‐realistic exchanges in the D2CF datasets and therefore unrealistic tie-‐line flows è too high East à West
flows within Germany -‐ For the limiting CB: Remedial Actions cannot cover this big difference. Only RA available for the CBCO is opening a bus
bar coupler, which normally reduces the N-‐1 loading by approximately 10%. But due to outage of a parallel line the branch was already overloaded in N situation and RA has even less impact.
-‐ Under ATC this internal line is not monitored, and as such the CB was not limiting the ATC domain -‐ Mitigation measure: detailed analysis focussing on D2CF improvement, GSK analysis, FRM to improve Flow Based
methodology further
A: harmonization & coordination
B: Physics of the grid F: RA
E: FRM
D: monitored CBCO
C: CGM (D2CF)
40
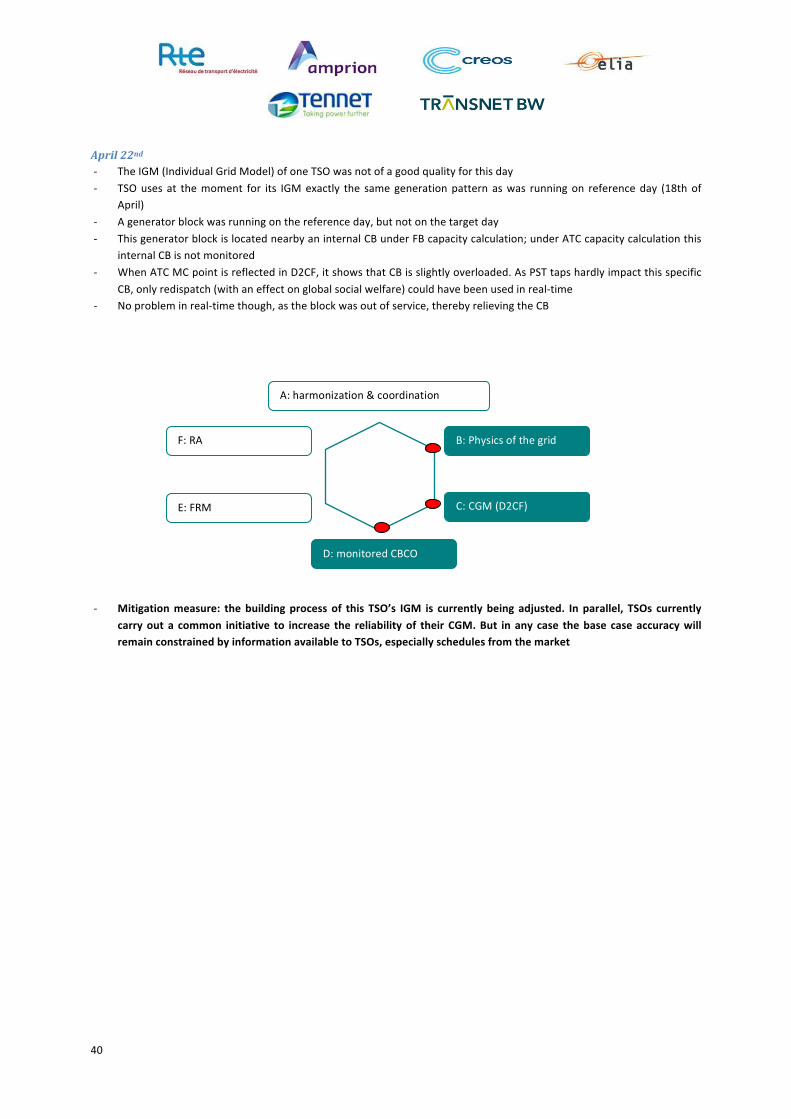
April 22nd -‐ The IGM (Individual Grid Model) of one TSO was not of a good quality for this day -‐ TSO uses at the moment for its IGM exactly the same generation pattern as was running on reference day (18th of
April) -‐ A generator block was running on the reference day, but not on the target day -‐ This generator block is located nearby an internal CB under FB capacity calculation; under ATC capacity calculation this
internal CB is not monitored -‐ When ATC MC point is reflected in D2CF, it shows that CB is slightly overloaded. As PST taps hardly impact this specific
CB, only redispatch (with an effect on global social welfare) could have been used in real-‐time -‐ No problem in real-‐time though, as the block was out of service, thereby relieving the CB -‐ Mitigation measure: the building process of this TSO’s IGM is currently being adjusted. In parallel, TSOs currently
carry out a common initiative to increase the reliability of their CGM. But in any case the base case accuracy will remain constrained by information available to TSOs, especially schedules from the market
A: harmonization & coordination
B: Physics of the grid F: RA
E: FRM
D: monitored CBCO
C: CGM (D2CF)

41
April 23rd -‐ The D2CF was of good quality -‐ Highly-‐loaded internal line (with 11% impact of cross-‐border trades), with a high FRM value (subject to volatile flows) -‐ Applicable TSO indicated that the FRM value resulting from the new analysis for this line is roughly 130 MW lower,
which would have relieved the constraint -‐ PSTs have no impact on this CBCO -‐ An FAV (margin increase) = -‐123 MW was applied for this CBCO to cover the LTA -‐ Under ATC this internal line is monitored
o 150 MW redispatch in real time to solve n-‐1 violations on that line o Redispatch is at the cost of welfare, thereby providing an offset between the ATC and FB welfare figures
o Mitigation measure: FRM has been adjusted based on new FRM studies, recently performed. In line with this values have been lowered for this specific and future further methodological improvements are continuously investigated
A: harmonization & coordination
B: Physics of the grid F: RA
E: FRM
D: monitored CBCO
C: CGM (D2CF)

42
April 24th -‐ D2CF is not of good quality -‐ Main difference between real-‐time and D2CF is the distribution of load within the German hub due to high
discrepancies between the reference day and the target day -‐ Highly-‐loaded internal line (with 7% impact of cross-‐border trades; automatic LTA inclusion was applied thereby
introducing artificial CBs / PTDFs) -‐ PSTs have no impact on this CBCO -‐ Under ATC this internal line is not monitored, and as such the CB was not limiting the ATC domain -‐ No problem in real-‐time due to a large difference between real-‐time and the reference day -‐ Mitigation measure: on-‐going base-‐case improvements
A: harmonization & coordination
B: Physics of the grid F: RA
E: FRM
D: monitored CBCO
C: CGM (D2CF)

43
3.2.3 Synthesis The table below depicts the factors involved in market surplus losses during the daily parallel run. By (arbitrarily) considering that the losses can be equally split between simultaneous factors, one can identify potential opportunities for improvement. This information can give insight in main causes on the one hand and potential improvements on the other hand for further investigations, which is developed in the section 3.1 of the present document. Figures can however not be used to extrapolate potential benefits or losses as this is based on a combination of numerous inputs and complex interdependencies between them.

44
3.3 Remarkable welfare gains
3.3.1 Principles of the investigations Days of the daily parallel run where the FBMC (Flow Based Market Coupling) resulted in a significantly higher market surplus (i.e. sum of DA Seller + Buyer welfare) than the ATC MC were subject to an extensive study. These situations should be assessed on feasibility from a security of supply point of view to ensure these high capacities and the associated social welfare can also provide ones in operations. Of course this is the assumption when performing the parallel run, but it was requested to investigate this in more detail. Potentially it also provides opportunities to better illustrate fundamental differences between ATC and FB approaches. Studies were performed by the service providers SSC and Coreso. The idea was to define a systematic approach to investigate these situations and to identify “clusters” or “patterns” in order to foster a better understanding of FB and opportunities for improvement. Four days were covered by the study and will be elaborated upon in the following section.
1. 16-‐3-‐2014 è 1 538 201 EUR 2. 13-‐4-‐2014 è 1 970 450 EUR 3. 08-‐5-‐2014 è 1 551 974 EUR 4. 09-‐8-‐2014 è 750 203 EUR

45
3.3.2 Case by case analysis
Approach followed: Basis for the analysis: one adjusted D2CF and one adjusted Snap shot (SN) or (Intraday Congetion Forecast) IDCF in order to assess security of supply based on grid situation in later stadium based on net postions from FBMC clearingpoint
§ The grid models represent the information available of the grid in two different moments in time, but same input (Flow based market clearing point) is used to assess the security of the grid
§ FB adjusted D2CF, shifted by means of the GSK to represent the FBMC in original grid information § FB adjusted SN/IDCF, shifted by means of the GSK to represent the FBMC in a grid close to real time
ð Flow based Market Coupling clearing point (including LTnom)
ð One “FB shifted” D2CF
IDCF/SN D2CF
GSK
Analyses and comparison of the two situations leading to: - Assessment SoS in later timeframes based on FB results - Better understanding of // run results
GSK
ð One “FB shifted” IDCF/SN

46
March 16th On Sunday 16th March 2014, there was quite an important amount of RES infeed (20 GW) in Germany. Due to forecasted wind in Germany the TSOs reduced capacity accordingly in the ATC capacity calculation. From this it follows that the Dutch import was limited by the decreased NTC, and German export was also limited. Flow-‐Based computation leads to more capacity for export of Germany and import of the Netherlands compared to the capacity generated by the ATC methodology, with a positive impact on social welfare results. Dutch import was balanced by a higher German export. The resulting net positions from the FB parallel run were integrated on the one hand side in the dedicated D2CF file and on the other hand side in the concerned IDCF. Here it turned out that in the adapted D2CF file no significant overloads could be detected, neither in IDCF file. The capacity domain provided by the FB approach was safe in terms of security of supply. ATC methodology was too conservative and, on that specific day, wind was not lowering Flow-‐Based domain as much as in ATC approach.
April 13th For Sunday the 13th of April the situation was that the Dutch hub tried to import energy while Germany and France were in an export situation. Due to forecasted wind in Germany the Dutch TSO reduced its import capacity accordingly in the ATC capacity calculation. From this it follows that the Dutch import was limited by the decreased NTC. By applying the Flow Based approach the import capacity for the Netherlands was higher compared to the capacity generated by the ATC methodology, which had a positive impact on the social welfare evolution. The higher Dutch import was balanced by a higher French export. The resulting net positions from the FB parallel run were integrated on the one hand side in the dedicated D2CF file and on the other hand side in the concerned IDCF. Here it turned out that in the adapted D2CF file no significant overloads could be detected, while in the IDCF file relevant overloads can be seen for a tie-‐line between Germany – Netherlands. But the aforementioned overloaded lines can be relieved by applying remedial actions, which were at least partly coordinated and implemented in CB file for the FB capacity calculation. From this it follows that the capacities provided by the FB approach were safe in terms of security of supply even though more remedial actions would have been needed compared to the agreed measures in D-‐2. For this day the conclusion is that the capacity from the ATC method was too conservative. Here it seems that the wind is not affecting (lowering) the FB capacity as much as the ATC capacity. It could also be concluded that the ATC approach is not distinguishing between weekdays and weekends. As the grid is (on normal days) on weekends not as stressed as on weekdays, it could be asserted, that the ATC approach is not considering this by increasing the capacity for weekends.
May 8th On Thursday 8th May 2014, there was quite an important amount of RES infeed (11 GW of wind, 12 GW of Solar infeed at 11h30) in Germany. Due to forecasted wind infeed in Germany the TSOs reduced capacity accordingly in the ATC capacity calculation. French export to Belgium was also limited. From this it follows that the Dutch and Belgium imports were slightly limited by the decreased NTC, and German and French exports were also slightly limited. Flow Based computation leads to more capacity for export of Germany and import of the Netherlands compared to the capacity generated by the ATC methodology, with a positive impact on social welfare results. Dutch import was balanced by a higher German, Belgium and French export. The resulting net positions from the FB parallel run were integrated on the one hand side in the dedicated D2CF file and on the other hand side in the concerned IDCF. Here it turned out that in the adapted D2CF file no significant overloads could be detected, neither in IDCF file. Conclusion is that the capacity domain provided by the FB approach was safe in terms of security of supply. ATC methodology was too conservative and, on that specific day, the forecasted wind infeed was not lowering Flow-‐Based domain as much as in ATC approach. In addition, physics of the grid are supporting more import in the Netherlands.

47
August 9th On Thursday 9th August 2014, in real-‐time there was a quite high infeed of renewables (16GW of wind, 16GW solar) for the hour 13h30. In the capacity calculations on D-‐2, the forecasted grid models (D2CF) were only calculated with 9GW of wind infeed. Based on the D-‐2 wind forecast information there was a small reduction done for the Dutch-‐German border within ATC based method. On the other hand a reduction is done within the Belgian hub caused by an outage on a tie-‐line (Van Eyck1-‐Maasbracht including PST). With CWE Flow based there were active constraints seen on the Dutch import and a CB between Germany and France. The D2CF file on D-‐2 is based on the medium kind of renewable infeed, and remains within the control on D-‐2/D-‐1. N-‐1 situation was completely different in the IDCF file from 13h30 compared to the D2CF situation, i.e. a big increase of forecasted renewables leading to overloads in the north of the Netherlands. The overloads would be controllable with the available PST settings and would not lead to operational problems even though they were not coordinated in D-‐2. For both capacity calculations (ATC and FB) the same updated forecast information is missing two days ahead, which can lead to a similar level of risk for grid situations for this specific day. In case there is a gap within updated forecast information between the D-‐2 capacity calculations and the intraday forecast information, this should be covered by security margins in the capacity calculation methods. At this moment FRM have been put in place to mitigate this problem in the FB method. Also having PST taps reserved for real time operation can ensure that there are sufficient measures available to mitigate these occurrences when needed.

48
3.3.3 Conclusion on “highly positive welfare” days The different business days that have been investigated are all characterized by the following aspects:
• These days have relatively high RES infeed • In NTC, mainly the Dutch import and German export are lowered as a consequence • Except for May 8th they are weekend days
In Flow based methodology, the Dutch import and German export capacities are not lowered – to the same extent – due to physics of the grid and the differences in methodology with NTC. This is the main driver of the significant differences observed in social welfare between ATC and Flow based. The results from the Security of Supply assessment done for all these days support this as it can be concluded that the situations would be manageable with Flow based. In addition, a large amount of deviation in RES infeed have been identified in some cases (9th August for example) between two-‐days ahead forecasts and real-‐time. The available margins embedded in the methodology (e.g. FRM, available RA for real time) are the reason why Flow based domain is still secure for these kind of cases – in which Flow based is closer to the limits of the physical grid. Uncertainties are covered by those available margins and RA reserved for real time operation. .
4 Next steps
4.1 Identified improvements and associated work plan
4.1.1 Inputs quality This section will present CWE TSOs standpoint with respect to the differences observed in ATC and FB results that are related to the inputs of the method: CBCO selection, CGM or RA. For each item, mitigation measures and/or justification for the different approaches are proposed.
Individual CBCO selection It has been shown previously (sections on welfare losses) that discrepancies between the lines actually monitored in ATC and FB can be a reason for significantly different results. While TSOs have developed a clear approach to select the monitored elements under FB (the so-‐called “5% rule”), these discrepancies needed to be explained and/or followed by concrete improvements in some cases:
A: harmonization & coordination
B: Physics of the grid F: RA
E: FRM
D: monitored CBCO
C: CGM (D2CF)

49
Situation per TSO Justification
Amprion Only tie lines monitored under ATC -‐ For some TSOs, in ATC only tie-‐lines are monitored
based on the regulatory guidelines and the methodology at that time.
-‐ In Flow based due to the changing methodologies and more extreme possible net positions, it requires monitoring of an increased number of lines to ensure these capacities can be provided while respecting Security of Supply.
-‐ Besides, the FB method offers the practical possibility to monitor many lines while there are structural limitations with the ATC approach
Elia Elia will align lines monitored in ATC & Flow based (by removing some FB CBs)
RTE Same lines monitored
TNG Same lines monitored
TTB Only tie lines monitored under ATC
TTG
Compared to ATC some additional lines are monitored in FB, all at least fulfilling the 5% criteria
In essence, one should bear in mind that the ATC method was designed during a period in which operating conditions were radically different while today physical flows on the grid are more intense, volatile and unpredictable (which is all the more pronounced that FB allows more trading opportunities). Therefore, there was the need by some TSOs to increase the perimeter of monitored elements for capacity calculation in order to maintain their control on a network bearing more and more flows. In that light, FB clearly appears as not being an end in itself, but rather as a method allowing TSOs and MPs to support safely a situation with more important and volatile exchanges. As a consequence, a “global alignment” of the CBs monitored in FB towards the current set monitored in ATC is not foreseen, despite local adjustments of the FB CB set.
D2CF: individual base case and merging process Usage of 24 D2CF as direct technical inputs in the capacity calculation process (CC) under FB is simultaneously a huge improvement and a potential weakness of the method. As a matter of fact the CGM quality has been clearly identified as an important cause for differences between ATC and FB outcomes, considering that in the vast majority of cases, the increased accuracy gained in the CC process thanks to 24 D2CF usage brings about significant benefits for the TSOs and the market. In any rate, improvements are currently being implemented both on a local basis by some TSOs and on a common basis within the merging entity. Final local improvements have been implemented in October and November while the new merging process will be implemented by January 2015. The eventual CGM process that will be used at Go Live is depicted respectively in sections 4.1.5 and 4.2.4 of the approval package submitted on August, 1st to CWE NRAs and now available on project parties website. CWE partners wish to make clear that this adjustment of the D2CF process belongs to a continuous improvement framework that is not strictly related to the current project and therefore cannot be seen as an evolution of the FB method itself.
RA (TSO local inputs) The parties aim to continue to work on the application of RA in order to maximise market efficiency consistent with system security, including issues on further harmonization of risk policy and transparency, and associated costs. In some cases, variations in the consideration of RA under FB and ATC have been one of the factors put forward to account for differences in market coupling outcomes or LTA violations. This can be especially the case when some ATCs are actually supported by remedial actions normally not “authorised” (according to local risk policies) at capacity calculation stage. These not “authorised” remedial actions are listed here after: -‐ Topological RA for some TSOs -‐ Consideration of PST settings beyond the range agreed within DA procedures for some TSOs owning PST in the CWE
area -‐ Costly RA (redispatching / counter-‐trading) for all TSOs, to the exception of RTE. RTE considers costly redispatching
which is “authorized” in ATC.

50
This implicit consideration of “forbidden RA” at CC stage in ATC is not made on a voluntary basis, but more based on the knowledge/experience (gained over time) that the situation will be manageable in operations thanks to the range of RA available in real time. On the contrary, FB is more formalized and allows a strict application of existing risk policies, which has consequences: -‐ In some cases, welfare comparison between ATC and FB can be misleading since the ATC are supported by additional
RA (that may have an indirect costs for TSOs even in case of topological actions), which is not taken into account within the market coupling optimization in the total welfare figures.
-‐ The FB approach is more sustainable, it allows a stricter control on the risks taken and therefore fosters an adequate framework for an environment presenting more and more volatility and volumes on the exchanges.
For these reasons, TSOs will be able to better accommodate their local policies under FB and therefore will not modify the consideration of RA within their CBs. However, an initiative is currently ongoing between RTE and Amprion in order to allow the consideration of topological cross-‐border RA (to be implemented end of November). This development, that is not correlated to FB Go Live, is expected to mitigate the majority of “likely corners LTA overloads” in which Amprion is involved (c.f. table in section 2.2.4).
Future usage of RA (within a coordinated framework between TSOs) As is the case for the CGM, CWE partners are involved in a continuous improvement framework aimed at implementing more advanced coordination procedures, especially focused on a better usage of remedial actions with a cross-‐border perspective. This initiative is not strictly related to the FB method and therefore not linked to FB implementation. While TSOs are currently working on further harmonization of the local principles for the application of RAs, it is expected to implement enhanced procedures (accompanied with appropriate sophisticated tools) in the course of 2015. In the meantime, CWE TSOs, with the support of coordination centres, currently work on the rationalization of the currently existing procedures thanks to: -‐ The design of better tooling -‐ The streamlining of the procedures -‐ The definition of a single point of contact/aggregation for all coordination requests
ð This intermediate initiative is expected before the Go Live of Flow Based.
ID process CWE TSOs are currently working on the implementation of a consistent capacity calculation framework for the ID timeframe. This is a specific initiative for which dedicated working groups exist, with a specific reporting towards NRAs. Deliverables of this other ID project are not linked to the implementation of DA FB. Acknowledging nonetheless the impact that DA FB might have on ID, CWE TSOs confirm that the current framework allowing bilateral adjustments of “initial ID ATCs” will remain after FB Go Live, which is a confirmation that the capacities currently published in the parallel run framework do not fairly represent the actual ATCs that will be available to the market once FB is in operations.
4.1.2 Synthesis on section 3.1 The thorough investigations carried out on parallel run results have allowed project parties to better illustrate fundamental differences between the ATC and the FB models, and to show that these differences concretely resulted, in some cases, in variations in the application of risk policies followed by TSOs. These differences are in any case no “anomalies”: the differences between FB and ATC are structural and stem from the fact that under FB TSOs have more control on their risks via a stricter application of their local policies. In this respect, CWE TSOs

51
will maintain a continuity in their global risk levels with the implementation of FB, but in any rate confirm their commitment to put into place an efficient, transparent and controllable process. Nonetheless, these investigations have confirmed the opportunity to implement improvements within the TSOs operational process, according to the indicative roadmap below:

52
4.2 Monitoring FB performance after Go Live10 This section provides a selection of a consistent set of indicators designed by CWE TSOs. It is believed that the chosen indicators make sense for external communication and reports (towards NRA and/or market parties depending on the case), especially to provide the assurance that the FB process is controlled operationally. Preliminary disclaimer: TSOs believe, based on the conclusions above, that a consistent monitoring of FB can be achieved without references to ATC outcomes any more since:
-‐ FB will have established its own reference after nearly two years of parallel run -‐ It has been mentioned above that FB allows a better application of TSOs risk policies, which means that ATC or LTA
violations, for which circumstantial justifications have been provided, were expected to some extent and need not be systematically followed by corrective actions. Consequently, a comparison to ATC (as a means to identify the “errors” of the FB process) is not justified.
-‐ Main potential improvements of the FB process have already been identified and in the course of implementation. Other sources of improvement are somehow “obvious”11 and belong to middle / long term initiatives that can be addressed within other projects.
10 Please keep in mind that some of the indicators depicted in this section might not be ready at the moment of Go Live, since the FB system specifications needed to be closed before the drafting of this report. 11 Work on fundamental methodological aspects like FRM, GSK, hybrid coupling etc…

53
4.2.1 Ex-‐post monitoring
NRA regular report CWE parties consider that the monitoring framework proposed in the approval package (section 11) constitutes the essential basis to control the quality of the FB method over time.
“Distance” to LT capacities In order to complement the periodic “NRA report”, CWE partners propose to monitor a “distance” between the FB domain and the sustainable reference that are the LT capacities. Indeed, even after going live, LT capacities will remain and therefore can be used as a continuous reference against which the FB domain can be compared -‐ In case the LTA corner is inside the FB domain: the distance, or slack, is the smallest remaining available margin when
the corner is applied. Value will be positive in this case. -‐ In case the LTA corner is outside: the distance is the highest overload due to the corner.
-‐ Reports can be considered on a regular basis (ex: monthly or weekly) with min/max or average values:
period YYYY/MM/(WW)
LTA corner 1 2 3 4 5 6 7 8 9 10 11 12 13 14 15 16
%age of corner occurrence during the period
average positive distance to FB domain
average negative distance to FB domain
max positive distance
min negative distance
Naturally, the metrics above would be computed on the FB domain “before automatic LTA coverage” (otherwise the table would only display 0 or positive values). Over time, such regular monitoring will tell how far the capacities computed by CWE TSOs in FB remain from the LT rights. This metric is comparable to the ATC comparison proposed in the beginning of this report. Please also note that such indicators are also already used by CWE TSO operators during the operational process. Such table can be completed by the reporting proposed in section 2.2.2 (occurrences of LTA covered CBs)
Negative distance to LTA corner : biggest overload
Positive distance to LTA corner : smallest slack between the CB and the LTA corner

54
4.2.2 Operational (process) monitoring This section proposes a couple of indicators that can be used to monitor the proceedings of the FB operational procedure itself.
Delivering FB parameters in due time This indicator will measure TSO’s ability to deliver FB Parameters (FBP) according to agreed timings, for initial, intermediate and final computation.
ð Indicator will measure the delay/slack with respect to each target-‐timing and can be provided on a daily basis or compiled over some period of time from the FB system.
Use of Default/Spanned FB parameters
ð This indicator will record the resort to fall-‐back processes, either spanning or “LTA+X” FBP.
Completeness of the input files "initial data gathering" If at target time for the initial data gathering mandatory files are missing from any party, it could result in a delay of the process.
ð Which files from TSOs are absent/delayed: D2CF, GSK, CB and EC, RefNTC, LTnom, RefProg, ReferenceNTC ? ð Which files from CASC are absent/delayed: LTA ?
Two separate reports can be made in order to discriminate between mandatory and non-‐mandatory files. Such reports can be made on a daily basis and/or compiled from the common system over some period of time.
CWE FB Coordination process The idea would be here to monitor the effectiveness of the qualification process between TSOs by looking at:
ð The number of coordination requests formulated by TSOs and their rate of acceptance/fulfilment during the coordination process.
ð The duration of the actual coordination phase (time elapsed between the first local request and intermediate computation).
ð The presolved CB being overloaded in likely LTA corners where no RA have been implemented. Such report can be produced on a daily basis or compiled over some period of time from the FB common system.
Application Performance Indicators (API) Time needed by the FB system to perform the main steps of the FB procedure. The focus is not only on pure “computation time” but rather on the total processing time, which is the lead-‐time in between the operator request and the actual availability of the results.
ð Processing time for initial, intermediate and final FBP computation can be looked at. Such report can be produced on a daily basis or compiled over some period of time from the FB common system.

55
4.2.3 Operational (FB parameters) monitoring This section provides a set of indicators that can help to assess the quality of the FB parameters before they are delivered to PXs, and independently of any reference to existing NTC values.
Internal Grid Model quality (D2CF before merging) Before the D2CF files are merged, an assessment is done based on quality criteria. Quality criteria: -‐ Late delivery -‐ Xnode inconsistency (inconsistency between interconnectors on each side of the border) -‐ Divergence (impossible to launch a load-‐flow on the D2CF) -‐ Vulcanus adjustment too big (indicate quality problem in a local D2CF) -‐ Files missing Reports are already available by the merging entity Coreso
Coverage of individual TSO “targets” In other words the values that will be used locally to drive the definition of local inputs, and potentially the request for further coordination on RA during the qualification phase. These values are independent from currently defined daily NTCs.
German reference NTCs for Flow Based capacity calculation
Amprion is going to provide the reference NTCs for the German hub acting for all German TSOs. This file will contain NTC values for the borders Germany – France and Germany – Netherlands for both import and export direction. The hourly values are based on the C-‐Function. That means that the values are only depending on the amount of forecasted wind in Germany.
Elia
Reference NTC Regarding the reference NTC, we will use the published weekly NTCs. Methodology: The weekly NTCs are computed with an OPF calculation based on a network files taking into account the planned outages, the forecasted production plan and a modified loop flow to take into account exchanges on non-‐Belgian borders. These results are then compared to the ones given by neighbouring TSO and the minimum is taken.
RTE
RTE Reference NTC will be based on the Weekly NTC. Weekly NTC (and D-‐2 NTC published today) are based on the same calculation principles:

56
1. Construction of a grid model 2. Load flow calculation on this grid model in order to perform a security analysis 3. Regarding the grid model used, and for each contingency to be considered: determination of available physical margins on grid elements. 4. At last, available physical margins are transformed into commercial capacities via PTDF (Power Transfer Distribution Factors). These results are matched with the values of ELIA only (same process of weekly calculation). No matching will be done for German Borders (no weekly matching process on that border) on RTE side, but will be done on Common side with Matched Reference NTC. In case of significant changes between weekly calculation and D-‐2, manual adjustment will be done on this value to be in line with the new network possibilities.
TTB
TenneT TSO B.V. will use the same NTC determination as used today for the reference NTC. TenneT TSO B.V. uses the composite NTC so without the TRM for this. TRM is the margin TenneT TSO B.V maintains in order to comply with Policy 3. TenneT TSO B.V contribution to balancing the European system is 300 MW. At the moment, TTC and TRM have fixed values. The formula deployed could be:
• Composite NTC + TRM = TTC or
• TTC -‐ TRM = Composite NTC. Next to this in the operations we have reduction rules. The reduction rules within the D-‐2 NTC determination are today: Possible reasons to reduce capacity are:
1. Period (summer and winter)
2. Public holidays
3. Planned / unplanned outages
4. Wind-‐based reduction
5. Solar-‐based reduction

57