Evolution based on domain combinations: the case of glutaredoxins

ORIGINAL RESEARCH ARTICLEpublished: 05 February 2014
doi: 10.3389/fonc.2014.00013
Customizing the therapeutic response of signalingnetworks to promote antitumor responses by drugcombinationsAlexey Goltsov 1*, Simon P. Langdon2, Gregory Goltsov 3, David J. Harrison4 and James Bown1
1 Centre for Research in Informatics and Systems Pathology (CRISP), University of Abertay Dundee, Dundee, UK2 Division of Pathology, Institute of Genetics and Molecular Medicine, Western General Hospital, University of Edinburgh, Edinburgh, UK3 Touch Surgery, London, UK4 School of Medicine, University of St Andrews, St Andrews, UK
Edited by:Jan Trøst Jørgensen, Dx-Rx Institute,Denmark
Reviewed by:Katarzyna Anna Rejniak, H. LeeMoffitt Cancer Center & ResearchInstitute, USAAndrea Degasperi, University CollegeDublin, Ireland
*Correspondence:Alexey Goltsov , Centre for Researchin Informatics and Systems Pathology(CRISP), University of AbertayDundee, Bell Street, Dundee DD11HG, UKe-mail: [email protected]
Drug resistance, de novo and acquired, pervades cellular signaling networks (SNs) fromone signaling motif to another as a result of cancer progression and/or drug intervention.This resistance is one of the key determinants of efficacy in targeted anti-cancer drugtherapy. Although poorly understood, drug resistance is already being addressed in combi-nation therapy by selecting drug targets where SN sensitivity increases due to combinationcomponents or as a result of de novo or acquired mutations. Additionally, successive drugcombinations have shown low resistance potential.To promote a rational, systematic devel-opment of combination therapies, it is necessary to establish the underlying mechanismsthat drive the advantages of combination therapies, and design methods to determine drugtargets for combination regimens. Based on a joint systems analysis of cellular SN responseand its sensitivity to drug action and oncogenic mutations, we describe an in silico methodto analyze the targets of drug combinations. Our method explores mechanisms of sensi-tizing the SN through a combination of two drugs targeting vertical signaling pathways.We propose a paradigm of SN response customization by one drug to both maximizethe effect of another drug in combination and promote a robust therapeutic responseagainst oncogenic mutations. The method was applied to customize the response of theErbB/PI3K/PTEN/AKT pathway by combination of drugs targeting HER2 receptors and pro-teins in the down-stream pathway. The results of a computational experiment showedthat the modification of the SN response from hyperbolic to smooth sigmoid responseby manipulation of two drugs in combination leads to greater robustness in therapeuticresponse against oncogenic mutations determining cancer heterogeneity. The applicationof this method in drug combination co-development suggests a combined evaluation ofinhibition effects together with the capability of drug combinations to suppress resistancemechanisms before they become clinically manifest.
Keywords: anti-cancer combination therapy, cancer drug resistance, pathway engineering, signaling networks,pertuzumab, PI3K/PTEN/AKT
INTRODUCTIONAnti-cancer combination therapies are an increasingly promisingway to better treat patients, offering an increase in efficacy of drugs,and a means to overcome/avoid resistance to targeted drug therapy.An evidence base of successes of multidrug strategies in anti-cancertherapy is growing yearly, but typically the mechanism of synergyis not entirely understood. To promote a more directed and sys-tematic development of combination therapies, it is necessary toclearly elucidate the underlying mechanisms that drive the advan-tages of drug combination effect. Exploration of these mechanismscan impact significantly on the determination and validationof advanced combination of targets in novel drug developmentstrategies such as drug combination co-development (1) and drug-diagnostics co-development (2). With respect to a drug combina-tion co-development strategy, novel compounds should be devel-oped in a combinatorial context and not independently in order
to gain those proven integrative benefits with respect to tumorgrowth inhibition, drug resistance, and toxicity. In the drug–diagnostic co-development model, the drug and the diagnosticassay are developed in conjunction. Companion diagnostic (CDx)assays as well as clinical trial strategies in the case of drug com-bination therapy should be adapted to multiple biomarkers anddifferent drug combinations (2). Considering the risk of increasingtoxicity by the use of drug combination therapy, the US food anddrug administration (FDA) released drug co-development guid-ance, which proposed stringent regulatory recommendations forthe use of combination strategies (1, 3). According to these rec-ommendations, there should exist a strong biological rationale forthe use of the combinations and proven significant advantagesover the use of the drugs as individual agents.
Rational determination and validation of advanced targetsfor drug combination therapy are the main challenges for these
www.frontiersin.org February 2014 | Volume 4 | Article 13 | 1
Goltsov et al. Customizing the therapeutic response of signalling networks
strategies. The inherent complexities of signaling networks (SNs),including crosstalk logic and redundancy in their topology (4,5) limit the relevance of genotype-based screening to identifyand validate optimal drug combination targets among severalhundred possible targets. In the face of these challenges, weneed more sophisticated methods to design effective combinationtherapies (1).
Systems biology and computational bioinformatics may offera key role in advancing drug combination co-development. Thesetechnologies are being developed to support rationalized screeningof effective drug combinations, and to formulate quantitative cri-teria for drug combination target validation and specific propertiesof each drug in a combination context and in the face of differentmutational statuses of different cancers (6–9). Such developmentsare motivated by the potential to reduce the size, duration, andcost of clinical trials as well as to accelerate regulatory approval.Our own studies to support drug combination co-development aredescribed here. Our method is based on analysis of the responseof a cellular SN to drug intervention, and its modification by drugcombination to achieve high efficacy and reduce drug resistancepotential. The approach developed here is founded on the twomost attractive advantages of drug combination well establishedrecently: (i) a drug combination suppresses de novo or acquiredresistance to one of the drugs in the combination – a resistancesuppression effect; and (ii) one drug in a combination sensitizestherapeutic response to a second drug – a sensitizing effect.
Resistance suppression effects arising from drug combinationare used widely in clinics now, by manipulating pathway dynam-ics or by slowing down the cancer evolution. Some examples ofpathway manipulations are summarized in Ref. (1) targeting dif-ferent domains of the same protein with two drugs [for example,trastuzumab combined with pertuzumab for human epidermalgrowth factor receptor, HER2, in breast (10) and ovarian (11, 12)cancers]; horizontally targeting parallel signaling pathways [forexample, combined MEK and PI3K/AKT inhibition (13, 14)], andvertically targeting up- and down-stream pathways in one SN [forexample, targeting BRAF and MEK, HER2, and PI3K, PI3K/AKTand mTOR (15–17)]. An evolutionary approach (adaptive ther-apy) to treat drug resistance has been suggested, with the aimof lowering the cancer cell’s capacity to evolve resistance mecha-nisms through adaptive combination therapy in order to hinderthe emergence of resistance types (18). Beyond these approaches,the combination of chemotherapy and molecular targeted ther-apy demonstrates a complementary mechanism of efficacy andmay suggest a route for next-generation cancer therapy (10, 19,20). For example, a clinical trial of HER2-positive breast can-cer progression following HER2 inhibitor trastuzumab therapyshowed that trastuzumab in combination with chemotherapeuticagent (capecitabine) was more effective than capecitabine alone.It would seem that trastuzumab sensitizes cell response to otherdrugs despite the fact that cells are refractory to trastuzumab andthat there is therapeutic benefit to continue trastuzumab therapyin combination with other drugs beyond progression (21).
The sensitizing effects of drug combinations are well estab-lished in combined therapies targeting different pathways, suchas the PI3K/PTEN/AKT and MAPK networks (13, 14); EGFR,DNA-damaging apoptotic signaling pathways (22) as well as in
drug combinations inhibiting different nodes in the same path-way: PI3K/PTEN/AKT/mTOR (23–25), Ras/RAF/MEK/ERK (26,27). However, there are longer-term implications arising fromdrug combinations since they may lead to different mutationsand negatively impact resistance potential. For example, compar-ison of pre- and post-trastuzumab treatment of tissue samplesin metastatic HER2-amplified breast cancer from patients pro-gressing on trastuzumab allowed determination of mutationsin PIK3CA and PTEN arising during treatment (4). A signifi-cant reduction, or full loss, of PTEN expression was observed intrastuzumab refractory metastatic tumors compared to the cohortuntreated by trastuzumab. It was suggested that PTEN expressionreduction was acquired as a result of trastuzumab therapy, lead-ing itself to trastuzumab resistance (4). In contrast, treatment byeverolimus, an mTOR inhibitor, did not increase mutational loadin pre/post treatment samples of renal carcinomas (28). More-over, this phenomenon is context specific: for example, abirateronealone and given in combination with other drugs to control sideeffects contributes to resistance by activating mutations in the hor-mone receptor genes; however, a different combination includingabiraterone was reported to delay drug resistance (29).
These examples highlight the complexities of combinationdrug therapy design, including the change in sensitivity to muta-tion and resistance potential through combination action, andthe attending challenges associated with validation. To help over-come these complexities and challenges, we propose a methodfor the in vitro/in vivo/in silico validation of the targets of drugcombinations and quantitative estimation of the perturbationsinduced by drugs in SNs. Our method is based on the study ofdrug response characteristics of (i) a SN and its modification bydifferent oncogenic mutations and drug action; and (ii) pertur-bation of SN sensitivity to drug action induced by mutations.Using sensitivity analysis (SA) of this signaling response, we showthat inhibition of various targets by the first drug significantlysensitizes SN response to both compensating mutations leadingto resistance and the second drug in combination. We presenta scheme for customizing the SN response through drug com-bination to enhance the robustness of the therapeutic responsedue to weakening of the drug-sensitizing effect to compensationmutations. To demonstrate the method and to study in detail thedrug/mutation modification of SN response, we used the kineticmodel of drug combination targeting HER2 receptors and verticalPI3K/PTEN/AKT signaling pathway (30–32).
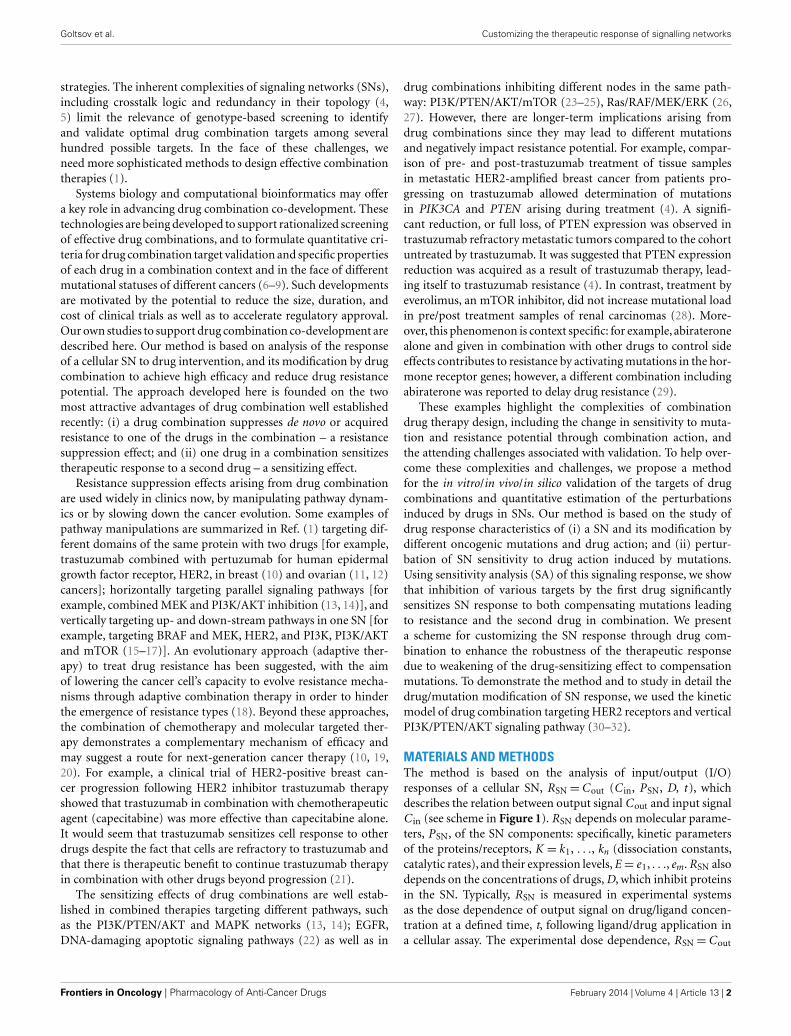
MATERIALS AND METHODSThe method is based on the analysis of input/output (I/O)responses of a cellular SN, RSN=Cout (C in, PSN, D, t ), whichdescribes the relation between output signal Cout and input signalC in (see scheme in Figure 1). RSN depends on molecular parame-ters, PSN, of the SN components: specifically, kinetic parametersof the proteins/receptors, K = k1, . . ., kn (dissociation constants,catalytic rates), and their expression levels, E = e1, . . ., em. RSN alsodepends on the concentrations of drugs, D, which inhibit proteinsin the SN. Typically, RSN is measured in experimental systemsas the dose dependence of output signal on drug/ligand concen-tration at a defined time, t, following ligand/drug application ina cellular assay. The experimental dose dependence, RSN=Cout
Frontiers in Oncology | Pharmacology of Anti-Cancer Drugs February 2014 | Volume 4 | Article 13 | 2
Goltsov et al. Customizing the therapeutic response of signalling networks
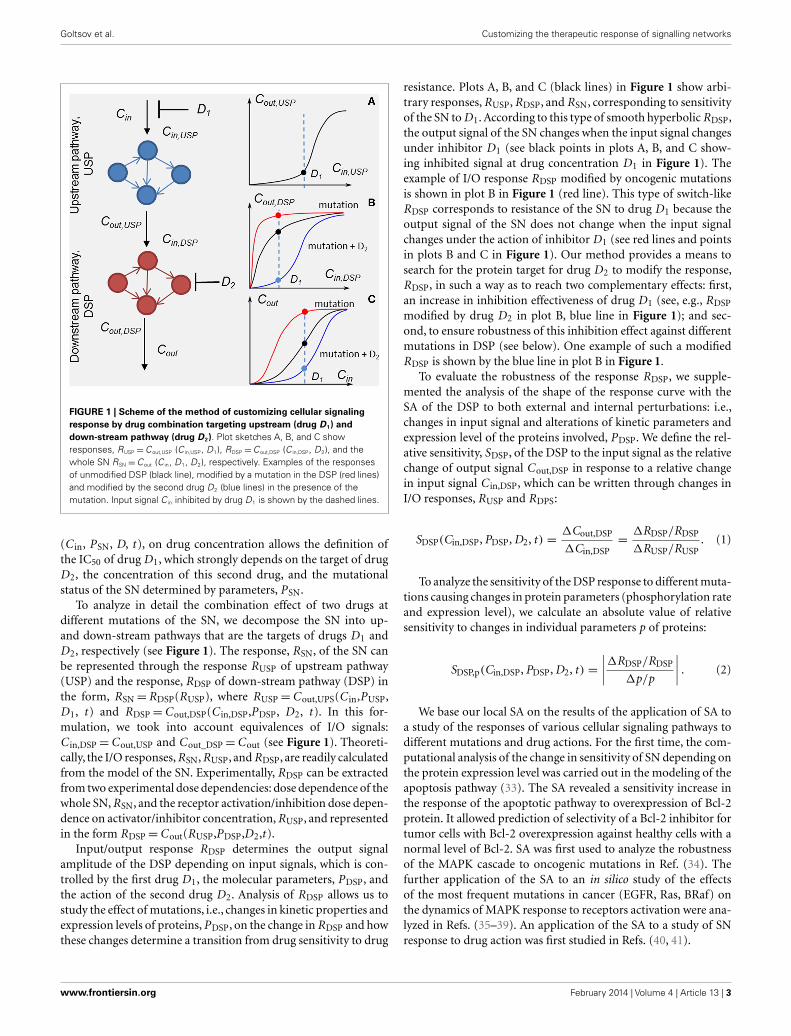
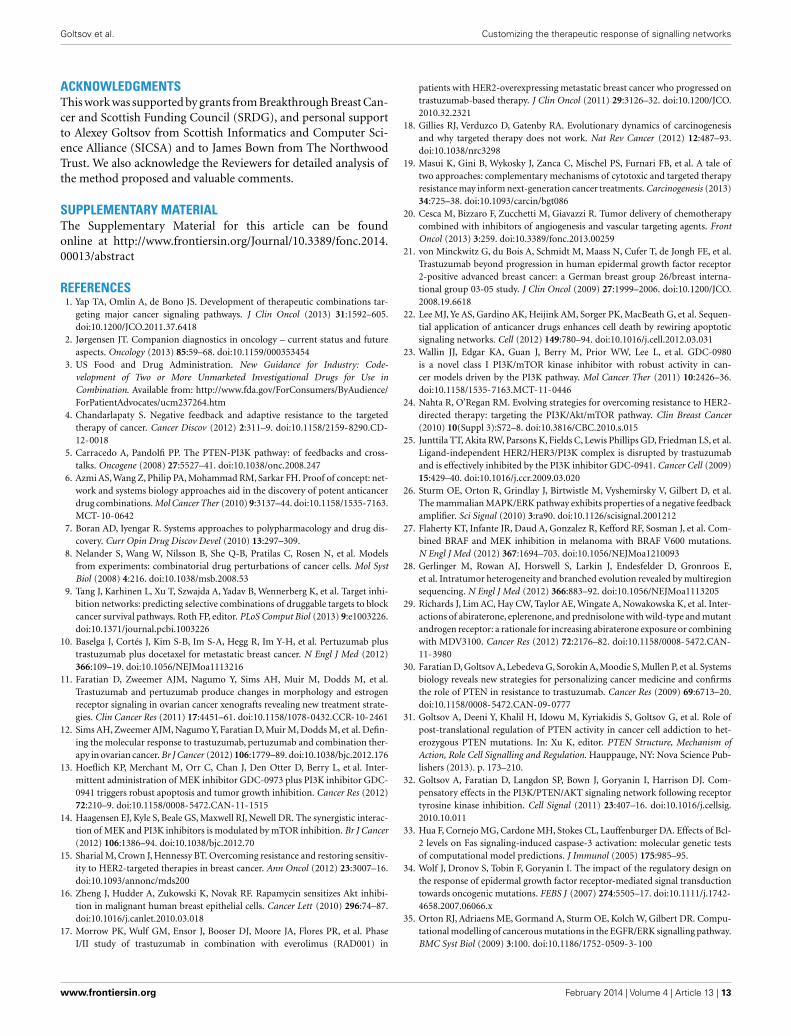
FIGURE 1 | Scheme of the method of customizing cellular signalingresponse by drug combination targeting upstream (drug D1) anddown-stream pathway (drug D2). Plot sketches A, B, and C showresponses, RUSP =Cout,USP (C in,USP, D1), RDSP =Cout,DSP (C in,DSP, D2), and thewhole SN RSN =Cout (C in, D1, D2), respectively. Examples of the responsesof unmodified DSP (black line), modified by a mutation in the DSP (red lines)and modified by the second drug D2 (blue lines) in the presence of themutation. Input signal C in inhibited by drug D1 is shown by the dashed lines.
(C in, PSN, D, t ), on drug concentration allows the definition ofthe IC50 of drug D1, which strongly depends on the target of drugD2, the concentration of this second drug, and the mutationalstatus of the SN determined by parameters, PSN.
To analyze in detail the combination effect of two drugs atdifferent mutations of the SN, we decompose the SN into up-and down-stream pathways that are the targets of drugs D1 andD2, respectively (see Figure 1). The response, RSN, of the SN canbe represented through the response RUSP of upstream pathway(USP) and the response, RDSP of down-stream pathway (DSP) inthe form, RSN=RDSP(RUSP), where RUSP=Cout,UPS(C in,PUSP,D1, t ) and RDSP=Cout,DSP(C in,DSP,PDSP, D2, t ). In this for-mulation, we took into account equivalences of I/O signals:C in,DSP=Cout,USP and Cout_DSP=Cout (see Figure 1). Theoreti-cally, the I/O responses, RSN, RUSP, and RDSP, are readily calculatedfrom the model of the SN. Experimentally, RDSP can be extractedfrom two experimental dose dependencies: dose dependence of thewhole SN, RSN, and the receptor activation/inhibition dose depen-dence on activator/inhibitor concentration, RUSP, and representedin the form RDSP=Cout(RUSP,PDSP,D2,t ).
Input/output response RDSP determines the output signalamplitude of the DSP depending on input signals, which is con-trolled by the first drug D1, the molecular parameters, PDSP, andthe action of the second drug D2. Analysis of RDSP allows us tostudy the effect of mutations, i.e., changes in kinetic properties andexpression levels of proteins, PDSP, on the change in RDSP and howthese changes determine a transition from drug sensitivity to drug
resistance. Plots A, B, and C (black lines) in Figure 1 show arbi-trary responses, RUSP, RDSP, and RSN, corresponding to sensitivityof the SN to D1. According to this type of smooth hyperbolic RDSP,the output signal of the SN changes when the input signal changesunder inhibitor D1 (see black points in plots A, B, and C show-ing inhibited signal at drug concentration D1 in Figure 1). Theexample of I/O response RDSP modified by oncogenic mutationsis shown in plot B in Figure 1 (red line). This type of switch-likeRDSP corresponds to resistance of the SN to drug D1 because theoutput signal of the SN does not change when the input signalchanges under the action of inhibitor D1 (see red lines and pointsin plots B and C in Figure 1). Our method provides a means tosearch for the protein target for drug D2 to modify the response,RDSP, in such a way as to reach two complementary effects: first,an increase in inhibition effectiveness of drug D1 (see, e.g., RDSP
modified by drug D2 in plot B, blue line in Figure 1); and sec-ond, to ensure robustness of this inhibition effect against differentmutations in DSP (see below). One example of such a modifiedRDSP is shown by the blue line in plot B in Figure 1.
To evaluate the robustness of the response RDSP, we supple-mented the analysis of the shape of the response curve with theSA of the DSP to both external and internal perturbations: i.e.,changes in input signal and alterations of kinetic parameters andexpression level of the proteins involved, PDSP. We define the rel-ative sensitivity, SDSP, of the DSP to the input signal as the relativechange of output signal Cout,DSP in response to a relative changein input signal C in,DSP, which can be written through changes inI/O responses, RUSP and RDPS:
SDSP(Cin,DSP, PDSP, D2, t ) =∆Cout,DSP
∆Cin,DSP=
∆RDSP/RDSP
∆RUSP/RUSP. (1)
To analyze the sensitivity of the DSP response to different muta-tions causing changes in protein parameters (phosphorylation rateand expression level), we calculate an absolute value of relativesensitivity to changes in individual parameters p of proteins:
SDSP,p(Cin,DSP, PDSP, D2, t ) =
∣∣∣∣∆RDSP/RDSP
∆p/p
∣∣∣∣ . (2)
We base our local SA on the results of the application of SA toa study of the responses of various cellular signaling pathways todifferent mutations and drug actions. For the first time, the com-putational analysis of the change in sensitivity of SN depending onthe protein expression level was carried out in the modeling of theapoptosis pathway (33). The SA revealed a sensitivity increase inthe response of the apoptotic pathway to overexpression of Bcl-2protein. It allowed prediction of selectivity of a Bcl-2 inhibitor fortumor cells with Bcl-2 overexpression against healthy cells with anormal level of Bcl-2. SA was first used to analyze the robustnessof the MAPK cascade to oncogenic mutations in Ref. (34). Thefurther application of the SA to an in silico study of the effectsof the most frequent mutations in cancer (EGFR, Ras, BRaf) onthe dynamics of MAPK response to receptors activation were ana-lyzed in Refs. (35–39). An application of the SA to a study of SNresponse to drug action was first studied in Refs. (40, 41).
www.frontiersin.org February 2014 | Volume 4 | Article 13 | 3
Goltsov et al. Customizing the therapeutic response of signalling networks
Sensitivity analysis of the I/O response allows us to: (i) deter-mine the resistance potential of a single drug and drug combina-tion to protein mutations in the DSP; and (ii) determine whetherthe DSP response to a specific drug combination is robust againstvarious mutations in the DSP and suggest more robust com-binations, which enhance the therapeutic effect in the face ofmutations.
RESULTSCHARACTERIZING SIGNALING NETWORK RESPONSE TO DIFFERENTONCOGENIC MUTATIONSWe illustrate this method by application to the analysis of theresponse of PI3K/PTEN/AKT signaling to a drug combination tar-geting the HER2 receptor and a protein in the DSP, PI3K, whichwere established to be promising drug targets in both mono- andcombination therapy in different cancers (1, 15, 42). The aim of theanalysis of known drugs and targets is to elucidate the mechanismunderlying high efficacy of their combination against differentoncogenic mutations in cancer (43, 44).
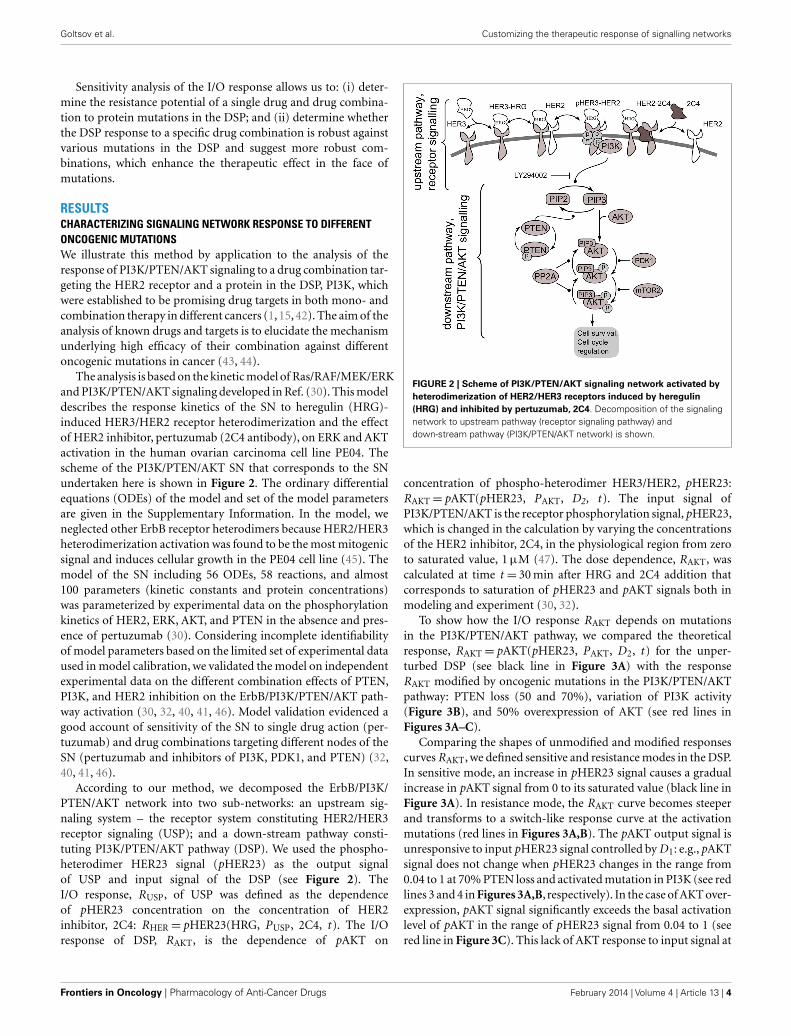
The analysis is based on the kinetic model of Ras/RAF/MEK/ERKand PI3K/PTEN/AKT signaling developed in Ref. (30). This modeldescribes the response kinetics of the SN to heregulin (HRG)-induced HER3/HER2 receptor heterodimerization and the effectof HER2 inhibitor, pertuzumab (2C4 antibody), on ERK and AKTactivation in the human ovarian carcinoma cell line PE04. Thescheme of the PI3K/PTEN/AKT SN that corresponds to the SNundertaken here is shown in Figure 2. The ordinary differentialequations (ODEs) of the model and set of the model parametersare given in the Supplementary Information. In the model, weneglected other ErbB receptor heterodimers because HER2/HER3heterodimerization activation was found to be the most mitogenicsignal and induces cellular growth in the PE04 cell line (45). Themodel of the SN including 56 ODEs, 58 reactions, and almost100 parameters (kinetic constants and protein concentrations)was parameterized by experimental data on the phosphorylationkinetics of HER2, ERK, AKT, and PTEN in the absence and pres-ence of pertuzumab (30). Considering incomplete identifiabilityof model parameters based on the limited set of experimental dataused in model calibration, we validated the model on independentexperimental data on the different combination effects of PTEN,PI3K, and HER2 inhibition on the ErbB/PI3K/PTEN/AKT path-way activation (30, 32, 40, 41, 46). Model validation evidenced agood account of sensitivity of the SN to single drug action (per-tuzumab) and drug combinations targeting different nodes of theSN (pertuzumab and inhibitors of PI3K, PDK1, and PTEN) (32,40, 41, 46).
According to our method, we decomposed the ErbB/PI3K/PTEN/AKT network into two sub-networks: an upstream sig-naling system – the receptor system constituting HER2/HER3receptor signaling (USP); and a down-stream pathway consti-tuting PI3K/PTEN/AKT pathway (DSP). We used the phospho-heterodimer HER23 signal (pHER23) as the output signalof USP and input signal of the DSP (see Figure 2). TheI/O response, RUSP, of USP was defined as the dependenceof pHER23 concentration on the concentration of HER2inhibitor, 2C4: RHER= pHER23(HRG, PUSP, 2C4, t ). The I/Oresponse of DSP, RAKT, is the dependence of pAKT on
FIGURE 2 | Scheme of PI3K/PTEN/AKT signaling network activated byheterodimerization of HER2/HER3 receptors induced by heregulin(HRG) and inhibited by pertuzumab, 2C4. Decomposition of the signalingnetwork to upstream pathway (receptor signaling pathway) anddown-stream pathway (PI3K/PTEN/AKT network) is shown.
concentration of phospho-heterodimer HER3/HER2, pHER23:RAKT= pAKT(pHER23, PAKT, D2, t ). The input signal ofPI3K/PTEN/AKT is the receptor phosphorylation signal, pHER23,which is changed in the calculation by varying the concentrationsof the HER2 inhibitor, 2C4, in the physiological region from zeroto saturated value, 1 µM (47). The dose dependence, RAKT, wascalculated at time t = 30 min after HRG and 2C4 addition thatcorresponds to saturation of pHER23 and pAKT signals both inmodeling and experiment (30, 32).
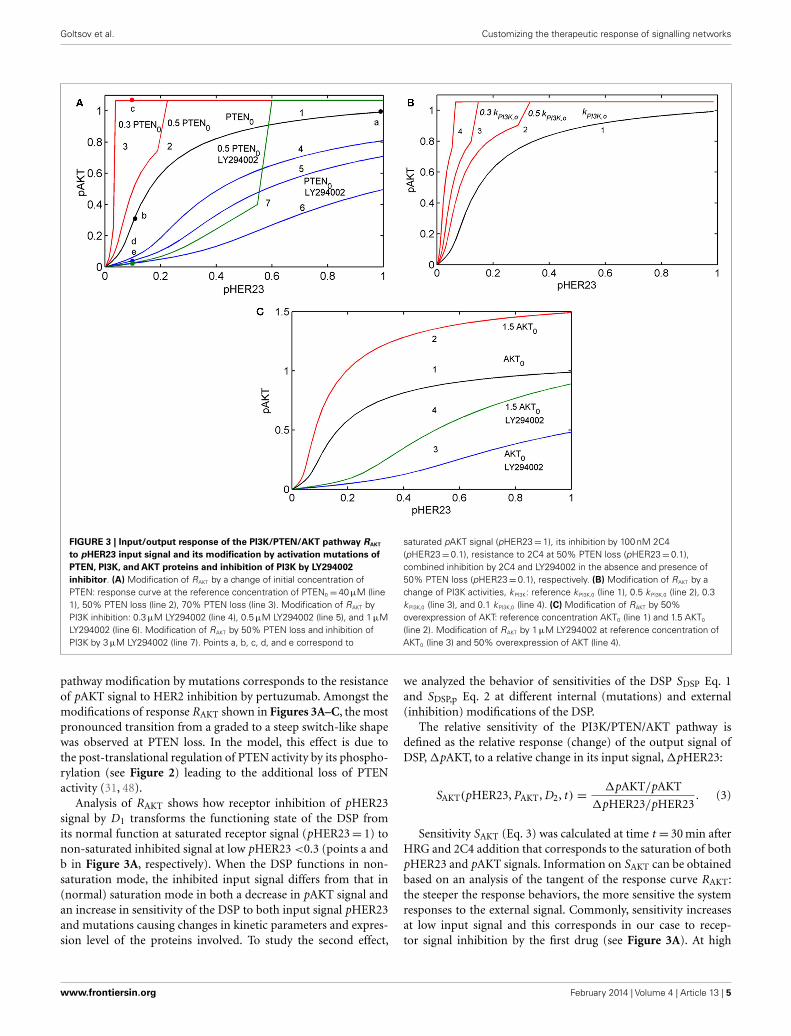
To show how the I/O response RAKT depends on mutationsin the PI3K/PTEN/AKT pathway, we compared the theoreticalresponse, RAKT= pAKT(pHER23, PAKT, D2, t ) for the unper-turbed DSP (see black line in Figure 3A) with the responseRAKT modified by oncogenic mutations in the PI3K/PTEN/AKTpathway: PTEN loss (50 and 70%), variation of PI3K activity(Figure 3B), and 50% overexpression of AKT (see red lines inFigures 3A–C).
Comparing the shapes of unmodified and modified responsescurves RAKT, we defined sensitive and resistance modes in the DSP.In sensitive mode, an increase in pHER23 signal causes a gradualincrease in pAKT signal from 0 to its saturated value (black line inFigure 3A). In resistance mode, the RAKT curve becomes steeperand transforms to a switch-like response curve at the activationmutations (red lines in Figures 3A,B). The pAKT output signal isunresponsive to input pHER23 signal controlled by D1: e.g., pAKTsignal does not change when pHER23 changes in the range from0.04 to 1 at 70% PTEN loss and activated mutation in PI3K (see redlines 3 and 4 in Figures 3A,B, respectively). In the case of AKT over-expression, pAKT signal significantly exceeds the basal activationlevel of pAKT in the range of pHER23 signal from 0.04 to 1 (seered line in Figure 3C). This lack of AKT response to input signal at
Frontiers in Oncology | Pharmacology of Anti-Cancer Drugs February 2014 | Volume 4 | Article 13 | 4
Goltsov et al. Customizing the therapeutic response of signalling networks
FIGURE 3 | Input/output response of the PI3K/PTEN/AKT pathway RAKT
to pHER23 input signal and its modification by activation mutations ofPTEN, PI3K, and AKT proteins and inhibition of PI3K by LY294002inhibitor. (A) Modification of RAKT by a change of initial concentration ofPTEN: response curve at the reference concentration of PTEN0 =40 µM (line1), 50% PTEN loss (line 2), 70% PTEN loss (line 3). Modification of RAKT byPI3K inhibition: 0.3 µM LY294002 (line 4), 0.5 µM LY294002 (line 5), and 1 µMLY294002 (line 6). Modification of RAKT by 50% PTEN loss and inhibition ofPI3K by 3 µM LY294002 (line 7). Points a, b, c, d, and e correspond to
saturated pAKT signal (pHER23=1), its inhibition by 100 nM 2C4(pHER23=0.1), resistance to 2C4 at 50% PTEN loss (pHER23= 0.1),combined inhibition by 2C4 and LY294002 in the absence and presence of50% PTEN loss (pHER23=0.1), respectively. (B) Modification of RAKT by achange of PI3K activities, kPI3K: reference kPI3K,0 (line 1), 0.5 kPI3K,0 (line 2), 0.3kPI3K,0 (line 3), and 0.1 kPI3K,0 (line 4). (C) Modification of RAKT by 50%overexpression of AKT: reference concentration AKT0 (line 1) and 1.5 AKT0
(line 2). Modification of RAKT by 1 µM LY294002 at reference concentration ofAKT0 (line 3) and 50% overexpression of AKT (line 4).
pathway modification by mutations corresponds to the resistanceof pAKT signal to HER2 inhibition by pertuzumab. Amongst themodifications of response RAKT shown in Figures 3A–C, the mostpronounced transition from a graded to a steep switch-like shapewas observed at PTEN loss. In the model, this effect is due tothe post-translational regulation of PTEN activity by its phospho-rylation (see Figure 2) leading to the additional loss of PTENactivity (31, 48).
Analysis of RAKT shows how receptor inhibition of pHER23signal by D1 transforms the functioning state of the DSP fromits normal function at saturated receptor signal (pHER23= 1) tonon-saturated inhibited signal at low pHER23 <0.3 (points a andb in Figure 3A, respectively). When the DSP functions in non-saturation mode, the inhibited input signal differs from that in(normal) saturation mode in both a decrease in pAKT signal andan increase in sensitivity of the DSP to both input signal pHER23and mutations causing changes in kinetic parameters and expres-sion level of the proteins involved. To study the second effect,
we analyzed the behavior of sensitivities of the DSP SDSP Eq. 1and SDSP,p Eq. 2 at different internal (mutations) and external(inhibition) modifications of the DSP.
The relative sensitivity of the PI3K/PTEN/AKT pathway isdefined as the relative response (change) of the output signal ofDSP, ∆pAKT, to a relative change in its input signal, ∆pHER23:
SAKT(pHER23, PAKT, D2, t ) =∆pAKT/pAKT
∆pHER23/pHER23. (3)
Sensitivity SAKT (Eq. 3) was calculated at time t = 30 min afterHRG and 2C4 addition that corresponds to the saturation of bothpHER23 and pAKT signals. Information on SAKT can be obtainedbased on an analysis of the tangent of the response curve RAKT:the steeper the response behaviors, the more sensitive the systemresponses to the external signal. Commonly, sensitivity increasesat low input signal and this corresponds in our case to recep-tor signal inhibition by the first drug (see Figure 3A). At high
www.frontiersin.org February 2014 | Volume 4 | Article 13 | 5

Goltsov et al. Customizing the therapeutic response of signalling networks
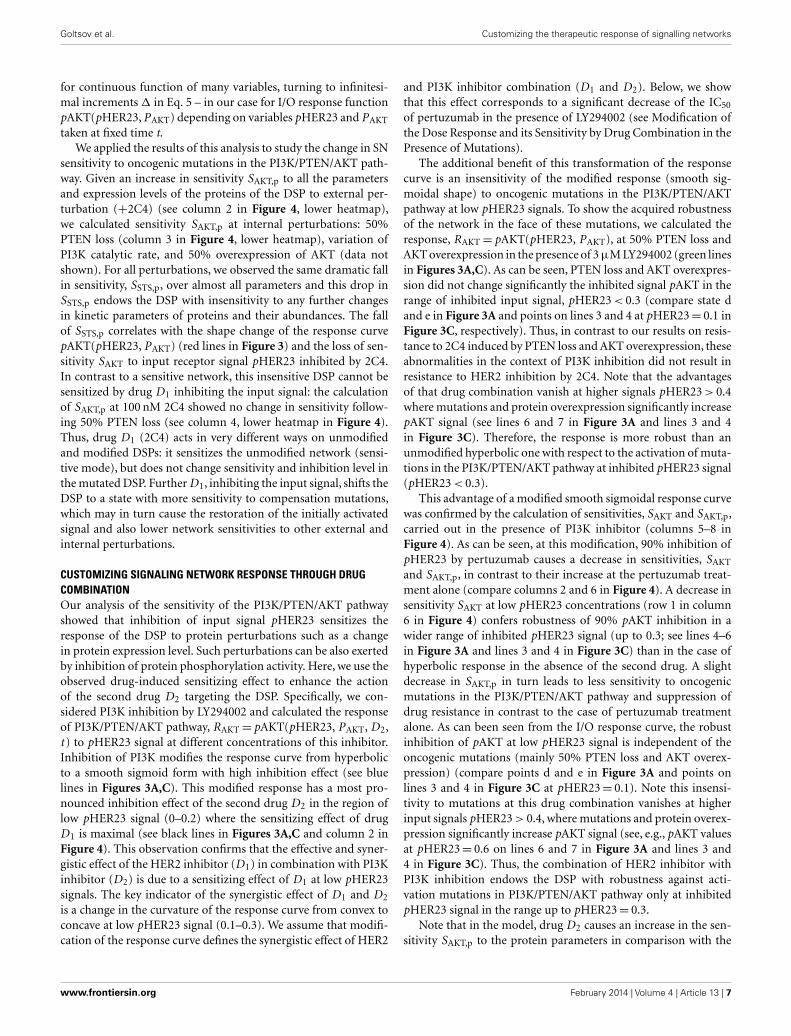
receptor signal, SAKT decreases at saturated signal, pHER23∼= 1.We represent the theoretical sensitivity SAKT (Eq. 3) as the upperheatmap in Figure 4 (columns 1–4) calculated at different pertur-bations of the DSP: (1) at the activation of DSP (pHER23= 1);(2) at the presence of 100 nM 2C4 (pHER23= 0.1); (3) 50%PTEN loss (pHER23= 1); and (4) 50% PTEN loss with 100 nM2C4 (pHER23= 0.1). According to the shape change in responsecurve under these perturbations (see Figure 3A), the sensitivitySAKT increases under 2C4 treatment in sensitive mode (comparecolumns 1 and 2) and decreases at 50% PTEN loss, correspondingto resistance mode (compare columns 1 with 3 and 4).
We also observed that the sensitivity of the DSP SAKT,p to pro-tein parameters and expression level increases in the same regionof pHER23 signal (40). Relative sensitivities SAKT,p (Eq. 2) of thePI3K/PTEN/AKT pathway to a specific parameter p (includingkinetic parameters and expression levels of the signaling proteins)were determined as follows:
SAKT,p(pHER23, PAKT, D2, t ) =
∣∣∣∣∆pAKT/pAKT
∆p/p
∣∣∣∣ . (4)
To show how drug and protein mutations change sensitivity,SAKT,p (Eq. 4), we calculated and compared SAKT,p for kineticparameters and initial concentrations of proteins involved in thePI3K/PTEN/AKT network under a normal functioning of theDPS and the mutations considered above. Figure 4 (middle andlower heatmaps, columns 1–4) shows SSTS,p calculated at: (1)HER23 activation by HRG (pHER23= 1); (2) in the presenceof HER2 inhibitor, 2C4, when pHER23 signal is 90% inhibited
(pHER23= 0.1); (3) at 50% PTEN loss (pHER23= 1); and (4)at 50% PTEN loss in the presence of 2C4 (pHER23= 0.1) (seecolumns 1–4 in Figure 4, respectively). Analysis of SAKT,p at nor-mal signaling in the PI3K/PTEN/AKT network (pHER23= 1)revealed the most sensitive modules within this network (see col-umn 1 in Figure 4). The results obtained in our model are inagreement with the results of local and global sensitivity analysesof other models of the PI3K/PTEN/AKT pathway (41, 49, 50).
We observed a two-to-four orders of magnitude increase inSAKT,p in response to changes in the kinetic parameters and initialconcentrations of the proteins at 90% inhibition of pHER23 sig-nal by 100 nM 2C4 (compare columns 1 and 2 in Figure 4, lowerheatmap). This increase correlates with an increase in sensitiv-ity, SAKT, at an inhibited signal of pHER23 (see upper heatmapin Figure 4). The increase in sensitivities SAKT and SSTS,p at lowpHER23 signals corresponds to the transition of the DSP fromfunctioning in saturated mode (pHER23∼= 1) to functioning atHER2 inhibition (non-saturation). This correlation in the behav-ior of SAKT and SSTS,p can be readily understood: sensitivity,SAKT,p(pHER23, PAKT), to a change in PAKT varies in accordancewith sensitivity SAKT (pHER2, PAKT) to a change in input signal,pHER23:
∆SAKT(pHER23, PAKT)
∆p=
∆SAKT,p(pHER23, PAKT)
∆pHER23, (5)
where ∆SAKT and ∆SAKT,p denote sensitivity changes. Equation 5can be derived from well-known equality of mixed derivatives
FIGURE 4 | A change in sensitivities SAKT and SAKT,p following differentperturbations in the PI3K/PTEN/AKT network. Heatmap of sensitivity SAKT
to pHER23 signal (upper heatmap) and sensitivity SAKT,p to kinetic parameters(middle heatmap) and initial protein concentrations (lower heatmap) at normalfunctioning of the SN (column 1), in the presence of 100 nM 2C4 (column 2),
and at 50% PTEN loss in the absence (column 3) and presence of 100 nM2C4 (column 4). Columns 5–8 show SATP,p as per columns 1–4 in the presenceof 3 µM LY294002. The relative change of the parameters in sensitivityanalysis was 0.01% (see Eq. 4) and sensitivity values were taken at timet =30 min after HRG and 2C4 addition.
Frontiers in Oncology | Pharmacology of Anti-Cancer Drugs February 2014 | Volume 4 | Article 13 | 6
Goltsov et al. Customizing the therapeutic response of signalling networks
for continuous function of many variables, turning to infinitesi-mal increments ∆ in Eq. 5 – in our case for I/O response functionpAKT(pHER23, PAKT) depending on variables pHER23 and PAKT
taken at fixed time t.We applied the results of this analysis to study the change in SN
sensitivity to oncogenic mutations in the PI3K/PTEN/AKT path-way. Given an increase in sensitivity SAKT,p to all the parametersand expression levels of the proteins of the DSP to external per-turbation (+2C4) (see column 2 in Figure 4, lower heatmap),we calculated sensitivity SAKT,p at internal perturbations: 50%PTEN loss (column 3 in Figure 4, lower heatmap), variation ofPI3K catalytic rate, and 50% overexpression of AKT (data notshown). For all perturbations, we observed the same dramatic fallin sensitivity, SSTS,p, over almost all parameters and this drop inSSTS,p endows the DSP with insensitivity to any further changesin kinetic parameters of proteins and their abundances. The fallof SSTS,p correlates with the shape change of the response curvepAKT(pHER23, PAKT) (red lines in Figure 3) and the loss of sen-sitivity SAKT to input receptor signal pHER23 inhibited by 2C4.In contrast to a sensitive network, this insensitive DSP cannot besensitized by drug D1 inhibiting the input signal: the calculationof SAKT,p at 100 nM 2C4 showed no change in sensitivity follow-ing 50% PTEN loss (see column 4, lower heatmap in Figure 4).Thus, drug D1 (2C4) acts in very different ways on unmodifiedand modified DSPs: it sensitizes the unmodified network (sensi-tive mode), but does not change sensitivity and inhibition level inthe mutated DSP. Further D1, inhibiting the input signal, shifts theDSP to a state with more sensitivity to compensation mutations,which may in turn cause the restoration of the initially activatedsignal and also lower network sensitivities to other external andinternal perturbations.
CUSTOMIZING SIGNALING NETWORK RESPONSE THROUGH DRUGCOMBINATIONOur analysis of the sensitivity of the PI3K/PTEN/AKT pathwayshowed that inhibition of input signal pHER23 sensitizes theresponse of the DSP to protein perturbations such as a changein protein expression level. Such perturbations can be also exertedby inhibition of protein phosphorylation activity. Here, we use theobserved drug-induced sensitizing effect to enhance the actionof the second drug D2 targeting the DSP. Specifically, we con-sidered PI3K inhibition by LY294002 and calculated the responseof PI3K/PTEN/AKT pathway, RAKT= pAKT(pHER23, PAKT, D2,t ) to pHER23 signal at different concentrations of this inhibitor.Inhibition of PI3K modifies the response curve from hyperbolicto a smooth sigmoid form with high inhibition effect (see bluelines in Figures 3A,C). This modified response has a most pro-nounced inhibition effect of the second drug D2 in the region oflow pHER23 signal (0–0.2) where the sensitizing effect of drugD1 is maximal (see black lines in Figures 3A,C and column 2 inFigure 4). This observation confirms that the effective and syner-gistic effect of the HER2 inhibitor (D1) in combination with PI3Kinhibitor (D2) is due to a sensitizing effect of D1 at low pHER23signals. The key indicator of the synergistic effect of D1 and D2
is a change in the curvature of the response curve from convex toconcave at low pHER23 signal (0.1–0.3). We assume that modifi-cation of the response curve defines the synergistic effect of HER2
and PI3K inhibitor combination (D1 and D2). Below, we showthat this effect corresponds to a significant decrease of the IC50
of pertuzumab in the presence of LY294002 (see Modification ofthe Dose Response and its Sensitivity by Drug Combination in thePresence of Mutations).
The additional benefit of this transformation of the responsecurve is an insensitivity of the modified response (smooth sig-moidal shape) to oncogenic mutations in the PI3K/PTEN/AKTpathway at low pHER23 signals. To show the acquired robustnessof the network in the face of these mutations, we calculated theresponse, RAKT= pAKT(pHER23, PAKT), at 50% PTEN loss andAKT overexpression in the presence of 3 µM LY294002 (green linesin Figures 3A,C). As can be seen, PTEN loss and AKT overexpres-sion did not change significantly the inhibited signal pAKT in therange of inhibited input signal, pHER23 < 0.3 (compare state dand e in Figure 3A and points on lines 3 and 4 at pHER23= 0.1 inFigure 3C, respectively). Thus, in contrast to our results on resis-tance to 2C4 induced by PTEN loss and AKT overexpression, theseabnormalities in the context of PI3K inhibition did not result inresistance to HER2 inhibition by 2C4. Note that the advantagesof that drug combination vanish at higher signals pHER23 > 0.4where mutations and protein overexpression significantly increasepAKT signal (see lines 6 and 7 in Figure 3A and lines 3 and 4in Figure 3C). Therefore, the response is more robust than anunmodified hyperbolic one with respect to the activation of muta-tions in the PI3K/PTEN/AKT pathway at inhibited pHER23 signal(pHER23 < 0.3).
This advantage of a modified smooth sigmoidal response curvewas confirmed by the calculation of sensitivities, SAKT and SAKT,p,carried out in the presence of PI3K inhibitor (columns 5–8 inFigure 4). As can be seen, at this modification, 90% inhibition ofpHER23 by pertuzumab causes a decrease in sensitivities, SAKT
and SAKT,p, in contrast to their increase at the pertuzumab treat-ment alone (compare columns 2 and 6 in Figure 4). A decrease insensitivity SAKT at low pHER23 concentrations (row 1 in column6 in Figure 4) confers robustness of 90% pAKT inhibition in awider range of inhibited pHER23 signal (up to 0.3; see lines 4–6in Figure 3A and lines 3 and 4 in Figure 3C) than in the case ofhyperbolic response in the absence of the second drug. A slightdecrease in SAKT,p in turn leads to less sensitivity to oncogenicmutations in the PI3K/PTEN/AKT pathway and suppression ofdrug resistance in contrast to the case of pertuzumab treatmentalone. As can been seen from the I/O response curve, the robustinhibition of pAKT at low pHER23 signal is independent of theoncogenic mutations (mainly 50% PTEN loss and AKT overex-pression) (compare points d and e in Figure 3A and points onlines 3 and 4 in Figure 3C at pHER23= 0.1). Note this insensi-tivity to mutations at this drug combination vanishes at higherinput signals pHER23 > 0.4, where mutations and protein overex-pression significantly increase pAKT signal (see, e.g., pAKT valuesat pHER23= 0.6 on lines 6 and 7 in Figure 3A and lines 3 and4 in Figure 3C). Thus, the combination of HER2 inhibitor withPI3K inhibition endows the DSP with robustness against acti-vation mutations in PI3K/PTEN/AKT pathway only at inhibitedpHER23 signal in the range up to pHER23= 0.3.
Note that in the model, drug D2 causes an increase in the sen-sitivity SAKT,p to the protein parameters in comparison with the
www.frontiersin.org February 2014 | Volume 4 | Article 13 | 7
Goltsov et al. Customizing the therapeutic response of signalling networks
unperturbed SN that can sensitize the DSP to compensatory muta-tions (see columns 1 and 5 in Figure 4). This discrepancy may bedue to the fact that in the calculation we compared the sensi-tivity at inhibited (pHER23= 0.1) and saturated (pHER23= 1)pHER23 signals (points d and a in Figure 3A, respectively). Herewe assumed that the activation growth factor signal (1 nM HRG)is saturated (point a in Figure 3A). However, if we assume ligandconcentration to be lower than the saturation level (e.g., 0.6–0.8)(51) and compare the sensitivities at inhibited and this pHER23signal, we find that drug D2 does not change the sensitivity incomparison with the unperturbed DSP (data not shown).
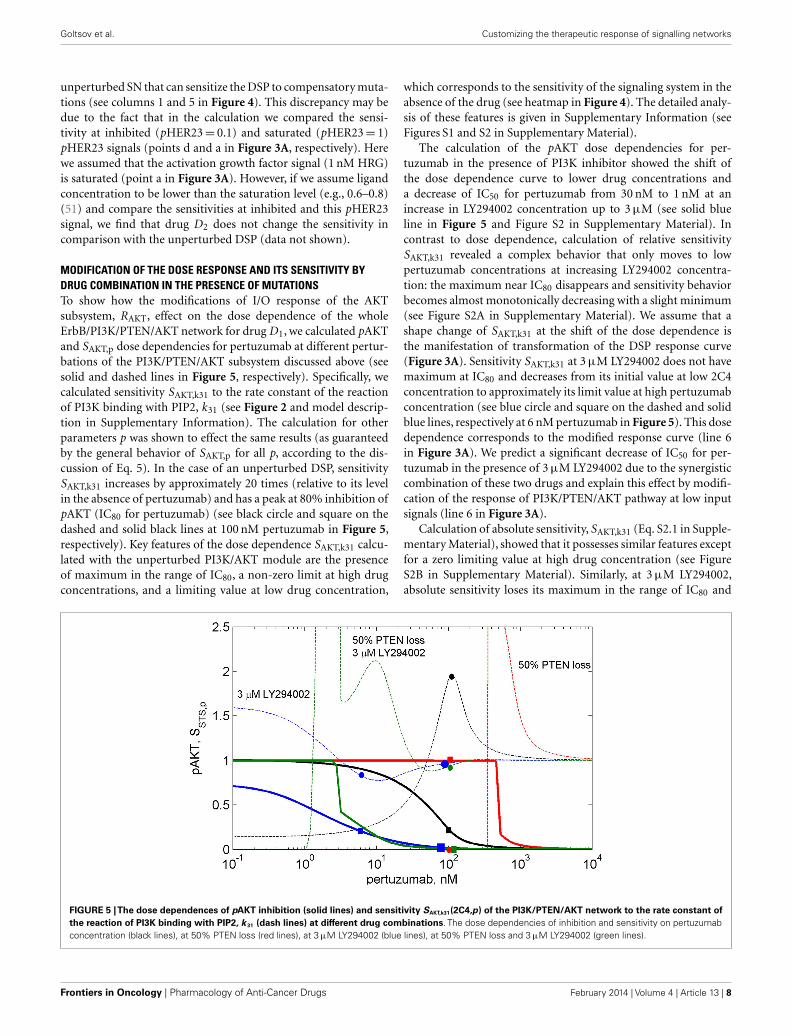
MODIFICATION OF THE DOSE RESPONSE AND ITS SENSITIVITY BYDRUG COMBINATION IN THE PRESENCE OF MUTATIONSTo show how the modifications of I/O response of the AKTsubsystem, RAKT, effect on the dose dependence of the wholeErbB/PI3K/PTEN/AKT network for drug D1, we calculated pAKTand SAKT,p dose dependencies for pertuzumab at different pertur-bations of the PI3K/PTEN/AKT subsystem discussed above (seesolid and dashed lines in Figure 5, respectively). Specifically, wecalculated sensitivity SAKT,k31 to the rate constant of the reactionof PI3K binding with PIP2, k31 (see Figure 2 and model descrip-tion in Supplementary Information). The calculation for otherparameters p was shown to effect the same results (as guaranteedby the general behavior of SAKT,p for all p, according to the dis-cussion of Eq. 5). In the case of an unperturbed DSP, sensitivitySAKT,k31 increases by approximately 20 times (relative to its levelin the absence of pertuzumab) and has a peak at 80% inhibition ofpAKT (IC80 for pertuzumab) (see black circle and square on thedashed and solid black lines at 100 nM pertuzumab in Figure 5,respectively). Key features of the dose dependence SAKT,k31 calcu-lated with the unperturbed PI3K/AKT module are the presenceof maximum in the range of IC80, a non-zero limit at high drugconcentrations, and a limiting value at low drug concentration,
which corresponds to the sensitivity of the signaling system in theabsence of the drug (see heatmap in Figure 4). The detailed analy-sis of these features is given in Supplementary Information (seeFigures S1 and S2 in Supplementary Material).
The calculation of the pAKT dose dependencies for per-tuzumab in the presence of PI3K inhibitor showed the shift ofthe dose dependence curve to lower drug concentrations anda decrease of IC50 for pertuzumab from 30 nM to 1 nM at anincrease in LY294002 concentration up to 3 µM (see solid blueline in Figure 5 and Figure S2 in Supplementary Material). Incontrast to dose dependence, calculation of relative sensitivitySAKT,k31 revealed a complex behavior that only moves to lowpertuzumab concentrations at increasing LY294002 concentra-tion: the maximum near IC80 disappears and sensitivity behaviorbecomes almost monotonically decreasing with a slight minimum(see Figure S2A in Supplementary Material). We assume that ashape change of SAKT,k31 at the shift of the dose dependence isthe manifestation of transformation of the DSP response curve(Figure 3A). Sensitivity SAKT,k31 at 3 µM LY294002 does not havemaximum at IC80 and decreases from its initial value at low 2C4concentration to approximately its limit value at high pertuzumabconcentration (see blue circle and square on the dashed and solidblue lines, respectively at 6 nM pertuzumab in Figure 5). This dosedependence corresponds to the modified response curve (line 6in Figure 3A). We predict a significant decrease of IC50 for per-tuzumab in the presence of 3 µM LY294002 due to the synergisticcombination of these two drugs and explain this effect by modifi-cation of the response of PI3K/PTEN/AKT pathway at low inputsignals (line 6 in Figure 3A).
Calculation of absolute sensitivity, SAKT,k31 (Eq. S2.1 in Supple-mentary Material), showed that it possesses similar features exceptfor a zero limiting value at high drug concentration (see FigureS2B in Supplementary Material). Similarly, at 3 µM LY294002,absolute sensitivity loses its maximum in the range of IC80 and
FIGURE 5 |The dose dependences of pAKT inhibition (solid lines) and sensitivity SAKT,k31(2C4,p) of the PI3K/PTEN/AKT network to the rate constant ofthe reaction of PI3K binding with PIP2, k 31 (dash lines) at different drug combinations. The dose dependencies of inhibition and sensitivity on pertuzumabconcentration (black lines), at 50% PTEN loss (red lines), at 3 µM LY294002 (blue lines), at 50% PTEN loss and 3 µM LY294002 (green lines).
Frontiers in Oncology | Pharmacology of Anti-Cancer Drugs February 2014 | Volume 4 | Article 13 | 8
Goltsov et al. Customizing the therapeutic response of signalling networks
monotonically decreases when drug concentration increases. Weconsider this transformation of sensitivity behavior as the resultsof modification of the DSP dose response from hyperbolic tosmooth sigmoid shape (Figure 3). This transformation, and therange of second drug concentration where it occurs, can be used inoptimization of drug composition to inhibit signaling, so avoidinga significant increase in sensitivity of the SNs to mutations. Belowwe consider one such optimization.
Transformation of the response of the DSP module leads topAKT inhibition by two drugs to exceed 80% in the wide rangeof LY294002 concentrations (0.3–3 µM) at a significantly lowerconcentration of pertuzumab (6 nM) in comparison with pAKTinhibition by pertuzumab alone, 100 nM (see Figure 5; FigureS2 in Supplementary Material). This allows optimization of drugconcentrations with respect to both inhibition of pAKT signal andsensitivity of the SN to mutations. Since these two characteristicsare interlinked and change correlatively in the same region of theresponse curve (Figure 3A) and dose dependence (Figure 5), theproblem of trade-off between them arises. It is possible to disen-tangle inhibition and sensitivity characteristics from each other byoptimal manipulation of two drugs in the concentration range dis-cussed above. One can establish two optimized conditions of drugcombination action with high inhibition and low sensitivity. Thefirst optimum condition is to decrease 2C4 concentration to main-tain 80% inhibition of pAKT (IC80= 6 nM) with low sensitivity at2–3 µM LY294002 (see blue square and circle on solid and dashedblue lines respectively in Figure 5 and lines 5 and 6 in Figure S2 inSupplementary Material). The second optimum is full inhibitionof pAKT with 100 nM pertuzumab and a minimal increase (sixtimes) of sensitivity at 3 µM LY294002 (see large blue square andcircle on solid and dashed blue lines respectively in Figure 5).
To demonstrate the sensitivity to resistance transition inresponse to HER2 inhibition at PTEN loss, we calculated the dosedependences of pAKT and SAKT,p at 50% PTEN loss (see red solidand dashed lines in Figure 5 and corresponding I/O response ofthe pAKT, line 2 in Figure 3A). PTEN loss leads to a 10-fold shiftof pAKT dependence to a higher pertuzumab concentration, socausing resistance to HER2 inhibition in the range of physiolog-ical pertuzumab concentration (100 nM). In this region of drugconcentration, both inhibition of pAKT and sensitivity SAKT,p areapproximately zero (see red square and circle on solid and dashedred lines in Figure 5, respectively). Sensitivity to HER2 inhibitionis restored through modification of the network by PI3K inhibitor,LY294002. This modification causes approximately full inhibitionof pAKT (green square on green solid line in Figure 5) while sen-sitivity SAKT,p (green circle on green dashed line in Figure 5) is atapproximately the same level as for normal PTEN concentration.
Joint analysis of the I/O response of the PI3K/PTEN/AKTpathway and pAKT dose dependence for pertuzumab (drug D1)revealed a trade-off between inhibition and sensitivity, which canbe formulated as follows. If the concentration of drug D1 is high(low pHER23 signal), pAKT inhibition is strong and sensitivity toprotein parameters is low: this is of a benefit with respect to sig-nal inhibition and suppression of compensatory mutations. If theconcentration of D1 is low (high pHER23 signal), pAKT concen-tration increases while sensitivity decreases, which gives advan-tages with respect to mutation suppression but leads to a decrease
in inhibition effect of the drug, D1. If the concentration of drug D1
is in the region of its IC50, sensitivity increases which affords theuse of the second drug more effectively (drug-sensitizing effect),and a disadvantage with respect to increasing sensitivity of the SNto compensation mutations. This analysis showed the inhibition-sensitivity trade-off decision can be optimized by customizingthe I/O response of the SN through manipulation of the con-centrations of the two drugs. Optimization of drug concentrationallows the separation of the regions with high inhibition and highsensitivity, which overlap each other in single drug treatment.
DISCUSSIONWe have shown that the sensitivity of the SN to drug action isattended by an increase in sensitivity SDSP,p of the DSP to thekinetic parameters and expression levels of the proteins involvedin this pathway. As a result, the DSP is sensitized by drug actionand may be more fragile with respect to mutations, which changeprotein kinetic properties (catalytic or/and dissociation constants)and their expression level (overexpression or suppression of geneexpression). In particular, an increasing sensitivity may result in anadverse effect of inhibitor action since a high sensitivity endows theSN with fragility with respect to mutations that can compensatefor the intended inhibitor effect by restoring a high output signalas well as initial low sensitivity of the SN to external perturbations.It follows that increasing SN sensitivity can be one of the causesof resistance potential to drug action. We suggest that this effectshould be taken into account at drug target validation, and thedrug resistance potential linked with this sensitizing effect shouldbe evaluated in drug combination co-development. We presenta method to design drug combination strategies that modify theI/O response of the SN to minimize any drug-sensitizing effect,enhance robustness of drug inhibition effect, and improve drugresistance potential by vertically targeting the SN.
The method is based on the modularity approach to analyz-ing the efficacy of combination therapy developed by Fitzgeraldet al. (52). According to this approach, we divide the signaling sys-tem into up- and down-stream pathways, which are the targets ofthe first and second drugs, respectively (see scheme in Figure 1).In this work, we focused on the I/O response characteristics ofthe down-stream pathways, DSP, which is a signal transductionmodule in the whole signaling pathway. As shown in Ref. (52),the effect of drug combination significantly depends on the I/Oresponse properties of the receptor systems, and mainly receptorexpression level, that shifts the IC50 concentration of drug, D1.To exclude the effects determined by the I/O response propertiesof the receptor system, we considered only the output signal ofthe USP which is varied from zero to a saturated level. In thismodularity approach, the effect of drug D1 defines only the inputsignal for the I/O response curve of the DSP (see Figures 1 and3A). We expanded this approach developed by Fitzgerald et al.(52) to investigate the modification of the I/O response of thedown-stream pathways as a result of external and internal per-turbations such as inhibition of signaling proteins and proteinmutations. The analysis of the responsiveness of the whole sys-tem to the first drug was shown to depend significantly on theI/O response characteristic of the down-stream signaling module.We suggest that the response curve, RDSP, can be considered as
www.frontiersin.org February 2014 | Volume 4 | Article 13 | 9

Goltsov et al. Customizing the therapeutic response of signalling networks
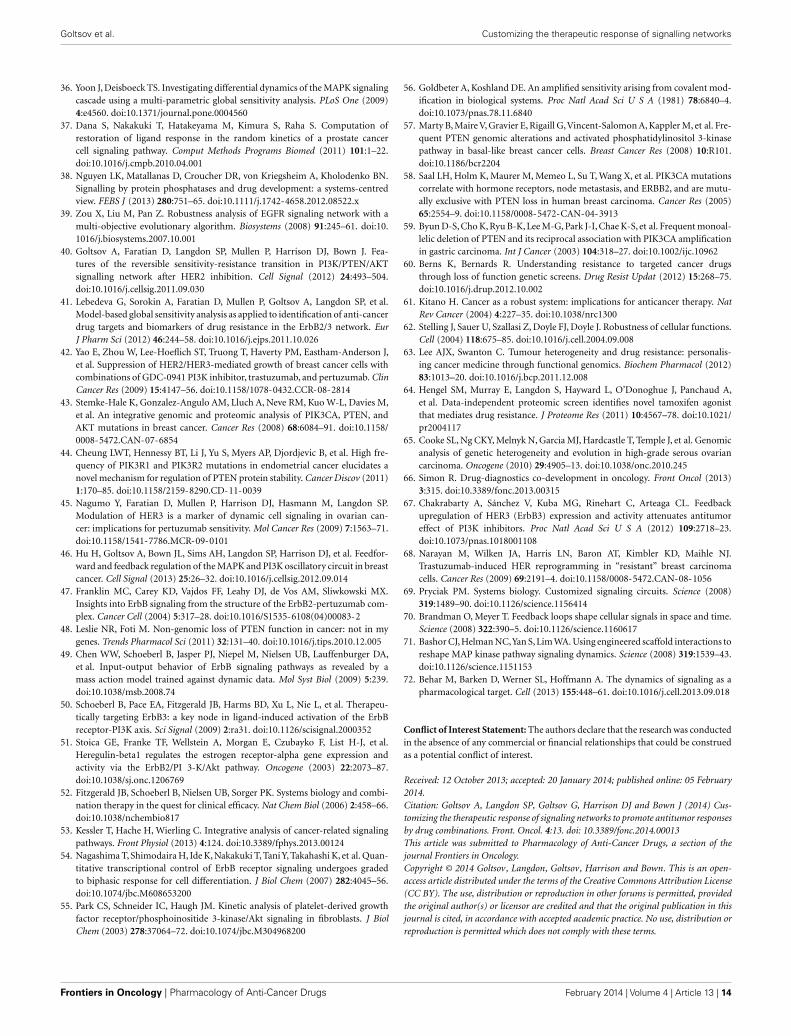
a biomarker (characteristic signature) of a particular cancer sig-naling pathways (e.g., MAPK, PI3K/AKT, Wnt, and others (53)in specific cancer cell lines. To illustrate this, we have extractedthe I/O response RDSP of the PI3K/PTEN/AKT and MAPK path-ways for different cancer cell lines using experimental data on thedose dependence of receptor activation (EGFR and PDGFR) andoutput signal (pAKT and pERK) on ligand concentrations (EGFand PDGF) (49, 54, 55). The characteristic I/O response curvesobtained for different activating input signals in various cell linesare shown in Figure 6. The experimental data on I/O responseswere fitted by the Hill function with a Hill constant, n, which char-acterizes that response as switch-like (higher n) or more graded(lower n). As shown, AKT responses are more varied comparedwith the more conserved set of ERK responses that are typicallyswitch-like (n= 2.65–12.8). pAKT responses range from switch-like for HBL and AU565 cells (Figures 6A,B) to graded hyperbolicfor T47 and PE04 cells (Figures 6C,E,F) and smooth sigmoidalfor MCF7 cells (Figure 6D) responses. We assume that such vari-ety in the responses of the PI3K/PTEN/AKT pathway results froma variation in the internal parameters of the networks caused bymutations and different expression levels of signaling proteins.We suggest that I/O responses can be considered as a biomarker ofmutation and protein expression status of specific cancer cells.
The in silico analysis of the I/O response of thePI3K/PTEN/AKT pathway confirmed that the SN can possess asmooth hyperbolic response, which corresponds to the sensitivitymode in signal transduction, and this response can be transformed
into a switch-like response by changing protein parameters, whichcorresponds to activating mutations of the proteins involved(PTEN, PI3K, and AKT). This transformation relates to the tran-sition from sensitivity to resistance of the SN to drug inhibitingreceptor signals (32). Joint analysis of the I/O response of thePI3K/PTEN/AKT pathway and its sensitivity showed that thesetwo key characteristics of the cellular SN are interconnected andthey both significantly depend on the protein parameters andtheir expression levels. We observed from in silico experimentsthat perturbations of protein parameters corresponding either to50% decreases in PTEN concentration (PTEN loss), PI3K acti-vation mutation, or AKT overexpression significantly changes inthe I/O response of the PI3K/PTEN/AKT pathway and its sen-sitivity. The transformation of the I/O response from smoothhyperbolic to switch-like at PTEN loss significantly endows theSN with hypersensitivity (56) that is assumed to be typical for thesignaling cascade in cells at decreasing phosphatase activity (38).The steep switch response observed at PTEN loss is assumed tobe due to a post-translational regulation of PTEN activity by itsphosphorylation leading to the additional loss of PTEN activity(31, 48) considered in our model.
We showed that PTEN loss, or PIK3CA activation muta-tion, AKT and PI3K overexpression (40) decreased sensitivitySAKT,p by four to six orders of magnitude for all protein para-meters and this corresponds to the transformation of the I/Oresponse from smooth hyperbolic to switch-like. At this mutation,the PI3K/PTEN/AKT pathway acquires insensitivity to further
FIGURE 6 | Input/output responses of PI3K/AKT and MAPK pathways tothe activation of growth factor receptors in different cells. Thedependences of pAKT and pERK on the activation level of ErbB1 receptors inHBL100 (A), AU565 (B), T47 (C) cells; on the level of HER2 receptors in MCF7(D) and PE04 (E) cells; and platelet-derived growth factor receptor (PDGF) inNIH 3T3 fibroblasts (F). Data on I/O response were extracted fromexperimental dose dependences [(A–C) (49), (D) (54), and (F) (55)] and
normalized at maximal values of input/output signals. pAKT, pERK dosedependencies for PE04 cells (E) are theoretical data (40) (black lines).Experimental data were fitted by Hill function: y = xn/(xn
+Kn) with Hillconstant, n, and half-maximum constant, K, which are given in Figures. Hillfunction is depicted by red lines for pAKT and blue lines for pERK.Experimental data were kindly allowed to be used by PK Sorger (A–C),M Hatakeyama (D), and JM Haugh (E).
Frontiers in Oncology | Pharmacology of Anti-Cancer Drugs February 2014 | Volume 4 | Article 13 | 10
Goltsov et al. Customizing the therapeutic response of signalling networks
perturbation of the SN: it becomes robust in the face of bothexternal perturbations (inhibition of input signal) and internalaberrations (mutations). PTEN loss leads to resistance to drugaction (resistance to HER2 inhibition) and causes robust activa-tion of the AKT output signal (57). Note that the observed decreasein sensitivity of the SN at either PTEN loss or PI3K aberration sug-gests that PTEN loss and PIK3CA mutation are mutually exclusive.Clinical study of oncogenic mutations in the PI3K/PTEN/AKTpathway reported both the data on mutually exclusive of PTENloss and PIK3CA mutation in human breast (58) and gastric (59)carcinomas and frequently concordant in breast cancer (43, 44). Asboth mutations activate AKT and each decreases sensitivity of theDSP to another mutation, our finding suggests either redundancyin mutations, the need for two alterations in the single module toactivate AKT, or that PTEN loss and PIK3CA mutation contributedifferently to carcinogenesis (60).
Combining analysis of the I/O response with SA, we showedthat a hyperbolic response in sensitivity mode is robust at highinput (saturated receptor signals) and loses its robustness againstactivation mutations of the proteins at low pHER23 signals.Importantly, the I/O response can be modified through drug com-bination action, here through customization of the I/O responseof the DSP by drug D2 to reach high robustness of the inhibitionresponse to drug D1 against oncogenic protein mutations in thepathway, leading to the transformation of a hyperbolic responseto a graded sigmoidal response curve (see blue lines in Figure 3A).The first benefit of that modification is an effective inhibition ofoutput signal, pAKT. The most pronounced inhibition effect ofthe second drug is at low pHER23 region (0–0.2), where the sen-sitizing effect by the first drug, pertuzumab, is at a maximum. Weexploit a synergistic interaction between these two drugs, specif-ically the sensitizing effect of one drug on the action of another.A second benefit of that modification is a decrease in the sensi-tivity of this response in the range of low pHER23 signal (0–0.2)(see blue lines in Figure 3A). We hypothesized that the mod-ified response is more robust against oncogenic mutation thanthe hyperbolic type of the response. To check this, we carriedout robustness screening of this response with respect to the fol-lowing aberrations in the PI3K/PTEN/AKT pathway: PTEN loss,activation mutation of PI3K, and overexpression of AKT. In allthese cases we observed effective inhibition of pAKT and so ahigh degree of robustness in the modified response to commononcogenic mutations in the PI3K/PTEN/AKT pathway (see greenlines in Figures 3A,C). We showed that a hyperbolic response ismore adapted to signal discrimination and signal transaction whilea modified graded sigmoidal response close to linear responseis more adapted to therapeutic inhibition of signaling pathwayactivated by oncogenic mutations.
Note, a similar transformation from hyperbole to switch-like response was observed in silico and in vitro experiments inRaf/MEK/ERK pathway as a result of deletion of negative feed-backs from ppERK to Son of Sevenless protein (SOS) and Raf(26). This finding and other theoretical and experimental studiesshow that multiple feedback and gene regulation can significantlycontrol drug efficacy (4, 5, 52). An extension of the modularityapproach used in our work should be performed to explore theconsequences of feedback and gene regulation networks, which
control the robustness of SNs in normal and malignant condi-tions (61, 62). For example, to develop more reliable model ofSN response to drug combination, it is necessary to take intoaccount the negative feedback in the PI3K/PTEN/AKT pathwaywhich includes phosphorylation (inactivation) of GSK3β by pAKTwhich phosphorylates (inactivates) PTEN, and therefore increasesAKT phosphorylation (31).
As discussed in the Section “Introduction,” many experimentsand clinical trials confirm the suppression of drug resistanceand the robustness response of drug combinations acting onthe vertical signaling pathways in different cancers. For exam-ple, complementary inhibition of the vertical targets in thePI3K/PTEN/AKT/mTOR pathway restores the inhibition effect oftrastuzumab and pertuzumab (15, 17). Moreover, the experimen-tal study of the combination of PI3K inhibition (GDC-0941) withHER2 inhibitors (trastuzumab, pertuzumab) showed that the highefficacy of this combination therapy is a general effect for differentbreast cancer cell lines despite the fact that different cell lines havedifferent susceptibilities/resistance to each drug separately (42).
Our in silico experiments indicate that anti-cancer responserobustness to drug action emerges due to a smooth sigmoidresponse of the SN when modified by drug combination. Experi-mentally, the robustness of the modified response to a change inexpression level of signaling proteins can be measured in RNAinterference (RNAi) screening with respect to repression of pro-tein expression. RNAi screening has been applied successfully toa study of resistance mechanisms and development of effectivecombination therapy by determining drug targets (60, 63), andallows estimation of the robustness of the therapeutic response tothe perturbations in expression of the proteins (isomers or cat-alytic/regulatory protein subunits) surrounding drug targets in aSN (both vertical and horizontal targeted pathways). Robustnessscreening with respect to overexpression of the proteins surround-ing targeted proteins can be measured using isogenic cell clonescustomized to genomic status involved in screening (64). Mostcritical experimental validations are assumed to be carried outwith heterogeneous tumor samples. Here we suggest that design-ing into a combination therapy regime, an unchanged landscapeof sensitivity across a mutation spectrum, such as that shown inheatmap in Figure 4 (columns 5, 6, and 8), may slow down the evo-lution of subpopulations of cancer cells under a selection pressureof drug therapy and suppresses the development of drug-resistantclones (28, 65). Further, effecting this slowing down in resistanceevolution may require a longer-term engineered drug combina-tion regime that accounts for a drift in cell signaling behavior overmany cellular generations.
The method of investigation of the I/O response of the SN mod-ules developed here can be considered as a supplementary tool forthe analysis of the dose dependence for drug D1 and the mech-anism of IC50 changes at oncogenic mutations and combinationtherapy. To show the link between response dynamics propertiesof the PI3K/PTEN/AKT pathway and the dose response of thewhole SN, we calculated the dose dependence of pAKT on con-centration of pertuzumab (drug D1): RSN=Cout (C in, D, PSN, t ),and showed how the modification of the DSP response by muta-tions and drugs changes IC50 for pertuzumab (Figure 5). In thecalculation, we observed a decrease of IC50 for pertuzumab in the
www.frontiersin.org February 2014 | Volume 4 | Article 13 | 11
Goltsov et al. Customizing the therapeutic response of signalling networks
presence of PI3K inhibitor, LY294002, suggesting lower concentra-tions to be effective. These results supplement the analysis of thedrug-induced shift in dose dependence and the synergetic effect oftwo drugs targeting vertical pathways discussed by Fitzgerald et al.(52). Additionally, we showed that drug-induced sensitivity to thesecond drug modify both response curve and dose dependence forthe first drug that significantly enhances synergetic effect of twodrugs in combination.
We showed that the sensitivity of the DSP without customiza-tion increases significantly in the range of IC80 of pertuzumab(see solid and dashed black lines in Figure 5). The simplest way toreach the goal of high inhibition and low sensitivity is to increasethe drug concentration and go far beyond the range of maximalsensitivity (>1 µM pertuzumab, Figure 5). In practice, this is oftennot a realistic solution for toxicity reasons, although there is evi-dence that drug concentrations that are twice the IC50 can suppressacquired resistance due to mutations following drug therapy (29).A more realistic approach is to customize the network response toinhibition through combination therapy, manipulating the inhi-bition and sensitivity dose dependencies through the action of thesecond drug, which modifies the I/O response of the DSP. Addi-tionally, our calculation showed that a significantly lower IC50 forpertuzumab in combination with the PI3K inhibitor can be a basisfor decreasing a dose of drug D1 to reduce its toxicity.
We applied the method to two well-known targets and drugsand investigated the mechanism of their effectiveness. We demon-strated that the drug-induced sensitivity of the DSP to changes inprotein parameters and their expression levels has the potentialto sensitize this pathway to mutations that compensate for drugaction, i.e., low output signal at inhibited input signal. Moreover,such mutations can effect a decrease in sensitivity of the DSP tofurther external and internal perturbations leading to an increasein DSP robustness. It is thus possible that drug action may sig-nificantly perturb DSP functioning, stimulating the activation ofcompensatory response mechanisms in the cell.
We then demonstrated a method of minimizing the drug-sensitizing effect while maintaining the intended effect of drugaction by customizing the I/O response of the DSP response.The goal of this customization was to reach a high inhibition ofinput signal without sensitizing the SN to mutations leading toan increased potential for resistance, specifically PTEN loss andAKT overexpression. Our focus was the modification of the I/Oresponse of the PI3K/PTEN/AKT pathway to inhibition of pHER2by pertuzumab.
These results suggest that the I/O response of signaling mod-ules can be used as biomarker to select advantaged drug targetsfor mono- and combination therapy. To illustrate this concept,we considered different strategies of drug selection depending onthe response of the PI3K/PTEN/AKT signaling module of the dif-ferent cells represented in Figure 6. We assume that in the case ofswitch-like response with low threshold of activation (low parame-ter K ) such as represented in Figure 6A (HBL cells) and Figure 6B(AU565 cells), a rational strategy is to use drug combination inwhich one drug targets the DSP and modifies the response curveto more graded or sigmoid form while another drug in combina-tion inhibits input and output signals according to that modifiedresponse curve. In the case of responses of smooth hyperbolictype like represented in Figure 6C (T47), Figure 6E (PE04), and
Figure 6F (NIH 3T3), the drug targeting USP effectively inhibitspAKT in the 80–90% range of inhibited receptor signal but sensi-tizes down-stream module to compensation mutations. To avoidthe latter effect, we suggest modifying the response of the down-stream module to a smooth sigmoid curve by a second drugtargeting the DSP. The I/O smooth sigmoid response of the typegiven in Figure 6D (MCF7) is assumed to endow the signalingmodule with high sensitivity to the drug inhibiting its input sig-nal and low sensitivity to compensatory mutations. In this case,inhibition of the USP by one drug is effective with respect to bothsignal inhibition and sensitivity suppression. The use of the seconddrug targeting down-stream pathway is redundant from the view-point of the response modification and toxicity. These analysesindicate the strategy of drug–diagnostic co-development (2, 66)when drug therapies (mono- or combination) are selected basedon the integrative biomarker corresponding to the I/O response ofsignaling modules. Stratification of patients according to differentI/O response curves can help identify patients who are most likelyto benefit from selected therapy. Constant monitoring of the trans-formation of the I/O response curve during treatment can indicateat compensatory gene regulation (12, 45, 67, 68) and acquiredmutations as a result of the selected therapy and so can serveas a guide for changing therapeutic regime. The obtained resultsshowed that it is desirable to introduce an additional characteristicof drugs to support this strategy – drug-induced sensitivity of theSN or resistance potential of drugs, which significantly dependson the I/O response of targeted SN.
The joint analysis, the I/O response of the PI3K/PTEN/AKTpathway, and pAKT dose response for pertuzumab revealed thechallenge of the trade-off between high sensitivity to drug actionand oncogenic mutations. The proposed method of modifica-tion of the I/O response of the PI3K/PTEN/AKT pathway andmanipulating separately by the inhibition and sensitivity dosedependencies through action of a second drug resolved this prob-lem partially. Despite PI3K inhibition causing the loss of relativesensitivity at different perturbations (pHER2 inhibition and thedifferent mutations in PI3K/PTEN/AKT pathway), it increased theoverall level of sensitivity of the DSP to protein parameters thatis assumed to sensitize the SN to the compensation mutations(compare columns 1 and 5 in Figure 4). To further optimize thistrade-off at the combination design stage, we propose that othermeans of customizing the I/O response to improve drug resis-tance potential are needed, e.g., by using the methods and resultsof synthetic biology in signaling pathway engineering to customizetheir I/O responses (69–71). For example, using some modulatorsit is possible to alter/reshape dose dependence from a graded to asharply sensitive, switch-like response and a time dependence fromsustained to pulse or delayed responses in MAPK pathway signal-ing (71). It has been shown that modification of cellular responseobtained by genetic engineering can also be reached throughdrug action. For example, cellular responses were engineered bydynamic rewiring of SN topology (22, 72) and controlling nega-tive feedback circuits in SN by drug combination (26). Ultimatelythe application of this arsenal of engineering methods in net-work and synthetic biology, underpinned by integrative systemsbiology, can be a powerful tool for adaptation of signaling responseto effective combination therapy and rational drug combinationsco-development.
Frontiers in Oncology | Pharmacology of Anti-Cancer Drugs February 2014 | Volume 4 | Article 13 | 12
Goltsov et al. Customizing the therapeutic response of signalling networks
ACKNOWLEDGMENTSThis work was supported by grants from Breakthrough Breast Can-cer and Scottish Funding Council (SRDG), and personal supportto Alexey Goltsov from Scottish Informatics and Computer Sci-ence Alliance (SICSA) and to James Bown from The NorthwoodTrust. We also acknowledge the Reviewers for detailed analysis ofthe method proposed and valuable comments.
SUPPLEMENTARY MATERIALThe Supplementary Material for this article can be foundonline at http://www.frontiersin.org/Journal/10.3389/fonc.2014.00013/abstract
REFERENCES1. Yap TA, Omlin A, de Bono JS. Development of therapeutic combinations tar-
geting major cancer signaling pathways. J Clin Oncol (2013) 31:1592–605.doi:10.1200/JCO.2011.37.6418
2. Jørgensen JT. Companion diagnostics in oncology – current status and futureaspects. Oncology (2013) 85:59–68. doi:10.1159/000353454
3. US Food and Drug Administration. New Guidance for Industry: Code-velopment of Two or More Unmarketed Investigational Drugs for Use inCombination. Available from: http://www.fda.gov/ForConsumers/ByAudience/ForPatientAdvocates/ucm237264.htm
4. Chandarlapaty S. Negative feedback and adaptive resistance to the targetedtherapy of cancer. Cancer Discov (2012) 2:311–9. doi:10.1158/2159-8290.CD-12-0018
5. Carracedo A, Pandolfi PP. The PTEN-PI3K pathway: of feedbacks and cross-talks. Oncogene (2008) 27:5527–41. doi:10.1038/onc.2008.247
6. Azmi AS, Wang Z, Philip PA, Mohammad RM, Sarkar FH. Proof of concept: net-work and systems biology approaches aid in the discovery of potent anticancerdrug combinations. Mol Cancer Ther (2010) 9:3137–44. doi:10.1158/1535-7163.MCT-10-0642
7. Boran AD, Iyengar R. Systems approaches to polypharmacology and drug dis-covery. Curr Opin Drug Discov Devel (2010) 13:297–309.
8. Nelander S, Wang W, Nilsson B, She Q-B, Pratilas C, Rosen N, et al. Modelsfrom experiments: combinatorial drug perturbations of cancer cells. Mol SystBiol (2008) 4:216. doi:10.1038/msb.2008.53
9. Tang J, Karhinen L, Xu T, Szwajda A, Yadav B, Wennerberg K, et al. Target inhi-bition networks: predicting selective combinations of druggable targets to blockcancer survival pathways. Roth FP, editor. PLoS Comput Biol (2013) 9:e1003226.doi:10.1371/journal.pcbi.1003226
10. Baselga J, Cortés J, Kim S-B, Im S-A, Hegg R, Im Y-H, et al. Pertuzumab plustrastuzumab plus docetaxel for metastatic breast cancer. N Engl J Med (2012)366:109–19. doi:10.1056/NEJMoa1113216
11. Faratian D, Zweemer AJM, Nagumo Y, Sims AH, Muir M, Dodds M, et al.Trastuzumab and pertuzumab produce changes in morphology and estrogenreceptor signaling in ovarian cancer xenografts revealing new treatment strate-gies. Clin Cancer Res (2011) 17:4451–61. doi:10.1158/1078-0432.CCR-10-2461
12. Sims AH, Zweemer AJM, Nagumo Y, Faratian D, Muir M, Dodds M, et al. Defin-ing the molecular response to trastuzumab, pertuzumab and combination ther-apy in ovarian cancer. Br J Cancer (2012) 106:1779–89. doi:10.1038/bjc.2012.176
13. Hoeflich KP, Merchant M, Orr C, Chan J, Den Otter D, Berry L, et al. Inter-mittent administration of MEK inhibitor GDC-0973 plus PI3K inhibitor GDC-0941 triggers robust apoptosis and tumor growth inhibition. Cancer Res (2012)72:210–9. doi:10.1158/0008-5472.CAN-11-1515
14. Haagensen EJ, Kyle S, Beale GS, Maxwell RJ, Newell DR. The synergistic interac-tion of MEK and PI3K inhibitors is modulated by mTOR inhibition. Br J Cancer(2012) 106:1386–94. doi:10.1038/bjc.2012.70
15. Sharial M, Crown J, Hennessy BT. Overcoming resistance and restoring sensitiv-ity to HER2-targeted therapies in breast cancer. Ann Oncol (2012) 23:3007–16.doi:10.1093/annonc/mds200
16. Zheng J, Hudder A, Zukowski K, Novak RF. Rapamycin sensitizes Akt inhibi-tion in malignant human breast epithelial cells. Cancer Lett (2010) 296:74–87.doi:10.1016/j.canlet.2010.03.018
17. Morrow PK, Wulf GM, Ensor J, Booser DJ, Moore JA, Flores PR, et al. PhaseI/II study of trastuzumab in combination with everolimus (RAD001) in
patients with HER2-overexpressing metastatic breast cancer who progressed ontrastuzumab-based therapy. J Clin Oncol (2011) 29:3126–32. doi:10.1200/JCO.2010.32.2321
18. Gillies RJ, Verduzco D, Gatenby RA. Evolutionary dynamics of carcinogenesisand why targeted therapy does not work. Nat Rev Cancer (2012) 12:487–93.doi:10.1038/nrc3298
19. Masui K, Gini B, Wykosky J, Zanca C, Mischel PS, Furnari FB, et al. A tale oftwo approaches: complementary mechanisms of cytotoxic and targeted therapyresistance may inform next-generation cancer treatments. Carcinogenesis (2013)34:725–38. doi:10.1093/carcin/bgt086
20. Cesca M, Bizzaro F, Zucchetti M, Giavazzi R. Tumor delivery of chemotherapycombined with inhibitors of angiogenesis and vascular targeting agents. FrontOncol (2013) 3:259. doi:10.3389/fonc.2013.00259
21. von Minckwitz G, du Bois A, Schmidt M, Maass N, Cufer T, de Jongh FE, et al.Trastuzumab beyond progression in human epidermal growth factor receptor2-positive advanced breast cancer: a German breast group 26/breast interna-tional group 03-05 study. J Clin Oncol (2009) 27:1999–2006. doi:10.1200/JCO.2008.19.6618
22. Lee MJ, Ye AS, Gardino AK, Heijink AM, Sorger PK, MacBeath G, et al. Sequen-tial application of anticancer drugs enhances cell death by rewiring apoptoticsignaling networks. Cell (2012) 149:780–94. doi:10.1016/j.cell.2012.03.031
23. Wallin JJ, Edgar KA, Guan J, Berry M, Prior WW, Lee L, et al. GDC-0980is a novel class I PI3K/mTOR kinase inhibitor with robust activity in can-cer models driven by the PI3K pathway. Mol Cancer Ther (2011) 10:2426–36.doi:10.1158/1535-7163.MCT-11-0446
24. Nahta R, O’Regan RM. Evolving strategies for overcoming resistance to HER2-directed therapy: targeting the PI3K/Akt/mTOR pathway. Clin Breast Cancer(2010) 10(Suppl 3):S72–8. doi:10.3816/CBC.2010.s.015
25. Junttila TT, Akita RW, Parsons K, Fields C, Lewis Phillips GD, Friedman LS, et al.Ligand-independent HER2/HER3/PI3K complex is disrupted by trastuzumaband is effectively inhibited by the PI3K inhibitor GDC-0941. Cancer Cell (2009)15:429–40. doi:10.1016/j.ccr.2009.03.020
26. Sturm OE, Orton R, Grindlay J, Birtwistle M, Vyshemirsky V, Gilbert D, et al.The mammalian MAPK/ERK pathway exhibits properties of a negative feedbackamplifier. Sci Signal (2010) 3:ra90. doi:10.1126/scisignal.2001212
27. Flaherty KT, Infante JR, Daud A, Gonzalez R, Kefford RF, Sosman J, et al. Com-bined BRAF and MEK inhibition in melanoma with BRAF V600 mutations.N Engl J Med (2012) 367:1694–703. doi:10.1056/NEJMoa1210093
28. Gerlinger M, Rowan AJ, Horswell S, Larkin J, Endesfelder D, Gronroos E,et al. Intratumor heterogeneity and branched evolution revealed by multiregionsequencing. N Engl J Med (2012) 366:883–92. doi:10.1056/NEJMoa1113205
29. Richards J, Lim AC, Hay CW, Taylor AE, Wingate A, Nowakowska K, et al. Inter-actions of abiraterone, eplerenone, and prednisolone with wild-type and mutantandrogen receptor: a rationale for increasing abiraterone exposure or combiningwith MDV3100. Cancer Res (2012) 72:2176–82. doi:10.1158/0008-5472.CAN-11-3980
30. Faratian D, Goltsov A, Lebedeva G, Sorokin A, Moodie S, Mullen P, et al. Systemsbiology reveals new strategies for personalizing cancer medicine and confirmsthe role of PTEN in resistance to trastuzumab. Cancer Res (2009) 69:6713–20.doi:10.1158/0008-5472.CAN-09-0777
31. Goltsov A, Deeni Y, Khalil H, Idowu M, Kyriakidis S, Goltsov G, et al. Role ofpost-translational regulation of PTEN activity in cancer cell addiction to het-erozygous PTEN mutations. In: Xu K, editor. PTEN Structure, Mechanism ofAction, Role Cell Signalling and Regulation. Hauppauge, NY: Nova Science Pub-lishers (2013). p. 173–210.
32. Goltsov A, Faratian D, Langdon SP, Bown J, Goryanin I, Harrison DJ. Com-pensatory effects in the PI3K/PTEN/AKT signaling network following receptortyrosine kinase inhibition. Cell Signal (2011) 23:407–16. doi:10.1016/j.cellsig.2010.10.011
33. Hua F, Cornejo MG, Cardone MH, Stokes CL, Lauffenburger DA. Effects of Bcl-2 levels on Fas signaling-induced caspase-3 activation: molecular genetic testsof computational model predictions. J Immunol (2005) 175:985–95.
34. Wolf J, Dronov S, Tobin F, Goryanin I. The impact of the regulatory design onthe response of epidermal growth factor receptor-mediated signal transductiontowards oncogenic mutations. FEBS J (2007) 274:5505–17. doi:10.1111/j.1742-4658.2007.06066.x
35. Orton RJ, Adriaens ME, Gormand A, Sturm OE, Kolch W, Gilbert DR. Compu-tational modelling of cancerous mutations in the EGFR/ERK signalling pathway.BMC Syst Biol (2009) 3:100. doi:10.1186/1752-0509-3-100
www.frontiersin.org February 2014 | Volume 4 | Article 13 | 13
Goltsov et al. Customizing the therapeutic response of signalling networks
36. Yoon J, Deisboeck TS. Investigating differential dynamics of the MAPK signalingcascade using a multi-parametric global sensitivity analysis. PLoS One (2009)4:e4560. doi:10.1371/journal.pone.0004560
37. Dana S, Nakakuki T, Hatakeyama M, Kimura S, Raha S. Computation ofrestoration of ligand response in the random kinetics of a prostate cancercell signaling pathway. Comput Methods Programs Biomed (2011) 101:1–22.doi:10.1016/j.cmpb.2010.04.001
38. Nguyen LK, Matallanas D, Croucher DR, von Kriegsheim A, Kholodenko BN.Signalling by protein phosphatases and drug development: a systems-centredview. FEBS J (2013) 280:751–65. doi:10.1111/j.1742-4658.2012.08522.x
39. Zou X, Liu M, Pan Z. Robustness analysis of EGFR signaling network with amulti-objective evolutionary algorithm. Biosystems (2008) 91:245–61. doi:10.1016/j.biosystems.2007.10.001
40. Goltsov A, Faratian D, Langdon SP, Mullen P, Harrison DJ, Bown J. Fea-tures of the reversible sensitivity-resistance transition in PI3K/PTEN/AKTsignalling network after HER2 inhibition. Cell Signal (2012) 24:493–504.doi:10.1016/j.cellsig.2011.09.030
41. Lebedeva G, Sorokin A, Faratian D, Mullen P, Goltsov A, Langdon SP, et al.Model-based global sensitivity analysis as applied to identification of anti-cancerdrug targets and biomarkers of drug resistance in the ErbB2/3 network. EurJ Pharm Sci (2012) 46:244–58. doi:10.1016/j.ejps.2011.10.026
42. Yao E, Zhou W, Lee-Hoeflich ST, Truong T, Haverty PM, Eastham-Anderson J,et al. Suppression of HER2/HER3-mediated growth of breast cancer cells withcombinations of GDC-0941 PI3K inhibitor, trastuzumab, and pertuzumab. ClinCancer Res (2009) 15:4147–56. doi:10.1158/1078-0432.CCR-08-2814
43. Stemke-Hale K, Gonzalez-Angulo AM, Lluch A, Neve RM, Kuo W-L, Davies M,et al. An integrative genomic and proteomic analysis of PIK3CA, PTEN, andAKT mutations in breast cancer. Cancer Res (2008) 68:6084–91. doi:10.1158/0008-5472.CAN-07-6854
44. Cheung LWT, Hennessy BT, Li J, Yu S, Myers AP, Djordjevic B, et al. High fre-quency of PIK3R1 and PIK3R2 mutations in endometrial cancer elucidates anovel mechanism for regulation of PTEN protein stability. Cancer Discov (2011)1:170–85. doi:10.1158/2159-8290.CD-11-0039
45. Nagumo Y, Faratian D, Mullen P, Harrison DJ, Hasmann M, Langdon SP.Modulation of HER3 is a marker of dynamic cell signaling in ovarian can-cer: implications for pertuzumab sensitivity. Mol Cancer Res (2009) 7:1563–71.doi:10.1158/1541-7786.MCR-09-0101
46. Hu H, Goltsov A, Bown JL, Sims AH, Langdon SP, Harrison DJ, et al. Feedfor-ward and feedback regulation of the MAPK and PI3K oscillatory circuit in breastcancer. Cell Signal (2013) 25:26–32. doi:10.1016/j.cellsig.2012.09.014
47. Franklin MC, Carey KD, Vajdos FF, Leahy DJ, de Vos AM, Sliwkowski MX.Insights into ErbB signaling from the structure of the ErbB2-pertuzumab com-plex. Cancer Cell (2004) 5:317–28. doi:10.1016/S1535-6108(04)00083-2
48. Leslie NR, Foti M. Non-genomic loss of PTEN function in cancer: not in mygenes. Trends Pharmacol Sci (2011) 32:131–40. doi:10.1016/j.tips.2010.12.005
49. Chen WW, Schoeberl B, Jasper PJ, Niepel M, Nielsen UB, Lauffenburger DA,et al. Input-output behavior of ErbB signaling pathways as revealed by amass action model trained against dynamic data. Mol Syst Biol (2009) 5:239.doi:10.1038/msb.2008.74
50. Schoeberl B, Pace EA, Fitzgerald JB, Harms BD, Xu L, Nie L, et al. Therapeu-tically targeting ErbB3: a key node in ligand-induced activation of the ErbBreceptor-PI3K axis. Sci Signal (2009) 2:ra31. doi:10.1126/scisignal.2000352
51. Stoica GE, Franke TF, Wellstein A, Morgan E, Czubayko F, List H-J, et al.Heregulin-beta1 regulates the estrogen receptor-alpha gene expression andactivity via the ErbB2/PI 3-K/Akt pathway. Oncogene (2003) 22:2073–87.doi:10.1038/sj.onc.1206769
52. Fitzgerald JB, Schoeberl B, Nielsen UB, Sorger PK. Systems biology and combi-nation therapy in the quest for clinical efficacy. Nat Chem Biol (2006) 2:458–66.doi:10.1038/nchembio817
53. Kessler T, Hache H, Wierling C. Integrative analysis of cancer-related signalingpathways. Front Physiol (2013) 4:124. doi:10.3389/fphys.2013.00124
54. Nagashima T, Shimodaira H, Ide K, Nakakuki T, Tani Y, Takahashi K, et al. Quan-titative transcriptional control of ErbB receptor signaling undergoes gradedto biphasic response for cell differentiation. J Biol Chem (2007) 282:4045–56.doi:10.1074/jbc.M608653200
55. Park CS, Schneider IC, Haugh JM. Kinetic analysis of platelet-derived growthfactor receptor/phosphoinositide 3-kinase/Akt signaling in fibroblasts. J BiolChem (2003) 278:37064–72. doi:10.1074/jbc.M304968200
56. Goldbeter A, Koshland DE. An amplified sensitivity arising from covalent mod-ification in biological systems. Proc Natl Acad Sci U S A (1981) 78:6840–4.doi:10.1073/pnas.78.11.6840
57. Marty B, Maire V, Gravier E, Rigaill G,Vincent-Salomon A, Kappler M, et al. Fre-quent PTEN genomic alterations and activated phosphatidylinositol 3-kinasepathway in basal-like breast cancer cells. Breast Cancer Res (2008) 10:R101.doi:10.1186/bcr2204
58. Saal LH, Holm K, Maurer M, Memeo L, Su T, Wang X, et al. PIK3CA mutationscorrelate with hormone receptors, node metastasis, and ERBB2, and are mutu-ally exclusive with PTEN loss in human breast carcinoma. Cancer Res (2005)65:2554–9. doi:10.1158/0008-5472-CAN-04-3913
59. Byun D-S, Cho K, Ryu B-K, Lee M-G, Park J-I, Chae K-S, et al. Frequent monoal-lelic deletion of PTEN and its reciprocal association with PIK3CA amplificationin gastric carcinoma. Int J Cancer (2003) 104:318–27. doi:10.1002/ijc.10962
60. Berns K, Bernards R. Understanding resistance to targeted cancer drugsthrough loss of function genetic screens. Drug Resist Updat (2012) 15:268–75.doi:10.1016/j.drup.2012.10.002
61. Kitano H. Cancer as a robust system: implications for anticancer therapy. NatRev Cancer (2004) 4:227–35. doi:10.1038/nrc1300
62. Stelling J, Sauer U, Szallasi Z, Doyle FJ, Doyle J. Robustness of cellular functions.Cell (2004) 118:675–85. doi:10.1016/j.cell.2004.09.008
63. Lee AJX, Swanton C. Tumour heterogeneity and drug resistance: personalis-ing cancer medicine through functional genomics. Biochem Pharmacol (2012)83:1013–20. doi:10.1016/j.bcp.2011.12.008
64. Hengel SM, Murray E, Langdon S, Hayward L, O’Donoghue J, Panchaud A,et al. Data-independent proteomic screen identifies novel tamoxifen agonistthat mediates drug resistance. J Proteome Res (2011) 10:4567–78. doi:10.1021/pr2004117
65. Cooke SL, Ng CKY, Melnyk N, Garcia MJ, Hardcastle T, Temple J, et al. Genomicanalysis of genetic heterogeneity and evolution in high-grade serous ovariancarcinoma. Oncogene (2010) 29:4905–13. doi:10.1038/onc.2010.245
66. Simon R. Drug-diagnostics co-development in oncology. Front Oncol (2013)3:315. doi:10.3389/fonc.2013.00315
67. Chakrabarty A, Sánchez V, Kuba MG, Rinehart C, Arteaga CL. Feedbackupregulation of HER3 (ErbB3) expression and activity attenuates antitumoreffect of PI3K inhibitors. Proc Natl Acad Sci U S A (2012) 109:2718–23.doi:10.1073/pnas.1018001108
68. Narayan M, Wilken JA, Harris LN, Baron AT, Kimbler KD, Maihle NJ.Trastuzumab-induced HER reprogramming in “resistant” breast carcinomacells. Cancer Res (2009) 69:2191–4. doi:10.1158/0008-5472.CAN-08-1056
69. Pryciak PM. Systems biology. Customized signaling circuits. Science (2008)319:1489–90. doi:10.1126/science.1156414
70. Brandman O, Meyer T. Feedback loops shape cellular signals in space and time.Science (2008) 322:390–5. doi:10.1126/science.1160617
71. Bashor CJ, Helman NC,Yan S, Lim WA. Using engineered scaffold interactions toreshape MAP kinase pathway signaling dynamics. Science (2008) 319:1539–43.doi:10.1126/science.1151153
72. Behar M, Barken D, Werner SL, Hoffmann A. The dynamics of signaling as apharmacological target. Cell (2013) 155:448–61. doi:10.1016/j.cell.2013.09.018
Conflict of Interest Statement: The authors declare that the research was conductedin the absence of any commercial or financial relationships that could be construedas a potential conflict of interest.
Received: 12 October 2013; accepted: 20 January 2014; published online: 05 February2014.Citation: Goltsov A, Langdon SP, Goltsov G, Harrison DJ and Bown J (2014) Cus-tomizing the therapeutic response of signaling networks to promote antitumor responsesby drug combinations. Front. Oncol. 4:13. doi: 10.3389/fonc.2014.00013This article was submitted to Pharmacology of Anti-Cancer Drugs, a section of thejournal Frontiers in Oncology.Copyright © 2014 Goltsov, Langdon, Goltsov, Harrison and Bown. This is an open-access article distributed under the terms of the Creative Commons Attribution License(CC BY). The use, distribution or reproduction in other forums is permitted, providedthe original author(s) or licensor are credited and that the original publication in thisjournal is cited, in accordance with accepted academic practice. No use, distribution orreproduction is permitted which does not comply with these terms.
Frontiers in Oncology | Pharmacology of Anti-Cancer Drugs February 2014 | Volume 4 | Article 13 | 14
Copyright © 2022 FDOKUMEN