Customer Satisfaction with Domestic Water Supply in India
13
Journal of Environment and Earth Science www.iiste.org ISSN 2224-3216 (Paper) ISSN 2225-0948 (Online) Vol.4, No.9, 2014 105 Customer Satisfaction with Domestic Water Supply in India – A Study in Hubli city Jayaramu K P (Corresponding author) Research scholar, Department of Environmental Engineering Sri Jayachamarajendra College of Engineering, Mysore, Karnataka and Executive Engineer, Karnataka Water Board, Jn NURM City Division, Mysore, Karnataka, India E-mail: [email protected] B. Manoj Kumar Professor, Department of Environmental Engineering, Sri Jayachamarajendra College of Engineering Mysore 570 006, Karnataka, India E-mail: [email protected] Prasanna Rashmi K K Research Associate, Center of Excellence in Urban Governance, Center for Public Policy, Indian Institute of Management, Bangalore The research is financed by Asian Development Bank. No. 2006-A171(Sponsoring information) The research is carried out as part of research by the Corresponding author and is sponsored by Karnataka Urban Water Supply and Drainage Board, Bengaluru, India. Abstract Severe water crisis prevailed in twin Cities of Hubli-Dharwad in South India for a long time. During the last ten years, there has been considerable improvement in the water service. While most parts of the city is having intermittent supply system, a pilot 24/7 water service was implemented in a Demonstration Zone through the World Bank assistance, and State Government of Karnataka. The 24x7 project covers about 12 % of the total population of the city. The objective of this paper is to study the customer satisfaction in both intermittent and 24/7 water service areas in Hubli city. Stratified sampling method was adopted for four groups namely, low, medium, high income and backward classes namely the Scheduled Cast/Scheduled Tribes (SC/ST) groups. The results of the study revealed that most customers in 24/7 demo zone were highly satisfied with water quality, continuity, quantity, and pressure; whereas there was slight dissatisfaction (12%) with regard to redressal of customer complaints. In contrast, there was considerable dissatisfaction with water quality, continuity and pressure in intermittent supply areas. There was universal opinion from both 24/7 demo zone and intermittent service areas supporting 24/7 water service scale up project in the city. Keywords: Intermittent Water Service, 24/7 Water Service, Customer Satisfaction 1. Introduction Study of customer satisfaction is of prime importance in encouraging performance improvement of any service provider. This is true even in the case of government-owned organizations such as those which provide essential services such as water supply. In most developing countries, including India, infrastructure services are provided by state-owned organizations. Due to the monopolistic nature of the organizations, there is no or little inclination to ensure consumer satisfaction. The requirements and satisfaction of customers are low on priority in government owned organizations, mainly due to lack of professional approach in customer services. Satisfaction is defined as the fulfillment and gratification of the need for a stated good or service. The level of satisfaction is, therefore determined by the perceived performance of a company or utility, which is an evaluation of the delivered good or service viewed in the light of the consumers’ needs. It is generally expected that a higher level of service quality is expected to lead to customer satisfaction and eventually to better customer loyalty and higher profits (Chen and Hu, 2010). Customer satisfaction is defined as the customer reaction to the state of fulfilment, and customer judgment of the fulfilled state Oliver (1997). The measurement of customer satisfaction is a useful means to achieve the objectives of business organizations through the analysis of the performance of the services or offerings to customers as well as to identify the areas of improvements as also customers’ priorities, leading to customer segmentation (Kotler et al., 2006). It is a tool that can be used as a projective way to get into the mind of the customers, and getting continuous valuable feedback from the customers and is a key element in total quality management (Zairi, 1994). Al-Ghuraiz and Enshassi (2006) found that improving quality of service was the key to improving consumer satisfaction. Mugabi et al, (2007) suggests that poor customer service could lead to lukewarm attitude to bills payment. It could also lead to consumer resistance to increasing water tariffs as well as affect consumer willingness to pay. A few of the attributes that leads to higher consumer satisfaction include reliability of water supply at appropriate pressure, good quality
-
Upload
khangminh22 -
Category
Documents
-
view
1 -
download
0
Transcript of Customer Satisfaction with Domestic Water Supply in India
Journal of Environment and Earth Science www.iiste.org
ISSN 2224-3216 (Paper) ISSN 2225-0948 (Online)
Vol.4, No.9, 2014
105
Customer Satisfaction with Domestic Water Supply in India – A
Study in Hubli city
Jayaramu K P (Corresponding author)
Research scholar, Department of Environmental Engineering
Sri Jayachamarajendra College of Engineering, Mysore, Karnataka and
Executive Engineer, Karnataka Water Board, Jn NURM City Division, Mysore, Karnataka, India
E-mail: [email protected]
B. Manoj Kumar
Professor, Department of Environmental Engineering, Sri Jayachamarajendra College of Engineering
Mysore 570 006, Karnataka, India
E-mail: [email protected]
Prasanna Rashmi K K
Research Associate, Center of Excellence in Urban Governance, Center for Public Policy, Indian Institute
of Management, Bangalore
The research is financed by Asian Development Bank. No. 2006-A171(Sponsoring information)
The research is carried out as part of research by the Corresponding author and is sponsored by Karnataka
Urban Water Supply and Drainage Board, Bengaluru, India.
Abstract
Severe water crisis prevailed in twin Cities of Hubli-Dharwad in South India for a long time. During the last ten
years, there has been considerable improvement in the water service. While most parts of the city is having
intermittent supply system, a pilot 24/7 water service was implemented in a Demonstration Zone through the
World Bank assistance, and State Government of Karnataka. The 24x7 project covers about 12 % of the total
population of the city. The objective of this paper is to study the customer satisfaction in both intermittent and
24/7 water service areas in Hubli city. Stratified sampling method was adopted for four groups namely, low,
medium, high income and backward classes namely the Scheduled Cast/Scheduled Tribes (SC/ST) groups. The
results of the study revealed that most customers in 24/7 demo zone were highly satisfied with water quality,
continuity, quantity, and pressure; whereas there was slight dissatisfaction (12%) with regard to redressal of
customer complaints. In contrast, there was considerable dissatisfaction with water quality, continuity and
pressure in intermittent supply areas. There was universal opinion from both 24/7 demo zone and intermittent
service areas supporting 24/7 water service scale up project in the city.
Keywords: Intermittent Water Service, 24/7 Water Service, Customer Satisfaction
1. Introduction
Study of customer satisfaction is of prime importance in encouraging performance improvement of any service
provider. This is true even in the case of government-owned organizations such as those which provide essential
services such as water supply. In most developing countries, including India, infrastructure services are provided
by state-owned organizations. Due to the monopolistic nature of the organizations, there is no or little inclination
to ensure consumer satisfaction. The requirements and satisfaction of customers are low on priority in
government owned organizations, mainly due to lack of professional approach in customer services. Satisfaction
is defined as the fulfillment and gratification of the need for a stated good or service. The level of satisfaction is,
therefore determined by the perceived performance of a company or utility, which is an evaluation of the
delivered good or service viewed in the light of the consumers’ needs. It is generally expected that a higher level
of service quality is expected to lead to customer satisfaction and eventually to better customer loyalty and
higher profits (Chen and Hu, 2010). Customer satisfaction is defined as the customer reaction to the state of
fulfilment, and customer judgment of the fulfilled state Oliver (1997). The measurement of customer
satisfaction is a useful means to achieve the objectives of business organizations through the analysis of the
performance of the services or offerings to customers as well as to identify the areas of improvements as also
customers’ priorities, leading to customer segmentation (Kotler et al., 2006). It is a tool that can be used as a
projective way to get into the mind of the customers, and getting continuous valuable feedback from the
customers and is a key element in total quality management (Zairi, 1994). Al-Ghuraiz and Enshassi (2006) found
that improving quality of service was the key to improving consumer satisfaction. Mugabi et al, (2007) suggests
that poor customer service could lead to lukewarm attitude to bills payment. It could also lead to consumer
resistance to increasing water tariffs as well as affect consumer willingness to pay. A few of the attributes that
leads to higher consumer satisfaction include reliability of water supply at appropriate pressure, good quality

Journal of Environment and Earth Science www.iiste.org
ISSN 2224-3216 (Paper) ISSN 2225-0948 (Online)
Vol.4, No.9, 2014
106
water, timely and accurate bills, responsiveness to general inquiries and resolving complaints, ease of obtaining
new connections, convenience of bill payment process, appropriate customer care behavior, regular information
updates regarding services as well as good office ambience. Vloerbergh et al., (2007) finds that consumer
satisfaction was closely linked to acceptance and preferences. Al-Ghuraiz and Enshassi, 2006, based on a survey
in Gaza strip for customer satisfaction reported that quality of service plays a key role in enhancing customer
satisfaction, and that scarcity of water or unscheduled supply of water breeds conflicts between consumers and
the water provider leading to customer dissatisfaction which leads to loss of revenue.
This study examines customer satisfaction with the two different systems of water supply that exist in parallel in
the city of Hubli, i.e. the 24X7 water supply system as well as the intermittent water supply system. This paper
is arranged as follows. Section 2 contains review of a few studies regarding customer satisfaction in water supply,
section 3 describes the methodology adopted in this study, while section 4 discusses the findings of this study
and section 5 concludes with the recommendations of the study.
2. Methodology 2.1 Description of the Study Area
Hubli-Dharwad twin city is the second largest city after Bengaluru, in Karnataka state having a population of
943857 as per 2011 Census, with a population density is 2362 per sq. km. Drinking water provision is made
from two surface water sources namely Neersagara and Malaprabha reservoirs. Water supply in Hubli-Dharwad,
is operated and managed by the Karnataka Urban Water Supply and Drainage Board (KUWS & DB), since 2003
(GoK, 2003). These cities have dual water supply system, with 4 wards (area of 3.29 Sq.Kilometres in Hubli
Demo zone and total area of Hubli-Dharwad is 202 Sq.Kilometres) each in Hubli and Dharwad having 24X7
water supply and the remaining areas having intermittent water supply. 24X7 water supply in the cities are
characterized by continuous water supply at constant pressure throughout the day, with higher per unit of water
supply, while in the intermittent water supply system, water is supplied once in two days for about 4 hours a day,
which include low pressure water supply in a few elevated areas in the cities (in about 10% area).
2.1.1 History of Water supply in the study area
Until the year 1995, the capacity of Hubli-Dharwad water supply system had been augmented from time to time
depending on the population growth in the city. The water distribution network was laid with good quality pipes
with zoned system as per approved designs. Though the supply of water was intermittent, it was fairly good with
metering and volumetric billing. In the ensuing period till 2003, there was no periodical augmentation of bulk
and distribution system commensurate with the growth of city. The existing system was extended beyond its
capacity to cover the new extensions by breaking the zoned system. Due to inequitable pressure in the
distribution system, majority of water meters were by-passed. The un-authorized layouts and slums were laid
with un-planned water distribution network with sub-standard quality of pipes. All the above factors resulted in
poor water service with a supply frequency of once in seven days. The water supply system under the Hubli-
Dharwad Municipal Corporation (HDMC) was characterized by several deficiencies; (a) partial water service
network coverage, (b) illegal connections to an extent of more than 30 percent, (c) absence of metering, and (d)
huge gap between expenditure and revenue of nearly Rupees 196 million in 2000-01.
Following the change in management regime in 2003, water supply system in the city witnessed several
technical and managerial improvements including the 24X7 water supply services in a few wards of the cities
(GoK 2005) . Replacement of old pre-stressed concrete transmission mains with new mild steel main, old pump
sets with new high efficiency pump sets, etc., were carried out to enhance bulk supply quantity from about 70
MLD to 105 MLD in July 2004 and the average per capita supply at tap was about 90 LPCD. There was further
augmentation of bulk supply in September 2011 to enhance the bulk supply to about 185 MLD. In the
distribution system, several feeder mains were newly installed and few damaged service pipes were also replaced,
which resulted in improved water service levels in the twin cities and the minimum per capita supply of 135
LPCD was ensured. The other improvements include increase in frequency of water supply, improved quality of
water, better billing and collection practices, as well as improvements in consumer complaints resolution.
In 24X7 water service demonstration zone in Hubli, about 12 percent population has been covered. The main
performance targets achieved in the demonstration zones were, continuous pressured water supply to every
customer with a minimum day time pressure of 6 m (from 6 am to 10 pm) and minimum night time pressure of 2
m (from 10 pm to 6 am), 100 percent metering, maintenance of computerized records of meter readings,
reduction of the losses, modernized that billing and collection system that generated bills on volumetric basis and
operation of 24-hour Customer service centre.
2.2 Empirical methods
The normal practice of measurement of satisfaction by service providers is to measure consumers’ satisfaction
on past performance. Vloerbergh et al., (2007) explained that the survey design could vary from survey questions
to unstructured interviews and everything in between using comparative and non-comparative scales. In
comparative scaling, the respondents are asked to compare one product against the other while non-comparative
Journal of Environment and Earth Science www.iiste.org
ISSN 2224-3216 (Paper) ISSN 2225-0948 (Online)
Vol.4, No.9, 2014
107
scaling is used to evaluate a single product. In this study, Likert Scales is used in this study for measurement of
customer satisfaction on water supply service in intermittent water supply area and 24/7 water supply areas
(Likert 1932).
2.2.1 Sampling
A stratified sample was selected for this study to ensure reliable levels of estimates. The stratification was done
at two levels; on the first level, the locations were bifurcated as intermittent water supply and the 24X7 water
supply areas based on the regularity of water supply, following which the respondents were selected based on
locations of income group areas such as low income group (LIG), medium income group (MIG), high income
group (HIG) and scheduled caste and scheduled tribes (SC/ST) groups separately in intermittent water supply
and 24X7 water supply areas. Since there were several initiatives by the Government of Karnataka, to improve
the access to piped water supply to the SC/ST community, they were also included as a separate group in this
study. The stratification and the substrata are given in Table 1.
Table 1. Details of sampling in Hubli city
Location Primary sample distribution
Low income
group
Middle income
group
High income
group
SC/ST
group
Total
24x7 Water service area
24x7 Demo zone, Hubli 120 120 120 120 480
Intermittent Water service
areas
HDMC Tank Master zone 60 60 60 60 240
Keshwa pur Master zone 60 60 60 60 240
Nehru nagar Master zone 60 60 60 60 240
Old Hubli Master zone 60 60 60 60
(50)*
240
(230)
Sainagar Master zone 60 60 60 60 240
Tabib land Master zone 60 60
(61)
60 60 240
(241)
Sub total 360 360
(361)
360 360 1440
(1431)
Total 480 480
(481)
480 480
(470)
1920
(1911)
*Figures in brackets indicate no. of respondents from whom data was collected
A random sample of 1920 respondents was selected from the consumer database, which included 480
respondents who were having 24X7 water supply (25.2% of the sample) and 1440 (74.8% of the sample) having
intermittent water supply i.e. who are provided with piped water supply once in two or three days a week.
2.2.2 Structure of the questionnaire
The survey questionnaire was structured into four sections, where the first part pertains to the data on
information on existing facilities for water supply and service details; the second part deals with customer
satisfaction with water supply service, third part for data pertaining to willingness to pay by using the open
ended CV with an introductory note and bidding game approach, and finally part four collects information about
household demographics. The questionnaire was designed in the local Kannada language and also in English
with majority being closed questions with two to four options. Each questionnaire was administered with a cover
note duly explaining the purpose of survey and completed by using well-trained enumerators. The household
survey was carried out during May-June 2012. A pre-test survey was conducted prior to the actual data
collection, to enable addressing issues in obtaining appropriate data and the field staff was trained in
administering the questionnaire. The in-person interview was lasted for an average of 30 minutes and the
response rate for the entire study sample was more than 99 percent.
Table 2. Response rate in data collection
Sample details 24X7 Demo zone Intermittent supply zone Total
Sample selected 480 1440 1920
Sample responded 480 1431 1911
Percentage response 100 99.38 99.53
The high response rate can be attributed to the crisis conditions prevailed in the city for a long time and also
active role of experienced enumerators involved in the survey (Table 2).
Journal of Environment and Earth Science www.iiste.org
ISSN 2224-3216 (Paper) ISSN 2225-0948 (Online)
Vol.4, No.9, 2014
108
3. Results of the study
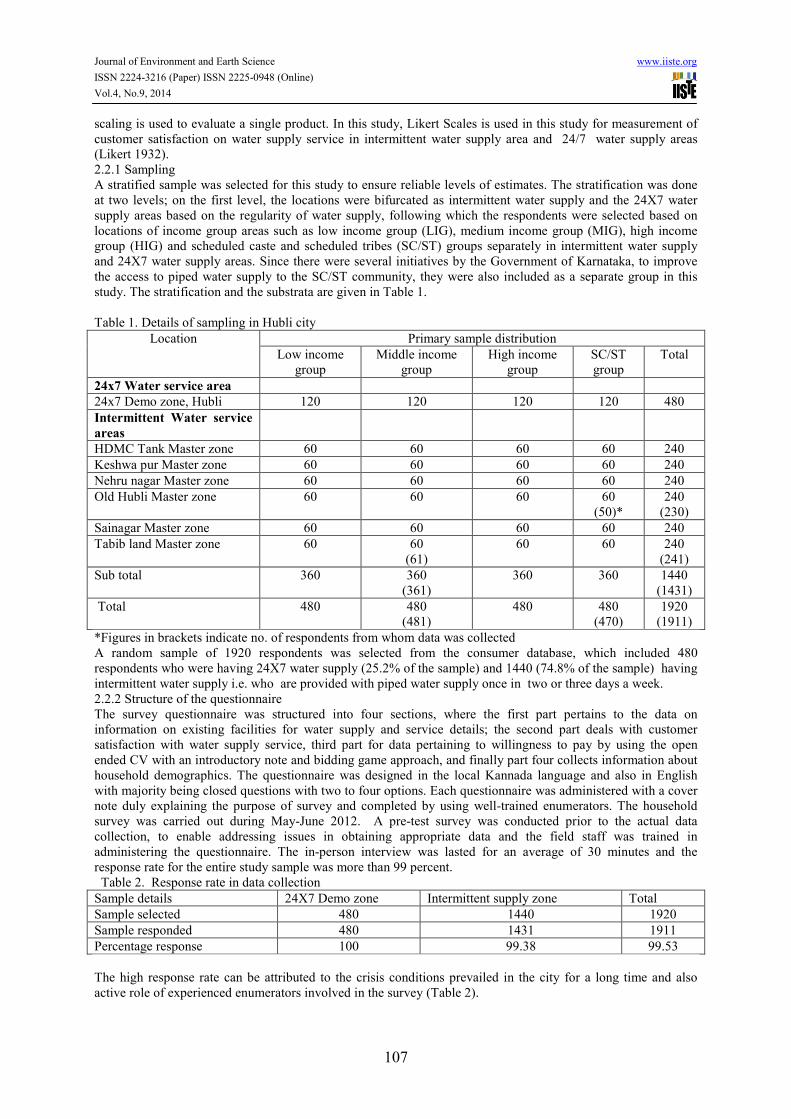
3.1 Characteristics of the households
The figure 1 below provides the socio-demographic characteristics of the respondents. It reveals that nearly 64
percent of the respondents were men and 29 percent of the respondents were women, though there were
variations in the proportion of men and women respondents across the locations. There were no responses among
remaining 7 percent of the respondents.
• Figure 1: Gender of the respondents
3.2 Ownership of dwelling
The customer survey shows that nearly 74 percent of the respondents were owners of the houses they dwelled,
20 percent of the respondents were tenants, while there were no responses among remaining 6 percent of the
respondents (Figure 2).
• Figure 2: Ownership of dwelling
3.3 Education of the households
Examination of the education levels of the households indicates that a small portion of (8%) respondents had
their education closed before obtaining secondary School Leaving Certificate (SSLC). The respondents who
have gone up to the Pre-University Class (PUC) levels are at 47 percent. or had diplomas. The proportion of
respondents with diploma education was fewer. There is considerable proportion (37%) of respondents with
graduate and post-graduate education (Figure 3).

Journal of Environment and Earth Science www.iiste.org
ISSN 2224-3216 (Paper) ISSN 2225-0948 (Online)
Vol.4, No.9, 2014
109
Figure 3: Education levels of respondents
3.4 Water requirements of households
The study reveals that most (nearly 65 %) households had water requirements of more than 10 buckets (Each
bucket measures about 20 liters) a day, with an average requirement of 21 buckets per day (Table 3), which is
equivalent to about 400 liters. The standard unit rates of requirement were published by the Central Public
Health Environmental Engineering Organization (CPHEEO) under the Ministry of Urban Development, Govt. of
India, in a manual (CPHEEO Manual, 1999). As per this manual, the domestic requirement of water is 135 liters
per capita per day (L/c/d). For a family of five members, the requirement of water works out to 675 liters/day
(L/d), which is more than the requirement of respondents. Table 4 indicates that majority (66%) of the
households required between 3 and 10 buckets of water for drinking purposes.
Table 3: Household water requirements
HH water requirement
24x7 Demo
zone
HDMC
Tank
Keshwa
pur
Nehru
Nagar
Old
Hubli
Sai
Nagar
Tabib
Land
City
Total
3 buckets* - -
5**
(2.08)**
*
- - - - 5
(0.23)
3-10 buckets 81
(16.88)
68
(28.33)
157
(65.42)
29
(12.08)
83
(36.09)
3
(1.25)
36
(14.94)
485
(22.58)
>10 buckets 384
(80.00)
104
(43.33)
68
(28.33)
210
(87.50)
40
(17.39)
221
(92.08)
144
(59.75)
1380
(64.25)
No Response 15
(3.13)
68
(28.33)
10
(4.17)
1
(0.42)
107
(46.52)
16
(6.67)
61
(25.31)
278
(12.94)
Total 480
(100)
240
(100)
240
(100)
240
(100)
230
(100)
240
(100)
241
(100)
2148
(100)
Average water requirement
(Buckets) 22.89 12.10 11.40 29.15 10.28 29.16 21.99 21.02
*Capacity of 1 bucket is about 20 Liters
**Figures indicate number of respondents
***Figures in brackets indicate percent of respondents
Journal of Environment and Earth Science www.iiste.org
ISSN 2224-3216 (Paper) ISSN 2225-0948 (Online)
Vol.4, No.9, 2014
110
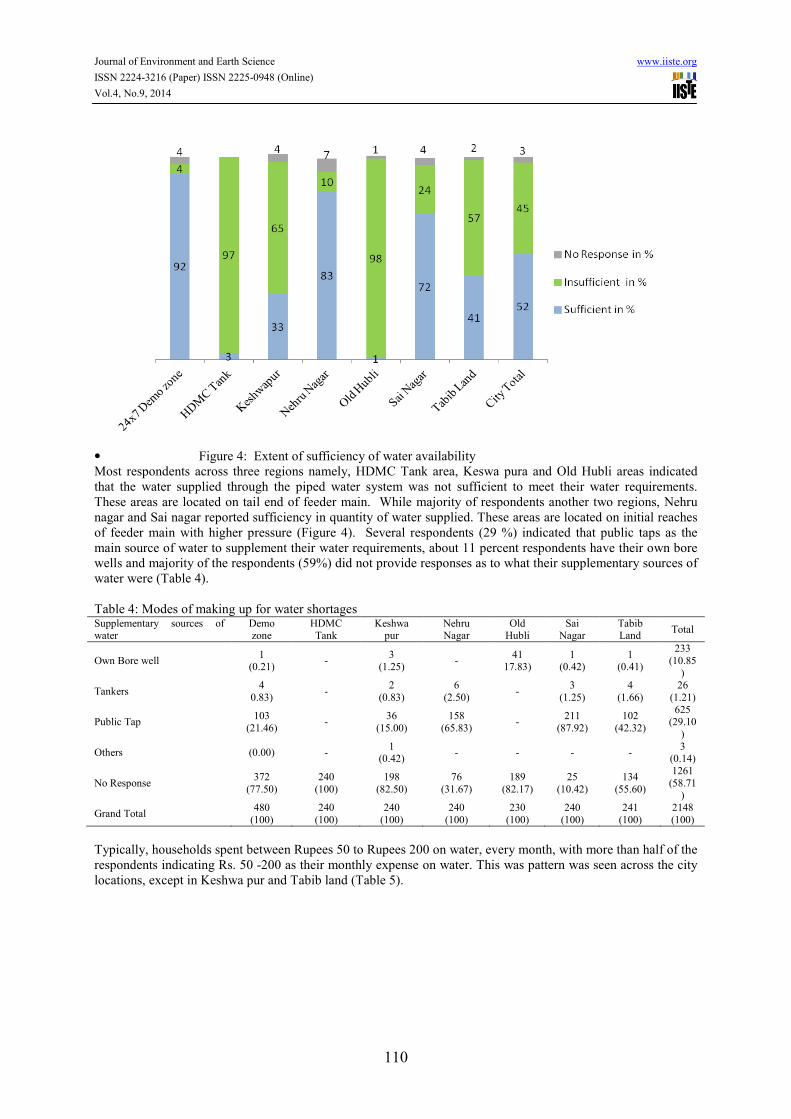
• Figure 4: Extent of sufficiency of water availability
Most respondents across three regions namely, HDMC Tank area, Keswa pura and Old Hubli areas indicated
that the water supplied through the piped water system was not sufficient to meet their water requirements.
These areas are located on tail end of feeder main. While majority of respondents another two regions, Nehru
nagar and Sai nagar reported sufficiency in quantity of water supplied. These areas are located on initial reaches
of feeder main with higher pressure (Figure 4). Several respondents (29 %) indicated that public taps as the
main source of water to supplement their water requirements, about 11 percent respondents have their own bore
wells and majority of the respondents (59%) did not provide responses as to what their supplementary sources of
water were (Table 4).
Table 4: Modes of making up for water shortages Supplementary sources of water
Demo zone
HDMC Tank
Keshwa pur
Nehru Nagar
Old Hubli
Sai Nagar
Tabib Land
Total
Own Bore well 1
(0.21) -
3 (1.25)
- 41
17.83) 1
(0.42) 1
(0.41)
233
(10.85
)
Tankers 4
0.83) -
2
(0.83)
6
(2.50) -
3
(1.25)
4
(1.66)
26
(1.21)
Public Tap 103
(21.46) -
36
(15.00)
158
(65.83) -
211
(87.92)
102
(42.32)
625 (29.10
)
Others (0.00) - 1
(0.42) - - - -
3 (0.14)
No Response 372
(77.50)
240
(100)
198
(82.50)
76
(31.67)
189
(82.17)
25
(10.42)
134
(55.60)
1261
(58.71)
Grand Total 480
(100)
240
(100)
240
(100)
240
(100)
230
(100)
240
(100)
241
(100)
2148
(100)
Typically, households spent between Rupees 50 to Rupees 200 on water, every month, with more than half of the
respondents indicating Rs. 50 -200 as their monthly expense on water. This was pattern was seen across the city
locations, except in Keshwa pur and Tabib land (Table 5).
Journal of Environment and Earth Science www.iiste.org
ISSN 2224-3216 (Paper) ISSN 2225-0948 (Online)
Vol.4, No.9, 2014
111
Table 5: Household Monthly Expenditure on Water in Rupees Monthly expenditure on water
Demo zone
HDMC Tank
Keshwa pur
Nehru Nagar
Old Hubli
Sai Nagar
Tabib Land
Total
<Rs. 50 91
(18.96)
66
(27.50)
60
(25.00)
44
(18.33)
63
(27.39)
39
(16.25)
98
(40.66)
491
(22.86)
Rs. 50-200 306
(63.75)
121
(50.42)
94
(39.17)
186
(77.50)
107
(46.52)
120
(50.00)
94
(39.00)
1182
(55.03)
>Rs. 200 72
(15.00)
50
(20.83)
77
(32.08) -
60
(26.09)
76
(31.67)
31
(12.86)
389
(18.11)
No Response 11
(2.29)
3
(1.25)
9
(3.75)
10
(4.17) -
5
(2.08)
18
(7.47)
86
(4.00)
Grand Total 480
(100)
240
(100)
240
(100)
240
(100)
230
(100)
240
100)
241
(100)
2148
(100)
3.5 Overall level of satisfaction with water supply
The higher levels of satisfaction with water supply is expected to be positively related to several factors such as
satisfaction with water quality, and other parameters such as water quality, water pressure, quantity of water
supplied and frequency of water supply. Price of water is not expected to play a role in customer satisfaction,
given that water was an essential commodity and being supplied by government-owned institutions, there was no
differential pricing of water.
The response level of satisfaction (Table 6), indicates that all the respondents in the 24X7 water service area
were satisfied with water supply, due to the fact that water was available throughout the day, and hence were
spared the hassles of needing to be alert on the timing of water supply as well as not having to stock water for
use. The level of satisfaction in the intermittent service areas was a little lower (94.41%) in the intermittent
water supply areas.
Table 6: Overall Satisfaction with Water Supply in the study area
Levels of
satisfaction
24x7 Demo
Zone
Intermittent water supply areas City
Total HDMC Tank
Keshwa pur Nehru Nagar Old Hubli Sai Nagar Tabib Land Total
Neutral - - 8
(3.33) - - -
5
(2.07)
13
(0.91)
13
(0.68)
Satisfied 465
(96.88)
228
(95.00)
222
(92.50)
232
(96.67)
222
(96.52)
227
(94.58)
220
91.29)
1351
(94.41)
1816
(95.03)
Highly satisfied 11
(2.29) 10
(4.17) 9
(3.75) -
8 (3.48)
13 (5.42)
9 (3.73)
49 (3.42)
60 (3.14)
No Response 4
(0.83)
2
(0.83)
1
(0.42)
8
(3.33) - -
7
(2.90)
18
(1.26)
22
(1.15)
Total 480
(100)
240
(100)
240
(100)
240
(100)
230
(100)
240
(100)
241
(100)
1431
(100)
1911
(100)
The various aspects that led to satisfaction among customers which include water pressure, water quality,
continuity in water supply, availability of appropriate quantum of water and water pressure as well as redressal
of customer complaints have been examined in Table 7 to Table 13.
3.5.1 Satisfaction with water schedule of water supply
Table 7 indicates that most of the respondents were satisfied with the schedule of water supply, with more than
85 percent of the respondents, for the city as a whole, indicating satisfaction. However, there was a dip in the
percentage of respondents satisfied in the HDMC tank zone, which is located on tail end of transmission main
and also the network is very old. As expected, nearly all the respondents (99%) in the Demo Zone indicated that
they were satisfied with the schedule of water supply because water was available to them 24X7 i.e. throughout
the day all through the year.
Journal of Environment and Earth Science www.iiste.org
ISSN 2224-3216 (Paper) ISSN 2225-0948 (Online)
Vol.4, No.9, 2014
112
Table 7: Customer satisfaction with Schedule of Water Supply
Levels of satisfaction 24x7 Demo Zone
Intermittent water supply areas
City Total HDMC
Tank
Keshwa
pur
Nehru
Nagar
Old
Hubli
Sai
Nagar
Tabib
Land Total
Highly Dissatisfied - - - 1
(0.42) - - -
1
(0.07)
1
(0.05)
Dissatisfied - 56
(23.33) -
1 (0.42)
1 (0.43)
- - 58
(4.05) 58
(3.04)
Neutral - 3
(1.25)
2
(0.83)
3
(1.25) -
2
(0.83)
1
(0.41)
11
(0.77)
11
(0.58)
Satisfied 471
(98.13)
177
(73.75)
236
(98.33)
226
(94.17)
228
(99.13)
229
(95.42)
229
(95.02)
1325
(92.59)
1796
(93.98)
Highly satisfied 4
(0.83) 2
(0.83) 1
(0.42) 1
(0.42) 1
(0.43) 9
(3.75) 4
(1.66) 18
(1.26) 22
(1.15)
No Response 5
(1.04)
2
(0.83)
1
(0.42)
8
(3.33) - -
7
(2.90)
18
(1.26)
23
(1.20)
Grand Total 480
(100)
240
(100)
240
(100)
240
(100)
230
(100)
240
(100)
241
(100)
1431
(100)
1911
(100)
3.5.2 Satisfaction with continuity of water supply
Table 8 shows that there was nearly 100 percent satisfaction with water continuity in 24X7 service areas, as
water was available throughout the day at constant pressure, while even in the case of intermittent service areas,
a meager 5.38 percent of the respondents were not satisfied with continuity of water, which was due to water
stoppage during power outages in zones without storage facilities.
Table 8: Levels of Satisfaction with continuity of Water
Levels of
satisfaction
24x7 Demo
zone
Intermittent water supply areas City
Total HDMC
Tank
Keshwa
pur
Nehru
Nagar
Old
Hubli
Sai
Nagar
Tabib
Land Total
Highly
Dissatisfied - - -
1
(0.42) - - -
1
(0.07)
1
(0.05)
Dissatisfied - 56
(23.33) -
1 (0.42)
1 (0.43)
- - 58
(4.05) 58
3.04)
Neutral - 3
(1.25)
2
(0.83)
3
(1.25) -
2
(0.83)
1
(0.41)
11
(0.77)
11
0.58)
Satisfied 471
(98.13) 177
(73.75) 236
(98.33) 226
(94.17) 228
(99.13) 229
(95.42) 229
95.02)
1325
(92.5
9)
1796 (93.98)
Highly satisfied 4
(0.83)
2
(0.83)
1
(0.42)
1
(0.42)
1
(0.43)
9
(3.75)
4
(1.66)
18
(1.26)
22
(1.15)
No Response 5
(1.04) 2
(0.83) 1
(0.42) 8
(3.33) - -
7 (2.90)
18 (1.26)
23 (1.20)
Grand Total 480
(100)
240
(100)
240
(100)
240
(100)
230
(100)
240
(100)
241
(100)
1431
(100)
1911
(100)
3.5.3 Satisfaction with Quantity and Pressure of Water Supply
Table 9 indicates that most of the respondents, in both the intermittent water supply regions and 24X7 zones
were satisfied with the quantity of water being supplied (90.08 % and 96.67%, respectively). These
improvements were possible on account of various initiatives undertaken by the Water Board viz., augmenting
bulk water supply at Malaprabha source, and reducing the extent of water lost in the system resulting in increase
in quantity of water available to customers. Examination of Table 10 indicates that majority of the customers
were also satisfied with the pressure at which water supplied in both the regions. The lower levels of satisfaction
in the non-24X7 regions was on account of pipes leaking due to aged infrastructure and the lack of pressure
reducing valves, causing low pressures on tail-ends and ridge areas. These issues were addressed while
implementing the 24X7 schemes in the cities, where new pipelines were installed together with pressure
reducing valves (PRV) at selected points so as to maintain the required pressure of more than 6 m.
Journal of Environment and Earth Science www.iiste.org
ISSN 2224-3216 (Paper) ISSN 2225-0948 (Online)
Vol.4, No.9, 2014
113
Table 9: Satisfaction with Quantity of Water Supplied
Levels of
satisfaction
24x7 Demo
zone
Intermittent water supply areas City
Total HDMC Tank
Keshwa pur
Nehru Nagar
Old Hubli
Sai Nagar
Tabib Land
Total
Highly Dissatisfied 1
(0.21) - - - -
1
(0.42) -
1
(0.07)
2
(0.10)
Dissatisfied 1
(0.21) -
1
(0.42)
2
(0.83) -
3
(1.25)
8
(3.32)
14
(0.98)
15
(0.78)
Neutral 51
(10.63) 4
(1.67) 3
(1.25) 19
(7.92) 2
(0.87) 10
(4.17) 9
(3.73) 47
(3.28) 98
(5.13)
Satisfied 415
(86.46)
227
(94.58)
229
(95.42)
208
(86.67)
222
(96.52)
219
(91.25)
212
(87.97)
1317
(92.03)
1732
(90.63)
Highly satisfied 7
(1.46)
7
(2.92)
5
(2.08)
3
(1.25)
6
(2.61)
7
(2.92)
5
(2.07)
33
(2.31)
40
(2.09)
No Response 5
(1.04)
2
(0.83)
2
(0.83)
8
(3.33)
7
(2.90)
19
(1.33)
24
(1.26)
Grand Total 480
(100) 240
(100) 240
(100) 240
(100) 230
(100) 240
(100) 241
(100) 1431 (100)
1911 (100)
Table 10: Satisfaction regarding pressure
Levels of
satisfactio
n
24x7 Demo zone
Intermittent water supply areas City Total HDMC
Tank
Keshwa
pur
Nehru
Nagar
Old
Hubli
Sai
Nagar
Tabib
Land Total
Highly Dissatisfie
d
- - 1 - - - - 1
(0.07)
2
(0.10)
Dissatisfied
1 - 1 1 - 4
(1.67) 3
1.24) 11
(0.77) 14
(0.73)
Neutral 4 1 2 10 1 21
(8.75)
13
(5.39)
66
(4.61)
84
(4.40)
Satisfied 93 93 96 85 98 212
(88.33) 216
(89.63)
1314
(91.82
)
1761 (92.15)
Highly
satisfied 1 5 - 1 1
3
(1.25)
2
(0.83)
21
(1.47)
27
(1.41)
No Response
1
1 - 3 - - 7
(2.90) 18
(.26) 23
(1.20)
Grand
Total
100 100 100 100 100
240
(100)
241
(100)
1431
(100)
1911
(100)
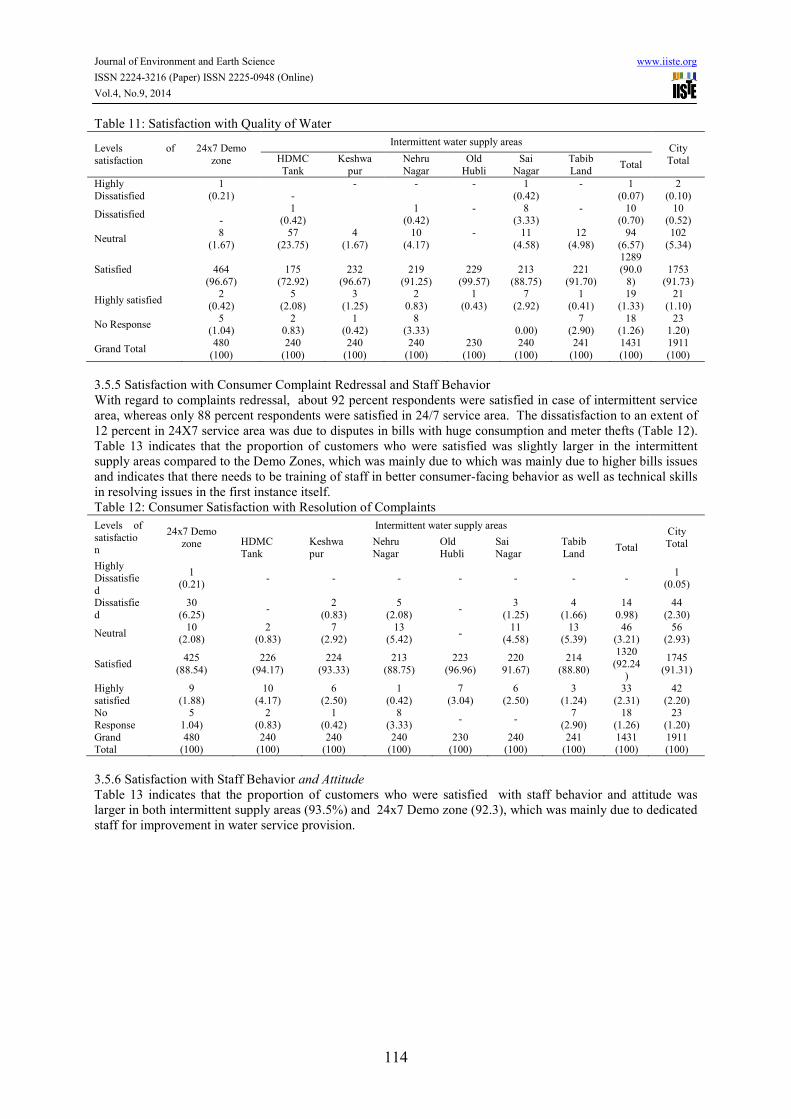
3.5.4 Satisfaction with Quality of Water Supply
One of the most important aspects for satisfaction regarding water supply is the satisfaction with the quality of
water that is being supplied. Table 11 indicates that more than 97 percent of the respondents in the 24X7 zone
were satisfied with the quality of water supplied, while the level of satisfaction was lesser in the non-demo zones,
with only about 93 per cent of the respondents indicating that they were satisfied. The levels of satisfaction with
quality of water varied across the city with reduced levels of satisfaction, particularly in the HDMC Tank regions.
The lower levels of satisfaction in the intermittent water supply areas was on account of seepage of polluted or
contaminated water into water mains due to the low pressure created inside the water mains when empty (on
account of intermittent water supply). In HDMC tank zone there were frequent leakages in pipes coupled with
low pressure leading to ingress of outside water
Journal of Environment and Earth Science www.iiste.org
ISSN 2224-3216 (Paper) ISSN 2225-0948 (Online)
Vol.4, No.9, 2014
114
Table 11: Satisfaction with Quality of Water
Levels of
satisfaction
24x7 Demo
zone
Intermittent water supply areas City
Total HDMC
Tank
Keshwa
pur
Nehru
Nagar
Old
Hubli
Sai
Nagar
Tabib
Land Total
Highly
Dissatisfied
1
(0.21) -
- - - 1
(0.42)
- 1
(0.07)
2
(0.10)
Dissatisfied -
1 (0.42)
1 (0.42)
- 8 (3.33)
- 10 (0.70)
10 (0.52)
Neutral 8
(1.67)
57
(23.75)
4
(1.67)
10
(4.17)
- 11
(4.58)
12
(4.98)
94
(6.57)
102
(5.34)
Satisfied 464
(96.67)
175
(72.92)
232
(96.67)
219
(91.25)
229
(99.57)
213
(88.75)
221
(91.70)
1289
(90.0
8)
1753
(91.73)
Highly satisfied 2
(0.42)
5
(2.08)
3
(1.25)
2
0.83)
1
(0.43)
7
(2.92)
1
(0.41)
19
(1.33)
21
(1.10)
No Response 5
(1.04) 2
0.83) 1
(0.42) 8
(3.33) 0.00) 7
(2.90) 18
(1.26) 23
1.20)
Grand Total 480
(100)
240
(100)
240
(100)
240
(100)
230
(100)
240
(100)
241
(100)
1431
(100)
1911
(100)
3.5.5 Satisfaction with Consumer Complaint Redressal and Staff Behavior
With regard to complaints redressal, about 92 percent respondents were satisfied in case of intermittent service
area, whereas only 88 percent respondents were satisfied in 24/7 service area. The dissatisfaction to an extent of
12 percent in 24X7 service area was due to disputes in bills with huge consumption and meter thefts (Table 12).
Table 13 indicates that the proportion of customers who were satisfied was slightly larger in the intermittent
supply areas compared to the Demo Zones, which was mainly due to which was mainly due to higher bills issues
and indicates that there needs to be training of staff in better consumer-facing behavior as well as technical skills
in resolving issues in the first instance itself.
Table 12: Consumer Satisfaction with Resolution of Complaints
Levels of
satisfaction
24x7 Demo
zone
Intermittent water supply areas City
Total HDMC
Tank
Keshwa
pur
Nehru
Nagar
Old
Hubli
Sai
Nagar
Tabib
Land Total
Highly
Dissatisfie
d
1 (0.21)
- - - - - - - 1
(0.05)
Dissatisfie
d
30
(6.25) -
2
(0.83)
5
(2.08) -
3
(1.25)
4
(1.66)
14
0.98)
44
(2.30)
Neutral 10
(2.08) 2
(0.83) 7
(2.92) 13
(5.42) -
11 (4.58)
13 (5.39)
46 (3.21)
56 (2.93)
Satisfied 425
(88.54)
226
(94.17)
224
(93.33)
213
(88.75)
223
(96.96)
220
91.67)
214
(88.80)
1320
(92.24)
1745
(91.31)
Highly
satisfied
9
(1.88)
10
(4.17)
6
(2.50)
1
(0.42)
7
(3.04)
6
(2.50)
3
(1.24)
33
(2.31)
42
(2.20) No
Response
5
1.04)
2
(0.83)
1
(0.42)
8
(3.33) - -
7
(2.90)
18
(1.26)
23
(1.20)
Grand Total
480 (100)
240 (100)
240 (100)
240 (100)
230 (100)
240 (100)
241 (100)
1431 (100)
1911 (100)
3.5.6 Satisfaction with Staff Behavior and Attitude
Table 13 indicates that the proportion of customers who were satisfied with staff behavior and attitude was
larger in both intermittent supply areas (93.5%) and 24x7 Demo zone (92.3), which was mainly due to dedicated
staff for improvement in water service provision.

Journal of Environment and Earth Science www.iiste.org
ISSN 2224-3216 (Paper) ISSN 2225-0948 (Online)
Vol.4, No.9, 2014
115
Table 13: Satisfaction with Staff Behavior and Attitude
Levels of
satisfaction
24x7 Demo
zone
Intermittent water supply areas City
Total HDMC
Tank
Keshwa
pur
Nehru
Nagar
Old
Hubli
Sai
Nagar
Tabib
Land Total
Highly
Dissatisfied - - - - -
2
(0.83) -
2
(0.14)
2
(0.10)
Dissatisfied - - 3
(1.25) 1
(0.42) -
3 (1.25)
1 (0.41)
8 (0.56)
8 (0.42)
Neutral 32
(6.67)
3
(1.25)
5
(2.08)
7
(2.92) -
6
(2.50)
10
(4.15)
31
(2.17)
63
(3.30)
Satisfied 436
(90.83) 229
(95.42) 228
(95.00) 219
(91.25) 227
(98.70) 221
(92.08) 216
(89.63)
1340
(93.6
4)
1776 (92.94)
Highly satisfied 7
(1.46)
6
(2.50)
3
(1.25)
5
(2.08)
3
(1.30)
8
(3.33)
7
(2.90)
32
(2.24)
39
(2.04)
No Response 5
(1.04) 2
(0.83) 1
(0.42) 8
(3.33) - -
7 (2.90)
18 (1.26)
23 (1.20)
Grand Total 480
(100)
240
(100)
240
(100)
240
(100)
230
(100)
240
(100)
241
(100)
1431
(100)
1911
(100)
3.6 Willingness for 24X7 Water Supply
Opinion of the customers across various regions was elicited regarding the scaling up of 24 X 7 water supply
throughout the city, and the responses indicate that a majority (97%) was in favor of extending the 24X7 services
throughout the city (Figure 5). Discussions with the respondents indicated that the 24X7 water supply would
reduce the need to store water and discard stored water and convenience in the form of not having to wake up at
odd hours or return home early from work to collect water in the intermittent water supply as being the main
reason for preferring 24X7 water services.
99 97 98 93 10093 95 97
24x7
Demo
zone
HDMC
Tank
Keshwa
pur
Nehru
Nagar
Old
Hubli
Sai
Nagar
Tabib
Land
City
Total
No Response
Not Required
Required
• Figure 5: Opinion regarding Scaling Up of 24X7 Water Supply
4. Summary and Conclusions
Customer satisfaction plays prime role in assessing the performance of an organization as well as in identifying
areas of improvement. The results of this study reveals that majority of the customers in Hubli city, particularly
in the 24X7 (Demo zones) were satisfied with the performance of the water supply-service provider in the city
i.e. The Karnataka Water Supply & Drainage Board. The characteristics / aspects of the service that contributed
to customer satisfaction include water quality, continuity, quantity, and pressure, while there was slight
dissatisfaction (12 percent) with regard to redressal of customer complaints, particularly in the 24X7 zones. The
dissatisfaction was related to the bill disputes that were carried over from the intermittent water supply period.
In contrast, there was higher level of dissatisfaction with water quality, continuity and pressure in the
intermittent service areas. Water quality issues, unscheduled supply and inequitable pressure in water supply
which inherent with the intermittent supply system across various cities in most countries were found to be
issues even in Hubli city. These performance issues could be addressed either through a piece-meal approach,
wherein, small investments are made to make minor improvements to infrastructure, or there could be a one-time
investment in overhauling the entire water distribution system in the city as in the case of 24X7 zones. The 24X7
water supply which is the benchmark set for water supply across the globe can help in resolving most
performance issues identified in this study. The results of the study also indicate there was overwhelming
affirmative response to scaling up the 24X7 water supply services throughout the city to enable all citizens to
Journal of Environment and Earth Science www.iiste.org
ISSN 2224-3216 (Paper) ISSN 2225-0948 (Online)
Vol.4, No.9, 2014
116
enjoy the benefits of such service. A few recommendations that arise from this study include that 24X7 water
supply services need to be extended throughout the city, as well as that a consumer complaints redressal cell
needs to be established at the department itself rather than depend on the complaints cell at the HDMC. Training
of staff in better handling customer technical and other requirements such as billing and payments would also
play a role in improving the image of the service provider.
5. References
Al-Ghuraiz Y., Enshassi A., 2006. Customers’ satisfaction with water supply service in the Gaza Strip, Building
and Environment 41, pp 1243–1250
Bhandari B., Grant M., 2007 User satisfaction and sustainability of drinking water schemes in rural communities
of Nepal, Sustainability, Practice & Policy Volume 3 Issue 1 pp.12-20(Available at http://ejournal.nbii.org)
CPHEEO (1999) Manual on Water Supply and Treatment. Central Public Health Environmental Engineering
Organization, Ministry of Urban Development, Govt. of India, New Delhi
Customer Satisfaction Survey Report, (Available at http://www.nwsc.co.ug/files/surveyreports/Pilot
20Survey.pdf)
GoK (2003): Government Order No UDD: 25: UWS: 2002, Bangalore, Dated 24-3-2003, Urban Development
Department, Government of Karnataka.
GoK (2005): Contract for Rehabilitation, Operation and Management of Water Provision in Selected
Demonstration Zones in Belgaum, Gulbarga and Hubli-Dharwad Municipal Corporations, Contract No.
KUWASIP-CC001-ICB-OCC, Urban Development Department, Government of Karnataka, Bangalore and
KUIDFC, Bangalore.
Kotler, P., Kelvin K. (2006), “Marketing Management”, 12th Edition, Pearson Education Inc.
Likert R., 1932. A technique for the measurement of attitudes. Archives of Psychology, 22(140), 1-55.
Mugabi, J., Kayaga, S. and Smout, I., 2007. Why Water Utility Customers don’t pay their Bills Promptly. Water
Utility Management International, 2(2).
Oliver, R.L. (1997) “Satisfaction: A Behavioral Perspective on the Consumer”, Irwin McGraw-Hill.
Po-Tsang Chen, Hsin-Hui Hu, (2010) "How determinant attributes of service quality influence customer-
perceived value: An empirical investigation of the Australian coffee outlet industry", International Journal of
Contemporary Hospitality Management, Vol. 22 Issue: 4, pp.535 – 551
Vloerbergh I., Fife-Schaw C., Kelay T., Chenoweth J., Morrison G and Lundehn C., 2007, Assessing consumer
preferences for drinking water services- Methods for Water Utilities TECHNEAU D 6.2.2
Zairi, M. (1994), Measuring Performance for Business results, Chapman and Hall.

The IISTE is a pioneer in the Open-Access hosting service and academic event
management. The aim of the firm is Accelerating Global Knowledge Sharing.
More information about the firm can be found on the homepage:
http://www.iiste.org
CALL FOR JOURNAL PAPERS
There are more than 30 peer-reviewed academic journals hosted under the hosting
platform.
Prospective authors of journals can find the submission instruction on the
following page: http://www.iiste.org/journals/ All the journals articles are available
online to the readers all over the world without financial, legal, or technical barriers
other than those inseparable from gaining access to the internet itself. Paper version
of the journals is also available upon request of readers and authors.
MORE RESOURCES
Book publication information: http://www.iiste.org/book/
Recent conferences: http://www.iiste.org/conference/
IISTE Knowledge Sharing Partners
EBSCO, Index Copernicus, Ulrich's Periodicals Directory, JournalTOCS, PKP Open
Archives Harvester, Bielefeld Academic Search Engine, Elektronische
Zeitschriftenbibliothek EZB, Open J-Gate, OCLC WorldCat, Universe Digtial
Library , NewJour, Google Scholar