C:\Users\user\Desktop\da stampare\annalisa-thesis - iris univpm
180
i
-
Upload
khangminh22 -
Category
Documents
-
view
2 -
download
0
Transcript of C:\Users\user\Desktop\da stampare\annalisa-thesis - iris univpm

i


Universita Politecnica delle Marche
Scuola di Dottorato di Ricerca in Scienze dell’Ingegneria
Curriculum in Ingegneria Informatica, Gestionale e dell’Automazione
An infrastructure for
decision-making to support
neonatal clinical care and research
Ph.D. Dissertation of:
Annalisa Cenci
Advisor:
Prof. Primo Zingaretti
Curriculum Supervisor:
Prof. Francesco Piazza
XVI edition - new series

Universita Politecnica delle Marche
Scuola di Dottorato di Ricerca in Scienze dell’Ingegneria
Facolta di Ingegneria
Via Brecce Bianche – 60131 Ancona (AN), Italy

To my family


Ringraziamenti
Il primo ringraziamento va, senza dubbio, ai miei genitori, i due punti di
riferimento della mia vita, senza i quali non sarei arrivata dove sono ora. Grazie
perche posso sempre contare su di voi, perche sapete essermi vicini nei momenti
difficili e gioire per i miei traguardi.
Un grazie enorme anche a mia sorella e a mio fratello, su cui posso sempre
contare, e alla famiglia che si allarga..
Un grazie speciale anche a te Italo, perche con te posso essere sempre me
stessa, perche mi capisci e mi sei vicino piu di chiunque altro, anche nei momenti
piu stressanti, che tanto spesso sono capitati in questi anni di dottorato. Grazie
per tutto!
Altro tipo di ringraziamento, ma non meno importante e sincero, va ai pro-
fessori Primo Zingaretti ed Emanuele Frontoni, che mi hanno dato la possi-
bilita di intraprendere questo stimolante percorso di ricerca. Grazie a Primo
per i suoi preziosi consigli che mi hanno spronato a fare sempre meglio e ad
Emanuele per la passione che mette nel suo lavoro e che cerca di trasmetterci
quotidianamente.
Ringrazio tutti i membri del VRAI, del DII e dell’Universita che ho avuto
il piacere di conoscere in questi anni, Rama, Michele, Rocco, Chiara, Mirco,
Roberto e Roberto, Gloria. Grazie per avermi dato una mano quando potevate
o anche solo per avermi allietato la giornata con una battuta.
Un grazie particolarmente sentito va ai miei due compagni di lavori, viaggi,
avventure, chiacchiere e risate, che in questi tre anni da colleghi si sono trasfor-
mati in amici fidati su cui so che potro contare anche in futuro.
Un grazie anche al Prof. Virgilio Paolo Carnielli, al personale del reparto
della UTIN dell’ospedale pediatrico “G. Salesi“ di Ancona e alla JEF srl senza
la cui collaborazione questo lavoro di dottorato non sarebbe stato possibile.
A tal proposito mi sento di ringraziare tutte le persone della JEF con cui mi
trovo molto bene e da cui sto imparando molto. Grazie a Moira, Bianca, Luca,
Andrea, Marco, Salvatore e a tutto il team di sviluppo.
Anche qui un grazie particolare, che viene dal cuore, va a te Ilaria. 7 anni
fa ti ho conosciuta come mia correlatrice. Da correlatrice sei passata a collega
e, poi, a molto piu che collega. Ormai se per me un’amica vera e leale. Posso
dire, mai stata piu sincera, che se non fosse stato per te non sarei arrivata fin
qui. Mi hai sempre spronato a continuare e ad andare avanti, credendo in me
ix

piu di quanto facessi io, sopportando le mie ansie e sollevandomi il morale con
il tuo perenne buonumore. Grazie!
Ultimo, ma non per importanza, un grazie alle mie amiche di sempre, Mari,
Vale, Anna e Marti; grazie perche, nonostante lo studio, il lavoro e i mille
impegni che ci tengono lontane, siete sempre lı pronte ad accogliermi a braccia
aperte, a farmi divertire e a farmi sentire a casa come se ci vedessimo ancora
tutti i giorni!
E per finire un grazie davvero sentito a tutti coloro, amici e parenti, che,
anche se non ho citato, mi hanno aiutato ad arrivare a questo importante
traguardo.
Ancona, October 2017
Annalisa Cenci
x

Sommario
I dispositivi medici, in genere, sono unita individuali, per cui una tipica
sala ospedaliera in un reparto di terapia intensiva ospita un gran numero di
dispositivi stand-alone, ognuno con una propria interfaccia utente.
Le culle dei neonati pretermine presso l’Unita di Terapia Intensiva Neona-
tale (UTIN) dell’Ospedale Pediatrico “G. Salesi“ di Ancona sono circondati da
numerosi dispositivi per il monitoraggio, la diagnosi e il trattamento di diverse
malattie e tutti questi dispositivi forniscono un’enorme quantita di dati che,
fino ad ora, venivano visualizzati solo su monitor e periodicamente trascritti in
una cartella clinica cartacea. Le note manuali, quindi, venivano regolarmente,
ma non immediatamente, trascritte in un foglio elettronico sul PC dell’unita
neonatale con il rischio di errori e dimenticanze.
In questo contesto, i medici hanno espresso la necessita di raccogliere auto-
maticamente i dati da tutti questi dispositivi per garantire che non venissero
trascurati dettagli importanti per la cura del paziente, essendo consapevoli che
l’automazione di questo processo puo facilitare e migliorare l’implementazione
delle procedure della loro pratica clinica quotidiana.
Alla luce di quanto espresso, l’obiettivo di questa tesi e quello di permet-
tere l’interfacciamento e l’integrazione delle strumentazioni biomediche della
UTIN in un’unica infrastruttura cloud, che consenta la comunicazione tra di-
versi dispositivi medici e un unico database. L’architettura proposta consente
l’automatizzazione del processo di raccolta, trasmissione, memorizzazione, elab-
orazione e disponibilita dei dati dei dispositivi per il personale medico. Questa
e garantita dalla realizzazione di un’interfaccia web che supera le funzionalita
di una semplice Cartella Clinica Elettronica (CCE), grazie allo sviluppo di
moduli clinici innovativi. Essi contengono applicazioni, funzionalita, tecniche
di estrazione e analisi dei dati e algoritmi decisionali, che forniscono in output
consigli, reminder, allarmi, e importanti indicatori, in grado di supportare i
medici nella previsione e nella diagnosi di malattie come l’ittero neonatale o
le disabilita motorie, nel monitoraggio dei parametri fisiologici e di sviluppo,
come la frequenza respiratoria e i parametri di crescita, e nelle decisioni da
prendere riguardo problemi clinici, come gli apporti nutrizionali giornalieri e i
follow-up.
Tutte le soluzioni sopra descritte sono state validate attraverso una serie di
esperimenti condotti nella UTIN sotto l’attenta supervisione del primario del
xi

reparto, il Prof. V. P. Carnielli.
xii

Abstract
Medical devices, generally, have been unique units, so that a typical hospital
room in an intensive care ward hosts a big number of stand-alone devices, each
one with its own user interface.
Preterm infants’ cribs in Neonatal Intensive Care Unit (NICU) of “Women’s
and Children’s Hospital G. Salesi” of Ancona are surrounded by many devices
for the monitoring, diagnosis and treatment of several diseases and all these
devices provide a huge amount of data that, until now, was only displayed on
monitors and periodically transcribed in a paper medical record. Then manual
notes were regularly, but not immediately, transcribed in an electronic sheet
on the PC of the neonatal unit with the risk of errors and forgetfulnesses.
In this context, physicians have expressed the need to automatically gather
data from all these devices to ensure that no important details for patient
care were overlooked, as they are aware that the automation of this process
could facilitate and improve the implementation of the procedures of their
daily clinical practice.
In the light of the above, the objective of this thesis is to allow the interfac-
ing and integration of biomedical instrumentations of the NICU into a single
cloud-based infrastructure that enables the communication between different
medical devices and a unique database. The proposed architecture permits
the automation of the process of device data collection, transmission, storage,
processing and availability for medical staff, that is guaranteed through the
implementation of a web interface that exceeds the functionalities of a simple
Electronic Medical Record (EMR), thanks to the development of innovative
clinical tools. They contain applications, functionalities, data extraction and
analysis techniques and decision making algorithms, which provide in output
advices, reminders, alarms, and important indicators that can support physi-
cians in predicting and diagnosing diseases, such as neonatal jaundice or motor
disabilities, in monitoring physiological and developmental parameters, such as
respiratory rate and growth parameters, and in making decisions about clinical
problems, such as daily nutritional intakes and follow-ups.
All the solutions described above have been validated through a series of
experiments conducted in the NICU under the careful supervision of the Head
Physician, Prof. V. P. Carnielli.
xiii


Contents
1 Introduction 1
1.1 Context . . . . . . . . . . . . . . . . . . . . . . . . . . . . . . . 1
1.2 Objectives and main contributions . . . . . . . . . . . . . . . . 4
1.3 Structure of the thesis . . . . . . . . . . . . . . . . . . . . . . . 6
2 State of the art 9
2.1 Health Information System Infrastructures . . . . . . . . . . . . 10
2.2 Electronic Medical Records and Electronic Health Records . . . 12
2.3 Evidence-Based Medicine and Decision Support . . . . . . . . . 16
3 A new infrastructure for neonatal care 19
3.1 SINC cloud-based healthcare architecture . . . . . . . . . . . . 20
3.1.1 Data Platform . . . . . . . . . . . . . . . . . . . . . . . 22
3.1.2 Cyber Security . . . . . . . . . . . . . . . . . . . . . . . 23
3.2 Medical Device Network . . . . . . . . . . . . . . . . . . . . . . 24
3.2.1 Patient Monitor . . . . . . . . . . . . . . . . . . . . . . 24
3.2.1.1 Communication Protocol . . . . . . . . . . . . 25
3.2.1.2 Patient Monitor Data . . . . . . . . . . . . . . 27
3.2.2 Bilirubinometer . . . . . . . . . . . . . . . . . . . . . . . 28
3.2.2.1 Communication Protocol . . . . . . . . . . . . 29
3.2.3 Transcutaneous Bilirubinometer . . . . . . . . . . . . . 31
3.2.3.1 Communication Protocol . . . . . . . . . . . . 32
3.3 The end-user web interface . . . . . . . . . . . . . . . . . . . . 34
3.3.1 Authentications, Authorizations and Privacy Policy . . 35
3.3.2 Applications, Tools and Services . . . . . . . . . . . . . 36
3.3.2.1 Clinical Tools . . . . . . . . . . . . . . . . . . . 37
3.3.2.1.1 Anagraphic Tool . . . . . . . . . . . . 37
3.3.2.1.2 Growth Tool . . . . . . . . . . . . . . 38
3.3.2.1.3 Nutrition Tool . . . . . . . . . . . . . 40
3.3.2.1.4 Bayley Tool . . . . . . . . . . . . . . 43
4 Decision-Making Tools 47
4.1 Bilirubin Tool . . . . . . . . . . . . . . . . . . . . . . . . . . . . 47
4.1.1 Related Works . . . . . . . . . . . . . . . . . . . . . . . 49
4.1.2 SIN Guidelines . . . . . . . . . . . . . . . . . . . . . . . 51
xv

Contents
4.1.3 Scenario . . . . . . . . . . . . . . . . . . . . . . . . . . . 55
4.1.4 Data Analysis: Bilirubin Decision-Making Algorithm . . 57
4.2 Activities Monitoring Tools . . . . . . . . . . . . . . . . . . . . 61
4.2.1 The physical architecture . . . . . . . . . . . . . . . . . 61
4.2.2 Respiration Tool . . . . . . . . . . . . . . . . . . . . . . 62
4.2.2.1 Related Works . . . . . . . . . . . . . . . . . . 63
4.2.2.2 Data Analysis: Respiratory Rate Algorithm . . 64
4.2.3 Movement Tool . . . . . . . . . . . . . . . . . . . . . . . 65
4.2.3.1 Related Works . . . . . . . . . . . . . . . . . . 68
4.2.3.2 Data Analysis . . . . . . . . . . . . . . . . . . 69
4.2.3.2.1 Acquisition and Movements Detection
Algorithm . . . . . . . . . . . . . . . 70
4.2.3.2.2 Data processing . . . . . . . . . . . . 71
KPIs Extraction . . . . . . . . . . . . . . . . 73
Markov Chain Model . . . . . . . . . . . . . 74
4.2.3.2.3 Extremities Tracking Algorithm . . . 75
4.2.4 Infant Semantic Segmentation . . . . . . . . . . . . . . . 77
4.2.4.1 Related Works . . . . . . . . . . . . . . . . . . 78
4.2.4.2 Convolutional Neural Networks . . . . . . . . . 78
4.2.4.2.1 U-Nets . . . . . . . . . . . . . . . . . 78
4.2.4.2.2 SegNet . . . . . . . . . . . . . . . . . 80
4.2.4.2.3 ResNet . . . . . . . . . . . . . . . . . 81
4.2.4.2.4 FractalNet . . . . . . . . . . . . . . . 81
4.2.4.3 Adopted Metrics . . . . . . . . . . . . . . . . . 82
5 Results and discussion 85
5.1 SINC cloud-based healthcare architecture evaluation . . . . . . 85
5.1.1 The web interface usability test . . . . . . . . . . . . . . 86
5.2 Bilirubin Tool . . . . . . . . . . . . . . . . . . . . . . . . . . . . 87
5.2.1 Data Analysis Results . . . . . . . . . . . . . . . . . . . 89
5.2.2 Discussion . . . . . . . . . . . . . . . . . . . . . . . . . . 91
5.3 Respiration Tool . . . . . . . . . . . . . . . . . . . . . . . . . . 93
5.3.1 Data Analysis Results . . . . . . . . . . . . . . . . . . . 94
5.3.2 Discussion . . . . . . . . . . . . . . . . . . . . . . . . . . 96
5.4 Movement Tool . . . . . . . . . . . . . . . . . . . . . . . . . . . 96
5.4.1 Data Analysis Results . . . . . . . . . . . . . . . . . . . 100
5.4.1.1 MIA (Motion Infant Analysis) dataset . . . . . 100
5.4.1.2 KPIs and MC Transition Matrix . . . . . . . . 101
5.4.2 Discussion . . . . . . . . . . . . . . . . . . . . . . . . . . 107
5.5 Semantic Segmentation . . . . . . . . . . . . . . . . . . . . . . 108
5.5.1 PIDS (Preterm Infants’ Depth Silhouette) Dataset . . . 108
xvi

Contents
5.5.2 Data Analysis Results . . . . . . . . . . . . . . . . . . . 112
5.5.2.1 Quantitative Evaluation . . . . . . . . . . . . . 112
5.5.2.2 Qualitative Evaluation . . . . . . . . . . . . . 115
5.5.3 Discussion . . . . . . . . . . . . . . . . . . . . . . . . . . 115
6 Conclusions and Future Works 119
6.1 Discussion . . . . . . . . . . . . . . . . . . . . . . . . . . . . . . 119
6.2 Thesis contributions . . . . . . . . . . . . . . . . . . . . . . . . 121
6.3 Future Works . . . . . . . . . . . . . . . . . . . . . . . . . . . . 123
Appendices 125
Appendix A 127
xvii

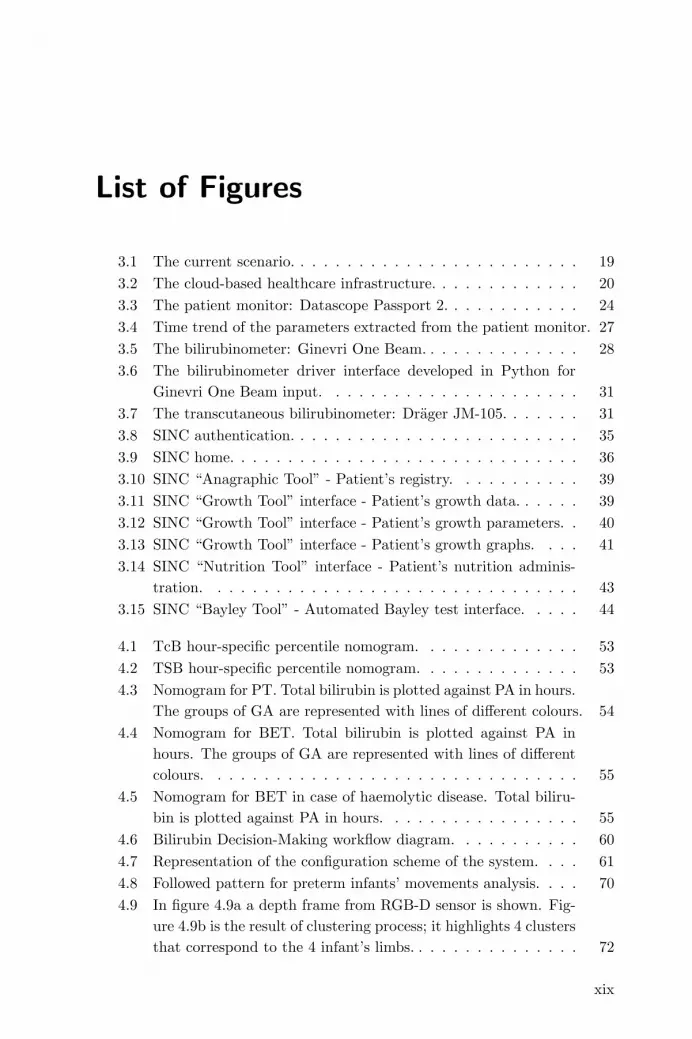
List of Figures
3.1 The current scenario. . . . . . . . . . . . . . . . . . . . . . . . . 19
3.2 The cloud-based healthcare infrastructure. . . . . . . . . . . . . 20
3.3 The patient monitor: Datascope Passport 2. . . . . . . . . . . . 24
3.4 Time trend of the parameters extracted from the patient monitor. 27
3.5 The bilirubinometer: Ginevri One Beam. . . . . . . . . . . . . . 28
3.6 The bilirubinometer driver interface developed in Python for
Ginevri One Beam input. . . . . . . . . . . . . . . . . . . . . . 31
3.7 The transcutaneous bilirubinometer: Drager JM-105. . . . . . . 31
3.8 SINC authentication. . . . . . . . . . . . . . . . . . . . . . . . . 35
3.9 SINC home. . . . . . . . . . . . . . . . . . . . . . . . . . . . . . 36
3.10 SINC “Anagraphic Tool” - Patient’s registry. . . . . . . . . . . 39
3.11 SINC “Growth Tool” interface - Patient’s growth data. . . . . . 39
3.12 SINC “Growth Tool” interface - Patient’s growth parameters. . 40
3.13 SINC “Growth Tool” interface - Patient’s growth graphs. . . . 41
3.14 SINC “Nutrition Tool” interface - Patient’s nutrition adminis-
tration. . . . . . . . . . . . . . . . . . . . . . . . . . . . . . . . 43
3.15 SINC “Bayley Tool” - Automated Bayley test interface. . . . . 44
4.1 TcB hour-specific percentile nomogram. . . . . . . . . . . . . . 53
4.2 TSB hour-specific percentile nomogram. . . . . . . . . . . . . . 53
4.3 Nomogram for PT. Total bilirubin is plotted against PA in hours.
The groups of GA are represented with lines of different colours. 54
4.4 Nomogram for BET. Total bilirubin is plotted against PA in
hours. The groups of GA are represented with lines of different
colours. . . . . . . . . . . . . . . . . . . . . . . . . . . . . . . . 55
4.5 Nomogram for BET in case of haemolytic disease. Total biliru-
bin is plotted against PA in hours. . . . . . . . . . . . . . . . . 55
4.6 Bilirubin Decision-Making workflow diagram. . . . . . . . . . . 60
4.7 Representation of the configuration scheme of the system. . . . 61
4.8 Followed pattern for preterm infants’ movements analysis. . . . 70
4.9 In figure 4.9a a depth frame from RGB-D sensor is shown. Fig-
ure 4.9b is the result of clustering process; it highlights 4 clusters
that correspond to the 4 infant’s limbs. . . . . . . . . . . . . . . 72
xix

List of Figures
4.10 Different movements states in which infant can be in. Red
rounds indicate the “in movement” limbs. . . . . . . . . . . . . 75
4.11 Longest path approach steps. . . . . . . . . . . . . . . . . . . . 76
4.12 Illustration of the U-Net architecture. Image taken from [1]. . . 79
4.13 Illustration of the cascade of vanilla U-Net and shape regular-
ization networks. Image taken from [2]. . . . . . . . . . . . . . 79
4.14 Illustration of implemented modified U-Net architecture. . . . . 80
4.15 Illustration of the SegNet architecture. Image taken from [3]. . 80
4.16 Residual Unit. Image taken from [4]. . . . . . . . . . . . . . . . 81
4.17 Illustration of the FractalNet architecture. Image taken from [5]. 82
5.1 SINC “Bilirubin Tool” interface. . . . . . . . . . . . . . . . . . 88
5.2 SINC “Bilirubin Tool” interface - Risk Factors. . . . . . . . . . 89
5.3 Screenshot of interface developed with the Qt Framework while
it is running on Cubieboard2. . . . . . . . . . . . . . . . . . . . 94
5.4 Example of respiration signal measured from RGB-D camera
(blu line) and of the filtered signal (red line) on a time window
of 10s. . . . . . . . . . . . . . . . . . . . . . . . . . . . . . . . . 95
5.5 Scatter plot and regression line of RR mean values. . . . . . . . 95
5.6 “Movement Tool” graphic interface. . . . . . . . . . . . . . . . 97
5.7 “Colour-map” of the movements extracted from the software. . 97
5.8 “Movement Tool” graphic interface with velocity information. . 98
5.9 “Movement Tool” interface screenshots that represent a sequence
of fast movement 5.9a, slow movement 5.9b and the absence of
movement 5.9c during a real-time acquisition. . . . . . . . . . . 99
5.10 “Movement Tool” graphic interface with extremities tracking. . 100
5.11 States activation sequence during time. . . . . . . . . . . . . . . 101
5.12 Transition matrix P of infant’s movements. . . . . . . . . . . . 104
5.13 Temporal evolution of P (i|i) probabilities related to each state. 104
5.14 Transition matrix P of infant’s movements during different pe-
riods of the day. . . . . . . . . . . . . . . . . . . . . . . . . . . 106
5.15 Example of a PIDS Dataset positive instance. It consists of 16
bit original depth image (5.15a), 8 bit scaled depth image (5.15b)
and the corresponding ground truth (5.15c). . . . . . . . . . . . 110
5.16 Example of a PIDS Dataset negative instance. It consists of 3
images where the infant is not present in the frame: a 16 bit
original depth image (5.16a), a 8 bit scaled depth image (5.16b)
and the corresponding ground truth (5.16c), a completely black
mask. . . . . . . . . . . . . . . . . . . . . . . . . . . . . . . . . 110
xx

List of Figures
5.17 Example of a PIDS Dataset partial instance. It consists of 3
images where the infant is partially visible in the frame: a 16 bit
original depth image (5.17a), a 8 bit scaled depth image (5.17b)
and the corresponding ground truth (5.17c). Figure 5.17d is
the corresponding RGB image used to facilitate ground truth
annotation. . . . . . . . . . . . . . . . . . . . . . . . . . . . . . 110
5.18 Example of a PIDS Dataset decentralised infant’s instance. . . 111
5.19 Example of a PIDS Dataset vertically positioned infant’s instance.111
5.20 Example of a PIDS Dataset instance acquired when lights are
very low. . . . . . . . . . . . . . . . . . . . . . . . . . . . . . . . 112
5.21 Jaccard index trends over the 200 epochs for each CNN archi-
tecture. . . . . . . . . . . . . . . . . . . . . . . . . . . . . . . . 113
xxi


List of Tables
3.1 Bedside-to-VISA protocol technical specifications. . . . . . . . . 26
3.2 Bedside-to-VISA protocol string. . . . . . . . . . . . . . . . . . 26
3.3 Communication protocol of Ginevri One Beam. . . . . . . . . . 30
3.4 Communication string of Ginevri One Beam. . . . . . . . . . . 30
3.5 HL7 Protocol . . . . . . . . . . . . . . . . . . . . . . . . . . . . 34
4.1 Evidence hierarchy from the centre for evidence-based-medicine. 52
4.2 Infants’ characteristics (Gestational Age and Weight). . . . . . 64
5.1 Database Traffic. . . . . . . . . . . . . . . . . . . . . . . . . . . 85
5.2 Database Connections. . . . . . . . . . . . . . . . . . . . . . . . 85
5.3 Query Statistics. . . . . . . . . . . . . . . . . . . . . . . . . . . 85
5.4 Mean RR values measured by RGB-D camera and patient monitor. 95
5.5 Data results and KPIs. . . . . . . . . . . . . . . . . . . . . . . . 103
5.6 PIDS Dataset infants characteristics (Gestational Age andWeight).109
5.7 PIDS Dataset acquisition sessions and relative instances. . . . . 112
5.8 Jaccard and Dice indices of different CNN architectures. . . . . 113
5.9 Semantic segmentation results of different ConvNet architectures.114
5.10 Jaccard Index results. . . . . . . . . . . . . . . . . . . . . . . . 117
5.11 Qualitative result of prediction. . . . . . . . . . . . . . . . . . . 118
1 U-Net Indexes results. . . . . . . . . . . . . . . . . . . . . . . . 128
2 U-Net2 Indexes results. . . . . . . . . . . . . . . . . . . . . . . 129
3 U-Net3 Indexes results. . . . . . . . . . . . . . . . . . . . . . . 130
4 ResNet Indexes results. . . . . . . . . . . . . . . . . . . . . . . 131
5 SegNet Indexes results. . . . . . . . . . . . . . . . . . . . . . . . 132
6 FractalNet Indexes results. . . . . . . . . . . . . . . . . . . . . . 133
xxiii


Chapter 1
Introduction
1.1 Context
Technologic advances in neonatal intensive care and their impact on short term
and long-term outcomes have been the major focus of neonatal clinical research.
Neonatal mortality reached an unsurpassable minimum by the late 1990s. How-
ever, this has been associated with high rates of neonatal morbidity and neu-
rodevelopmental impairment.
Preterm birth is defined as all births before 37 completed weeks of gestation
or fewer than 259 days since the first day of a woman’s last menstrual period
[6]. Preterm births can be further sub-divided based on gestational age (GA):
extremely preterm (<28 weeks), very preterm (28 - <32 weeks) and moderate
preterm (32 - <37 completed weeks of gestation). Moderate preterm births may
be further split to focus on late preterm birth (34 - <37 completed weeks).
Every year there are more than 15 million worldwide preterm births, that is
more than 1 in 10 babies, and the number of cases continues to rise.
Prematurity is the leading cause of newborn deaths (babies in the first 4
weeks of life) and now the second leading cause of death after pneumonia in
children under five years of age. It was responsible for nearly 1 million deaths in
2015. Three-quarters of them could be saved with current, cost-effective inter-
ventions. Many of the surviving infants face a lifetime of significant disability,
including learning and motor disabilities.
Preterm birth affects the anatomical and functional development of all or-
gans, inversely with GA, as well as the acquisition of skills for survival in an
extra-uterine environment.
In the case of preterm infants and low weight infants, the risk of mortality
and morbidity increases; typical complications linked to prematurity occur in
infants of very low GA (between 23 and 28 weeks) and weighting less than 1
kg.
Across 184 countries, the rate of preterm birth ranges from 5% to 18% of
babies born; 7-9% of pregnancies do not reach the normal 40-week gestation
period; 1% of newborn babies come to light before the 32nd week of gestation
1

Chapter 1 Introduction
and 0.5% even before the 28th week.
In Italy, preterm births represent the 6.9% of the total birth rate; among the
40000 premature births born every year, 5600 have a body weight less than
1500 g. The care of these young patients, who would not be able to survive
independently, require highly specialized staff and cutting-edge technologies.
In the last five years, the development of biomedical technologies for intensive
neonatal care has allowed the survival of patients born before the 23rd week
of gestation and of a weight at birth less than 400 g. To date, the survival of
preterm infants has even reached more than 90%.
The sooner babies are born, the less prepared their bodies are for the outside
world. They need special care to overcome the following challenges:
- breathing: many preterm babies start breathing on their own when they
are born, but others need to be resuscitated. If the lungs are not fully
developed and lack surfactant (a substance that helps keep the lungs
expanded), preterm babies may have difficulty breathing. Sometimes,
premature babies that start off breathing are not strong enough to con-
tinue on their own. They exhaust themselves and may stop breathing
(apnoea).
- brain: Preterm babies are at risk of bleeding in the brain, during birth
and in the first few days after birth; about 1 in 5 babies weighting less
than 2kg have this problem. Preterm babies can also have brain injuries
from a lack of oxygen. Bleeding or lack of oxygen to the brain can result
in cerebral palsy, developmental delays, motor impairments and learning
difficulties.
- neonatal jaundice: it is caused by an accumulation of bilirubin (redish-yel-
low pigment present in the bile and produced by haemoglobin catabolism)
in the subcutaneous tissue and in the sclere; when bilirubin exceeds the
limit values, the newborn is placed under a UV light lamp that promotes
the elimination of bilirubin from the blood to the intestine.
- cardiovascular difficulty: there is often a delayed adaptation of the circu-
latory system to post-natal life.
- feeding: Preterm babies can have trouble feeding because the coordi-
nated suck and swallow reflex is not yet fully developed. They may need
additional support for feeding. They often experience gastrointestinal
difficulties and reduced food tolerances, so that additional support for
feeding is needed: total parenteral nutrition (i.e., venous feeding) or gav-
age feeding (milk administration by means of an orogastric tube, which
goes directly from the mouth to the stomach) is often used.
- infections: Severe infections are more common among preterm babies.
Their immune systems are not yet fully developed, and they have a higher
risk of dying if they get an infection.
2

1.1 Context
- staying warm: Preterm babies lose body heat more easily, putting them
at risk of life-threatening hypothermia. They need extra energy and care
to stay warm and grow.
- eyes: Preterm babies’ eyes are not ready for the outside world. They
can be damaged by abnormal growth of blood vessels in the retina. The
condition is usually more severe in very premature babies and if they are
given a too-high level of oxygen. This can result in visual impairment or
blindness.
As said, preterm babies are at risk of developing disabilities that will affect
them for their entire lives, strongly depending on how early they were born,
the quality of care they received during and around birth and the days and
weeks that follow.
Hospitals with neonatal intensive care units can provide specialized care for
preterm infants with serious health problems. They have special equipment
and specially trained doctors and nurses who provide around-the-clock care for
preterm babies who need extra support to keep warm, to breathe and to be
fed, or who are very sick.
Preterm infants are housed in incubators or heated cribs, which provide
temperature control and recreate the maternal uterine environment. Sometimes
a “nest” with sheets is made inside the incubator to increase the sense of
containment enjoyed by the baby in his mother’s womb.
Continuous monitoring of the vital functions of the small patient is required,
which will then be connected to multiple probes and devices that generate
alarms whenever the limit levels set by the staff of the neonatal intensive care
ward are exceeded.
The hospital ward taken into consideration in this thesis is the Neonatal
Intensive Care Unit (NICU) of the Women’s and Children’s Hospital “G.Salesi”
in Ancona.
Here, infants’ cribs are surrounded by many devices for the monitoring, di-
agnosis and treatment of the above described diseases and all these devices
provide a huge amount of data that was only displayed on monitors. A mem-
ber of the medical staff, usually the nurse on duty, periodically transcribed
these data in a paper medical record. Then the manual notes were regularly,
but not immediately, transcribed by nurses in an electronic sheet on the PC of
the neonatal unit with the risk of errors and forgetfulnesses.
In this context, physicians have expressed the need to automatically gather
data from all these devices in order to ensure that no important details for
patient care were overlooked, as they are aware that the automation of this
process can facilitate and improve the implementation of the procedures of
their daily clinical practice. In this sense they have also contributed to the
development of innovative systems, methods and algorithms for the study of
3

Chapter 1 Introduction
some important healthcare problems related to preterm infants.
1.2 Objectives and main contributions
In the light of the above, the first objective of this thesis was to allow the inter-
facing and integration of biomedical instrumentation in the neonatal intensive
care ward into a single cloud infrastructure that allowed the digital storage of
all data from the various instruments.
In order to carry out optimal care processes, in fact, a maximum correlation
and integration between all the physiological data collected by the instrumen-
tation connected to the infant was required. Often the critical clinical situation
is caused by a combination of pathologies, therefore the interactions between
several physiological parameters must be studied.
In particular, the developed architecture was tested with the integration of
three different type of instruments located in the NICU of the “Women’s and
Children’s Hospital G.Salesi”:
- Patient monitor;
- Bilirubinometer;
- Transcutaneous bilirubinometer.
Medical communication protocols are used to enable the communication and
data transfer between the above mentioned infant’s monitoring devices and the
unique database of the platform. For this purpose, Python drivers for input
devices are being developed in order to communicate with the devices and
acquire data.
Then, a process of data collection from different instrumentation was carried
out by standardising the data and by forwarding them to the cloud, through
import Web Services. A system built with these characteristics guarantees the
interoperability property of the collected data allowing on-line sharing of the
data.
At this point, another objective achieved by this thesis was to provide the
medical staff with a valid tool to visualize this enormous amount of data. Data
visualization plays a fundamental role in the interpretation of data. The visu-
alization does not simply have an aesthetic purpose of presenting the results,
but gives access to information and interpretations that otherwise would re-
main latent. For this reason, a web interface has been designed and developed
based on specifications given by healthcare personnel and medical guidelines.
It acts like a web-portal and works as an application on Mobile Devices and
Desktop Workstations, where medical staff members can access all available
information.
Moreover, it is equipped with the main characteristics of the patient clinical
record, but it exceeds the functionalities of a simple Electronic Medical Record
4

1.2 Objectives and main contributions
(EMR), thanks to the development of innovative clinical tools, which contain
functionalities, data analysis techniques and decision-making algorithms, useful
to speed up and facilitate the work of doctors. These tools allow them to
follow guidelines of daily clinical practice more closely, by automating steps
and medical procedures, with the aim of improving patient care.
The processing of the data displayed on these clinical tools is, in fact, the
result of decision-making systems, whose development and implementation is
a further objective of this thesis in order to support the early diagnosis of
diseases.
In particular, an algorithm has been developed to support the diagnosis of
neonatal jaundice and the management of therapies to teat the disease. It
consists in an evidence-based automated decision support system (DSS) for
guideline based care to facilitate the implementation of clinical practice guide-
lines for neonatal jaundice.
Another proposed algorithm supports the physician in fluid administration
within nutrition task, another allows the automation of a clinical test used in
follow-ups to assess the development of preterm infants.
Worthy of note is the implementation of an algorithm deployed to analyse
preterm infants’ respiratory rate, which is able to activate an alarm signal when
respiratory rate values go out of the physiological range, and of a method that,
through computer vision techniques and machine learning algorithms, is able to
detect infant’s movements in real-time from depth stream and to extract from
the sequence of depth images, collected by an RGB-D sensor, some important
features and indicators that can be used by clinicians to objectively study
infants’ movements during their development.
The validation of these algorithms was made possible only thanks to the
creation of a new device, another objective achieved in this work. It is a novel
non-contact and non-invasive RGB-D system that consists in an RGB-D camera
and in an embedded board, where the algorithms used to extract and analyse
data from the depth images acquired by the camera are run in real-time.
All the above described solutions and algorithms have been validated through
a series of experiments, conducted in the NICU of “G.Salesi” Hospital under
the careful supervision of the Head Physician, Prof. V. P. Carnielli, which have
also led to the creation of two datasets.
The work of this thesis is culminated in the funding of a regional project,
named SINC, made in collaboration with the “Women’s and Children’s Hos-
pital G. Salesi” of Ancona, as the coordinator of all the regional Neonatal
Intensive Care Units, and where the Head Physician, Prof. V. P. Carnielli, a
neonatologist of international fame, is the scientific director and validator of
technological solutions, the Departments of Information Engineering and of In-
dustrial Engineering and Mathematical Sciences of the Polytechnic University
5

Chapter 1 Introduction
of Marche and four local companies. SINC “System Improvement for Neonatal
Care” project started in January 2017 and will last three years.
The objective of the SINC project is to develop an innovative integrated
system that allows an enrichment of the instrumentation available for neona-
tology and that will be able to automatically communicate the data to a cloud
in order to guarantee the distribution of information and protocols of care on
the territory, creating a new regional organizational model, on the basis of that
developed in this thesis for the NICU of “G. Salesi” Hospital.
One of the project’s objectives is to manage a cloud infrastructure that makes
services and utilities available throughout the region and that is able to inte-
grate monitoring data collected by medical devices to facilitate patient diag-
nosis and treatment. The aim is to create and experiment a new hospital and
territorial model for the integrated management of neonatal care and thera-
pies between the various levels of hospital specialization in the Marche Region,
which will be supported by distributed data management systems.
1.3 Structure of the thesis
The thesis is organized in six Chapters, which describe the design and devel-
opment of a healthcare infrastructure that has allowed the interconnection of
several biomedical devices in a NICU and the communication of data coming
from these instruments to a single DB, which is exploited in order to permit the
automatization of the process of device data collection, transmission, storage,
processing and availability for medical staff.
Chapter 2 reviews the state-of-the-art about the main topics addressed. It
discusses the results achieved in the creation of distributed healthcare infras-
tructures for the integration of medical devices in hospital wards and the prob-
lems still outstanding in this regard, and then goes into more detail on the
current situation regarding the development and use of Electronic Medical and
Health Records, Evidence-Based Medicine and Decision Support Systems in
general and particularly in Italy and in the Marche region.
Chapter 3 describes the proposed cloud-based infrastructure, that allows the
communication between the three different type of medical devices of the NICU
of the “Women’s and Children’s Hospital G.Salesi” through communication
protocols that are thoroughly described, and the developed web-based platform,
where data coming from these instruments can be displayed and analysed.
The functionalities of the implemented tools of the platform are briefly de-
scribed in this Chapter, while in Chapter 4 the attention is focused on three
of these tools, which have seen the application of decision-making algorithms
and computer vision techniques applied with the aim of support physicians in
everyday clinical practice.
6

1.3 Structure of the thesis
Chapter 5, then, discusses the results related to the analysis of the data
collected by the various instruments and stored in the various platform tools,
which are processed using the algorithms described in the previous chapter
through a series of experiments conducted within the NICU.
Finally, conclusions are reported in Chapter 6, as well as some future research
directions.
7


Chapter 2
State of the art
Medical devices generally are monolithic units so that a typical hospital room
in an intensive care ward hosts a number of stand-alone devices, each one
with its own user interface, its own proprietary software, its own display and
often its own built-in computer. Graphical user interfaces are all different and
non-uniform and this can create confusion and misunderstandings among the
healthcare personnel who has to use all the devices simultaneously.
Moreover, the devices are physically separated blocks and they can also be
located on different bed sides so that the medical staff has to go from one device
to another to use it, e.g., to see data on device display, to change device settings
and to set up new vital parameters or new alarm values. In this way, the staff
has to deal with different interfaces implemented on devices located in different
places, which contributes to create mental confusion and poor organization and
makes it more difficult for the physicians to rapidly take stock of the situation
on the patient’s state of health. Furthermore, in a hospital ward there are
many figures with different roles, e.g., the head physician, specialists in various
fields and nurses, and each of them needs a tailored user interface suited to
his own expertise and that shows him device data and information in the most
suitable way to make him perform his job well and quickly.
Finally, around patient’s bed there are devices for the monitoring, the di-
agnosis and the treatment of different diseases and it would be appropriate to
bring together data coming from all these devices to ensure that the physician
could have a general idea about the patient’s health conditions in order to not
neglect any important detail for the patient’s care. On the contrary, data are
usually saved separately for each device and they are not always sent to the pa-
tient Electronic Medical Record (EMR), if it exists, so that it becomes difficult
to search and find them, to create correlations between them and to make them
available in real time to the clinician when he is visiting the patient, whereas
this would bring great benefits to medical research [7].
Nowadays many devices already have some connection mechanisms that use
serial ports, Ethernet, IEEE 802.11 or Bluetooth wireless, but they are typi-
cally used to unidirectionally log data and events from these devices towards
9

Chapter 2 State of the art
the computer, permitting the reading of the measured value on a PC display.
However, this is no longer sufficient: as demand increases for better health-
care paradigms, it is evident that there is the need of having integrated and
cooperating (interoperable) medical devices. Thus, the goal is to go beyond
the simple connectivity to move towards a more complex device integration
that offers the possibility to stream device data directly into electronic med-
ical records (EMRs), to create a database for further statistic investigations
of data so collected and to integrate the information derived from multiple
medical devices into a single customised display.
In this thesis, a cloud computing solution is proposed for the creation of
a cloud infrastructure that exceeds the simple EMR. A cloud-based DBaaS
(Database-as-a-Service) is created with the abilities of storing and coopera-
tively sharing medical data based on the HL7 message required for interoper-
ability of medical information of different types. A database is created serving
as a data consumer which allows the integration between device data, EMR
data, personal patient’s data, patient’s medical history and so on. This per-
mits to aggregate device data in one place, making easier the recorded data
maintaining. This facilitates data searching in order to allow the doctor to
make faster diagnosis, by having all relevant information available. Moreover,
the identification of statistical trends and patterns is simplified by using data
mining and machine learning techniques that can lead to the discovery of cor-
relations between collected data and illnesses, which otherwise would not have
been possible to observe by clinicians [8] and that could be an useful tool to
support a long-period management of a university hospital [9].
2.1 Health Information System Infrastructures
Health Information Systems (HISs) can be described as the interaction be-
tween individuals, processes and technologies used to support fundamental in-
formation operations, management and availability, with the aim to improve
healthcare services [10].
They provide information and enhance the knowledge creation in health care
environments through data processing [11]. In particular, they are considered
mechanisms for storing, processing, analysing and transmitting information
required for planning, organization, execution and evaluation of health services.
The above depicted scenario presents the opportunity to create an integrated
cloud-based network that automates the process that begins with data collec-
tion from multiple devices and ends with information accessibility from medical
staff. To achieve this goal diverse cut-edge technologies were studied.
In the past, the healthcare information systems have been extensively im-
plemented with traditional Management Information System (MIS) mode, but
10

2.1 Health Information System Infrastructures
this does not comply with the current requirements of healthcare system. Lee
et al. in [12] propose a service-oriented architecture (SOA)-based system that
permits the integration of data from personal health devices and the creation
of tailored users interfaces, but this work does not provide concurrency or con-
stant and reliable service capabilities. Kulkarni and Ozturk in [13] implement
a system called mPHASiS that leads to an end-to-end solution. Nonetheless, it
is based on the Java programming language that makes the system less efficient
for reasons of performance of Java Virtual Machine (JVM).
The proposed solution is based on the idea of cloud computing with which
it is possible to provide customers with pervasive, affordable and on-demand
services. Cloud computing owns the characteristics of parallel computing, dis-
tributed computing, and grid computing, but it improves the user experiences
over the Internet compared to these. Lots of applications are moved towards
a cloud platform because it is able to supply services for diverse application
scenarios [14, 15]. Nowadays, also lots of works on medical information systems
are based on cloud services [16, 17]. Cloud infrastructure can provide the flexi-
bility and scalability of service-oriented systems unlike the transaction-oriented
MIS mode.
The proposed model provides support to ad hoc integration of diverse med-
ical devices, distributed processing, and open accessibility. A cloud-based in-
frastructure is presented where medical devices are plugged in and begin to
cooperate, i.e. to collect and transmit data. The computer resources achiev-
able with this environment are set up to receive, store, process, and distribute
the information. The method described in this thesis permits the creation of
an ad hoc integration network of different medical devices and of a distributed
data processing.
The main requirement of the optimal solution is that it has to quickly imple-
ment the methods to collect process and distribute infant’s vital data, from the
crib to remote accessibility, by integrating all different medical devices [18, 19].
Moreover, it has to be flexible and extensible, i.e., it has to hold up diverse
medical devices in different numbers that can be added to the system in different
times [20]. Then, the proposed system has to guarantee the security and the
safety of shared data, by ensuring strong access control and data encryption [21,
22].
To ensure data interoperability [23] it is necessary to realise data extrac-
tion process from various instruments, normalising the database according to
a record format defined in the XML language and specifically to the logic re-
lated to language HL7 [24]. A database made with these characteristics enables
online sharing of encrypted healthcare data, reported in a standard language,
allowing a complete interoperability of shared data.
The architecture has to guarantee also the system availability in any possible
11
Chapter 2 State of the art
operational conditions, by ensuring its reliability [25] and it has to be scalable
and compatible with the use in large healthcare environments and with the
aggregation of different institutions [26].
In King et al. [27] they discuss about all these main problems and about
their possible solutions with respect to the creation of a distributed architec-
ture for the integration of medical devices in a hospital ward. They discuss
about interoperability of data collected from devices, displays and databases of
different vendors and about standardisation of device data streams and their
reliability, security and safety, also in terms of privacy. However, the work is
not concentrated on concrete solutions, leaving room to other works for putting
into practise the proposed ideas.
2.2 Electronic Medical Records and Electronic
Health Records
All health information systems, as well as many other technologies, can be
interfaced with a systematic collection of information: the electronic medical
record (EMR).
The medical record is the tool used to manage patient’s clinical data, which
are collected during meetings with healthcare professionals for prevention pur-
poses, or when episodes of disease occur.
EMR is therefore the electronic evolution of the classic paper-based medical
record, which has lost its effectiveness because the continuous improvement of
the treatment process has led the paper version to become increasingly volumi-
nous and easily damageable, with a wide variety of sources from which to obtain
documents and information, and has made it more difficult to consult and find
the necessary information for healthcare professionals in a timely manner [28].
Moreover, handwritten medical records may be lowly legible, and this can
contribute to medical errors. Some pre-printed forms and the standardization
of abbreviations were stimulated to improve reliability of paper-based medical
records, but without remarkable results.
Thus, EMR may help with the standardization of digitized forms, terminol-
ogy and data input in order to facilitate the collection of data for epidemiology
and clinical studies [29].
The EMR can enable information to be used and shared over secure net-
works through digital formatting; track care (e.g. prescriptions) and outcomes
(e.g. blood pressure); trigger warnings and reminders, send and receive orders,
reports, and results; decrease billing processing time and create more accurate
billing system; enable information to move electronically between organiza-
tions [30].
12

2.2 Electronic Medical Records and Electronic Health Records
As regards interoperability, EMRs would facilitate the coordination of health-
care transfer in non-affiliated healthcare structures [31]. A lot of information is
conveyed in the EMR which can include laboratory results, radiology results,
pharmacy orders, medical prescription, discharge/transfer orders and any other
data from auxiliary services. In this way, some EMR-based systems are capable
of automatically monitoring clinical events, by analysing patient data to pre-
dict, detect and potentially prevent adverse events. Furthermore, data from an
EMR can be used for statistics on issues such as quality improvement, physi-
cians’ self-audit and resource management.
The EMR, actually, is the patient record created by providers for specific
encounters in hospitals and ambulatory environments and it is limited to a
single healthcare structure. It can serve as a data source for the electronic
health record (EHR). The terms EHR and EMR, in fact, have often been
used interchangeably, although differences between the models are now being
defined [32, 33].
The EHR is a more comprehensive collection of the electronic health in-
formation of individual patients or populations. It is a more comprehensive
form involving integration and network access of data from different clinical
applications and heterogeneous systems.
According to the definition of the International Organization for Standard-
ization (ISO) the EHR is a repository of patient data in digital form, stored and
exchanged securely, and accessible by multiple authorized users [34]. It con-
tains retrospective, concurrent, and prospective information and its primary
purpose is to support continuing, efficient and quality integrated health care.
EHR should contain, for each patient, all information resulting from their in-
teraction with different healthcare professionals, hospital wards and structures
in order to facilitate an integrated vision of patient data [35]. It grows over
time: it self-feeds, preserves and organises the complete collection of personal
health history.
Main requirements of an EHR include the definition of a flexible data struc-
ture to allocate information in each patient’s profile, of a clinical information
registry concerning subsequent consultations and prescriptions, and of a repos-
itory of all medical and clinical history individualized and complete [36].
A system that manages the EHR must be able to meet three main demands:
- the integration of data from different sources (e.g. hospitals, private
clinics, health care professionals);
- the correct acquisition of data;
- support for clinical decisions.
These interlinked characteristics within the EHR permit to achieve the goal
pursued by the system: patient care. In order to achieve this goal, however, the
EHR must also have interoperability characteristics, since processed data come
13

Chapter 2 State of the art
from different sources and are produced autonomously [37]. It must ensure
the integration between different types of information (e.g. clinical, financial,
administrative data) and not be limited in geographical terms, because it must
link the various access points of users (general practitioner, physicians, health-
care professionals, and patients) and the different healthcare structures [38].
It should also ensure the integration of data provided by the various EMRs to
obtain what IHE (Integrating the Healthcare Enterprise) calls a “longitudinal”
view of the health status of individual patients.
In Italy, EMRs are quite widespread, but only within individual hospital
wards and they are used more administratively than clinically.
According to a survey [39, 40] conducted in 2016 by the Healthcare Infor-
mation and Management Systems Society (HIMSS), that has created the EMR
Adoption Model (EMRAM), an eight-stage model that permits to assess the
quality of the adopted EMRs on a scale from 0 to 7, in Italy the 6th level EMR
covers only the 2,2% out of a total of 135 EMRs evaluated by HIMMS, while
there are not 7th level EMR, compared to the 8,6% and 2,9%, respectively, in
the Netherlands (total = 35) and the 32,7% and 6,1% in the USA (total =
5478). The majority of the italian healthcare structures are placed on stage 5
(34,8%) and 2 (34,1%) and the 6,7% still occupy stage 0 compared to 0% in
the Netherlands and to 1,6% in USA.
There are many reasons for this situation. In fact, even if the EMR spread
requires infrastructure investments, which are still lacking, the painful point
is the lack of confidence, if not resistance, that healthcare workers show to-
wards the EMR. On the one hand, a cultural and “self-protection” resistance
to the transparency of the data that the EMR sets in motion, and on the other
hand - even more significant - a technological approach that does not make
the EMR confidant with the doctor, especially if it is in situations of urgency
and speed. Doctors often denounce the adoption of complicated and redun-
dant technological procedures, heterogeneous levels of integration, overlapping
programs, excessive access and safety filters, which make “complex” the use of
the EMRs [41, 42, 43, 44].
In any case, even Italy is increasingly moving towards the digitalization of the
medical record, especially after the enactment of the Article 12 of Act 221/2012
that officially introduced the EHR, called “Fascicolo Sanitario Elettronico”,
defined as “the set of data and digital documents relating to health and socio-
medical information produced by current and past clinical events concerning the
patient” [45]. Under Article 12.2, the EHR can be used for a triple purpose:
a prevention, diagnosis, treatment and rehabilitation;
b study and scientific research in the medical context;
c health planning, verification of the quality of care and evaluation of
healthcare.
14

2.2 Electronic Medical Records and Electronic Health Records
Moreover, the n. 237 of October 2017 of the Official Gazette contains
the publication of Circular n. 4, “Documento di progetto dell’Infrastruttura
Nazionale per l’Interoperabilita dei Fascicoli Sanitari Elettronici (art.12 - comma
15-ter – D.L. 179/2012))”, available in the transparency section of the website
of the Italian Agency for the Digital Agenda (AgID) [46], where EHR charac-
teristics, its objectives and structure are illustrated in the light of the latest
legislative changes affecting it.
The results of Government and regions efforts to promote the EHR can be
seen in the following percentages: in 2015, the 40% of reports and the 9% of
medical records were dematerialised; according to Federfarma, the 72% of med-
ical prescriptions were dematerialized, up sharply from 26% in December 2014;
the 16% of the reports were delivered online to the citizen, while bookings and
payments made via the web were 12% and 8% respectively. The share of those
who have heard about EHR (32%) doubled compared with the previous year,
even if only 5% have actually used it, considering that at the moment, accord-
ing to AgID data of April 2016, only six italian regions have an EHR already
active and operational (Emilia-Romagna, Lombardy, Tuscany, Sardinia, and
Valle d’Aosta), while in 11 others, including Marche Region, regional EHRs
are being implemented.
As mentioned above, the Marche Region is also making progress in dissemi-
nating the guidelines concerning the regional EHR infrastructure, with the aim
of illustrating all the integration services envisaged in this area, in order to
facilitate future suppliers of systems that will interact with the regional EHR
in the implementation of integration interfaces [47].
On the basis of this document and those mentioned above, a web-based
solution was therefore designed and developed, which allows the integration of
data from different devices with those from the medical record. This solution
was achieved by considering and preparing the communication with the regional
EHR.
The final and future objective is, in fact, to go towards the creation of a
network that includes all neonatologies of the Marche region, favouring the
sharing of health data and the coordination of their flows, in order to facili-
tate transfers between the different hospital structures, which may take place
after a first analysis of the patient’s vital signals has already been made by
the reception centre, and, vice versa, to allow the continuity of monitoring of
the newborn once from the central hospital (“G. Salesi”) is transferred to a
neonatology that is closer to his parents’ residence to ends there the last days
of hospitalization.
The database created is also available for a “transversal” interoperability
with all the colleagues who have need of continuity of care with respect to
the same patient, and “vertical” interoperability with other databases and Na-
15

Chapter 2 State of the art
tional Health Service (NHS) operators. All services are backed by a guarantee
for the highest security of data, encrypted both during transfer and storage,
and access, in compliance with current legislations in terms of security and pri-
vacy, is strictly permitted only to those who have the appropriate permissions.
Users can remotely access patient data, using both the PC and mobile devices
(smartphones and tablets).
2.3 Evidence-Based Medicine and Decision Support
Evidence-based medicine (EBM) aims to improve quality of care reducing the
wide healthcare practice variations, and the inefficiencies, dangers, and in-
equalities that have resulted from nonoptimal patient care as pointed out in
“Crossing the quality chasm” by the Institute of Medicine [48].
EBM originated in 1992, from a series of studies started more than 10 years
earlier at the Department of Clinical Epidemiology and Biostatistics of the
Canadian McMaster University for the best use of scientific literature for med-
ical updating.
From these roots, the EBM has developed the concept that “evidence” must
play a leading role in therapeutic decisions, meaning with the term “evidence”
up-to-date and methodologically valid information from medical literature.
Originally defined as “a new emerging paradigm for medical practice”, the EBM
received, four years later, a more cautious definition: EBM is “the conscien-
tious, judicious and explicit use of current best evidence in making decisions
about the care of individual patients”, then recognizing the need to integrate
“evidence” with individual clinical skills of the healthcare professional (“exper-
tise”) [49].
EBM has developed in two areas of application: public health macro-de-
cisions or related to homogeneous population groups and individual patient
medical practice.
EBM use has been approved by international healthcare organizations such
as the WHO and the Institute of Medicine. but it has resulted to be far from
easy to implement. About thirty years after its birth, it has so far found little
application, especially in Italian clinical information systems. While there are
several free or pay websites where clinical evidence and guidelines can be found
and used, there has been no software integration between these sources and
patient clinical data.
One of the tools used for the practice of EBM is Clinical Decision Sup-
port defined as “providing clinicians or patients with computer-generated clini-
cal knowledge and patient-related information, intelligently filtered or presented
at appropriate times, to enhance patient care” [50], where clinical knowledge
means, for example, the evidence contained in up-to-date guideline recommen-
16

2.3 Evidence-Based Medicine and Decision Support
dations.
Clinical Decision Support Systems (CDSSs) are interactive software, very
important within the medical industry, designed to assist doctors and other
healthcare professionals (e.g. nurses) in the formulation of diagnosis, treat-
ment decisions and management of therapies, through the collection and the
elaboration of information coming from several sources.
In fact, knowledge-based CDSSs apply rules to data to be analysed by models
or other methods via an inferential motor and provide results to the end user.
There are many different clinical applications in which CDSSs are used.
They can be used to warn changes in patients’ condition from patient monitor
data analysis [51], to help the evaluation of the clinical guidelines used to assist
physicians in finding alternative treatment and diagnosis [52], or to identify
similar factors between different cases that lead to complications [53].
A CDSS is used in a diabetic clinic to determine if a diabetics treatment
would be safe given patient history, laboratory test results and known allergies
and pathologies of a diabetic patient [54].
Generally, when a patient’s case is complex or the healthcare professional who
has to make the diagnosis is inexperienced, a CDSS can support to decide which
is the therapeutic treatment to be suggested based on up-to-date treatment
guidelines.
CDSSs are also used extensively in Neonatal Intensive Care Units (NICUs),
given the very critical conditions in which small patients live and the many
ethical problems associated with them.
In [55] a prototype of integrated eXtended Markup Language (XML)-based
CDSS is implemented in a NICU, with the aim to evaluate the effectiveness of
real-time decision support and of the longterm impacts on physician decision-
making. In [56] it is used to define, detect and generate clinical alerts from
collected medical device data.
In [57] a decision-making support system based on specific outcome informa-
tion for individual NICU patients is used to provide support for parents and
healthcare professionals in ethically determining and deciding which treatments
to perform.
In [58] a web services-based infrastructure to support CDSSs for processing
multi-domain medical data from obstetrics, perinatal and neonatal hospital
wards is proposed. It is used to reduce medical errors, to assist physicians in
decision-making process, to improve patient care also by the optimization of
alert detection systems.
In Italy, CDSSs are still not very widespread, while in the rest of Europe and
North America they represent a growing phenomenon.
The report “Clinical Decision Support Systems Market by Component (Ser-
vices, Software), Delivery Mode, Product Type (Integrated, Standalone), Model
17

Chapter 2 State of the art
(Knowledge-Based), Type (Therapeutic, Diagnostic), User Interactivity (Ac-
tive, Passive), Application - Forecasts to 2021”, made by MarketsandMar-
kets [59], studies the global clinical decision support systems market over the
forecast period of 2016 to 2021. This global market is expected to reach USD
1.519,2 Million by 2021 from USD 856,3 Million in 2016, at a CAGR of 12.2%.
The cause of this lack of diffusion in italian healthcare system is due to
physicians’ aversion and to a great distrust of technology and CDSSs use as
underlined in [60], but also to the lack of a passage in the current legislation
(which is instead foreseen in many European and extra-European health sys-
tems, starting from Belgium, the Netherlands and the United Kingdom) or
which “the practice of the health professional” is explicitly encouraged to use
a scientifically based CDSS (guidelines and good practices).
Despite this, having ascertained the excellent results deriving from the use of
CDSSs in clinical practice, they are beginning to spread also in Italy in various
fields of clinical application [61, 62, 63].
In fact, the results of the study conducted in [60] suggest that the CDSSs
adoption path is marked by a progressive evolution of clinicians’ perceptions
towards the system. A trend is emerged which moves from positions that are
adverse to the adoption of CDSSs - characterized by strong resistances and
a very little “perceived mastery” - to an hoped optimal situation, in which
CDSSs are seen as a working tool at the service of clinicians, integrable (and
not interchangeable) with their skills, adaptable to their needs and to the local
organizational specificities.
In this thesis, decision-making models and algorithms are applied in the
NICU environment to preterm infants’ data in order to generate alarms from
the analysis of medical devices data, to help physicians in the administration
of nutrients and in the diagnosis and treatment of neonatal jaundice, and to
support the prediction of neuromotor disabilities from depth images as shown
in next chapters.
18

Chapter 3
A new infrastructure for neonatal
care
measurement observationmanual
annotation
digital
transcriptionstorage
Figure 3.1: The current scenario.
The hospital ward that is taken into consideration for testing the new in-
frastructure is the Neonatal Intensive Care Unit (NICU) of the “Women’s and
Children’s Hospital G.Salesi” in Ancona, where preterm infants are taken into
care [64]. As said, preterm birth affects the anatomical and functional devel-
opment of all organs, inversely with GA. The degree of organs immaturity is
a critical aspect for these babies, which leads them to have many health prob-
lems. For this reason, the primary physiological functions of these babies have
to be continuously monitored and often infants have to undergo major treat-
ments and therapies. Hence, infants’ cribs are surrounded by lots of devices
for the monitoring, the diagnosis and the treatment of different diseases. It is
desirable that all these devices communicate between each other and with a
unique database in order to create an integrated device network.
Nowadays, on the contrary, the majority of these devices only provide the
ability to read data on their digital displays. Consequently, a member of the
medical staff, generally the nurse in charge, has to collect infant’s data at
bedside by writing them down to a paper medical chart on a regular basis.
Then manual notes are regularly, but not immediately, transcribed by nurses
in a PC of the Neonatal Unit. After that, data are transmitted to a local
server that stores and organizes them together with the patient data collected
in the EMR. Only at this moment, the medical staff can access data through an
interface application. Focusing on the problem of infants’ vital data collection,
19


3.1 SINC cloud-based healthcare architecture
face, and with software to collect, encode, encrypt and transmit data through
configurable communication channels to be stored, forming the local interface.
Data are picked up through applications of extraction, specifically concerted
for every different type of devices, which use medical communication protocols
or proprietary software to enable the direct data communication and transfer.
After extracting and standardising into XML, through Web Service of im-
portation, data are carried to the cloud database, where they are aggregated.
For security reasons, both during the import process and the storage phase
in the aggregate DB, data are encrypted and accessed, using “strong” creden-
tials as well as other medical authorities (or other health professions, as far
as relevant information about an individual is concerned) authorized by the
physician.
The intrinsic interoperability, obtained by using different device types and
vendors and language independent XML technologies and the widespread HTTP
as a transport, implies that devices can communicate each other and with the
EHR by using Web Services [65].
Web Services, in fact, are web application components that permit the in-
teroperability between different technologies that work in a same network.
These services hide their internal complexities such as data types and busi-
ness logic from their users, but expose their programming interfaces and their
locations using UDDI (Universal Description, Discovery, and Integration) pro-
tocols. They make available a software interface, described in a format which
can be automatically processed, which permits the interaction between other
systems and the Web Service itself by activating the functions available on
the interface (services or requests of remote procedures) through special ”mes-
sages” of request. Such request messages are included in an “envelope” that
is formatted according to the standard XML, encapsulated and transported
via Web protocol. In our case, the XML-based language for describing Web
services application software interface is Web Services Description Language
(WSDL), which is recommended by the World Wide Web Consortium (W3C).
These interfaces, publicly exposed, guarantee the procedures of import data
and access to the database by different authorized medical staff members for
respective allowed functions. The XML-based protocol for accessing Web Ser-
vices is Simple Object Access Protocol (SOAP), which is always recommended
by W3C and the Web protocol on which SOAP operates is HTTP, the most
commonly used and the only one that was standardised by the W3C.
Web services act like a broker between local medical devices and remote
services. They are able to capture collected data from devices and to send
them to suitable storage service hosted on cloud. They also allow the local
storage for pre-processing, e.g., they allow data to be aggregated or simply
analysed before the transfer to the main system.
21

Chapter 3 A new infrastructure for neonatal care
On the other hand, Web Services work as an access point. Users through a
web interface that acts like an application that works on Mobile Devices and
Desktop Workstations, with which the hospital ward is equipped, can interact
with data on the cloud database. Web Services receive requests from that
interface to recover data from the cloud database.
The function of the Utility Computing Provider is to provide logical and
physical infrastructure for data storage, processing and delivery services.
Its main components are the Platform front end interface, the Cloud Storage
and the DBaaS (Database-as-a-Service). The platform front end interface is
able to allow the management of the storage contents and to directly communi-
cate with users. The interface can be a web client or a standalone application.
The cloud storage is the model of data storage in which the digital data is stored
in logical pools and it is based on highly virtualized infrastructure. Database-
as-a-service [66] is one of cloud computing secondary service models and a key
component of XaaS. This may be considered a subspecialty of the bigger Soft-
ware-as-a-service model. In essence, DBaaS is a cloud database, which is a
database that typically runs on a cloud computing platform. It is a cloud com-
puting service model with which there is no need to physically launch a virtual
machine instance for the database so that in such a configuration, application
users do not have to install and maintain the database themselves. All of the
administrative tasks, installation and maintenance are taken care of by the
database service provider and application owners pay according to their usage.
3.1.1 Data Platform
The relational database for the storage and management of data is configured
according to a structure optimized in terms of performance and zero data re-
dundancy.
As DBaaS the Amazon Relational Database (Amazon RDS) for MySQL is
used, since it makes it easy to set up, operate, and scale MySQL deployments
in the cloud. The use of this DBaaS provides to the system all the features that
we have discussed in section 2.1, which are the main requirements to obtain an
efficient cloud-based healthcare infrastructure for medical device integration.
It makes it easy to go from project conception to deployment. It is possible
to access the capabilities of a production-ready relational database in minutes
and without the need for infrastructure provisioning, and for installing and
maintaining database software. It is possible to scale database compute and
storage resources often with no downtime: the engine will automatically grow
the size of database volume as database storage needs grow. It enhances relia-
bility for critical production databases, including automated backups, database
snapshots and automatic host replacement.
22
3.1 SINC cloud-based healthcare architecture
For security reasons, it allows data encryption both during the transit, with
the use of SSL, and during the cloud storage phase. Also backups, read replicas
and snapshots are encrypted. Moreover, data are accessible only by authorized
medical staff members by using strong authorization. There is also the possi-
bility to run database instances in a virtual private network.
3.1.2 Cyber Security
The legislation about the protection of personal data (Legislative Decree no.
30 June 2003 n. 196) provides (art. 31) a general safety requirement under
which the personal data object of treatment should be kept and controlled,
also in relation to acquired knowledge with the technical progress, the nature
of the data and the specific characteristics of the treatment, so as to minimize,
through the adoption of suitable and preventive security measures, the risk
of destruction or loss, even accidental, of the data, unauthorized access or
treatment not allowed or inconsistent with the purposes for collection.
The obligation to adopt the “minimum security measures” (arts. 33 et seq.)
is also provided. In particular, (pursuant to art. 34) the treatment of personal
data carried out with electronics instruments is allowed only if the following
measures are adopted:
- computer authentication;
- adoption of procedures for the management of authentication credentials;
- use of a system of authorization;
- periodic update of the identification of treatment allowed to individual
officers and employees for management or maintenance of electronic in-
struments;
- protection of electronic tools and data against illegal treatment of data,
unauthorized access and certain computer programs;
- adoption of procedures for storing backups, restoring access data and
systems;
- adoption of encryption techniques or identification codes for certain treat-
ments of data disclosing health status or sexual life performed by health
organizations.
Under these conditions, in Nu.Sa. data are subjected to protection with a
“strong” encryption system that guarantees high degree of security; the as-
sumption is that only the rightful owner - the licensed doctor - has access to
the data of his competence through an authentication system (SSO Single Sign
On) described below. The cryptography algorithm is held by a third party, the
Polytechnic University of Marche.
23

Chapter 3 A new infrastructure for neonatal care
3.2 Medical Device Network
In order to have continuous and multi-parametric monitoring of premature pa-
tients, a system has been developed based on the connection of several biomed-
ical devices to the platform described above. Thus, the architecture was tested
with the integration of three different type of instruments located in the NICU
of the “Women’s and Children’s Hospital G.Salesi”:
- Patient monitor;
- Bilirubinometer;
- Transcutaneous bilirubinometer.
In the following paragraphs there will be a brief description of each biomed-
ical apparatus listed above.
Furthermore, Python drivers for input devices are developed in order to com-
municate with the devices and acquire data. They work in a Linux environment,
but were tested also on Windows OS.
Communication protocols, that allow the correct flow of data between the
above mentioned infant’s monitoring devices and the platform, will be dis-
played.
3.2.1 Patient Monitor
Figure 3.3: The patient monitor: Datascope Passport 2.
Nowadays, patient monitors, commonly called cardiac monitors, are not lim-
ited to heart rate monitoring, but also control other important vital functions
such as breathing rate, partial oxygen and carbon dioxide pressures in the
bloodstream, temperature, pressure.
For this reason, it is preferable to call this instrument “monitor for the control
of physiological activities”, as they provide signals useful for monitoring, but
24

3.2 Medical Device Network
not sufficient for diagnostics. Each parameter is detected by the relative sensor
and processed through a set of special amplifiers and circuits; on the screen
the trends of the parameters of interest are shown, a widespread application in
intensive care units, including neonatal ones.
Associated with the derivation of the ECG (usually I or II) there is often an
acoustic signal, activated by a certain threshold for the QRS complex: every
time it is surpassed by this complex, there is a standardized beep, usually a
pure 800 Hz tone, which indicates the beat.
In addition, patient monitors are equipped with an alarm system, whose
thresholds for the various parameters monitored are set by medical personnel.
The patient monitor used in the NICU of “G.Salesi” hospital is the Datascope
Passport 2 [67] represented in figure 3.3.
It detects the following parameters:
- Oxygen saturation, SaO2 [%];
- Heart rate detected by the saturimeter [bpm];
- Heart rate detected by the ECG [bpm];
- Respiratory rate [apm];
- Systolic, diastolic and average pressures [mmHg];
- Esophageal temperature [◦C].
3.2.1.1 Communication Protocol
To communicate with the patient monitor Datascope Passport 2 the Datascope
Bedside-to-VISA for serial communication protocol is used.
The patient monitor transmits parameter data and waveform data in a packet
format with a synchronization word at the beginning of each packet. The
waveform data is in a binary format, the parameter data is in ASCII format.
The parameter data is interspersed in the waveform data.
The patient monitor continuously transmits data in the following sequence:
- Instrument Identification
- Patient Data
- Alarm Limits
- Patient Data
This protocol specifies communication in one direction only, transmit. No
data is received by the patient monitor.
Details of the RS232C interface are summarised in table 3.1.
The Bedside-to-VISA communication protocol consists of a 74 byte packet
transmitted every 80 milliseconds (table 3.2). Each packet consists of two
25

Chapter 3 A new infrastructure for neonatal care
Table 3.1: Bedside-to-VISA protocol technical specifications.
Item Value
Baud Rate 9600Parity none
Stop Bits 1Bits per character 8
Table 3.2: Bedside-to-VISA protocol string.
byte 1 byte 2 bytes 3 - 20 bytes 21 - 38 bytes 39 - 56 bytes 57 - 74
AA Hex 55 Hex Data + CRC Data + CRC Data + CRC Data + CRC
synchronization bytes, followed by four 18 byte packets. Each 18 byte packet is
17 bytes of data followed by 1 byte Cyclical Redundancy Check (CRC).
Each 74 byte packet contains the following information: 16 ECG samples
(200 Hz sample rate), 8 samples of each of the three other waveforms (100 Hz
sample rate), and sixteen characters from the parameter information described
later in this document (200 characters per second transfer rate). Each waveform
sample consists of 10 bits of data, each ECG sample also includes a pacer detect
flag. The 74 byte packet is split into four 18 byte packets. The four 18 byte
packets split the data up to provide 4 ECG samples, 2 samples of each of the
other three waveforms and four characters from the parameter information.
The contents of each byte are defined in the Service Manual Supplement.
To check the correct transmission of data, the Bedside-to-VISA communi-
cation protocol provides at the end of the sent data string the insertion of 4
redundant control characters, called Cyclic Redundancy Check (CRC).
It consists in adding to the end of the transmitted data sequence redundant
bits, so that the entire sequence constitutes a binary number that can be exactly
divided by another fixed binary number, which must be the same for sender
and receiver, in order to be able to check the integrity of the data by comparing
the calculated CRC with the received one.
The CRC code, expressed in hexadecimal, is obtained by cyclically scrolling
the input data in a logical network, taking into account not only the value of
the bits, but also their position.
An algorithm for calculating the CRC on the received data was then imple-
mented, so that it can be compared with the one sent by the patient monitor
and thus verify the correctness of the received string.
This algorithm has been written by adapting the one reported in the Bedside-
to-VISA communication protocol, i.e. the algorithm used by the monitor itself
to calculate the CRC transmitted at the end of each sent string.
26


Chapter 3 A new infrastructure for neonatal care
Figure 3.4 shows the time trend of some of the above listed parameters
extracted from the patient monitor.
3.2.2 Bilirubinometer
Figure 3.5: The bilirubinometer: Ginevri One Beam.
The bilirubinometer is a biomedical instrument designed to achieve accurate
total serum bilirubin concentration (TSB) measurements in newborns through
the analysis of micro-blood samples with a heel puncture. Knowledge of accu-
rate bilirubin levels is essential helping in the successful treatment of neona-
tal jaundice caused by bilirubin aggregation in various body tissues, skin in
particular (classic yellow skin colour observed in jaundice patients). Biliru-
bin aggregation could involve brain tissues causing irreversible patient damage
(kernicterus). Thus, newborns require constant monitoring of bilirubin levels.
Bilirubin concentrations are determined either by whole blood or serum anal-
ysis using spectrophotometric methods or by skin-reflectance measurements
(section 3.2.3).
The three methods of spectrophotometric analysis are the direct spectropho-
tometric method, the Malloy-Evelyn method, and the Jendrassik-Grof method.
Blood samples are required for spectrophotometric analysis. The analysis tech-
nique depends on both the type or types of bilirubin being measured and the
age of the patient (neonate versus child or adult). The reflected light is gener-
ally split into two beams by a dichroic mirror, and wavelengths of 455nm and
575nm are measured by optical detectors.
Transcutaneous bilirubinometers do not require a blood sample. A light-
emitting sensor is placed on the infant’s skin (optimally on the forehead or
28

3.2 Medical Device Network
sternum).
The bilirubinometer used in the NICU of “G.Salesi” hospital is the Ginevri
One Beam [68] represented in figure 3.5.
It allows for a prompt photometric analysis of bilirubin in the serum (conju-
gated and non-conjugated total) using a capillary tube as an optical cell. Biliru-
bin concentration is determined through a photometric measurement at 455nm
and 575nm wavelengths: the first wave length indicates bilirubin levels while
the second informs on any interfering agent presence, essentially haemoglobin.
A mathematical model accounts for haemoglobin interference resulting in an
accurate bilirubin result.
The HD OLED display indicates both bilirubin (mg/dl and µmol/l) and in-
terfering agent (g/dl) values. One Beam uses a single optical beam projected
onto a fixed point of the sample due to a particular automatic filtering system.
The system achieves a “clean” light beam free of any disturbing frequencies
reducing negative bilirubin photo-isomerization effects thus ensuring a stable
signal. An accurate signal is also achieved as an only one point on the capillary
tube is measured eliminating any errors observed in past generation devices
with two measure points. Lastly a stronger signal results due to the use of
a single rather than a split beam. A particular collimation and beam con-
centration system allows for reading results even with limited serum sample
quantities obtained after centrifugation, as in polycythemia cases (up to 80%
haematocritic levels) or partial capillary tube filling. Advanced microprocessor
controlled electronic technology enables better signal processing transformed
into the corresponding bilirubin level promptly indicated on the display. The
printer enables quick printing of any test results.
3.2.2.1 Communication Protocol
In this case, the communication protocol is much simpler than in the previous
case, since the bilirubinometer transmits only a parameter data in ASCII
format and not a waveform data.
An example of ASCII output is: “GINEVRI ONE BEAM 09/11/16 11:19
BILIRUB. 06.7mg/dl EMO. 0.28g/dl” and in HEX is: “47 49 4E 45 56 52 49
20 4F 4E 45 20 42 45 41 4D 20 30 39 2F 31 31 2F 31 36 20 31 31 3A 31 39 20
42 49 4C 49 52 55 42 2E 20 30 36 2E 37 6D 67 2F 64 6C 20 45 4D 4F 2E 20
30 2E 32 38 67 2F 64 6C 0D 0A”.
The contents of each character are defined in table 3.3.
For the bilirubinometer to verify data integrity, the transmission of the same
data unit is repeated 10 times.
In addition, the string is associated with the patient’s ID written on a barcode
held in the infant’s crib. In particular, an algorithm has been developed that
waits for the code to be read by a wireless barcode scanner and then for the
29

Chapter 3 A new infrastructure for neonatal care
Table 3.3: Communication protocol of Ginevri One Beam.
#Byte ASCII HEX #Byte ASCII HEX #Byte ASCII HEX
1 G 47 23 / 2F 45 7 372 I 49 24 1 31 46 m 6D3 N 4E 25 6 36 47 g 674 E 45 26 20 48 / 2F5 V 56 27 1 31 49 d 646 R 52 28 1 31 50 l 6C7 I 49 29 : 3A 51 208 20 30 1 31 52 E 459 O 4F 31 9 39 53 M 4D10 N 4E 32 20 54 O 4F11 E 45 33 B 42 55 . 2E12 20 34 I 49 56 2013 B 42 35 L 4C 57 0 3014 E 45 36 I 49 58 . 2E15 A 41 37 R 52 59 2 3216 M 4D 38 U 55 60 8 3817 20 39 B 42 61 g 6718 0 30 40 . 2E 62 / 2F19 9 39 41 20 63 d 6420 / 2F 42 0 30 64 l 6C21 1 31 43 6 36 65 0D22 1 31 44 . 2E 66 0A
string from the bilirubinometer. At the end, the string that arrives at DB
through REST API is visible in table 3.4.
Table 3.4: Communication string of Ginevri One Beam.
s : 4 : “data′′; s : 230 :“{“infantID′′ : 01315052601,“vendor′′ : “GINEV RI ′′,“instrument′′ : “ONEBEAM ′′,“datetime′′ : “6/06/1717 : 35′′,“timestamp′′ : “2017− 06− 1615 : 39 : 01.745882′′,“bilirubin′′ : 4.2,“bilirubinUnit′′ : “mg/dl′′,“hemoglobin′′ : 0.24,“hemoglobinUnit′′ : “g/dl′′
}′′;
The interface of Python driver is visible in figure 3.6.
30


Chapter 3 A new infrastructure for neonatal care
Transcutaneous bilirubinometry is based on optical spectroscopy, which re-
lates the amount of light absorption by bilirubin (i.e., the yellow color of the
skin) to the concentration of bilirubin in the skin. The first transcutaneous
bilirubinometer was introduced in 1980 [72]. Since then, several more devices
have been developed, and important adjustments, such as the correction for
the presence of other skin chromophores (i.e., melanin and hemoglobin), were
made to improve their accuracy [73, 74, 75, 76, 77]. These “second genera-
tion” bilirubinometers are suitable for screening of hyperbilirubinemia, leading
to a considerable decrease of the number of hospital readmissions [78] and a
decrease of the amount of required blood samples from patients [79]. Hence,
the use of transcutaneous bilirubinometers is recommended in clinical practice
guidelines on the management of hyperbilirubinemia [80], but only as a first
control measure for what concerns NICUs, as will be explained later in section
4.1.3.
The transcutaneous bilirubinometer used in the NICU of “G.Salesi” hospital
is the Drager JM-105 [81] represented in figure 3.7.
Drager JM-105 has to be placed on the infant’s forehead or sternum, it di-
rects white light into the skin and measures the intensity of the returning wave-
lengths. It analyses the spectrum of optical signal reflected from the neonate’s
subcutaneous tissues: it measures hemoglobin, dermal maturity, melanin, and
bilirubin, and then, by using known spectral characteristics of each of these
components, subtracts all but the bilirubin to arrive at a measurement.
It has an integrated barcode scanner that can automate data entry, storing
patient and nurse ID, medical record number, patient name, and date of birth.
Automated data entry permits to saves time and reduces the likelihood of
manual input errors. In the NICU of “G.Salesi” hospital the infant’s barcode
is read with the device incorporated scanner, while the rest of the data is
entered with the keypad.
3.2.3.1 Communication Protocol
The communication protocol used by the Drager JM-105 transcutaneous biliru-
binometer is HL7 Standard Protocol.
The HL7 Standard was created and is maintained by Health Level Seven, an
American National Standards Institute (ANSI) accredited Standards Develop-
ing Organization (SDO) that operates in the healthcare arena [82], consisting
of hospital, vendor and consultant volunteers.
Initial efforts began in March of 1987 and continue to date. Now, the HL7
Standard is broadly divided into two categories – Version 2 (V2) and Version
3 (V3). The majority of HL7 messaging employs messages that use the 2.3 or
2.3.1 versions of the standard. Newer versions of the standard, including V3,
represent only a small portion of real-world usage in interfacing.
32

3.2 Medical Device Network
HL7 design is based on a set of general goals. The first goal is to be supportive
rather than prescriptive. This is an important philosophy and is absolutely
necessary in the very heterogeneous health care computing environment. The
second goal is that it be practical, which to the developers of HL7 means that it
should function in a wide range of environments, from complex networks (e.g.
a full seven level ISO type network) to simple terminal/host environments (e.g.
RS232 connection). The third goal is that the standard should accommodate
site specific variations. This has been accomplished by allowing sites to create
their own message types and record definitions. The fourth and final goal is
to support evolutionary growth. This capability has been built in by requiring
that changes to the record definitions be made only by adding fields and never
by deleting.
The central paradigm of the protocol is the exchange of messages between
applications that want to communicate. HL7 messages transmit data between
disparate systems. An HL7 message consists of a group of segments in a defined
sequence, with these segments or groups of segments being optional, required,
and/or repeatable (referred to as HL7 cardinality). A segment is a logical
grouping of fields containing data. The HL7 message type defines the purpose
for the message being sent and is present in every HL7 message. Message types
are identified by a three-character code, and are used in conjunction with a
trigger event. An HL7 trigger event is a real-world event that initiates com-
munication and the sending of a message, and is shown as part of the message
type. Both the message type and trigger event are found in the MSH-9 field
of the message. MSH segment is the first mandatory segment that gives infor-
mation about the calling, receiving, triggering event, version of protocol used
and so on. Each segment starts with three characters that uniquely identify
the segment within the message.
Table 3.5 shows the message exchanged between the Drager JM-105 tran-
scutaneous bilirubinometer and SINC infrastructure.
It is an OUL∧R22 message type, that is an “Unsolicited Specimen Oriented
Observation Message”, of 2.5.1 HL7 version, as it is possible to see from the
MSH (Message Header segment).
The Patient Identification segment (PID) is used by all applications as the
primary means of communicating patient identification information. In biliru-
binometer message this segment contains the id code (01315052601), described
above, that is read by the barcode scanner incorporated in the device before
the measurement.
The Observation/Results segment (OBX) is used to transmit a single ob-
servation. Here, there are 3 OBX segments: the first is used to transmit the
value of the transcutaneous bilirubin measurement (5.5), the unit of measure-
ment (mg/dl), the measurement date and time (20160309132951), the nurse
33

Chapter 3 A new infrastructure for neonatal care
ID (Rossi) and the device ID (3501198); the second is used to return the result
of the comparison between the measurement value and the value considered
normal; the third is used to return the advice to carry out phototherapy.
The OBR segment generally transmits information about an exam, a diag-
nostic study/observation, or an assessment that is specific to a result. In this
case it gives information about the presence of neonatal jaundice.
The information contained in the last two OBX segments and in the OBR
segment are not actually used because NICU medical staff follows specific guide-
lines, which will be described below (section 4.1.3).
The Specimen Model (SPM) and the Common Order (ORC) segments give
other information about the measurement, as the message time.
Table 3.5: HL7 Protocol
MSH| ∧ &|JM − S1w|Nursery|LISSystem|Lab.|20160309134533||OUL ∧R22∧OULR22|20160309134533− 0017|P |2.5.1 ∧ US||||||ASCII
PID|||01315052601|| ∧ ∧ ∧ ∧ ∧ ∧LSPM |1|||FOREH|||||||||||||20160309132951OBX|1|SN |01 ∧ Jaundice ∧ 99OP1|1| ∧ 5.5|mg/dl|||||F |||20160309132951||
∧ ∧ ∧ ∧ ∧ ∧ ∧ ∧ ∧U ∧ ∧ ∧ ∧ ∧A||3501198OBX|2|CE|02 ∧ Priority ∧ 99OP1|1|01 ∧NORMAL ∧ 99OP2||||||FOBX|3|CE|03 ∧ Phototherapy ∧ 99OP1|1|00 ∧NO ∧ 99OP3||||||FOBR|1|||01 ∧ Jaundice ∧ 99OP1|||20160309132951|||||||||||||||20160309132951|||FORC|CN ||||CM ||||||||||||||||||||||||I
To verify data integrity the transmission of the same data unit is repeated
10 times.
3.3 The end-user web interface
The same logic which led to the SINC project, has allowed different providers
to make available to users, resources and tools able to functionally connect to
the database in the cloud. It is currently available on-line a web interface [83],
equipped with the main functions of the outpatient clinical record, which works
as an application on Mobile Devices and Desktop Workstations. This service
acts like a portal where medical staff members can access all available informa-
tion.
The user interface is built using the following architectures for different ap-
plication areas:
- PHP as the server side scripting language;
- JavaScript as the client side scripting language;
- for the developing of the client side Web application it is used AngularJS,
which is an infrastructure composed of a lot of functionalities.
34


3.3 The end-user web interface
There are also systems for access to self-audit, that have been articulated
into several functions, accompanied by benchmarking activities, to ensure ad
improve data collection quality.
Another important function is to allow an automatic data backup and dis-
aster recovery. These are two aspects very important for physicians, in fact for
disciplinary management and confidentiality of medical data, there are data
saving procedures with allocated frequencies to avoid the risk of loss of the
same data.
The electronic online platform automatically makes frequent backups, al-
lowing full restoration of the database in real time, decreasing risks and re-
sponsibilities for the physicians. In addition, for initiatives of tele-diagnosis,
tele-consultation, and tele-monitoring, the project offers the possibility to auto-
matically insert reports, data and consultancies (always through web services).
This occurs in well-defined locations of the patient record of the DB in the
cloud, thus completing a “transparent” mode for the activities of a physician
engaged in a professional service.
3.3.2.1 Clinical Tools
As said, SINC platform will consist of several tools, some of which are already
fully developed and functioning, others being developed such as those relating
to diseases and problems, diagnoses and therapies.
In this section the functionalities of the implemented tools of the platform,
accessible from the SINC portal, are briefly described.
In the next chapter the focus will be on three of these tools, which have
seen the application of decisional algorithms and computer vision techniques
applied with the aim of helping physicians in everyday clinical practice.
3.3.2.1.1 Anagraphic Tool
The “Anagraphic Tool” represents the storage in which the main patient in-
formation is summarized. It is structured on several fields, not all of which are
mandatory, in order to allow a mapping as precise as possible of the information
relevant for infants management.
An independent personal database has been created, with encrypted sensitive
data, which has been developed in a very simplified way. However, it will be
linked to the Public Health Corporation personal database.
In particular, it will be connected with the ARCA (“Anagrafe Centralizzata
Regionale Assistiti”), which is the set of personal data relating to all citizens
who use health services at ASUR (“Azienda Sanitaria Unica Regionale”), the
local health authority of Marche Region, and at Marche Region Hospital Cor-
porations and certified by the Ministry of Economy and Finance.
37

Chapter 3 A new infrastructure for neonatal care
In this way it will be possible to benefit from all the functionalities of the
ARCA, that performs the function of an Enterprise Master Patient Index
(EMPI). In fact, it solves the problem of unambiguous patient identification
and allows the patient’s clinical history to be linked to a known demographic
position. The ARCA-EMPI platform also acts as a centralized system for the
management of reference dictionaries for personal data (e.g. the coding of mu-
nicipalities, nationalities, local health authorities, regions and so on), and it
is responsible for obtaining from the appropriate sources a series of regional
catalogues and for making them accessible at a centralized level by means of
special services (e.g. health care services, drugs and medical devices, affiliated
doctors, healthcare facilities and so on).
The tool will also be linked to the medical record used in the Gynaecology
and Obstetrics clinic ward of “G. Salesi” hospital in order to create a transversal
link that allows information about the infant’s mother to be obtained quickly
and directly.
Immediately after birth, the newborn infant is registered on the platform. In
this way he is given a unique code which will be used throughout the hospital
stay. Afterwards the medical staff members can retrieve the page related to
the infant and fill in the missing data. The module, in fact, allows the his-
toricization of changes to the patient data in order to support the concept of
temporary patients recording.
The required information is distributed on different web pages. In particular,
there are a patient’s registry (figure 3.10), where, in addition to data relating
to the newborn, essential information on parents is requested, and a registry
totally dedicated to infant’s mother information. This is a very detailed part
where not only the personal data are recorded, but also a lot of information
related to pregnancy, delivery, possible complications of delivery, possible in-
fections contracted by the mother during pregnancy and the tests carried out.
It is possible to extract personal data from the SINC DBaaS for statistical and
directional processing.
3.3.2.1.2 Growth Tool
The “Growth Tool” permits to insert and archive data on the patient’s growth
during hospital staying (see figure 3.11). The data required are: weight, length,
and head circumference, with a frequency that depends on the parameter:
weight is measured once a day, while the other indicators are measured once a
week. On the basis of these frequencies, which can be modified if authorized,
a reminder is sent to the medical staff to remind them of the need to take the
measurement.
During the insertion phase of the measurements, algorithms have been de-
veloped that compare the value inserted with the previous one with several
38


Chapter 3 A new infrastructure for neonatal care
to feed themselves with the breast milk or bottle. The baby is then fed thanks
to special bags containing nutrients and drugs products. Bags may be ready
or prepared by the hospital pharmacy.
The composition of the solutions to be administered to infants is determined
by specialists using computer programs that can calculate, based on precise
parameters, the amount and quality of nutrients to be given [86, 87].
Because of fetal growth being more rapid than infant growth, the extremely
preterm infant has extraordinarily high nutrient requirements and thanks to
parenteral nutrition it is possible to cover nutritional needs from the first min-
utes of life in a very premature infant. However, when the infant is stable
it is extremely important to introduce enteral nutrition that can be started
with a minimum milk content, commonly called “minimal enteral feeding”, to
stimulate the maturation of the intestinal mucosa.
In SINC DBaaS a table with all 98 nutritional ingredients (both for EN and
for PN) used in Marche Region Hospitals has been created. Among these, it is
then possible to use those that are used in the “G. Salesi” Hospital pharmacy
because each one uses different ingredients.
An algorithm has been implemented in the “Nutrition Tool” (see figure 3.14)
which, on the basis of data taken from the “Anagrahic” and “Growth” tools
for a certain infant (life days, GA at birth, current GA, weight and so on) and
on the basis of nutritional schemes created by the head physician of NICU of
“G. Salesi” Hospital together with specialists of the sector, advises the total
amount of fluids to be administered to the infant with EN, when possible, with
PN, or with a mix of the two.
The algorithm, then, by removing from the total daily fluids, the amount of
liquids administered with EN and drugs, automatically prescribes the bag for
parenteral nutrition.
The doctor is instructed to choose what type of PN to administer (central or
peripheral venous catheters) and whether to use one of the pre-packaged bags
or not. If the choice is made on bags that are not pre-packaged, but prepared by
the hospital pharmacy, the physician is guided by the algorithm in the choice of
ingredients to be administered and of their quantity in order to respect the en-
ergy requirements and the molarity corresponding to the particular conditions
of the infant at the time of administration.
Since the ingredients in most cases are found in compounds, an algorithm
for compensating the ingredients in the bag had to be implemented.
All data from the tool are saved in the SINC DBaaS and they can be corre-
lated with those of “Anagrahic” and “Growth” tools, with those coming from
follow-ups studies (see next paragraph) and in the future also with those com-
ing from other SINC tools, such as those that will concern diseases, diagnoses
and therapies in order to perform randomised and prospective studies that cor-
42


3.3 The end-user web interface
- The Language Scale (Lang) taps understanding and expression of lan-
guage, for example, recognition of objects and people, following direc-
tions, and naming objects and pictures. It is divided into two subscales:
– Receptive Communication (RC), which examines preverbal behaviour,
vocabulary development and verbal comprehension;
– Expressive Communication (EC), which assesses communication,
vocabulary development and morphosynthetic vocabulary develop-
ment.
- The Motor Scale (Mot) assesses gross and fine motor skills such as grasp-
ing, sitting, stacking blocks, and climbing stairs. It is divided into two
subscales:
– Fine-motor (FM), which examines the manipulation of objects, tak-
ing and responding to tactile information;
– Gross-motor (GM), which evaluates posture, dynamic movement,
balance and coarse-motor planning.
There are two additional Bayley-II Scales depend on parental report, includ-
ing:
- The Social-Emotional scale, which asks caregivers about such behaviors
as ease of calming, social responsiveness, and imitation play. It analyses
the child’s mastery of his or her emotional function, communication needs
and ability to relate with others.
- The Adaptive Behavior scale which asks about adaptions to the demands
of daily life, including communication, self-control, following rules, and
getting along with others. It evaluates the subjects’ daily functional
abilities.
The Bayley-III Cognitive and Language scales are good predictors of preschool
mental test performance. These scores are largely used for screening, helping
to identify the need for further observation and intervention, as infants who
score very low are at risk for future developmental problems [90, 91, 92].
In the “Bayley Tool” these tests have been automated, as it is possible to see
from the web interface of the tool in figure 3.15. The caregiver has no longer to
write down the results of the items and then make the necessary calculations
to get the score, he can quickly scroll through questions on the tablet and take
advantage of the automatic grading done by the implemented algorithm.
In this way, besides avoiding calculation errors, it is possible to immediately
visualize patient’s score at an individual level and above all it is possible to
examine the results on question level to learn, for example, which item is more
difficult for children, at what age and so on.
Scores and responses to individual items are saved in the SINC DBaaS and
can be downloaded and used for further analysis.
45

Chapter 3 A new infrastructure for neonatal care
In each tool, an automatic reporting mechanism has been set up that gener-
ates reports in pdf format that can be used as medical reports to be delivered
to the parents of patients, to be entered in the ward medical record and sent
to the regional EHR, with which the SINC platform will be linked using the
ARCA-EMPI.
46

Chapter 4
Decision-Making Tools
4.1 Bilirubin Tool
Jaundice is the yellow colouring of the skin, sclera and gums caused by bilirubin
deposition. In newborns, sclera and gums are difficult to see and therefore
the yellow colouring of the skin is used to define the newborn jaundice, while
they may be more useful in coloured babies. The assessment of skin jaundice
should be made in a well illuminated environment and on compressed skin
to remove neonatal erythema. However, it is important to remember that
the cephalocaudal progression of jaundice can be used as an indication of the
evolution and gravity of jaundice, but it does not have a significant correlation
with the level of bilirubinaemia [93, 94].
Bilirubin is a yellow pigment derived from the catabolism of haemoglobin. It
is continuously formed in both foetus and newborn babies and is transported in
the blood associated with albumin because it is a non-polar compound. In the
foetus bilirubin is eliminated from the placenta, while in the newborn it must
be conjugated by the liver and eliminated through the bile. However, infant’s
liver is not able to eliminate the amount of bilirubin produced in the first days
of life and for this reason bilirubinaemia increases and causes physiological
hyperbilirubinaemia.
Physiological jaundice is an event that affects more than 60% of healthy term
infants and generally has the following characteristics [95]:
- it appears after the first 24 hours of life;
- it reaches the maximum intensity between the 3rd and 5th day of life in
term infants and in the 7th day in preterm infants;
- bilirubinaemia rarely exceeds 12-13 mg/dl (205-222 µmol/l);
- the increase in bilirubinaemia is <0.5 mg/dl/hour (8.5µmol/l/hour);
- Asian, Hispanic and South American populations may have higher biliru-
binaemia;
- it is no longer evident after 14 days of life;
- it disappears without any treatment.
Pathological jaundice differs from physiological one because of, generally, it
47

Chapter 4 Decision-Making Tools
presents the following characteristics:
- it appears in the first 24 hours of life;
- bilirubinaemia often exceeds 15 mg/dl (259 µmol/l);
- the increase in bilirubinaemia is >5 mg/day;
- it can last beyond the first 14 days of life in term infants and beyond the
first 21 days of life in preterm infants;
- it always requires treatment (usually with phototherapy).
As said, the reliability of jaundice visual assessment is limited and so at least
one measure of bilirubin must be taken for each newborn baby. As explained
in chapter 3, there are two ways to measure bilirubin: TcB, can be used as a
first measure because it is less invasive but less reliable, and TSB, that it is
always necessary to do when bilirubin values are high and in any case before
taking any therapeutic decision.
Jaundice can become dangerous, when the serum concentration of un-con-
jugated bilirubin becomes so high that it causes damage to central nervous
system structures [96].
The risk of neurological damage from bilirubin depends, first of all, on the
serum concentration of total bilirubin: the higher it is, the greater is the pos-
sibility that free bilirubin can enter the brain cells. In healthy term infants,
the level of bilirubinaemia may become dangerous in presence of risk cofactors
when it is >350 µmol/l (20.5 mg/dl), while for preterm infants it is dangerous
at > 255 µmol/l (15 mg/dl). The gestational and postnatal age (PA) must also
be considered: the lower they are, the greater is the possibility of damage, as
the higher the permeability of blood-brain barrier. There are also other factors
that favour the permeability of the blood-brain barrier (e.g. severe aptitude,
hypothermia, respiratory failure, acidosis, hypoglycemia, haemolysis, sepsis,
meningitis, neurological pathology and drugs), which must therefore be taken
into account.
Another factor to consider is haemolytic disease of the newborn, caused by
the transplacental passage of maternal antibodies against the red blood cells
of the fetus/neonate; the haemolysis that results in anaemia and hyperbiliru-
binaemia in the fetus and newborn.
The most important causes of feto-neonatal haemolysis are Rh isoimmu-
nisation disease [97], caused by anti-D antibodies produced by Rh negative
mothers against the Rh positive red blood cells of the fetus (it may occur when
the mother is Rh negative and the Rh positive fetus) and ABO haemolytic dis-
ease [98], which occurs when the mother is a group 0 and the fetus is a group
A or B.
If not diagnosed and treated in time, acute bilirubin encephalopathy (ABE),
also known as Kernicterus, can cause central deafness, mental retardation and
athetoid cerebral palsy or severe hypotonia and may also lead to death [99, 100].
48

4.1 Bilirubin Tool
Prevention of ABE is achieved by avoiding high levels of bilirubinaemia with
the following strategies [101, 102]:
- early feeding (better breasts) to reduce weight loss, dehydration and the
entero-hepatic bilirubin circle;
- early detection of critical bilirubinaemia values;
- adequate treatment with phototherapy;
- treatment with immunoglobulins in case of Rh or ABO haemolytic dis-
eases [103], even if their efficacy is debated;
- blood exchange transfusion (BET) when indicated.
The main remedy for solving neonatal jaundice is phototherapy (PT), a cu-
rative technique based on the use of light. Light of a certain wavelength is able
to induce in bilirubin an isomerisation that transforms unconjugated bilirubin
into hydrosoluble compounds (lumirubin and photobilirubin) that are excreted
with bile without the need for liver conjugation [104]. During treatment biliru-
binaemia decreases quite rapidly (4-8 mg/dl every 24 hours). This reduction
depends on the light spectrum used (e.g.: blue light is more effective than
white light), the radiance (between 10 and 40 µW/cm2/nm), the skin surface
exposed to light (preferable supine position) and the distance between the lamp
and the newborn skin (between 20 and 40 cm). During the treatment, which
must be continuous and non-intermittent, baby must be placed naked (the dia-
per is allowed) at a distance ≤ 40 cm from the lamp with eyes covered to avoid
damaging the retina.
Excluding hyperbilirubinaemia cases due to Rh and ABO haemolytic dis-
eases, the need for BET is very limited [105, 106]. In particular, it is necessary
in the case of hyperbilirubinaemia that does not respond to the treatment with
intensive PT to avoid cases of ABE. A newborn infant showing clinical signs of
ABE should undergo urgent BET intervention. Intensive PT must always be
started while waiting. The BET must be carried out after having obtained the
informed consent of the parents, in an intensive ward with monitoring during
and after the operation and with the possibility of carrying out all necessary
resuscitation operations [107].
4.1.1 Related Works
Neonatal hyperbilirubinaemia is the most frequent problem that every neona-
tologist has to face in daily practice. Approximately 60% of term ad 80% of
preterm infants have a visible jaundice that causes diagnostic and therapeu-
tic problems. The attitude of neonatologists towards hyperbilirubinaemia has
changed considerably in recent years: from an excessive attention to every “yel-
low” newborn in the period during which RH isoimmunisation prevailed, to a
less caution after the disappearance of this pathology and the advent of PT in
49

Chapter 4 Decision-Making Tools
the therapeutic scenario, until no longer considering jaundice as a problem in
the last decade.
The early discharge of newborns [108], the consideration of infants with a
35-36 weeks GA as comparable to term infants, and the promotion of exclusive
breastfeeding [109] have made hyperbilirubinaemia resurfaced as a “problem”.
Hospitalisation for jaundice after early discharge, severe hyperbilirubinaemia
with acute neurological symptoms and more frequent cases of nuclear jaundice
(kernicterus) with serious chronic outcomes have re-proposed a problem that,
although not disappeared, has certainly had a resurgence [110].
For this reason, in the last twenty years numerous studies have been con-
ducted on how to diagnose and treat neonatal pathological jaundice [111, 112,
113] and especially on how to predict and prevent it [114, 115, 101, 116].
In this respect, many studies have been carried out on possible causes [117]
and on risk factors and how these are correlated with the onset of hyperbiliru-
binemia [118, 119, 120].
Moreover, in recent years, numerous studies have been conducted on the
correlation between TSB and TcB [121, 122]. As already mentioned, in fact,
non-invasive methods are currently available for the dosage of bilirubin in the
undercuts, allowing to reduce invasive and painful determinations by sampling
blood on the heel [123]. However, several studies show that only in the concen-
tration range of 6 to 12 mg/dl (103-205 µmol/l) transcutaneous determination
provides a reliable estimate of blood concentration in term and late preterm
infants [75, 124, 125].
To prevent adverse outcomes resulting from neonatal hyperbilirubinaemia
and to support healthcare physicians in neonatal jaundice assessment and qual-
ity of care improvement, standardised protocols for the identification and eval-
uation of hyperbilirubinaemia were established in many countries.
Clinical practice guidelines support clinicians by synthesising up-to-date ev-
idence and suggesting best practices; however, they are underused in prac-
tice and not always effective in influencing physician behaviours in patient’s
care [126, 127]. Among the reasons is that they are provided to healthcare
professionals on a paper-based format and this contributes to decreasing their
friendliness.
To facilitate guidelines implementation in everyday practice some evidence-
based decision support systems have been developed to automate recommen-
dations such as in [128], in [129] and in [130], where a model is proposed so
that, by entering the various information related to a patient, an output advice
on the behaviour to be taken in that situation is obtained, based on the guide-
lines respectively delivered by Spanish [131], American [132] and English [133]
international scientific societies.
In [134] Dani et al. showed that also in Italy, as in other countries, the di-
50

4.1 Bilirubin Tool
agnostic and therapeutic approach of neonatal hyperbilirubinaemia is not well
codified, hence the need felt by the Italian Society of Neonatology (SIN, Societa
Italiana di Neonatologia) to set up a task force for neonatal hyperbilirubinaemia
that, based on national and international experiences, elaborated Recommen-
dations in order to standardize the diagnostic and therapeutic approach to
neonatal hyperbilirubinaemia in Italy.
The aim of SIN recommendations is to provide Italian neonatologists with a
practical means of dealing with the problem of neonatal jaundice in an effective
and safe way. For this purpose the guidelines of many international scientific
societies have been taken into account, e.g., those of American Academy of
Pediatrics [135, 132, 136], NICE for English society [137, 133], Canadian Pedi-
atric Association [138], Netherlands Neonatal Research Network [139], Norwe-
gian Pediatric Society [140], those of the Israeli [141], New Zealand [142] and
Australian (Queensland) [143] societies, in addition to the Indian [144], the
Spanish [131] and the Swiss [145] guidelines, largely derived from others.
Experiences in the neonatal population of the Lazio Region have also been
taken into consideration as an expression of a representative sample of the
Italian population, both for the elaboration and the prospective application of
hourly nomograms relating to both transcutaneous and serum determination
of bilirubin [146, 147, 148]. Most of these guidelines have been developed for
infants with a GA ≤ 35 weeks and only a few have also indications for infants
of a lower GA.
In section 4.1.4 the design and implementation of a web-based decision sup-
port tool is described, which automates SIN guidelines and incorporates some
valuable advices from NICU neonatologists who have been consulted during
the development of the system.
4.1.2 SIN Guidelines
Recommendation 1: Aim of the guidelines
SIN recommendations foresee to avoid the overcoming of a bilirubinaemia equal
to 20 mg/dL in the first 96 hours of life and 25 mg/dL after 96 hours of life
(the maturation of the blood-brain barrier progresses with PA) in term infants
(LoE 2b)1. Then, SIN guidelines require that the limit is less than 12 mg/dL
for preterm infants with a GA ≤ 30 weeks and 15 mg/dL for infants with EG
31-36 weeks (LoE 1b). On this basis, bilirubinaemia values have been defined
according to the time of life and GA exceeded, which are indicated to start
treatment with PT or perform BET.
Recommendation 2: Methods for controlling hyperbilirubinaemia
SIN recommends that every jaundice infant should receive a measurement of
1Levels of evidence (LoE) are indicated according to the classification shown in table 4.1.
51

Chapter 4 Decision-Making Tools
Table 4.1: Evidence hierarchy from the centre for evidence-based-medicine.
Level Definition
1a Systematic review (with homogeneity) of RCTs1b Individual RCT (with narrow confidence interval)2a Systematic review (with homogeneity) of cohort studies2b Individual cohort study3a Systematic review (with homogeneity) of case–control studies3b Individual case–control study4 Case-series (and poor quality cohort and case–control studies)5 Expert opinion without explicit critical appraisal, or based on
physiology, bench research or “first principles”
bilirubinaemia. Transcutaneous determination (TcB) can be used as a first
approach to minimise blood samples, but TSB is always necessary for high
bilirubinaemia values. In any case, therapeutic decisions should only be made
on the basis of TSB value (LoE 1b).
Recommendation 3: Forecasting of severe hyperbilirubinaemia
SIN recommends the following procedure for newborn babies with GA ≥ 35
weeks [131, 145, 146]:
- All infants with jaundice must undergo TcB measurement.
- If TcB value is higher than the 75◦ centile given in the nomogram of
figure 4.1 TSB must be measured.
- TSB value must be evaluated on the nomogram of figure 4.2 and the
follow-up must be programmed as follows:
- Values of TSB < 50◦ centile in the first 48 hours or < 75◦ centile
after 48 hours of life are not at risk of clinically relevant hyperbiliru-
binemia (need for PT) and therefore do not require further control.
- TSB values > 50◦ centile in the first 48 hours or > 75◦ centile after
48 hours of life are at risk of clinically relevant hyperbilirubinemia
(need for PT) and require control at 24 or 48 hours respectively
after measurement depending on the age of the newborn baby and
the possible presence of risk factors (LoE 1b).
For infants with a GA < of 35 weeks there are no predictive nomograms of the
risk of developing relevant hyperbilirubinaemia. Therefore, it is recommended
that controls should take into account infants GA with reference to the TSB
values for which PT treatment is expected to begin (LoE 5).
Recommendation 4: Treatment - Phototherapy
SIN recommends the use of nomograms in which TSB values, indicative of the
need to start PT, are expressed in relation to the GA, defining the values for
homogeneous groups of GAs: <30, 30-31, 32-34, 35-37 and >37 weeks, as it is
possible to see in figure 4.3.
52


Chapter 4 Decision-Making Tools
low-risk term infants. The treatment of PT, however, is carried out only in the
NICU, the only hospital ward equipped with PT lamps.
Usually if jaundice is not visible and if there are no particular risk factors,
such as haemolytic disease, in term infants, the first TcB is carried out within
48 hours, while in preterms infants control is carried out within 24 hours. If the
value of TcB is less than 12mg/dL, they proceed with the regular checks, up
to the discharge, if it is more than 12mg/dL, they make the TSB and compare
it with the curves of the centils and with those relating to PT and BET in the
most serious cases, corresponding to the GA of the newborn baby.
If the newborn infant has anemia, the first measurement is taken immediately
and depending on the values of the measurement, on the type of anaemia, on
GA and on PA, checks are carried out every 4,6 or 12 hours. For comparisons
with the corresponding curves, in this case, the curve related to the previous
GA group is taken into account, to have a more cautious attitude. Even if the
newborn baby has other risk factors, less severe, controls can be programmed
more frequently, but in this case the comparison is made on the basis of SIN
guidelines.
In particular, measured TcB and TSB values are written down by nurses
on a spreadsheet and only later transcribed on the PC. Nurses proceed to the
comparison of the measured TcB/TSB value with standard values established
by SIN guidelines: the TcB/TSB value is visually compared with the correct
curve selected depending on percentile or on GA and on measurement time
compared to birth hour. From this purely visual comparison and, therefore
very subjective, they decide if the value of TcB/TSB is in the physiological
range or not. If it is, they continue with measurements taken at regular in-
tervals, depending on GA and on the presence of risk factors, until discharge.
Otherwise, if it is not, in case of TCB measurement, they proceed with the
measurement of TSB, and in case of a TSB measurement beyond the limit,
nurses must promptly inform physicians who will order to perform therapies
such as PT or BET in more serious cases.
Since it is transcribed on PC only later, the TcB value has to be compared
with the correspondent curve of the guidelines only visually through a paper
chart. For this reason, this comparison is very subjective and prone to error.
The aim was therefore to standardise, first of all, the treatment protocols
of the three departments, which showed disparities, and then to create a valid
model for all the birthplaces of Marche region.
Another objective was to automatically collect data from all the instru-
ments used for the measurement of serum and transcutaneous bilirubin that
are located in the three hospital wards, namely 2 sieric bilirubinometers and
3 transcutaneous ones, in a single DB. Through the interconnection of the in-
struments, described in chapter 3, in fact, the values of the measurement are
56

4.1 Bilirubin Tool
shown in the tool interface in an automatic and instantaneous way and are then
processed by the algorithm to extract useful information on jaundice diagnosis.
Thus, the automatic transmission of the measured values will eliminate draw-
backs due to manual transcription and it will give the possibility of making
comparisons with the standard curves of the guidelines in a direct, automatic
and objective way and without the possibility of making mistakes.
Moreover, in the nursery measurements are not even transcribed from paper
to EMR with the problem that if the newborn gets sick or gets worse and has
to be moved to the NICU, they have to be recovered and transcribed on the PC
in order to have the historical patient’s bilirubin values. Furthermore, when
infants are sent from the nest to PT at the NICU, on their return, nurses of the
Pediatric Nursery do not have access to bilirubin values related to the period of
PT. The use of a single database, which also includes the personal data of the
patient, through the integration with EMR data, has also solved this problem.
4.1.4 Data Analysis: Bilirubin Decision-Making Algorithm
The “Bilirubin Tool” and, in particular, the algorithm have been designed and
developed after several interviews with 2 neonatologists and a nurse acting as
domain experts. With them the structure of the problem was modelled as a
workflow diagram 4.6, identifying decisions to be made, the sequence in which
they would arise, and the information available at each decision-making time,
as well as all the uncertain events. It is implemented in JavaScript for client
side and in PHP for server side.
The developed decision-making algorithm consists in an automated DSS for
guideline based care to facilitate the implementation of clinical practice guide-
lines for neonatal jaundice. It is an evidence based CDSS which, generally,
automates SIN guidelines, but also adds physicians’ expertise at some critical
points.
Decision nodes involve the temporal axis of the model: first, to establish
measurements reminders and, then, to decide the treatment (PT, exchange
transfusion, or simply observation) depending on some risk factors and on the
results of any measurement tests carried out. Decisions about treatments are
repeated as many times as necessary until the problem is over, i.e., the infant
is discharged unless he has other health problems.
Clinical inputs of the system, apart from SIN guidelines rules and recom-
mendations that form the knowledge base, are GA and PA, coming from “Ana-
graphic Tool”, birth weight and the current one, coming from “Growth Tool”,
bilirubin measurements coming from bilirubinometers and transcutaneous ones
(combined in the same DB table), bilirubin levels curves recommended from
SIN guidelines and some risk factors.
57

Chapter 4 Decision-Making Tools
The risk factors that the algorithm takes into account, on the advice of ex-
perienced physicians, are in addition to those covered by the guidelines and
considered primary factors, i.e. the presence of Rh isoimmunisation and ABO
haemolytic disease, assessed by the Coombs test results, manually inserted by
nurses or physicians, some secondary factors, i.e. familiarity with PT, breast-
feeding, always manually entered as a response to an initial questionnaire, and
a weight loss ≥ 10%, automatically calculated by the algorithm as the difference
between infant’s birth weight and current weight.
SIN guidelines do not specify how risk factors are to be taken into consid-
eration except in the curves of critical bilirubin values for BET (4.5). On the
contrary, the algorithm, if one of the primary risk factors is present, takes for
the comparison of TcB and TSB measurements the values corresponding to
the group of GAs preceding the actual one of the infant and reduces the time
between checks; while if one of the secondary risk factors is present, it only
reduces the time between bilirubin value checks.
Immediately after the infant’s patient data registration on the “Anagraphic
Tool” and the mandatory compilation of risk factors, the algorithm starts a
countdown to program TcB measurement after 24 hours if there are no risk
factors or after 6 hours if there are risk factors (even secondary ones). In
any case, the physician may decide to reduce these time intervals between the
bilirubin measurement checks depending on the particular case, by modifying
a field in the interface of the tool and justifying its motivation in a note field.
The algorithm takes into account the new predetermined range.
The countdown results in a reminder for nurses to do the bilirubin measure-
ment and, when this is not done on time, in a warning (need for immediate
measurement).
As soon as the DB receives a new measure of bilirubin from the instrumen-
tations depending on the type (TcB or TSB) and time order, a series of actions
are triggered, which are translated into a series of if-else cycles controlled by
the various inputs described above.
If the infant has a GA ≥ of 35 weeks, if TcB value is higher than the 75◦
percentile given in the related SIN guidelines nomograms (4.1), depending on
infant’s PA, TSB must be measured, that results in a TSB measurement warn-
ing, otherwise another TcB measurement is required after the predetermined
time interval, that results in a TcB measurement reminder.
If the infant has a GA < of 35 weeks, the same nomogram is followed, but
independently from PA if it exceeds 11 mg/dL, the TSB is required. This is
because in the guidelines the critical value is 12 mg/dL, but according to physi-
cians’ experience in this range of values the transcutaneous bilirubinometer has
a great variability, so as a precaution they have decided to set the limit at 11
mg/dL.
58

4.1 Bilirubin Tool
Then, if TSB value, in the first 48 hours, is < 50◦ centile or, after 48 hours
of life, is < 75◦ centile given in the related SIN guidelines nomogram (4.2),
depending on infant’s GA and PA, further controls are not required other than
the final TSB measurement before discharge, while if TSB value is > 50◦ centile
in the first 48 hours or > 75◦ centile after 48 hours, the TSB value has to be
compared with the SIN guidelines nomograms related to PT (4.3), depending
on infant’s GA and PA.
If TSB value is lower than that of the monogram for PT related to the
infant’s GA and PA, then a TSB check must be carried out again after the
predetermined time interval, that results in a TSB measurement reminder;
otherwise, if it is higher, but lower than that of the monogram for BET (4.4),
related to the infant’s GA and PA, the PT should start as soon as possible
ad it results in a PT acceptance request sent by email to physician in charge
because only physicians can give the consent to begin the therapy.
After the physician has accepted, also by sending an unlock code via email,
PT is started. Then, TSB control must be scheduled at 4 hours from the start
(even less if TSB is < 3 mg/dL from the threshold value to perform BET) and
then every 12-24 hours depending on whether secondary risk factors are present
or not. If the PT has been started for more than 72 hours and the value is not
yet below the threshold, the exposure or power of the lamps must be increased.
Treatment can be stopped after obtaining two values of TSB in reduction,
compared to the values at the beginning of treatment. Post-suspension control
should be scheduled within 12-24 hours to detect any rebound.
If TSB value is higher than that of the monogram for BET related to the
infant’s GA and PA, SIN guidelines are followed: before the start of the pro-
cedure PT is immediately initiated after physician’s consent; TSB must be
checked first and at the end of the procedure and then every 4 hours until
stabilisation; after the procedure intensive PT treatment should be continued
until stabilisation.
59

Chapter
4Decisio
n-M
akingTools
NEONATAL
VISITAre primary Risk
Factors present?
1) GAs previous group
2) T1= 4h
3) T2= 4h
Are secondary Risk
Factors present?
1) T1= 6h
2) T2= 12h
1) T1= 24h
2) T2= 24h
TcB within T1
Did physician
change checks
frequency?
comparison with monogram
(fig. 4.1), given PA
Is TcB > 75° centile?
TcB within T1
comparison with monogram
(fig. 4.1), given PA
Is TcB > 75° centile?
HOSPITAL DISCHARGE*
with scheduled follow-up
GAs previous group
T1= 4h
T2= 4h
T1= 6h
T2= 12h
T1= 24h
T2= 24h
T1= xh
T2= xh
T1= xh
T2= xh
T1= xh
T2= xh
Did physician
change checks
frequency?
Did physician
change checks
frequency?
TSB within T1
comparison with monogram
(fig. 4.2), given PA
Is TSB > 50° centile (if PA<48h)
or
TSB > 75° centile (if PA>48h)?
TSB within T1
comparison with monogram
(fig. 4.2), given PA
Is TSB > 50° centile (if PA<48h)
or
TSB > 75° centile (if PA>48h)?
HOSPITAL DISCHARGE*
with scheduled follow-up
comparison with monogram
(fig. 4.3), given PA and GA
Is TSB > TSBPT?
comparison with monogram
(fig. 4.4), given PA and GA
Is TSB > TSBBET?
Is TSBBET – TSB<3 mg/dL?
T3= 6h T3= 4h
PT alarm
Email to physician
for PT acceptance
Is PT approved?
START PT
TSB within T3
Is TSB41 > TSBBET_32?
Is TSB41 < TSB23/26?
TSB within T2
Is TSB44 > TSBBET_32?
Is TSB44 < TSB23/16?
STOP PT
TSB within T2 Go to BOX 24
Alarm BET and PT
Email for BET and for PT
acceptance to physician
Is PT approved?
START PT
Is BET started?
1) STOP PT
2) TSB
3) START BET
TSB within 4h
STOP BET
TSB within 2hGo to BOX 30
Did 72 h pass
since PT START?
1 2
3
4
118
7 13
129
10
65
1514
23
17
16
20
19
18
24
26
22
21
25
28
29
43
44
27
35 36
34
33
32
31
30
39
38
37
51
42
41
40
48
50
49
47
Increase exposure
55
54
53
52
58
59
60
61
Urge BET
Continue PT
57
56
45
46
n y
n yy
y
n n nyy y
ny y n
ny
yn
n y
y
yn
n
n
n
n
n
y
y
y n
n y
n
n y
y
Figure 4.6: Bilirubin Decision-Making workflow diagram.
60

4.2 Activities Monitoring Tools
4.2 Activities Monitoring Tools
In this section a novel non-contact and non-invasive RGB-D imaging method
to estimate infants’ respiratory rate and movements is presented. In section 4.7
the physical architecture is described, then in section 4.2.2 and 4.2.3 respec-
tively, the methods and algorithms used to analyse data extracted from depth
images acquired from the RGB-D camera are described.
4.2.1 The physical architecture
RGB-D sensor
Embedded
System
Figure 4.7: Representation of the configuration scheme of the system.
Figure 4.7 shows the configuration scheme of the system. It consists of two
main components:
1. Single Board Computer : is a complete computer built on a single circuit
board, with microprocessor(s), memory, input/output (I/O) and other
features required for a functional computer. Single-board computers were
made as demonstration or development systems, for the use as embedded
computer controllers [149].
2. RGB-D sensor : is composed by an infrared sensor, an RGB sensor and
some microphones. It is able to provide in output a RGB representation
of the scene and it also allows to reconstruct a depth map of the same.
In the depth map the value of each pixel codifies the distance of each
element in a 3D scene.
The architecture design is based on the choice of hardware and software compo-
nents. In order to satisfy both functional and non-functional requirements, an
61

Chapter 4 Decision-Making Tools
embedded board, such as a CubieBoard22, has been used, since it is sufficiently
small and suited to manage all algorithms. Asus Xtion Pro live has been cho-
sen as depth sensor because it has a low cost, it has smaller dimensions than
Microsoft Kinect, and the power supply is provided only by the USB port: it
does not need an external power. Moreover, it is easy to install over the crib.
The Cubieboard2 is a SoC based on ARM Cortex-A7 Dual-Core processor run-
ning on 1 GHz, and on ARM Mali 400MP2GPU, containing 1 GB of DDR3
memory and 4 GB of internal NAND flash. On that, a version of Debian OS
(CubianX) is installed because compatible with the hardware and easy to setup
the drivers of depth sensor (OpenNI2), the vision libraries (OpenCV), and the
Qt Framework (Qt5).
4.2.2 Respiration Tool
The respiratory rate is defined as the number of breaths taken by an individual
over a minute. Every single respiratory cycle is composed of an inspiratory
phase, during which the chest wall expands itself, and an expiratory phase,
during which the chest wall goes back to the previous state.
The respiratory rate of an adult at rest is 12− 20 breaths per minute [150].
In the newborn and throughout the first year of age, the respiratory rate is
about 40 breaths per minute. In preterm infants it is higher, about 40−50 per
minute, and irregular.
As said before, preterm birth affects the anatomical and functional develop-
ment of all organs, inversely with GA and the degree of immaturity is primarily
in the respiratory tract.
The rhythm of the breath is usually irregular for the immaturity of the
respiratory centers. Periodic breathing (Cheyne-Stokes rhythm) is frequently
encountered, characterized by recurrent periods of apnoea (about 5-10 s) within
periods with close breaths.
Respiratory Distress Syndrome (RDS) is one of the most frequent lung dis-
eases in premature births. It is a surfactant deficiency disease, which designates
lung immaturity from a biochemical and structural point of view. Normally,
RDS can occur from 3 to 6 hours after birth and in the most serious cases at
birth, while in the lighter forms it appears after 12-18 hours.
The following terminology is used in a standardised manner to describe the
severity of respiratory distress:
- absent: haemoglobin saturation exceeds 85% and respiratory rate is below
60 cycles/minute;
- moderate: haemoglobin saturation is below 85% and the respiratory rate
is above 60 cycles/minute;
2http://cubieboard.org/model/cb2/
62

4.2 Activities Monitoring Tools
- severe: the patient is in apnoea, gasping (agonal respiration, not effective,
with very low frequency) or intubated.
Thus, a respiratory rate greater than 60 breaths per minute creates alert.
Even if the infant has an apnoea, i.e., breathing stops for more than 10 seconds,
it means that there is a respiratory problem.
For all these reasons it is necessary to continuously monitor the respiratory
rate in preterm infants.
For disease assessment hemogasanalytic parameters, such as Ph, PaCO2 and
PaO2, are also used. Furthermore, it is very useful to quantify the severity of
signs and symptoms of RDS using the respiratory score according to Silverman,
where each of the parameters taken into consideration is given a maximum score
of 2; a total score of 10 identifies an infant with an important respiratory failure.
One of these parameters is the thoraco-abdominal balance, a typical oscilla-
tion between thorax and abdomen given by the lack of coordination between
diaphragm and intercostal muscles in conditions of intense fatigue. In the
absence of RDS pathology, the upper chest portion and abdomen expand si-
multaneously. On the contrary, when the disease is present, a wavy movement
is visible, so the chest falls back while the abdomen expands.
RDS is treated with artificial ventilation and exogenous surfactant, natural
(cattle or pig) or synthetic.
4.2.2.1 Related Works
The two most widely used methods for evaluating the respiratory activity in
adults are spirometer and pneumotacography.
Other invasive devices are impedance pneumography [151], thoracic impedance
[152], respiratory inductance pletysmography [153], photopletysmography [154],
strain gauges [155], thermistor [156], magnetometers [157] and acoustic moni-
toring [158].
However the measurement of the respiratory rate in all these techniques needs
the direct contact with the monitored people and it may cause interference in
their normal activity breath.
For this reason, in the last years some non-contact respiratory measurement
methods were investigated, such as Doppler radar [159], microwave sensors [160,
161], infrared temperature sensors [162], thermal imaging [163], structured light
pletysmography [164] and optoelectronic pletysmography [165, 166].
Most recently, the RGB-D camera is used to detect the respiratory rate[167,
168, 169, 170] but in literature, there is a little number of works describing this
technique, which, however, is used only for adults.
Generally, the respiratory activity of hospitalized infants is monitored us-
ing the thoracic impedance technique. In literature, it is possible to find that
some of the methods previously cited are adapted and tested also on newborns
63

Chapter 4 Decision-Making Tools
and preterm infants, such as respiratory inductance pletysmography [171],
impedance plethysmography [172], structured light plethysmography [173] and
optoelectronic plethysmography [166].
In the neonatal intensive care unit (NICU) of the Women’s and Children’s
Hospital “G. Salesi” in Ancona, where these babies are taken into care, the
respiratory activity of preterm infants is continuously monitored using a patient
monitor, used as benchmark, obtaining the respiratory rate through the ECG
electrodes by impedance pneumography.
In this section, a novel contribution for monitoring the respiratory rate of
preterm infants is described, developing a low cost embedded video system
that measures preterm infant respiratory rate without any physical contact.
Respiratory rate is derived by calculating morphological chest wall motions
using a depth camera positioned above the infant lying on the infant warmer.
The advantage of the proposed method is that it is contact-less, non-invasive
and suitable to be used in an indoor environment with poor lighting, as might
be rooms in the neonatal intensive care unit.
4.2.2.2 Data Analysis: Respiratory Rate Algorithm
In this section, main steps of the algorithm that analyses the respiratory rate
of preterm infants are described.
The subjects under examination are 3 preterm infants (males) recovered in
the NICU. Their GA ranged from 32 and 34 weeks, with a mean age of 33+3
weeks of age and the weight is between 1400 g and 1800 g, as shown in table 4.2.
In order to evaluate the performances of the proposed algorithm, five tests,
lasting 30 seconds each one, for each subject were performed.
Table 4.2: Infants’ characteristics (Gestational Age and Weight).
ID Acquisition Gestational Age (weeks+days) Weight (g)
1 32+3 14202 33+3 16183 34+2 1762
Mean 33+3 1600
The depth sensor has been placed perpendicularly above the infant lying on
the crib at a distance of 70 cm, normally directed to the subject skin. Other
tests have been performed putting it in a slightly inclined position, however
this different position does not affect the measurement. For the analysis of the
respiratory rate, the measurement points have been chosen in the thoraco-ab-
dominal area, considering where the possibility to detect the movements due
to inspiration and expiration acts is greater and at the same time where it is
64

4.2 Activities Monitoring Tools
possible to work on an available part of the skin surface of the infant, that is
wearing a diaper and has sensors attached to the body. The mechanical move-
ments of this area due to inspiration end expiration acts cause the variation of
the depth signal acquired.
The method for the analysis of respiratory rate is based on the depth sensor.
The idea is to analyse the time trend of different points in the thoraco-abdom-
inal surface area of the subject monitored, present in the depth frame. The
particular configuration of the system facilitates the monitoring of the respi-
ratory rate. A graphical interface has been created in C + +, which allows
viewing video streams (RGB and depth) from the sensor.
The algorithm includes a first step where the user can choose to analyse dif-
ferent strategic points. These, along with the depth values and the timestamps,
are exported to a .csv file. Then, for each frame, the average value of depth
of the chosen points is calculated . After this first analysis, a filter (fourth-or-
der Butterworth low-pass filter) is applied to raw data so collected to remove
the unwanted noise components due to the cardiac activity and to the motion
artefacts. Then a find-peak function is used to detect the respiratory signal
peaks and the time elapsed between two successive peaks is calculated, which
is the instantaneous respiration period (RR). Finally for each performed test,
the RR period obtained from the RGB-D sensor is compared with that derived
from the patient monitor, used as reference.
4.2.3 Movement Tool
Every year there are more than 15 million worldwide preterm births and the
number of cases continues to rise [6]. Preterm infants are babies born between
the 22nd and 36th week of gestation that often have health problems because of
preterm birth affects the anatomical and functional development of all organs,
inversely with GA.
One of the biggest problems concerns the functional integrity of the neonate’s
central nervous system (CNS). Preterm infants, in fact, are at higher risk of
developing adverse neurodevelopmental outcomes and correlated motor impair-
ments than infants born at term [174]. Cerebral palsy (CP) is a permanent dis-
order in the development of movement and posture and is one of the major dis-
abilities that affects up to 18% of infants who are born extremely preterm [175].
The total rate of neurological impairments, developmental delays and other
motor coordination disorders due to less severe category of minor neurological
dysfunctions is up to 45% [176].
For the moment, there are no standardized clinical guidelines to assess the
risk of later disabilities and predict motor impairment in high risk infants.
Neuroimaging results, such as MRI and clinical neurological examination, in-
65

Chapter 4 Decision-Making Tools
tegrated with infant’s clinical history, are used to identify infants at highest
risk through different clinical assessments and experience of healthcare profes-
sionals. These sophisticated brain imaging techniques can provide additional
information for conditions like CP [177], but these approaches are not yet suited
for early diagnosis. CP diagnosis generally cannot be made definitively until a
child is at least 3-4 years-old [175].
However, in order to limit the consequences of CP or other minor neurologi-
cal dysfunctions, physiotherapy should start as soon as possible, meaning that
infants at risk have to be identified from the earliest possible age. Though the
major injury cannot be completely repaired, in fact, with an early identification
follow-ups after discharge can be planned in a more focused way in order to
provide specific interventions and information for parents about infant’s prog-
nosis.
In last years, it was found that the spontaneous motility of preterm in-
fants during their first weeks of life has an important clinical significance. The
study of the early motor repertoire in preterm infants is an important predictor
of nervous system dysfunctions and neuromotor impairments in high risk in-
fants [178] and it can be considered as an essential step to optimise therapeutic
approaches [179].
Prechtl proposed a new method to study infant nervous system by evaluating
the quality of movement patterns in infants. In [180], authors introduced the
term General Movements (GMs) to describe whole-body movements that have
varying speed, amplitude and sequence and in [181] they developed a quali-
tative approach to assess infants’ motor integrity based on the observation of
spontaneous motor movements.
GMs can be observed in newborns and young infants until the 20th week
post term. In preterm infants (until the 4th week post term) GMs are called
Writhing Movements (WMs); they seem to be more proximal and have small
to moderate amplitude and slow to moderate speed. To the 6th-8th week post
term GMs are called Fidgety Movements (FMs); they appear more distal, cir-
cular, with a moderate speed, a smaller amplitude, a constant fluency and
are characterized by variable limbs acceleration in all directions. The transi-
tion from WMs to FMs indicates a changing maturational stage, whereas the
absence of FMs in infants at the 9th-20th week post term is proved to be a
marker for later disability and CP [182]. Also the presence of the cramped syn-
chronized general movements (CSGMs), in which infant’s limbs are rigid and
move almost simultaneously during preterm and term age, have high predictive
value for CP development, if observed persistently during a certain number of
weeks [183].
The quality of GMs is evaluated by trained observers meaning that GMs
assessment (GMA) is based on visual observation by physicians and, thereby,
66

4.2 Activities Monitoring Tools
that the outcome measures are not standardized and influenced by examiner’s
subjective interpretation. The GMA technique is time-consuming, depends on
examiner’s experience and shows a considerable intra and inter-observer vari-
ability [184]. For these reasons, an objective (observer-independent) method,
that automates the process of assessing the quality of infant GMs, would be
preferable. Computer-based analysis of GMs could be a useful tool to support
the physician in his medical decisions.
Nowadays, the advanced motion capture technologies have made possible the
quantitative analysis of movement and the classification of “normal” and “at
risk” movements based on objective criteria. However, the utility of these meth-
ods is often limited by the need for complex equipment and instrumentation for
advanced analyses and for highly experienced personnel who is required [185].
Instead, an ideal system for analysing infants movements in a clinical envi-
ronment, as might be the Neonatal Intensive Care Unit (NICU) where this
solution is tested, has to provide the following characteristics: the system has
to be cheap, easy to install, non-invasive and user-friendly and has to provide
in outcome objective, accurate and reliable measures.
In this section, a novel contribution for preterm infant’s movements analysis
is described, by providing a low-cost video-based system that achieves all pre-
vious requirements by using a depth sensor positioned above the infant lying
on the infant warmer. The advantage of the proposed method is that it is
contactless, non-invasive, easy to install and suitable to be used in an indoor
environment with poor lighting, as might be rooms in the NICU.
The aim is to provide a 3D motion analysis system that is able to extract
some important features from the sequence of depth images collected by RGB-D
sensor, which serve as quantitative and qualitative indicators of infant’s move-
ments. These indicators can be used to objectively and quantitatively study
infant’s movements during his development. In that way, it will be possible to
see the change of movements type during the time, the transition from WMs
to FMs, the absence of FMs or the presence of abnormalities in movement as
CSGMs, the improvements after physiotherapy. The work is mainly focused
on the statistical method reporting only preliminary test results conducted in
the experimental phase on a preterm infant hospitalized in the NICU of the
Women’s and Children’s Hospital “G. Salesi” in Ancona (Italy). The goal is
to extract a set of parameters from statistical analysis of depth data, collected
from the RGB-D sensor of the video-based system installed over the crib, which
support clinician in quantifying movements, e.g. with information about move-
ments percentage, velocity, acceleration and activity sequences.
The project opens also to future evolutions in the direction of infants’ clas-
sification in “healthy” and “at risk” classes.
67

Chapter 4 Decision-Making Tools
4.2.3.1 Related Works
The clinical importance of the early detection of neuromotor impairments in
high risk infants has led to an increasing interest in the use of automated
movement recognition technologies being applied in this field. Over last years,
several researchers tried to overcome GMA subjectivity by attempting to au-
tomatically analyse GMs. Different methods of data acquisition (e.g. optical
or magnetic tracking, acceleration measurements, image processing) have been
studied. However, these approaches are often based on complex equipment
and used methods are not always suitable for a clinical environment. In [186]
automated movement recognition for clinical movement assessment in high risk
infants are divided in two main categories: video-based assessment and assess-
ment through direct movement sensing.
Video-based movement assessment systems can be divided into three-dimen-
sional (3D) motion capture systems, based on special markers that should be
attached to the limbs being tracked, and systems that use traditional colour
(RGB) sensors.
A first 3D motion capture approach was performed by Meinecke et al. in [185].
Based on a 3D motion analysis system, the aim of this study is to develop a
methodology in the direction of an objective and quantitative description of
GMs of infants within the first month of life. The measurement procedure al-
lows the spatial detection and quantification of full body movements for long-
term control with very high 3D tracking accuracy and resolution (both spatial
and temporal), but at a considerable price and setup effort.
With a similar setup, in [187, 188] Kanemaru and colleagues analysed in-
fants’ GMs in order to investigate the relationship between the jerkiness in
spontaneous movements at term age and the development of CP at 3 years of
age.
However, 3D motion analysis of the whole body is a demanding task, es-
pecially in the case of very small infants. Infant’s movements must not be
impeded by cumbersome measurement setups, because the aim is to provide
the basis for the application of quantitative methods in clinical routine.
Systems that use standard video cameras, e.g. webcams and RGB sensors,
are also used for markerless infants’ motion capture. These systems are a more
affordable alternative to 3D motion capture systems and require a less set up
effort, allowing their applications in research and clinical settings. However,
these approaches have lower spatial and temporal resolution and less accurate
tracking than 3D motion systems, which limit the level of analysis detail .
Adde and co-workers used a video-based analysis system for quantitative
and qualitative assessments of infants’ GMs [189]. They developed the General
Movement Toolbox (GMT) by modifying some modules of the Musical Gesture
Toolbox (MGT), a software collection for performing video analysis of music-
68

4.2 Activities Monitoring Tools
related movements in musicians and dancers [190]. By using the so called
“motiongrams” for quantifying changes in the infant’s movements, the GMT
is able to detect FMs as described in the GMA.
More recent studies have successfully applied accelerometers to preterm in-
fants to measure spontaneous movements [191, 192]. In [193] authors tested
the use of wireless accelerometers in an NICU and compared accelerometers
data to the GMA in order to investigate whether accelerometery, combined
with machine learning techniques, could accurately identify CSGMs. As in
the case of traditional cameras, the use of accelerometers provides low spatial
resolution, occasional data losses and relative movement capture only.
In [194] authors used another approach in the movement sensing assessment
class by tracking body segments of upper and lower limbs during GMs with
a magnetic tracking system compared with traditional GMA through video
analyses. Despite the increasing popularity of depth sensors, these have not
yet been used extensively for movement analysis in infants. This contrasts
with other clinical applications, e.g. gait analysis [195], rehabilitation monitor-
ing [196], postural control assessment [197], or monitoring of musculoskeletal
disorders [198]. Although its great potential in human action recognition [199]
and in general movement analysis, depth sensors use is not largely explored
with regards to preterm infants’ GMA. This may have happened because the
provided body tracking functionality of Kinect sensor does not work reliably
for humans smaller than one meter, which makes it unsuitable for tracking
infants.
In [200] authors started to develop a 3D motion analysis system based on
the use of Kinect sensor by providing the development of a markerless body
pose estimator in single depth images for infants as the first step towards this
goal. The advantages of this kind of solution is that the use of depth sensors
provides high spatial resolution with a marker-less, non-invasive, low-cost and
privacy preserving motion capture unlike 3D motion capture studied until now.
For these reasons, the attention is focused on this approach by continuing the
work started in [201].
4.2.3.2 Data Analysis
This section describes proposed Computer Vision (CV) algorithms used for
infants’ movements detection (paragraph 4.2.3.2.1) and extremities tracking
(paragraph 4.2.3.2.3) and some algorithms used for the analysis of these move-
ments with the aim of processing data and transform them in important indi-
cators useful for physicians in clinical decision-making (paragraph 4.2.3.2.2).
The pattern observed for the analysis of movements is shown in figure 4.8.
69

Chapter 4 Decision-Making Tools
Acquisition(section 4.2.1)
Pre-processing(section 4.2.3.2.1)
Movements
Detection(section 4.2.3.2.1)
K-means
Clustering(section 4.2.3.2.2)
KPIs(section 4.2.3.2.2)
Insights(section 5.4.1)
MC Model(section 4.2.3.2.2)
Segmentation*(section 4.2.3.2.1
& section 4.2.4)
Segmentation* = Binary Segmentation/
Semantic Segmentation
Figure 4.8: Followed pattern for preterm infants’ movements analysis.
4.2.3.2.1 Acquisition and Movements Detection Algorithm
As said, the system hardware architecture consists of an RGB-D sensor placed
perpendicularly above the infant, lying in a supine position on the crib, at
a distance of 70 cm, normally directed to the subject. The entire sensor is
composed by an RGB sensor and an infrared sensor, that provides a depth
map.
An acquisition framework, based on vision techniques, has been developed,
which can detect infant’s movements in real time. The main tasks of this
framework are:
• frame acquisition;
• noise filtering;
• infant’s segmentation;
• motion analysis.
An algorithm is proposed which can detect infant’s movements in real time
and it is based on vision techniques. Initially, the user selects a region of
interest in the GUI where it is possible to visualize the infant. This procedure
is used to filter the noise produced by the edges of the crib, creating zero
pixels in the depth image. After this stage, the process of acquiring depth
stream begins. The frames are stored in a vector so it is possible a subtraction
operation between the first and the last frame. The size of the vector has
been experimentally defined. Subsequently, an image filtering is performed:
all points that, at the time of the acquisition have zero value (pixel where
depth is not deifned) are filtered. After filtering, the image is segmented using
a threshold value, so as to further discriminate positive signals that indicate
70

4.2 Activities Monitoring Tools
moving of limbs, by false positives due to background noise. At this point,
the segmented image contains some blobs (movement blobs) that represent
an area of pixels where the variations of the depth values between subsequent
frames due to infant’s movements of the baby exceed a certain threshold. These
regions are identified and filtered depending on the area. The centres of mass
are extracted from the blobs and are tracked for the duration of the movement.
The detail of the algorithm is shown in Algorithm 1.
input : Depth image d(x, y)input : Number of frame delay Nfdelay
output: Vector of points points
while sensor.isOpen() doif dlist.size() > Nfdelay
thenddiff ← dlist.last()− dlist.first();dlist.pop back();dfil ← filtering(ddiff );dseg ← segmentation(dfil);contours← find contours(dseg);points← moments(contours);tracking(points);
elseskip;
enddlist.push front(d(x, y));
endAlgorithm 1: Movements Analysis algorithm.
4.2.3.2.2 Data processing
Later, this framework has been customised in order to permit extraction and
exportation of depth values and timestamps related to movement blobs [202].
After a preliminary analysis, the coordinates of the various instances of the
movement blobs (x, y) are plotted and it is easy to observe (from figure 4.9b)
that points are distributed in 4 well separated clusters; therefore, K-means
algorithm can be used as a clustering method, setting k equal to 4, i.e. the
number of the limbs being tracked.
K-means clustering [203] is a commonly used method to automatically par-
tition a dataset into k groups. It proceeds by selecting k initial cluster centres
and then iteratively refining them as follows:
1. Each instance di is assigned to its closest cluster centre.
2. Each cluster centre Cj is updated to be the mean of its constituent in-
stances.
71

Chapter 4 Decision-Making Tools
The algorithm converges when there is no further change in assignment of
instances to clusters.
K-means clustering provides in output a ground truth vector that associates
to each blob instance (i.e. to each blob timestamp) the cluster value assigned
to the corresponding limb:
• right leg (RL);
• left leg (LL);
• right arm (RA);
• left arm (LA);
as shown in figure 4.9.
(a) Depth frame.
0 50 100 150 200 250 300
0
50
100
150
200
right
(R)
left
(L)
left leg
(LL)
left arm
(LA)
right leg
(RL)
right arm
(RA)
(b) Clustering result.
Figure 4.9: In figure 4.9a a depth frame from RGB-D sensor is shown. Figure 4.9b isthe result of clustering process; it highlights 4 clusters that correspond tothe 4 infant’s limbs.
Considering that each timestamp instance can be associated to multiple clus-
ters because limbs can move simultaneously, this ground truth vector is used
as the input of an algorithm that generates the states vector.
Each limb can assume two different states, “in movement” or “not in move-
ment”, and, therefore, considering 4 limbs, the number of possible combinations
72

4.2 Activities Monitoring Tools
is equal to 24 = 16.
At the end of the algorithm in output there are the states vector that asso-
ciates to each timestamp of the recorded video session a state giving information
about which limbs are “in movement” in that moment (timestamp).
KPIs Extraction
Using these preprocessed data and movement blobs position data, the following
10 Key Performance Indicators (KPIs) are derived, each of which describes
different characteristics of the infant’s spontaneous movements, of great interest
for physicians and already used in other studies [187, 188].
M l% =
∑
i
tli
ttot(4.1)
where tli are the time instants during which the l limb (RL, LL, RA, LA) is
moving. M l%
is the percentage of the movement of each limb.
MG% =
∑
l
∑
i
tli
ttot(4.2)
is the general movement percentage of all the limbs over the time of a recording
session ttot.
Ms% =
∑
i
tsi
ttot(4.3)
where tsi are the time instants during which the s state (from 1 to 16) is active.
Ms%
is the percentage of movement of each state over the time of a recording
session ttot.
Mα% =
∑
i
tli
ttotα ∈ {L,R}, l ∈ α (4.4)
is the percentage of the movements of each body part, where α indicates,
respectively, the right side (R) and the left side (L) of infant’s body.
tl=
∑
i
tli
nl(4.5)
where nl indicates the number of movement blobs belonging to the same l limb,
which corresponds to the number of times l limb moves. tlis the average time
of movement of each limb expressed in seconds.
ts=
∑
i
tsi
ns(4.6)
73

Chapter 4 Decision-Making Tools
where ns indicates the number of movement blobs belonging to the same s
state, which corresponds to the number of times states are active. tsis the
average time of movement of each state expressed in seconds.
tα=
∑
i
tli
nαα ∈ {L,R}, l ∈ α (4.7)
where nα indicates the number of movement blobs belonging to α body side,
which corresponds to the number of times α body side moves. tαis the average
time of movement of each body side expressed in seconds.
vl =
∑
i
dpli
dtli
nl(4.8)
is the average velocity of the movements of each limb calculated on the basis of
the position data for the movement blobs of each limb and expressed in cm/s.
3D tangential velocities is calculated asdpl
i
dtli, where p is the 3D Euclidean
distance. Then, the instantaneous velocities is averaged over the number of
movement blobs belonging to the same limb, which is referred to as average
velocity of each limb.
al =
∑
i
dvli
dtli
nl(4.9)
is the average acceleration of the movements of each limb always calculated on
the basis of the position data for the movement blobs of each limb and expressed
in cm/s2. The instantaneous accelerations, obtained by deriving instantaneous
velocities, is averaged over the number of movement blobs belonging to the
same limb, which is referred to as average acceleration of each limb.
Vl=
4
3πr3 (4.10)
is the estimated 95% spheric volume of each limb expressed in m3, which cor-
responds to volume of the 95% bivariate confidence sphere, which is expected
to enclose approximately 95% of the 3D points inside each cluster.
In order to analyse the results of the experiment, a dataset has been built
and it is described in subsection 5.4.1.1. By using this dataset 10 KPIs are
calculated for each recording session, shown in table 5.5, that are discussed in
subsection 5.4.1.2.
Markov Chain Model
States vector elements value can range from 1 to 16 as shown in figure 4.10.
74

4.2 Activities Monitoring Tools
(a) State01
(b) State02
(c) State03
(d) State04
(e) State05
(f) State06
(g) State07
(h) State08
(i) State09
(j) State10
(k) State11
(l) State12
(m) State13
(n) State14
(o) State15
(p) State16
Figure 4.10: Different movements states in which infant can be in. Red rounds indi-cate the “in movement” limbs.
Since there is a temporal sequence of 16 possible combinations (states) in which
the infant can be in, infant’s movements sequence can be modelled as a series
of transitions states by using Markov Chain (MC).
MC is a natural formalism for modelling users’ behaviours and it is widely
used in many applications. The experimental results are modelled with a MC,
in particular using a transition matrix, in which the probabilities that infant
changes his state are recorded. For example, the transition from state 1 to
state 2 records the percentage of occurrences that infant has passed from state
1 to state 2. The MC model is formalised for measuring the movements change
in a preterm infant’s GMA between the rounds of the experiment under con-
sideration.
A MC is defined as M = (S, P ) and consists of states, i, in a finite set S of
size n, and an n− by − n transition matrix:
P = {pij |i, j ∈ S}
The transition matrix P is row stochastic, i.e. for all states, i,∑
j pij = 1, and
P is assumed to be irreducible and aperiodic, i.e. it exists m such that Pm > 0.
4.2.3.2.3 Extremities Tracking Algorithm
While previous data processing techniques are aimed at determining limb move-
ment indicators, the following application has been developed to focus on limb
extremities (hands and feet) and head tracking.
To get the infants’ extremities (hands, feet and head) the longest path ap-
proach is used. This approach expects to calculate the maximum distance from
the centre of mass of the infant on a portion of the image relative to a limb or
75


4.2 Activities Monitoring Tools
the one that is located at the maximum distance from the initial node.
To get the path is sufficient to back through the path from the final node
until the beginning memorising the identifications of the nodes which are along
the path. Applying the function of inverse enumeration, it is possible to get
the pixel coordinates that belong to the shortest path of the longer node.
The algorithm is recursively repeated for every portion of the image (feet,
hands and head) and for every frame. Finally, the path and the node with
maximum distance are drawn over each frame (see section 5.4).
To summarise, infants’ extremities detection algorithm follows these steps:
1. For each pixel inside the area of interest, performing of:
a. Labelling of the pixel through the enumeration function;
b. Creation of a vertex in the indexed graph with the label of the pixel;
2. Scanning from left to right and from top to bottom, for each pixel per-
forming of:
a. Computing of the Euclidean distance between the pixel and its
neighbour;
b. Creation of an arch between the nodes by a weight equals to the
computed distance;
3. Dijkstras algorithm application;
4. Scrolling of distances vector to find the node with the maximum distance;
5. Memorisation of crossed nodes identifier along the path by going back
through the path until the initial node;
6. Conversion of nodes identifier in absolute coordinates by applying inverse
labelling function;
7. Drawing on screen of paths and final points.
4.2.4 Infant Semantic Segmentation
Limitations of the proposed system are due to occlusions caused by external
interventions that occur when nurses or physicians put their hands between the
depth sensor and the infant to perform their activities.
Another problem may be caused when nurses or clinicians change the position
of the infant inside the crib. Such new arrangements may adversely affect
clustering goodness.
To avoid these issues, in a first moment only recording sessions in which there
are not interactions with nurses or clinicians were analysed, as it is possible to
77

Chapter 4 Decision-Making Tools
see later in section 5.4.1. Then to completely resolve these problems semantic
segmentation with Convolutional Neural Networks is used.
Semantic segmentation is understanding an image at pixel level i.e, each pixel
of the image has to be assigned to an object class. Apart from recognizing the
object, it includes the delineation of the boundaries of each object. Therefore,
unlike classification, dense pixel-wise predictions from models are needed.
4.2.4.1 Related Works
Semantic segmentation has several use cases such as detecting road signs [205],
detecting tumors [206], detecting medical instruments in operations [207], colon
crypts segmentation [208], land use and land cover classification [209]. Several
applications of segmentation in medicine are listed in [210].
Techniques used in this field, before deep learning took over computer vision,
were approaches like Texton Forest and Random Forest based classifiers. Then,
as happened with image classification and in many visual recognition tasks [211,
212], Convolutional Neural Networks (CNNs) have had enormous success on
segmentation problems [213, 214, 215].
On the argument, there are various semantic segmentation surveys such as
the works by Zhu et al. [216] and Garcia et al. [217], where existing methods
are summerised and classified, datasets and metrics are discussed, and design
choices for future research directions are provided.
4.2.4.2 Convolutional Neural Networks
In this section five different approaches taken from literature and based on
CNNs are presented in order to solve the problem of infants’ images segmen-
tation. Then, a novel architecture is described.
4.2.4.2.1 U-Nets
While developing a system for biomedical image segmentation, Ronneberger et
al. [1] proposed a fully convolutional neural network architecture (figure 4.12)
with 23 convolutional layers composed by a contracting path (left side) able
to capture context and a symmetric expanding path (right side) that enables
precise localization.
The contracting path follows the typical architecture of a convolutional net-
work. It consists of the repeated application of two 3x3 convolutions (unpadded
convolutions), each followed by a rectified linear unit (ReLU) and a 2x2 max
pooling operation with stride 2 for downsampling. At each downsampling step
they double the number of feature channels. Every step in the expansive path
consists of an upsampling of the feature map followed by a 2x2 convolution
78


Chapter 4 Decision-Making Tools
Figure 4.17: Illustration of the FractalNet architecture. Image taken from [5].
convolutional layer:
f1(z) = conv(z), (4.12)
and then successive fractals are defined recursively as:
fC+1(z) = [(fC ◦ fC)(z)]⊕ [conv(z)], (4.13)
where ◦ denotes composition, ⊕ is the join operator and C corresponds to
the number of columns, or width, of network fC(·).
If depth, defined to be the number of conv layers on the longest path between
input and output, scales as 2C−1, by using fC(·) as a building block and stacking
it with subsequent pooling layers B times, Larsson et al. yielded a total depth
of B · 2C−1, as in convolutional networks pooling layers are interspersed.
4.2.4.3 Adopted Metrics
To measure the performance of different segmentation approaches, several met-
rics are proposed in literature.
In this thesis two set of metrics are adopted: the first set measures how
much the system is able to separate the infant silhouette from the background,
while the second one measures the ability of the system to correctly classify
the silhouettes.
The first metric is the Jaccard index, also known as Intersection over Union
(IoU), which is used for comparing the similarity and diversity of sample sets.
82

4.2 Activities Monitoring Tools
It measures similarity between finite sample sets, and is defined as the size of
the intersection divided by the size of the union of the sample sets:
JaccardIndex =truepos
truepos + falsepos + falseneg, (4.14)
where the positive class is the infant silhouette and the negative is the back-
ground. It is averaged across all the test images.
The second metric is the Sørensen–Dice Index [222], also known as the Over-
lap Index, which is used for comparing the similarity of two samples. It is the
most used metric in semantic segmentation, and is computed as:
DiceIndex =2× truepos
2× truepos + falsepos + falseneg, (4.15)
where the positive class is always the infant silhouette and the negative is all
the rest.
The second set of metrics is composed by the average accuracy, precision,
recall and f1 score averaged across all the test images. Considering that the
ability to discriminate the background has been already measured, those met-
rics are evaluated just on the silhouette pixels. These metrics are computed
as:
Accuracy =truepos + trueneg
truepos + trueneg + falsepos + falseneg, (4.16)
Precision =truepos
truepos + falsepos, (4.17)
Recall =truepos
truepos + falseneg, (4.18)
F1score =2× Precision×Recall
Precision+Recall. (4.19)
83


Chapter 5
Results and discussion
5.1 SINC cloud-based healthcare architecture
evaluation
Table 5.1: Database Traffic.
TrafficValue per hour
(MByte)
Received 471Sent 832
Table 5.2: Database Connections.
Connections Value per hour
Max contemporary connections 578Failed attempts 0
Table 5.3: Query Statistics.
Queries Value per hour
select 386 kinsert 36update 27delete 8
Some initial studies have been conducted by evaluating system performance
in order to validate system usability. Some first results have been reached from
this system implementation regarding the integration of the patient monitor,
the bilirubinometer and the transcutaneous bilirubinometer.
85

Chapter 5 Results and discussion
They demonstrate that the solution provides good performance, by improv-
ing infants’ personal data availability by medical staff members and permitting
data sharing.
Table 5.1 and table 5.2 present, respectively, the database performance about
traffic and about connections, and table 5.3 shows the overall of the query
statistics.
The acquired results can be considered as indicative since the experiments
are conducted in a real case scenario where the specific service is utilized in
order to transmit and receive medical data.
As mentioned in chapter 3, a web platform is developed, where members of
the hospital staff can log in via mobile or stationary devices (e.g., workstation,
personal computer, tablet) through an authentication system (SSO Single Sign
On) in order to increase the security of shared data.
Each of them has a customised interface depending on their roles and on the
operations that they can do.
It is a highly configurable modular platform that can be easily adapted ac-
cording to needs to be managed. In fact, the platform is created considering the
possibility to expand it with new tools as new devices and new funcionalities
are integrated in the healthcare infrastructure.
The platform permits to browse personal data of the patient’s medical record
and enter new patient data.
Moreover, the tools described in section 3.3.2.1 and in Chapter 4 were im-
plemented and tested by physicians and nurses of the NICU of the Women’s
and Children’s Hospital “G.Salesi” of Ancona.
5.1.1 The web interface usability test
A web interface usability test was performed.
In a first phase, participants (6 physicians and 4 nurses) were invited to test
the system one after the other on a computer desktop in the NICU.
The SINC expert first introduced explained the purpose and procedure of
the testing. Participants were assured of their privacy and formal consent
was obtained. The hospital ward layout was adapted to ensure proper testing
and observation with no influences on comments and suggestions from other
member of the hospital staff. A short survey on participant familiarity with
technology was asked to every participant before the testing.
The participants was then given the website name and asked to explore
the web based SINC system on their own. The SINC expert sat behind the
participant and gave no instruction to the participant unless him or her could
not proceed after repeated efforts. The participant was also encouraged to
make comments during the navigation. Participant behaviours and comments
86

5.2 Bilirubin Tool
are recorded using observation metrics and detailed notes. The metrics included
20 tasks to complete on the website (10 on “Bilirubin Tool”, 5 on “Activities
Monitoring Tools” and 5 about the other tools), time needed on each task, and
if a task was performed without error, with error, or needed assistance.
Results showed a very good usability impact and some comments, mainly
on button positioning and icons meanings, are currently used for renew SINC
version. On average all usability test where performed with no suggestions.
Average time to complete a single task was of about 26 seconds. More that
85% of final usability surveys judged the web application with a very good
feeling.
The same set of tests was performed in a second phase using a tablet to
prove the effectiveness of the touch interface. Final results confirmed previous
results; suggestions were again mainly related to icons meanings and their
usability when no text is shown. In the survey 76% of users affirmed that a
tablet use is the preferred one in the future of medical data sharing systems.
5.2 Bilirubin Tool
Figure 5.1 shows the web interface of “Bilirubin Tool”. It is obviously connected
with data coming from EHR, which can be seen summarised at the top of the
web page in a pop-up window.
Physicians or nurses, once selected the involved infant and entered the tool for
the first time, are asked, if they have not already done during the registration
phase, to fill in the risk factors sheet (figure 5.2), both primary and secondary,
which are used by the algorithm described in section 4.1.4 to determine the
time intervals between one measurement and another and to decide the curve
of which GAs group to take into consideration for the comparison with the
measurements coming from the instruments. This time interval is projected
as a countdown on the top of the page and is associated with a reminder for
nurses to do the bilirubin measurement within the predetermined time or in a
warning that represents the need for an immediate measurement.
Once a TcB or a TSB measurement is made, the value is displayed in real
time on the PC monitor and it can be viewed with infant’s historical values of
bilirubin listed in a table or in a graphical way. Furthermore, it is automatically
compared with the corresponding guidelines curve value, depending on the
infant’s GA and PA. After the automatic comparison, the system displays again
a reminder, a warning or an alarm, if a therapy is required, i.e. phototherapy
or BET.
From the graphs it is possible to see the progress of bilirubin values over the
time in relation to the curves of the different monograms as shown in figure 5.1.
Of course, only the infant’s related GA curve is plotted, or that corresponding
87


Chapter 5 Results and discussion
step from which it came, and the value of bilirubin that brought the algorithm
in that step. In this way the time sequence of the steps of the algorithm is
available, which makes it easier to compare with the actual clinical practice.
In this way it was possible to perform a blind test to evaluate the algorithm
goodness. Physicians were asked to carry out their clinical practice in the
diagnosis and treatment of hyperbilirubinaemia, following as much as possible
the guidelines and noting their actions and decisions for 100 treated children,
without being aware of the decisions made at the same time by the algorithm.
These annotations were then compared with the time trend of the algorithm
described above to see the correspondence and discrepancies with the decisions
made by physicians.
It was found that in 75 out of 100 cases there were no discrepancies between
the decisions (reminders, warnings and alarms) taken by the algorithm and the
actual decisions taken by physicians.
The remaining 25 cases, where differences were found, were carefully analysed
with the help of expert physicians and it was found that:
- In 3 cases, the difference between the decisions taken is due to the fact
that in comparison between measured bilirubin values and nomograms,
in the case of intermediate PA values compared to those present in the
nomogram of the guidelines, the algorithm makes a linear interpolation
between the two extremes of the range within which the PA is included,
while the nurses make an approximate average between these limit values.
- In 15 cases, the difference between the decisions taken is due to the fact
that when comparing the value of the first measurement of TcB with
the related nomogram, the algorithm takes into account the nomogram
of figure 4.1, with in addition the rule that independently from PA if
TcB exceeds 11 mg/dL, the TSB is required, while nurses often do not
consider the nomogram but only apply the last rule of TSB required if
TcB is ≥ 11 mg/dL.
- In 2 cases jaundice was evident, so a measurement of TSB was imme-
diately carried out, while the algorithm, not being able to recognize the
symptoms, required a TcB.
- In 2 cases, the presence of loss of appetite and numbness in the child led
the doctor to request a TSB despite the fact that the size of the TcB
did not imply it (the values were however at the limit); in 3 cases the
presence of loss of appetite and numbness, together with the presence of a
strong weight loss and other factors led the doctor to start phototherapy
with values lower than the thresholds provided by the nomogram for
phototherapy (the values were in any case the values were as follows.
From these results it is evident that in some cases the algorithm is more
precise than human decisions, in other cases, however, some deficiencies of the
90

5.2 Bilirubin Tool
algorithm are evident, which concern in particular the presence of some symp-
toms of hyperbilirubinaemia that are noticed by the medical staff, while the
algorithm does not consider, such as the colour of the skin tending to yellow, the
lack of appetite and numbness. Therefore, consideration is already being given
to how these factors can be added to the decision algorithm. The secondary
risk factors considered are only familiarity with phototherapy, breastfeeding
and a weight loss ≥ 10%, while it is important to consider also the loss of
appetite, numbness and the colour of the skin. These indicators are difficult
to quantify, so they will initially be considered as binary values, then they can
be entered as scaled values, for example from 1 to 10. Moreover, for the time
being, secondary risk factors are only required at the beginning of the decision-
making process, while it is clear how important it is to update these factors
over time and take them into account in decisions. For example, weight loss is
taken into account when risk factors are recorded, in order to make the decision
about the time interval between measurements checks, but for how it has now
been structured the algorithm a progressive decrease in weight over time is not
considered, even if it can be useful for decision making.
5.2.2 Discussion
As already mentioned, the “Bilirubin Tool” interface and the decision-making
algorithm workflow (figure 4.6) have been designed and developed after several
interviews with 2 neonatologists and a nurse acting as domain experts.
Very often, unfortunately, it happens that CDSSs, even though they have the
potential to help and support physicians and nurses in daily clinical practice,
are not used by healthcare professionals, because they are not user-friendly
and, indeed, they are seen as tools that make them lose time and sometime as
something that remove physician’s importance or dignity at work. For these
reasons, involving medical staff in the application design phase was essential to
avoid further problems of acceptance of the proposed solution.
After the interviews with doctors the strategic knowledge is outlined in order
to delimit the aims of the system, which are to:
- promote and facilitate the use of the guidelines, as studies have demon-
strated that guidelines following helps to reduce ABE and kernicterus
cases;
- avoid over-precautionary behaviours that lead to an excessive use of pho-
totherapy, which in some cases is resulted to be an unnecessary treatment,
and, thus, lead to the NICU overcrowding, as this is the only hospital
ward where phototherapy is carried out;
- facilitate the exchange of information between the three hospital wards
where bilirubin measures are carried out (NICU, Neonatal Pathology, and
91

Chapter 5 Results and discussion
Pediatric Nursery) in order to create a single, standardised treatment
protocol;
- create a database to allow future studies to be conducted in order to
verify, for example, that following the guidelines actually reduces the
number of ABE and kernicterus.
The decision-making algorithm developed and described in section 4.1.4 con-
sists in an evidence-based CDSS which automates SIN guidelines, used as the
general rules and the knowledge base of the algorithm, but also adds physicians’
expertise at some critical points. In particular, it departs from the guidelines,
using instead the observations and experience of physicians, in the choice of
time intervals between checks and in the selection of the curve corresponding
to the previous GAs group in case of Rh isoimmunisation or ABO haemolytic
disease.
As a result, the algorithm provides reminders to remember the bilirubin
measurement, warnings to emphasize the need for an immediate measurement,
and alarms when a therapy (phototherapy or BET) is required.
A critical point of the algorithm is the inability to automatically recognise
some risk factors that are not present from the beginning but may appear over
time, e.g., loss of appetite or numbness. For this reason, the doctor is given
the possibility to manually vary the frequency of the controls. Even the skin
colour information cannot be automatically entered as an algorithm parameter.
If jaundice begins to show obvious symptoms, such as yellow skin colour, the
doctor immediately performs a TSB measurement. These parameters will be
inserted in the update version of the algorithm, always giving the physician the
possibility to do it manually.
The strength of the proposed EB-CDSS lies in the simultaneous exploita-
tion of both a physical infrastructure that allows the interconnection of the
instrumentation used to make bilirubin measurements that in this way are au-
tomatically loaded on the SINC DB and directly visible from the algorithm,
completely eliminating the manual collecting laborious work and the resulting
possibility of typing and comparison errors, and a web-based platform where
there are other tools in addition to Bilirubin Tool, so the system can read di-
rectly from the DB some parameters used by the algorithm, e.g., GA, PA, birth
weight, current weight. This leads it to be better than any other system pro-
posed in section 4.1.1, where manual entries are provided not only for bilirubin
measurements but also for values related to GA, to PA and so on.
In this way, all the objectives presented in section 4.1.3 have been achieved:
the system use and process data collected in a single DB from all the instru-
ments used for the measurement of serum and transcutaneous bilirubin that
are located in the three hospital wards, namely 2 sieric bilirubinometers and 3
transcutaneous ones, in order extract useful information on jaundice diagnosis,
92

5.3 Respiration Tool
to facilitate the exchange of information between different wards and to stan-
dardise the treatment protocols of neonatal jaundice, by creating a valid model
for all the birthplaces of Marche Region.
Another advantage introduced by the system is the reduction of the waiting
time necessary for the doctor to accept the request for the start of the pho-
totherapy treatment. While before the nurse had to seek the doctor to receive
the consent, now the doctor can accept the request by answering the email that
is generated by the system when the step of “phototherapy start request” is
reached.
Finally, when the algorithm reaches the last step of “hospital discharge”, a
report in pdf format is automatically generated, which can be used as medical
report to be delivered to the parents of patients, to be entered in the ward
medical record and also sent to the regional EHR. In any case, if the infant
remains hospitalized for reasons other than hyperbilirubinemia, routine TcB
measurements are continued at regular intervals, which are saved on SINC
DBaaS. They are displayed on the Bilirubin Tool interface in the temporal
trend of historical bilirubin values and can also be saved in the medical report.
In addition, even after the hospital discharge, the system provides the pos-
sibility of entering the scheduled follow-up data. Follow-up measurements can
be taken at the “G. Salesi” Hospital or in peripheral hospitals, which are closer
to the parents’ residence. Up until now, when parents went to peripheral hospi-
tals, the bilirubin measurement value was lost, while now there is the possibility
of setting up an account for peripheral hospitals to allow storage of the new
measured bilirubin value. In the same way it will be possible to save the biliru-
bin values measured by family paediatricians in further follow-ups: it will be
sufficient to provide them with an account where they can enter such data.
In conclusion, a web-based decision support tool based on clinical practice
guideline was developed and implemented. The tool revealed rapid acceptance,
and its use was associated with increased observance of SIN clinical guidelines.
Physician evaluations indicated that “Bilirubin Tool” application made the SIN
guidelines look easier to use, more practical, and more significant for physicians
and nurses, which is a particularly important goal to reach.
5.3 Respiration Tool
An application with a user-friendly interface was realised, which physicians and
nurses of the hospital ward can easily use.
Entering the Respiration Tool, they find a graphical interface where they
can select the measurement points on the thoraco-abdominal area of the infant
(figure 5.3) and then in real time the system displays the path of temporal
depth measured by RGB-D camera from which the respiratory signal and the
93


5.3 Respiration Tool
0 1 2 3 4 5 6 7 8 9 10−1
−0.8
−0.6
−0.4
−0.2
0
0.2
0.4
0.6
0.8
1
Time [s]
No
rma
lize
d a
mp
litu
de
Figure 5.4: Example of respiration signal measured from RGB-D camera (blu line)and of the filtered signal (red line) on a time window of 10s.
0.8 0.9 1 1.1 1.2 1.3
0.8
0.9
1
1.1
1.2
1.3
RRmean
RGB−D camera [s]
RR
mean
card
iom
on
ito
r [s
]
Figure 5.5: Scatter plot and regression line of RR mean values.
Table 5.4: Mean RR values measured by RGB-D camera and patient monitor.
Patient ID DeviceMean RR values (s)
Test 1 Test 2 Test 3 Test 4 Test 5
1Patient Monitor 0.98 0.91 0.92 0.88 0.96RGB-D Camera 0.96 0.94 0.91 0.88 0.95
2Patient Monitor 1.17 1.33 1.15 1.03 0.99RGB-D Camera 1.21 1.18 1.18 1.02 0.96
3Patient Monitor 0.93 0.94 0.79 0.74 0.88RGB-D Camera 0.95 0.95 0.79 0.82 0.91
This comparison is only made possible by the fact that the various instru-
ments are all integrated into the same infrastructure.
95

Chapter 5 Results and discussion
The scatter plot and the regression line, reported in figure 5.5, show a good
correlation between the measured data with respect to the data derived from
the reference instrument. The agreement between the two methods is also
confirmed by the Pearson’s correlation coefficient that is equal to 0.95.
Table 5.4 reports the mean values of the RR period measured both from the
RGB-D sensor and the patient monitor, for each test and for each patient.
The breathing rate (breaths per minute), mentioned in section 4.2.2, can be
easily inferred from the RR period through this simple formula:
BR(bpm) =60
RRperiod(s). (5.1)
Comparing these values with the RDS thresholds, it appears that 2 of the
infants under examination had a high respiratory rate, therefore, to be kept
under control.
5.3.2 Discussion
The work was mainly focused on the basic hardware and software architecture
of the system, including the web interface, and only preliminary tests were
conducted in the experimental phase.
Though, experimental results showed that the proposed method can correctly
measure the respiratory rate in preterm infants, compared to gold standard,
and it can activate an alarm signal when respiratory rate values go out of the
physiological range, especially when the respiratory rate is higher than normal
values.
The RRperiod, in fact, is instantly compared with threshold value, that dis-
criminates between the disease absence and its presence.
In the future a machine learning approach will be used to classify infants’
in “healthy” and “at risk” classes, for what concerns RDS. This approach will
involve information about thoraco-abdominal balance (section 4.2.2).
In fact, the possibility to select the measurement points on the thoraco-
abdominal area from the web interface, described above, allows to study the
displacement of the chest and abdomen in a separate way and so to see if there
is the wave movement typical of RDS disease.
5.4 Movement Tool
A similar framework is realised for the “Movement Tool” interface (figure 5.6),
that permits the real-time visual monitoring of the infant during the acquisition.
It displays in real time the RGB stream video on the left and the real-time
“colour-map” of the infant movements on the right.
96


Chapter 5 Results and discussion
makes slower movements (vRA = 13.98 cm/s, yellow-highlighted) than other
limbs.
This is confirmed also by al KPI, greater for LA and lower for RA (aRL =
100, 71 cm/s2, red-highlighted and aRA = 57, 04 cm/s2, yellow-highlighted).
From VlKPI information about movements amplitude can be obtained:
legs, as expected, cover larger volumes (red-highlighted) than the arms as they
perform larger movements.
Figure 5.11 shows the activation of each state s during the registration period.
From this figure it is clear that infant is stationary for most of the time (state
1) and that remains completely stationary for three long periods of time, as
already highlighted in table 5.5. When the infant is moving (states 2 to 16),
the state, in which he is in, varies very quickly and for this reason it is difficult
to view the state changes in the image.
102

5.4
Movem
entTool
Table 5.5: Data results and KPIs.
RS MG
%M
l
%M
α
%tl [s] t
α [s] vl [cm/s] a
l[
cm/s2]
Vl[
m3]
RL LL RA LA R L RL LL RA LA R L RL LL RA LA RL LL RA LA RL LL RA LA
01 44.86 33.73 23.22 28.80 18.13 40.37 28.55 0.98 0.68 0.65 0.63 2.38 1.00 12.24 32.06 20.70 41.92 39.49 151.25 81.96 217.85 0.16 0.23 0.15 0.3002 17.41 4.76 7.31 12.12 7.85 14.01 11.76 0.44 0.65 0.89 0.50 1.00 0.84 24.32 7.76 18.41 27.10 129.82 21.36 74.06 87.71 0.24 0.20 0.18 0.1603 10.67 3.98 5.49 4.90 5.79 7.35 8.55 0.45 0.67 0.76 0.73 0.68 1.49 55.74 24.42 10.16 31.05 319.63 91.35 26.83 81.42 0.83 0.24 0.19 0.1804 5.14 2.05 2.33 2.19 1.92 4.21 2.77 0.74 1.35 0.70 0.62 0.72 2.00 114.98 8.28 7.01 32.03 561.68 27.82 15.96 154.97 0.83 0.18 0.14 0.2205 80.34 28.70 34.89 41.31 49.97 56.74 66.45 0.54 0.54 0.60 0.68 0.80 1.11 26.27 37.89 16.13 32.40 96.59 184.84 64.33 118.84 0.26 0.24 0.18 0.1906 14.88 7.49 7.57 3.07 6.43 8.88 11.81 0.85 0.80 0.38 0.80 0.78 1.11 13.75 13.79 7.01 24.49 31.34 65.13 24.40 103.53 0.18 0.14 0.22 0.2207 1.27 0.72 0.59 0.27 0.44 0.83 0.77 0.43 0.59 0.80 1.33 0.50 1.15 82.25 12.98 10.33 29.32 587.88 36.94 28.99 86.98 0.32 0.26 0.23 0.2308 0 0 0 0 0 0 0 - - - - - - - - - - - - - - - - - -09 19.37 5.42 6.86 6.30 7.49 10.16 13.25 0.37 0.79 0.55 0.40 0.76 0.80 43.53 21.81 61.80 75.47 182.53 111.65 254.24 373.05 0.30 0.17 0.33 0.3310 0 0 0 0 0 0 0 - - - - - - - - - - - - - - - - - -11 0 0 0 0 0 0 0 - - - - - - - - - - - - - - - - - -12 0 0 0 0 0 0 0 - - - - - - - - - - - - - - - - - -13 1.57 0.34 0.53 1.04 0.96 1.12 1.23 0.50 0.52 0.78 2.87 1.11 1.83 8.93 7.13 8.29 7.59 25.85 31.52 27.25 10.84 0.23 0.26 0.13 0.1114 5.81 2.31 1.69 2.50 2.22 4.11 3.42 0.48 0.33 0.81 0.46 1.00 0.50 59.58 59.93 28.11 11.17 283.98 299.34 125.53 42.73 0.35 0.32 0.21 0.1515 3.17 1.15 1.06 0.98 1.86 1.96 2.48 0.57 0.35 0.49 0.55 0.73 1.06 11.07 78.08 9.31 20.88 24.37 272.43 32.90 46.44 0.25 0.34 0.16 0.2216 8.99 1.36 4.25 3.78 4.63 4.64 7.53 0.43 0.64 0.54 0.66 0.60 1.07 7.81 89.04 24.82 65.34 31.38 400.63 79.90 272.34 0.15 0.23 0.23 0.3217 8.01 3.75 3.49 2.00 3.43 4.67 5.75 0.47 0.42 0.44 0.75 0.67 0.97 40.65 50.51 79.91 28.17 152.73 187.25 455.00 75.96 0.55 0.26 0.32 0.1818 5.54 0.90 3.38 2.33 1.00 3.23 3.87 0.52 0.81 0.75 0.36 0.72 1.24 57.42 30.02 8.29 5.47 327.20 167.98 19.46 20.11 0.13 0.24 0.25 0.2619 57.79 26.06 38.37 37.88 27.75 46.41 48.43 0.50 0.62 0.74 0.48 1.15 1.10 10.47 29.97 16.87 8.46 38.00 145.92 57.97 29.34 0.15 0.27 0.23 0.1320 4.30 1.09 1.83 0.38 1.55 1.36 3.07 0.44 0.87 0.53 0.49 0.64 1.24 2.83 15.73 4.13 8.32 8.35 23.81 12.70 38.22 0.11 0.31 0.14 0.2221 90.00 46.60 58.75 31.50 50.39 59.40 80.25 0.50 0.63 0.45 0.72 0.75 1.65 19.83 13.25 9.61 16.07 91.37 50.61 33.03 70.80 0.24 0.21 0.15 0.1722 86.45 25.81 50.50 42.88 39.30 56.26 71.12 0.51 0.76 0.55 0.69 0.77 1.25 8.01 15.83 24.24 15.54 30.27 55.17 98.96 63.74 0.14 0.32 0.37 0.1823 93.36 57.20 26.52 41.93 49.04 76.56 63.61 0.72 0.46 0.61 0.57 1.19 0.80 18.79 9.27 9.86 13.09 73.28 38.86 33.85 36.27 0.33 0.14 0.16 0.2024 99.45 75.82 59.03 76.68 55.25 95.53 82.38 0.79 0.60 0.74 0.53 2.41 1.02 16.05 9.91 14.92 16.80 62.13 35.41 66.02 62.97 0.21 0.14 0.16 0.2225 93.57 54.26 43.75 51.45 66.61 77.39 78.38 0.64 0.52 0.58 0.75 1.08 1.35 17.57 16.26 9.94 16.62 67.55 59.37 40.36 70.22 0.28 0.27 0.15 0.1526 14.11 10.89 7.66 7.15 7.59 12.80 11.26 0.77 0.78 0.60 0.49 1.51 1.10 9.32 38.16 9.46 30.45 32.24 191.09 28.59 130.17 0.15 0.32 0.16 0.2527 99.46 58.15 49.00 68.74 76.69 88.70 88.30 0.68 0.56 0.70 0.88 1.41 1.45 13.38 16.95 13.97 14.92 46.98 74.50 54.91 56.06 0.30 0.25 0.15 0.1628 99.31 65.68 54.54 56.04 66.81 86.08 85.51 0.73 0.62 0.58 0.75 1.53 1.39 18.46 17.11 11.13 10.60 72.30 61.51 40.49 39.15 0.22 0.21 0.14 0.1529 63.83 29.94 42.21 35.50 48.82 45.68 59.31 0.48 0.64 0.51 0.72 0.74 1.87 8.02 18.09 7.36 21.22 30.31 67.52 27.82 85.90 0.13 0.21 0.15 0.2930 61.15 30.27 17.32 35.64 17.66 51.37 28.07 0.51 0.52 0.73 0.49 1.40 0.79 12.64 13.73 11.79 10.66 42.93 50.41 38.30 44.65 0.39 0.18 0.27 0.1431 40.42 5.07 19.32 23.50 11.42 26.28 26.07 0.32 0.56 0.68 0.62 0.67 0.84 10.53 17.44 15.15 13.59 49.04 58.93 66.52 45.18 0.12 0.31 0.67 0.1832 0 0 0 0 0 0 0 - - - - - - - - - - - - - - - - - -33 0 0 0 0 0 0 0 - - - - - - - - - - - - - - - - - -34 28.65 14.29 11.75 9.13 9.66 19.60 18.48 0.61 0.61 0.51 0.44 0.81 0.82 8.71 10.37 12.07 15.11 27.29 40.34 46.09 48.22 0.16 0.33 0.40 0.1435 35.87 23.96 8.48 1.83 12.77 24.52 19.43 1.18 0.49 0.23 1.05 1.23 1.00 17.34 7.74 8.43 11.59 58.18 23.17 39.95 29.56 0.37 0.17 0.15 0.17
AVG 34.14 17.76 16.91 18.05 18.67 26.58 26.62 0.49 0.52 0.51 0.60 0.85 0.97 21.44 20.67 13.98 18.73 100.71 86.46 57.04 72.66 0.23 0.20 0.18 0.17
103


5.4 Movement Tool
Other elements (not along the diagonal) with significantly higher values are
due to the addition in the next state of the movement of a single other limb
in addition to those already moved in the previous state. An example of these
cases can be seen in element P (4, 8), that describes the probability of a tran-
sition from state 4, in which infant moves legs, to state 8, in which he moves
legs and RA.
The transition matrix is calculated for each recording session and then the
diagonal element values are plotted for each session in figure 5.13. In this
graph, there are three areas where the probability of remaining on the same
state decreases for all the diagonal elements except that one related to the
state 1 (which corresponds to infant inactivity). These areas correspond with
recording sessions mentioned before, in which the infant is stationary (8, 10−12,
32− 33). Confirming what has just been said, during the recording sessions in
which he moves, the probability of all the diagonal elements increases except
inactivity probability (state 1), that decreases.
Figure 5.14 shows different models of MC transition matrix during several
time periods of the day. Studying the evolution of the motor behaviour of the
infants will be possible by analysing such models over time.
Thereby, models can be used to study infants movements, their behaviour
over time and in particular the sequences of movements.
The sequence in which infants move their limbs is predictive of certain
pathologies. For example, the simultaneous movement of all limbs is associated
with CSGMs, while the movement of one limb after the other is associated with
normal movement.
Thus, the classification of infants based on these CM transiton matrix models
could be helpful in classifying them in “healthy” and “at risk” classes.
105

Chapter 5 Results and discussion
1 2 3 4 5 6 7 8 9 10 11 12 13 14 15 16
1
2
3
4
5
6
7
8
9
10
11
12
13
14
15
16
0.1
0.2
0.3
0.4
0.5
0.6
0.7
0.8
0.9
(a) Transition matrix during the morning.
1 2 3 4 5 6 7 8 9 10 11 12 13 14 15 16
1
2
3
4
5
6
7
8
9
10
11
12
13
14
15
16
0.1
0.2
0.3
0.4
0.5
0.6
0.7
0.8
0.9
(b) Transition matrix after a meal.
1 2 3 4 5 6 7 8 9 10 11 12 13 14 15 16
1
2
3
4
5
6
7
8
9
10
11
12
13
14
15
16
0.1
0.2
0.3
0.4
0.5
0.6
0.7
0.8
0.9
(c) Transition matrix during the evening.
Figure 5.14: Transition matrix P of infant’s movements during different periods ofthe day.
106

5.4 Movement Tool
5.4.2 Discussion
In this subsection discussion and some possible future developments are pre-
sented.
In this section, a novel video-based system for preterm infant’s movement
detection and analysis is presented by using a non-invasive depth sensor placed
over the infant lying on the infant warmer.
An algorithm is developed, able to detect infant’s movements in real-time
from depth stream and to extract some important features from the sequence
of depth images collected by RGB-D sensor.
Some important indicators are derived, which can be used by clinicians to
objectively study infant’s movements during his development.
By using the information included in KPIs it will be possible to quantify
the change in infant’s limbs movements during the time and the improvements
after physiotherapy, to observe the presence of the physiological transition from
WMs to FMs, the absence of FMs or the presence of abnormal movements.
KPIs give information about movements percentage, velocity, acceleration,
amplitude and volume, about activities sequences and symmetries in move-
ment.
E.g., Ms%
KPI, when s = 16, tells about the percentage time during which
the infant moves all the limbs simultaneously and it can give information about
the presence of abnormal movements as CSGMs.
Recent studies indicate that infants with an abnormal persistence of GMs
between the different stages of transformation (Writhing and Fidgety) present
a high risk (70%-80%) of developing CP. Some studies report that the per-
manent presence of abnormal GMs in the fidgety phase, which implies a total
absence of elegance and complexity of movements, predicts a CP with an ac-
curacy between 85% and 98%. More recent studies indicate that infants with
abnormal GMs in the fidgety phase who do not develop CP may develop other
problems, such as minor neurological disorders, attentive deficits, hyperactivity,
aggressive behaviour or cognitive problems [224].
The work is mainly focused on the statistical method reporting only prelim-
inary test results, but, currently, more extensive studies with more infants are
in process.
The project, indeed, opens to future evolutions in the direction of infants’
classification in “healthy” and “at risk” classes. Based on this set of parameters,
the aim is to develop scores to resemble GMA as a support for clinician in CP
diagnosis, in order to increase the number of early detections of movement
disorders, so that treatment can be started as soon as possible.
Limitations of the proposed system are due to occlusions caused by external
interventions that occur when nurses or physicians put their hands between the
107

Chapter 5 Results and discussion
depth sensor and the infant to perform their activities.
Another problem may be caused when nurses or clinicians change the position
of the infant inside the crib. Such new arrangements may adversely affect
clustering goodness.
To avoid these issues, only recording sessions in which there are not inter-
actions with nurses or clinicians are considered in the data processing phase.
Then, to completely resolve these problems semantic segmentation with Con-
volutional Neural Networks is used improving the quality of limbs tracking.
Results of image semantic segmentation approach to extract preterm infant’s
silhouette from depth image are presented in next section.
5.5 Semantic Segmentation
This section presents the results obtained from the implementation of the dif-
ferent CNNs architectures described in subsection 4.2.4.
For training neural networks the dataset, generally, is splitted into three
parts: training, validation, and test. When training the neural networks, here
proposed, a common approach was followed in order to better highlight compar-
isons between the different architectures. Thus, in the following experiments,
70%, 10% and 20% of dataset are chosen respectively for train, test and vali-
dation.
Each CNN architecture was trained with two types of depth images, respec-
tively of 16 bit (original depth image) and 8 bit (scaled depth image), since
the dataset is composed of tuples consisting of three images for each frame,
the original depth image, the scaled depth image and the ground truth, as
explained in the next paragraph.
An update rule based on iterations over training was used to learn model
parameters, and the best model was generally chosen by evaluating a secondary
stopping criterion on a held out validation set. Once this is complete, the best
model was also evaluated over the never before seen test set. In addition,
several combinations of hyperparameters were tested: a learning rate of 0.001
and an Adam optimization algorithm were used.
5.5.1 PIDS (Preterm Infants’ Depth Silhouette) Dataset
In order to locate the silhouette of preterm infants lying on the crib under the
RGB-D sensor placed perpendicularly above the infant warmer at a distance of
70cm, normally directed to the subject, by the use of semantic segmentation,
PIDS (Preterm Infants’ Depth Silhouette) Dataset is built.
The sensor used captures depth and colour images, both with dimensions
of 320x240 pixels, at a rate up to approximately 30 fps and illuminates the
108

5.5 Semantic Segmentation
scene/objects with structured light based on infrared patterns.
Subjects under acquisition are 9 preterm infants hospitalised in the NICU of
the Women’s and Children’s Hospital “G.Salesi” of Ancona (Italy). Their GA
at the time of acquisition ranged from 32 and 34 weeks, with a mean age of
33+3 weeks and the weight is between 1400 g and 1800 g, as shown in table 5.6.
Table 5.6: PIDS Dataset infants characteristics (Gestational Age and Weight).
ID AcquisitionGestational Age
(weeks+days)Weight
(g)
1 32+3 14202 33+3 16183 34+2 17624 37+1 20505 35+4 18006 34+4 16257 36+5 19708 36+3 189011 35+5 177016 33+2 1655
Mean 34+6 1756
As mentioned above the dataset is composed of tuples, instances identified
by a unique timestamp, and each of them consists of three images:
• a 16 bit depth image, the original image acquired by depth sensor;
• a 8 bit depth image, obtained after a preprocessing phase aimed at scal-
ing the original corresponding 16 bit depth one in order to obtain an
image where the infant silhouette is highlighted by improving contrast
and brightness;
• the corresponding ground truth, that consists of the infant silhouette
(white) on an homogeneous background (black).
The ground truth was manually labelled by 6 human annotators, with the
help of the timestamp corresponding RGB image, that has been acquired for
the sole purpose of facilitating the labelling and thus the creation of the dataset,
but that is not part of the dataset itself.
Figure 5.15 shows an example of a dataset instance that includes the three
images described above.
The dataset is divided into two folders:
• positive, which contains 1710 positive instances, i. e. 1710 tuples of the
3 images above described in which the infant is in the crib ( 5.15);
• negative, which contains 1800 negative instances, i. e. 1800 tuples of
the 3 images above described in which the infant is not in the crib and
therefore it is not the infant’s silhouette in the image. Here the ground
109

Chapter 5 Results and discussion
(a) 16 bit depth image (b) 8 bit depth image (c) Ground truth
Figure 5.15: Example of a PIDS Dataset positive instance. It consists of 16 bit origi-nal depth image (5.15a), 8 bit scaled depth image (5.15b) and the corre-sponding ground truth (5.15c).
truth consists of a completely black mask ( 5.16).
(a) 16 bit depth image (b) 8 bit depth image (c) Ground truth
Figure 5.16: Example of a PIDS Dataset negative instance. It consists of 3 imageswhere the infant is not present in the frame: a 16 bit original depth image(5.16a), a 8 bit scaled depth image (5.16b) and the corresponding groundtruth (5.16c), a completely black mask.
Positive instances also include the so-called partial instances (5.17) where
the infant is only partially visible because it is partially framed, because it is
covered by the hands of health workers or because it is partially covered by a
sheet. In this case the acquired RGB image (5.17d) was very useful for correctly
labelling the corresponding depth image.
(a) 16-bit depthimage
(b) 8-bit depthimage
(c) Ground truth (d) RGB image
Figure 5.17: Example of a PIDS Dataset partial instance. It consists of 3 imageswhere the infant is partially visible in the frame: a 16 bit original depthimage (5.17a), a 8 bit scaled depth image (5.17b) and the correspondingground truth (5.17c). Figure 5.17d is the corresponding RGB image usedto facilitate ground truth annotation.
110

5.5 Semantic Segmentation
The infant is generally in a central and horizontal position with respect to the
framing, but sometimes when nurses change sheets, diapers or during meals,
the infant is moved to a vertical or lateral position with respect to the framing.
The same happens when the depth camera is moved. For this reason, these
special cases have also been included in the dataset (figures 5.18, 5.19).
(a) 16 bit depth image (b) 8 bit depth image (c) Ground truth
Figure 5.18: Example of a PIDS Dataset decentralised infant’s instance.
(a) 16 bit depth image (b) 8 bit depth image (c) Ground truth
Figure 5.19: Example of a PIDS Dataset vertically positioned infant’s instance.
The total 17 acquisition sessions (see table 5.7) forming PIDS Dataset have
been performed over a 28-months period of time. Acquisitions were made in
an indoor scenario (NICU) where the illumination conditions are not constant:
some acquisitions were made with natural light entering the windows, others
with artificial light. Moreover, natural light varies in function of the different
hours of the day and it also depends on weather conditions.
The use of depth sensor makes it possible to make acquisitions even during
the night when lights are very low. It is evident from figure 5.20d that it would
be difficult to perform segmentation using RGB images, and this is not one of
the worst cases.
111

Chapter 5 Results and discussion
(a) 16 bit depthimage
(b) 8 bit depthimage
(c) Ground truth (d) RGB image
Figure 5.20: Example of a PIDS Dataset instance acquired when lights are very low.
Table 5.7: PIDS Dataset acquisition sessions and relative instances.
ID Acquisition# of PositiveInstances
# of NegativeInstances
1 149 -2 274 -3 734 -4 34 -5 46 -6 300 -7 112 -8 29 -9 - 38310 - 53711 25 -12 - 7913 - 46814 - 6315 - 6616 7 -17 - 204
TOT 1710 1800
5.5.2 Data Analysis Results
5.5.2.1 Quantitative Evaluation
The performances of the different CNNs architecures described in 4.2.4.2 are
evaluated on the dataset splitted in train, test and validation sets, respectively
formed by the 70%, 10% and 20% of entire dataset, as said above.
Each CNN architecture was trained with the two types of depth images of
each dataset instance, the 16 bit and the 8 bit image.
When training the neural networks, a common approach was followed in order
to better highlight comparisons between the different architectures. Thus, each
network was trained with a learning process of 200 epochs, which approximately
corresponds to the achievement of convergence, as is possible to visually see
112


Chapter 5 Results and discussion
Table 5.9: Semantic segmentation results of different ConvNet architectures.
Net Bit Accuracy Precision Recall F1-Score
U-Net [1]8 0.984514 0.926640 0.951217 0.90451816 0.984581 0.928222 0.951852 0.907175
U-Net2 [2]8 0.986978 0.966541 0.965419 0.96782016 0.987042 0.967384 0.966019 0.968877
U-Net38 0.988792 0.989633 0.988389 0.99089916 0.988799 0.988496 0.987339 0.989663
SegNet [3]8 0.987432 0.965309 0.962212 0.96849316 0.987445 0.965120 0.962161 0.968151
ResNet [4]8 0.988122 0.974488 0.972054 0.97695716 0.988048 0.973575 0.971580 0.975608
FractalNet [5]8 0.988575 0.989374 0.986805 0.99201516 0.988583 0.990059 0.988008 0.992142
of the FractalNet is also very good, as in the 8-bit version it obtains the best
results on validation test and in the 16-bit version it is second only to the
U-Net3 on train set results. Immediately after there is the ResNet.
In table 5.9 are reported the results in terms of accuracy, precision, recall
and F1-score.
Also from this table it is possible to see that in general the best network is
the 8-bit version U-Net3, which has the highest values of precision and recall
compared to all other networks and very high values of accuracy and F1-score.
The highest accuracy value belongs to the 16-bit version U-Net3, while that of
F1-score to the 16-bit version of the FractalNet, which is still performing well
and, as before, is followed by the ResNet in terms of results.
In conclusion, considering all the metrics as a whole, it is possible to say
that the best CNN architecture for PIDS Dataset is the 8-bit version of U-
Net3, followed by FractalNet and ResNet, i. e. the deepest networks.
In figure 5.21 is shown for each CNN the trend of Jaccard index during the fit
process. It is possible to see that the FractalNet and the ResNet immediately
reach high values after a few epochs. Instead, the U-Net3 increases its value
more slowly, but converges at high values as the FractalNet. On the contrary,
it is easy to see that the performances of the classic U-Net are below all other
networks.
In a similar way, in table 5.10, for each network is shown the Jaccard index
trend along the 200 epochs.
114

5.5 Semantic Segmentation
5.5.2.2 Qualitative Evaluation
The segmented images can also be evaluated from a qualitative point of view.
In fact, a good annotation is not just an annotation that reaches high scores on
all the metrics, but above all an annotation that looks nice and closely matches
the borders of infant sihlouettes.
The achievement of this visual matching is not captured by the discussed
metrics. Thus, the segmented images can be qualitatively evaluated in order
to see which of the various networks is more prone to reach the objective.
In this light, in table 5.11 the predicted images obtained from the various
networks are reported, compared with the ground truth at the top. As a
first thing, it is clearly visible that the classic U-Net achieves not very good
performances, as resulted from the analysis of the metrics. This is justified by
the nature of the network born with the aim of segmenting cells into biomedical
images, with shapes that are more compact, circular and less articulated than
an infant’s silhouette.
The ResNet reaches good results on metrics, but from visual inspection it is
visible that the annotations have a not so high quality, as the SegNet.
Finally, also from qualitative observations, it is clear that the best CNN is the
U-Net3 (8 and 16-bit versions) which manages to fairly faithfully reproduce the
infant’s silhouette. The net partly continues to maintain this tendency towards
rounding that allows it to blunt the figure and make it more smoothed and less
fragmented than the FractalNet predicted image and so more similar to the
label.
5.5.3 Discussion
In this subsection some important advantages and limitations of semantic seg-
mentation approach are highlighted.
A novel dataset containing 10530 depth images has been created, of which
a third are 16 bit depth images, the original images acquired by depth sensor,
a third are 8 bit depth images, obtained after a pre-processing phase aimed at
scaling the original corresponding 16 bit depth ones in order to obtain an image
where the infant silhouette is highlighted, and the remaining third consists of
ground truth corresponding images. It contains 1710 positive triplets in which
the infant is in the crib and 1800 negative triplets in which the infant is not in
the crib.
6 different CNNs have been tested on this new dataset with good quantitative
and qualitative results. The use of CNNs greatly improves the detection of the
infant’s silhouette with respect to simple binary segmentation.
Experimental results demonstrate the effectiveness and suitability of the new
implemented U-Net, obtained by modifying the classic U-Net, that achieves
115

Chapter 5 Results and discussion
high accuracy and performs better than all other tested networks.
Semantic segmentation has been used to solve the problem of occlusions that
occur by healthcare staff members: hands that are placed between the sensor
and the infant during clinical practice, if at the height of the infant, can, in
fact, be exchanged for the infant himself, when threshold segmentation is used.
Hand movements can thus be mistaken for infant’s movements.
To avoid this issue, initially, the time interval of the acquisition studied
in order to analyse data processing was divided in recording sessions of 300
seconds each one, which permits to discard those records in which there are
interactions with a nurse or a clinician.
Using semantic segmentation it will be possible to apply the algorithm for
motion detection without interruption, even during procedures by nurses and
doctors.
The high computational calculation due to the use of neural networks, made
it necessary to use a PC with higher characteristics than those of the Cu-
bieboard used in the architecture described above. Networks were trained on
a PC desktop with a NVIDIA GTX 970 GPU, but also for the application of
the real-time prediction model during the acquisition it was necessary to use
something more powerful than the Cubieboard. In particular, the Asus Vivo-
Mini PC UN42-M026M was used in order to try to keep as much as possible
the characteristics of the system not to be bulky.
116


Chapter 5 Results and discussion
Table 5.11: Qualitative result of prediction.
8-bit 16-bit Label
U-Net [1]
U-Net2 [2]
U-Net3
SegNet [3]
ResNet [4]
FractalNet [5]
118

Chapter 6
Conclusions and Future Works
6.1 Discussion
This thesis has presented an efficient cloud-based health infrastructure that
permits the automation of the processes of data collection, transmission, stor-
age, processing and availability for the personnel of the NICU of “Women’s
and Children’s Hospital G. Salesi” of Ancona.
A solid foundation for building a device network has been developed to allow
data sharing between medical devices, as well as the communication in real-time
with EMR data.
This allows physicians to have a general idea about patient’s health con-
ditions and to not neglect any important detail for the patient’s care and to
support them in medical decisions.
Moreover, the automatic transmission of the measured values from devices
to the cloud storage eliminates the drawbacks of manual collection work and
the consequent possibility of typing errors.
The infrastructure has been tested by connecting 4 different types of instru-
ments with a single DB connected to the EMR of the hospital ward. The
4 different types of medical instruments, patient-monitors, bilirubinometers,
transcutaneous bilirubinometers and RGB-D vision systems, and the related
communication protocols used to interconnect them to the DB have been de-
scribed in detail.
Thus, in addition to connecting medical instruments already present in the
department, a new device has been created, which deserves some consideration.
It is a medical imaging method to estimate preterm infant’s respiratory rate
and movement indicators with a non invasive embedded RGB-D sensor. It is
low-cost, not bulky and easy to install in the hospital environment where the
experimental phase was carried out and where it is going to be used in daily
clinical practice. Affordability, installability and practicability are important
characteristics required to all new systems installed in the NICU. It is non-
contact and non-invasive. This ensures the decrease of the discomfort procured
to the baby, reducing the number of transducers applied on the infant skin and
119

Chapter 6 Conclusions and Future Works
also the risk incurred whenever the infant comes into contact with external
objects, as is the case of marker-based capture systems and sensor-based ap-
proaches. This aspect is of major importance especially in this case, in which
infants have a very small accessible body surface area and a very sensitive skin.
Moreover, the use of depth data makes the system suitable to be used in an
indoor environment with poor lighting, as might be rooms in the NICU and it
allows the preservation of privacy, unlike RGB cameras. Future developments
may involve the use of new, more performing, structured-light sensors or of
time-of-flight (ToF) sensors that supply depth images of better quality and
are less affected by the presence of sunlight. In any way, experimental results
showed that the system can automatically measure preterm infant’s respiratory
rate and some movement indicators, activating an alarm signal when respira-
tory rate values go out of the physiological range or when the infant remains
stationary for a long time.
The infrastructure here created can provide the scalability necessary to sup-
port the adding of all medical devices that surround the neonatal crib for mon-
itoring, diagnosis and treatment of different diseases, which is the next target.
The idea is to obtain a single tailored display for each neonatal crib, where the
clinician can access all patient’s data, e.g., he can visualise his medical records,
all device data in real time, historical values, and where he can change device
settings and set up new vital signs or new alarm values.
Data availability and accessibility, guaranteed from the web interface through
Web services and ensured by strong authorization for only medical staff, facil-
itates the process of data delivery and visualisation.
In particular, a modular platform has been created, equipped with many
tools that allow to visualize the patient’s personal data, the data coming from
the instruments and therefore the historical values of the vital parameters mea-
sured by these instruments with user-friendly dashboards, graphs and tables.
NICU medical staff have remote access to the cloud database, both with
the PC within the ward and in a more innovative way with mobile devices
(smartphones and tablets) to view patient data, and have the ability to perform
a continuous backup of their data.
The DB is also made available for “transversal” interoperability with other
colleagues who need continuity of care for the same patient, such as, for exam-
ple, with colleagues from peripheral hospitals and family paediatricians in the
case of bilirubin, and for “vertical” interoperability with other databases and
NHS operators.
This is guaranteed by a maximum security of data, encrypted, and access,
controlled and strictly allowed only to those who have the necessary autho-
rizations and differentiated according to the figure of the personnel. The web-
platform, in fact, guarantees, subject to prior authorization, differentiated ac-
120

6.2 Thesis contributions
cess to the data depending on the figure that makes the log-in. Also infants’
parents can access it with the possibility to view the infant’s clinical history
and the reports of the various tools. In the future, parents will not only be able
to view the infant’s medical record, but also to communicate with doctors and
carry out tele-consulting through the platform itself, actively participating in
the process of caring for their child.
The device integration in the infrastructure made also possible to elaborate
collected data in real time with specific algorithms to assist physicians with
clinical decision-making for improved healthcare in the view of Clinical Decision
Support Systems.
The decision-making algorithms developed within this work collect and use
data coming from the connected instruments, and therefore the values of the
various biomedical parameters and signals measured by these instruments such
as, heart rate, respiratory rate, TSB, TcB, movement indicators and so on,
as well as infant’s personal data and growth data, inserted in the appropriate
tools of the web-platform during the registration and hospitalization phase of
the infant from NICU personnel, and EMR data of the hospital ward. Then
they elaborate this set of data and bring out from it useful information to
monitor infants breathing and movement, to prescribe the recipes of bags for
parenteral nutrition, to provide follow-ups and to diagnose neonatal jaundice
as well as to decide a possible therapy to treat it.
6.2 Thesis contributions
The main contributions of this Thesis can be summarized as follows:
- Design and implementation of SINC cloud-based healthcare infrastruc-
ture that allows the developing and the deploying of the process automa-
tion of data collection, storage, processing and distribution through a
medical device network that uses cloud computing in the NICU of the
“Women’s and Children’s Hospital G.Salesi” in Ancona.
- Integration and interfacing with SINC cloud-based infrastructure of three
different type of instruments (patient monitors, bilirubinometers, and
transcutaneous bilirubinometers) located in the NICU, through med-
ical communication protocols used to enable the communication and
data transfer between these infant’s monitoring devices and the unique
database of the architecture.
- Development and interconnection with SINC infrastructure of a new de-
vice that is a novel non-contact and non-invasive RGB-D system that
121

Chapter 6 Conclusions and Future Works
consists in an RGB-D camera and in an embedded board, where the al-
gorithms used to extract and analyse data from the depth images acquired
by the camera are run in real-time.
- Design and development of an end-user web interface based on speci-
fications given by healthcare staff and medical guidelines, which works
as an application on Mobile Devices and Desktop Workstations, where
medical staff members can access all available information. The propose
web-platform exceeds the characteristics of a simple EMR, thanks to the
development of innovative clinical tools, each of which has particular
functionalities useful to make faster and easier physicians’ clinical daily
practice and to improve patient care:
- “Anagraphic Tool”
- “Growth Tool”
- “Nutrition Tool”
- “Bayley Tool”
- “Bilirubin Tool”
- “Respiration Tool”
- “Movement Tool”
- Design and implementation of decision-making systems that, based on
clinical guidelines, on physicians’ expertise, on EMR data entered by
medical staff in the different SINC tools, on computer vision techniques
and on machine learning algorithms, are able to analyse and process
data extracted from different devices. They provide in output advices,
warnings, alarms, insights and important indicators, that can support
physicians in the prediction or diagnosis of diseases such as neonatal
jaundice or motor disabilities, or in the monitoring of physiological and
developmental parameters and problems, such as respiratory rate, growth
parameters and nutrition.
- Design and implementation of several CNNs for semantic segmentation
of preterm infants’ silhouette from depth images. Four different types of
CNNs, i.e. U-Net, SegNet, FractalNet, and ResNet, have been trained
through a manually annotated dataset.
- Creation of two datasets:
- MIA dataset;
- PIDS dataset.
122

6.3 Future Works
6.3 Future Works
In the future, the possibility to share data and, especially, healthcare protocols,
here investigated, will play a key role in the regional distribution of Neonatal
Units.
In fact, the method used in this thesis work, based on a flexible and extensible
infrastructure, is appropriate for the creation of a network that will include all
the regional Neonatal Units and it will be used within SINC regional project.
The possibility of linking SINC DB to the regional ARCA-EMPI and the
fact that every medical report delivered from the platform tools can be sent
to the regional EHR shows that the work, described in this thesis, is focused
towards the direction of the creation of a single regional model.
In this way, the system will facilitate the function of tele-consultation be-
tween specialists, enabling more effective collaboration between the peripheral
structures and the central one, e.g., to better evaluate the conditions of a pa-
tient for which a transfer is requested or simply to unify healthcare protocols.
For example, it will facilitate the infant’s transfer between the different hos-
pitals, which can take place after having already made an initial analysis of
the patient’s vital signals by the reception peripheral centre, or vice versa,
facilitate the continuity of monitoring once the infant is transferred from the
central structure (“G. Salesi” Hospital) to a hospital closer to the residence of
the parents, ending there the last days of hospitalization.
Moreover, the sharing of care protocols in the regional distribution of neona-
tologies will allow the achievement of a standardization of care, obtaining an im-
portant improvement in the services offered to citizens and proposing through-
out the Region the same quality and efficiency that the NICU of “G. Salesi”
Hospital demonstrates by covering the first places at EU level.
The interdisciplinary approach, the updating in the field of research and clin-
ical research, the evolutionary perspective will provide those who work with
these infants with a fundamental reference model to design courses of care and
support for the development of the child and his family through a multidis-
ciplinary assistance that continues for several years after the discharge and
involves, in addition to neonatologists and psychologists, different professional
figures: the family paediatrician, the child neuropsychiatrist, the physiatrist,
the physiotherapist, the speech therapist and the educator.
123


Appendices
125


Appendix A
127


Bibliography
[1] O. Ronneberger, P. Fischer, and T. Brox, “U-net: Convolutional net-
works for biomedical image segmentation,” in International Confer-
ence on Medical Image Computing and Computer-Assisted Intervention.
Springer, 2015, pp. 234–241.
[2] H. Ravishankar, R. Venkataramani, S. Thiruvenkadam, P. Sudhakar, and
V. Vaidya, “Learning and incorporating shape models for semantic seg-
mentation,” in International Conference on Medical Image Computing
and Computer-Assisted Intervention. Springer, 2017, pp. 203–211.
[3] V. Badrinarayanan, A. Kendall, and R. Cipolla, “Segnet: A deep con-
volutional encoder-decoder architecture for image segmentation,” arXiv
preprint arXiv:1511.00561, 2015.
[4] K. He, X. Zhang, S. Ren, and J. Sun, “Deep residual learning for image
recognition,” in Proceedings of the IEEE conference on computer vision
and pattern recognition, 2016, pp. 770–778.
[5] G. Larsson, M. Maire, and G. Shakhnarovich, “Fractalnet: Ultra-deep
neural networks without residuals,” arXiv preprint arXiv:1605.07648,
2016.
[6] W. H. Organization et al., “Born too soon: the global action report on
preterm birth,” 2012.
[7] E. R. Millett, J. K. Quint, B. L. De Stavola, L. Smeeth, and S. L. Thomas,
“Improved incidence estimates from linked versus stand-alone electronic
health records,” Journal of Clinical Epidemiology, 2016.
[8] M. K. Obenshain, “Application of data mining techniques to healthcare
data,” Infection Control & Hospital Epidemiology, vol. 25, no. 08, pp.
690–695, 2004.
[9] S. Tsumoto and S. Hirano, “Data mining in hospital information system
for hospital management,” in 2009 ICME International Conference on
Complex Medical Engineering, 2009.
[10] M. N. Almunawar and M. Anshari, “Health information systems (his):
concept and technology,” arXiv preprint arXiv:1203.3923, 2012.
135

Bibliography
[11] R. Haux, “Health information systems–past, present, future,” Interna-
tional journal of medical informatics, vol. 75, no. 3, pp. 268–281, 2006.
[12] S.-H. Lee, J. H. Song, J.-H. Ye, H. J. Lee, B.-K. Yi, and I. K. Kim,
“Soa-based integrated pervasive personal health management system us-
ing phds,” in Pervasive Computing Technologies for Healthcare (Perva-
siveHealth), 2010 4th International Conference on-NO PERMISSIONS.
IEEE, 2010, pp. 1–4.
[13] P. Kulkarni and Y. Ozturk, “mphasis: Mobile patient healthcare and sen-
sor information system,” Journal of Network and Computer Applications,
vol. 34, no. 1, pp. 402–417, 2011.
[14] J.-T. Hsu, S.-H. Hsieh, C.-C. Lo, C.-H. Hsu, P.-H. Cheng, S.-J. Chen,
and F.-P. Lai, “Ubiquitous mobile personal health system based on cloud
computing,” in TENCON 2011-2011 IEEE Region 10 Conference. IEEE,
2011, pp. 1387–1390.
[15] J. Biswas, J. Maniyeri, K. Gopalakrishnan, L. Shue, P. J. Eugene, H. N.
Palit, F. Y. Siang, L. L. Seng, and L. Xiaorong, “Processing of wearable
sensor data on the cloud-a step towards scaling of continuous monitoring
of health and well-being,” in Engineering in Medicine and Biology Society
(EMBC), 2010 Annual International Conference of the IEEE. IEEE,
2010, pp. 3860–3863.
[16] Z. Rashid, U. Farooq, J.-K. Jang, and S.-H. Park, “Cloud computing
aware ubiquitous health care system,” in E-Health and Bioengineering
Conference (EHB), 2011. IEEE, 2011, pp. 1–4.
[17] N. Botts, B. Thoms, A. Noamani, and T. A. Horan, “Cloud comput-
ing architectures for the underserved: Public health cyberinfrastructures
through a network of healthatms,” in System Sciences (HICSS), 2010
43rd Hawaii International Conference on. IEEE, 2010, pp. 1–10.
[18] Q. Huang, L. Ye, M. Yu, F. Wu, and R. Liang, “Medical information inte-
gration based cloud computing,” in Network Computing and Information
Security (NCIS), 2011 International Conference on, vol. 1. IEEE, 2011,
pp. 79–83.
[19] Z. Chang, S. Mei, Z. Gu, J. Gu, L. Xia, S. Liang, and J. Lin, “Realiza-
tion of integration and working procedure on digital hospital information
system,” Computer Standards & Interfaces, vol. 25, no. 5, pp. 529–537,
2003.
136

Bibliography
[20] C. O. Rolim, F. L. Koch, C. B. Westphall, J. Werner, A. Fracalossi, and
G. S. Salvador, “A cloud computing solution for patient’s data collec-
tion in health care institutions,” in eHealth, Telemedicine, and Social
Medicine, 2010. ETELEMED’10. Second International Conference on.
IEEE, 2010, pp. 95–99.
[21] E. Frontoni, M. Baldi, P. Zingaretti, V. Landro, and P. Misericordia,
“Security issues for data sharing and service interoperability in ehealth
systems: the nu. sa. test bed,” in Security Technology (ICCST), 2014
International Carnahan Conference on. IEEE, 2014, pp. 1–6.
[22] R. Zhang and L. Liu, “Security models and requirements for healthcare
application clouds,” in Cloud Computing (CLOUD), 2010 IEEE 3rd In-
ternational Conference on. IEEE, 2010, pp. 268–275.
[23] L. Rossi, A. Belli, A. De Santis, C. Diamantini, E. Frontoni, E. Gambi,
L. Palma, L. Pernini, P. Pierleoni, D. Potena et al., “Interoperability
issues among smart home technological frameworks,” in Mechatronic and
Embedded Systems and Applications (MESA), 2014 IEEE/ASME 10th
International Conference on. IEEE, 2014, pp. 1–7.
[24] B. Orgun and J. Vu, “Hl7 ontology and mobile agents for interoperability
in heterogeneous medical information systems,” Computers in biology and
medicine, vol. 36, no. 7, pp. 817–836, 2006.
[25] M. Deng, M. Nalin, M. Petkovic, I. Baroni, and A. Marco, “To-
wards trustworthy health platform cloud,” in Secure Data Management.
Springer, 2012, pp. 162–175.
[26] C. He, X. Jin, Z. Zhao, and T. Xiang, “A cloud computing solution for
hospital information system,” in Intelligent Computing and Intelligent
Systems (ICIS), 2010 IEEE International Conference on, vol. 2. IEEE,
2010, pp. 517–520.
[27] A. L. King, S. Procter, D. Andresen, J. Hatcliff, S. Warren, W. Spees,
R. P. Jetley, P. L. Jones, and S. Weininger, “An open test bed for medical
device integration and coordination.” in ICSE Companion, 2009, pp. 141–
151.
[28] J. Roukema, R. K. Los, S. E. Bleeker, A. M. van Ginneken, J. van der
Lei, and H. A. Moll, “Paper versus computer: feasibility of an electronic
medical record in general pediatrics,” Pediatrics, vol. 117, no. 1, pp. 15–
21, 2006.
137

Bibliography
[29] R. Hillestad, J. Bigelow, A. Bower, F. Girosi, R. Meili, R. Scoville, and
R. Taylor, “Can electronic medical record systems transform health care?
potential health benefits, savings, and costs,” Health affairs, vol. 24, no. 5,
pp. 1103–1117, 2005.
[30] S. M. Retchin and R. P. Wenzel, “Electronic medical record systems at
academic health centers: advantages and implementation issues.” Aca-
demic Medicine, vol. 74, no. 5, pp. 493–8, 1999.
[31] D. J. Brailer, “Interoperability: the key to the future health care system,”
Health affairs, vol. 24, p. W5, 2005.
[32] J. L. Habib and D. B. Trends, “Ehrs, meaningful use, and a model emr,”
Drug Benefit Trends, vol. 22, 2010.
[33] P. Kierkegaard, “Electronic health record: Wiring europe’s healthcare,”
Computer law & security review, vol. 27, no. 5, pp. 503–515, 2011.
[34] ISO/TC 20514 Health Informatics, “Health Informatics – Electronic
Health Record – Definition, Scope, and Context,” 2005.
[35] K. Hayrinen, K. Saranto, and P. Nykanen, “Definition, structure, con-
tent, use and impacts of electronic health records: a review of the research
literature,” International journal of medical informatics, vol. 77, no. 5,
pp. 291–304, 2008.
[36] S. V. Jardim, “The electronic health record and its contribution to health-
care information systems interoperability,” Procedia Technology, vol. 9,
pp. 940–948, 2013.
[37] S. Garde, P. Knaup, E. J. Hovenga, and S. Heard, “Towards semantic in-
teroperability for electronic health records–domain knowledge governance
for open ehr archetypes,” Methods of information in medicine, vol. 46,
no. 3, pp. 332–343, 2007.
[38] F. M. Bowens, P. A. Frye, and W. A. Jones, “Health information tech-
nology: integration of clinical workflow into meaningful use of elec-
tronic health records,” Perspectives in Health Information Manage-
ment/AHIMA, American Health Information Management Association,
vol. 7, no. Fall, 2010.
[39] “HiMMS Analytics, Electronic Medical Record Adoption Model,” http:
//www.himssanalytics.org/emram.
[40] “HiMMS Analytics, Electronic Medical Record Adoption Model
Score Distribution - European Countries,” http://www.himss.eu/
healthcare-providers/emram.
138

Bibliography
[41] J. J. Cimino, J. M. Teich, V. L. Patel, and J. Zhang, “What is wrong
with emr?” Panel proposal for AMIA, vol. 99, 1999.
[42] I. Valdes, D. Kibbe, G. Tolleson, M. Kunik, and L. Petersen, “Barriers
to proliferation of electronic medical records,” Journal of Innovation in
Health Informatics, vol. 12, no. 1, pp. 3–9, 2004.
[43] H. Yan, R. Gardner, and R. Baier, “Beyond the focus group: under-
standing physicians’ barriers to electronic medical records,” The Joint
Commission Journal on Quality and Patient Safety, vol. 38, no. 4, pp.
184–AP1, 2012.
[44] A. Boonstra and M. Broekhuis, “Barriers to the acceptance of electronic
medical records by physicians from systematic review to taxonomy and
interventions,” BMC health services research, vol. 10, no. 1, p. 231, 2010.
[45] P. Guarda, Fascicolo sanitario elettronico e protezione dei dati personali.
Trento: Universita degli Studi di Trento, 2011, vol. 94.
[46] “Agenzia per l’Italia Digitale (AgID),” http://www.agid.gov.it/.
[47] “LINEE GUIDA FSE - Framework dei servizi di integrazione con
l’infrastruttura FSE di Regione Marche,” 2015.
[48] A. Baker, “Crossing the quality chasm: a new health system for the 21st
century,” BMJ: British Medical Journal, vol. 323, no. 7322, p. 1192, 2001.
[49] D. L. Sackett, W. M. Rosenberg, J. M. Gray, R. B. Haynes, and W. S.
Richardson, “Evidence based medicine: what it is and what it isn’t,”
1996.
[50] J. A. Osheroff et al., “Improving outcomes with clinical decision support:
an implementer’s guide.” Himss, 2012.
[51] T. Schecke, M. Langen, H.-J. Popp, G. Rau, H. Kasmacher, and G. Kalff,
“Knowledge-based decision support for patient monitoring in cardioanes-
thesia,” International journal of clinical monitoring and computing,
vol. 9, no. 1, pp. 1–11, 1992.
[52] J. Warren, G. Beliakov, and B. Van Der Zwaag, “Fuzzy logic in clinical
practice decision support systems,” in System Sciences, 2000. Proceedings
of the 33rd Annual Hawaii International Conference on. IEEE, 2000,
pp. 10–pp.
[53] J. C. Prather, D. F. Lobach, L. K. Goodwin, J. W. Hales, M. L. Hage, and
W. E. Hammond, “Medical data mining: knowledge discovery in a clinical
139

Bibliography
data warehouse.” in Proceedings of the AMIA annual fall symposium.
American Medical Informatics Association, 1997, p. 101.
[54] R. E. Bolinger, S. Price, and J. L. Kyner, “Use of a computerized clinical
decision system in a diabetic clinic,” in Proceedings of the ACM annual
conference. ACM, 1973, pp. 362–364.
[55] C. Catley and M. Frize, “A prototype xml-based implementation of an
integrated’intelligent’neonatal intensive care unit,” in Information Tech-
nology Applications in Biomedicine, 2003. 4th International IEEE EMBS
Special Topic Conference on. IEEE, 2003, pp. 322–325.
[56] C. Catley, M. Frize, C. Walker, and L. StGermain, “Integrating clinical
alerts into an xml-based health care framework for the neonatal intensive
care unit,” in Engineering in Medicine and Biology Society, 2003. Pro-
ceedings of the 25th Annual International Conference of the IEEE, vol. 2.
IEEE, 2003, pp. 1276–1279.
[57] M. Frize, L. Yang, R. C. Walker, and A. M. O’Connor, “Conceptual
framework of knowledge management for ethical decision-making support
in neonatal intensive care,” IEEE Transactions on Information Technol-
ogy in Biomedicine, vol. 9, no. 2, pp. 205–215, 2005.
[58] C. Catley, D. C. Petriu, and M. Frize, “Software performance engineering
of a web service-based clinical decision support infrastructure.” inWOSP,
vol. 4, 2004, pp. 130–138.
[59] “MarketsandMarkets,” https://www.marketsandmarkets.com/.
[60] E. G. Liberati, L. Galuppo, M. Gorli, M. Maraldi, F. Ruggiero,
M. Capobussi, R. Banzi, K. Kwag, G. Scaratti, O. Nanni et al., “Barriere
e facilitatori all’implementazione dei sistemi di supporto decisionale com-
puterizzati in ospedale: uno studio “grounded theory”,” Recenti Progressi
in Medicina, vol. 106, no. 4, pp. 180–191, 2015.
[61] S. Corrao, V. Arcoraci, S. Arnone, L. Calvo, R. Scaglione,
C. Di Bernardo, R. Lagalla, A. P. Caputi, and G. Licata, “Evidence-
based knowledge management: an approach to effectively promote good
health-care decision-making in the information era,” Internal and emer-
gency medicine, vol. 4, no. 2, pp. 99–106, 2009.
[62] F. Pesce, M. Diciolla, G. Binetti, D. Naso, V. C. Ostuni, T. Di Noia,
A. M. Vagane, R. Bjørneklett, H. Suzuki, Y. Tomino et al., “Clinical
decision support system for end-stage kidney disease risk estimation in
iga nephropathy patients,” Nephrology Dialysis Transplantation, vol. 31,
no. 1, pp. 80–86, 2015.
140

Bibliography
[63] M. Capobussi, R. Banzi, L. Moja, S. Bonovas, M. Gonzalez-Lorenzo,
E. Liberati, F. H. Polo, O. Nanni, M. Mangia, and F. Ruggiero, “Comput-
erized decision support systems: Ebm at the bedside,” Recenti progressi
in medicina, vol. 107, no. 11, pp. 589–591, 2016.
[64] A. Cenci, D. Liciotti, I. Ercoli, P. Zingaretti, and V. P. Carnielli, “A
cloud-based healthcare infrastructure for medical device integration: The
bilirubinometer case study,” in Mechatronic and Embedded Systems and
Applications (MESA), 2016 12th IEEE/ASME International Conference
on. IEEE, 2016, pp. 1–6.
[65] J. Rao and X. Su, “A survey of automated web service composition meth-
ods,” in Semantic Web Services and Web Process Composition. Springer,
2004, pp. 43–54.
[66] H. Hacigumus, B. Iyer, and S. Mehrotra, “Providing database as a ser-
vice,” in Data Engineering, 2002. Proceedings. 18th International Con-
ference on. IEEE, 2002, pp. 29–38.
[67] Datascope Passport 2 - Passport 2 LT User Manual, http://www.
frankshospitalworkshop.com/equipment/ecg service manuals.html,
Datascope Patient Monitoring, USA, 1945.
[68] “Ginevri One Beam,” http://www.ginevri.com/Prodotti.aspx?id=20&l=
en-US.
[69] J. M. Kirk, “Neonatal jaundice: a critical review of the role and practice
of bilirubin analysis,” Annals of clinical biochemistry, vol. 45, no. 5, pp.
452–462, 2008.
[70] J. Dai, D. M. Parry, and J. Krahn, “Transcutaneous bilirubinometry:
its role in the assessment of neonatal jaundice,” Clinical biochemistry,
vol. 30, no. 1, pp. 1–9, 1997.
[71] L. D. Lilien, V. J. Harris, R. S. Ramamurthy, and R. S. Pildes, “Neona-
tal osteomyelitis of the calcaneus: complication of heel puncture,” The
Journal of pediatrics, vol. 88, no. 3, pp. 478–480, 1976.
[72] I. Yamanouchi, Y. Yamauchi, and I. Igarashi, “Transcutaneous biliru-
binometry: preliminary studies of noninvasive transcutaneous bilirubin
meter in the okayama national hospital,” Pediatrics, vol. 65, no. 2, pp.
195–202, 1980.
[73] S. Yasuda, S. Itoh, K. Isobe, M. Yonetani, H. Nakamura, M. Nakamura,
Y. Yamauchi, and A. Yamanishi, “New transcutaneous jaundice device
141

Bibliography
with two optical paths,” Journal of perinatal medicine, vol. 31, no. 1, pp.
81–88, 2003.
[74] R. Tayaba, D. Gribetz, I. Gribetz, and I. R. Holzman, “Noninvasive
estimation of serum bilirubin,” Pediatrics, vol. 102, no. 3, pp. e28–e28,
1998.
[75] F. F. Rubaltelli, G. R. Gourley, N. Loskamp, N. Modi, M. Roth-Kleiner,
A. Sender, and P. Vert, “Transcutaneous bilirubin measurement: a mul-
ticenter evaluation of a new device,” Pediatrics, vol. 107, no. 6, pp. 1264–
1271, 2001.
[76] D. De Luca, E. Zecca, M. Corsello, E. Tiberi, C. Semeraro, and C. Ro-
magnoli, “Attempt to improve transcutaneous bilirubinometry: a double-
blind study of medick bilimed versus respironics bilicheck,” Archives of
Disease in Childhood-Fetal and Neonatal Edition, vol. 93, no. 2, pp. F135–
F139, 2008.
[77] G. Bertini, S. Pratesi, E. Cosenza, and C. Dani, “Transcutaneous biliru-
bin measurement: Evaluation of bilitestTM,” Neonatology, vol. 93, no. 2,
pp. 101–105, 2008.
[78] J. R. Petersen, A. O. Okorodudu, A. A. Mohammad, A. Fernando, and
K. E. Shattuck, “Association of transcutaneous bilirubin testing in hos-
pital with decreased readmission rate for hyperbilirubinemia,” Clinical
chemistry, vol. 51, no. 3, pp. 540–544, 2005.
[79] M. J. Maisels and E. Kring, “Transcutaneous bilirubinometry decreases
the need for serum bilirubin measurements and saves money,” Pediatrics,
vol. 99, no. 4, pp. 599–600, 1997.
[80] A. A. of Pediatrics Subcommittee on Hyperbilirubinemia et al., “Man-
agement of hyperbilirubinemia in the newborn infant 35 or more weeks
of gestation.” Pediatrics, vol. 114, no. 1, p. 297, 2004.
[81] “Drager JM-105,” https://www.draeger.com/en uk/Hospital/Products/
Thermoregulation-and-Jaundice-Management/Jaundice-Management/
Jaundice-Screening/Jaundice-Meter-JM-105.
[82] “Health Level Seven R© INTERNATIONAL,” http://www.hl7.org/.
[83] “Sinc, System Improvement for Neonatal Care,” http://sinc.jef.it/.
[84] W. H. Organization et al., WHO child growth standards: length/height for
age, weight-for-age, weight-for-length, weight-for-height and body mass
index-for-age, methods and development. World Health Organization,
2006.
142

Bibliography
[85] R. Gaillard, M. A. de Ridder, B. O. Verburg, J. C. Witteman, J. P.
Mackenbach, H. A. Moll, A. Hofman, E. A. Steegers, and V. W. Jad-
doe, “Individually customised fetal weight charts derived from ultrasound
measurements: the generation r study,” European journal of epidemiol-
ogy, vol. 26, no. 12, pp. 919–926, 2011.
[86] Gruppo di Studio Nutrizione e Metabolismo della Societa Italiana di
Neonatologia, “Guida alla nutrizione parenterale in epoca neonatale,”
2000.
[87] SIN Societa Italiana Neonatologia Gruppo Nutrizione Parenterale Neona-
tale, “Manuale di Nutrizione Parenterale Neonatale,” 2017.
[88] N. Bayley, Bayley scales of infant and toddler development. Pearson,
2006.
[89] C. A. Albers and A. J. Grieve, “Test review: Bayley, n.(2006). bayley
scales of infant and toddler development–third edition. san antonio, tx:
Harcourt assessment,” Journal of Psychoeducational Assessment, vol. 25,
no. 2, pp. 180–190, 2007.
[90] T. Moore, S. Johnson, S. Haider, E. Hennessy, and N. Marlow, “Rela-
tionship between test scores using the second and third editions of the
bayley scales in extremely preterm children,” The Journal of pediatrics,
vol. 160, no. 4, pp. 553–558, 2012.
[91] I. Adams-Chapman, C. M. Bann, Y. E. Vaucher, B. J. Stoll, H. D. N.
N. R. Network, E. K. S. N. I. of Child Health et al., “Association between
feeding difficulties and language delay in preterm infants using bayley
scales of infant development,” The Journal of pediatrics, vol. 163, no. 3,
pp. 680–685, 2013.
[92] K. Lee, “Use of the bayley scales of infant development-iii by therapists
for assessing development and recommending treatment for infants in a
nicu follow-up clinic,” 2013.
[93] A. Knudsen, “The influence of the reserve albumin concentration and ph
on the cephalocaudal progression of jaundice in newborns,” Early human
development, vol. 25, no. 1, pp. 37–41, 1991.
[94] A. Riskin, A. Tamir, A. Kugelman, M. Hemo, and D. Bader, “Is visual
assessment of jaundice reliable as a screening tool to detect significant
neonatal hyperbilirubinemia?” The Journal of pediatrics, vol. 152, no. 6,
pp. 782–787, 2008.
143

Bibliography
[95] A. Madan, J. MacMahon, D. Stevenson et al., “Neonatal hyperbilirubine-
mia,” Avery’s disease of the newborn. 8th ed. Philadelphia: Saunders, pp.
1227–56, 2005.
[96] S. Ip, M. Chung, J. Kulig, R. O’Brien, R. Sege, S. Glicken, M. J. Maisels,
J. Lau et al., “An evidence-based review of important issues concerning
neonatal hyperbilirubinemia,” Pediatrics, vol. 114, no. 1, pp. e130–e153,
2004.
[97] V. K. Bhutani, A. Zipursky, H. Blencowe, R. Khanna, M. Sgro, F. Ebbe-
sen, J. Bell, R. Mori, T. M. Slusher, N. Fahmy et al., “Neonatal hyper-
bilirubinemia and rhesus disease of the newborn: incidence and impair-
ment estimates for 2010 at regional and global levels,” Pediatric research,
vol. 74, no. Suppl 1, p. 86, 2013.
[98] J. Chen and U. Ling, “Prediction of the development of neonatal hyper-
bilirubinemia in abo incompatibility.” Zhonghua yi xue za zhi= Chinese
medical journal; Free China ed, vol. 53, no. 1, pp. 13–18, 1994.
[99] F. Ebbesen, “Recurrence of kernicterus in term and near-term infants in
denmark,” Acta paediatrica, vol. 89, no. 10, pp. 1213–1217, 2000.
[100] M. J. Maisels and T. B. Newman, “Kernicterus in otherwise healthy,
breast-fed term newborns,” Pediatrics, vol. 96, no. 4, pp. 730–733, 1995.
[101] L. H. Johnson, V. K. Bhutani, and A. K. Brown, “System-based approach
to management of neonatal jaundice and prevention of kernicterus,” The
Journal of pediatrics, vol. 140, no. 4, pp. 396–403, 2002.
[102] G. K. Suresh and R. E. Clark, “Cost-effectiveness of strategies that are
intended to prevent kernicterus in newborn infants,” Pediatrics, vol. 114,
no. 4, pp. 917–924, 2004.
[103] F. Nasseri, G. A. Mamouri, and H. Babaei, “Intravenous immunoglobulin
in abo and rh hemolytic diseases of newborn.” Saudi medical journal,
vol. 27, no. 12, pp. 1827–1830, 2006.
[104] M. J. Maisels and A. F. McDonagh, “Phototherapy for neonatal jaun-
dice,” New England Journal of Medicine, vol. 358, no. 9, pp. 920–928,
2008.
[105] C. E. Ahlfors, “Criteria for exchange transfusion in jaundiced newborns,”
Pediatrics, vol. 93, no. 3, pp. 488–494, 1994.
[106] S. Murki and P. Kumar, “Blood exchange transfusion for infants with
severe neonatal hyperbilirubinemia,” in Seminars in perinatology, vol. 35,
no. 3. Elsevier, 2011, pp. 175–184.
144

Bibliography
[107] J. C. Jackson, “Adverse events associated with exchange transfusion in
healthy and ill newborns,” Pediatrics, vol. 99, no. 5, pp. e7–e7, 1997.
[108] D. S. Seidman, D. K. Stevenson, Z. Ergaz, and R. Gale, “Hospital read-
mission due to neonatal hyperbilirubinemia,” Pediatrics, vol. 96, no. 4,
pp. 727–729, 1995.
[109] G. Bertini, C. Dani, M. Tronchin, and F. F. Rubaltelli, “Is breastfeeding
really favoring early neonatal jaundice?” Pediatrics, vol. 107, no. 3, pp.
e41–e41, 2001.
[110] M. J. Maisels, “Neonatal hyperbilirubinemia and kernicterus—not gone
but sometimes forgotten,” Early human development, vol. 85, no. 11, pp.
727–732, 2009.
[111] P. A. Dennery, D. S. Seidman, and D. K. Stevenson, “Neonatal hyper-
bilirubinemia,” New England Journal of Medicine, vol. 344, no. 8, pp.
581–590, 2001.
[112] S. Ip, S. Glicken, J. Kulig, R. O’Brien, and R. Sege, “Management
of neonatal hyperbilirubinemia.” Evidence report/technology assessment
(Summary), no. 65, p. 1, 2002.
[113] M. Maisels and J. Watchko, “Treatment of jaundice in low birthweight
infants,” Archives of Disease in Childhood-Fetal and Neonatal Edition,
vol. 88, no. 6, pp. F459–F463, 2003.
[114] V. K. Bhutani, L. Johnson, and E. M. Sivieri, “Predictive ability of a
predischarge hour-specific serum bilirubin for subsequent significant hy-
perbilirubinemia in healthy term and near-term newborns,” Pediatrics,
vol. 103, no. 1, pp. 6–14, 1999.
[115] T. B. Newman, B. Xiong, V. M. Gonzales, and G. J. Escobar, “Predic-
tion and prevention of extreme neonatal hyperbilirubinemia in a mature
health maintenance organization,” Archives of pediatrics & adolescent
medicine, vol. 154, no. 11, pp. 1140–1147, 2000.
[116] R. Keren, X. Luan, S. Friedman, S. Saddlemire, A. Cnaan, and V. K.
Bhutani, “A comparison of alternative risk-assessment strategies for pre-
dicting significant neonatal hyperbilirubinemia in term and near-term
infants,” Pediatrics, vol. 121, no. 1, pp. e170–e179, 2008.
[117] M. Sgro, D. Campbell, and V. Shah, “Incidence and causes of severe
neonatal hyperbilirubinemia in canada,” Canadian Medical Association
Journal, vol. 175, no. 6, pp. 587–590, 2006.
145

Bibliography
[118] Y. Maruo, K. Nishizawa, H. Sato, Y. Doida, and M. Shi-
mada, “Association of neonatal hyperbilirubinemia with bilirubin udp-
glucuronosyltransferase polymorphism,” Pediatrics, vol. 103, no. 6, pp.
1224–1227, 1999.
[119] M.-J. Huang, K.-E. Kua, H.-C. Teng, K.-S. Tang, H.-W. Weng, and
C.-S. Huang, “Risk factors for severe hyperbilirubinemia in neonates,”
Pediatric research, vol. 56, no. 5, pp. 682–689, 2004.
[120] J. F. Watchko, “Identification of neonates at risk for hazardous hy-
perbilirubinemia: emerging clinical insights,” Pediatric clinics of North
America, vol. 56, no. 3, pp. 671–687, 2009.
[121] D. De Luca, E. Zecca, P. De Turris, G. Barbato, M. Marras, and C. Ro-
magnoli, “Using bilicheckTM for preterm neonates in a sub-intensive unit:
Diagnostic usefulness and suitability,” Early human development, vol. 83,
no. 5, pp. 313–317, 2007.
[122] T. Karen, H. U. Bucher, and J.-C. Fauchere, “Comparison of a new tran-
scutaneous bilirubinometer (bilimed R©) with serum bilirubin measure-
ments in preterm and full-term infants,” BMC pediatrics, vol. 9, no. 1,
p. 70, 2009.
[123] S. N. El-Beshbishi, K. E. Shattuck, A. A. Mohammad, and J. R. Petersen,
“Hyperbilirubinemia and transcutaneous bilirubinometry,” clinical chem-
istry, vol. 55, no. 7, pp. 1280–1287, 2009.
[124] N. Bosschaart, J. H. Kok, A. M. Newsum, D. M. Ouweneel, R. Mentink,
T. G. van Leeuwen, and M. C. Aalders, “Limitations and opportunities
of transcutaneous bilirubin measurements,” Pediatrics, vol. 129, no. 4,
pp. 689–694, 2012.
[125] F. Raimondi, S. Lama, F. Landolfo, M. Sellitto, A. C. Borrelli, R. Maf-
fucci, P. Milite, and L. Capasso, “Measuring transcutaneous bilirubin: a
comparative analysis of three devices on a multiracial population,” BMC
pediatrics, vol. 12, no. 1, p. 70, 2012.
[126] A. R. Gagliardi, M. C. Brouwers, V. A. Palda, L. Lemieux-Charles, and
J. M. Grimshaw, “How can we improve guideline use? a conceptual
framework of implementability,” Implementation Science, vol. 6, no. 1,
p. 26, 2011.
[127] R. Grol and J. Grimshaw, “From best evidence to best practice: effective
implementation of change in patients’ care,” The lancet, vol. 362, no.
9391, pp. 1225–1230, 2003.
146

Bibliography
[128] C. Bielza, M. Gomez, S. Rıos-Insua, J. F. Del Pozo, P. G. Barreno,
S. Caballero, and M. S. Luna, “Ictneo system for jaundice management,”
Revista de la Real Academia de Ciencias Exactas Fısicas y Naturales,
vol. 92, no. 4, pp. 307–315, 1998.
[129] C. Longhurst, S. Turner, and A. E. Burgos, “Development of a web-
based decision support tool to increase use of neonatal hyperbilirubine-
mia guidelines,” The Joint Commission Journal on Quality and Patient
Safety, vol. 35, no. 5, pp. 256–262, 2009.
[130] “Tool for management of neonatal jaundice.” http://paediatrics.co.uk/
nicu/neonatal-jaundice.
[131] J. M. R. Miguelez and J. F. Aloy, “Ictericia neonatal,” Protocolo de la
Asociacion Espanola de Pediatrıa. Recuperado a partir de http://www.
seneonatal. es/Portals/0/Articulos/38. pdf, 2008.
[132] M. J. Maisels, V. K. Bhutani, D. Bogen, T. B. Newman, A. R. Stark, and
J. F. Watchko, “Hyperbilirubinemia in the newborn infant ≥ 35 weeks
gestation: an update with clarifications,” Pediatrics, vol. 124, no. 4, pp.
1193–1198, 2009.
[133] M. Atkinson and H. Budge, “Review of the nice guidance on neona-
tal jaundice,” Archives of Disease in Childhood-Education and Practice,
vol. 96, no. 4, pp. 136–140, 2011.
[134] C. Dani, C. Poggi, J. Barp, C. Romagnoli, and G. Buonocore, “Cur-
rent italian practices regarding the management of hyperbilirubinaemia
in preterm infants,” Acta Paediatrica, vol. 100, no. 5, pp. 666–669, 2011.
[135] S. Ip, M. Chung, J. Kulig, R. SEGE, S. GLICKEN, M. MAISELS, J. Lau
et al., “American academy of pediatrics subcommittee on hyperbiliru-
binemia. an evidence-based review of important issues concerning neona-
tal hyperbilirubinemia,” 2004.
[136] V. K. Bhutani et al., “Phototherapy to prevent severe neonatal hyper-
bilirubinemia in the newborn infant 35 or more weeks of gestation,” Pe-
diatrics, pp. peds–2011, 2011.
[137] J. Rennie, S. Burman-Roy, M. S. Murphy, G. D. Group et al., “Neonatal
jaundice: summary of nice guidance,” BMJ, vol. 340, no. 7757, p. c2409,
2010.
[138] K. Barrington and K. Sankaran, “Guidelines for detection, management
and prevention of hyperbilirubinemia in term and late preterm newborn
147

Bibliography
infants (35 or more weeks’ gestation),” Paediatr Child Health, vol. 12, no.
Suppl B, pp. 1B–12B, 2007.
[139] D. E. van Imhoff, P. H. Dijk, C. V. Hulzebos et al., “Uniform treatment
thresholds for hyperbilirubinemia in preterm infants: background and
synopsis of a national guideline,” Early human development, vol. 87, no. 8,
pp. 521–525, 2011.
[140] D. Bratlid, B. Nakstad, and T. Hansen, “National guidelines for treat-
ment of jaundice in the newborn,” Acta Paediatrica, vol. 100, no. 4, pp.
499–505, 2011.
[141] M. Kaplan, P. Merlob, and R. Regev, “Israel guidelines for the man-
agement of neonatal hyperbilirubinemia and prevention of kernicterus,”
Journal of Perinatology, vol. 28, no. 6, pp. 389–397, 2008.
[142] “Newborn Service Clinical Guideline. Management of neonatal jaundice.”
http://www.adhb.govt.nz/newborn/guidelines/GI/Jaundice.htm.
[143] Q. Maternity, “Neonatal clinical guideline: Neonatal jaundice: Preven-
tion, assessment and management. 2009.”
[144] S. Mishra, R. Agarwal, A. Deorari, and V. Paul, “Jaundice in the new-
born. aiims-nicu protocols. 2007.”
[145] R. Arlettaz, A. Blumberg, L. Buetti, H. Fahnenstich, D. Mieth, and
M. Roth-Kleiner, “Assessment and treatment of jaundice newborn infants
35 0/7 or more weeks of gestation,” Swiss Soc Neonatology, pp. 1–4, 2007.
[146] D. De Luca, C. Romagnoli, E. Tiberi, A. A. Zuppa, and E. Zecca,
“Skin bilirubin nomogram for the first 96 h of life in a european normal
healthy newborn population, obtained with multiwavelength transcuta-
neous bilirubinometry,” Acta Paediatrica, vol. 97, no. 2, pp. 146–150,
2008.
[147] C. Romagnoli, E. Tiberi, G. Barone, M. De Curtis, D. Regoli, P. Paolillo,
S. Picone, S. Anania, M. Finocchi, V. Cardiello et al., “Validation of
transcutaneous bilirubin nomogram in identifying neonates not at risk
of hyperbilirubinaemia: a prospective, observational, multicenter study,”
Early human development, vol. 88, no. 1, pp. 51–55, 2012.
[148] ——, “Development and validation of serum bilirubin nomogram to pre-
dict the absence of risk for severe hyperbilirubinaemia before discharge:
a prospective, multicenter study,” Italian journal of pediatrics, vol. 38,
no. 1, p. 6, 2012.
148

Bibliography
[149] D. Liciotti, M. Contigiani, E. Frontoni, A. Mancini, P. Zingaretti, and
V. Placidi, “Shopper analytics: A customer activity recognition system
using a distributed rgb-d camera network,” in Video Analytics for Au-
dience Measurement. Springer International Publishing, 2014, pp. 146–
157.
[150] G. J. Tortora and B. H. Derrickson, Principles of anatomy and physiology.
John Wiley & Sons, 2008.
[151] V.-P. Seppa, J. Viik, and J. Hyttinen, “Assessment of pulmonary flow
using impedance pneumography,” Biomedical Engineering, IEEE Trans-
actions on, vol. 57, no. 9, pp. 2277–2285, 2010.
[152] J. H. Houtveen, P. F. Groot, and E. J. de Geus, “Validation of the tho-
racic impedance derived respiratory signal using multilevel analysis,” In-
ternational Journal of Psychophysiology, vol. 59, no. 2, pp. 97–106, 2006.
[153] J. P. Cantineau, P. Escourrou, R. Sartene, C. Gaultier, and M. Goldman,
“Accuracy of respiratory inductive plethysmography during wakefulness
and sleep in patients with obstructive sleep apnea.” CHEST Journal, vol.
102, no. 4, pp. 1145–1151, 1992.
[154] J. Allen, “Photoplethysmography and its application in clinical physio-
logical measurement,” Physiological measurement, vol. 28, no. 3, p. R1,
2007.
[155] M. A. Carskadon, K. Harvey, W. C. Dement, C. Guilleminault, F. B. Sim-
mons, and T. F. Anders, “Respiration during sleep in children,” Western
Journal of Medicine, vol. 128, no. 6, p. 477, 1978.
[156] R. Farre, J. Montserrat, M. Rotger, E. Ballester, and D. Navajas, “Ac-
curacy of thermistors and thermocouples as flow-measuring devices for
detecting hypopnoeas,” European Respiratory Journal, vol. 11, no. 1, pp.
179–182, 1998.
[157] J. Sharp, W. Druz, J. Foster, M. Wicks, and S. Chokroverty, “Use of the
respiratory magnetometer in diagnosis and classification of sleep apnea.”
CHEST Journal, vol. 77, no. 3, pp. 350–353, 1980.
[158] V. P. Harper, H. Pasterkamp, H. Kiyokawa, and G. R. Wodicka, “Mod-
eling and measurement of flow effects on tracheal sounds,” Biomedical
Engineering, IEEE Transactions on, vol. 50, no. 1, pp. 1–10, 2003.
[159] A. D. Droitcour, T. B. Seto, B.-K. Park, S. Yamada, A. Vergara,
C. El Hourani, T. Shing, A. Yuen, V. M. Lubecke, and O. Boric-Lubecke,
“Non-contact respiratory rate measurement validation for hospitalized
149

Bibliography
patients,” in Engineering in Medicine and Biology Society, 2009. EMBC
2009. Annual International Conference of the IEEE. IEEE, 2009, pp.
4812–4815.
[160] M. Uenoyama, T. Matsui, K. Yamada, S. Suzuki, B. Takase, S. Suzuki,
M. Ishihara, and M. Kawakami, “Non-contact respiratory monitoring sys-
tem using a ceiling-attached microwave antenna,” Medical and Biological
Engineering and Computing, vol. 44, no. 9, pp. 835–840, 2006.
[161] D. Dei, G. Grazzini, G. Luzi, M. Pieraccini, C. Atzeni, S. Boncinelli,
G. Camiciottoli, W. Castellani, M. Marsili, and J. Lo Dico, “Non-contact
detection of breathing using a microwave sensor,” Sensors, vol. 9, no. 4,
pp. 2574–2585, 2009.
[162] L. Boccanfuso and J. M. O’Kane, “Remote measurement of breathing
rate in real time using a high precision, single-point infrared temperature
sensor,” in Biomedical Robotics and Biomechatronics (BioRob), 2012 4th
IEEE RAS & EMBS International Conference on. IEEE, 2012, pp.
1704–1709.
[163] S. Y. Chekmenev, H. Rara, and A. A. Farag, “Non-contact, wavelet-based
measurement of vital signs using thermal imaging,” in The first inter-
national conference on graphics, vision, and image processing (GVIP),
Cairo, Egypt, 2005, pp. 107–112.
[164] I. Levai, V. Sidoroff, and R. Iles, “An introduction to the non-invasive
non-contact assessment of respiratory function,” Respiratory Therapy,
vol. 7, no. 5, p. 43, 2012.
[165] A. Aliverti, R. Dellaca, P. Pelosi, D. Chiumello, A. Pedotti, and L. Gat-
tinoni, “Optoelectronic plethysmography in intensive care patients,”
American journal of respiratory and critical care medicine, vol. 161, no. 5,
pp. 1546–1552, 2000.
[166] R. L. Dellaca, M. L. Ventura, E. Zannin, M. Natile, A. Pedotti, and
P. Tagliabue, “Measurement of total and compartmental lung volume
changes in newborns by optoelectronic plethysmography,” Pediatric re-
search, vol. 67, no. 1, pp. 11–16, 2010.
[167] M.-C. Yu, J.-L. Liou, S.-W. Kuo, M.-S. Lee, and Y.-P. Hung, “Noncon-
tact respiratory measurement of volume change using depth camera,”
in Engineering in Medicine and Biology Society (EMBC), 2012 Annual
International Conference of the IEEE. IEEE, 2012, pp. 2371–2374.
150

Bibliography
[168] F. Benetazzo, A. Freddi, A. Monteriu, and S. Longhi, “Respiratory rate
detection algorithm based on rgb-d camera: theoretical background and
experimental results,” Healthcare Technology Letters, vol. 1, no. 3, pp.
81–86, 2014.
[169] N. Bernacchia, L. Scalise, L. Casacanditella, I. Ercoli, P. Marchionni,
and E. P. Tomasini, “Non contact measurement of heart and respiration
rates based on kinectTM,” in Medical Measurements and Applications
(MeMeA), 2014 IEEE International Symposium on. IEEE, 2014, pp.
1–5.
[170] H. Aoki, M. Miyazaki, H. Nakamura, R. Furukawa, R. Sagawa, and
H. Kawasaki, “Non-contact respiration measurement using structured
light 3-d sensor,” in SICE Annual Conference (SICE), 2012 Proceedings
of. IEEE, 2012, pp. 614–618.
[171] S. Stick, E. Ellis, P. LeSouef, and P. Sly, “Validation of respiratory in-
ductance plethysmography (“respitrace” R©) for the measurement of tidal
breathing parameters in newborns,” Pediatric pulmonology, vol. 14, no. 3,
pp. 187–191, 1992.
[172] W. J. Daily, M. Klaus, H. Belton, and P. Meyer, “Apnea in premature
infants: monitoring, incidence, heart rate changes, and an effect of envi-
ronmental temperature,” Pediatrics, vol. 43, no. 4, pp. 510–518, 1969.
[173] J. Usher Smith, R. Wareham, J. Lasenby, J. Cameron, P. Bridge, and
R. Iles, “Structured light plethysmography in infants and children-a pilot
study,” 2009.
[174] D. E. Odd, R. Lingam, A. Emond, and A. Whitelaw, “Movement out-
comes of infants born moderate and late preterm,” Acta pædiatrica, vol.
102, no. 9, pp. 876–882, 2013.
[175] I. Krageloh-Mann and C. Cans, “Cerebral palsy update,” Brain and de-
velopment, vol. 31, no. 7, pp. 537–544, 2009.
[176] M. HADDERS-ALGRA, K. R. Heineman, A. F. Bos, and K. J. Middel-
burg, “The assessment of minor neurological dysfunction in infancy using
the touwen infant neurological examination: strengths and limitations,”
Developmental Medicine & Child Neurology, vol. 52, no. 1, pp. 87–92,
2010.
[177] S. J. Korzeniewski, G. Birbeck, M. C. DeLano, M. J. Potchen, and
N. Paneth, “A systematic review of neuroimaging for cerebral palsy,”
Journal of child neurology, vol. 23, no. 2, pp. 216–227, 2008.
151

Bibliography
[178] M. Burger and Q. A. Louw, “The predictive validity of general
movements–a systematic review,” European journal of paediatric neu-
rology, vol. 13, no. 5, pp. 408–420, 2009.
[179] E. C. Cameron, V. Maehle, and J. Reid, “The effects of an early physical
therapy intervention for very preterm, very low birth weight infants: a
randomized controlled clinical trial,” Pediatric Physical Therapy, vol. 17,
no. 2, pp. 107–119, 2005.
[180] C. Einspieler, H. F. Prechtl, F. Ferrari, G. Cioni, and A. F. Bos, “The
qualitative assessment of general movements in preterm, term and young
infants—review of the methodology,” Early human development, vol. 50,
no. 1, pp. 47–60, 1997.
[181] C. Einspieler and H. F. Prechtl, “Prechtl’s assessment of general move-
ments: a diagnostic tool for the functional assessment of the young ner-
vous system,” Mental retardation and developmental disabilities research
reviews, vol. 11, no. 1, pp. 61–67, 2005.
[182] L. Adde, M. Rygg, K. Lossius, G. K. Øberg, and R. Støen, “General
movement assessment: predicting cerebral palsy in clinical practise,”
Early human development, vol. 83, no. 1, pp. 13–18, 2007.
[183] F. Ferrari, G. Cioni, C. Einspieler, M. F. Roversi, A. F. Bos, P. B. Paoli-
celli, A. Ranzi, and H. F. Prechtl, “Cramped synchronized general move-
ments in preterm infants as an early marker for cerebral palsy,” Archives
of pediatrics & adolescent medicine, vol. 156, no. 5, pp. 460–467, 2002.
[184] I. Bernhardt, M. Marbacher, R. Hilfiker, and L. Radlinger, “Inter-and
intra-observer agreement of prechtl’s method on the qualitative assess-
ment of general movements in preterm, term and young infants,” Early
human development, vol. 87, no. 9, pp. 633–639, 2011.
[185] L. Meinecke, N. Breitbach-Faller, C. Bartz, R. Damen, G. Rau, and
C. Disselhorst-Klug, “Movement analysis in the early detection of new-
borns at risk for developing spasticity due to infantile cerebral palsy,”
Human movement science, vol. 25, no. 2, pp. 125–144, 2006.
[186] C. Marcroft, A. Khan, N. D. Embleton, M. Trenell, and T. Plotz, “Move-
ment recognition technology as a method of assessing spontaneous general
movements in high risk infants,” Front. Neurol, vol. 5, pp. 22–30, 2015.
[187] N. Kanemaru, H. Watanabe, H. Kihara, H. Nakano, R. Takaya, T. Naka-
mura, J. Nakano, G. Taga, and Y. Konishi, “Specific characteristics of
spontaneous movements in preterm infants at term age are associated
152

Bibliography
with developmental delays at age 3 years,” Developmental Medicine &
Child Neurology, vol. 55, no. 8, pp. 713–721, 2013.
[188] N. Kanemaru, H. Watanabe, H. Kihara, H. Nakano, T. Nakamura,
J. Nakano, G. Taga, and Y. Konishi, “Jerky spontaneous movements
at term age in preterm infants who later developed cerebral palsy,” Early
human development, vol. 90, no. 8, pp. 387–392, 2014.
[189] L. Adde, J. L. Helbostad, A. R. Jensenius, G. Taraldsen, and R. Støen,
“Using computer-based video analysis in the study of fidgety move-
ments,” Early human development, vol. 85, no. 9, pp. 541–547, 2009.
[190] A. R. Jensenius, R. I. Godøy, and M. M. Wanderley, “Developing tools
for studying musical gestures within the max/msp/jitter environment,”
2005.
[191] F. Heinze, K. Hesels, N. Breitbach-Faller, T. Schmitz-Rode, and
C. Disselhorst-Klug, “Movement analysis by accelerometry of newborns
and infants for the early detection of movement disorders due to infantile
cerebral palsy,” Medical & biological engineering & computing, vol. 48,
no. 8, pp. 765–772, 2010.
[192] D. Karch, K.-S. Kang, K. Wochner, H. Philippi, M. Hadders-Algra,
J. Pietz, and H. Dickhaus, “Kinematic assessment of stereotypy in sponta-
neous movements in infants,” Gait & posture, vol. 36, no. 2, pp. 307–311,
2012.
[193] M. Fan, D. Gravem, D. M. Cooper, and D. J. Patterson, “Augmenting
gesture recognition with erlang-cox models to identify neurological disor-
ders in premature babies,” in Proceedings of the 2012 ACM Conference
on Ubiquitous Computing. ACM, 2012, pp. 411–420.
[194] D. Karch, K.-S. Kim, K. Wochner, J. Pietz, H. Dickhaus, and H. Philippi,
“Quantification of the segmental kinematics of spontaneous infant move-
ments,” Journal of biomechanics, vol. 41, no. 13, pp. 2860–2867, 2008.
[195] M. Gabel, R. Gilad-Bachrach, E. Renshaw, and A. Schuster, “Full body
gait analysis with kinect,” in Engineering in Medicine and Biology Society
(EMBC), 2012 Annual International Conference of the IEEE. IEEE,
2012, pp. 1964–1967.
[196] C.-Y. Chang, B. Lange, M. Zhang, S. Koenig, P. Requejo, N. Somboon,
A. A. Sawchuk, and A. A. Rizzo, “Towards pervasive physical reha-
bilitation using microsoft kinect,” in Pervasive Computing Technologies
for Healthcare (PervasiveHealth), 2012 6th International Conference on.
IEEE, 2012, pp. 159–162.
153

Bibliography
[197] R. A. Clark, Y.-H. Pua, K. Fortin, C. Ritchie, K. E. Webster, L. Denehy,
and A. L. Bryant, “Validity of the microsoft kinect for assessment of
postural control,” Gait & posture, vol. 36, no. 3, pp. 372–377, 2012.
[198] R. Wang, G. Medioni, C. Winstein, and C. Blanco, “Home monitoring
musculo-skeletal disorders with a single 3d sensor,” in Proceedings of the
IEEE Conference on Computer Vision and Pattern Recognition Work-
shops, 2013, pp. 521–528.
[199] M. Devanne, H. Wannous, S. Berretti, P. Pala, M. Daoudi, and
A. Del Bimbo, “3-d human action recognition by shape analysis of motion
trajectories on riemannian manifold,” IEEE transactions on cybernetics,
vol. 45, no. 7, pp. 1340–1352, 2015.
[200] N. Hesse, G. Stachowiak, T. Breuer, and M. Arens, “Estimating body
pose of infants in depth images using random ferns,” in Proceedings of the
IEEE International Conference on Computer Vision Workshops, 2015,
pp. 35–43.
[201] A. Cenci, D. Liciotti, E. Frontoni, A. Mancini, and P. Zingaretti, “Non-
contact monitoring of preterm infants using rgb-d camera,” in ASME
2015 International Design Engineering Technical Conferences and Com-
puters and Information in Engineering Conference. American Society
of Mechanical Engineers, 2015, pp. V009T07A003–V009T07A003.
[202] A. Cenci, D. Liciotti, E. Frontoni, P. Zingaretti, and V. P. Carnielli,
“Movements analysis of preterm infants by using depth sensor,” in Pro-
ceedings of the International Conference on Internet of Things and Ma-
chine Learning (IML 2017). Liverpool, UK., 2017.
[203] J. MacQueen et al., “Some methods for classification and analysis of
multivariate observations,” in Proceedings of the fifth Berkeley symposium
on mathematical statistics and probability, vol. 1, no. 14. Oakland, CA,
USA., 1967, pp. 281–297.
[204] M. D. Olsen, A. Herskind, J. B. Nielsen, and R. R. Paulsen, “Body part
tracking of infants,” in Pattern Recognition (ICPR), 2014 22nd Interna-
tional Conference on. IEEE, 2014, pp. 2167–2172.
[205] S. Maldonado-Bascon, S. Lafuente-Arroyo, P. Gil-Jimenez, H. Gomez-
Moreno, and F. Lopez-Ferreras, “Road-sign detection and recognition
based on support vector machines,” IEEE transactions on intelligent
transportation systems, vol. 8, no. 2, pp. 264–278, 2007.
154

Bibliography
[206] N. Moon, E. Bullitt, K. Van Leemput, and G. Gerig, “Automatic brain
and tumor segmentation,” Medical Image Computing and Computer-
Assisted Intervention—MICCAI 2002, pp. 372–379, 2002.
[207] G.-Q. Wei, K. Arbter, and G. Hirzinger, “Automatic tracking of laparo-
scopic instruments by color coding,” in CVRMed-MRCAS’97. Springer,
1997, pp. 357–366.
[208] A. Cohen, E. Rivlin, I. Shimshoni, and E. Sabo, “Memory based active
contour algorithm using pixel-level classified images for colon crypt seg-
mentation,” Computerized Medical Imaging and Graphics, vol. 43, pp.
150–164, 2015.
[209] C. Huang, L. Davis, and J. Townshend, “An assessment of support vector
machines for land cover classification,” International Journal of remote
sensing, vol. 23, no. 4, pp. 725–749, 2002.
[210] D. L. Pham, C. Xu, and J. L. Prince, “A survey of current methods in
medical image segmentation, technical report jhu/ece 99–01.” Baltimore:
Department of Electrical and Computer Engineering, The Johns Hopkins
University, 2001.
[211] R. Girshick, J. Donahue, T. Darrell, and J. Malik, “Rich feature hierar-
chies for accurate object detection and semantic segmentation,” in The
IEEE Conference on Computer Vision and Pattern Recognition (CVPR),
June 2014.
[212] A. Krizhevsky, I. Sutskever, and G. E. Hinton, “Imagenet classification
with deep convolutional neural networks,” in Advances in Neural
Information Processing Systems 25, F. Pereira, C. J. C. Burges,
L. Bottou, and K. Q. Weinberger, Eds. Curran Associates, Inc.,
2012, pp. 1097–1105. [Online]. Available: http://papers.nips.cc/paper/
4824-imagenet-classification-with-deep-convolutional-neural-networks.
[213] D. Ciresan, A. Giusti, L. M. Gambardella, and J. Schmidhuber, “Deep
neural networks segment neuronal membranes in electron microscopy im-
ages,” in Advances in neural information processing systems, 2012, pp.
2843–2851.
[214] C. Farabet, C. Couprie, L. Najman, and Y. LeCun, “Learning hierarchical
features for scene labeling,” IEEE transactions on pattern analysis and
machine intelligence, vol. 35, no. 8, pp. 1915–1929, 2013.
155
http://papers.nips.cc/paper/4824-imagenet-classification-with-deep-convolutional-neural-networks.pdf

Bibliography
[215] S. Gupta, R. Girshick, P. Arbelaez, and J. Malik, “Learning rich features
from rgb-d images for object detection and segmentation,” in European
Conference on Computer Vision. Springer, 2014, pp. 345–360.
[216] H. Zhu, F. Meng, J. Cai, and S. Lu, “Beyond pixels: A comprehensive
survey from bottom-up to semantic image segmentation and cosegmen-
tation,” Journal of Visual Communication and Image Representation,
vol. 34, pp. 12–27, 2016.
[217] A. Garcia-Garcia, S. Orts-Escolano, S. Oprea, V. Villena-Martinez, and
J. Garcia-Rodriguez, “A review on deep learning techniques applied to
semantic segmentation,” arXiv preprint arXiv:1704.06857, 2017.
[218] S. Ioffe and C. Szegedy, “Batch normalization: Accelerating deep network
training by reducing internal covariate shift,” in International Conference
on Machine Learning, 2015, pp. 448–456.
[219] K. Chatfield, K. Simonyan, A. Vedaldi, and A. Zisserman, “Return of the
devil in the details: Delving deep into convolutional nets,” arXiv preprint
arXiv:1405.3531, 2014.
[220] K. Simonyan and A. Zisserman, “Very deep convolutional networks for
large-scale image recognition,” arXiv preprint arXiv:1409.1556, 2014.
[221] P. Sermanet, D. Eigen, X. Zhang, M. Mathieu, R. Fergus, and Y. Le-
Cun, “Overfeat: Integrated recognition, localization and detection using
convolutional networks,” arXiv preprint arXiv:1312.6229, 2013.
[222] L. R. Dice, “Measures of the amount of ecologic association between
species,” Ecology, vol. 26, no. 3, pp. 297–302, 1945.
[223] “Boost Library,” http://www.boost.org/.
[224] M. Hadders-Algra, “General movements: a window for early identifica-
tion of children at high risk for developmental disorders,” The Journal of
pediatrics, vol. 145, no. 2, pp. S12–S18, 2004.
156