Why rational choice theory does not deserve paradigmatic ...

1
Curricular Choice: A Test of a Rational Choice Model
of Education
Forthcoming European Sociological Review
April 21, 2009
Limor Gabay-Egozi, Yossi Shavit
Tel Aviv University
and
Meir Yaish
University of Haifa
Word count: 10,820
Number of tables: 8

2
Abstract
Rational choice theories of education view student's educational decision
as a sequence of binary choices between options that entail long-term
utility and options that reduce short-term risk of failure. One of the best
articulated models of educational choice (Breen and Goldthorpe, 1997)
asserts that choice between alternative options is affected by students'
utility considerations, their expectations regarding the odds of success or
failure in alternative educational options, and their motivation to avoid
downward social mobility. We evaluated these propositions using data on
students' curricular choices in Tel Aviv-Jaffa high schools. We found that
educational choice was affected by subjective utility and failure
expectations, but not by class maintenance motivations. Just as
important, and contrary to the model's main assertion, educational
inequality between social strata was not mediated by any of these choice
mechanisms. Finally, and importantly, about a fifth of the students in Tel
Aviv-Jaffa did not choose between long-term utility and short-term risks,
but combined the two. These students, the hedgers, combined the riskier
scientific subjects that are expected to yield long-term utility with social
sciences and the humanities that reduce the risk of failure in the short
term, but are not expected to yield large long-term utilities. The hedgers,
moreover, were shown to be disproportionately female and drawn from
disadvantaged social strata. These results suggest that educational
systems that allow multiple rather than alternative choices may enhance
the attainment of working-class youth because they enable them to opt
for long term utility while providing a safety-net in the form of additional
safer subjects.

3
Theoretical Background
Introduction
In recent years policy makers have advocated choice in education as a means
to enhance equality of educational opportunity (Hayman et al., 1997; Plank
and Sykes, 2003). But as some argue, choice could be a stratifying rather
than an equalizing mechanism in the educational attainment process. For
example, Ayalon (2006), who studied students in Israeli high schools differing
in the degree of choice available to students, found that gender and
socioeconomic differences among them were more pronounced where choice
was prevalent. The implications of educational choice for educational
stratification therefore merit study.
One of the main debates in the literature on educational
stratification is encapsulated in the title of Gambetta’s (1987) book: Were
They Pushed or Did They Jump? Push factors refer to the various
structural and social constraints that determine students' educational
attainment, while pull factors refer to choice. These concepts echo
Boudon's (1974) distinction between primary and secondary effects. The
former are factors responsible for the association between social origins
and children’s scholastic ability and performance; the latter are factors
that account for educational choices controlling for class differences in
ability.
In recent years interest has grown in choice-related explanations of
educational stratification (e.g., Boudon, 1974; Gambetta, 1987;
Goldthorpe, 1996, 1998; Erikson and Jonsson, 1996; Breen and

4
Goldthorpe, 1997; Morgan, 1998, 2005). Rational-choice theory, for
example, assumes that individuals are conscious decision makers whose
choices are influenced by a costs-benefit calculus (Hedström and Stern,
2008). The growing interest in choice as an educational stratification
mechanism has led scholars to develop theoretical models to explain why
children of similar abilities but different class backgrounds are observed to
make different educational choices (Goldthorpe, 1996, 1998; Erikson and
Jonsson, 1996; Breen and Goldthorpe, 1997; Morgan, 1998, 2005). One
of the most influential of these models is Breen and Goldthorpe's
(henceforth BG) model of educational decision making. Although this
model was motivated by, and developed to explain persistent inequality in
class based educational opportunity (cf. Blossfeld and Shavit, 1993), it is
ultimately a model of educational choice (cf. Breen and Yaish, 2006;
Stocké, 2007; Van de Werfhorst and Hofstede, 2007), and we approach it
as such. Importantly, the BG model is theoretically well developed, and a
number of empirical studies have found support for its predictions
regarding the statistical association between class and educational
attainment patterns (Need and De Jong, 2000; Davies et al., 2002; Breen
and Yaish, 2006). Yet, the model's assumptions have rarely been tested
directly (cf. Stocké, 2007; Van de Werfhorst and Hofstede, 2007).
Choice and Educational Stratification
Most studies on the determinants of inequality of educational opportunity
focus on two main sets of variables: familial resources and characteristics

5
of the educational system. Among them are families' economic resources
(Duncan et al., 1998), cultural resources (De Graaf et al., 2000),
students’ track placement (Shavit, 1984, 1990) and the curriculum
offered in schools (Apple, 1990; Oakes, 1990; Ayalon, 1995, 2002;
Burkam et al., 1997). The privileged classes benefit from a variety of
material, cultural and cognitive assets which they mobilize to gain a persistent
edge in the competition for desired credentials, and the educational systems
are often structured in ways that benefit them further (e.g., Halsey et al.,
1980; Gamoran and Mare, 1989).
More recently, choice, rather than constraint, has attracted increasing
attention as a stratifying mechanism in the educational attainment process.
Some scholars have noted that despite the attenuation of structural
constraints on processes of educational stratification, inequality between
social strata in educational attainment persists. For example, Lucas argued
that despite the replacement of overt tracking by apparent choice in course
selection in America, de facto tracking persisted, as did class and race-based
inequality therein (Lucas, 1999). Scholars interested in pull factors argue
that inequality is also due to processes involving choice (e.g., Goldthorpe,
1996; Breen and Goldthorpe, 1997). Several studies have shown that
class differentials in educational attainment persist even after controlling
for push factors and scholastic performance (cf. Erikson and Jonsson,
1996; Breen and Jonsson, 2000; Need and De Jong, 2000; Davies et al.,
2002; Breen and Yaish, 2006). In England and Wales, for example, class
differentials in educational choice account for about 25 percent of inter-

6
class educational inequality (Erikson et al., 2005; Jackson et al., 2007).
The publication of BG's (1997) paper stimulated considerable
research on rational choice processes in education. Following Mare
(1981), BG view the educational attainment process as a sequence of
transition points at which students (and their families) decide whether to
drop out or to continue to the next level in any of the available
educational options. At each transition point students evaluate each available
option in terms of the expected utility to be gained by successfully completing
it, and in terms of the risk of failing to do so.1 Utility is defined as the
degree to which completion would enhance the student's future
occupational and economic attainment. Risk is defined as the odds of
failing to complete the prescribed course of study.
Importantly, the model implies that subjective utility and risk are
positively correlated. This is because educational trajectories that are
associated with high utility expectations are also associated with high
failure expectations. Thus, decision makers face an inherent dilemma
between maximizing the former and minimizing the latter.
The theoretical centerpiece of BG's model is the so called Relative
Risk Aversion mechanism (RRA). Accordingly, there exists a threshold
that determines a student’s minimum acceptable level of educational
attainment, which will guarantee entry to a class position at least as good
as that of their parents. In other words, students set their threshold at a
level that will minimize the risk of downward mobility (Breen and
Goldthorpe, 1997, p. 283-5). The model further assumes that students

7
from all social classes are equally motivated to maintain their parental
class position. The implications of the RRA mechanism for educational
choice, however, differ by class background. For upper class children it
implies choosing the risky option because this alone will lead them to the
upper class. Conversely, working-class children tend to choose less risky
options because they suffice for the attainment of working-class
occupations. When individuals reach an educational threshold which they
believe will gain them entry into the same social class position as their
parents', the costs of pursuing any further education (in terms of real
costs, earnings forgone, and the risk of failure to complete) outweigh the
utility of doing so (Breen and Yaish, 2006). Hence, net of scholastic
ability, the RRA mechanism raises the class differentials in educational
choice, and reproduces inequality of educational attainment between
classes.
In sum, BG's model postulates that students' educational choices are
affected by: their beliefs about the relative utility of available alternatives;
their beliefs about the relative odds of success or failure in each alternative,
and their motivation to avoid downward mobility. Although BG recognize class
differences in scholastic ability and economic resources (Breen and
Goldthorpe, 1997, p. 283), they further assume that net of ability, classes do
not differ in relative risk aversion motivation; future utility attributed to
educational options, and success expectations within different educational
trajectories. This study tests the motivational mechanisms underlying the

8
BG model in the context of curricular choice of secondary school students
in Tel Aviv-Jaffa in Israel.
BG's objective was theoretical and they did not test their
propositions empirically. In recent years others have attempted to do so
(Need and De Jong, 2000; Davies et al., 2002; Holm and Jager, 2005;
Breen and Yaish, 2006; Van de Werfhorst and Hofstede, 2007; Stocké,
2007), with mixed results. Most of these studies examine the model's
behavioral predictions rather than its motivational mechanisms directly.
For example, Need and De Jong (2000) analyzed data on Dutch
secondary school students. They evaluated the RRA proposition by testing
whether students wish to attain an educational level at least as high as
their parents'. They did not explore whether students' level of educational
aspiration was motivated by a fear of class demotion, as assumed by the
Breen and Goldthorpe model. Similarly, in their Danish study Davies et al.
(2002) noted that if RRA is correct, when students reach their parents'
level of education, they gain no additional utility from any further
education. They argue that this means that the impact of parental
education should be strongest on students' transitions up to the
educational level attained by their parents themselves, and would decline
thereafter. Again, this is an indirect derivative of RRA. Finally, Breen and
Yaish (2006) tested behavioral predictions of the BG model in England
and Wales but did not measure directly any of the motivational variables
suggested by the model.

9
Only two studies tested the actual motivational processes
underlying the model. Using survey data taken from secondary school
pupils in Amsterdam, Van de Werfhorst and Hofstede (2007) tested
whether, and to what extent, family cultural capital and relative risk
aversion explained the educational performance and ambitions of
secondary school students in Amsterdam. Unlike previous studies, they
measured RRA directly by asking students to indicate how closely they
agreed with a series of six statements such as "I find it important to
achieve a better job than my parents" (p. 399). The reliability of the
composite measure was 0.77. They found that the effects of social origin
on school performance were largely mediated by cultural capital rather
than by RRA, while RRA rather than cultural capital affected educational
ambitions. Hence, cultural reproduction theory provides an important
explanation for class inequalities in early school performance, whereas
ambitions are affected by concerns with mobility, as suggested by Breen
and Goldthorpe. By measuring RRA directly, Van de Werfhorst and
Hofstede advanced research on rational choice in education substantially,
but they did not measure the model's other motivational components.
Specifically they did not measure the subjective utility and the failure
expectations that students associate with the alternative options they
face.
Utilizing data on parents of fourth graders in Rhineland-Palatinate in
Germany, Stocké (1997), provided the most comprehensive test to date
of the motivational mechanisms proposed by the BG model: subjective

10
costs, success probabilities, and the status maintenance motivation
(RRA). He found that net of ability, parents' subjective beliefs about their
children's' odds of success, as well as RRA (but see below), strongly
affected their educational choices. However, contrary to BG's expectation,
he did not find that these mechanisms mediated class inequality in
secondary school choice.
Stocké measured RRA using two questionnaire items: (i) ‘For many
parents, the occupational future of their children is particularly important.
Would you please tell me how strongly it would bother you if your child
reached a less prestigious occupation than yourself?’ (ii) ‘Please think
about what your child will be able to reach in future with different
educational degrees. As how likely do you regard it that your child,
endowed with the different educational degrees, will be able to reach
occupationally at least what you reached?' (asked for all three degrees)
(verbatim, Stocké, 2007, p. 517 notes 4 and 5).
In our view, the first question measures RRA and is consistent with
the measure employed by Van de Werfhorst and Hofstede (2007). The
second question would appear to measure the labor market returns that
parents attribute to various educational credentials. In other words, it
measures utility expectations rather than RRA. We note in Stocké's
findings that while the measure of subjective utility affected educational
choices RRA did not.
The aim of our study is to provide a comprehensive and direct test
of the motivational mechanisms underlying the BG model. Like Stocké, we

11
simultaneously test whether subjective utility, failure expectations and
RRA affect educational choices. However, we employ Van de Werfhorst
and Hofstede's measure of RRA. We test the following hypotheses:
Hypothesis I: Students' educational choices are affected by their
subjective utility, namely their beliefs as to the likely returns on the
various educational options.
Hypothesis II: Students' educational choices are driven by their beliefs as
to their own odds of success or failure in the alternative educational
options.
Hypothesis III: Educational decisions are motivated by individuals'
apprehension of downward class mobility (i.e., the relative risk aversion).
Hypothesis IV: The three motivational mechanisms discussed above
mediate socio-economic inequality in educational choices.
Hypothesis V: Students of different socio-economic backgrounds (e.g.,
class) do not differ in any of the following: (i) their relative risk aversion;
(ii) their subjective future utility attributed to educational options; and
(iii) net of ability, their success expectations in the different educational
options.
The Setting, Data and Variables
The Setting
We tested these hypotheses with data on the choice of major subjects by
secondary school students in Tel Aviv-Jaffa in Israel. Our sample was
ninth and tenth graders who were about to choose a major for their

12
matriculation examinations. The choice of advanced courses and
examinations is an important junction in the socioeconomic life course of
young Israelis. At age twelve, after a year in pre-school and six years in
primary school, Israeli children enter middle schools where they spend
grades seven, eight and nine. This spell is followed by upper secondary
school in grades ten through twelve, where students are prepared for the
matriculation examinations leading to the award of the matriculation
certificate (bagrut), which is required for higher education.2
The secondary school curriculum is composed of compulsory and
elective subjects, such that students can choose from a range of
advanced academic courses in different subjects. The various subjects are
offered at different levels, ranging from one to five units, and students
must pass exams in subjects totaling at least 21 units to earn the
matriculation certificate.3
Seven subjects are compulsory (English, Mathematics, Civic
Studies, Bible Studies, History, Literature, and Hebrew language – in the
Hebrew school sector), and must be taken at either a basic (1-3 units) or
an advanced (4 or 5 units) level. Students must also take at least one
elective major at an advanced level. Advanced majors are usually chosen
during the spring term of tenth grade (although in one of the schools we
studied students made the choice as early as ninth grade).
The elective majors are not stratified formally, and they should in
principle all open meaningful educational opportunities. Nevertheless,
informal stratification of these majors does exist, such that students from

13
an advantaged social background tend to specialize in the sciences, while
those from a lesser social background tend to specialize in the humanities and
the social sciences (Ayalon, 1994, 1995; Ayalon and Yogev, 1997).
Admission into higher education predicates a matriculation
certificate, and the more prestigious departments and institutions of
higher education set several additional requirements: (1) advanced
English (at least 4 units); (2) a high matriculation grade point average;
(3) some technical and prestigious departments (e.g., engineering and
the sciences) and institutions (e.g., the Technion) specifically require
higher matriculation grades in advanced math and sciences. The
elaborate formula employed by universities also tends to favor applicants
who have passed more than one advanced level examination.
In recent cohorts, 54 percent of students obtained the matriculation
diploma (Ministry of Education, 2007). Of those who sat for matriculation
examinations, about 65 percent passed all the examinations necessary for
the diploma. Mathematics and English are generally regarded difficult
examinations, and unlike other difficult subjects (e.g., Physics, Chemistry
and Computer Science) they are compulsory. In an effort to raise
students' success rates in Mathematics schools evaluate their
performance early on and assign them to unit levels as early as ninth
grade. Once a student has been placed on a level he or she has little
further choice in the matter except to opt for a lower level.
Data

14
In the spring term of 2006 we collected data in four public secondary
schools in Tel Aviv-Jaffa. With a population of nearly 400,000, Tel Aviv-
Jaffa is Israel's largest city and is the core of the Tel Aviv Metropolitan
area with its population of about three million (Tel Aviv-Jaffa, 2007). Tel
Aviv-Jaffa has nine administrative districts, which are fairly homogeneous
socio-economically (Tel Aviv-Jaffa, 2006). Southern districts are typically
working class while northern ones are middle class.
We restricted our sample to Hebrew academic secular high schools
in Tel Aviv-Jaffa. We excluded vocational, religious, Arab and two magnet
schools because they differ in their curricular menu and emphasis.
Vocational schools offer a limited menu of academic subjects with an
abundance of technical ones, Jewish religious schools emphasize religious
studies and encourage their stronger students to take these rather than
the sciences, and Arab schools offer a somewhat different curriculum than
Hebrew schools. Specifically, they teach different languages (Hebrew and
English as foreign languages rather than English, Arabic and French), put
less emphasis on Bible studies, and teach some Koran instead. One of the
two magnet schools specializes in the arts and the other caters primarily
to Russian immigrant children and offers a mix of Russian and Hebrew
curricula. In the interest of simplification, we chose to restrict the sample
to schools which share a common curriculum.
Of the remaining seven schools in the city we sampled two in
working-class districts and two in middle-class districts. Fortunately, all
four school principals cooperated with the study and allowed us access to

15
their schools. The four schools offer students similar core curricula, as
well as the option to choose among the following advanced subjects:
Physics, Chemistry, Computer Science, Biology, Economics, Social
Sciences, History, Literature and Communication.
We distributed self-administered questionnaires among tenth
graders attending three of the schools and among both tenth and ninth
graders in the fourth (because students at that school where encouraged
to choose an advanced major as of ninth grade). In total, we collected
data in 28 classes and obtained 683 completed student questionnaires. Of
these, 18 percent were incomplete and were excluded from the analysis,
which accordingly covered 563 cases.4
Like Stocké's (2007) and Van de Werfhorst and Hofstede's (2007)
studies before us, our sample too is local rather than nationally
representative. However, our data include good measurements of the
central theoretical concepts under investigation, including relative risk
aversion, utility and failure expectations, as well as social origins and
other control variables (see below). While acknowledging the limited
generalizability of our findings beyond Tel Aviv-Jaffa, we believe that our
data are suitable to the task at hand. If the BG model holds as a general
theory, it should help explain socio-economic differences in educational
attainment in Tel Aviv and in other stratified communities. To anticipate,
the results of our study together with those of Stocké (2007) and Van de
Werfhorst and Hofstede (2007), add up to a rather consistent message
with respect to the BG model.

16
The Dependent Variables
We study the determinants of two types of curricular choices that
students make in anticipation of their matriculation examinations.
Respondents were presented with a list of electives that were available in
their school, and were asked to indicate whether or not they intend to
take each of them at an advanced level. The distribution of choices shown
in Table 1 indicates that boys tended to choose Physics, Computers,
Economics and other Social Sciences, while girls are more inclined to take
the Social Sciences, Communications, Economics and Biology.
Our first dependent variable distinguishes between those who chose
to take English at an advanced (4 or 5 units), rather than at a basic level
(3 units). Recall that admission into higher education predicates a
matriculation certificate with advanced English. Thus, the choice of
advanced English has very clear stratifying consequences. Given the
importance of advanced English for university enrolment, it is not
surprising to see in Table 1 that 93 Percent of our respondents intended
to take English at that level.5
Our second dependent variable concerns the choices that students
make among the elective subjects. Following common practice in the
literature on school curriculum (Apple, 1990; Kliebard, 1992; Kamens and
Benavot, 1992) we form the nine elective subjects into two groups: the
sciences (Physics, Chemistry, Computers, and Biology) and the
humanities and social sciences (Economics, Social Sciences, History,

17
Literature, and Communications). The sciences (hereafter hard subjects)
are generally regarded as more prestigious than the humanities and
social sciences (hereafter soft subjects) and are considered more
demanding (Ayalon and Yogev, 1997).
[TABLE 1 HERE]
In Table 2 we compare the three curricular choices in terms of
perceived utility and risk of failure. We measured perceived utility by
asking respondents the following question: "For each subject listed below,
in your opinion, if a student succeeds in this subject at the 5-unit level,
what are his or her chances of admission to a university?" [scale: 1 ('not
high at all') to 5 ('very good')]. Perception of risk is defined as students'
subjective belief that they would gain a low grade (64 or less on a 100-
point scale) in a subject were they to take it at an advanced level.
Students' perception of risk in the hard or the soft subjects is then refers
to the proportion of those who thought that their grade, in each subject
within the hard and the soft subjects, would be low. As seen in Table 2,
on average, (across subjects) students perceived the hard electives as
associated with both higher utility and a higher risk of failure than the soft
electives.6 The utility that students associate with advanced English is
higher than the mean utility associated with either the hard or the soft
electives. In addition, the risk of failure they associate with advanced
English is comparable to that associated with the soft subjects which are
perceived as relatively safe.

18
[TABLE 2 HERE]
As indicated earlier, although students are only required to take one
advanced subject to be eligible for a matriculation certificate, there are
strong incentives for taking more because students can then discount the
advanced subject in which they scored lowest. The great majority (96
percent) of students in our sample did indicate that they intended to take
two or more advanced electives. Although most students tended to pick
subjects within the two clusters of electives, some intended to take a mix
of both hard and soft subjects. Thus, our second dependent variable
consists of a three-category classification representing choice of advanced
subjects: (i) hard subjects (Physics, Chemistry, Computer Science, and
Biology); (ii) soft subjects (Economics, Social Sciences, History, Literature
and Communication); and, (iii) a mixture of both. As seen in Table 3, 36
percent of the students in our sample intended to take advanced subjects
in the sciences alone, 42 percent intended to take only soft subjects, and
22 percent intended to take a mix of the two.
[TABLE 3 HERE]
Thus, about a third of students who intended to take a hard elective
seemed to hedge their risk of failure by taking a soft elective too. This
strategy seems quite reasonable given that students are only required to
complete a single advanced elective course and can discount an extra
course in which they might do poorly.

19
Independent Variables
As noted, the rational choice model of education refers to three
motivational variables (i.e., secondary factors) affecting educational
choice: relative risk aversion, and, for each educational option, beliefs
about future utilities and beliefs about failure expectation.
We measured Relative Risk Aversion with the following questions:
"To what extent do you agree with each of the following statements?
[scale: 1 ('strongly disagree') to 5 ('strongly agree')]:
a. It is important for me to work in an occupation that is better than the occupations of my parents
b. It is important for me that my salary be at least equal to the level of my parents' salary.
c. My parents would not be satisfied if I were to work at a lower occupation than theirs.
d. I would like to attain a social class on a level at least equal to my parents'.
e. I am concerned that I might reach a social class that is lower than the social class of my parents
f. It is important for me to attain a higher level of education than the level of education of my parents"
This measure is based on Van de Werfhorst and Hofstede's six scale items
measurement of Relative Risk Aversion (2007). Items (b) to (e) represent
students' concern with downward mobility whereas items (a) and (f)
represent their attitude to upward mobility. Consistent with Van de
Werfhorst and Hofstede's measurement, factor analysis of these six items
found them to load on a single factor, which we interpret to represent the
class maintenance motivation (i.e., relative risk aversion). This factor
accounted for approximately 63 percent of the total variance in the test

20
items, and the factor loadings of five out of the six items were above .66
(item e=.47). The relatively low loading of item e is probably related to
the translation of the original statement, and was therefore removed from
the analysis due to translation issue.7 .The five item factor accounted for
approximately 72 percent of the total variance, and its reliability was
identical to that obtained by Werfhorst and Hofstede (.78).
Beliefs about future utilities were measured by the question cited
earlier concerning the subjective odds that a student (i.e., any student)
who succeeds in each subject will enter university. For each student we
computed the mean perception of success associated with the hard
subjects and the soft subjects. The ratio of the former to the latter was
then our measure of the relative utility that students attribute to the hard
subjects as against the soft subjects.
Relative Failure Expectation was measured as the difference
between the proportion of hard and soft subjects respectively, in which
the student expected to obtain a low grade (64 or less). High values
represent apprehension of the hard subjects.
Control Variables
Following well documented gender differences in curricular choices (e.g.,
Ayalon, 1995; Bradley, 2000), we include a dummy variable for gender.
Against the relatively constancy of class differentials in educational
attainment, in nearly all advanced societies gender differentials in levels
of educational attainment (favoring males over females) have declined

21
sharply and even reversed since the 1970s. BG attribute the decline to
perceptions of rising occupational and economic returns to women's
education (Breen and Goldthorpe, 1997, p. 296-7). In a footnote, they
also refer to gender differences in subject choice (Breen and Goldthorpe,
1997, p. 303, note 10) and suggest that since women expect their
careers to be interrupted by family obligations, they are prefer subjects
which lead to occupations that afford flexible working arrangements. To
anticipate, and consistent with other studies on gender differences in
curricular choices (e.g., Ayalon, 1995; Bradley, 2000), we find boys were
more likely than girls to take hard rather than soft electives.
We indicate social origin by two variables: parental education and
family economic resources. We began our analysis with class as an
indicator of social origin but soon realized that student reports of father's
occupation and of his employment status (which are the building blocks of
the class schema) are highly unreliable, therefore, we prefer to represent
social origins with parental education and their economic resources.
Parental education was measured as the highest qualification obtained by
either father or mother. It was measured by a six-category classification
which maintains a clear hierarchical order. In addition, Students were also
asked to provide information on the availability of a variety of durable
goods in the home (such as air-conditioning, computer, dishwasher, car,
etc.). Economic resources were measured as the sum of available items in
the parental household.8

22
Students' scholastic performance was indicated by their grades,
measured as the mean of self-reported grades in Hebrew, English and
Mathematics on the most recent report card. Grouping was the level at
which a student considered himself or herself in tenth-grade Mathematics.
It was coded as a dummy variable indicating advanced placement. As
noted earlier, group placement is largely determined by students’ prior
performance in Mathematics and once placement has been made it is an
evident push factor which affects subsequent curricular choice. Students
placed in low level Mathematics are unlikely to choose advanced hard
subjects.
Finally, we controlled for the number of subjects the student
intended to take at an advanced level, because the odds of taking a
mixture of both hard and soft subject should increase, the more subjects
students take. The inclusion of this variable in our models did not
substantially alter the effects of any of the other variables.
Empirical Findings
Descriptive Analysis
Table 4 presents descriptive statistics of the independent variables by
curricular choices: the choice of advanced and basic English, and the
choice among the three categories of advanced matriculation electives.
Consistent with previous studies in Israel (Ayalon and Yogev, 1997;
Ayalon, 2003; Katz-Gerro and Yaish, 2003) and elsewhere (Ma and

23
Willms, 1999; Bradley, 2000), we found that boys were more likely than
girls to take hard rather than soft subjects.
[TABLE 4 HERE]
As expected, we also see that students who chose advanced English
and the more demanding and rewarding sciences were disproportionately
drawn from a more advantaged social background than those who chose
the less demanding subjects (cf. Oakes et al., 1992; for Israel see Ayalon,
1994, 1995; Ayalon and Yogev, 1997). More importantly, on average,
students who chose a mix of hard and soft subjects (the hedgers) came
from lower strata than those who selected either pure category of
subjects (hard or soft ones). This is an interesting result that we shall
return to later.
Regarding scholastic performance and grouping, the entries in Table
4 reveal that students who chose hard subjects won higher grades than
those who selected the mixed or the soft subjects. Similarly, those who
chose hard subjects were more likely to have been placed in an advanced
group in math. The same apply for the differences between those who
choose advanced English compared with their counterparts who intended
to take the subject at a basic level.
Turning to the motivational factors, we see that those who selected
advanced English evinced more confidence in their ability to succeed in
the subject than those who chose it at a basic level. There are no
significant differences in Relative Risk Aversion and in utility expectations

24
between those who chose advanced and basic English. As for the three
clusters of electives, we see that students who chose mixed subjects
exhibited the highest degree of relative risk aversion, suggesting that
those who are concerned with class maintenance hedge their risk by
adopting a mixed strategy. The hard (and risky) subjects increase the
expected long-term utility of the mix and if one does poorly in these,
success in the soft subjects averts short-term failure. Thus, choosing a
mix of electives could minimize exposure to unwanted short-term risks,
while allowing the possibility of long-term success in higher education and
in the labor market.
Expectedly, those who selected hard subjects hold stronger beliefs
about their positive utility (i.e., admission to university) than those who
chose the other combinations, and those who selected soft subjects
showed the lowest confidence in their ability to gain academic success in
the hard subjects. Also expectedly, the more advanced subjects a student
chose, the more likely he or she was to choose a combination of mixed
subjects.
The Effects of Social Background on Performance and the
Motivational Factors
Before testing whether the three motivational variables explain
educational choices, we estimated, as shown in Table 5, the effect of
social background on performance, and that of social background and
performance on status maintenance motivation, utility considerations,

25
and failure expectations. Consistent with previous research, social
background exerted positive effects on scholastic performance. Further,
boys and girls did not differ in their performance but they did differ
significantly in the motivational factors.9
[TABLE 5 HERE]
The last three columns of Table 5 test Hypothesis IV, which
postulated that when scholastic performance is controlled, no
socioeconomic differences should appear in any of the three motivational
factors. The results indicate that students from advantaged social
background are less concerned with maintaining their parental
socioeconomic positions. Thus, with regard to the Relative Risk Aversion
mechanism, our finding, consistent with that of Stocké (2007), refutes
one of the core assumptions of the BG model, namely that all social strata
are equally concerned about status maintenance. A plausible explanation
for the negative association between relative risk aversion and social
background might be related to the degree of confidence that people of
different social backgrounds have in their social position. Students from
advantaged social strata may rely on their family to supply, if necessary,
the buffers against downward mobility, or many of them may even take
their position as given and are therefore less concerned with status
maintenance. By contrast, students from less privileged families may
suffer from status anxiety and fear of status loss. Thus, to the extent that
RRA has a positive effect on the choice of high utility subjects, it may

26
actually attenuate, rather than reproduce inequality between generations.
To anticipate, we shall soon show that RRA did not affect educational
choice and does not mediate the effects of origins on educational choice.
Contrary to BG's assumption, but consistent with Stocké's (2007) results,
we found significant socio-economic differences in beliefs about relative
utility. No such differences appeared in failure expectations, which is consist
with the BG model and Hypothesis IV.
Primary and Secondary Effects on Choice of Advanced Subjects
Reverting to the first three hypotheses outlined at the outset, we asked:
are students' educational choices affected by their apprehension of
downward class mobility (i.e., relative risk aversion), by their beliefs
about the likely future returns on the various choices, and by their beliefs
about their own odds of academic success or failure in the alternative
trajectories? We also asked whether these secondary factors mediated the
effects of social origins in educational choice, that is: is choice a
stratifying mechanism?
To answer these questions we first estimated a binary logit model
on the choice between advanced and basic levels in English. We then
examined, by applying a multinomial logit model, the determinants of
choice between the three curricular clusters identified earlier (i.e., hard,
soft and mixed subjects). These models included the following
independent variables: parental education, family's economic resources,
scholastic performance, grouping in math, relative risk aversion,

27
subjective utility (of advanced English or of the hard as against the soft
advanced subjects), and failure expectation (in English or in the hard as
against the soft subjects). We also controlled for sex in our models, and
in the multinomial model also for the number of chosen subjects. Table 6
presets the parameter estimates of the odds of choosing advanced
English. Tables 7a and 7b present the parameter estimates of the
contrasts between hard versus soft subjects (Table 7a) and between hard
subjects and a mix of hard and soft subjects (Table 7b).10 To facilitate
comparison of the effects of the continuous independent variables we
standardized them to a mean of zero and a unit standard deviation.
Dummy variables retained their original metric.
In Model I in these tables, we regressed educational choice on social
background alone. In models II and III we added performance and
grouping to each model respectively. These two models were meant to
assess the extent to which performance and grouping mediate the effects
of social background. In model IV we regressed educational choice on the
three motivational factors alone, and model V included all variables
simultaneously.11
[TABLE 6 HERE]
Advanced Versus Basic English
Model I in Table 6 indicates that students with educated parents were
more likely to opt for advanced English. When we added performance to
this model (Model II) the effect of parental education was reduced, and

28
adding grouping in Math (Model III) rendered the effect of parental
education even weaker and statistically insignificant. High achieving
students and those who had been assigned to an advanced grouping in
math were more likely to choose English at advanced level. Importantly,
the choice between advanced or basic level English was largely
determined by performance and grouping, and no effects of social
background remained to be explained by secondary factors.
In Model IV the analysis focused on the gross effects of the three
secondary factors. The effects of relative risk aversion and utility
consideration were very small and statistically insignificant. By contrast,
students who hold low failure expectations in advanced English were more
likely to select advanced English. When, in Model V, we also controlled for
social background, performance and grouping in Math, the net effects of
failure expectation was slightly reduced but maintained its statistical
power (compared with Model IV).
In sum, the main determinants of choice between advanced and
basic English were scholastic performance, grouping in math, and failure
expectations in English, but not relative risk aversion or utility
perceptions. Moreover, although the odds of choosing advanced English
are affected by students' subjective failure expectations, they are largely
determined by previous performance and no effects of social background
remained to be explained by secondary factors.
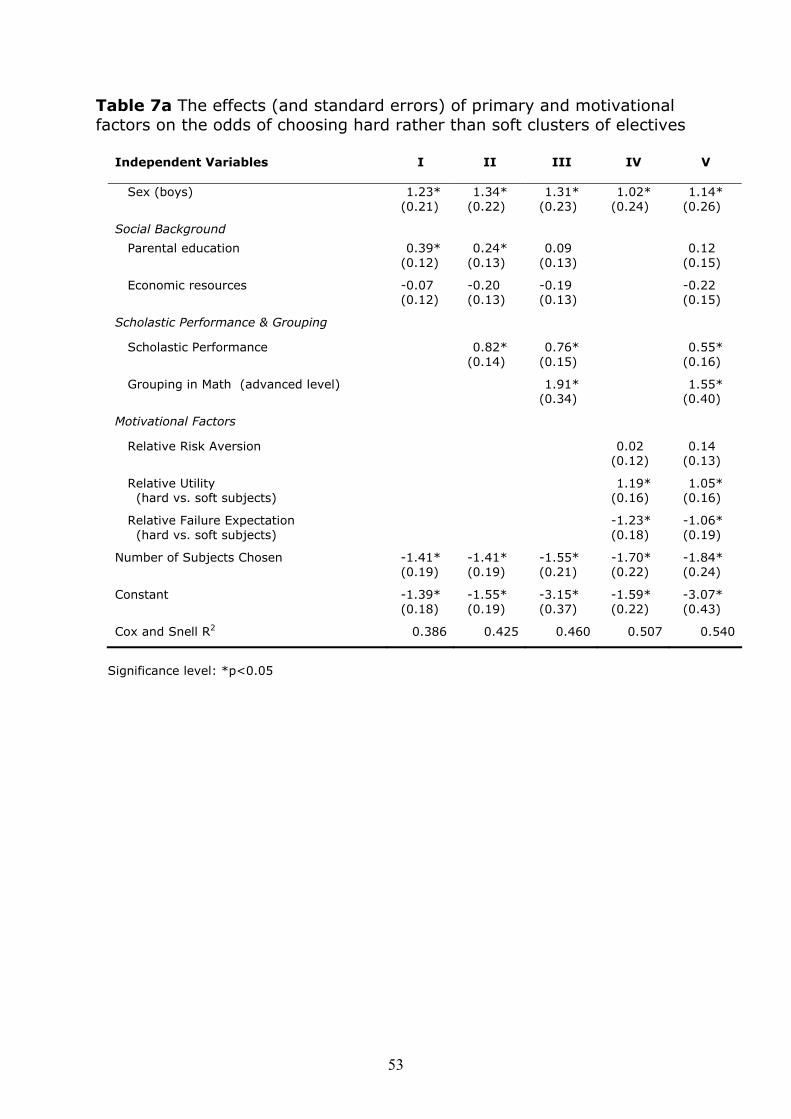
Hard versus Soft Subjects

29
The analysis of choice between hard and soft electives yields similar
results to those obtained above. Model I in Table 7a indicates that males,
and students with educated parents, were more likely to opt for hard than
for soft subjects. When we added performance to this model (Model II)
the effect of parental education was reduced, and adding grouping (Model
III) rendered the effect of parental education even weaker and
statistically insignificant. Strong students and those who had been
assigned to an advanced grouping in math were more likely to choose
hard rather than soft subjects. Importantly, the choice between the hard
and soft clusters of subjects was largely determined by performance and
grouping, and no effects of social background remained to be explained
by secondary factors.
[TABLE 7a HERE]
In Model IV the analysis focused on the gross effects of the three
secondary factors. The relative risk aversion mechanism was very small
and statistically insignificant. By contrast, the effects of both relative
utility and relative failure expectation were significant, and in the
expected directions: students who expected relatively higher utility from
the hard subjects and hold low failure expectations in them were more
likely to select hard than soft subjects. When, in Model V, we also
controlled for social background, performance and grouping the net
effects of relative utility and relative failure expectation were slightly
reduced but maintained their statistical power (compared with Model IV).

30
Again, the coefficient for relative risk aversion in Model V was not
significant statistically.
Finally, we found that the odds of choosing hard rather than soft
subjects declined as the number of subject selections increased.
Evidently, students who choose the hard sciences are more likely than
those who choose soft subjects to concentrate on the relatively difficult
task at hand and avoid spreading their attention over several subjects.
Hard versus a Mix of Subjects
In Table 7b we present the effects of the independent variables on the log
odds of choosing hard rather than mixed subjects. These results, too, are
quite similar to those reported in Tables 6 and 7a. Boys were more likely
to choose hard subject than a mix of hard and soft ones; the
socioeconomic differences in these odds were fully accounted for by
performance and grouping; the effects of RRA were statistically
insignificant; those of perceived relative utility and relative risk of failure
were statistically significant and in the expected directions, and the
secondary factors did not mediate socio-economic differences in choice.
Finally, the odds of taking a mix of subjects increased substantially as the
number of selections increased.
[TABLE 7b HERE]
In sum, the main determinants of choice among hard subjects, soft
subjects and a mix of the two were scholastic performance, grouping in

31
math, relative failure expectations, and subjective utility, but not relative
risk aversion. Just as important, the three motivational factors posited by
BG's Rational Action Theory did not seem to mediate the effects of social
background.
Thus far, then, our results lead to the same conclusion; secondary
effects are absent with respect to educational inequality between social
strata in curricula choices within the Israeli secondary system.
Summary and Discussion
It is generally recognized that students from privileged social backgrounds
progress farther in the educational system than those from less advantageous
origins. Rational choice models of education, in particular the BG model,
attribute these inequalities, in part, to differences in educational choice made
by individuals from different social strata. According to the model, the
educational process consists of a sequence of branching points at which
students are faced with binary choices. On the one hand, the high road is
demanding and risky in the short term, but can lead to rewarding life-course
outcomes in the long term. On the other hand, the low road is less
demanding and safer in the short term, but can offer only limited long-term
rewards. That is, long-term utility and short-term risks are positively
associated. It is further assumed that on reaching educational decision points
students consider their success probability in each alternative, its utility,
defined as the probability that it will lead to desirable occupational outcomes,
and the extent to which it will protect them from downward social mobility.

32
The desire to avoid downward mobility gives rise to class differentials in
educational choice. Students from the upper strata are impelled to choose the
high road, which is necessary if they are to maintain their social position,
while those of lower strata choose the low road, which is sufficient to maintain
their social position. Finally, the BG model postulates that social reproduction
is mediated, in part, by differential educational choice.
In this paper we put these propositions to an empirical test.
Specifically, we examined the role of utility considerations, of failure
expectations in education, and of the class maintenance motivation in shaping
educational choice. We examined the validity of these assumptions by
analyzing recently collected data from a purpose-designed survey of Tel Aviv-
Jaffa high school students who in 2006 were about to select school subjects
at an advanced level for their matriculation examinations.
In the main, our results cast doubt on some of the main assumptions of
the BG model. Summarizing our results concerning each assumption in turn,
first we found that educational choice was affected by the relative utility
that students attribute to the alternative choice options. It was also
affected by students' subjective failure expectations on the alternative
educational routes. However, it was not affected by the so-called Relative
Risk Aversion motivation (i.e., the class maintenance motivation). These
results are consistent with those reported by Stocké (2007) for German
parents choosing secondary educational tracks for their children. Hence,
the role of mobility concerns at this stage of the educational career is
questionable.

33
Further, although affected by social origin (and two of the three also
hold effect on educational choice), secondary factors did not mediate
class inequalities in educational choice, which were largely mediated by
performance and prior grouping in Math. In addition, relative risk aversion
was negatively related to social origins: students from the lower strata
seemed more concerned about downward social mobility that those from
the more privileged strata. Although BG's predictions about the
determinants of educational choices were validated in part. We agree with
Stocké (2007) and with Nash (2003, 2006) that rational choice theory in
education focuses too heavily on secondary effects. Our findings indicate
that secondary effects on educational attainment are weaker compared
with primary effects. Research on the relative importance of secondary
effects on educational attainment indicates that the relative importance of
secondary effects depend, in part, on the specific educational transition in
question and on the societal context in question.12
Moreover, and importantly, a large proportion of our respondents took
neither the high road nor the low road, preferring a mixture of the two. We
suggest that students who choose both high-utility and low-risk options
hedge short-term risks with long-term utility. We find that hedgers came
disproportionately from less affluent and less educated families, had lower
scholastic achievements, and were more concerned with class
maintenance, than those who chose either pure hard subjects or pure soft
subjects. The possibility to choose a mix of subjects is not anticipated by
rational choice models of education.

34
This is an important finding, indicating that the model ignores
systemic differences in the structure of available choices. The availability
of multiple rather than binary options can affect educational choice and
class-based educational inequality by allowing students to hedge long-
term utility with short-term risk. Comparative research across educational
systems that offer students a variety of alternatives to choose from is in
order.
Our finding that the less privileged in society adopted a hedging
strategy also calls into question the argument that curricular choice
masks transparent tracks visible only to the more affluent parents (Lucas,
1999). We find that students from less affluent and less educated families
seemed to be aware of the risks and utilities associated with the different
subjects available to them, and they mixed them to their apparent
advantage. The availability of options need not work to the detriment of
greater equality of educational opportunity, as suggested by Lucas (also by
Ayalon, 2006).
Research is also called for on the relationship between students'
stated intentions and the courses they actually take. While actual course
taking is affected by students' preferences, it is also affected by the
availability of courses at schools, by teachers' recommendations, by schools'
policies of student selection, and by a host of other institutional constraints.
In a future study we hope to evaluate the role of subjective choices and of
hedging, as well as of push factors, on the actual courses students take.

35
Notes
1. When evaluating their available educational option, students (and their
parents) are also assumed to take into account the direct and indirect
costs of education. Although perceived cost is an important variable in
rational-choice theory it is not discussed or measured in this study
because high-school alternatives (i.e., choice of major) in Israel do not
differ in their expected costs.
2. Upper secondary education consists of two main tracks: academic
and vocational. Until recently the vocational track trained most
students for a trade and prepared them for the world of work rather
than for further study. In recent years, however, most vocational-
track students have been able to sit for matriculation examinations,
although their success rates are lower than those of their academic
counterparts (e.g., Ayalon and Shavit, 2004).
3. The number of units refers to the time devoted to the subject. A
unit equals one hour a week for three years, or three hours a week
for one year. The number of units at which a subject is taken
corresponds to its level and degree of difficulty (Ayalon, 1994).
4. Students' sampling probabilities were computed as the product of
the school's sampling probability (0.29 and 0.66 in the middle class
and working class neighborhoods, respectively) and the students'
sampling probability within the school, which was computed as the
ratio of the number of respondents and the number of tenth graders
(ninth and tenth graders in one of the schools). In the analysis, the

36
cases were weighted inversely to their sampling probabilities. In
unreported analyses we also controlled for sampling districts (north,
south) and obtained substantively identical results.
5. Some schools track students in math early-on in secondary school
and leave them little choice in the matter. In unreported analysis
we found that when compared to known distributions of students by
level of study in math, their stated choices are highly unrealistic.
Therefore, we do not analyze the choice of advanced mathematics.
6. The results presented in Table 2 for the hard and soft clusters are
similar to those obtained by inspecting the utility and failure
expectation for each of their composite subject separately, with one
exception: both the perceived utility and failure expectations for
Economics are similar to those for Biology. However, since the great
majority (96%) of students who intended to take economics also
chose other social science subjects its allocation to the social
science category seems justified.
7. Specifically, the wording in Van de Werfhorst and Hofstede's item e
was: 'I am concerned that I might reach a social class that is lower
than the social class of my parents', whereas in our Hebrew version
concerned was worded as afraid.
8. In unreported analyses we also controlled for number of siblings,
and students' reading habits, but, net of parental education and
economic resources, most of their effects did not reach statistical

37
significance. Dropping them from the analysis did not alter the
substance of our results in any way.
9. In a separate study that is currently in progress, we attempt to
account for gender differences in the motivational factors.
10. The effects on a third possible contrast (soft vs. mix) are not
reported and can be computed as the differences between the
respective effects in Tables 7a and 7b. Of all effects on the third
contrast, only that of relative failure expectation is significant and in
the expected direction. It does not mediate the effects of social
origins.
11. When models IV and V were fitted with each of the choice
mechanisms (RRA, RU and RFE) only, each effect was similar to the
effect reported here.
12. See, for example, the sharp difference in the estimated relative
importance of secondary effects in England and Wales (Jackson et
al., 2007) compared with Germany (Reimer and Schindler, 2007).

38
Acknowledgements
This study was supported by an Eshkol Fellowship from the Israeli Ministry of
Science and Technology, and by a fellowship from the Horowitz Institute at
Tel Aviv University to the first author, and by the Weinberg Chair of Social
Stratification and Inequality at Tel Aviv University. An earlier version was
presented in 2007 at the Annual meeting of the American Sociological
Association and at the Montreal meeting of RC28. We are thankful to those
who contributed important comments, especially to John Goldthorpe, Richard
Breen and Moshe Semyonov. Finally, we would also like to thank the two
anonymous referees for their useful suggestions and comments on previous
version of this manuscript.

39
REFERENCES
Apple, M. W. (1990). Ideology and Curriculum (2nd edition). New York:
Routledge.
Ayalon, H. (1994). Monopolizing Knowledge - the Ethnic-Composition and
Curriculum of Israeli High-Schools. Sociology of Education, 67, 264-
278.
Ayalon, H. (1995). Math as a Gatekeeper: Ethnic and Gender Inequality in
Course Taking of the Sciences in Israel. American Journal of
Education, 104, 34-56.
Ayalon, H. (2002). Mathematics and Sciences Course Taking among Arab
Students in Israel: A Case of Unexpected Gender Equality.
Educational Evaluation and Policy Analysis, 24, 63-80.
Ayalon, H. (2003). Women and Men Go to University: Mathematical
Background and Gender Differences in Choice of Field in Higher
Education. Sex Roles, 48, 277-290.
Ayalon, H. (2006). Nonhierarchical Curriculum Differentiation and
Inequality in Achievement: A Different Story or More of the Same?.
Teachers College Record, 108, 1186-1213.
Ayalon, H. and Shavit, Y. (2004). Educational Reforms and Inequality in
Israel: The MMI Hypothesis Revisited. Sociology of Education, 77,
103-120.

40
Ayalon, H. and Yogev, A. (1997). Students, Schools, and Enrollment in
Science and Humanity Courses in Israeli Secondary Education.
Educational Evaluation and Policy Analysis, 19, 339-353.
Blossfeld, H. -P. and Shavit, Y. (1993). Persisting Barriers: Changes in
Educational Opportunities in Thirteen Countries. In Shavit, Y. and
Blossfeld, H.-P. (Eds), Persistent Inequalities: a Comparative Study
of Educational Attainment in Thirteen Countries. Boulder Colorado,
Westview Press, pp. 1-23.
Boudon, R. (1974). Education, Opportunity, and Social Inequality:
Changing Prospects in Western Society. New York: Wiley.
Bradley, K. (2000). The Incorporation of Women into Higher Education:
Paradoxical Outcomes?. Sociology of Education, 73, 1-18.
Breen, R.and Goldthorpe, J. H. (1997). Explaining Educational
Differentials - Towards a Formal Rational Action Theory. Rationality
and Society, 9, 275-305.
Breen, R. and Jonsson, J. O. (2000). Analyzing Educational Careers: A
Multinomial Transition Model. American Sociological Review, 65,
754-772.
Breen, R. and Yaish, M. (2006). Testing the Breen-Goldthorpe Model of
Educational Decision Making. In Stephen, L., Grusky, D. B. and
Fields, G. S (Eds), Mobility and Inequality: Frontiers of Research
from Sociology and Economics. Stanford: Stanford University Press,
pp. 323-358.

41
Burkam, D. T., Lee, V. E. and Smerdon, B. A. (1997). Gender and Science
Learning Early in High School: Subject Matter and Laboratory
Experience. American Educational Research Journal, 34, 297–331.
Davies, R., Heinesen, E. and Holm, H. (2002). The Relative Risk Aversion
Hypothesis. Journal of Population Economics, 15, 683-713.
De Graaf, N. D., De Graaf, P. M. and Kraaykamp, G. (2000). Parental
Cultural Capital and Educational Attainment in the Netherlands: A
Refinement of the Cultural Capital Perspective. Sociology of
Education,73, 92-11.
Duncan, G. J., Yeung, J. W., Brooks-Gunn, J. and Smith, J. R. (1998).
How Much Does Childhood Poverty Affect the Life Chances of
Children?. American Sociological Review, 63, 406-423.
Erikson, R. E., Goldthorpe, J. H., Jackson, M., Yaish, M. and Cox, D. R.
(2005). On Class Differentials in Educational Attainment.
Proceedings of the National Academy of Sciences of the United
States of America, 102, 9730-9733.
Erikson, R. E. and Jonsson, J. O. (1996). Can Education Be Equalized? The
Swedish Case in Comparative Perspective. Boulder, CO: Westview.
Gambetta, D. (1987). Were They Pushed or Did They Jump? Individual
Decision Mechanisms in Education. Cambridge: Cambridge
University Press.

42
Gamoran, A. and Mare, R. D. (1989). Secondary School Tracking and
Educational Inequality: Compensation, Reinforcement, or
Neutrality?. American Journal of Sociology, 94, 1146-1183.
Goldthorpe, J. H. (1996). Class Analysis and the Reorientation of Class
Theory: The Case of Persisting Differential in Educational
Attainment. British Journal of Sociology, 47, 481-505.
Goldthorpe, J. H. (1998). Rational Action Theory for Sociology. British
Journal of Sociology, 49, 167-192.
Halsey, A. H., Heath, A. F. and Ridge, J. M. (1980). Origins and
Destinations: Family, Class and Education in Modern Britain.
Oxford: Clarendon Press.
Hayman, F., Golan, H. and Shapira, R. (1997). School Autonomy and
Parental Choice: Steps in Local Educational Planning. In Shapira, R.
and Cookson, P.W. (Eds), Autonomy and Change in Context: An
International Perspective. Oxford: Pergamon, pp. 77-108.
Hedström, P. and Stern, C. (2008). Rational Choice and Sociology. In
Durlauf, S. and Blume, L., The New Palgrave Dictionary of
Economics (2nd edition). New York: Palgrave Macmillan.
Holm, A. and Jaeger, M. M. (2005). Relative Risk Aversion and Social
Reproduction in Intergenerational Educational Attainment:
Application of a Dynamic Discrete Choice Model. Paper presented at
the summer meeting of ISA-RC28 (Social Stratification and
Mobility), Los Angeles, August.

43
Jackson, M., Erikson, R. E., Goldthorpe, J. H. and Yaish, M. (2007).
Primary and Secondary Effects in Class Differentials in Educational
Attainment: the Transition to A-Level Courses in England and
Wales. Acta Sociologica, 50, 211-229.
Kamens, D. H. and Benavot, A. (1992). A Comparative and Historical
Analysis of Mathematics and Science Curricula, 1800-1986. In
Meyer, J.W., Kamens, D.H. and Benavot, A. (Eds), School
Knowledge for the Masses : World Models and National Primary
Curricular Categories in the Twentieth Century. Washington, DC:
Falmer Press, pp. 101-123.
Katz-Gerro, T. and Yaish, M. (2003). Higher Education: Is More Better?
Gender Differences in Labour Market Returns to Tertiary Education
in Israel. Oxford Review of Education, 30, 571-592.
Kliebard, H. M. (1992). The Decline of Humanistic Studies in the American
School Curriculum. In Kliebard, H.M. (Ed), Forging the American
Curriculum: Essays in Curriculum History and Theory. New York:
Routledge, pp. 3-26.
Lucas, S. R. (1999). Tracking Inequality: Stratification and Mobility in
American High Schools. New York: Teachers College Press.
Ma, X. and Willms, D. J. (1999). Dropping Out of Advanced Mathematics:
How Much Do Students and School Contribute to the Problem?.
Educational Evaluation and Policy Analysis, 21, 365-383.

44
Mare, R. D. (1981). Change and Stability in Educational Stratification.
American Sociological Review, 46, 72-87.
Ministry of Education, http://www.education.gov.il/netuney_bchinot/,
accessed on 26 December 2007.
Morgan, S. L. (1998). Adolescent Educational Expectations: Rationalized,
Fantasized, or Both?. Rationality and Society, 10, 131-62.
Morgan, S. L. (2005). On the Edge of Commitment: Educational
Attainment and Race in the United States. Stanford: Stanford
University Press.
Nash, R. (2003). Inequality Difference in Education: Is a Real Explanation
of Primary and Secondary Effects Possible?. British Journal of
Sociology, 54, 433-451.
Nash, R. (2006). Controlling for 'Ability': A Conceptual and Empirical
Study of Primary and Secondary Effects. British Journal of Sociology
of Education, 27, 157-172.
Need, A. and De Jong, U. (2000). Educational Differentials in the
Netherlands - Testing Rational Action Theory. Rationality and
Society, 13, 71-98.
Oakes, J. A. (1990).Opportunity, Achievement and Choice: Women and
Minority Students in Science and Mathematics. Review of Research
in Education, 16, 153–222.

45
Oakes, J. A., Gamoran, A. and Page, R.N. (1992). Curriculum
Differentiation: Opportunities, Outcomes and Meanings. In Jackson,
P.W. (Ed), Handbook of Research on Curriculum. New York:
Macmillan, pp. 570-608.
Plank, D. N. and Sykes,G. (2003). Choosing Choice: School Choice in
International Perspective. New York: Teachers College Press.
Reimer, D. and Schindler, S. (2007). Primary and Secondary Effects in
Access to Higher Education Germany. Conference of the European
Research Network EQUALSOC Network (Economic Change, Unequal
Life-Chances and Quality of Life), Dijon, France.
Shavit, Y. (1984). Tracking and Ethnicity in Israeli Secondary Education.
American Sociological Review, 49, 210-220.
Shavit, Y. (1990). Segregation, Tracking and the Educational Attainment
of Minorities: Arabs and Oriental Jews in Israel. American
Sociological Review, 55, 115-126.
Stocké, V. (2007). Explaining Educational Decision and Effects of Families’
Social Class Position: An Empirical Test of the Breen–Goldthorpe
Model of Educational Attainment. European Sociological Review, 23,
505-519.
Van de Werfhorst, H. G. and Hofstede, S. (2007). Cultural Capital or
Relative Risk Aversion? Two Mechanisms for Educational Inequality
Compared. The British Journal of Sociology, 58, 391-415.

46
Tel Aviv-Jaffa, Municipality. http://www.tel-aviv.gov.il/Hebrew/Education/
schools/Index.htm, accessed March 2006.
Tel Aviv-Yafo. 2007. Statistical Yearbook No. 46. Tel Aviv-Jaffa: Tel Aviv-
Yafo Municipality.

47
Authors' Address
Limor Gabay-Egozi (to whom correspondence should be addressed),
Department of Sociology and Anthropology, Tel Aviv University, Ramat
Aviv, Tel Aviv 69978, Israel. Email: [email protected].
Yossi Shavit, Department of Sociology and Anthropology, Tel Aviv
University, Ramat Aviv, Tel Aviv 69978, Israel. Email: [email protected].
Meir Yaish, Department of Sociology and Anthropology, Haifa University,
Haifa 31905, Israel. Email: [email protected].

48
Table 1 Percent distributions of subject choice by gender
Advanced Subjects Boys Girls Total
English 93 92 93
Physics 33 12 23
Chemistry 22 17 19
Computers 28 13 20
Biology 19 20 20
Economics 30 25 27
Social Science 30 52 41
History 16 15 16
Literature 12 14 13
Communications 14 24 19
Table 2 Means (and standard deviations) of perceived utility and perceived risk in advanced English, and in hard and soft advanced Electives
Advanced English
Hard Subjects
Soft Subjects
Perceived utility in university admission 4.44 4.09 3.50* (0.79) (0.78) (0.80) Perceived risk of failure 0.03 0.15 0.06* (0.16) (0.26) (0.15)
NOTE: Asterisks indicate significant (p<0.05) differences between the means of the hard and the soft clusters.

49
Table 3 Percent distribution of elective choice clusters
Choice categories %
Hard subjects only: 36 Physics, Chemistry, Computers and Biology
Soft subjects only: 42 Social Science, Economics, History, Literature and Communications
Mix of hard and soft subjects 22
Total % (N)
100 (563)

50
Table 4 Means (and standard errors) of key variables by choice categories
Variables
All (1)
English advanced
(2)
English basic (3)
Hard Subjects
(4)
Mixed
(5)
Soft Subjects
(6)
Social Background Sex (boys) 0.51 0.51 0.48 0.63 0.55* 0.39* (0.50) (0.50) (0.51) (0.49) (0.50) (0.49)
Parental Education 4.67 4.73* 3.86 5.10* 4.17* 4.57* (1.56) (1.53) (1.65) (1.31) (1.67) (1.60)
Economic Resources 6.17 6.24* 5.39 6.59* 5.39* 6.23 (2.21) (2.18) (2.23) (1.86) (2.23) (2.36)
Scholastic Performance & Grouping Scholastic Performance 82.81 83.44* 74.75 87.40* 78.91 80.90* (11.12) (10.95) (10.10) (9.35) (11.82) (10.82)
Grouping in Math (advanced level) 0.78 0.80* 0.58 0.94* 0.74 0.68* (0.41) (0.40) (0.50) (0.24) (0.44) (0.47)
Motivational Factors Relative Risk Aversion -0.10 -0.10 -0.11 -0.19* 0.18* -0.18 (1.00) (1.00) (1.03) (1.05) (0.95) (0.96)
English Utility 4.43 4.44 4.28 -- -- -- (0.79) (0.79) (0.79)
Relative Utility 1.20 -- -- 1.35* 1.14 1.11* (hard vs. Soft subjects) (0.28) (0.31) (0.23) (0.22)
English Failure Expectation 0.05 0.03* 0.34 -- -- -- (0.22) (0.16) (0.48)
Relative Failure Expectation 0.09 -- -- 0.01 0.07* 0.17* (hard vs. soft subjects) (0.23) (0.14) (0.21) (0.27)
Number of Chosen Subjects 1.94 -- -- 1.37* 2.95* 1.88* (0.99) (0.62) (1.09) (0.74)
Number of Cases 563 517 46 189 144 230 NOTE: Asterisks in column 2 indicate statistically significant (p<0.05) differences between the means
shown in columns 2 and 3. Asterisks in column 4 indicate statistically significant (p<0.05) differences between the means shown in columns 4 and 5. Asterisks in column 5 indicate statistically significant (p<0.05) differences between the means shown in columns 5 and 6. Asterisks in column 6 indicate statistically significant (p<0.05) differences between the means shown in columns 4 and 6.

51
Table 5 OLS regression coefficients (and standard errors) on performance and motivational factors
Independent Variables
Scholastic Performance
Relative
Risk Aversion
Relative Utility of Sciences
Relative Failure
Expectations in Sciences
Sex (Boys) -0.77 0.29* 0.07* -0.07* (0.83) (0.08) (0.02) (0.02)
Social Background Parental Education 1.68* -0.16* 0.02* -0.01 (0.30) (0.03) (0.01) (0.01)
Economic Resources 1.05* -0.08* 0.01 0.01 (0.21) (0.02) (0.01) (0.01)
Scholastic Performance Scholastic Performance 0.00 0.004* -0.003* (0.00) (0.00) (0.00)
Constant 68.89* 0.97* 0.66* 0.38*
(1.54) (0.29) (0.08) (0.07)
Adjusted R2 0.14 0.14 0.09 0.05
Significance level: *p<0.05

52
Table 6 The effects (and standard errors) of primary and motivational factors on the odds of choosing English at an advanced rather than basic level
Independent Variables
I II III IV V
Sex (boys) 0.14 0.23 0.17 0.18 0.15 (0.32) (0.32) (0.33) (0.34) (0.35)
Social Background
Parental education 0.38* 0.28~ 0.22 0.12 (0.16) (0.17) (0.17) (0.20)
Economic resources 0.25 0.10 0.07 0.08 (0.18) (0.19) (0.19) (0.20)
Scholastic Performance & Grouping
Scholastic Performance 0.54* 0.51* 0.32~ (0.16) (0.16) (0.17)
Grouping in Math (advanced level) 0.62~ 0.58 (0.35) (0.38)
Motivational Factors
Relative Risk Aversion 0.09 0.23 (0.17) (0.19)
Utility in English 0.04 0.07 (0.16) (0.16)
Failure Expectation in English -2.90* -2.22* (0.42) (0.48)
Constant 2.61* 2.58* 2.16* 2.87* 2.47*
(0.23) (0.23) (0.32) (0.25) (0.36)
Cox and Snell R2 0.022 0.041 0.045 0.069 0.083
Significance levels: *p<0.05 ~ 0.05<p<0.09
53
Table 7a The effects (and standard errors) of primary and motivational factors on the odds of choosing hard rather than soft clusters of electives
Independent Variables
I II III IV V
Sex (boys) 1.23* 1.34* 1.31* 1.02* 1.14* (0.21) (0.22) (0.23) (0.24) (0.26)
Social Background
Parental education 0.39* 0.24* 0.09 0.12 (0.12) (0.13) (0.13) (0.15)
Economic resources -0.07 -0.20 -0.19 -0.22 (0.12) (0.13) (0.13) (0.15)
Scholastic Performance & Grouping
Scholastic Performance 0.82* 0.76* 0.55* (0.14) (0.15) (0.16)
Grouping in Math (advanced level) 1.91* 1.55* (0.34) (0.40)
Motivational Factors
Relative Risk Aversion 0.02 0.14 (0.12) (0.13)
Relative Utility 1.19* 1.05* (hard vs. soft subjects) (0.16) (0.16)
Relative Failure Expectation -1.23* -1.06* (hard vs. soft subjects) (0.18) (0.19)
Number of Subjects Chosen -1.41* -1.41* -1.55* -1.70* -1.84* (0.19) (0.19) (0.21) (0.22) (0.24)
Constant -1.39* -1.55* -3.15* -1.59* -3.07* (0.18) (0.19) (0.37) (0.22) (0.43)
Cox and Snell R2 0.386 0.425 0.460 0.507 0.540
Significance level: *p<0.05

54
Table 7b The effects (and standard errors) of primary and motivational factors on the odds of choosing hard rather than mixed clusters of electives
Independent Variables
I II III IV V
Sex (boys) 0.81* 0.92* 0.92* 0.74* 0.87* (0.28) (0.29) (0.30) (0.30) (0.31)
Social Background
Parental education 0.35* 0.21 0.13 0.17 (0.16) (0.16) (0.16) (0.18)
Economic resources 0.10 -0.03 0.01 -0.05 (0.16) (0.16) (0.17) (0.18)
Scholastic Performance & Grouping
Scholastic Performance 0.81* 0.77* 0.60* (0.17) (0.17) (0.19)
Grouping in Math (advanced level) 1.31* 1.11* (0.43) (0.47)
Motivational Factors
Relative Risk Aversion -0.14 0.03 (0.15) (0.17)
Relative Utility 0.92* 0.77* (hard vs. soft subjects) (0.18) (0.18)
Relative Failure Expectation -0.84* -0.73* (hard vs. soft subjects) (0.20) (0.22)
Number of Subjects Chosen -2.63* -2.62* -2.76* -2.93* -3.03* (0.23) (0.23) (0.24) (0.25) (0.27) Constant -0.18* -0.35 -1.51* -0.55* -1.68* (0.23) (0.24) (0.45) (0.26) (0.50)
Significance level: *p<0.05
Copyright © 2022 FDOKUMEN