Current health of Indian healthcare and hospitality industries: a demographic study
17
International Journal of Business Research and Development ISSN 1929‐0977 | Vol. 2 No. 1, pp. 1‐17 (2013) www.sciencetarget.com * Corresponding author: [email protected] Current Health of Indian Healthcare and Hospitality Industries: A Demographic Study Faisal Talib 1* and Zillur Rahman 2 1 Aligarh Muslim University, Aligarh, India 2 Indian Institute of Technology Roorkee, India Abstract In the present era of competitive business environment due to increasing complexity and globalization of quality products and services, quality managers and practitioners have started to improve services to customers especially in healthcare and hospitality industries. These industries are considered as the most challenging and highest growing service industries across the world and therefore needs special attention due to their direct impact on the country’s economy as well as employment and revenue generation. Looking to these issues, there is a need to examine the current status and demographic characteristics of these two industries i.e. healthcare and hospitality in Indian context. Thus, the aim of this paper is to study the demographic characteristics of Indian healthcare and hospitality industries through a survey. A questionnaire based survey approach was used to collect the relevant data from these two industries. The objective of this paper was accomplished by collecting the responses from top and middle level administrators. A total of 120 questionnaires were mail delivered to various healthcare and hotels and tourism companies, 51 valid responses were received yielding a response rate of 42.4 percent. The data was analyzed using percentage frequency and Chi-square statistical tests to understand the demographic characteristics of the two industries. Various respondent companies’ characteristics like type of company, ownership, quality certification and number of employees were analyzed and discussed. The finding presents a holistic picture of current status of these two Indian service industries which may help the Indian service managers and practitioners to further exploit opportunities in these two industries. At the end, some implications to mangers and scope for further research are presented. Keywords: Healthcare; Hospitality; Service Industry; Demographic Characteristics; India. 1. Introduction Over past few decades, services were defined in many ways by different authors and researchers but with no general agreement as to what it really constitutes (Talib et al., 2012a). The latest definitions given by Bygstad and Lanestedt (2009) and Karwan and Markland (2006) are the most interesting ones. They defined services as ‘a non- material equivalent of goods’ (Bygstad and Lanestedt, 2009) and ‘a package made up of a set of tangible and intangible elements’ (Karwan and Markland, 2006). Nowadays, services in most of the newly developed products are amalgam of both tangible and intangible acts. Many of which could be found in healthcare, hotels, transportations, banks, information and communication technology (ICT), real estate and several other industries which are grouped under service sector.
Transcript of Current health of Indian healthcare and hospitality industries: a demographic study
International Journal of Business Research and Development ISSN 1929‐0977 | Vol. 2 No. 1, pp. 1‐17 (2013)
www.sciencetarget.com
* Corresponding author: [email protected]
Current Health of Indian Healthcare and Hospitality Industries: A Demographic Study
Faisal Talib1* and Zillur Rahman2
1Aligarh Muslim University, Aligarh, India 2Indian Institute of Technology Roorkee, India
Abstract In the present era of competitive business environment due to increasing complexity and globalization of quality products and services, quality managers and practitioners have started to improve services to customers especially in healthcare and hospitality industries. These industries are considered as the most challenging and highest growing service industries across the world and therefore needs special attention due to their direct impact on the country’s economy as well as employment and revenue generation.
Looking to these issues, there is a need to examine the current status and demographic characteristics of these two industries i.e. healthcare and hospitality in Indian context. Thus, the aim of this paper is to study the demographic characteristics of Indian healthcare and hospitality industries through a survey. A questionnaire based survey approach was used to collect the relevant data from these two industries. The objective of this paper was accomplished by collecting the responses from top and middle level administrators. A total of 120 questionnaires were mail delivered to various healthcare and hotels and tourism companies, 51 valid responses were received yielding a response rate of 42.4 percent. The data was analyzed using percentage frequency and Chi-square statistical tests to understand the demographic characteristics of the two industries. Various respondent companies’ characteristics like type of company, ownership, quality certification and number of employees were analyzed and discussed. The finding presents a holistic picture of current status of these two Indian service industries which may help the Indian service managers and practitioners to further exploit opportunities in these two industries. At the end, some implications to mangers and scope for further research are presented.
Keywords: Healthcare; Hospitality; Service Industry; Demographic Characteristics; India.
1. Introduction
Over past few decades, services were defined in many ways by different authors and researchers but with no general agreement as to what it really constitutes (Talib et al., 2012a). The latest definitions given by Bygstad and Lanestedt (2009) and Karwan and Markland (2006) are the most interesting ones. They defined services as ‘a non-material equivalent of goods’ (Bygstad and Lanestedt, 2009) and ‘a package made up of a set
of tangible and intangible elements’ (Karwan and Markland, 2006). Nowadays, services in most of the newly developed products are amalgam of both tangible and intangible acts. Many of which could be found in healthcare, hotels, transportations, banks, information and communication technology (ICT), real estate and several other industries which are grouped under service sector.
2 © Talib and Rahman 2013 | Current Health
Science Target Inc. www.sciencetarget.com
Today, the service sector occupies a great market share in many developing countries like India, Singapore, Thailand, Malaysia and many more. The World Bank Group (2010) in their survey showed that services account for more than 70 percent of Gross Domestic Product (GDP) in countries like USA, UK, France, Germany and Japan economy. Further, according to Arasli et al. (2005), the survey report of Organization for Economic Co-operation and Development (OECD) indicates that more than 70 percent of people are employed in the service sector. In addition, the net annual income earned by the service sector, both in developed and developing countries, is steadily increasing from past one decade. This indicates that service sector plays an effective role in the development of a country and presently under tremendous pressure to deliver continuing perfor-mance and quality improvement while being customer focused. Quality of service is an important parameter to judge the performance of any industry and is recognized as one of the key strategic dimension of services (Lewis, 1991).
From past two decades, literature has been evolved on quality of services with studies ranging from exploration of its inherent dimensions to its impact on service outcomes (Aagja and Garg, 2010; Padma et al., 2009; Lim and Tang, 2000; Arasli et al., 2005; Sohail, 2003; Duggirala et al., 2008; Seth et al., 2005; Sahu, 2007). It had showed many benefits to the industry such as increased sales and market shares, improved customer relations, customer retention and satisfaction, reduced employee turnover rates, and customer attraction through positive word of mouth (Arasli et al., 2005; Caruana, 2002; Guru, 2003; Sureshchander et al., 2002; Seth et al., 2005; Lasser et al., 2000; Lim and Tang, 2000; Padma et al., 2009).
Healthcare and hospitality (hotels and tourism) services are a demand driven and high involvement industries which constitute an important part of the service sector. They together contribute about 12.5 percent of GDP from the total contribution of GDP (56.0 percent) in Indian service sector (CSO, 2010). As per the report published by Ministry of Labor and Employment (MoL&E), Government of India (GOI), July 2010, healthcare and hospitality industries are highly labour-intensive industries and provide substantial employment (MoL&E, 2010; Talib et al., 2012a). In addition, these two
industries are gradually generating revenue and are large enough to capture and represent almost all the critical aspects of customer related service quality (Talib et al., 2012a). They encompass an extensive variety of service industries that includes hospitals, nursing homes, healthcare establish-ments, hotels, restaurant, private tour operators (PTOs), travel agencies and many others. These two industries especially hospitality industry often suffers from more economic fluctuations when compared to its peer industries and thus, they are continuous monitored by the clients, stakeholders, or consumers.
But in recent years, it was observed that healthcare and hospitality industries have become one of the extremely complex industries in the world, especially in Indian context. The reasons behind it are several. Some of them are due to the rapid development of information technology (IT), tremendous speed of socio-technical development, the changed needs of users, increasing number of hospitals, PTOs and hotels as well as increased number of healthcare and hospitality quality dimensions have all added to the expectations of a service industry. It is therefore, evident that the status of these two industries must be explored from time to time in order to judge the current health of the most demanding and developing industries in Indian context so that the threats to these two industries may be minimized.
Considering the above issues, there is a need to study the present status of these two major Indian service industries by examining and understanding their demographic characteristics. This could help in presenting the current health of healthcare and hospitality industries and further suggestions for improvement. Furthermore, most of the studies to date on healthcare and hospitality have concentrated on service quality (SQ) dimensions, customer perception, quality award models, customer relation management (CRM), business performance etc. in developed as well as developing countries (Claver-Cortes et al., 2008; Holjevac, 2008; Chartruagruang et al., 2006; Yeoh, 2011; Raja et al., 2007; Azam et al., 2012; Talib et al., 2010, Talib et al., 2011; Talib et al., 2012b; Duggirala et al., 2008; Padma et al., 2009; Narang, 2011). But to our knowledge, this study is unique in the sense that till date no study has been undertaken based on demographic characteristics
International Journal of Business Research and Development | Vol. 2 No.1, pp. 1‐17 3
Science Target Inc. www.sciencetarget.com
of any industry especially the Indian service industry to understand the current status of the healthcare and hospitality industries which are thought to have several reforms in near future. Findings of this study might be generalized for other service industries that may need to restructure their overall demographic system in order to cope up with the present situation. Moreover, the present study will shed light on some important demographic characteristics and provide feedback to other industries so that they may incorporate them into any strategic planning.
The rest of the paper is structured as follows. Initially after highlighting the need for the present study, a brief literature review on Indian healthcare and hospitality industries along with the studies on demographic characteristics are presented and discussed. Next, the methodology and data collection procedure are explained, followed by the results and discussion of the analysis. Finally, conclusions and managerial implications are noted, and future directions are discussed.
2. Literature Review Literature on healthcare and hospitality is quite encyclopedic. Over the past two decades, healthcare and hospitality industries emerged out to be the two most developing and economic industries among Indian service industries and showed an overabundance of research studies on several issues and developments in these areas. Next section presents a brief overview of the Indian healthcare industry followed by a discussion on Indian hospitality industry.
Indian Healthcare Industry
Health is an essential component of nation’s development and is vital to the economy growth and internal stability of the country. Assuring a minimal level of healthcare to its population is a critical constituent of the development process. Since independence, India has built up a vast health infrastructure and health personnel at primary, secondary, and tertiary care in public, voluntary, and private sectors. The Indian healthcare system includes medical care providers, physicians, specialist clinics, nursing homes, hospitals, medical diagnostic centers, pathology laboratories, and paramedical institutions including
Ayurveda, Yoga and Naturopathy, Unani, Siddha, and Homeopathy (AYUSH) institutions, which have been set-up for producing skilled human resources (Planning Commission Report, 2010).
Currently, healthcare is one of India’s largest service industries, in terms of revenue and employment. During the 1990s, Indian healthcare grew at a compound annual rate of 16 percent. In year 2009, the total value of the sector was more than $35 billion. By 2012, India’s healthcare sector is projected to grow to nearly $70 billion (Planning Commission Report, 2010). Further, the current share of public expenditure on health as proportion of gross domestic product (GDP) is 1 percent and will rise to a target of 2-3 percent of GDP by 2012. Private spending accounts for almost 80 percent of the total healthcare expenditure and is quite dominant in the healthcare sector. Inadequate public investment in health infrastructure has given an opportunity to private hospitals to capture a large share of the market. Some of the prominent corporate hospital networks in the country are Apollo Hospital, Fortis Healthcare, Max Health-care, Wockhardt Hospital, and Manipal Group. Simultaneously, a number of new players like Artemis Health Institute, Paras Group, and MediCity among others are also in the process to set-up their establishments in the country.
Industry leaders in India are also voicing their concerns about getting ISO certification and Accreditation of healthcare organizations (Manjunath et al., 2007). Many Indian hospitals are now either ISO certified or undergoing the accreditation certification process (JCAHO Certification, 2004). In general, ISO 9000 certification helps achieve consistency in production of a product or service and providing assurance to customers that the specific practices are in providers’ stated quality systems (Manjunath et al., 2007). While accreditation provides international recognition, guarantee quality healthcare to all, care of patients and protection of patent’s rights, improvement in quality and attract new, markets (Nandaraj et al., 2001; Manjunath et al., 2007). The National Accreditation Board for Hospitals and Healthcare providers (NABH), a constituent of the Quality Council of India, is responsible to operate accreditation programs for healthcare organizations in India but still not all the
4 © Talib and Rahman 2013 | Current Health
Science Target Inc. www.sciencetarget.com
state government hospitals are accredited (The Times of India, 2009).
Notwithstanding the sector’s rapid growth and potential, in many respects, but still India’s healthcare falls well below international benchmarks for physical infrastructure and manpower, and even falls below the standards existing in comparable developing countries. Thus, Indian healthcare industry needs to scale up considerably in terms of the availability and quality of its physical infrastructure as well as human resources so as to meet the growing demand and to compare favorably with international standards. Also, despite the giant steps taken by the Indian healthcare industry, there is a need for improvement in customer service
Indian Hospitality Industry
The hotel and tourism industry forms one of the most important segments of the Indian service sector with high potential for employment generation and foreign exchange earnings. To give impetus to this industry, the government provided several beneficial policies and incentives. Recently developed industrial policies have now placed hotels and tourism related activities as a priority industry (Ministry of Information and Broadcasting (MoIB), 2009). Furthermore, the Indian department of Tourism has classified hotels and restaurant into various categories formed and approved by Hotels and Restaurant Approval and Classification Committee (HRACC). In order to further accelerate the development of tourism in the country, the thrust during the 10th and 11th Five Year Plan was also been given by developing various policies. In addition to this, as per the report published by the World Economic Forum (2009) on tourism industry, India is ranked at 11th place in the Asia Pacific region and 62nd globally. It is also ranked in other hospitality parameters like best tourist destination, natural and cultural resources, heritage sites, national integration, rural and domestic tourism and many others.
Several organizations are involved in the development of Indian hotels and tourism industry namely Indian Institute of Tourism and Travel Management, National Council for Hotel Management and Catering Technology and Applied Nutrition, India Tourism Development Corporation Limited, Indian Institute of Shipping and Mountaineering, and National Institute of
Water Sports are to be named some (MoIB, 2009). All these organizations are responsible for formulation and implementation of policies and programs for the development of hospitality industry within the country and are attracting foreign tourists by way of developing tourism infrastructure, publicity and promotion, co-ordination and supervision of activities of various segments of industry such as hotels, travel agencies, tour operators etc.
Overall, the main objectives of hospitality industry are to position India in this sector globally, to promote various Indian tourism products so as to compete with the products of different destinations and to increase India’s share of the global tourism market (MoIB, 2009).
Demographic Studies
The literature review showed that studies on demographic characteristics are rare and under developing stage. Though researches have been undertaken across different segments covering multiple aspects related to demographic characteristics which are associated with variety of subjects and themes, but no study to date have been conducted to understand and examine the status of any Indian service industry which utilizes the demographic based survey methodology which this paper tries to implement.
The extent literature on demographic studies has been summarized and presented in Table 1.
3. Research Methodology Sample Size
In order to understand and examine the current status of Indian healthcare and hospitality industries, a questionnaire survey methodology was adopted and data were collected from a minimum sample size consisting of these two industries. The sample size consisted of top and middle level administrators of healthcare and hospitality (hotels and tourism) companies across India. The sampling frame used for this study is the list of healthcare and hospitality companies approved by Centre for Monitoring Indian Economy Private Limited, India (CMIE, 2010). The list contains a total of 120 healthcare and 350 hospitality companies at the time of study period.
International Journal of Business Research and Development | Vol. 2 No.1, pp. 1‐17 5
Science Target Inc. www.sciencetarget.com
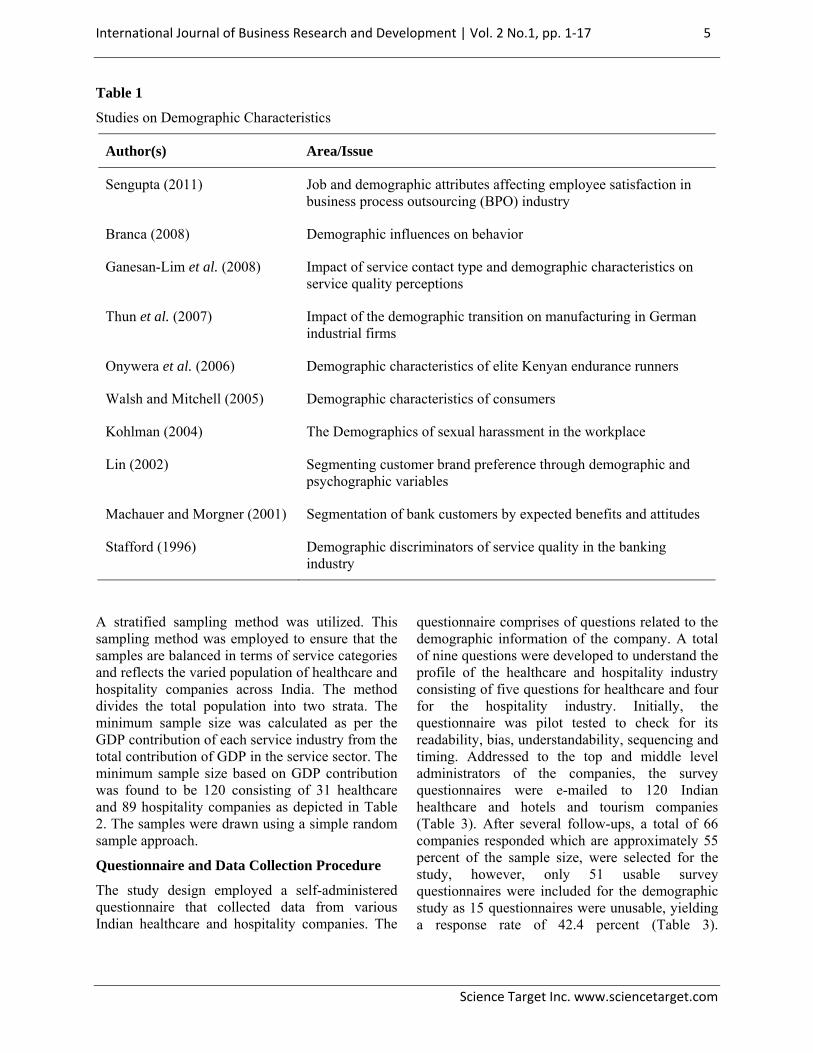
Table 1
Studies on Demographic Characteristics
Author(s) Area/Issue
Sengupta (2011) Job and demographic attributes affecting employee satisfaction in business process outsourcing (BPO) industry
Branca (2008) Demographic influences on behavior
Ganesan-Lim et al. (2008) Impact of service contact type and demographic characteristics on service quality perceptions
Thun et al. (2007) Impact of the demographic transition on manufacturing in German industrial firms
Onywera et al. (2006) Demographic characteristics of elite Kenyan endurance runners
Walsh and Mitchell (2005) Demographic characteristics of consumers
Kohlman (2004) The Demographics of sexual harassment in the workplace
Lin (2002) Segmenting customer brand preference through demographic and psychographic variables
Machauer and Morgner (2001) Segmentation of bank customers by expected benefits and attitudes
Stafford (1996) Demographic discriminators of service quality in the banking industry
A stratified sampling method was utilized. This sampling method was employed to ensure that the samples are balanced in terms of service categories and reflects the varied population of healthcare and hospitality companies across India. The method divides the total population into two strata. The minimum sample size was calculated as per the GDP contribution of each service industry from the total contribution of GDP in the service sector. The minimum sample size based on GDP contribution was found to be 120 consisting of 31 healthcare and 89 hospitality companies as depicted in Table 2. The samples were drawn using a simple random sample approach.
Questionnaire and Data Collection Procedure
The study design employed a self-administered questionnaire that collected data from various Indian healthcare and hospitality companies. The
questionnaire comprises of questions related to the demographic information of the company. A total of nine questions were developed to understand the profile of the healthcare and hospitality industry consisting of five questions for healthcare and four for the hospitality industry. Initially, the questionnaire was pilot tested to check for its readability, bias, understandability, sequencing and timing. Addressed to the top and middle level administrators of the companies, the survey questionnaires were e-mailed to 120 Indian healthcare and hotels and tourism companies (Table 3). After several follow-ups, a total of 66 companies responded which are approximately 55 percent of the sample size, were selected for the study, however, only 51 usable survey questionnaires were included for the demographic study as 15 questionnaires were unusable, yielding a response rate of 42.4 percent (Table 3).
6 © Talib and Rahman 2013 | Current Health
Science Target Inc. www.sciencetarget.com
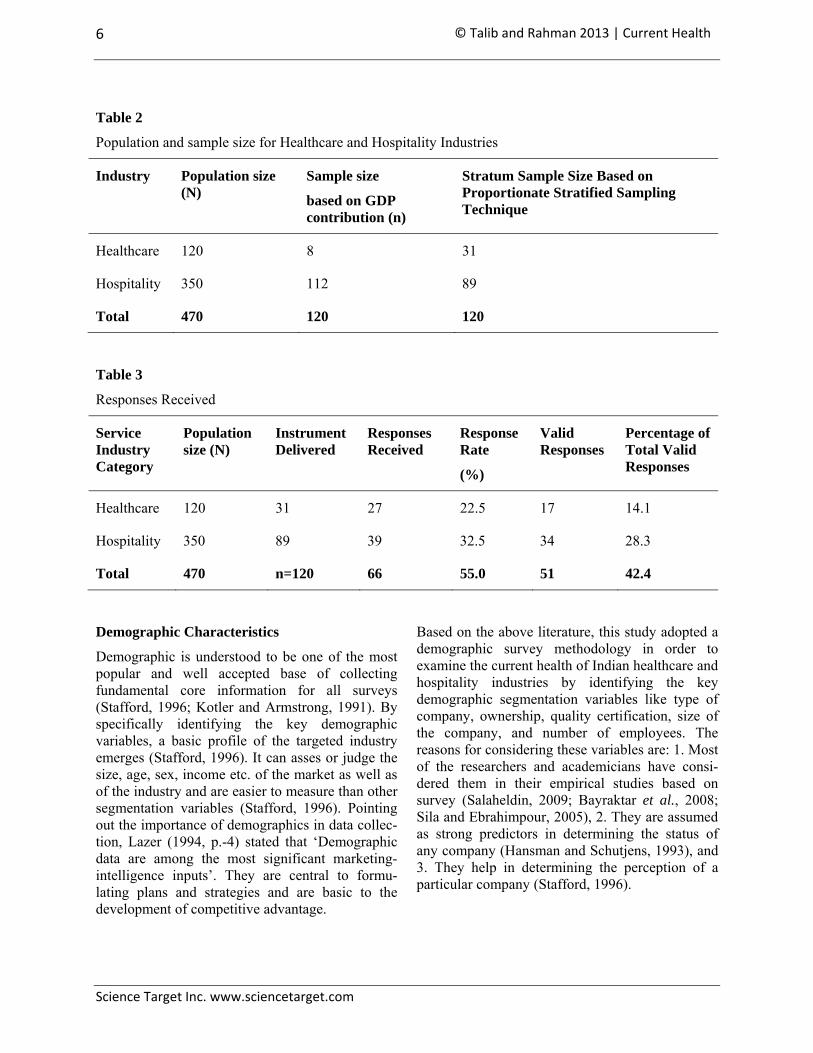
Table 2
Population and sample size for Healthcare and Hospitality Industries
Industry Population size (N)
Sample size
based on GDP contribution (n)
Stratum Sample Size Based on Proportionate Stratified Sampling Technique
Healthcare 120 8 31
Hospitality 350 112 89
Total 470 120 120
Table 3
Responses Received
Service Industry Category
Population size (N)
Instrument Delivered
Responses Received
Response Rate
(%)
Valid Responses
Percentage of Total Valid Responses
Healthcare 120 31 27 22.5 17 14.1
Hospitality 350 89 39 32.5 34 28.3
Total 470 n=120 66 55.0 51 42.4
Demographic Characteristics
Demographic is understood to be one of the most popular and well accepted base of collecting fundamental core information for all surveys (Stafford, 1996; Kotler and Armstrong, 1991). By specifically identifying the key demographic variables, a basic profile of the targeted industry emerges (Stafford, 1996). It can asses or judge the size, age, sex, income etc. of the market as well as of the industry and are easier to measure than other segmentation variables (Stafford, 1996). Pointing out the importance of demographics in data collec-tion, Lazer (1994, p.-4) stated that ‘Demographic data are among the most significant marketing-intelligence inputs’. They are central to formu-lating plans and strategies and are basic to the development of competitive advantage.
Based on the above literature, this study adopted a demographic survey methodology in order to examine the current health of Indian healthcare and hospitality industries by identifying the key demographic segmentation variables like type of company, ownership, quality certification, size of the company, and number of employees. The reasons for considering these variables are: 1. Most of the researchers and academicians have consi-dered them in their empirical studies based on survey (Salaheldin, 2009; Bayraktar et al., 2008; Sila and Ebrahimpour, 2005), 2. They are assumed as strong predictors in determining the status of any company (Hansman and Schutjens, 1993), and 3. They help in determining the perception of a particular company (Stafford, 1996).
International Journal of Business Research and Development | Vol. 2 No.1, pp. 1‐17 7
Science Target Inc. www.sciencetarget.com
4. Results and Discussion The questionnaire was designed in order to obtain the necessary information to accomplish the objective of this research study. Based on the available data, frequency distribution and percentage frequency were obtained and an in-depth study of different demographic variables chosen was studied and analyses were made. Additionally, to further strengthen the results and findings, this study adopted Chi-square non-parametric statistical test to judge the significance of each demographic variable over the two service industries using SPSS 16.0 software (Coakes et al., 2006). The results are presented as follows.
Demographics of Healthcare Industry
Type of Hospitals Covered
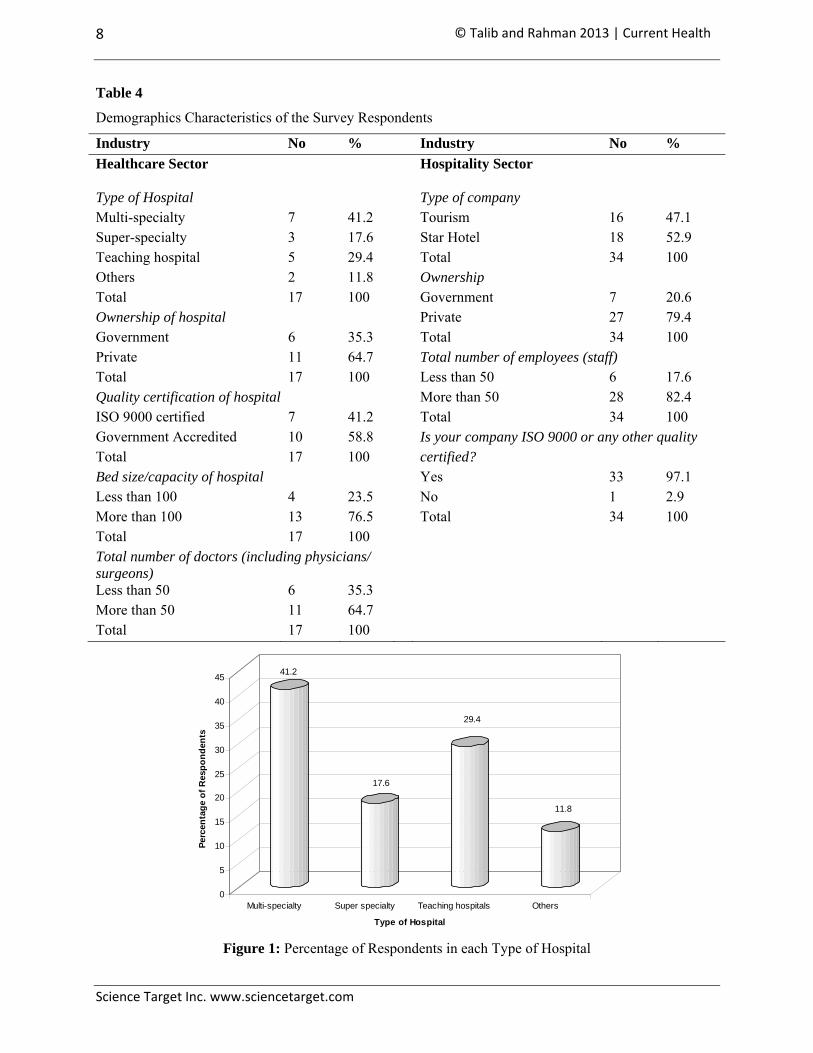
In healthcare category, the total number of valid responses received was 17. These 17 responses were further classified into five sub-categories, namely: type of hospital, ownership of the hospital, quality certification of hospital, bed-size/capacity of hospital, and total number of doctors. Thus, the survey covers a wide range of healthcare companies across the India. With respect to the type of hospital covered, 41.2 percent of the hospitals are multi-specialty, 17.6 percent are super-specialty, 29.4 percent hospitals are teaching hospitals, and others are represented only by a figure of 11.8 percent (Table 4). It can be seen from the Table 4 that majority of hospitals were multi-specialty and super-specialty hospitals (58.8%) i.e. more than half of the healthcare responses received come from this group. Thus, the sample population of the hospitals covers a majority of quality and reputed healthcare companies. This suggests that the data source is significant and useful for this study, and is quite reliable for further analysis. This is also supported and claimed by Rohini and Mahadevappa (2006); Kunst and Lemmink (2000). The percentage of respondents from each type of hospital in the healthcare industry is evident through Figure 1.
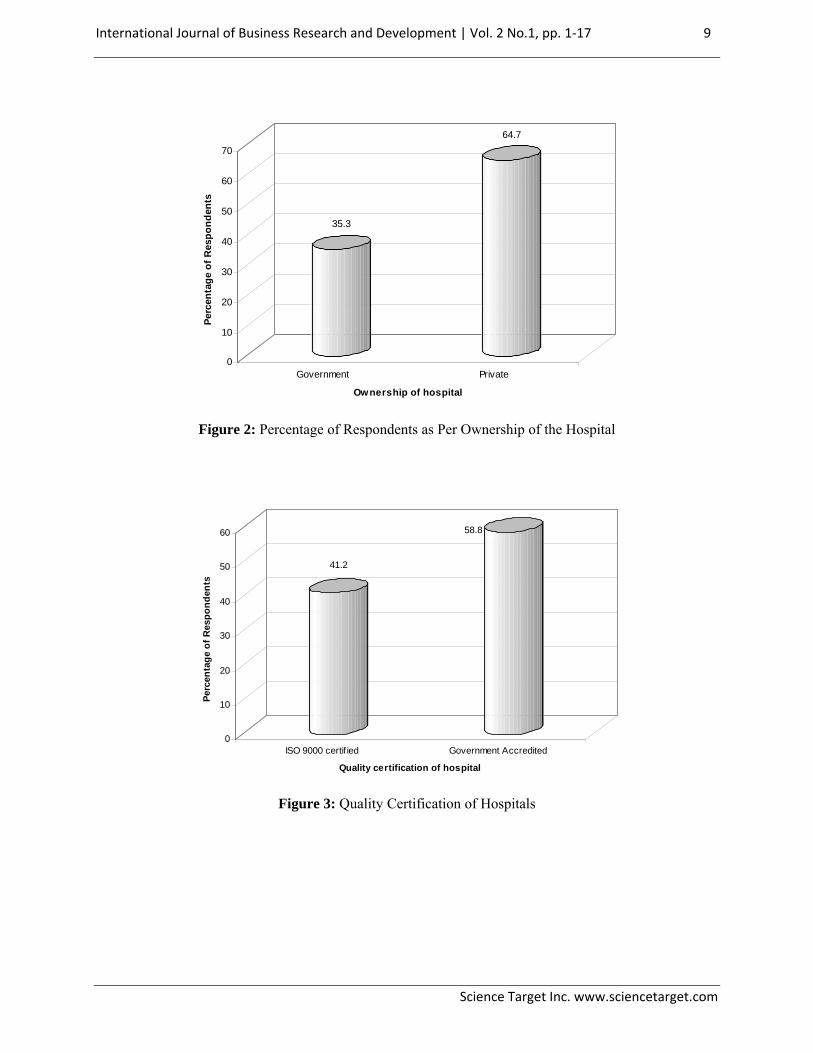
Out of the 17 hospitals which participated in this study, six were government owned and 11 were private hospitals (Table 4). This shows that
healthcare sample respondents represent 64.7 percent private hospitals and 35.3 percent government hospitals. Further, it also indicates the dominance and active participation of private hospitals in this study and continuously improving their performance when compared with the government owned hospitals, which is also claimed by Rohini and Mahadevappa (2006) in their study on healthcare sector. The percentage of respondents as per ownership of the hospital is depicted in Figure 2 below.
Quality Certification of Hospitals
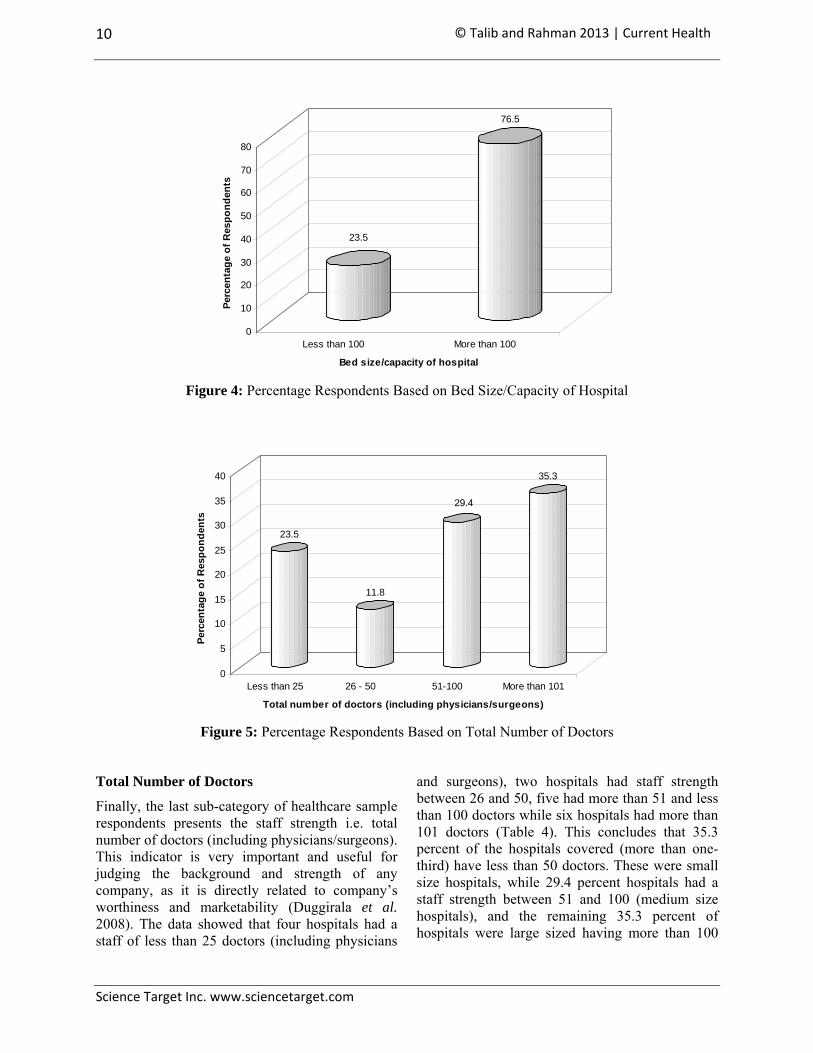
Among these 17 hospitals, seven hospitals were ISO 9000 certified and ten were government accredited. No hospital was found to be either non-ISO 9000 certified or government non-accredited. It suggests that Indian healthcare industry is implementing quality tools and techniques and is well aware of quality models and framework. It also shows their interest in different quality related issues and practices so that they could strengthen themselves in global market. This was also supported by Miller et al. (2009) in his study of quality management (QM) practices in healthcare industry. Figure 3 shows the percentage distribution of quality certification of hospitals in two different categories.
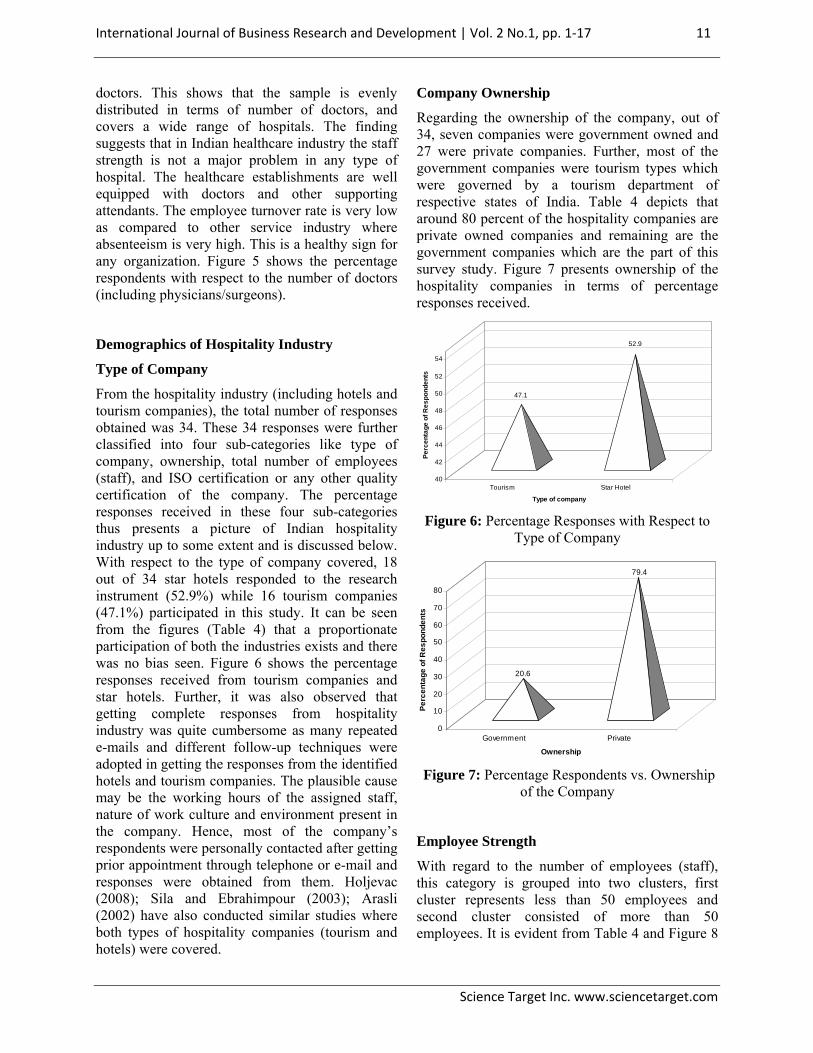
Bed Size/Capacity of Hospitals
The healthcare sample is further sub-categorized based on bed size or capacity of hospital. Accordingly, four hospitals were having less than 100 beds capacity and 13 hospitals were having a capacity of more than 100 beds (Table 4). This indicates that 23.5 percent of the sample hospitals are small in size while the majority of sample hospitals (76.5%) are ranging from moderately large to very large hospitals in terms of accommodating the number of patients. This reveals that hospitals of more than 100 bed size are better equipped with resources and are quality accredited as compared to the small size hospitals. It is therefore, assumed that these hospitals are very active and conscious in implementing and adopting various quality programs in their organization. Figure 4 depicts the graphical representation of percentage respondents with respect to bed size/capacity of the hospital.
8 © Talib and Rahman 2013 | Current Health
Science Target Inc. www.sciencetarget.com
Table 4
Demographics Characteristics of the Survey Respondents
41.2
17.6
29.4
11.8
0
5
10
15
20
25
30
35
40
45
Perc
enta
ge o
f Res
pond
ents
Multi-specialty Super specialty Teaching hospitals Others
Type of Hospital
Figure 1: Percentage of Respondents in each Type of Hospital
Industry No % Industry No % Healthcare Sector Hospitality Sector
Type of Hospital Type of company Multi-specialty 7 41.2 Tourism 16 47.1 Super-specialty 3 17.6 Star Hotel 18 52.9 Teaching hospital 5 29.4 Total 34 100 Others 2 11.8 Ownership Total 17 100 Government 7 20.6 Ownership of hospital Private 27 79.4 Government 6 35.3 Total 34 100 Private 11 64.7 Total number of employees (staff) Total 17 100 Less than 50 6 17.6 Quality certification of hospital More than 50 28 82.4 ISO 9000 certified 7 41.2 Total 34 100 Government Accredited 10 58.8 Is your company ISO 9000 or any other quality Total 17 100 certified? Bed size/capacity of hospital Yes 33 97.1 Less than 100 4 23.5 No 1 2.9 More than 100 13 76.5 Total 34 100 Total 17 100 Total number of doctors (including physicians/ surgeons)
Less than 50 6 35.3 More than 50 11 64.7 Total 17 100
International Journal of Business Research and Development | Vol. 2 No.1, pp. 1‐17 9
Science Target Inc. www.sciencetarget.com
35.3
64.7
0
10
20
30
40
50
60
70
Perc
enta
ge o
f Res
pond
ents
Government Private
Ownership of hospital
Figure 2: Percentage of Respondents as Per Ownership of the Hospital
41.2
58.8
0
10
20
30
40
50
60
Perc
enta
ge o
f Res
pond
ents
ISO 9000 certif ied Government Accredited
Quality certification of hospital
Figure 3: Quality Certification of Hospitals
10 © Talib and Rahman 2013 | Current Health
Science Target Inc. www.sciencetarget.com
23.5
76.5
0
10
20
30
40
50
60
70
80
Perc
enta
ge o
f Res
pond
ents
Less than 100 More than 100
Bed size/capacity of hospital
Figure 4: Percentage Respondents Based on Bed Size/Capacity of Hospital
23.5
11.8
29.4
35.3
0
5
10
15
20
25
30
35
40
Perc
enta
ge o
f Res
pond
ents
Less than 25 26 - 50 51-100 More than 101
Total number of doctors (including physicians/surgeons)
Figure 5: Percentage Respondents Based on Total Number of Doctors
Total Number of Doctors
Finally, the last sub-category of healthcare sample respondents presents the staff strength i.e. total number of doctors (including physicians/surgeons). This indicator is very important and useful for judging the background and strength of any company, as it is directly related to company’s worthiness and marketability (Duggirala et al. 2008). The data showed that four hospitals had a staff of less than 25 doctors (including physicians
and surgeons), two hospitals had staff strength between 26 and 50, five had more than 51 and less than 100 doctors while six hospitals had more than 101 doctors (Table 4). This concludes that 35.3 percent of the hospitals covered (more than one-third) have less than 50 doctors. These were small size hospitals, while 29.4 percent hospitals had a staff strength between 51 and 100 (medium size hospitals), and the remaining 35.3 percent of hospitals were large sized having more than 100
International Journal of Business Research and Development | Vol. 2 No.1, pp. 1‐17 11
Science Target Inc. www.sciencetarget.com
doctors. This shows that the sample is evenly distributed in terms of number of doctors, and covers a wide range of hospitals. The finding suggests that in Indian healthcare industry the staff strength is not a major problem in any type of hospital. The healthcare establishments are well equipped with doctors and other supporting attendants. The employee turnover rate is very low as compared to other service industry where absenteeism is very high. This is a healthy sign for any organization. Figure 5 shows the percentage respondents with respect to the number of doctors (including physicians/surgeons).
Demographics of Hospitality Industry
Type of Company
From the hospitality industry (including hotels and tourism companies), the total number of responses obtained was 34. These 34 responses were further classified into four sub-categories like type of company, ownership, total number of employees (staff), and ISO certification or any other quality certification of the company. The percentage responses received in these four sub-categories thus presents a picture of Indian hospitality industry up to some extent and is discussed below. With respect to the type of company covered, 18 out of 34 star hotels responded to the research instrument (52.9%) while 16 tourism companies (47.1%) participated in this study. It can be seen from the figures (Table 4) that a proportionate participation of both the industries exists and there was no bias seen. Figure 6 shows the percentage responses received from tourism companies and star hotels. Further, it was also observed that getting complete responses from hospitality industry was quite cumbersome as many repeated e-mails and different follow-up techniques were adopted in getting the responses from the identified hotels and tourism companies. The plausible cause may be the working hours of the assigned staff, nature of work culture and environment present in the company. Hence, most of the company’s respondents were personally contacted after getting prior appointment through telephone or e-mail and responses were obtained from them. Holjevac (2008); Sila and Ebrahimpour (2003); Arasli (2002) have also conducted similar studies where both types of hospitality companies (tourism and hotels) were covered.
Company Ownership
Regarding the ownership of the company, out of 34, seven companies were government owned and 27 were private companies. Further, most of the government companies were tourism types which were governed by a tourism department of respective states of India. Table 4 depicts that around 80 percent of the hospitality companies are private owned companies and remaining are the government companies which are the part of this survey study. Figure 7 presents ownership of the hospitality companies in terms of percentage responses received.
47.1
52.9
40
42
44
46
48
50
52
54
Perc
enta
ge o
f Res
pond
ents
Tourism Star Hotel
Type of company
Figure 6: Percentage Responses with Respect to Type of Company
20.6
79.4
0
10
20
30
40
50
60
70
80
Perc
enta
ge o
f Res
pond
ents
Government Private
Ownership
Figure 7: Percentage Respondents vs. Ownership of the Company
Employee Strength
With regard to the number of employees (staff), this category is grouped into two clusters, first cluster represents less than 50 employees and second cluster consisted of more than 50 employees. It is evident from Table 4 and Figure 8
12 © Talib and Rahman 2013 | Current Health
Science Target Inc. www.sciencetarget.com
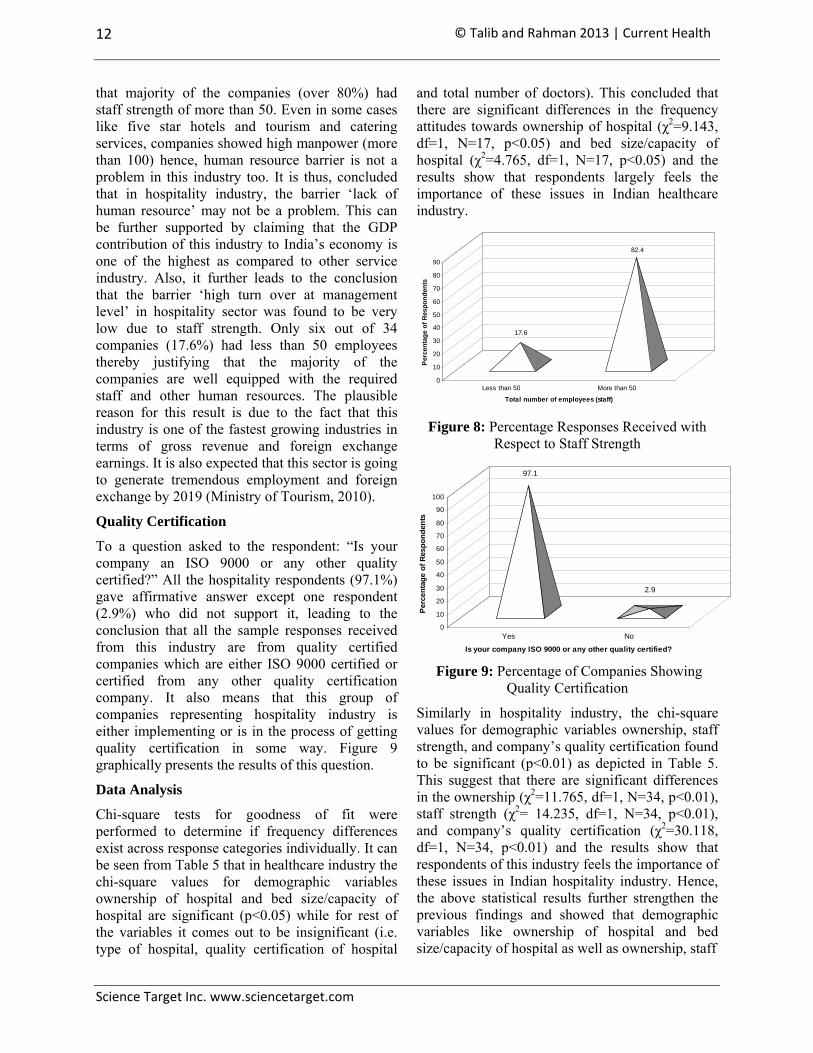
that majority of the companies (over 80%) had staff strength of more than 50. Even in some cases like five star hotels and tourism and catering services, companies showed high manpower (more than 100) hence, human resource barrier is not a problem in this industry too. It is thus, concluded that in hospitality industry, the barrier ‘lack of human resource’ may not be a problem. This can be further supported by claiming that the GDP contribution of this industry to India’s economy is one of the highest as compared to other service industry. Also, it further leads to the conclusion that the barrier ‘high turn over at management level’ in hospitality sector was found to be very low due to staff strength. Only six out of 34 companies (17.6%) had less than 50 employees thereby justifying that the majority of the companies are well equipped with the required staff and other human resources. The plausible reason for this result is due to the fact that this industry is one of the fastest growing industries in terms of gross revenue and foreign exchange earnings. It is also expected that this sector is going to generate tremendous employment and foreign exchange by 2019 (Ministry of Tourism, 2010).
Quality Certification
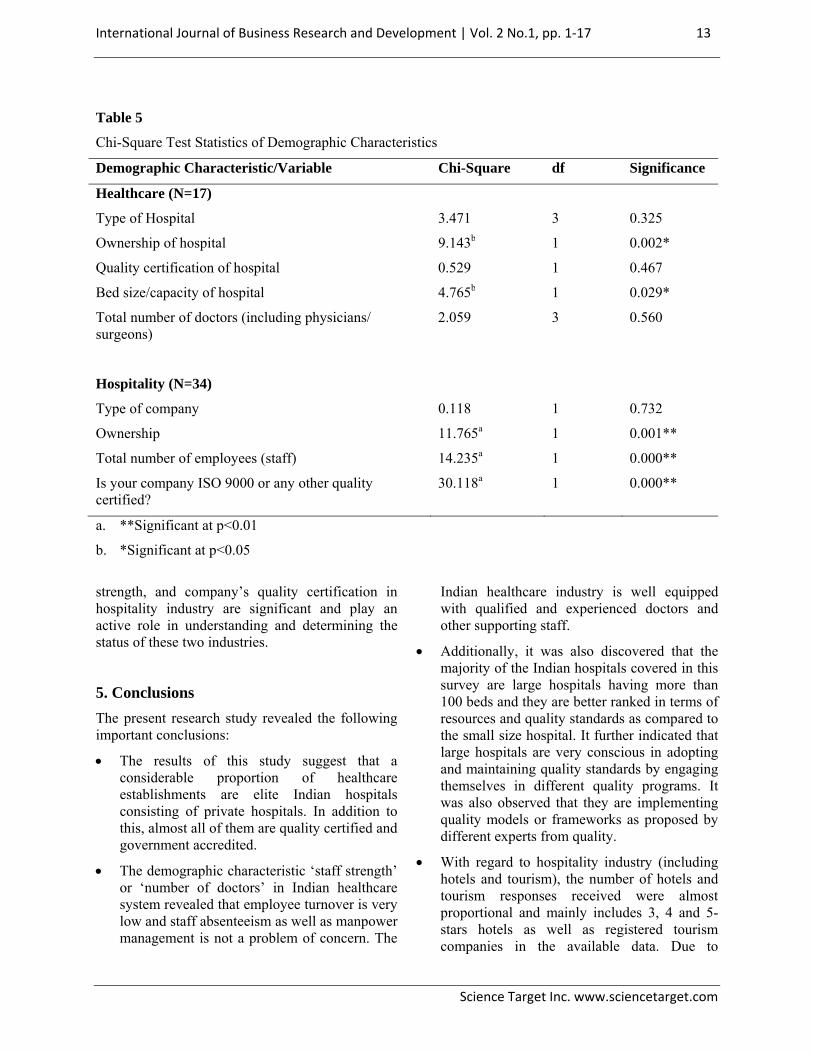
To a question asked to the respondent: “Is your company an ISO 9000 or any other quality certified?” All the hospitality respondents (97.1%) gave affirmative answer except one respondent (2.9%) who did not support it, leading to the conclusion that all the sample responses received from this industry are from quality certified companies which are either ISO 9000 certified or certified from any other quality certification company. It also means that this group of companies representing hospitality industry is either implementing or is in the process of getting quality certification in some way. Figure 9 graphically presents the results of this question.
Data Analysis
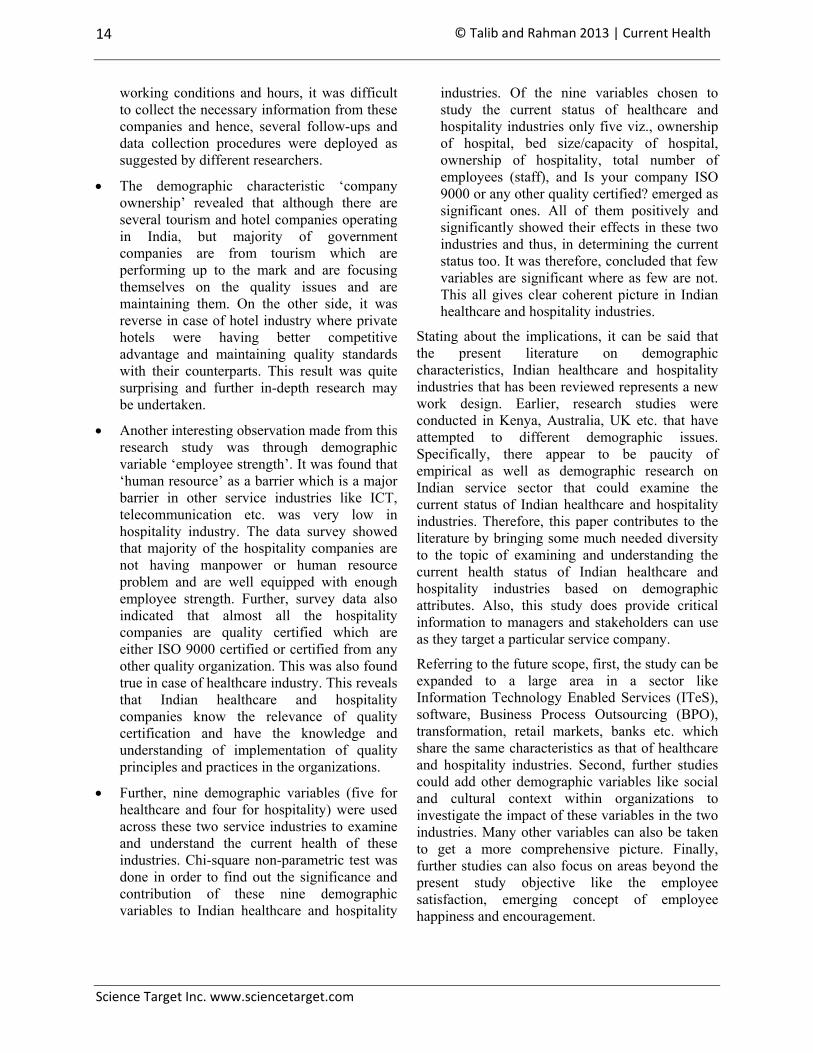
Chi-square tests for goodness of fit were performed to determine if frequency differences exist across response categories individually. It can be seen from Table 5 that in healthcare industry the chi-square values for demographic variables ownership of hospital and bed size/capacity of hospital are significant (p<0.05) while for rest of the variables it comes out to be insignificant (i.e. type of hospital, quality certification of hospital
and total number of doctors). This concluded that there are significant differences in the frequency attitudes towards ownership of hospital (χ2=9.143, df=1, N=17, p<0.05) and bed size/capacity of hospital (χ2=4.765, df=1, N=17, p<0.05) and the results show that respondents largely feels the importance of these issues in Indian healthcare industry.
17.6
82.4
0
10
20
30
40
50
60
70
80
90
Perc
enta
ge o
f Res
pond
ents
Less than 50 More than 50
Total number of employees (staff)
Figure 8: Percentage Responses Received with
Respect to Staff Strength
97.1
2.9
0
10
20
30
40
50
60
70
80
90
100
Per
cent
age
of R
espo
nden
ts
Yes No
Is your company ISO 9000 or any other quality certified?
Figure 9: Percentage of Companies Showing Quality Certification
Similarly in hospitality industry, the chi-square values for demographic variables ownership, staff strength, and company’s quality certification found to be significant (p<0.01) as depicted in Table 5. This suggest that there are significant differences in the ownership (χ2=11.765, df=1, N=34, p<0.01), staff strength (χ2= 14.235, df=1, N=34, p<0.01), and company’s quality certification (χ2=30.118, df=1, N=34, p<0.01) and the results show that respondents of this industry feels the importance of these issues in Indian hospitality industry. Hence, the above statistical results further strengthen the previous findings and showed that demographic variables like ownership of hospital and bed size/capacity of hospital as well as ownership, staff
International Journal of Business Research and Development | Vol. 2 No.1, pp. 1‐17 13
Science Target Inc. www.sciencetarget.com
Table 5
Chi-Square Test Statistics of Demographic Characteristics
Demographic Characteristic/Variable Chi-Square df Significance
Healthcare (N=17)
Type of Hospital 3.471 3 0.325
Ownership of hospital 9.143b 1 0.002*
Quality certification of hospital 0.529 1 0.467
Bed size/capacity of hospital 4.765b 1 0.029*
Total number of doctors (including physicians/ surgeons)
2.059 3 0.560
Hospitality (N=34)
Type of company 0.118 1 0.732
Ownership 11.765a 1 0.001**
Total number of employees (staff) 14.235a 1 0.000**
Is your company ISO 9000 or any other quality certified?
30.118a 1 0.000**
a. **Significant at p<0.01
b. *Significant at p<0.05
strength, and company’s quality certification in hospitality industry are significant and play an active role in understanding and determining the status of these two industries.
5. Conclusions The present research study revealed the following important conclusions:
• The results of this study suggest that a considerable proportion of healthcare establishments are elite Indian hospitals consisting of private hospitals. In addition to this, almost all of them are quality certified and government accredited.
• The demographic characteristic ‘staff strength’ or ‘number of doctors’ in Indian healthcare system revealed that employee turnover is very low and staff absenteeism as well as manpower management is not a problem of concern. The
Indian healthcare industry is well equipped with qualified and experienced doctors and other supporting staff.
• Additionally, it was also discovered that the majority of the Indian hospitals covered in this survey are large hospitals having more than 100 beds and they are better ranked in terms of resources and quality standards as compared to the small size hospital. It further indicated that large hospitals are very conscious in adopting and maintaining quality standards by engaging themselves in different quality programs. It was also observed that they are implementing quality models or frameworks as proposed by different experts from quality.
• With regard to hospitality industry (including hotels and tourism), the number of hotels and tourism responses received were almost proportional and mainly includes 3, 4 and 5-stars hotels as well as registered tourism companies in the available data. Due to
14 © Talib and Rahman 2013 | Current Health
Science Target Inc. www.sciencetarget.com
working conditions and hours, it was difficult to collect the necessary information from these companies and hence, several follow-ups and data collection procedures were deployed as suggested by different researchers.
• The demographic characteristic ‘company ownership’ revealed that although there are several tourism and hotel companies operating in India, but majority of government companies are from tourism which are performing up to the mark and are focusing themselves on the quality issues and are maintaining them. On the other side, it was reverse in case of hotel industry where private hotels were having better competitive advantage and maintaining quality standards with their counterparts. This result was quite surprising and further in-depth research may be undertaken.
• Another interesting observation made from this research study was through demographic variable ‘employee strength’. It was found that ‘human resource’ as a barrier which is a major barrier in other service industries like ICT, telecommunication etc. was very low in hospitality industry. The data survey showed that majority of the hospitality companies are not having manpower or human resource problem and are well equipped with enough employee strength. Further, survey data also indicated that almost all the hospitality companies are quality certified which are either ISO 9000 certified or certified from any other quality organization. This was also found true in case of healthcare industry. This reveals that Indian healthcare and hospitality companies know the relevance of quality certification and have the knowledge and understanding of implementation of quality principles and practices in the organizations.
• Further, nine demographic variables (five for healthcare and four for hospitality) were used across these two service industries to examine and understand the current health of these industries. Chi-square non-parametric test was done in order to find out the significance and contribution of these nine demographic variables to Indian healthcare and hospitality
industries. Of the nine variables chosen to study the current status of healthcare and hospitality industries only five viz., ownership of hospital, bed size/capacity of hospital, ownership of hospitality, total number of employees (staff), and Is your company ISO 9000 or any other quality certified? emerged as significant ones. All of them positively and significantly showed their effects in these two industries and thus, in determining the current status too. It was therefore, concluded that few variables are significant where as few are not. This all gives clear coherent picture in Indian healthcare and hospitality industries.
Stating about the implications, it can be said that the present literature on demographic characteristics, Indian healthcare and hospitality industries that has been reviewed represents a new work design. Earlier, research studies were conducted in Kenya, Australia, UK etc. that have attempted to different demographic issues. Specifically, there appear to be paucity of empirical as well as demographic research on Indian service sector that could examine the current status of Indian healthcare and hospitality industries. Therefore, this paper contributes to the literature by bringing some much needed diversity to the topic of examining and understanding the current health status of Indian healthcare and hospitality industries based on demographic attributes. Also, this study does provide critical information to managers and stakeholders can use as they target a particular service company.
Referring to the future scope, first, the study can be expanded to a large area in a sector like Information Technology Enabled Services (ITeS), software, Business Process Outsourcing (BPO), transformation, retail markets, banks etc. which share the same characteristics as that of healthcare and hospitality industries. Second, further studies could add other demographic variables like social and cultural context within organizations to investigate the impact of these variables in the two industries. Many other variables can also be taken to get a more comprehensive picture. Finally, further studies can also focus on areas beyond the present study objective like the employee satisfaction, emerging concept of employee happiness and encouragement.
International Journal of Business Research and Development | Vol. 2 No.1, pp. 1‐17 15
Science Target Inc. www.sciencetarget.com
References Aagja, J.P. and Garg, R. (2010), “Measuring
perceived service quality for public hospitals (PubHosQual) in the Indian context”, International Journal of Pharmaceutical and Healthcare Marketing, Vol. 4 No. 1, pp. 60-83
Arasli, H. (2002), “Diagnosing whether northern Cyprus hotels are ready for TQM: an empirical analysis”, Total Quality Management and Business Excellence, Vol.13 No.3, pp. 347-364.
Arasli, H., Mehtap-Smadi, S. And Katircioglu, S.T. (2005), “Customer service quality in the Greek Cypriot banking industry”, Managing Service Quality, Vol.15 No.1, pp. 41-56
Azam, M., Rahman, Z., and Talib, F. (2012), “A critical study of quality parameters in health care establishment: Developing an integrated quality model”, International Journal of Health Care Quality Assurance, Vol. 25, No.5, pp. 387-402
Bayraktar, E., Tatiglu, E. and Zaim, S. (2008), “An instrument for measuring the critical factor of TQM in Turkish higher education”, Total Quality Management and Business Excellence, Vol.19 No.6, pp. 551-574
Branca, A.S. (2008), “Demographic influences on behaviour: An update to the adoption of bank delivery channels”, International Journal of Bank Marketing, Vol. 26 No.4, pp. 237-259
Bygstad, B. and Lanestedt, G. (2009) ‘ICT based service innovation- a challenge for project management’, International Journal of Project Management, Vol.27, pp. 234-242
Carvana, A. (2002), “Service loyalty: the effects of service quality and the mediating role of customer satisfaction”, European Journal of Marketing, Vol.36 No.7&8, pp. 811-829
CATI (2003), Computer Assisted Telephone Interviewing, Technical Reference Group, National Public Health Partnership, Canberra, Australia
Chartrungruang, B.-On, Turner, L., King, B. and Waryszak, R. (2006), “Customer satisfaction, training, and TQM: a comparative study of Western and Thai hotels”, Journal of Human Resources in Hospitality and Tourism, Vol.5 No.1, pp. 51-75.
Claver-Cortés, E., Pereira-Moliner, J., Tarí, J. J. and Molina-Azorín, J. F., (2008), “TQM, managerial factors and performance in the Spanish hotel industry”, Industrial Management and Data Systems, Vol.108 No.2, pp. 228-244
CMIE, 2010, i-cube, Information Infrastructure for Institutions, Centre for Monitoring Indian Economy Private Limited, India, Website: http://www.cmie.com/database/?service=database-products/customised-solutions/information-infrastructure-for-institutions.htm. [Assessed 20 May 2010]
Coakes, S.J., Steed, L. and Dzidic, P. (2006), SPSS: Analysis without Anguish: Version 16 for Windows, John-Wiley, India
CSO (2010), Central Statistics Office, Ministry of Statistics and Program Implementation, Government of India, Website: http://www.mospi.gov.in/cso_test1.htm. [Assessed 13 July, 2010]
Duggirala, M., Rajendran, C. & Anantharaman, R.N. (2008), “Patient-perceived dimensions of total quality service in healthcare”, Benchmarking: An International Journal, Vol.15 No.5, pp. 560-583
Ganesan-Lim, C., Russell-Bennett, R. and Dagger, T. (2008), “The impact of service contact type and demographic characteristics on service quality perceptions”, Journal of Services Marketing, Vol.22 No.7, pp. 550-561
Guru, C. (2003), “Tailoring e-service through CRM”, Managing Service Quality, Vol.13 No.6, pp. 520-531
Hansman, H. and Schutjens, V. (1993), “Dynamics in market segmentation: a demographic perspective on age-specific consumption”, Marketing and Research Today, Vol. 21 No. 3, pp. 139-47
Holjevac, I.A. (2008), “Business ethics in tourism-as a dimension of TQM”, Total Quality Management, Vol.19 No.10, pp. 1029-1041
JCAHO Certification (2004). Apollo Hospitals positions itself as an Indian MNC: Enrolls for JCAHO certification, August 28, 2004, in Business Standard, Regional Bureau, Hyderabad, www.business-std..com/bsonline

16 © Talib and Rahman 2013 | Current Health
Science Target Inc. www.sciencetarget.com
Karwan, K.R. and Markland, R.E. (2006) ‘Integrating service design principles ad information technology to improve delivering and productivity in public sector operations: the case of the South Carolina DMV’, Journal of Operations Management, Vol.24, No.4, pp. 347-362
Kohlman, M.H. (2004), “Person or position?: the demographics of sexual harassment in the workplace”, Equal Opportunities International, Vol.23 No.3, pp. 143-161.
Kotler, P. and Armstrong, G. (1991), Principles of Marketing, 5th ed., Prentice-Hall, Englewood Cliffs, NJ
Kunst, P. and Lemmink, J. (2000), “Quality Management and Business Performance in Hospitals: A Search for Success Parameters”, Total Quality Management, Vol.11 No.8, pp. 1123-1333
Lasser, W.M., Manolis, C. and Winsor, R.D. (2000), “Service quality perspectives and satisfaction in private banking”, Journal of Service Marketing, Vol.14 No.3, pp. 244-271
Lazer, W. (1994), Handbook of Demographics for Marketing and Advertising, 2nd ed., Lexington Books, New York, NY
Lewis, B.R. (1991), “Customer care in service organizations”, Management Decision, Vol.29 No.1, pp. 31-34
Lim, P.C. and Tang, N.K.H. (2000), “The development of a model for total quality healthcare”, Managing Service Quality, Vol. 10 No. 2, pp. 103-111
Lin, C.-F. (2002), “Segmenting customer brand preference: demographic or psychographic”, Journal of Product and Brand Management, Vol. 11 No.4, pp. 249-268
Machauer, A. and Morgner, S. (2001), “Segmentation of bank customers by expected benefits and attitudes”, International Journal of Bank Marketing, Vol. 19 No.1, pp. 6-18.
Manjunath, U., Metri, B.A. and Ramachandran, S. (2007), “Quality management in a healthcare organisation: a case of South Indian hospital”, The TQM Magazine, Vol.19 No.2, pp. 129-139
MI&B (2009), Ministry of Information and Broadcasting, Government of India, Soochna Bhawan, New Delhi, pp.930, www.publicationsdivision.nic.in, [Assessed 13 July, 2010]
Miller, W.J., Sumner, A.T. and Deane, R.H. (2009), “Assessment of Quality Management Practices within the Healthcare Industry”, American Journal of Economics and Business Administration, Vol.1 No.2, pp. 105-113
Ministry of Tourism, Government of India (2010), Website: http://www.tourism.gov.in/. [Assessed 13 July 2010]
MoL&E, GOI, (2010), Ministry of Labor and Employment, Government of India. Website: http://labour.nic.in/. [Assessed 01 July 2012]
Nandaraj, S., Khot, A., Menon, S. and Brugha, R. (2001), “A stakeholder approach towards accreditation”, Health Policy and Planning, Vol. 16 No. 2, pp. 70-79
Narang, R. (2011), “Determining quality of public health care services in rural India”, Clinical Governance: An International Journal Vol. 16 No. 1, pp. 35-49
Onywera, V.O., Scott, R.A., Boit, M.K., and Pitsiladis, Y.P. (2006), “Demographic characteristics of elite Kenyan endurance runners”, Journal of Sports Sciences, Vol.24 No.4, pp. 415–422
Padma, P., Rajendran, C. and Sai, L.P. (2009), “A conceptual framework of service quality in healthcare Perspectives of Indian patients and their attendants”, Benchmarking: An International Journal, Vol. 16 No. 2, pp. 157-191
Planning Commission Report (2010), Government of India, Website: http://www.planning commission.nic.in/sector/health.html [Assessed 13 July 2010]
Raja, M.P.N., Deshmukh, S.G. and Wadhwa, S. (2007), “Quality award dimension: a strategic instrument for measuring health service quality”, International Journal of Health Care Quality Assurance, Vol. 20 No.5, pp. 363-378
Rohini, R. and Mahadevappa, B. (2006), “A study of total quality management practices in

International Journal of Business Research and Development | Vol. 2 No.1, pp. 1‐17 17
Science Target Inc. www.sciencetarget.com
healthcare services”, Productivity, Vol.46 No.4, pp. 492-503
Sahu, A.K. (2007), “Measuring service quality in an academic library: an Indian case study”, Library Review, Vol.56 No.3, pp. 234-243
Salaheldin, S.I. (2009) ‘Critical success factors for TQM implementation and their impact on performance of SMEs’, International Journal of Productivity and Performance Management, Vol. 58, No.3, pp. 215-237
Sengupta, S. (2011), “An exploratory study on job and demographic attributes affecting employee satisfaction in the Indian BPO industry”, Strategic Outsourcing: An International Journal, Vol. 4 No.3, pp. 248–273
Seth, N., Deshmukh, S.G. and Vrat, P. (2005), “Service quality models: a review”, International Journal of Quality and Reliability Management, Vol.22 No.9, pp. 913-949
Sila, I. and Ebrahimpour, M. (2003), “An examination of quality management in luxury hotels”, International Journal of Hospitality and Tourism Administration, Vol.4 No.2, pp. 33-59
Sila, I. and Ebrahimpour, M. (2005), “Critical linkages among TQM factors and business results”, International Journal of Operations and Production Management, Vol. 25 No.11, pp. 1123-1155
Sohail, S.M. (2003), “Service quality in hospitals: more favorable than you might think”, Managing Service Quality, Vol. 13 No. 3, pp. 197-206.
Stafford, M.R. (1996),”Demographic discriminators of service quality in the banking industry”, Journal of Services Marketing, Vol. 10 No. 4 pp. 6-22
Sureshchandar, G. S., Rajendran, C. and Anantharaman, R.N. (2002), “The relationship between management’s perception of total quality service and customer perception of service quality”, Total Quality Management, Vol.13, pp. 69-88
Talib, F., Rahman, Z. and Azam, M (2010), “Total Quality Management Implementation in the Healthcare Industry: A Proposed Framework”,
Proceedings of Second International Conference on Production and Industrial Engineering, organized by Department of Industrial and Production Engineering, Dr. B.R. Ambedkar National Institute of Technology, Jalandhar (NITJ), Punjab, India during December 03-05, pp. 1361-1368
Talib, F., Rahman, Z. and Azam, M. (2011), “Best practices of total quality management implementation in healthcare setting”, International Journal of Health Marketing Quarterly, Vol.28, No.3, pp. 232-252
Talib, F., Rahman, Z. and Qureshi, M.N. (2012a), “Total quality management in service sector: a literature review”, International Journal of Business Innovation and Research, Vol. 6, No.3, pp. 259-301
Talib, F., Rahman, Z. and Qureshi, M.N. (2012b), “Total Quality Management Practices in Indian Hospitality Industry: Some Key Findings from Survey”, National Conference on Emerging Challenges for Sustainable Business (ECSB-2012), Department of Management Studies, Indian Institute of Technology Roorkee, India, June 1-2, pp. 1866-1888
The Times of India (2009), “Accreditation results in high quality care and patient safety”, The Times of India, July 19, p. 5
The World Bank Group (2010), World Development Indicators. Website: http://data.worldbank.org/indicator. [Assessed 13 July 2010]
Thun, J.-H., Größler, A. and Miczka, S. (2007), “The impact of the demographic transition on manufacturing: Effects of an ageing workforce in German industrial firms”, Journal of Manufacturing Technology Management, Vol.18 No.8, pp. 985-999
Walsh, G. and Mitchell, V.-W. (2005), “Demo-graphic characteristics of consumers who find it difficult to decide”, Marketing Intelligence and Planning, Vol. 23 No.3, pp. 281-295
Yeoh, P.-L. (2011), “Location choice and the internationalization sequence: Insights from Indian pharmaceutical Companies”, International Marketing Review Vol. 28 No. 3, pp. 291-312.