Cumulative risk assessment lessons learned: a review of case studies and issue papers
9
Review Cumulative risk assessment lessons learned: A review of case studies and issue papers Sarah S. Gallagher a,⇑ , Glenn E. Rice b , Louis J. Scarano c , Linda K. Teuschler b , George Bollweg d , Lawrence Martin e a American Association for the Advancement of Science (AAAS) Science and Technology Policy Fellow, U.S. Environmental Protection Agency (EPA) Office of the Science Advisor, 1200 Pennsylvania Ave. NW., Washington, DC 20460, USA b U.S. EPA National Center for Environmental Assessment, 26 W. Martin Luther King Dr., Cincinnati, OH 45268, USA c U.S. EPA Office of Pollution Prevention and Toxics, 1200 Pennsylvania Ave. NW., Washington, DC 20460, USA d U.S. EPA Region 5 Air and Radiation Division, 77 W. Jackson Blvd., Chicago, IL 60604, USA e U.S. EPA Office of the Science Advisor, 1200 Pennsylvania Ave. NW., Washington, DC 20460, USA highlights Authors identify six lessons learned from ten US EPA cumulative risk assessments. Due to a population focus cumulative risk assessments need engaged stakeholders. Tiering can focus the scope of cumulative risk assessments and prioritize stressors. An iterative approach for cumulative assessments reduces complications of multiple stressors. Quantifying risks in vulnerable populations is important, but data gaps remain. article info Article history: Received 24 March 2014 Received in revised form 9 October 2014 Accepted 11 October 2014 Available online 6 November 2014 Handling Editor: Tamara S. Galloway Keywords: Cumulative risk assessment Vulnerability Stakeholder involvement Tiered approach Chemical mixture Multiroute exposure abstract Cumulative risk assessments (CRAs) examine potential risks posed by exposure to multiple and sometimes disparate environmental stressors. CRAs are more resource intensive than single chemical assessments, and pose additional challenges and sources of uncertainty. CRAs may examine the impact of several factors on risk, including exposure magnitude and timing, chemical mixture composition, as well as physical, biological, or psychosocial stressors. CRAs are meant to increase the relevance of risk assessments, providing decision makers with information based on real world exposure scenarios that improve the characterization of actual risks and hazards. The U.S. Environmental Protection Agency has evaluated a number of CRAs, performed by or commissioned for the Agency, to seek insight into CRA concepts, methods, and lessons learned. In this article, ten case studies and five issue papers on key CRA topics are examined and a set of lessons learned are identified for CRA implementation. The lessons address the iterative nature of CRAs, importance of considering vulnerability, need for stake- holder engagement, value of a tiered approach, new methods to assess multiroute exposures to chemical mixtures, and the impact of geographical scale on approach and purpose. Ó 2014 Elsevier Ltd. All rights reserved. http://dx.doi.org/10.1016/j.chemosphere.2014.10.030 0045-6535/Ó 2014 Elsevier Ltd. All rights reserved. Abbreviations: BMD 10 , benchmark dose estimate for 10%; CAG, Common Assessment Group; CEP, Community Environmental Partnership; CRA, cumulative risk assessment; CRPF, cumulative relative potency factor; DBP, disinfection by- product; EPA, Environmental Protection Agency; ERA, ecological risk assessment; FQPA, Food Quality Protection Act; HAP, hazardous air pollutant; HI, hazard index; HQ, hazard quotient; ICED, index chemical equivalent dose; MOA, mode of action; NATA, National-Scale Air Toxics Assessment; OP, organophosphorus pesticides; OPP, Office of Pesticide Programs; RAIMI, Regional Air Impact Modeling Initiative; ReVA, Regional Vulnerability Assessment; RPF, relative potency factor. ⇑ Corresponding author at: Oak Ridge Institute for Science and Education Fellow, U.S. EPA Office of Solid Waste and Emergency Response, 1200 Pennsylvania Ave. NW., Washington, DC 20460, USA. Tel.: +1 202 566 1394. E-mail address: [email protected] (S.S. Gallagher). Chemosphere 120 (2015) 697–705 Contents lists available at ScienceDirect Chemosphere journal homepage: www.elsevier.com/locate/chemosphere
Transcript of Cumulative risk assessment lessons learned: a review of case studies and issue papers

Chemosphere 120 (2015) 697–705
Contents lists available at ScienceDirect
Chemosphere
journal homepage: www.elsevier .com/locate /chemosphere
Review
Cumulative risk assessment lessons learned: A review of case studiesand issue papers
http://dx.doi.org/10.1016/j.chemosphere.2014.10.0300045-6535/� 2014 Elsevier Ltd. All rights reserved.
Abbreviations: BMD10, benchmark dose estimate for 10%; CAG, CommonAssessment Group; CEP, Community Environmental Partnership; CRA, cumulativerisk assessment; CRPF, cumulative relative potency factor; DBP, disinfection by-product; EPA, Environmental Protection Agency; ERA, ecological risk assessment;FQPA, Food Quality Protection Act; HAP, hazardous air pollutant; HI, hazard index;HQ, hazard quotient; ICED, index chemical equivalent dose; MOA, mode of action;NATA, National-Scale Air Toxics Assessment; OP, organophosphorus pesticides;OPP, Office of Pesticide Programs; RAIMI, Regional Air Impact Modeling Initiative;ReVA, Regional Vulnerability Assessment; RPF, relative potency factor.⇑ Corresponding author at: Oak Ridge Institute for Science and Education Fellow,
U.S. EPA Office of Solid Waste and Emergency Response, 1200 Pennsylvania Ave.NW., Washington, DC 20460, USA. Tel.: +1 202 566 1394.
E-mail address: [email protected] (S.S. Gallagher).
Sarah S. Gallagher a,⇑, Glenn E. Rice b, Louis J. Scarano c, Linda K. Teuschler b, George Bollweg d,Lawrence Martin e
a American Association for the Advancement of Science (AAAS) Science and Technology Policy Fellow, U.S. Environmental Protection Agency (EPA) Office of the Science Advisor,1200 Pennsylvania Ave. NW., Washington, DC 20460, USAb U.S. EPA National Center for Environmental Assessment, 26 W. Martin Luther King Dr., Cincinnati, OH 45268, USAc U.S. EPA Office of Pollution Prevention and Toxics, 1200 Pennsylvania Ave. NW., Washington, DC 20460, USAd U.S. EPA Region 5 Air and Radiation Division, 77 W. Jackson Blvd., Chicago, IL 60604, USAe U.S. EPA Office of the Science Advisor, 1200 Pennsylvania Ave. NW., Washington, DC 20460, USA
h i g h l i g h t s
� Authors identify six lessons learned from ten US EPA cumulative risk assessments.� Due to a population focus cumulative risk assessments need engaged stakeholders.� Tiering can focus the scope of cumulative risk assessments and prioritize stressors.� An iterative approach for cumulative assessments reduces complications of multiple stressors.� Quantifying risks in vulnerable populations is important, but data gaps remain.
a r t i c l e i n f o
Article history:Received 24 March 2014Received in revised form 9 October 2014Accepted 11 October 2014Available online 6 November 2014
Handling Editor: Tamara S. Galloway
Keywords:Cumulative risk assessmentVulnerabilityStakeholder involvementTiered approachChemical mixtureMultiroute exposure
a b s t r a c t
Cumulative risk assessments (CRAs) examine potential risks posed by exposure to multiple andsometimes disparate environmental stressors. CRAs are more resource intensive than single chemicalassessments, and pose additional challenges and sources of uncertainty. CRAs may examine the impactof several factors on risk, including exposure magnitude and timing, chemical mixture composition, aswell as physical, biological, or psychosocial stressors. CRAs are meant to increase the relevance of riskassessments, providing decision makers with information based on real world exposure scenarios thatimprove the characterization of actual risks and hazards. The U.S. Environmental Protection Agencyhas evaluated a number of CRAs, performed by or commissioned for the Agency, to seek insight intoCRA concepts, methods, and lessons learned. In this article, ten case studies and five issue papers onkey CRA topics are examined and a set of lessons learned are identified for CRA implementation. Thelessons address the iterative nature of CRAs, importance of considering vulnerability, need for stake-holder engagement, value of a tiered approach, new methods to assess multiroute exposures to chemicalmixtures, and the impact of geographical scale on approach and purpose.
� 2014 Elsevier Ltd. All rights reserved.

698 S.S. Gallagher et al. / Chemosphere 120 (2015) 697–705
Contents
1. Background and purpose . . . . . . . . . . . . . . . . . . . . . . . . . . . . . . . . . . . . . . . . . . . . . . . . . . . . . . . . . . . . . . . . . . . . . . . . . . . . . . . . . . . . . . . . . . . . . . . 6982. Scope of the paper . . . . . . . . . . . . . . . . . . . . . . . . . . . . . . . . . . . . . . . . . . . . . . . . . . . . . . . . . . . . . . . . . . . . . . . . . . . . . . . . . . . . . . . . . . . . . . . . . . . . 6983. Lessons learned from the case studies and issue papers . . . . . . . . . . . . . . . . . . . . . . . . . . . . . . . . . . . . . . . . . . . . . . . . . . . . . . . . . . . . . . . . . . . . . . 698
3.1. Lesson 1: iterative nature of CRA . . . . . . . . . . . . . . . . . . . . . . . . . . . . . . . . . . . . . . . . . . . . . . . . . . . . . . . . . . . . . . . . . . . . . . . . . . . . . . . . . . . 6983.2. Lesson 2: importance of vulnerability . . . . . . . . . . . . . . . . . . . . . . . . . . . . . . . . . . . . . . . . . . . . . . . . . . . . . . . . . . . . . . . . . . . . . . . . . . . . . . . 6993.3. Lesson 3: importance of stakeholder engagement . . . . . . . . . . . . . . . . . . . . . . . . . . . . . . . . . . . . . . . . . . . . . . . . . . . . . . . . . . . . . . . . . . . . . 7003.4. Lesson 4: the value of a tiered approach . . . . . . . . . . . . . . . . . . . . . . . . . . . . . . . . . . . . . . . . . . . . . . . . . . . . . . . . . . . . . . . . . . . . . . . . . . . . . 7013.5. Lesson 5: the need for new methods for CRA . . . . . . . . . . . . . . . . . . . . . . . . . . . . . . . . . . . . . . . . . . . . . . . . . . . . . . . . . . . . . . . . . . . . . . . . . 7023.6. Lesson 6: implications of spatial scale . . . . . . . . . . . . . . . . . . . . . . . . . . . . . . . . . . . . . . . . . . . . . . . . . . . . . . . . . . . . . . . . . . . . . . . . . . . . . . . 702
4. Discussion. . . . . . . . . . . . . . . . . . . . . . . . . . . . . . . . . . . . . . . . . . . . . . . . . . . . . . . . . . . . . . . . . . . . . . . . . . . . . . . . . . . . . . . . . . . . . . . . . . . . . . . . . . . 7035. Conclusion . . . . . . . . . . . . . . . . . . . . . . . . . . . . . . . . . . . . . . . . . . . . . . . . . . . . . . . . . . . . . . . . . . . . . . . . . . . . . . . . . . . . . . . . . . . . . . . . . . . . . . . . . . 704
Acknowledgements . . . . . . . . . . . . . . . . . . . . . . . . . . . . . . . . . . . . . . . . . . . . . . . . . . . . . . . . . . . . . . . . . . . . . . . . . . . . . . . . . . . . . . . . . . . . . . . . . . . 704References . . . . . . . . . . . . . . . . . . . . . . . . . . . . . . . . . . . . . . . . . . . . . . . . . . . . . . . . . . . . . . . . . . . . . . . . . . . . . . . . . . . . . . . . . . . . . . . . . . . . . . . . . . 704
1. Background and purpose
Evaluations of environmental hazards and human health risksare expanding from single chemical or simple chemical mixtureapproaches to more comprehensive approaches that examine risksposed by exposures to multiple stressors, including chemical,physical, biological, and psychosocial stressors. Traditionalenvironmental risk assessment approaches focus on chemical ormicrobial hazards, independently of other hazards or stressors.Attempting to analyze ‘‘real world’’ exposures and improve theaccuracy of the characterization of risks, cumulative risk assess-ments (CRAs) examine human health and environmental risksfrom the perspective that populations are exposed simultaneouslyto multiple stressors via multiple exposure routes and pathways(Callahan and Sexton, 2007).
The U.S. Environmental Protection Agency (EPA) has long recog-nized the potential importance of expanding the focus of riskassessment activities beyond single chemicals (Browner, 1995).In 2003, the EPA published the Framework for Cumulative RiskAssessment (herein called the Framework) (US EPA, 2003b). TheFramework defines cumulative risk as ‘‘the combined risks fromaggregate exposures to multiple agents or stressors’’ and empha-sizes considering population vulnerabilities. After its publication,the EPA initiated two efforts to amass information for developingCRA Guidelines. First, the EPA collected Agency assessments thataddressed one or more aspects of CRA and examined the utilityof the methods used in these CRA ‘‘case studies’’. Second, the EPAcommissioned five issue papers that investigated key CRA topicsdeemed critical to understand and improve the accuracy of riskspredicted by CRA methods.
2. Scope of the paper
This article describes six key ‘‘lessons learned’’ from the CRAcase studies (Table 1) and issue papers (Table 2). While evaluatingthese individually to determine their contributions to criticalaspects of CRA, we note that several of these lessons apply gener-ally to risk assessment practices. The case studies highlightapproaches that EPA program and regional offices and researchprograms developed to address risks posed by exposures to multi-ple stressors. They reflect varied geographic scales, including CRAsconducted at both national and community levels, and variedscope, with three evaluating ecological endpoints, six evaluatinghuman health endpoints, and one evaluating both human healthand ecological endpoints separately (rather than in an integratedmanner).
The five issue papers (Table 2) investigated specific topics thatinclude: articulating the challenges to conducting CRAs, evaluating
combined health effects from multiple stressors, incorporating vul-nerability into CRA, assessing environmental mixtures, and usingbiomarkers to inform CRA (Callahan and Sexton, 2007; DeFuret al., 2007; Menzie et al., 2007; Ryan et al., 2007; Sexton andHattis, 2007).
3. Lessons learned from the case studies and issue papers
3.1. Lesson 1: iterative nature of CRA
EPA’s Framework recognized that iteration would be essential inthe conduct of CRAs. The three phases of a CRA -planning, scoping,and problem formulation; analysis; and risk characterization-would not always be conducted unidirectionally (US EPA, 2003b).As different types of stressors and population vulnerabilities areidentified and associated risks are characterized, the need for addi-tional data on interactions among stressors of interest, otherstressors that could be related (e.g., cause same health effect), orpopulation vulnerabilities may be recognized and require the col-lection of additional data or further analysis. Similarly, during theconduct of a CRA, unanticipated risk management options maybecome apparent that could entail additional analysis or reconsid-eration of the risk assessment approach. These are simple exam-ples of the role that an iterative approach may have during aCRA. In its recommendations for improving the utility of riskassessment, the National Research Council (2009) also identifiedthis as being an important risk assessment practice.
The Clinch and Powell Valley Ecological Risk Assessment exempli-fies the iterative conduct of a CRA (Diamond et al., 2002; US EPA,2002a). The assessment goal was to determine whether mining,urbanization, and agricultural activities in the watershed wereadversely impacting fish and mussel species. The conceptual mod-els for this assessment provided the following: (1) identify theexposed populations (i.e., fish, mussels); (2) identify possiblesources of stressors (e.g., runoff from mining activities); (3) specifyadverse effects (e.g., unacceptable losses of native fish); and (4)conceptualize the pathways by which the stressors impact assess-ment endpoints (e.g., runoff enters water bodies where fish reside).The relationships depicted in these conceptual models providedthe initial inputs to the analysis plan. As the assessment pro-gressed, unanticipated gaps were identified for specific stressorand effects data (e.g., a lack of water chemistry data preventedthe analysis of relationships between water quality stressors andland uses, including urbanization). To overcome this challenge,the analytical approach was modified; nearby land-use activitiesalong with habitat quality information served as surrogates forwater quality stressor levels (US EPA, 2002a).
Table 1Summary of the ten case studies.
Title Goal Results Lessons learned
Iterative nature of cumulative risk assessment (CRA)
Clinch and Powell ValleyWatershed Ecological RiskAssessment (ERA) US EPA(2002a)
Establish a baseline for futurewatershed assessments anddetermine if multiple stressors wereadversely impacting the fish andmussel species
Identified key stressors (e.g., proximity tomining activities) and managementapproaches (e.g., restoration of abandonedmines)
Iteration enhanced development of animproved analysis plan. An initial conceptualmodel, depicting the relationships betweenland uses and stressors, was revised based ondata availability and the preliminary analysis
Importance of considering vulnerability
Regional VulnerabilityAssessment for the Mid-Atlantic Region US EPA(2002e)
Develop a tool to identify ecosystemsmost vulnerable to loss or permanentharm and stressors posing thegreatest risks
Developed a decision aid that identifiesvulnerable ecosystems and stressors drivingecological change
Individual data integration methods canaddress different aspects of vulnerability andcan be sensitive to different data problems.Used combinations of integration methods toaddress data limitations
Air Screening Assessment forCook County, Illinois andLake County, Indiana(Argonne NationalLaboratory, 2004)
Evaluate the cumulative cancer andnoncancer inhalation hazards from airpollutants in the study area
Provided alternative tools for evaluating airquality. Cumulative hazard indicators (e.g.,toxicity weights for emissionsa).Characterized sources/contributions ofstressors, spatial distribution of stressors,and potentially vulnerable populations
Importance of identifying vulnerablepopulations, including groups withpreexisting diseases and elevated stressorexposures, who could experience adversehealth outcomes from additional stressorexposures or are more likely to develop moresevere outcomes than the general population
Importance of stakeholder engagement
Waquoit Bay ERA US EPA(2002f)
Identify how stressors were impactingwater quality in Waquoit Bay, andwhich were the most important tomanage to improve water quality
Utilizing stakeholder input on environmentalconcerns and important local resources,identified stressor of greatest concern
Providing opportunities for stakeholderinvolvement is essential throughout the CRA
Baltimore CommunityEnvironmental Partnership(CEP) Study US EPA(2000a)
Evaluate impact of multiple emissionssources on local air quality. Identifyeffective prevention efforts toimprove community health
Involved stakeholders in initial projectstages. Changes in scope due to resource anddata constraints were communicatedineffectively
Consistent stakeholder engagementfacilitates community understanding ofgoals, limits, and questions that a CRA cananswer
Value of a tiered approach
Industrial SurfaceImpoundment Sites USEPA (2000c)
Estimate human health and ecologicalrisks posed by managing wastes insurface impoundments, and‘‘protectiveness’’ of regulations
For human health, single chemical hazards/risks aggregated across exposure pathwayswere generally below levels of concern. Forecological effects, the assessment suggestedpossibility of adverse effects
Tiered approaches allow facilities that areunlikely to pose a risk to human health or theenvironment to be screened out, reducingthe number of facilities requiring moreresource-intensive assessment
Baltimore CEP Study US EPA(2000a)
Evaluate impact of multiple sourceson local air quality; identify effectiveprevention efforts to improvecommunity health
Established an emission sources inventoryfor air pollutants. Using a three-tiered,screening approach, estimated aggregateexposure levels and identified chemicals ofconcern
A risk-based screening approach was used tofocus the assessment. Refined exposureestimates as tiers progressed
New methods for chemical mixtures and multiroute exposure
Organophosphorus Pesticide(OP) CRA US EPA (2002d,2006a)
Examine health risks posed bymultiple pathways of exposures tomixtures of OPs acting by a commonmode of action
Compared the risk posed by OP exposures viadifferent pathways, identified major sourcesof exposure, and evaluated if risk mitigationefforts effectively reduced exposure
The Relative Potency Factors Approach isuseful for evaluating mixture risk
Drinking Water DisinfectionBy-Product (DBP) MixturesUS EPA (2003a); Teuschleret al. (2004)
Evaluate cumulative, multirouteexposures to DBPs and assesspotential health risks
Developed method to evaluate groups ofDBPs whose components caused toxicity viadifferent modes of action. Estimated internaldoses of DBPs based on multiroute exposuremodeling
A probabilistic approach can be used toestimate DBP multiple route exposures. TheCumulative Relative Potency Factor approachcan be used to estimate mixture risks
Implications of Spatial Scale
National-Scale Air ToxicsAssessment US EPA(2006a)
Assess potential health risksassociated with inhalation exposureto �180 chemicals (individually andcombined)
Calculated cumulative cancer risks andnoncancer hazards. Identified national andregional risk drivers. Developed model-to-monitor comparisons, and limitations ofestimates
This national-scale assessment enabled EPAto identify specific hazardous air pollutants(HAPs) and emission sources thatcontributed the most to national populationrisk
Regional Air Impact ModelingInitiative US EPA (2003c)
Identify a standard approach forpermitting authorities to assessaggregate risks from exposure tomultiple pollutants, sources, andpathways
Provided detailed contaminant-, source-, andreceptor-specific information supporting theidentification and prioritization of riskmanagement opportunities
The finer resolution spatial level enables riskassessors to consider cumulative impacts onneighborhoods when evaluating facilitysiting proposals
a Emission mass (pounds per year) was multiplied by Risk Screening Environmental Indicators toxicity weights to estimate the relative hazard for each pollutant.
S.S. Gallagher et al. / Chemosphere 120 (2015) 697–705 699
3.2. Lesson 2: importance of vulnerability
Risk assessors have long recognized the importance of consider-ing vulnerable populations in assessments of environmental chem-icals; current approaches address some aspects of vulnerability,e.g., an uncertainty factor for sensitive human populations whenderiving reference doses (US EPA, 2002c). However, gaps remain
in identifying and accurately quantifying risks in vulnerable popu-lations; both for conventional, single chemical risk assessmentsand CRAs (Sexton and Hattis, 2007).
Vulnerability includes predisposition to risk of harm from expo-sure to stressors due to biological susceptibility, or differentialexposure, preparedness, or ability to recover (cited in US EPA,2003b; Kasperson, Personal communication). Vulnerability implies
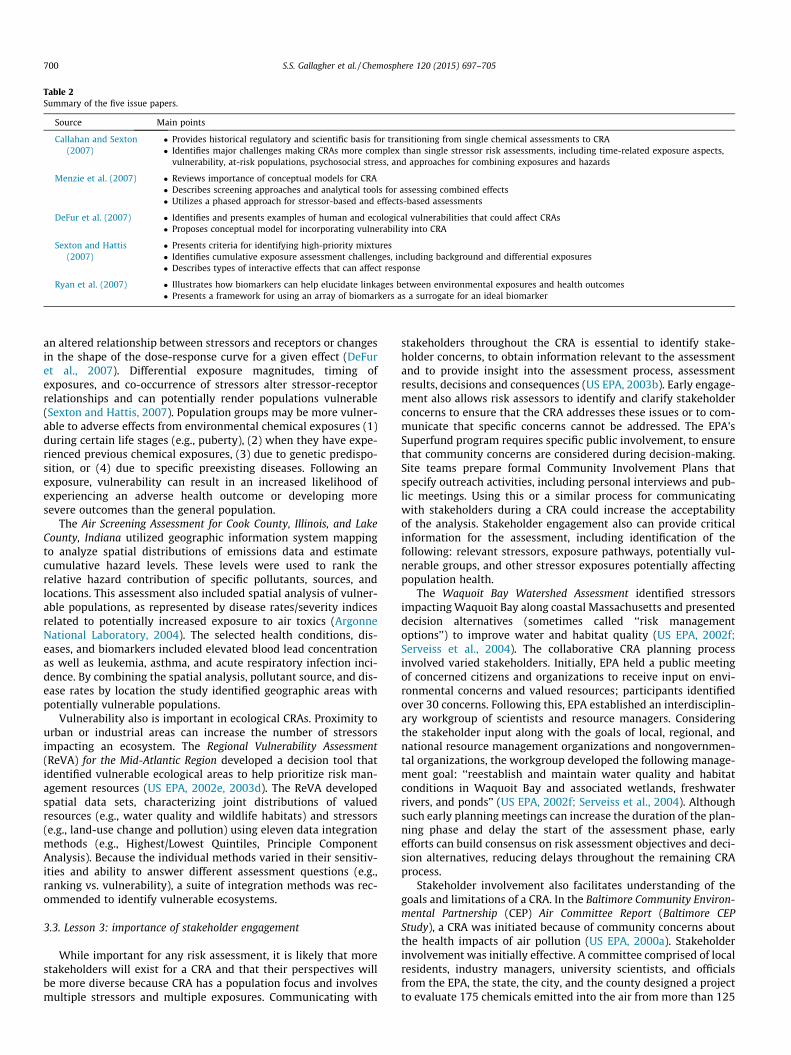
Table 2Summary of the five issue papers.
Source Main points
Callahan and Sexton(2007)
� Provides historical regulatory and scientific basis for transitioning from single chemical assessments to CRA� Identifies major challenges making CRAs more complex than single stressor risk assessments, including time-related exposure aspects,
vulnerability, at-risk populations, psychosocial stress, and approaches for combining exposures and hazards
Menzie et al. (2007) � Reviews importance of conceptual models for CRA� Describes screening approaches and analytical tools for assessing combined effects� Utilizes a phased approach for stressor-based and effects-based assessments
DeFur et al. (2007) � Identifies and presents examples of human and ecological vulnerabilities that could affect CRAs� Proposes conceptual model for incorporating vulnerability into CRA
Sexton and Hattis(2007)
� Presents criteria for identifying high-priority mixtures� Identifies cumulative exposure assessment challenges, including background and differential exposures� Describes types of interactive effects that can affect response
Ryan et al. (2007) � Illustrates how biomarkers can help elucidate linkages between environmental exposures and health outcomes� Presents a framework for using an array of biomarkers as a surrogate for an ideal biomarker
700 S.S. Gallagher et al. / Chemosphere 120 (2015) 697–705
an altered relationship between stressors and receptors or changesin the shape of the dose-response curve for a given effect (DeFuret al., 2007). Differential exposure magnitudes, timing ofexposures, and co-occurrence of stressors alter stressor-receptorrelationships and can potentially render populations vulnerable(Sexton and Hattis, 2007). Population groups may be more vulner-able to adverse effects from environmental chemical exposures (1)during certain life stages (e.g., puberty), (2) when they have expe-rienced previous chemical exposures, (3) due to genetic predispo-sition, or (4) due to specific preexisting diseases. Following anexposure, vulnerability can result in an increased likelihood ofexperiencing an adverse health outcome or developing moresevere outcomes than the general population.
The Air Screening Assessment for Cook County, Illinois, and LakeCounty, Indiana utilized geographic information system mappingto analyze spatial distributions of emissions data and estimatecumulative hazard levels. These levels were used to rank therelative hazard contribution of specific pollutants, sources, andlocations. This assessment also included spatial analysis of vulner-able populations, as represented by disease rates/severity indicesrelated to potentially increased exposure to air toxics (ArgonneNational Laboratory, 2004). The selected health conditions, dis-eases, and biomarkers included elevated blood lead concentrationas well as leukemia, asthma, and acute respiratory infection inci-dence. By combining the spatial analysis, pollutant source, and dis-ease rates by location the study identified geographic areas withpotentially vulnerable populations.
Vulnerability also is important in ecological CRAs. Proximity tourban or industrial areas can increase the number of stressorsimpacting an ecosystem. The Regional Vulnerability Assessment(ReVA) for the Mid-Atlantic Region developed a decision tool thatidentified vulnerable ecological areas to help prioritize risk man-agement resources (US EPA, 2002e, 2003d). The ReVA developedspatial data sets, characterizing joint distributions of valuedresources (e.g., water quality and wildlife habitats) and stressors(e.g., land-use change and pollution) using eleven data integrationmethods (e.g., Highest/Lowest Quintiles, Principle ComponentAnalysis). Because the individual methods varied in their sensitiv-ities and ability to answer different assessment questions (e.g.,ranking vs. vulnerability), a suite of integration methods was rec-ommended to identify vulnerable ecosystems.
3.3. Lesson 3: importance of stakeholder engagement
While important for any risk assessment, it is likely that morestakeholders will exist for a CRA and that their perspectives willbe more diverse because CRA has a population focus and involvesmultiple stressors and multiple exposures. Communicating with
stakeholders throughout the CRA is essential to identify stake-holder concerns, to obtain information relevant to the assessmentand to provide insight into the assessment process, assessmentresults, decisions and consequences (US EPA, 2003b). Early engage-ment also allows risk assessors to identify and clarify stakeholderconcerns to ensure that the CRA addresses these issues or to com-municate that specific concerns cannot be addressed. The EPA’sSuperfund program requires specific public involvement, to ensurethat community concerns are considered during decision-making.Site teams prepare formal Community Involvement Plans thatspecify outreach activities, including personal interviews and pub-lic meetings. Using this or a similar process for communicatingwith stakeholders during a CRA could increase the acceptabilityof the analysis. Stakeholder engagement also can provide criticalinformation for the assessment, including identification of thefollowing: relevant stressors, exposure pathways, potentially vul-nerable groups, and other stressor exposures potentially affectingpopulation health.
The Waquoit Bay Watershed Assessment identified stressorsimpacting Waquoit Bay along coastal Massachusetts and presenteddecision alternatives (sometimes called ‘‘risk managementoptions’’) to improve water and habitat quality (US EPA, 2002f;Serveiss et al., 2004). The collaborative CRA planning processinvolved varied stakeholders. Initially, EPA held a public meetingof concerned citizens and organizations to receive input on envi-ronmental concerns and valued resources; participants identifiedover 30 concerns. Following this, EPA established an interdisciplin-ary workgroup of scientists and resource managers. Consideringthe stakeholder input along with the goals of local, regional, andnational resource management organizations and nongovernmen-tal organizations, the workgroup developed the following manage-ment goal: ‘‘reestablish and maintain water quality and habitatconditions in Waquoit Bay and associated wetlands, freshwaterrivers, and ponds’’ (US EPA, 2002f; Serveiss et al., 2004). Althoughsuch early planning meetings can increase the duration of the plan-ning phase and delay the start of the assessment phase, earlyefforts can build consensus on risk assessment objectives and deci-sion alternatives, reducing delays throughout the remaining CRAprocess.
Stakeholder involvement also facilitates understanding of thegoals and limitations of a CRA. In the Baltimore Community Environ-mental Partnership (CEP) Air Committee Report (Baltimore CEPStudy), a CRA was initiated because of community concerns aboutthe health impacts of air pollution (US EPA, 2000a). Stakeholderinvolvement was initially effective. A committee comprised of localresidents, industry managers, university scientists, and officialsfrom the EPA, the state, the city, and the county designed a projectto evaluate 175 chemicals emitted into the air from more than 125

S.S. Gallagher et al. / Chemosphere 120 (2015) 697–705 701
facilities. Some community members expected the study to con-firm their presupposition that local air quality posed unacceptablehealth risks (US EPA, 2000a). Ultimately, resource limitations anddata gaps precluded the researchers’ ability to link the air qualitymeasures to disease incidence. Because these limitations wereineffectively communicated, some stakeholders were disappointedwhen the study results could not fully address their concerns,highlighting the importance of properly communicating the CRAscope and limits throughout the assessment process.
Stakeholders can help risk assessors understand how culturalpractices and activities may affect CRA. For example, the culturalpractices of some Native American tribes can lead to exposuresthat differ markedly from the general population (e.g., diets includ-ing significant quantities of locally caught fish). Understandingthese practices can increase the accuracy of exposure and risk esti-mates (Callahan and Sexton, 2007).
3.4. Lesson 4: the value of a tiered approach
While ‘‘tiering’’ approaches are useful in many risk assessments,they are particularly valuable in CRAs, as they can focus the CRA’sscope and prioritize stressors that may require further data collec-tion or analysis (Menzie et al., 2007). In CRAs, tiering facilitates theevaluation of multiple stressor exposures, by allowing stressors oflimited public health concern to be screened out, focusing theresources available on stressors of most concern. Decisions toinclude or exclude specific stressors must be presented logicallyand transparently. A concern for screening approaches is that astressor, group of stressors, or sources may be inappropriatelyscreened out (i.e., false negative results). When tiered screeningapproaches are employed, the criteria must be sufficiently
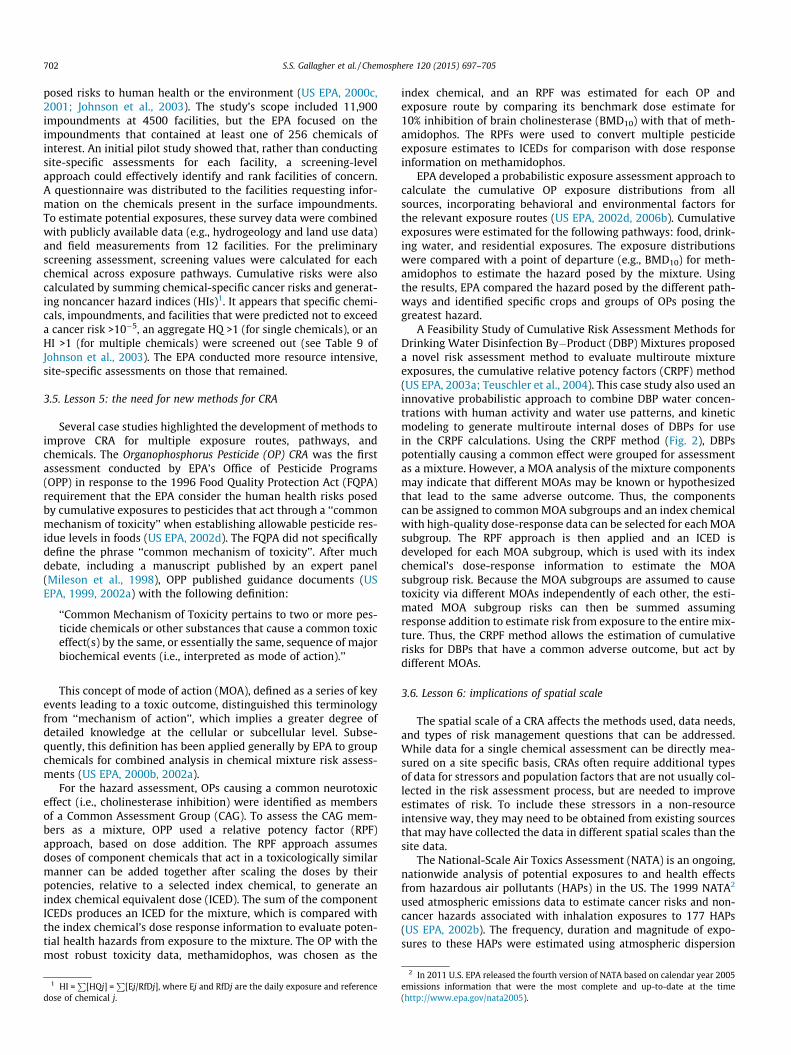
Include Chemical in the Analysis
175 Chemicals Released to Outdoor Air
Tier 1: Calculate cancer risk and noncancer Hazard Quotient (HQ) for each individual chemical using conservative exposure modeling.
Tier 2: Calculate cancer risk and noncancer HQ for each individual chemical using an air dispersion model to estimate exposure.
Tier 3: Calculate cancer risk and noncancer HQ for each individual chemical using emissions data from the facilities to estimateexposure.
Fig. 1. Flow diagram of tiered approach for Baltimore Community Environmental Partneris an estimate of an exposure that is likely to be without an appreciable risk of deleteriouscancer risk per incremental unit of the Exposure.
conservative to reduce the likelihood of such an event. To preventstressors from being screened out inappropriately, the initial tiersshould utilize conservative benchmarks that are below the thresh-olds at which individual health effects might occur (Menzie et al.,2007). This strategy will enable the risk assessor to retain stressorsthat may have screened out on their own, but may need to be eval-uated for potential joint toxicity in a mixture. Additional tiers per-form in depth analyses on a small set of stressors. A strength ofusing tiered approaches is that the level of effort can be tailoredto the purpose of the specific tier in the assessment with increasingfocus on specific stressors, groups of stressors, or other concerns(e.g., vulnerable population or lifestage) (Meek et al., 2011).
The Baltimore CEP Study focused available resources by conduct-ing a three-tiered, risk-based screening approach (Fig. 1) to evalu-ate the chemicals released to the atmosphere from multiplesources (US EPA, 2000a). At each tier, the cancer risk and noncancerHazard Quotient (HQ) were estimated for each individual chemical.The accuracy of the exposure estimates increased at each tier.Chemicals with either cancer risk or HQ estimates above screeningvalues were evaluated further in the next tier. Tier 1 used conser-vative exposure modeling assumptions and identified 17% of theoriginal chemicals for further evaluation. Tier 2 utilized atmo-spheric dispersion modeling to improve the accuracy of exposureestimates; the results indicated that 24% of the remaining chemi-cals (4% of the original chemicals) required further analysis. Tier3 utilized monitoring data from each facility; 2% of the chemicalsinitially considered were identified as potential chemicals ofconcern.
The Industrial Surface Impoundment Risk Assessment employed atiered approach to assess whether management of wastewatertreatment plant discharges and sludges in surface impoundments
Exclude Chemical from the Analysis
No (29)
Is the cancer risk < 10-6
And the HQ<1? Yes
(146)
No (7)
Is the cancer risk < 10-6
And the HQ<1? Yes
(22)
Is the cancer risk < 10-6
and theHQ<1? Yes
(3)
No (4)
ship (CEP) case study. KEY: HQ = (Exposure/Reference Value), where Reference Valueeffects during a lifetime; Cancer risk = (Exposure � Unit Risk), where Unit Risk is the
702 S.S. Gallagher et al. / Chemosphere 120 (2015) 697–705
posed risks to human health or the environment (US EPA, 2000c,2001; Johnson et al., 2003). The study’s scope included 11,900impoundments at 4500 facilities, but the EPA focused on theimpoundments that contained at least one of 256 chemicals ofinterest. An initial pilot study showed that, rather than conductingsite-specific assessments for each facility, a screening-levelapproach could effectively identify and rank facilities of concern.A questionnaire was distributed to the facilities requesting infor-mation on the chemicals present in the surface impoundments.To estimate potential exposures, these survey data were combinedwith publicly available data (e.g., hydrogeology and land use data)and field measurements from 12 facilities. For the preliminaryscreening assessment, screening values were calculated for eachchemical across exposure pathways. Cumulative risks were alsocalculated by summing chemical-specific cancer risks and generat-ing noncancer hazard indices (HIs)1. It appears that specific chemi-cals, impoundments, and facilities that were predicted not to exceeda cancer risk >10�5, an aggregate HQ >1 (for single chemicals), or anHI >1 (for multiple chemicals) were screened out (see Table 9 ofJohnson et al., 2003). The EPA conducted more resource intensive,site-specific assessments on those that remained.
3.5. Lesson 5: the need for new methods for CRA
Several case studies highlighted the development of methods toimprove CRA for multiple exposure routes, pathways, andchemicals. The Organophosphorus Pesticide (OP) CRA was the firstassessment conducted by EPA’s Office of Pesticide Programs(OPP) in response to the 1996 Food Quality Protection Act (FQPA)requirement that the EPA consider the human health risks posedby cumulative exposures to pesticides that act through a ‘‘commonmechanism of toxicity’’ when establishing allowable pesticide res-idue levels in foods (US EPA, 2002d). The FQPA did not specificallydefine the phrase ‘‘common mechanism of toxicity’’. After muchdebate, including a manuscript published by an expert panel(Mileson et al., 1998), OPP published guidance documents (USEPA, 1999, 2002a) with the following definition:
‘‘Common Mechanism of Toxicity pertains to two or more pes-ticide chemicals or other substances that cause a common toxiceffect(s) by the same, or essentially the same, sequence of majorbiochemical events (i.e., interpreted as mode of action).’’
This concept of mode of action (MOA), defined as a series of keyevents leading to a toxic outcome, distinguished this terminologyfrom ‘‘mechanism of action’’, which implies a greater degree ofdetailed knowledge at the cellular or subcellular level. Subse-quently, this definition has been applied generally by EPA to groupchemicals for combined analysis in chemical mixture risk assess-ments (US EPA, 2000b, 2002a).
For the hazard assessment, OPs causing a common neurotoxiceffect (i.e., cholinesterase inhibition) were identified as membersof a Common Assessment Group (CAG). To assess the CAG mem-bers as a mixture, OPP used a relative potency factor (RPF)approach, based on dose addition. The RPF approach assumesdoses of component chemicals that act in a toxicologically similarmanner can be added together after scaling the doses by theirpotencies, relative to a selected index chemical, to generate anindex chemical equivalent dose (ICED). The sum of the componentICEDs produces an ICED for the mixture, which is compared withthe index chemical’s dose response information to evaluate poten-tial health hazards from exposure to the mixture. The OP with themost robust toxicity data, methamidophos, was chosen as the
1 HI =P
[HQj] =P
[Ej/RfDj], where Ej and RfDj are the daily exposure and referencedose of chemical j.
index chemical, and an RPF was estimated for each OP andexposure route by comparing its benchmark dose estimate for10% inhibition of brain cholinesterase (BMD10) with that of meth-amidophos. The RPFs were used to convert multiple pesticideexposure estimates to ICEDs for comparison with dose responseinformation on methamidophos.
EPA developed a probabilistic exposure assessment approach tocalculate the cumulative OP exposure distributions from allsources, incorporating behavioral and environmental factors forthe relevant exposure routes (US EPA, 2002d, 2006b). Cumulativeexposures were estimated for the following pathways: food, drink-ing water, and residential exposures. The exposure distributionswere compared with a point of departure (e.g., BMD10) for meth-amidophos to estimate the hazard posed by the mixture. Usingthe results, EPA compared the hazard posed by the different path-ways and identified specific crops and groups of OPs posing thegreatest hazard.
A Feasibility Study of Cumulative Risk Assessment Methods forDrinking Water Disinfection By�Product (DBP) Mixtures proposeda novel risk assessment method to evaluate multiroute mixtureexposures, the cumulative relative potency factors (CRPF) method(US EPA, 2003a; Teuschler et al., 2004). This case study also used aninnovative probabilistic approach to combine DBP water concen-trations with human activity and water use patterns, and kineticmodeling to generate multiroute internal doses of DBPs for usein the CRPF calculations. Using the CRPF method (Fig. 2), DBPspotentially causing a common effect were grouped for assessmentas a mixture. However, a MOA analysis of the mixture componentsmay indicate that different MOAs may be known or hypothesizedthat lead to the same adverse outcome. Thus, the componentscan be assigned to common MOA subgroups and an index chemicalwith high-quality dose-response data can be selected for each MOAsubgroup. The RPF approach is then applied and an ICED isdeveloped for each MOA subgroup, which is used with its indexchemical’s dose-response information to estimate the MOAsubgroup risk. Because the MOA subgroups are assumed to causetoxicity via different MOAs independently of each other, the esti-mated MOA subgroup risks can then be summed assumingresponse addition to estimate risk from exposure to the entire mix-ture. Thus, the CRPF method allows the estimation of cumulativerisks for DBPs that have a common adverse outcome, but act bydifferent MOAs.
3.6. Lesson 6: implications of spatial scale
The spatial scale of a CRA affects the methods used, data needs,and types of risk management questions that can be addressed.While data for a single chemical assessment can be directly mea-sured on a site specific basis, CRAs often require additional typesof data for stressors and population factors that are not usually col-lected in the risk assessment process, but are needed to improveestimates of risk. To include these stressors in a non-resourceintensive way, they may need to be obtained from existing sourcesthat may have collected the data in different spatial scales than thesite data.
The National-Scale Air Toxics Assessment (NATA) is an ongoing,nationwide analysis of potential exposures to and health effectsfrom hazardous air pollutants (HAPs) in the US. The 1999 NATA2
used atmospheric emissions data to estimate cancer risks and non-cancer hazards associated with inhalation exposures to 177 HAPs(US EPA, 2002b). The frequency, duration and magnitude of expo-sures to these HAPs were estimated using atmospheric dispersion
2 In 2011 U.S. EPA released the fourth version of NATA based on calendar year 2005emissions information that were the most complete and up-to-date at the time(http://www.epa.gov/nata2005).

Division of Group into MOA Subgroups A,B
Subgroup A Riskof Adverse Effect Using RPFs (RA)
MOA Analysis of Chemical Mixture Group Finds Mixed MOAs for an Adverse Effect
Event: Mechanism of Ac�on
Key Event: Mode of Ac�on
Chemical Mixture Group Total Risk of Adverse Effect
Using CRPF Approach
Subgroup B Riskof Adverse Effect Using RPFs (RB)
Dose
Add
i�on
Bas
ed o
nCo
mm
on M
OA
With
in S
ubgr
oup
B
Response Addi�on Based on Independent MOAs
Across SubgroupsSum Subgroup Risks (RA + RB)
Adverse EffectAdverse EffectDose
Add
i�on
Bas
ed o
nCo
mm
on M
OA
With
in S
ubgr
oup
A
Fig. 2. Schematic of cumulative relative potency factor (CRPF) approach for chemical mixture group with mixed modes of action (MOAs).
S.S. Gallagher et al. / Chemosphere 120 (2015) 697–705 703
models and human activity pattern data. Cancer risks from expo-sures to mixtures of HAPs were estimated assuming response addi-tion, and the noncancer hazards for respiratory effects and forneurological effects were estimated using the hazard index method(US EPA, 2000b). The results enabled EPA to identify specific HAPsposing the greatest risk and determine the relative impact of differ-ent emission sources affecting health, including locations contribut-ing significantly to population health risks. While this national-scaleassessment evaluated contaminants of potential concern across largegeographical areas (e.g., county, state), the exposure and riskestimates at finer spatial scales (e.g., neighborhood level) were lesscertain, potentially requiring different models and emissions dataconsistent with the spatial scale of interest.
The Regional Air Impact Modeling Initiative (RAIMI)—Initial Phase(herein called RAIMI Pilot) was implemented to develop a tool forassessing cumulative health risks from exposures to chemicalsemitted by multiple atmospheric emission sources (US EPA,2003c). The study goal was to develop a standardized approachfor assessing and prioritizing inhalation exposures based on airemissions data, using facility-specific data obtained from federaland state regulatory emissions databases, regulatory files, and per-mit applications. Compared to NATA, the methods developed forthe RAIMI Pilot evaluate more refined spatial levels, allowing theestimation of risks at the neighborhood level. This finer resolutionenables risk assessors to consider cumulative risks or impacts onlocal communities when evaluating permitting decisions or facilitysiting proposals. In addition, RAIMI links estimated risks to specificsources, pathways, and contaminants, allowing assessors to
identify sources potentially causing elevated health risks (i.e.,‘‘hot spots’’). Because of its local spatial scale focus, RAIMI can pri-oritize interventions reducing community exposures and risks.
4. Discussion
Each of these six lessons learned are not necessarily newconsiderations for risk assessment. Clearly, evaluating multiplestressors and vulnerabilities are complicating factors that set CRAapart from conventional single chemical risk assessment. Thefollowing key contributions from the efforts reviewed here areimportant for the continued development of CRA:
� Using an iterative process (e.g., continued reexamination ofassessment goals) promotes efficient use of resources andensures that the CRA results address the primary concerns.� Consideration of population vulnerabilities could improve esti-
mation of population risks and ensures that a selected risk man-agement option is adequately protective.� Early and regular communication with stakeholders enhances
process transparency and informs stakeholders of changes inthe analysis as well as the logic underlying the selection of a riskmanagement option.� A tiered approach focuses resources on the most important fac-
tors contributing to risk. The criteria used in developing tiersneed to be balanced, yet sufficiently conservative so that impor-tant factors are not inappropriately screened out.

704 S.S. Gallagher et al. / Chemosphere 120 (2015) 697–705
� Continued development of novel risk assessment methods isneeded for evaluating multiple stressors encountered in CRAs,including approaches for assessing combined chemical andnonchemical stressors and evaluating dose-response relation-ships in vulnerable populations.� The spatial scale of a CRA affects data needs, model choice, and
the utility of the information for comparing risk managementoptions. Challenges for CRAs include combining data from dis-parate sources, such as separate national databases, and usinganalyses of national-scale data to evaluate risks on a commu-nity scale.
While EPA utilizes aspects of CRA on a limited basis, additionalresearch and case studies could greatly increase the applicationrates of CRA. CRA could benefit from the development of additionalmethods for evaluating risks or hazards posed by combinations ofchemicals that act via different pathways as well as methods topredict risks from combined exposures to chemical and nonchem-ical stressors. The ‘‘omics’’ technologies, including genomics, pro-teomics, and metabolomics, could potentially elucidate themolecular mechanisms of such toxicities. Patterns of changes inthe concentrations of related biomolecules can form molecular sig-natures of toxicity, which can be used to identify and group stress-ors eliciting the same response and affecting a common healthoutcome (Pleil et al., 2012). Recently, Thomas et al. used transcrip-tional changes following chemical exposure to predict pathway-based points of departure, correlating these pathways with apicalendpoints previously identified through ‘‘traditional’’ animal test-ing (Thomas et al., 2012). One challenge is identifying cellularchanges that are indicative of a toxic effect because not all cellularchanges lead to an adverse effect. There also may be adaptive cel-lular responses that will require further elucidation, such as theup-regulation of genes for xenobiotic metabolism and the role ofsuch responses in altering the risks posed by toxic chemicals. Oncethese technologies have been developed, it will be important toevaluate the new data streams in case studies to understand howthey can be used in combination with traditional toxicity informa-tion to support the grouping of chemicals for CRA. In the future,they also may be useful in dose-response assessment as suggestedby Thomas et al.
Research into biomarkers, including xenobiotics, metabolites, orDNA- and protein-adducts may fill some gaps regarding exposureand risk in vulnerable populations. Exposure biomarkers haveidentified populations experiencing differential chemical expo-sures (Schulte and Hauser, 2012). Some genetic factors anddiseases associated with vulnerable populations also exhibitbiomarkers (Ryan et al., 2007). Multiple researchers have usedgenetic epidemiology to quantify population vulnerability, linkingadverse health outcomes to measures of genetic variation, such assingle-nucleotide polymorphisms (Cantor et al., 2010; McHaleet al., 2010).
Another major challenge is that CRA requires integration acrossa number of different scientific disciplines, each having their ownterminology. In some cases, different terms are used for the sameconcept. One important concept for CRA that is often representedinterchangeably by multiple words is vulnerability (e.g., suscepti-bility and sensitivity). Alternatively, the same word can representdifferent concepts. At the EPA, there is the added complexity thatdifferent programs may use the same term with slightly differentmeanings depending on the regulatory context. This communica-tion disconnect hinders cross-fertilization between disciplinesand EPA programs. Communication issues can also affect the abil-ity of the field to share and integrate data. A similar challenge hadto be addressed the way the biomedical fields represented genes.In 1998, the Gene Ontology Consortium was formed to develop acommon terminology for annotating genes, gene products, and
sequences. A similar set of standardized rules and requirementsfor data collection and reporting is essential for CRA; enabling sci-entists to develop databases, tools, and models capable of integrat-ing data collected from disparate resources.
While this article focuses on the work conducted by EPA, impor-tant research on the science underlying and application of CRA isbeing conducted outside of the Agency. Much of this work hasfocused on new methods for developing quantitative estimates ofrisk for complex assessments. The European Food Safety Authority(EFSA) assessed the utility of using a ‘‘common adverse outcome’’approach to accommodate chemicals with dissimilar modes ofaction (EFSA, 2013). In addition, workshops have been held to eval-uate how emerging data streams can be used to characterizehuman variability to address some aspects of population vulnera-bility (Zeise et al., 2013) as well as on new approaches for incorpo-rating nonchemical stressors into CRA, including a systems-basedapproach for predicting the interactions between physical andchemical stressors (Rider et al., 2014).
5. Conclusion
Because CRAs evaluate risks posed by exposures to multiplestressors, possibly including different types of stressors, andconsider vulnerability, this emerging area of risk analysis is morecomplex than traditional single chemical environmental riskassessments. Our examination shows that EPA programs andregions are pursuing an increased understanding of CRA throughtheir unique regulatory mandates. The lessons learned from thecase studies and issue papers highlight important considerationsas EPA and others attempt to make scientific advances in this field.
Acknowledgements
Sarah Gallagher was supported by a Science and TechnologyPolicy Fellowship from the American Association for the Advance-ment of Science – United States.
References
Argonne National Laboratory, 2004. Air Screening Assessment for Cook County,Illinois, and Lake County, Indiana, Chicago, IL. ftp://public-ftp.agl.faa.gov/OMP%20PFC%2006-19-C–00-ORD/EIS%20and%20ROD%20Administrative%20Record/Disk04/03_March%202004/11_99_22253.pdf.
Browner, C., 1995. Memorandum on the EPA Risk Characterization Program andAttached Policy for Risk Characterization, 21 March 1995. U.S. EnvironmentalProtection Agency, Washington, DC.
Callahan, M.A., Sexton, K., 2007. If cumulative risk assessment is the answer, what isthe question? Environ. Health Perspect. 115, 799–806.
Cantor, K.P., Villanueva, C.M., Silverman, D.T., Figueroa, J.D., Real, F.X., Garcia-Closas,M., Malats, N., Chanock, S., Yeager, M., Tardon, A., Garcia-Closas, R., Serra, C.,Carrato, A., Castano-Vinyals, G., Samanic, C., Rothman, N., Kogevinas, M., 2010.Polymorphisms in GSTT1, GSTZ1, and CYP2E1, disinfection by-products, andrisk of bladder cancer in Spain. Environ. Health Perspect. 118, 1545–1550.
DeFur, P.L., Evans, G.W., Cohen Hubal, E.A., Kyle, A.D., Kyle, A.D., Morello-Frosch, R.A,Williams, D.R., 2007. Vulnerability as a function of individual and groupresources in cumulative risk assessment. Environ. Health Perspect. 115, 817–824.
Diamond, J.M., Bressler, D.W., Serveiss, V.B., 2002. Assessing relationships betweenhuman land uses and the decline of native mussels, fish, andmacroinvertebrates in the Clinch and Powell river watershed. USA Environ.Toxicol. Chem. 21, 1147–1155.
EFSA (European Food Safety Authority), 2013. Scientific opinion on the relevance ofdissimilar mode of action and its appropriate application for cumulative riskassessment of pesticides residues in food. EFSA J. 11, 3472.
Johnson, B., Balserak, P., Beaulieu, S., Cuthbertson, B., Stewart, R., Truesdale, R.,Whitmore, R., Young, J., 2003. Industrial surface impoundments: environmentalsettings, release and exposure potential and risk characterization. Sci. TotalEnviron. 317, 1–22.
McHale, C.M., Zhang, L., Hubbard, A.E., Smith, M.T., 2010. Toxicogenomic profiling ofchemically exposed humans in risk assessment. Mutat. Res. 705, 172–183.
Meek, M.E., Boobis, A.R., Crofton, K.M., Heinemeyer, G., Raaij, M.V., Vickers, C., 2011.Risk assessment of combined exposure to multiple chemicals: a WHO/IPCSframework. Regul. Toxicol. Pharmacol. 60, S1–S14.

S.S. Gallagher et al. / Chemosphere 120 (2015) 697–705 705
Menzie, C.A., MacDonell, M.M., Mumtaz, M., 2007. A phased approach for assessingcombined effects from multiple stressors. Environ. Health Perspect. 115, 807–816.
Mileson, B.E., Chambers, J.E., Chen, W.L., Dettbarn, W., Ehrich, M., Eldefrawi, A.T.,Gaylor, D.W., Hamernik, K., Hodgson, E., Karczmar, A.G., Padila, S., Pope, C.N.,Richardson, R.J., Saunders, D.R., Sheets, L.P., Sultatos, L.G., Wallace, K.B., 1998.Common mechanism of toxicity: a case study of organophosphorus pesticides.Toxicol. Sci. 41, 8–20.
National Research Council, 2009. Science and Decisions: Advancing RiskAssessment. The National Academies Press, Washington, DC.
Pleil, J.D., Williams, M.A., Sobus, J.R., 2012. Chemical Safety for Sustainability (CSS):human in vivo biomonitoring data for complementing results from in vitrotoxicology-A commentary. Toxicol. Lett. 215, 201–207.
Rider, C.V., Boekelheide, K., Catlin, N., Gordon, C.J., Morata, T., Selgrade, M.K., Sexton,K., Simmons, J.E., 2014. Cumulative risk: toxicity and interactions of physicaland chemical stressors. Toxicol. Sci. 137, 3–11.
Ryan, P.B., Burke, T.A., Cohen Hubal, E.A., Cura, J.J., McKone, T.E., 2007. Usingbiomarkers to inform cumulative risk assessment. Environ. Health Perspect.115, 833–840.
Schulte, P.A., Hauser, J.E., 2012. The use of biomarkers in occupational healthresearch, practice, and policy. Toxicol. Lett. 213, 91–99.
Serveiss, V.B., Bowen, J.L., Dow, D., Valiela, I., 2004. Using ecological risk assessmentto identify the major anthropogenic stressor in the Waquoit Bay Watershed,Cape Cod. Massachusetts. Environ. Manage. 33, 730–740.
Sexton, K., Hattis, D., 2007. Assessing cumulative health risks from exposure toenvironmental mixtures-three fundamental questions. Environ. HealthPerspect. 115, 825–832.
Teuschler, L.K., Rice, G.E., Wilkes, C.R., Lipscomb, J.C., Power, F.W., 2004. A feasibilitystudy of cumulative risk assessment methods for drinking water disinfectionby-product mixtures. J. Toxicol. Environ. Health A 67, 755–777.
Thomas, R.S., Clewell 3rd, H.J., Allen, B.C., Yang, L., Healy, E., Andersen, M.E., 2012.Integrating pathway-based transcriptomic data into quantitative chemical riskassessment: a five chemical case study. Mutat. Res. 746, 135–143.
US EPA, 1999. Proposed Guidance on Cumulative Risk Assessment of PesticideChemicals that Have a Common Mechanism of Toxicity. Office of PesticidePrograms, Washington, DC.
US EPA, 2000a. Baltimore Community Environmental Partnership Air CommitteeTechnical Report. Office of Pollution Prevention and Toxics, Washington, DC.EPA/744/R-00/005. <http://www.epa.gov/oppt/cahp/pubs/baltimore.pdf>.
US EPA, 2000b. Supplementary Guidance for Conducting Health Risk Assessment ofChemical Mixtures. Risk Assessment Forum, Washington, DC. <http://www.epa.gov/raf/publications/pdfs/CHEM_MIX_08_2001.PDF>.
US EPA, 2000c. Surface Impoundment Study. Technical Plan for Human Health andEcological Risk Assessment. Office of Water, Washington, DC. <http://www.epa.gov/osw/hazard/tsd/ldr/icr/impdfs/sispeer.pdf>.
US EPA, 2001. Industrial Surface Impoundments in the United States. Office of SolidWaste and Emergency Response, Washington, DC. EPA/530/R-1/005. <http://www.epa.gov/osw/hazard/tsd/ldr/icr/impdfs/sisreprt.pdf>.
US EPA, 2002a. Clinch and Powell Valley Watershed Ecological Risk Assessment.National Center for Environmental Assessment, Washington, DC. <http://ofmpub.epa.gov/eims/eimscomm.getfile?p_download_id=36338>.
US EPA, 2002b. National-Scale Air Toxics Assessment for 1996: EstimatedEmissions, Concentrations and Risk. Office of Air Quality Planning andStandards, Washington, DC. <http://www.epa.gov/ttn/atw/nata/>.
US EPA, 2002c. A Review of the Reference Dose and Reference ConcentrationProcesses. Risk Assessment Forum, Washington, DC. <http://www.epa.gov/raf/publications/pdfs/rfd-final.pdf>.
US EPA, 2002d. Revised Organophosphorus Pesticide Cumulative Risk Assessment.Office of Pesticides Programs, Washington, DC. <http://www.epa.gov/oppsrrd1/cumulative/rra-op/>.
US EPA, 2002e. The US EPA’s Regional Vulnerability Assessment Program: AResearch Strategy for 2001�2006. Office of Research and Development,Washington, DC. <http://www.epa.gov/reva/docs/reva-strategy.pdf>.
US EPA, 2002f. Waquoit Bay Watershed Ecological Risk Assessment: The effect ofland-derived nitrogen loads on estuarine eutrophication. National Center forEnvironmental Assessment, Washington, DC. <http://ofmpub.epa.gov/eims/eimscomm.getfile?p_download_id=36757>.
US EPA, 2003a. The Feasibility of Performing Cumulative Risk Assessments forMixtures of Disinfection By-products in Drinking Water. National Center forEnvironmental Assessment, Cincinnati, OH. EPA/600/R-03/051.
US EPA, 2003b. Framework for Cumulative Risk Assessment. Risk AssessmentForum, Washington, DC. <http://www.epa.gov/raf/publications/pdfs/frmwrk_cum_risk_assmnt.pdf>.
US EPA, 2003c. Regional Air Impact Modeling Initiative: Study Pilot—Initial Phase.Office of Solid Waste and Emergency Response, Washington, DC. EPA/906/R-01/001. <http://www.epa.gov/region6/6en/raimi/title.pdf>.
US EPA, 2003d. Regional Vulnerability Assessment for the Mid-Atlantic Region:Evaluation of Integration Methods and Assessments Results. Office of Researchand Development, Washington, D.C. EPA/600/R-03/082. http://www.epa.gov/reva/docs/vulnerable.pdf>.
US EPA, 2006a. National-Scale Air Toxics Assessment for 1999: EstimatedEmissions, Concentrations and Risk. Office of Air Quality Planning andStandards, Washington, DC. <http://www.epa.gov/ttn/atw/nata1999/>.
US EPA, 2006b. Organophosphorus Cumulative Risk Assessment-2006 Update.Office of Pesticides Programs, Washington, DC. <http://www.epa.gov/oppsrrd1/cumulative/2006-op/op_cra_main.pdf>.
Zeise, L., Bois, F.Y., Chiu, W.A., Hattis, D., Rusyn, I., Guyton, K.Z., 2013. Addressinghuman variability in next-generation human health risk assessments ofenvironmental chemicals. Environ. Health Perspect. 121, 23–31.