
Reduced ceramide synthase 2 activity causes progressive myoclonic epilepsy
Upload
independentCategory
view
0download
0
LETTERdoi:10.1038/nature13386
CTP synthase 1 deficiency in humans reveals itscentral role in lymphocyte proliferationEmmanuel Martin1,2, Noe Palmic1,2, Sylvia Sanquer3, Christelle Lenoir1,2, Fabian Hauck1,2, Cedric Mongellaz4, Sylvie Fabrega2,5,Patrick Nitschke2,6, Mauro Degli Esposti7,8, Jeremy Schwartzentruber9, Naomi Taylor4, Jacek Majewski9, Nada Jabado9,10,Robert F. Wynn7, Capucine Picard2,11,12, Alain Fischer1,2,13,14, Peter D. Arkwright7* & Sylvain Latour1,2,3*
Lymphocyte functions triggered by antigen recognition and co-stimulation signals are associated with a rapid and intense cell divi-sion, and hence with metabolism adaptation1. The nucleotide cytidine59 triphosphate (CTP) is a precursor required for the metabolism ofDNA, RNA and phospholipids2–4. CTP originates from two sources:a salvage pathway and a de novo synthesis pathway that depends ontwo enzymes, the CTP synthases (or synthetases) 1 and 2 (CTPS1 withCTPS2); the respective roles of these two enzymes are not known5–7.CTP synthase activity is a potentially important step for DNA syn-thesis in lymphocytes8,9. Here we report the identification of a loss-of-function homozygous mutation (rs145092287) in CTPS1 in humansthat causes a novel and life-threatening immunodeficiency, charac-terized by an impaired capacity of activated T and B cells to prolif-erate in response to antigen receptor-mediated activation. In contrast,proximal and distal T-cell receptor (TCR) signalling events and res-ponses were only weakly affected by the absence of CTPS1. ActivatedCTPS1-deficient cells had decreased levels of CTP. Normal T-cellproliferation was restored in CTPS1-deficient cells by expressing wild-type CTPS1 or by addition of exogenous CTP or its nucleoside pre-cursor, cytidine. CTPS1 expression was found to be low in resting Tcells, but rapidly upregulated following TCR activation. These resultshighlight a key and specific role of CTPS1 in the immune system byits capacity to sustain the proliferation of activated lymphocytes duringthe immune response. CTPS1 may therefore represent a therapeutictarget of immunosuppressive drugs that could specifically dampenlymphocyte activation.
We initially studied two unrelated families (family 1 and 2) originat-ing from the northwest region of England, whose four children sufferedfrom severe and recurrent Epstein–Barr virus (EBV) infection, in whomknown primary immunodeficiencies have been excluded10 (Fig. 1a andTable 1). Four additional patients (family 3 to 5) originating from thesame geographical area were identified thereafter (Methods). All patientshad early onset of severe chronic viral infections, mostly caused by herpesviruses, including EBV and varicella zooster virus (VZV) and also suf-fered from recurrent encapsulated bacterial infections, a spectrum ofinfections typical of a combined deficiency of adaptive immunity (CID)11
(Table 1 and data not shown). Two patients (P4 and P5) had EBV-drivenB-cell non-Hodgkin lymphoma. Overall, the clinical phenotype is severewith 3 patients having died. Six of 8 patients have undergone haema-topoietic stem cell transplantation. Of note, none of the patients hadextra-haematopoietic manifestations (Table 1).
Immunological investigations showed that most of patients had vari-able lymphopenia which was exacerbated during infection episodes with
inversed CD4:CD8 T-cell ratio, whereas other blood cell counts wereusually normal (Extended Data Table 1 and data not shown). Their immu-noglobulin levels were normal or elevated with increased IgG but lowIgG2 levels with low antibody titres to Streptococcus pneumoniae. Fur-ther analyses were performed in patient P1.2 showing naive CD41
T-cell lymphopenia, increased numbers of effector memory T cells, lownumbers of memory CD271 B cells, a complete absence of both invariantT cell populations (CD31Va241Vb111) iNKT and (CD31CD161Hi
Va7.21) MAIT cells, as well as an impaired PHA- and antigen-inducedproliferation of peripheral blood mononuclear cells (PBMCs) (ExtendedData Table 2).
To identify the gene defect underlying the immunodeficiency inthese patients, we performed whole-exome sequencing (WES) in threepatients (P1.1, P1.2 and P2.1). Intersection of the genetic variationsfound in the three patients pointed to an unique common homozygousG to C mutation in the CTPS1 gene encoding the CTP synthase 1 at posi-tion 41475832 in chromosome 1 with an assigned rsID (rs145092287)in the dbSNP database (Fig. 1b and Extended Data Fig. 1a, b). CTPS1encodes a 67-kDa protein containing a CTP synthetase domain and aglutamine amide transfer domain promoting the formation of CTP fromUTP and glutamine12. The identified mutation affects a splice donor siteat the junction of intron 17–18 and exon 18 (IVS18-1 G to C) leading tothe expression of an abnormal transcript lacking exon 18 (ExtendedData Fig. 1b, c). This splice mutation was found to be deleterious becauseCTPS1 protein expression could not be detected in lysates of EBV-transformed B cells and T-cell blasts from patients (Figs 1c and 2c andExtended Data Fig. 2). In contrast, CTPS2 was expressed normally inpatient cell lysates. In the five affected families, all patients were homo-zygous for the IVS18-1 G to C mutation and all parents and tested healthysiblings were heterozygous carriers (Fig. 1a, b and data not shown).Sequencing of a cohort of 752 healthy individuals from the northwestof England gave an estimated frequency of homozygosity of 1:560,000.This represents more than a tenfold increase compared to the frequencyestimated from available exome databases. WES data and analysis ofpolymorphic microsatellite markers in all patients revealed a commonregion of homozygosity of 1.1 Mb surrounding the IVS18-1 G to C muta-tion (Supplementary Information). All these data were indicative of afounder effect. These observations led us to conclude that the immuno-deficiency resulting from the CTPS1 mutation in these patients couldbe primarily associated with a T-cell immunodeficiency.
We next examined CTPS1 expression in normal tissues. CTPS1 mRNAexpression was comparable between the different tissues, except forT cells in which CTPS1 expression was strongly upregulated after cell
*These authors contributed equally to this work.
1LaboratoireActivationLymphocytaire etSusceptibilite a l’EBV, INSERM UMR 1163, Hopital Necker Enfants-Malades, Paris 75015, France. 2Universite Paris DescartesSorbonneParisCite, Institut Imagine,Paris 75015, France. 3Laboratoire de Biochimie Metabolomique et Proteomique, Hopital Necker Enfants-Malades, Paris 75015, France. 4Hematopoiesis and Immunotherapy, CNRS-UMR 5535, Institut deGenetique Moleculaire de Montpellier, Montpellier 34293, France. 5Plateforme Vecteurs Viraux et Transfert de Genes, IFR94, Hopital Necker Enfants-Malades, Paris 75015, France. 6Service deBioinformatique, Hopital Necker Enfants-Malades, Paris 75015, France. 7University of Manchester, Royal Manchester Children’s Hospital, Manchester M13 0WL, UK. 8Italian Institute of Technology, Genoa16163, Italy. 9McGill University and Genome Quebec Innovation Centre, Montreal H3A 0G1, Canada. 10Department of Pediatrics, McGill University Health Center Research Institute, Montreal H3H 1P3,Canada. 11Centre d’Etude des Deficits Immunitaires, Hopital Necker Enfants-Malades, AP-HP, Paris 75015, France. 12Laboratoire Genetique Humaine des Maladies Infectieuses, INSERM UMR 1163,Hopital Necker Enfants-Malades, Paris 75015, France. 13Unite d’Immunologie et Hematologie Pediatrique, Assistance Publique-Hopitaux de Paris (AP-HP), Hopital Necker Enfants-Malades, Paris 75015,France. 14College de France, Paris 75005, France.
0 0 M O N T H 2 0 1 4 | V O L 0 0 0 | N A T U R E | 1
Macmillan Publishers Limited. All rights reserved©2014
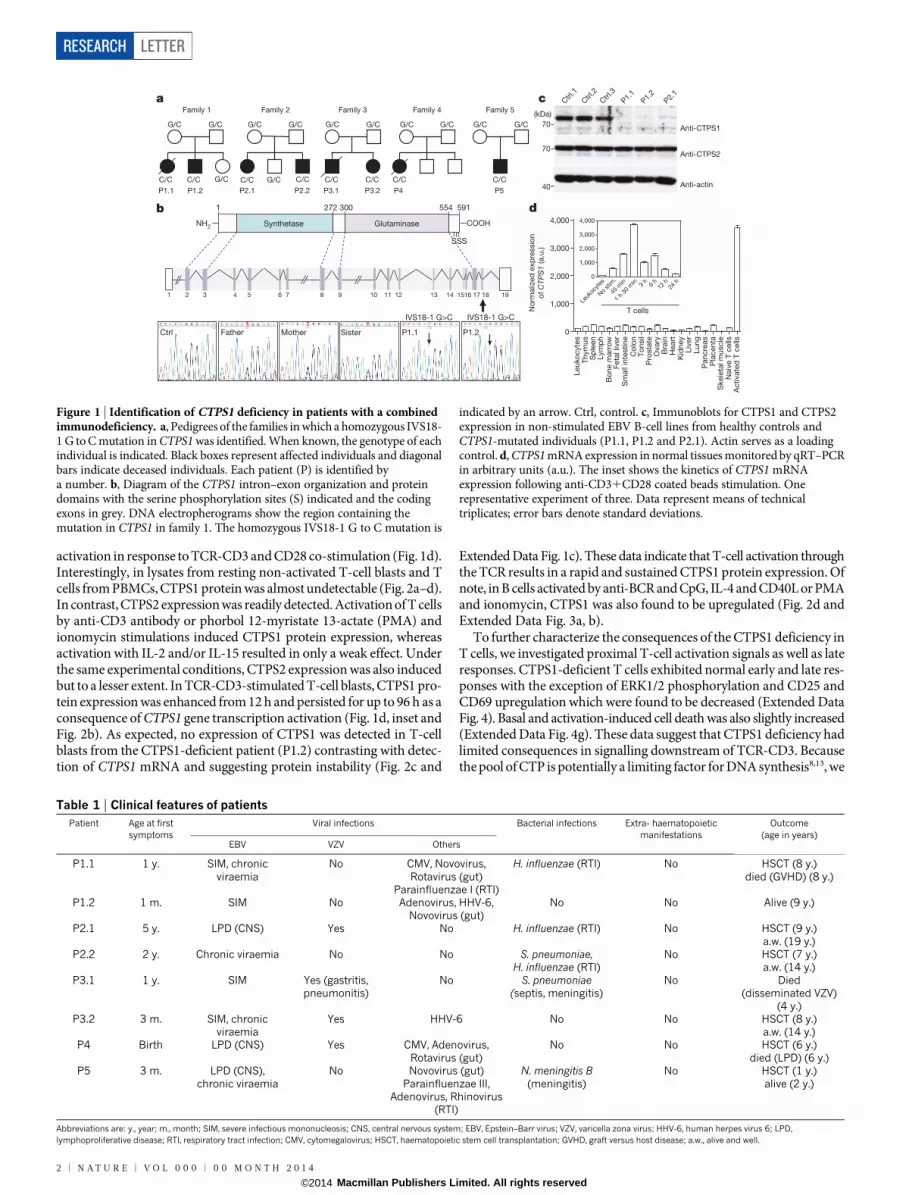
activation in response to TCR-CD3 and CD28 co-stimulation (Fig. 1d).Interestingly, in lysates from resting non-activated T-cell blasts and Tcells from PBMCs, CTPS1 protein was almost undetectable (Fig. 2a–d).In contrast, CTPS2 expression was readily detected. Activation of T cellsby anti-CD3 antibody or phorbol 12-myristate 13-actate (PMA) andionomycin stimulations induced CTPS1 protein expression, whereasactivation with IL-2 and/or IL-15 resulted in only a weak effect. Underthe same experimental conditions, CTPS2 expression was also inducedbut to a lesser extent. In TCR-CD3-stimulated T-cell blasts, CTPS1 pro-tein expression was enhanced from 12 h and persisted for up to 96 h as aconsequence of CTPS1 gene transcription activation (Fig. 1d, inset andFig. 2b). As expected, no expression of CTPS1 was detected in T-cellblasts from the CTPS1-deficient patient (P1.2) contrasting with detec-tion of CTPS1 mRNA and suggesting protein instability (Fig. 2c and
Extended Data Fig. 1c). These data indicate that T-cell activation throughthe TCR results in a rapid and sustained CTPS1 protein expression. Ofnote, in B cells activated by anti-BCR and CpG, IL-4 and CD40L or PMAand ionomycin, CTPS1 was also found to be upregulated (Fig. 2d andExtended Data Fig. 3a, b).
To further characterize the consequences of the CTPS1 deficiency inT cells, we investigated proximal T-cell activation signals as well as lateresponses. CTPS1-deficient T cells exhibited normal early and late res-ponses with the exception of ERK1/2 phosphorylation and CD25 andCD69 upregulation which were found to be decreased (Extended DataFig. 4). Basal and activation-induced cell death was also slightly increased(Extended Data Fig. 4g). These data suggest that CTPS1 deficiency hadlimited consequences in signalling downstream of TCR-CD3. Becausethe pool of CTP is potentially a limiting factor for DNA synthesis8,13, we
G/C
Family 5
G/C
C/C
Family 3
G/C G/C
C/C C/C
Family 4
G/CG/C
C/C
Family 1
C/C C/C
G/C G/C
G/C
Family 2
G/C G/C
C/C G/C C/C
SynthetaseNH2 COOH
SSS
1 2 3 4 5 6 7 8 9 10 11 12 13 14 1516 17 18 19
1 272 300 554 591
Glutaminase
Ctrl Father Mother Sister P1.1 P1.2
IVS18-1 G>C IVS18-1 G>C
0
1,000
2,000
3,000
4,000
0
1,000
2,000
3,000
4,000
Ctrl
.1
Ctrl
.2
Ctrl
.3
P1.1
P1.2
P2.1
Anti-CTPS1
Anti-CTPS2
Anti-actin
70
70
40
No
rmaliz
ed
exp
ressio
n
of CTP
S1
(a.u
.)
Leuko
cyte
sT
hym
us
Sp
leen
Lym
ph
Bo
ne m
arr
ow
Feta
l liv
er
Sm
all
inte
stine
Co
lon
To
nsil
Pro
sta
teO
vary
Bra
inH
eart
Kid
ney
Liv
er
Lung
Pancre
as
Pla
centa
Skele
tal m
uscle
Naiv
e T
cells
Activate
d T
cells
Leuk
ocyt
es
No
stim
.
45 m
in
1 h
30 m
in 3 h
6 h
12 h
24 h
T cells
a
b
c
d
P1.1 P1.2 P2.1 P2.2 P3.1 P3.2 P4 P5
(kDa)
Figure 1 | Identification of CTPS1 deficiency in patients with a combinedimmunodeficiency. a, Pedigrees of the families in which a homozygous IVS18-1 G to C mutation in CTPS1 was identified. When known, the genotype of eachindividual is indicated. Black boxes represent affected individuals and diagonalbars indicate deceased individuals. Each patient (P) is identified bya number. b, Diagram of the CTPS1 intron–exon organization and proteindomains with the serine phosphorylation sites (S) indicated and the codingexons in grey. DNA electropherograms show the region containing themutation in CTPS1 in family 1. The homozygous IVS18-1 G to C mutation is
indicated by an arrow. Ctrl, control. c, Immunoblots for CTPS1 and CTPS2expression in non-stimulated EBV B-cell lines from healthy controls andCTPS1-mutated individuals (P1.1, P1.2 and P2.1). Actin serves as a loadingcontrol. d, CTPS1 mRNA expression in normal tissues monitored by qRT–PCRin arbitrary units (a.u.). The inset shows the kinetics of CTPS1 mRNAexpression following anti-CD31CD28 coated beads stimulation. Onerepresentative experiment of three. Data represent means of technicaltriplicates; error bars denote standard deviations.
Table 1 | Clinical features of patientsPatient Age at first
symptomsViral infections Bacterial infections Extra- haematopoietic
manifestationsOutcome
(age in years)EBV VZV Others
P1.1 1 y. SIM, chronicviraemia
No CMV, Novovirus,Rotavirus (gut)
Parainfluenzae I (RTI)
H. influenzae (RTI) No HSCT (8 y.)died (GVHD) (8 y.)
P1.2 1 m. SIM No Adenovirus, HHV-6,Novovirus (gut)
No No Alive (9 y.)
P2.1 5 y. LPD (CNS) Yes No H. influenzae (RTI) No HSCT (9 y.)a.w. (19 y.)
P2.2 2 y. Chronic viraemia No No S. pneumoniae,H. influenzae (RTI)
No HSCT (7 y.)a.w. (14 y.)
P3.1 1 y. SIM Yes (gastritis,pneumonitis)
No S. pneumoniae(septis, meningitis)
No Died(disseminated VZV)
(4 y.)P3.2 3 m. SIM, chronic
viraemiaYes HHV-6 No No HSCT (8 y.)
a.w. (14 y.)P4 Birth LPD (CNS) Yes CMV, Adenovirus,
Rotavirus (gut)No No HSCT (6 y.)
died (LPD) (6 y.)P5 3 m. LPD (CNS),
chronic viraemiaNo Novovirus (gut)
Parainfluenzae III,Adenovirus, Rhinovirus
(RTI)
N. meningitis B(meningitis)
No HSCT (1 y.)alive (2 y.)
Abbreviations are: y., year; m., month; SIM, severe infectious mononucleosis; CNS, central nervous system; EBV, Epstein–Barr virus; VZV, varicella zona virus; HHV-6, human herpes virus 6; LPD,lymphoproliferative disease; RTI, respiratory tract infection; CMV, cytomegalovirus; HSCT, haematopoietic stem cell transplantation; GVHD, graft versus host disease; a.w., alive and well.
RESEARCH LETTER
2 | N A T U R E | V O L 0 0 0 | 0 0 M O N T H 2 0 1 4
Macmillan Publishers Limited. All rights reserved©2014
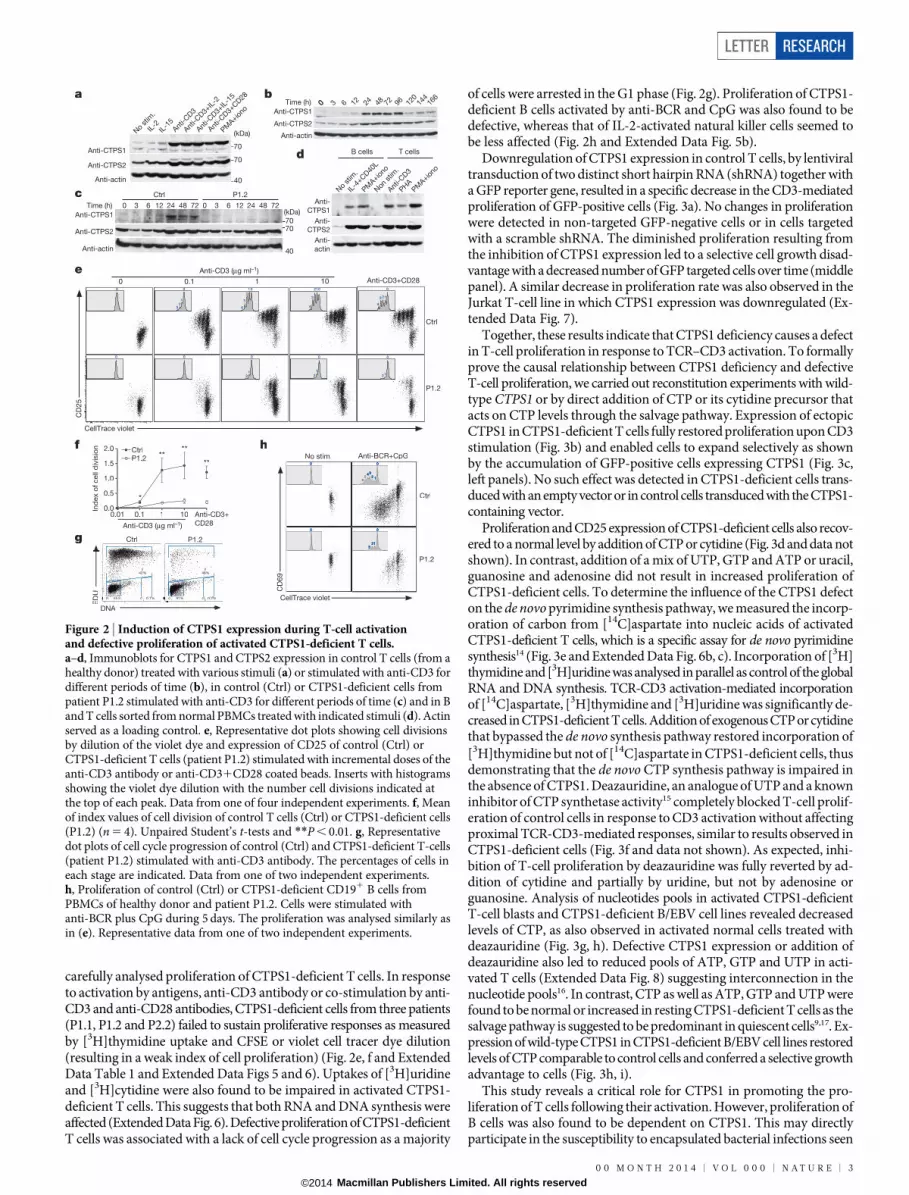
carefully analysed proliferation of CTPS1-deficient T cells. In responseto activation by antigens, anti-CD3 antibody or co-stimulation by anti-CD3 and anti-CD28 antibodies, CTPS1-deficient cells from three patients(P1.1, P1.2 and P2.2) failed to sustain proliferative responses as measuredby [3H]thymidine uptake and CFSE or violet cell tracer dye dilution(resulting in a weak index of cell proliferation) (Fig. 2e, f and ExtendedData Table 1 and Extended Data Figs 5 and 6). Uptakes of [3H]uridineand [3H]cytidine were also found to be impaired in activated CTPS1-deficient T cells. This suggests that both RNA and DNA synthesis wereaffected (Extended Data Fig. 6). Defective proliferation of CTPS1-deficientT cells was associated with a lack of cell cycle progression as a majority
of cells were arrested in the G1 phase (Fig. 2g). Proliferation of CTPS1-deficient B cells activated by anti-BCR and CpG was also found to bedefective, whereas that of IL-2-activated natural killer cells seemed tobe less affected (Fig. 2h and Extended Data Fig. 5b).
Downregulation of CTPS1 expression in control T cells, by lentiviraltransduction of two distinct short hairpin RNA (shRNA) together witha GFP reporter gene, resulted in a specific decrease in the CD3-mediatedproliferation of GFP-positive cells (Fig. 3a). No changes in proliferationwere detected in non-targeted GFP-negative cells or in cells targetedwith a scramble shRNA. The diminished proliferation resulting fromthe inhibition of CTPS1 expression led to a selective cell growth disad-vantage with a decreased number of GFP targeted cells over time (middlepanel). A similar decrease in proliferation rate was also observed in theJurkat T-cell line in which CTPS1 expression was downregulated (Ex-tended Data Fig. 7).
Together, these results indicate that CTPS1 deficiency causes a defectin T-cell proliferation in response to TCR–CD3 activation. To formallyprove the causal relationship between CTPS1 deficiency and defectiveT-cell proliferation, we carried out reconstitution experiments with wild-type CTPS1 or by direct addition of CTP or its cytidine precursor thatacts on CTP levels through the salvage pathway. Expression of ectopicCTPS1 in CTPS1-deficient T cells fully restored proliferation upon CD3stimulation (Fig. 3b) and enabled cells to expand selectively as shownby the accumulation of GFP-positive cells expressing CTPS1 (Fig. 3c,left panels). No such effect was detected in CTPS1-deficient cells trans-duced with an empty vector or in control cells transduced with the CTPS1-containing vector.
Proliferation and CD25 expression of CTPS1-deficient cells also recov-ered to a normal level by addition of CTP or cytidine (Fig. 3d and data notshown). In contrast, addition of a mix of UTP, GTP and ATP or uracil,guanosine and adenosine did not result in increased proliferation ofCTPS1-deficient cells. To determine the influence of the CTPS1 defecton the de novo pyrimidine synthesis pathway, we measured the incorp-oration of carbon from [14C]aspartate into nucleic acids of activatedCTPS1-deficient T cells, which is a specific assay for de novo pyrimidinesynthesis14 (Fig. 3e and Extended Data Fig. 6b, c). Incorporation of [3H]thymidine and [3H]uridine was analysed in parallel as control of the globalRNA and DNA synthesis. TCR-CD3 activation-mediated incorporationof [14C]aspartate, [3H]thymidine and [3H]uridine was significantly de-creased in CTPS1-deficient T cells. Addition of exogenous CTP or cytidinethat bypassed the de novo synthesis pathway restored incorporation of[3H]thymidine but not of [14C]aspartate in CTPS1-deficient cells, thusdemonstrating that the de novo CTP synthesis pathway is impaired inthe absence of CTPS1. Deazauridine, an analogue of UTP and a knowninhibitor of CTP synthetase activity15 completely blocked T-cell prolif-eration of control cells in response to CD3 activation without affectingproximal TCR-CD3-mediated responses, similar to results observed inCTPS1-deficient cells (Fig. 3f and data not shown). As expected, inhi-bition of T-cell proliferation by deazauridine was fully reverted by ad-dition of cytidine and partially by uridine, but not by adenosine orguanosine. Analysis of nucleotides pools in activated CTPS1-deficientT-cell blasts and CTPS1-deficient B/EBV cell lines revealed decreasedlevels of CTP, as also observed in activated normal cells treated withdeazauridine (Fig. 3g, h). Defective CTPS1 expression or addition ofdeazauridine also led to reduced pools of ATP, GTP and UTP in acti-vated T cells (Extended Data Fig. 8) suggesting interconnection in thenucleotide pools16. In contrast, CTP as well as ATP, GTP and UTP werefound to be normal or increased in resting CTPS1-deficient T cells as thesalvage pathway is suggested to be predominant in quiescent cells9,17. Ex-pression of wild-type CTPS1 in CTPS1-deficient B/EBV cell lines restoredlevels of CTP comparable to control cells and conferred a selective growthadvantage to cells (Fig. 3h, i).
This study reveals a critical role for CTPS1 in promoting the pro-liferation of T cells following their activation. However, proliferation ofB cells was also found to be dependent on CTPS1. This may directlyparticipate in the susceptibility to encapsulated bacterial infections seen
a
c
e
f
g
h
b
d
CellTrace violet
CellTrace violet
CD
25
0 Anti-CD3+CD280.1 1 10
Anti-CD3 (μg ml–1)
Anti-CD3 (μg ml–1)
Ctrl
P1.2
70
0 3 6 12
Ctrl P1.2
24 48 72
(kDa)
70
40
Anti-CTPS1
Time (h)
No
stim
.
No
stim
.
IL-4
+CD40
L
Non
stim
.
IL-2
IL-1
5Ant
i-CD3
Anti-C
D3
Anti-C
D3+
IL-2
Anti-C
D3+
IL-1
5
Anti-C
D3+
CD28
PMA+io
no
PMA+io
no
PMA+io
no
PHA
00 3 6 12 24 48 72 96 120
144
166
Anti-CTPS2
Anti-actin
Anti-CTPS1
Anti-CTPS2
Anti-actin
Time (h)
Anti-CTPS1
Anti-CTPS2
Anti-actin
Anti-
CTPS1
B cells T cells
Anti-
CTPS2
Anti-
actin
GGG111 GGGGGG2222%%%555555 GGG111 1%1%1%919191%%%0 10 10.1 GGG222222 2%2%2%0 20 20.2
SS42%42%
SS48%48%
DNA
ED
U
Ctrl P1.2
0.01 0.1 1 100.0
0.5
1.0
1.5
2.0
Ind
ex o
f cell
div
isio
n CtrlP1.2
Anti-CD3+
CD28
*
****
**
56
Anti-BCR+CpGNo stim.
CD
69
Ctrl
P1.2
0 3 6 12 24 48 72
7070
40
(kDa)
Figure 2 | Induction of CTPS1 expression during T-cell activationand defective proliferation of activated CTPS1-deficient T cells.a–d, Immunoblots for CTPS1 and CTPS2 expression in control T cells (from ahealthy donor) treated with various stimuli (a) or stimulated with anti-CD3 fordifferent periods of time (b), in control (Ctrl) or CTPS1-deficient cells frompatient P1.2 stimulated with anti-CD3 for different periods of time (c) and in Band T cells sorted from normal PBMCs treated with indicated stimuli (d). Actinserved as a loading control. e, Representative dot plots showing cell divisionsby dilution of the violet dye and expression of CD25 of control (Ctrl) orCTPS1-deficient T cells (patient P1.2) stimulated with incremental doses of theanti-CD3 antibody or anti-CD31CD28 coated beads. Inserts with histogramsshowing the violet dye dilution with the number cell divisions indicated atthe top of each peak. Data from one of four independent experiments. f, Meanof index values of cell division of control T cells (Ctrl) or CTPS1-deficient cells(P1.2) (n 5 4). Unpaired Student’s t-tests and **P , 0.01. g, Representativedot plots of cell cycle progression of control (Ctrl) and CTPS1-deficient T-cells(patient P1.2) stimulated with anti-CD3 antibody. The percentages of cells ineach stage are indicated. Data from one of two independent experiments.h, Proliferation of control (Ctrl) or CTPS1-deficient CD191 B cells fromPBMCs of healthy donor and patient P1.2. Cells were stimulated withanti-BCR plus CpG during 5 days. The proliferation was analysed similarly asin (e). Representative data from one of two independent experiments.
LETTER RESEARCH
0 0 M O N T H 2 0 1 4 | V O L 0 0 0 | N A T U R E | 3
Macmillan Publishers Limited. All rights reserved©2014

GFP+
GFP–
CellTrace violet
Sh scramble Sh CTPS1 no.1 Sh CTPS1 no.2
SSC
GF
P
0 1 2 3 4 5 6 7 8
0
0.2
0.4
0.6
0.8
1.0
1.2
Sh scramble
Sh CTPS1 no.1
Sh CTPS1 no.2
Time (days)
Ratio
of
GF
P+ c
ells
Sh sc
ram
ble
Sh CTP
S1 no
.1
Sh CTP
S1 no
.2
Ind
ex o
f cell
div
isio
n
0.01 0.1 1 100.0
0.5
1.0
1.5
2.0
CTPS1vector
Empty vectorGFP+
GFP–
Anti-CD3 (μg.ml–1)
GFP+
GFP–
CellTrace violet
*** ***
Ctrl
P1.2
Per
cent
of
GF
P+ c
ells
1 2 3 4 5 6 7 80
10
20
30
40
50
CTPS1 vector
Empty vector
CTPS1 vector
Empty vectorCtrl P1.2
Time (days)
P1.2
Anti-CD3+CD28No stim.
CellTrace violet
Anti-CD3+CD28+ nucleotideor nucleoside
+ CTP + UTPGTPATP
+ Cytidine + UridineGuanosineAdenosine
P1.2
Ctrl
0
2,000
4,000
6,000
8,000
Ctrl. Ctr.+CTP
P1.2
P1.2+CTP
Ctr.+cytidine P1.2+cytidine
*** *
**
0
20,000
40,000
60,000
80,000 *********
Anti-CD3+CD28No stim.
CellTrace violet
Anti-CD3+CD28 + nucleoside
+ Cytidine + 4 nucleosides+ Adenosine+ Uridine + Guanosine
+ Deazauridine
0
40
80
120
CT
P (m
g l
–1)
CtrlCtrl+Deaza.P1.2
0
40
80
120
No stim. Anti-CD3+CD28
*** ***
0
100
200
300
CtrlPat.Pat.+CTPS1
*** ***
0 5 10 15 20 25 300
25
50
75
P1.2
P1.2
P2.1
P2.1
Empty vector
CTPS1 vector
Per
cent
of
GF
P p
ositiv
e c
ells
Time (days)
a
b
e
g
c
d
f
h i
36.636.6 66.966.96666
–
Anti-CTPS1
Anti-CTPS2
Anti-actin
GFP+
GFP–
Anti-CTPS1
Anti-CTPS2
Anti-actin
Em
pty
vecto
r
CT
PS
1 v
ecto
r
Em
pty
vecto
r
CT
PS
1 v
ecto
r
P1.2Ctrl.
Ind
ex o
f cell
div
isio
n
0.0
0.5
1.0
1.5
2.0
0.01 0.1 1 10
No stim. Anti-CD3 No stim. Anti-CD3
[14C
]Asp
art
ate
(c.p
.m.)
[3H
]Thym
idin
e (c.p
.m.)
CT
P (m
g l
–1)
Figure 3 | CTPS1 is required for proliferation of T cells in response toTCR-CD3 activation. a, Proliferation of T cells in which CTPS1 expressionwas silenced with vectors containing shRNA for CTPS1 (Sh CTPS1 no. 1 or ShCTPS1 no. 2) or containing a scramble shRNA (Sh scramble) with GFP genereporter. Representative dot plots of GFP1 cells corresponding to transducedcells (left upper panels). Representative histograms of violet dye dilutionshowing the cell divisions after stimulation (left lower panels). Curves showingthe ratio of the percentage of GFP1 cells at different days to the percentageof GFP1 cells at day 0 in long-term expansions after repeated stimulation(middle panel). Immunoblots for CTPS1 and CTPS2 expression intransduced cells and non-transduced cells (2) (right panels) and actin asloading control. One representative of two experiments. b, c, Proliferation ofcontrol (Ctrl) and CTPS1-deficient T cells (patient P1.2) transduced by emptyor wild-type CTPS1-containing vector. Representative histograms of violet dyedilution (b, left panels). Means of indexes of cell division after stimulation(b, right panels) from triplicate of one representative of two experiments.Curves showing the percentage of GFP1 transduced cells after repeatedstimulation (c, left panel). Representative data from one of two independentexperiments. Immunoblots same as in (a) (c, right panels). d, Representativehistograms of violet dye dilution showing cell divisions of control (Ctrl) and
CTPS-1-deficient T cells (P1.2) incubated with the indicated nucleotides ornucleosides before stimulation. Data from one of three independentexperiments. e, Incorporation of [14C]aspartate, a tracer of the de novopyrimidine nucleotide synthesis and [3H]thymidine as a control ofproliferation/DNA synthesis. T cells were labelled during stimulation. Means ofincorporated radioactivity (c.p.m.) (n 5 6). f, Same as d except that controlT cells were incubated with deazauridine. Data from one representative of threeindependent experiments. g, Concentration of CTP in control T cells incubatedwith deazauridine (Ctrl 1 Deaza., n 5 4) or not (Ctrl, n 5 6) and CTPS1-deficient cells (P1.2, n 5 3) after stimulation with anti-CD31CD28 coatedbeads. Data from three independent experiments. h, Concentration of CTP incell extracts of EBV B-cell lines from healthy controls (Ctrl; n 5 6), andCTPS1-deficient patients transduced (Pat. 1 CTPS1, n 5 4) or not (Pat., n 5 6)with wild-type CTPS1-containing vector. P1.1 (squares), P1.2 (circles) andP2.1 (triangles). For controls, each symbol corresponds to cells of a differentdonor. Data from two independent experiments. i, Proliferation of CTPS1-deficient EBV B-cell lines (P1.2 and P2.1) transduced by empty or wild-typeCTPS1-containing vector. Curves showing the percentage of GFP1-transducedcells in culture. Unpaired t-tests and ***P , 0.001, **P , 0.01,*P , 0.05 (b, e, g, h).
RESEARCH LETTER
4 | N A T U R E | V O L 0 0 0 | 0 0 M O N T H 2 0 1 4
Macmillan Publishers Limited. All rights reserved©2014

in CTPS1-deficient patients and account for the low titres of S. pneu-moniae antibodies as it is a T-cell-independent B-cell response. The roleof CTPS1 in B cells could be different or/and less important than inT cells. Of note, CTPS1-deficient B cells preserve an intact capacity toexpand upon transformation by EBV and patients had normal immu-noglobulin levels and/or elevated IgG. Decreased expansion of naturalkiller cells and low numbers of iNKT and MAIT cells might also con-tribute to the CTPS1 immunodeficiency as these cells have been pro-posed to have a role in a broad range of immune responses includinganti-EBV immunity18–21. The finding that CTPS1-deficiency causes noother significant clinical consequences favours a redundancy with CTPS2activity in other cell lineages and tissues. Interestingly, pyrimidine poolsincluding CTP have been previously shown to be strongly expanded inPHA-stimulated T cells by de novo pathways including increased CTPSactivity8,9. The induction of CTPS1 expression in activated T cells reportedhere thus appears as the major determinant of CTP pool increase. Indeed,proliferation of CTPS1-deficient T cells was restored to normal levelsby addition of CTP. The exact mechanism(s) by which TCR signallinginduces a rapid expression and activation of CTPS1 in T cells remainsto be determined, although we showed that the ERK pathway is required,as well as tyrosine phosphorylation signals (Extended Data Fig. 3c). Itis interesting to note that T-cell differentiation does not appear to beseverely impaired by CTPS1 deficiency, suggesting that CTP pools inthymocytes may originate from the nucleoside salvage pathway and/or the CTPS2 activity8,22–24. Notably, CTPS1 activity is critical for the in-tense cell division induced by antigenic stimulation as exemplified by mas-sive proliferation and expansion of CD81 T cells during viral infections25,26.
In the absence of CTPS1, we showed that de novo pyrimidine syn-thesis pathway is impaired but not totally abrogated. This residual activityis probably dependent on CTPS2. Recently, the de novo pyrimidine syn-thesis pathway was shown to be dependent on post-transcriptional reg-ulation by mTORC1 and S6 protein (S6K) kinases that activate the firstenzymatic steps required for pyrimidine synthesis14,27,28. Thus, distinctregulatory mechanisms control de novo pyrimidine synthesis. Based onthe present study, CTPS1-mediated tuning of CTP synthesis in lympho-cytes appears to be a key element in enabling adaptive immune responses.If CTPS1-specific inhibitors can be designed, they would potentiallybe highly specific immunosuppressive drugs able to inhibit auto- orallogenic-specific T-cell and B-cell responses without additional tox-icity given the lymphocyte specificity of the CTPS1-deficiency pheno-type. In conclusion, our results provide the first in vivo evidence of arole of the de novo pyrimidine synthesis pathway as a critical step forproliferation of T and B lymphocytes when activated by antigens.
METHODS SUMMARYInformed consent was obtained from donors, patients and families of patients. Thestudy and protocols conform to the 1975 declaration of Helsinki as well as to locallegislation and ethical guidelines. See Methods for full experimental procedures. Inseveral experiments, data are expressed as means 6 standard deviation (s.d.) denotedby the error bars. P values were calculated by two-tailed Student’s t-test.
Online Content Any additional Methods, Extended Data display items and SourceData are available in the online version of the paper; references unique to thesesections appear only in the online paper.
Received 14 June 2013; accepted 22 April 2014.
Published online 28 May 2014.
1. MacIver, N. J., Michalek, R. D. & Rathmell, J. C. Metabolic regulation ofT lymphocytes. Annu. Rev. Immunol. 31, 259–283 (2013).
2. Evans, D. R. & Guy, H. I. Mammalian pyrimidine biosynthesis: fresh insights into anancient pathway. J. Biol. Chem. 279, 33035–33038 (2004).
3. Higgins, M. J., Graves, P. R. & Graves, L. M. Regulation of human cytidinetriphosphate synthetase 1 by glycogen synthase kinase 3. J. Biol. Chem. 282,29493–29503 (2007).
4. Ostrander, D. B., O’Brien, D. J., Gorman, J. A. & Carman, G. M. Effect of CTPsynthetase regulation by CTP on phospholipid synthesis in Saccharomycescerevisiae. J. Biol. Chem. 273, 18992–19001 (1998).
5. Kassel, K. M., Au D. R., Higgins M. J., Hines, M. & Graves, L. M. Regulation of humancytidine triphosphate synthetase 2 by phosphorylation. J. Biol. Chem. 285,33727–33736 (2010).
6. Nadkarni, A. K. et al. Differential biochemical regulation of the URA7- andURA8-encoded CTP synthetases from Saccharomyces cerevisiae. J. Biol. Chem.270, 24982–24988 (1995).
7. van Kuilenburg, A. B., Meinsma, R., Vreken, P., Waterham, H. R. & van Gennip, A. H.Identification of a cDNA encoding an isoform of human CTP synthetase. Biochim.Biophys. Acta 1492, 548–552 (2000).
8. Fairbanks, L. D., Bofill, M., Ruckemann, K. & Simmonds, H. A. Importance ofribonucleotide availability to proliferating T-lymphocytes from healthy humans.Disproportionate expansionofpyrimidine pools and contrasting effects of denovosynthesis inhibitors. J. Biol. Chem. 270, 29682–29689 (1995).
9. van den Berg, A. A. et al. Cytidine triphosphate (CTP) synthetase activity during cellcycle progression in normal and malignant T-lymphocytic cells. Eur. J. Cancer 31,108–112 (1995).
10. Wynn, R. F. et al. Treatment of Epstein-Barr-virus-associated primary CNS B celllymphoma with allogeneic T-cell immunotherapy and stem-cell transplantation.Lancet Oncol. 6, 344–346 (2005).
11. Notarangelo, L. D. Functional T cell immunodeficiencies (with T cells present).Annu. Rev. Immunol. 31, 195–225 (2013).
12. Kursula, P. et al. Structure of the synthetase domain of human CTP synthetase, atarget for anticancer therapy. Acta Crystallogr. Sect. F Struct. Biol. Cryst. Commun.62, 613–617 (2006).
13. Traut, T. W. Physiological concentrations of purines and pyrimidines. Mol. Cell.Biochem. 140, 1–22 (1994).
14. Ben-Sahra, I., Howell, J. J., Asara, J. M. & Manning, B. D. Stimulation of de novopyrimidine synthesis by growth signaling through mTOR and S6K1. Science 339,1323–1328 (2013).
15. McPartland, R. P., Wang, M. C., Bloch, A. & Weinfeld, H. Cytidine 59-triphosphatesynthetase asa target for inhibitionby the antitumoragent 3-deazauridine. CancerRes. 34, 3107–3111 (1974).
16. Qiu, Y. et al. Mycophenolic acid-induced GTP depletion also affects ATP andpyrimidine synthesis in mitogen-stimulated primary human T-lymphocytes.Transplantation 69, 890–897 (2000).
17. van den Berg, A. A. et al. The roles of uridine-cytidine kinase and CTP synthetase inthe synthesis of CTP in malignant human T-lymphocytic cells. Leukemia 8,1375–1378 (1994).
18. Le Bourhis, L., Mburu, Y. K. & Lantz, O. MAIT cells, surveyors of a new class ofantigen: development and functions. Curr. Opin. Immunol. 25, 174–180 (2013).
19. Vivier, E., Tomasello, E., Baratin, M., Walzer, T. & Ugolini, S. Functions of naturalkiller cells. Nature Immunol. 9, 503–510 (2008).
20. Chung, B. K. et al. Innate immune control of EBV-infected B cells by invariantnatural killer T cells. Blood 122, 2600–2608 (2013).
21. Brennan, P. J., Brigl, M. & Brenner, M. B. Invariant natural killer T cells: an innateactivation scheme linked to diverse effector functions. Nature Rev. Immunol. 13,101–117 (2013).
22. Toy, G. et al. Requirement for deoxycytidine kinase in T and B lymphocytedevelopment. Proc. Natl Acad. Sci. USA 107, 5551–5556 (2010).
23. Marijnen, Y. M. et al. Studies on the incorporation of precursors into purine andpyrimidinenucleotidesvia ‘denovo’and‘salvage’pathways innormal lymphocytesand lymphoblastic cell-line cells. Biochim. Biophys. Acta 1012, 148–155 (1989).
24. Austin, W. R. et al. Nucleoside salvage pathway kinases regulate hematopoiesis bylinking nucleotide metabolism with replication stress. J. Exp. Med. 209,2215–2228 (2012).
25. Murali-Krishna, K. et al. Counting antigen-specific CD8 T cells: a reevaluation ofbystander activation during viral infection. Immunity 8, 177–187 (1998).
26. Hislop,A.D.,Taylor,G.S.,Sauce,D.&Rickinson,A.B.Cellularresponsestoviral infectioninhumans: lessons fromEpstein-Barr virus.Annu.Rev. Immunol.25,587–617 (2007).
27. Huang, M. & Graves, L. M. De novo synthesis of pyrimidine nucleotides; emerginginterfaceswithsignal transductionpathways.Cell.Mol. LifeSci.60,321–336(2003).
28. Robitaille, A.M.et al.Quantitativephosphoproteomics revealmTORC1activatesdenovo pyrimidine synthesis. Science 339, 1320–1323 (2013).
Supplementary Information is available in the online version of the paper.
Acknowledgements The authors thank the patients, their families and the healthydonors for cooperation. We thank S. Rigaud, S. Gerart, C. Synaeve and R. Rodriguez forhelp with experiments and P. Revy for discussion. This work was supported by grantsfrom INSERM, ANR (ANR-08-MIEN-012-01, ANR-2010-MIDI-005-02 andANR-10-IAHU-01), Fondation ARC (France), the European Research Council(ERC-2009-AdG_20090506 nuFP7-249816) and the Rare Diseases Fondation(France). S. L. is a senior scientist of CNRS (France). E. M. is supported by ANR (France)and Ligue contre le cancer (France). We are also grateful to the UK 1958 Birth Cohort(http://www2.le.ac.uk/projects/birthcohort) for providing DNA from 752 individualsborn in the northwest of England. Access to these resources was enabled via the58READIE Project funded by the Wellcome Trust and Medical Research Council (grantnumbers WT095219MA and G1001799). A full list of the financial, institutional andpersonal contributions to the development of the 1958 Birth Cohort Biomedicalresource is available at (http://www2.le.ac.uk/projects/birthcohort).
Author Contributions E.M.performedexperiments, analysed the dataand participatedin the writing of the manuscript. N.P., F.H., C.L., S.F., C.M. and S.S. performed exper-iments. A.F., S.L., S.S., J.S., C.P., P.N., J.M., N.J., C.M. and N.T. analysed the data. M.D.E.,R.F.W. andP.D.A. identified the families and providedandanalysed clinical information.S.L. and A.F. co-wrote the manuscript. S.L. designed and supervised the research.
Author Information Reprints and permissions information is available atwww.nature.com/reprints. The authors declare no competing financial interests.Readers are welcome to comment on the online version of the paper. Correspondenceand requests for materials should be addressed to S.L. ([email protected]).
LETTER RESEARCH
0 0 M O N T H 2 0 1 4 | V O L 0 0 0 | N A T U R E | 5
Macmillan Publishers Limited. All rights reserved©2014
METHODSCohorts of patients. Beside the four initially identified patients, four additionalpatients were identified by screening 10 patients (9 families) originating from thenorthwest of England with severe chronic viral infections, mostly caused by herpesviruses, including EBV and VZV. Furthermore, 24 patients (24 families) originat-ing from different geographical areas with the same phenotype were also tested forall exons of CTPS1 in order to identify other mutations and none was found to be acarrier of CTPS1 mutations.Exome sequencing and analysis. Exome capture was performed according tothe manufacturer’s protocol using the Illumina TruSeq exome enrichment kit andsequencing of 100 bp paired-end reads on an Illumina HiSeq. Approximately 10 Gbof sequence were obtained for each subject such that 90% of the coding bases of theexome defined by the consensus coding sequence (CCDS) project were covered byat least 10 reads. Adaptor sequences and quality trimmed reads were removed usingthe Fastx toolkit (http://hannonlab.cshl.edu/fastx_toolkit/) and a custom script wasthen used to ensure that only read pairs with both mates present were subsequentlyused. Reads were aligned to hg19 with BWA31, and duplicate reads were markedusing Picard (http://picard.sourceforge.net/) and excluded from downstream ana-lyses. Single nucleotide variants (SNVs) and short insertions and deletions (indels)were determined using SAMtools (http://samtools.sourceforge.net/) pileup andvarFilter32 with the base alignment quality (BAQ) adjustment disabled, and theywere then quality filtered to require at least 20% of reads supporting the variant call.Variants were annotated using both ANNOVAR33 and custom scripts to identifywhether they affected protein coding sequences, and whether they had previouslybeen seen in the dbSNP, the 1000 Genomes data set (1,092 genomes), or in approxi-mately 2,073 exomes previously sequenced at our centre. A variant detected in apatient was considered to be a candidate mutation if it had not been reported or hada frequency below 0.001% in the three databases indicated above. At the time thehomozygous G to C mutation in CTPS1 (at position chr1:41475832) was identifiedby WES in the three patients (P1.1, P1.2 and P2.1), it was not described as a dbSNPor assigned to a rsID. Afterwards, this mutation has been identified in the NHLBIGO Exome Sequencing Project (http://evs.gs.washington.edu/EVS/) with the assignedrsID: rs145092287. In the NHLBI GO Exome Sequencing Project, the rs145092287 ispresent three times in a heterozygous status among 4,300 genomes from an European-American population and not found in the 2,203 genomes of an African-Americanpopulation. The rs145092287 was not found in a homozygous or heterozygousstatus in other available genome databases (NCBI, 1000 Genomes project and the3,519 genomes of our centre). Homozygosity regions around the rs145092287 weredetermined in the exomes by looking at the homozygous variations. Between thepositions chr1:40737516 (rs6677717) and chr1:42008077 (rs 63729761) a succes-sion of 97 homozygous variations (without heterozygous variations) was found tobe shared by the three patients.Genomic DNA sequencing. Genomic DNA from peripheral blood cells, EBV-Bcell lines and/or fibroblasts of patients, their parents, and other family memberswas isolated according to standard methods. Genomic DNAs of 752 healthy con-trol subjects born in the northwest of England were obtained from the UK 1958Birth Cohort (http://www2.le.ac.uk/projects/birthcohort). The estimated frequencyof the CTPS1 mutation in the populations was calculated according to the Hardy–Weinberg law. Oligonucleotide primers flanking the 39 region of intron 17–18 andexon 18 of CTPS1 were used to amplify genomic DNA: forward 59-AGAGTTGGTGGTAGGGTGTGTGAC-39 and reverse 59-CTTGCAATCGCAGTGTGTTATCAC-39. PCR products were amplified using high fidelity Platinum Taq DNA Poly-merase (Invitrogen) according to the manufacturer’s recommendations, purifiedwith the QIAquick gel extraction kit (Qiagen) and sequenced using the ABI PRISMBigDye Terminator Cycle Sequencing Ready Reaction Kit (PerkinElmer) accordingto the manufacturer’s recommendations. All collected sequences were analysed using4peaks software (Version 1.7.2; A. Griekspoor and T. Groothuis, http://nucleobytes.com/index.php/4peaks).Analysis of microsatellite markers. Microsatellite markers were genotyped usingUniSTS sequences and mapping information available from the NCBI (http://www.ncbi.nlm.nih.gov). Genomic DNA from patients was used as templates to amplifyby PCR with specific fluorescent labelled oligonucleotides, the polymorphic repeatscorresponding to the microsatellite markers. PCR products were evaluated using anABI 3100 DNA Fragment Analyzer (Applied Biosystems), and data were analysedusing Genescan and Genotyper software (Applied Biosystems).Gene expression analysis. Total RNA was isolated from EBV-B cell and activatedT-cell blasts of P1.2, P2.1 patients and control donors using the RNeasy Mini kit(Qiagen). The samples were depleted of genomic DNA and reverse transcriptionwas performed using Superscript II First Strand Synthesis System (Invitrogen).cDNAs were used as a template to perform PCR amplifications of exon 15 to exon19 of CTPS1 or exon 4 of actin with the following primers using standard proto-cols: CTPS1 forward primer: 59-GAGAGGCACCGCCACCGATTTG-39, CTPS1reverse primer: 59-GCCAGTACACGTGATGGGACATGC-39, actin forward primer:
59-CTCCTTAATGTCACGCACGAT-39; actin reverse primer: 59-CTCCTTAATGTCACGCACGAT-39. PCR to amplify full length CTPS1 cDNAs from control andpatients cells were also performed using the following primers, forward primer:59-AGCTCTGTCGCTGACGGGAGGAT-39 (exon1); reverse primer: 59-GCCAGTACACGTGATGGGACATGC-39 (exon 19). PCR products were verified by se-quencing revealing the expression of an abnormal CTPS1 transcript lacking exon 18in patients’ cells. Multiple tissue cDNA panels from Ozyme (Human MTC panel I,II and Human Immune Sytem MTC panel) were analysed for CTPS1 and CTPS2gene expression by qRT–PCR. Gene expression assays were performed with Assays-on-Demand probe and primer combinations (CTPS1, Hs01041858; CTPS2,Hs00219845; GAPDH, Hs027558991) from Applied Biosystem labelled with 6-carboxy-fluorescein (FAM) dye, and universal reaction mixture. Real time quant-itative PCRs for GAPDH, CTPS1 and CTPS2 were performed in triplicate using aLightCycler VIIA7 System (Roche). Expression levels were determined by relativequantification using the comparative threshold cycle method 2DDCt in whichDDCtis determined as followed: (Cttarget gene – Ctreference gene) target tissue 2 (Cttarget gene
– Ctreference gene) calibrator tissue. The results shown in arbitrary units (a.u.) havebeen normalized to GAPDH gene expression and are presented as the relativechange in gene expression normalized against the calibrator sample correspondingto leukocyte tissue.Cell culture and stimulation. Peripheral blood mononuclear cells (PBMCs) col-lected from patients and healthy donors were isolated by Ficoll-Paque densitygradient (Lymphoprep, Proteogenix) from blood samples using standard proce-dures. Expansion of T-cell blasts were obtained by incubating PBMCs for 72 h withphytohaemagglutinin (PHA) (2.5mg ml21, Sigma-Aldrich) in RPMI 1640 GlutaMaxmedium (Invitrogen) supplemented with 5% human male AB blood group serum(BioWest), penicillin (100 U ml-1) and streptomycin (100mg ml21). After 3 days,dead cells were removed by Ficoll-Paque density gradient and blasts were main-tained in culture with IL-2 (100 U ml21). For proliferation and cell cycle analyses,blasts were washed and cultured without IL-2 for 72 h to synchronize the cells. Blastsor PBMCs were then cultured during 4 to 6 days in complete medium alone or inthe presence of 0.1, 1 or 10mg ml21 coated anti-CD3 antibody (clone OKT3, eBio-sciences), anti-CD3/CD28-coated beads (Invitrogen), PHA (2.5mg ml21, 1025 Mionomycin (Sigma-Aldrich) plus 1027 M phorbol 12-myristate 13-acetate (PMA,Sigma-Aldrich), Candidin (5mg ml21, Bio-Rad), tetanus toxoid (1 to 8,000 dilu-tion, Statens Serum Institute) or tuberculosis antigen (50mg ml21, Statens SerumInstitute). Proliferation and cell cycle were analysed at the indicated time points.Then 40mM of 3-Deazauridine (DAZ, Sigma-Aldrich) was added for 12 h beforethe stimulation. In complementation experiments, blasts were incubated with 100mMof CTP, UTP, GTP or ATP (New England Biolabs) separately or in combination, orwith 200mM of cytidine, uridine, guanosine or adenosine (Sigma-Aldrich) sepa-rately or in combination 12 h before the stimulation. For dosage of nucleotides,blasts were deprived of IL-2 for 72 h before stimulation or not with anti-CD3/CD28-coated beads for 48 h and cell lysates were prepared. Jurkat cells29, 293-T cells and BEBV cell lines from patients were cultured in RPMI 1640 GlutaMax medium sup-plemented with 10% heat-inactivated fetal calf serum (Gibco), penicillin (100 U ml21)and streptomycin (100mg ml21). Cells were free of mycoplasma contamination.Proliferation and cell cycle assays. Cell proliferation was monitored by labellingcells with the cell trace violet dye (CellTrace violet proliferation kit, Invitrogen) orCFSE (5mM, Invitrogen) before stimulation, according to the manufacturer’sinstructions. After 4 or 6 days of culture, cells were collected and CellTrace violetor CSFE fluorescence dilution was assessed by flow cytometry. The division indexof proliferation was calculated using FlowJo software (Tree Star) and correspondsto the average number of cell divisions per cell including the undivided peak. T-cellresponses within total PBMCs were also measured by [3H]thymidine incorpora-tion after 6 days of stimulation. A total of 0.074 MBq ml21 of [3H]thymidine wasadded during the last 18 h of stimulation. Cell proliferation was determined byc.p.m. of [3H]thymidine incorporated in cells that were counted with TopCountNXT beta counter (PerkinElmer). Cell cycle analysis was determined by measur-ing the incorporation of the nucleoside analogue 5-ethynyl-2-deoxyuridine (EdU)into newly synthesized DNA, according to the manufacturer’s instructions (Click-iT EdU, Invitrogen) after 48 h of anti-CD3 stimulation. EdU incorporation in cellswas measured following conjugation of EdU to azide-modified Alexa Fluor 647dye. Cells were analysed by flow cytometry with a FACS-Canto II flow cytometrysystem (BD Biosciences).Nucleic acids and de novo pyrimidine synthesis assays. PBMCs were stimulatedin the presence of 1mg ml21 coated anti-CD3 antibody (clone OKT3, eBiosciences)or 2.5mg ml21 PHA (Sigma-Aldrich) for 3 days or in the presence of candidin(5mg ml21, Bio-Rad), tetanus toxoid (1 to 8,000 dilution, Statens Serum Insti-tute) or PPD (tuberculin) (50mg ml21, Statens Serum Institute) for 6 days. Then0.074 MBq ml21 of [3H]thymidine, [3H]cytidine, [3H]uridine or [3H]leucine or0.185 MBq ml21 U-[14C]aspartate were added during the last 18 h of stimulation.For [3H]cytidine, this corresponds to 0.133mM, which does not restore normal
RESEARCH LETTER
Macmillan Publishers Limited. All rights reserved©2014

proliferation of CTPS1-deficient cells that required 50mM. Cells were collectedwith a Filter Mate harvester (PerkinElmer) on filters for labelled cell assays (Uni-filter plates, PerkinElmer) that retain nucleic acids and filters were then washed.Radioactivity (c.p.m.) on filters (corresponding to radiolabelled compounds incor-porated in nucleic acids) was measured by liquid scintillation counting with Top-Count NXT beta counter (PerkinElmer).Apoptosis assay. Apoptosis was determined by evaluating phosphatidylserine(PS) exposure in the outer leaflet of the cytoplasmic membrane with PE-conjugatedannexin-V in combination with 7-AAD Viaprobe (Apoptosis Detection Kit I, BD)12 h after stimulation with coated-OKT3 (0.1, 1 or 10 mg ml21). Apoptosis wasbased on the percentage of annexin V1/7AAD2 cells to exclude necrotic cells. Cellswere analysed by flow cytometry.Cytokine production and degranulation. For intracellular staining of cytokines,cells were stimulated overnight with PMA and ionomycin or anti CD3/CD28 beadsin the presence of brefeldin A (GolgiPlug, BD). Cells were then fixed and per-meabilized using the BD cytofix/cytoperm plus kit (BD Pharmingen) according tothe manufacturer’s instructions. Cells were labelled with PE-anti-IL-2 (rat IgG2a,MHQ1-17H12), PE/Cy7-anti-TNF-a (mouse IgG1; MAb11), APC-anti-IFN-c (mouseIgG1, 4S.B3) and isotype-matched monoclonal antibodies purchased from Bio-Legend and analysed by flow cytometry. Degranulation was determined by analysisof the expression of CD107/LAMP, a marker of the exocytosis of lytic granules.Blasts were stimulated for 3 h in the presence of 0.3, 3 or 30mg ml21 coated-OKT3and simultaneously labelled with eFluor660-anti-CD107a (mouse IgG1; eBioH4A3),eFluor660-anti-CD107b (mouse IgG1; eBioABL-93) or isotype matched monoclo-nal antibodies purchased from eBiosciences. Thereafter, cells were collected, washedand stained with FITC-anti-CD3 and PE-anti-CD8 monoclonal antibodies andanalysed by flow cytometry.Flow cytometry. Cell staining and the flow-cytometry-based phenotypic analysesof PBMCs and cells were performed according to standard flow cytometry methods.The following monoclonal antibodies were conjugated to fluorescein isothiocyanate(FITC), phycoerythrin (PE), phycoerythrin-Cyanine7 (PE/Cy7), phycoerythrin-Cyanine5, phycoerythrin-Cyanine5.5, allophycocyanin (APC), allophycocyanin-Vio7, View blue or View green: anti-CD25 (M-A251), anti-CD27 (M-T271), anti-CD31(WM59), anti-CD45RA (HI100), anti-CD45RO (UCHL1), anti-CD197/CCR7 (3D12),anti-TCRab (T10B9), anti-TCRcd (B1), anti-CD95 (DX2), anti-CD19 (HIB19), anti-CD21 (B-ly4), anti-IgM (G20-127), anti-IgD (IA6-2), anti-CD56 (B159) and anti-CD16 (3G8), all purchased from BD Biosciences and anti-CD3 (BW264/56), anti-CD4(VIT4), anti-CD8 (BW135/80) and anti-CD69 (FN50) from Miltenyi Biotec. iNKTcells were detected by staining with anti-Va24 (C15) and anti-Vb11 (C21) (BeckmanCoulter) and MAIT cells by staining with anti-Va7.2 (3C10) and anti-CD161 (HP-3G10 (Biolegend). All data were collected on a FACS-Canto II cytometer (BD Bio-sciences) and analysed using FlowJo Version 9.3.2 software (Tree Star).Immunoblotting and analysis of CTPS1 protein expression. Cells (5 3 106 cellsper ml) were stimulated by anti-CD3 antibody (1mg ml21) crosslinking with a rabbitanti-mouse IgG (2mg ml21) or anti CD3/CD28 beads for the indicated time periods.Cells were then lysed in 1% NP40, 50 mM Tris pH 8, 150 mM NaCl, 20 mM EDTA,1 mM Na3VO4, 1 mM NaF and complete protease inhibitor cocktail (Roche),as previously described30. Protein concentrations were quantitated by BCA assay(BIO-RAD). Then 80 mg of proteins were separated by SDS–PAGE and trans-ferred on PVDF membranes (Millipore). Membranes were blocked with milk orBSA before incubation with antibodies. The following monoclonal antibodies andrabbit polyclonal antibodies were used for immunoblotting: anti-PLC-c1 (#2822S),anti-phosphorylated PLC-c1 (#2821S), anti-phosphorylated ERK1/2 (clone E10,#9106S), anti-ERK1/2 (#4695S) anti-phosphorylated IkBa (clone 5A5, #9246S),anti-phosphorylated PKCtheta (#9377S), NFkB (clone D14E12) anti-phosphorylatedAKT (Serine 473, clone 587F11) and anti-phosphorylated tyrosine (4G10) pur-chased from Cell Signaling Technology and rabbit polyclonal antibodies anti-actin(#A2066) and anti-CTPS1 raised against the residues 341 to 355 (#SAB111071) or416-430 (#SAB111072) and anti-CTPS2 (#HPA017437) purchased from Sigma-Aldrich. Anti-CTPS1 rabbit polyclonal antibodies (K-21) from Santa Cruz werealso tested. Membranes were then washed and incubated with anti-mouse or anti-rabbit HRP-conjugated secondary antibodies from Cell Signaling and GE Health-care, respectively. Pierce ECL western blotting substrate was used for detection. Forinhibition assays of the signalling pathways after TCR-CD3 activation, cells havebeen stimulated with anti-CD3/CD28 beads for 48 h in the presence of 100 nM ofthe MAPK/ERK inhibitor PD0325901, 10mM of the Src family protein tyrosinekinase inhibitor PP1, 10mM of the Src family protein tyrosine kinase inhibitor PP2,10mM of the selective Ca21 chelator 1,2-bis-(2-aminophenoxy) ethane-N,N,N’,N’-tetraacetic acid tetra(acetoxymethyl) ester (BAPTA/AM), 10mM of the IkBa phos-phorylation inhibitor Bay 11-7085 or 10mM of PI3Kdelta inhibitor IC87114. Allwere from Sigma-Aldrich, except IC87114 from Calbiochem. The concentrationsused were typical and previously reported. After 48 h incubation with the differentinhibitors, cell viability was verified and was more than 90% in each condition. The
activity and the selectivity of the inhibitors was verified in parallel by immuno-blotting for phospho-tyrosine (for PP1 and PP2), IkBa phosphorylation (for Bay11-7085), ERK phosphorylation (for PD0325901) and AKT phosphorylation (forIC87114) (data not shown).Calcium flux analysis. Ca21 responses were assessed by flow cytometry, as previ-ously described31. Briefly, cells were loaded with 5mM Indo-1 a.m. (Molecular Probes),washed, incubated with anti-CD4-APC and anti-CD8-PE monoclonal antibodies,stimulated by anti-CD3 antibody (0.125mg ml21) crosslinking with F(ab9)2 rabbitanti-mouse IgG (10mg ml21) and then incubated with ionomycin (1mM). Cellswere analysed with a FACSAria flow cytometer (BD Biosciences). Ca21 flux datawere obtained using kinetic analyses of FlowJo software package (Tree Star). Intra-cellular Ca21 levels correspond to the normalized ratio of Ca21-bound to Ca21-free Indo-1 fluorescence and are plotted as a function of time.Plasmid constructs, cell transfections and infections. A full-length cDNA encod-ing wild-type CTPS1 and a full length cDNA encoding the mutant CTPS1D18 wereobtained by RT–PCR from control blasts and blasts from patient 1.2 respectivelyusing the forward 59-CGGGATCCCACCATGAAGTATATTCTGGTT-39 and reverse59-CCGCTCGAGTCAGTCATGATTTATTGA-39 (for wild type) and 59-CCGCTCGAGTTAAAGAAAGTCTCCAAGC-39 (for CTPS1D18) specific primers.The cDNAs were verified by sequencing and inserted into a bicistronic lentiviralexpression vector encoding the green fluorescent protein (GFP) as a reporter (pLenti7.3/V5-TOPO, Invitrogen). Viral particles for infection were obtained by co-expressionof the lentiviral vector containing CTPS1 with third-generation lentiviral plasmidscontaining Gag-Pol, Rev and the G protein of the vesicular stomatitis virus (VSVG)into HEK 293T using calcium phosphate. Viral supernatants were collected every12 h on 2 consecutive days, starting 48 h after transfection, and viral particles wereconcentrated by ultracentrifugation at 49,000g for 1.5 h at 12 uC. Cells were infectedwith viral particles at a minimal titre of 107 tranducing units per ml and 48 h afterinfection, cells were deprived of IL-2 during 72 h for proliferation assays. To assessthe selective advantage of GFP expression during long-term expansion, blasts werere-stimulated with anti-CD3/CD28 beads (Invitrogen) every 48 h during 8 days.For CTPS1 gene knockdown, blasts or Jurkat cells were infected at day 3 of PHAstimulation with the pLKO.1 lentiviral vector containing a CTPS1-specific shRNA(OpenBiosystems, nuTRCN0000045349 and nuTRCN0000045350) or a scrambledshRNA in which the puromycin resistance gene was replaced by the GFP gene.Proliferation was analysed in GFP1 and GFP2 blasts after 4 days of stimulation withanti-CD3/CD28 beads as previously described. For survey of loss of GFP expressionin long-term expansions, blasts were repeatedly stimulated with anti-CD3/CD28beads every 48 h during 8 days. Jurkat cells were maintained in culture after infec-tion during 26 days. The proportions percentages of GFP1 cells were determinedby flow cytometry.Quantification of intracellular nucleotides. Intracellular pools of nucleotideswere quantified based on previously described methods32,33. Briefly, five million cellswere washed in 0.1 M phosphate buffer (pH 7.4) and lysed in 60ml HClO4 1 M,containing 2mM 8-bromo-AMP (8-BrAMP) as an internal standard. After 12,000gcentrifugation for 5 min at 4 uC, supernatants were transferred to a 384-well plateand kept at 4 uC in an auto sampler before injection. Aliquots of 5ml were injectedonto a separation column (ACQUITY UPLC BEH300 C18, 1.7mm, 2.1 3 100 mmreversed-phase column, Waters) with a flow rate of 0.5 ml min21 and analysedwith a tandem mass spectrometry system consisting of an Acquity Ultra Perfor-mance Liquid Chromatography (UPLC Waters) interfaced with a xevo-TQ-S tan-dem quadrupole mass spectrometer (Waters). Mobile phase A was 0.1% formicacid in water and mobile phase B, 0.1% formic acid in acetonitrile. A programmedmobile phase-gradient was used during a 7-min run: 0 min, 1% B; 5 min, 10% B;5.1 min, 100% B; 6 min, 100% B; 6.1 min, 1% B; 7 min, 1% B. The content of the 4nucleotides ATP, GTP, UTP and CTP was quantified in the electrospray negative ionmode with multiple reaction monitoring (MRM). Transitions of m/z 505.9 . 408and 505.9 . 272.9 were used for quantification and confirmation of ATP, respectively,and those of 521.9 . 158.9 and 521.9 . 177 for GTP, 482.8 . 158.9 and 482.8 . 79for UTP, and 481.8 . 158.9 and 481.8 . 384 for CTP. Concentrations were deter-mined by using calibration curves of the 4 nucleotides. The linearity, exactitudeand variability were determined for the technical validation of this assay. The linea-rity gave a correlation coefficient of the linear regression curves greater than 0.99for the 4 nucleotides. The minimum and maximum recovery of spiked samples withthe 4 nucleotides at a concentration of 90 mg l21 and 250 mg l21 ranged from 72% to123%. The maximum intra- and inter-assay variability was 22% and 23%, respectively.Statistical analysis. P values were calculated with a Student’s t-test using PRISMsoftware (GraphPad Software), with a two-tailed distribution. The variance was sim-ilar between the groups that have been statistically compared.
29. Gulow, K. et al. HIV-1 trans-activator of transcription substitutes for oxidativesignaling inactivation-inducedTcell death. J. Immunol. 174, 5249–5260(2005).
30. Latour, S. et al. Regulation of SLAM-mediated signal transduction by SAP, theX-linked lymphoproliferative gene product. Nature Immunol. 2, 681–690 (2001).
LETTER RESEARCH
Macmillan Publishers Limited. All rights reserved©2014

31. Picard, C. et al. Hypomorphic mutation of ZAP70 in human results in a late onsetimmunodeficiency and no autoimmunity. Eur. J. Immunol. 39, 1966–1976(2009).
32. Luo, B., Groenke, K., Takors, R., Wandrey, C. & Oldiges, M. Simultaneousdetermination of multiple intracellular metabolites in glycolysis, pentose
phosphate pathwayand tricarboxylic acid cycle by liquid chromatography-massspectrometry. J Chromatogr. A 1147, 153–164 (2007).
33. Scavennec, J., Maraninchi, D., Gastaut, J. A., Carcassone, Y. & Cailla, H. L. Purineand pyrimidine ribonucleoside monophosphate patterns of peripheral blood andbonemarrowcells inhumanacute leukemias.CancerRes.42,1326–1330 (1982).
RESEARCH LETTER
Macmillan Publishers Limited. All rights reserved©2014

Extended Data Figure 1 | Identification of a genetic CTPS1 defect inpatients P1.1, P1.2 and P2.1. a, Analysis of the single nucleotide variations(SNVs) detected by whole-exome sequencing in the genome of P1.1, P1.2and P2.1. The numbers of SNVs are indicated in the triangles. SNVs werefiltered by removal of non-functional intronic and synonymous mutations,heterozygous variations and those present in dbSNPs, 1000 genomes databases.The intersection of the filtered SNVs in the three patients resulted in theidentification of a single common splicing site variation in the CTPS1 gene.b, Exon–intron structure and sequences of exons 17, 18 and 19 of CTPS1.The position of the variation is indicated by an arrow. The boxed nucleotidecorresponds to the alternative splice site which produces a shorter transcript
lacking exon 18 detected in patient cells. The alternative stop codon is indicatedby an asterisk. c, Expression of a CTPS1 transcript lacking exon 18 (CTPS1D18)in CTPS1-deficient patients. The relative expression of full length CTPS1,CTPS1D18 and actin transcripts was examined by qRT–PCR in EBV-B celllines (patient P2.1) and T-cell blasts (patient P1.2) from CTPS1-deficientpatients. qRT–PCRs of actin are shown as normalization controls of the cDNAsamples. Three fold-serial dilutions of cDNAs (indicated as 1, 0.3 and 0.1) wereused for amplification of each transcript. Base pair markers are shown onthe left. PCR products were verified by sequencing showing the expression ofan abnormal CTPS1 transcript lacking exon 18 in the cells of the patients.
LETTER RESEARCH
Macmillan Publishers Limited. All rights reserved©2014

Extended Data Figure 2 | Loss of CTPS1 expression and undetectableexpression of the mutant CTPS1D18 protein in cells from CTPS1-deficientpatients. a, Transient expression of CTPS1 and the mutant CTPS1D18 in293-T cells transfected with vectors containing wild-type CTPS1 or the mutantCTPS1D18. Cell lysates were tested by immunoblotting for CTPS1 withdifferent antibodies raised against CTPS1 and for actin as a control for loading.The CTPS1D18 mutant protein is recognized by the rabbit polyclonalantibodies raised against the 341 to 355 (anti-341-355) or the 416 to 430
(anti-416-430) residues of CTPS1 but not by the rabbit polyclonal antibodyK21. b, T-cell blasts from a healthy control (Ctr.) and the CTPS1-deficientpatient P1.2 (P1.2) stimulated for 48 h with anti-CD3 were analysed forCTPS1 expression with the rabbit polyclonal antibodies anti-416-430 andanti-341-355. Actin expression as control for loading. c, EBV B-cell lines fromhealthy controls (Ctr. 1 and Ctr.2) and CTPS1-mutated patients (P1.2 andP2.1) were analysed for CTPS1 expression with the rabbit polyclonal antibodyanti-416-430. Actin expression served as control for loading.
RESEARCH LETTER
Macmillan Publishers Limited. All rights reserved©2014

Extended Data Figure 3 | Induction of CTPS1 expression in activatedB cells. a, Immunoblots for CTPS1 expression in sorted CD191 B cells(from PBMCs of an healthy donor) stimulated with the indicated stimuli. Actinwas used as a loading control. b, Kinetics of CTPS1 mRNA expressionmonitored by qRT–PCR in sorted B cells that have been stimulated withanti-BCR1CpG. Expression is in arbitrary units (a.u.) normalized to the
expression of the GADPH gene and leukocytes were used as calibrator.c, Immunoblots for CTPS1 expression in T-cell blasts (from an healthy donor)stimulated with anti-CD3/CD28 beads in the presence of selective inhibitors ofNFkB, Src kinases, Ca21, ERK kinase and PI3Kdelta. Actin was used as aloading control. The activity of the inhibitors was controlled in parallel (seeMethods and data not shown).
LETTER RESEARCH
Macmillan Publishers Limited. All rights reserved©2014

Extended Data Figure 4 | Analysis of proximal and late TCR activationresponses in CTPS1-deficient cells. a, Immunoblots showing thephosphorylation of proximal signalling molecules in T-cell blasts from acontrol donor (Ctr.) and a CTPS1-deficient patient P1.2 (P1.2) stimulated withanti-CD3 antibodies for 0, 2, 5, 15, 30 and 60 min or PMA plus ionomycin(P 1 I). Cell lysates were immunoblotted with antibodies against tyrosine-phosphorylated residues (PY), phosphoPLCG1 (pPLCG1), PLCG1, NFAT2c,phosphoPKCtheta (pPKCtheta), IkBa, phosphoERK1/2 (pERK1/2) and actinas a loading control. Molecular weights are on the left. Data correspond to onerepresentative experiment of 2 or 3 independent experiments. b, Flowcytometry analyses of Ca21-flux in T cells from PBMCs or T-cell blasts of acontrol donor (Ctr.) and a CTPS1-deficient patient P1.2 (P1.2) loaded withthe Ca21-sensitive fluorescent dye Indo-1. Cells were then stimulated withanti-CD3 antibodies (first arrow) crosslinked with rabbit anti-mouseantibodies (second arrow) and then incubated with ionomycin (third arrow) toinduce a receptor-independent Ca21 response. Intracellular Ca21 levels areexpressed in arbitrary units (a.u.). Data with the T-cell blasts correspond to oneof three representative experiments. c, Analysis of the degranulation capacity ofCD81 T-cell blasts from two control donors (Ctr.1 and Ctr.2) and a CTPS1-deficient patient P1.2 (P1.2) stimulated with the indicated concentrations ofanti-CD3 antibodies for 4 h. Cells were stained with antibodies againstCD107a/b (LAMP1/2), a surface-exposed marker of the secretion of lyticgranules, and then analysed by FACS. Means with s.d of percentages of CD81
CD1071 cells are presented. d, Flow cytometry analysis of intracellular IL-2production in CD41 and CD81 T cells from PBMCs of a control donor (Ctr.)and two CTPS1-deficient patients P1.2 and P2.2 (P1.2 and P2.2) stimulatedfor 36 h with anti-CD28 and anti-CD3 antibodies. The percentages ofCD41IL-21 and CD81IL-21 are shown. e, Flow cytometry analysis ofintracellular IFN-c and TNF-a production on gated CD31 T-cell blasts of acontrol donor (Ctr.) and a CTPS1-deficient patient P1.2 (P1.2) stimulated for12 h with IL-2, anti-CD3 and anti-CD28 coated beads (anti-CD3/CD28), PMAplus ionomycin or PHA. Data are representative of one of 3 independentexperiments. Dot-plots in red correspond to the isotype control. f, Induction ofCD25 and CD69 in CD31 T-cell blasts from a control donor (Ctr.) and aCTPS1-deficient patient (P1.2) was assessed after 24 h of anti-CD3 stimulationfor CD69 and 96 h for CD25. Expression was assessed by flow cytometryand the median fluorescence intensity (MFI) is presented. Data are means withs.d of four and eight independent experiments for CD69 and CD25,respectively. Unpaired Student’s t-test. ***P , 0.001, *P , 0.05. g, Analysis ofactivation-induced cell death (AICD) in CD31 T-cell blasts from a controldonor (Ctr.) and a CTPS1-deficient patient P1.2 (P1.2,) after stimulation withthe indicated concentration of anti-CD3 antibodies for 12 h. Apoptotic cellswere detected by annexin V and 7-AAD staining and the percentages ofannexin V positive/7-AAD negative cells within the gated CD3 population areshown. Data are means with s.d. of four (P1.2, n 5 4) and eight (Ctr., n 5 8)independent experiments. Unpaired Student’s t-tests and *P , 0.05.
RESEARCH LETTER
Macmillan Publishers Limited. All rights reserved©2014

Extended Data Figure 5 | Decreased proliferation of TCR-stimulated T cellsfrom patients P1.1, P1.2 and P2.2. and IL-2-expanded natural killer cellsfrom patient P1.2. a, Proliferation of CD31 T cells from PBMCs of controldonors (Ctr.) and CTPS1-deficient patients (P1.1, P1.2; left panels) or (P1.2,P2.2; right panels). Right panels and left panels correspond to 2 independentexperiments. Cells were stimulated with immobilized anti-CD3 and solubleanti-CD28 antibodies during the course of 6 days. The proliferation wasdetermined by dilution of CFSE staining analysed by flow cytometry.
Histograms correspond to CFSE staining dilutions for which the number of celldivisions was indicated at the top of each peak. b, Proliferation of CD31 T andCD161CD561 natural killer cells from PBMCs of a control donor (Ctr.) and aCTPS1-deficient patient (P1.2). Cells were stimulated with anti-CD3/CD28coated beads for 3 days or IL-2 for 7 days. Representative dot plots showingcell divisions by dilution of the violet dye and expression of the activationmarker CD69. Inserts with histograms showing the violet dye dilution with thenumber cell divisions indicated at the top of each peak.
LETTER RESEARCH
Macmillan Publishers Limited. All rights reserved©2014

Extended Data Figure 6 | Decreased incorporation of thymidine, uridine,cytidine, leucine and asparte in CTPS1-deficient cells. a, Incorporation of[3H]thymidine, [3H]uridine, [3H]cytidine and [3H]leucine as tracers of DNA,RNA and protein synthesis in PBMCs from a control healthy donor (Ctr.) and aCTPS1-deficient patient (P1.2) stimulated or not (no stim.) for 3 days withanti-CD3 or PHA and for 6 days with tetanus toxoid, candidin or tuberculin.The concentration of [3H]cytidine used in these experiments is under the value
allowing the restoration of normal proliferation in CTPS1-deficient cells(also see Methods). Data are means with s.d of two independent experimentswith triplicates. Unpaired Student’s t-tests and ***P , 0.001, **P , 0.01,*P , 0.05. b, c, Incorporation of [14C]aspartate and [3H]thymidine in PBMCs(b) or T-cell blasts (c) from a control healthy donor (Ctr.) and a CTPS1-deficient patient (P1.2) stimulated or not (no stim.) for 3 days with anti-CD3 orPHA. Data means with s.d of three independent samples.
RESEARCH LETTER
Macmillan Publishers Limited. All rights reserved©2014
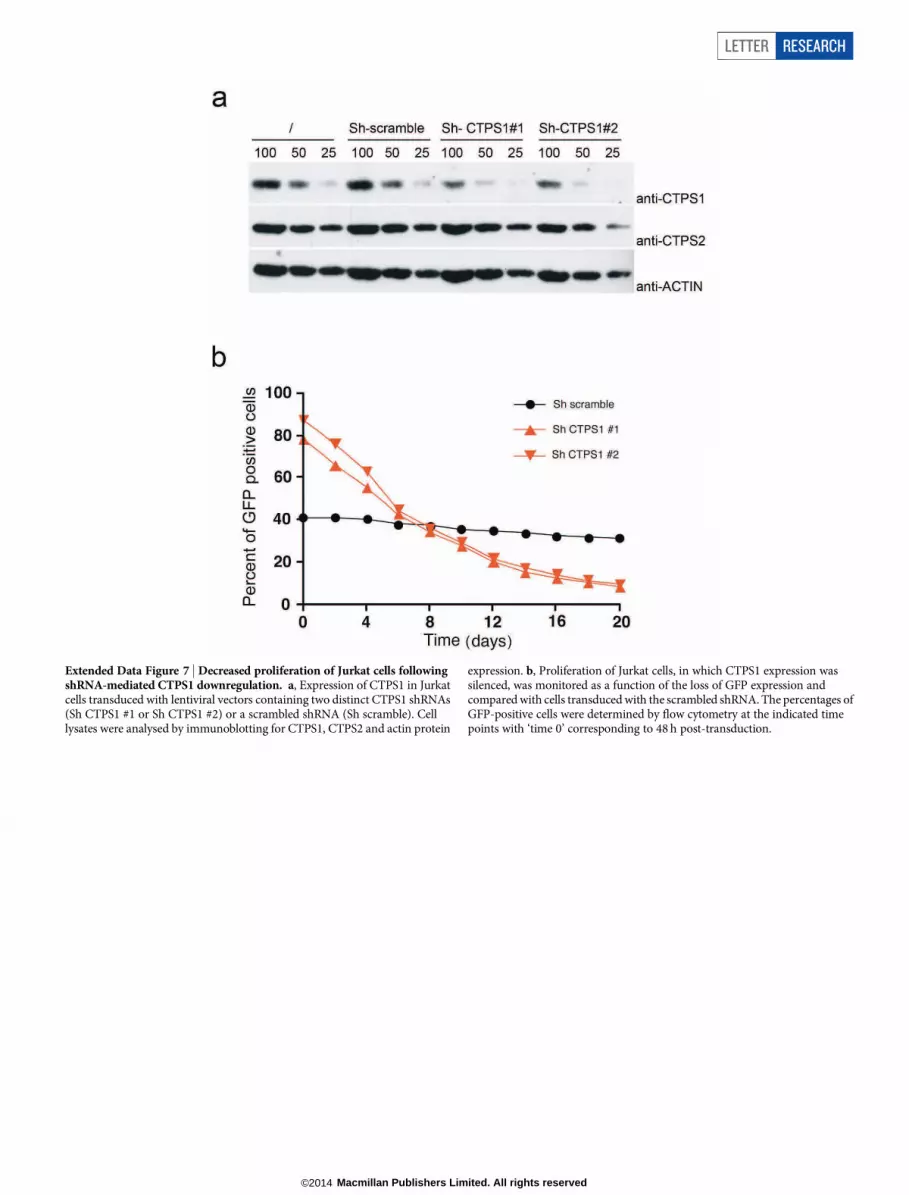
Extended Data Figure 7 | Decreased proliferation of Jurkat cells followingshRNA-mediated CTPS1 downregulation. a, Expression of CTPS1 in Jurkatcells transduced with lentiviral vectors containing two distinct CTPS1 shRNAs(Sh CTPS1 #1 or Sh CTPS1 #2) or a scrambled shRNA (Sh scramble). Celllysates were analysed by immunoblotting for CTPS1, CTPS2 and actin protein
expression. b, Proliferation of Jurkat cells, in which CTPS1 expression wassilenced, was monitored as a function of the loss of GFP expression andcompared with cells transduced with the scrambled shRNA. The percentages ofGFP-positive cells were determined by flow cytometry at the indicated timepoints with ‘time 0’ corresponding to 48 h post-transduction.
LETTER RESEARCH
Macmillan Publishers Limited. All rights reserved©2014

Extended Data Figure 8 | Measurements of nucleotide pools inCTPS1-deficient T cells and in B/EBV cell lines from patients.a, Concentration of ATP, GTP, UTP and CTP in cell extracts of T-cell blastsstimulated with anti-CD3/CD28 coated beads or not (no stim.) from controlhealthy donors (Ctr.) or from patient P1.2. Control cells were treated or notwith deazauridine for 24 h before and during stimulation or not. Representativedata from 3 independent experiments. b, Same as in a with EBV B-cell lines
from control healthy donors (Ctr.) and patients P1.1 (squares), P1.2 (circles)and P2.1 (triangles). For controls, each symbol corresponds to a differentcontrol cell line (from a different healthy donor). Representative data from twoindependent experiments with blinding during the measurements. Barscorrespond to averages. Unpaired Student’s t-tests and *P , 0.05, **P , 0.01,***P , 0.001. CTP data are also shown in Fig. 3g, h.
RESEARCH LETTER
Macmillan Publishers Limited. All rights reserved©2014

Extended Data Table 1 | Immunological data of CTPS1-deficient patients
Different immunological parameters of patients were tested from blood (numbers of cells), PBMCs (proliferation in response to PHA evaluated by incorporation of [3H]thymidine) and serum (immunoglobulinsubclasses and specific antibodies).
LETTER RESEARCH
Macmillan Publishers Limited. All rights reserved©2014

Extended Data Table 2 | Immunological features of PBMCs from patient P1.2 at 8 and 9 years
Different T-cell subsets, B-cell subsets and natural killer cells from PBMCs were tested by flow cytometry. T cell proliferation from PBMCs in response to different stimuli including antigen- specific responses wasanalysed.
RESEARCH LETTER
Macmillan Publishers Limited. All rights reserved©2014
Copyright © 2022 FDOKUMEN