CSC Steel Holdings (CSCS MK) - Maybank Kim Eng
38
August 21, 2017 Materials Malaysia THIS REPORT HAS BEEN PREPARED BY MAYBANK INVESTMENT BANK BERHAD SEE PAGE 36 FOR IMPORTANT DISCLOSURES AND ANALYST CERTIFICATIONS PP16832/01/2013 (031128) Mohd Hafiz Hassan [email protected] (603) 2082 6819 CSC Steel Holdings (CSCS MK) Steeling through the storm Initiate BUY, TP MYR2.02 CSC is in a strong position within the sector to reap the benefits from the pick-up in domestic steel demand, and to plug the supply gap. It should ride the current cyclical recovery in steel prices as the international supply-demand balance is improving. Valuation is undemanding; it is trading at below the average of its 5-year historical forward PER of 10.5x. We forecast CSC’s earnings to grow at an annual double-digit pace (~15% pa) over the next two years (FY18-19). Our TP is based on 10.5x FY18F EPS. We also like CSC for its net cash position and strong free cash flow that can reward shareholders with stable dividend payouts. A big player in carbon coil industry in MY CSC has maintained a dominant presence in Malaysia’s CRC (carbon cold rolled coil) steel industry since its inception in the 1990s. CSC had 57% market share in terms of industry production in Malaysia in 2016 and we expect this to grow further due to sustainable domestic demand, restrictions on steel imports and the temporary absence of competitor Megasteel from the supply equation. Megasteel is unlikely to resume operations in the near future due to the lack of funding. Four key drivers of earnings growth We forecast a two-year earnings CAGR of 15% (FY18-19), fuelled by: (1) recovering steel demand in various key industries in Malaysia; (2) a supply gap to fill, amid the absence of Megasteel’s output and less cheap imported steel available since the imposition of anti-dumping duties last year; (3) a favourable CRC steel price outlook, translating to higher ASP for CSC of MYR2,349/2,494/MYR2,648 per mt for FY17E-FY19E (vs. estd. MYR2,061 in 2016); (4) a better product mix leading to margins uptick. A big warchest, 4-6% dividend yield CSC has been debt free since 2009 and its MYR195.7m cash on hand (equivalent to 53sen per share) provides CSC with unparalleled flexibility to fund future capacity expansion, and upgrade its plants and equipment to enhance its core competitiveness. Besides this, CSC has strong free cash flow that can cover an average of 2x its dividend payout. Share Price MYR 1.72 12m Price Target MYR 2.02 (+17%) BUY Company Description Statistics Shariah status 52w high/low (MYR) 3m avg turnover (USDm) Free float (%) Issued shares (m) Market capitalisation Major shareholders: 45.0% 4.9% 3.2% 380 0.4 CSC Steel Holdings Bhd, through its subsidiaries, manufactures and markets steel and related products. Yes China Steel Corp. Lembaga Tabung Haji TAN KIT PHENG 2.32/1.44 41.3 MYR653.6M USD152M Price Performance 80 100 120 140 160 180 200 220 240 0.80 1.00 1.20 1.40 1.60 1.80 2.00 2.20 2.40 Aug-15 Nov-15 Feb-16 May-16 Aug-16 Nov-16 Feb-17 May-17 CSC Steel - (LHS, MYR) CSC Steel / Kuala Lumpur Composite Index - (RHS, %) -1M -3M -12M Absolute (%) (4) (16) 16 Relative to index (%) (5) (16) 11 Source: FactSet FYE Dec (MYR m) FY15A FY16A FY17E FY18E FY19E Revenue 1,017 1,035 1,142 1,237 1,330 EBITDA 96 106 107 119 132 Core net profit 35 69 61 71 81 Core EPS (sen) 9.6 18.6 16.6 19.2 22.1 Core EPS growth (%) nm 94.0 (10.8) 15.7 15.0 Net DPS (sen) 8.0 14.0 8.3 9.6 11.0 Core P/E (x) 18.0 9.3 10.4 9.0 7.8 P/BV (x) 0.8 0.8 0.8 0.7 0.7 Net dividend yield (%) 4.7 8.1 4.8 5.6 6.4 ROAE (%) 6.9 8.7 7.4 8.3 9.1 ROAA (%) 4.4 8.0 6.8 7.5 8.3 EV/EBITDA (x) 1.8 4.9 3.0 2.5 2.0 Net gearing (%) (incl perps) net cash net cash net cash net cash net cash Consensus net profit - - 72 79 83 MKE vs. Consensus (%) - - (14.7) (10.3) (2.0)
-
Upload
khangminh22 -
Category
Documents
-
view
3 -
download
0
Transcript of CSC Steel Holdings (CSCS MK) - Maybank Kim Eng
August 21, 2017
Mate
rials
M
ala
ysi
a
THIS REPORT HAS BEEN PREPARED BY MAYBANK INVESTMENT BANK BERHAD
SEE PAGE 36 FOR IMPORTANT DISCLOSURES AND ANALYST CERTIFICATIONS
PP16832/01/2013 (031128)
Mohd Hafiz Hassan [email protected] (603) 2082 6819
CSC Steel Holdings (CSCS MK)
Steeling through the storm
Initiate BUY, TP MYR2.02
CSC is in a strong position within the sector to reap the benefits from the
pick-up in domestic steel demand, and to plug the supply gap. It should
ride the current cyclical recovery in steel prices as the international
supply-demand balance is improving. Valuation is undemanding; it is
trading at below the average of its 5-year historical forward PER of
10.5x. We forecast CSC’s earnings to grow at an annual double-digit pace
(~15% pa) over the next two years (FY18-19). Our TP is based on 10.5x
FY18F EPS. We also like CSC for its net cash position and strong free cash
flow that can reward shareholders with stable dividend payouts.
A big player in carbon coil industry in MY
CSC has maintained a dominant presence in Malaysia’s CRC (carbon cold
rolled coil) steel industry since its inception in the 1990s. CSC had 57%
market share in terms of industry production in Malaysia in 2016 and we
expect this to grow further due to sustainable domestic demand,
restrictions on steel imports and the temporary absence of competitor
Megasteel from the supply equation. Megasteel is unlikely to resume
operations in the near future due to the lack of funding.
Four key drivers of earnings growth
We forecast a two-year earnings CAGR of 15% (FY18-19), fuelled by: (1)
recovering steel demand in various key industries in Malaysia; (2) a
supply gap to fill, amid the absence of Megasteel’s output and less cheap
imported steel available since the imposition of anti-dumping duties last
year; (3) a favourable CRC steel price outlook, translating to higher ASP
for CSC of MYR2,349/2,494/MYR2,648 per mt for FY17E-FY19E (vs. estd.
MYR2,061 in 2016); (4) a better product mix leading to margins uptick.
A big warchest, 4-6% dividend yield
CSC has been debt free since 2009 and its MYR195.7m cash on hand
(equivalent to 53sen per share) provides CSC with unparalleled flexibility
to fund future capacity expansion, and upgrade its plants and equipment
to enhance its core competitiveness. Besides this, CSC has strong free
cash flow that can cover an average of 2x its dividend payout.
Share Price MYR 1.72
12m Price Target MYR 2.02 (+17%)
BUY
Company Description
Statistics
Shariah status
52w high/low (MYR)
3m avg turnover (USDm)
Free float (%)
Issued shares (m)
Market capitalisation
Major shareholders:
45.0%
4.9%
3.2%
380
0.4
CSC Steel Holdings Bhd, through its subsidiaries,
manufactures and markets steel and related
products.
Yes
China Steel Corp.
Lembaga Tabung Haji
TAN KIT PHENG
2.32/1.44
41.3
MYR653.6M
USD152M
Price Performance
80
100
120
140
160
180
200
220
240
0.80
1.00
1.20
1.40
1.60
1.80
2.00
2.20
2.40
Aug-15 Nov-15 Feb-16 May-16 Aug-16 Nov-16 Feb-17 May-17
CSC Steel - (LHS, MYR) CSC Steel / Kuala Lumpur Composite Index - (RHS, %)
-1M -3M -12M
Absolute (%) (4) (16) 16
Relative to index (%) (5) (16) 11
Source: FactSet
FYE Dec (MYR m) FY15A FY16A FY17E FY18E FY19E
Revenue 1,017 1,035 1,142 1,237 1,330
EBITDA 96 106 107 119 132
Core net profit 35 69 61 71 81
Core EPS (sen) 9.6 18.6 16.6 19.2 22.1
Core EPS growth (%) nm 94.0 (10.8) 15.7 15.0
Net DPS (sen) 8.0 14.0 8.3 9.6 11.0
Core P/E (x) 18.0 9.3 10.4 9.0 7.8
P/BV (x) 0.8 0.8 0.8 0.7 0.7
Net dividend yield (%) 4.7 8.1 4.8 5.6 6.4
ROAE (%) 6.9 8.7 7.4 8.3 9.1
ROAA (%) 4.4 8.0 6.8 7.5 8.3
EV/EBITDA (x) 1.8 4.9 3.0 2.5 2.0
Net gearing (%) (incl perps) net cash net cash net cash net cash net cash
Consensus net profit - - 72 79 83
MKE vs. Consensus (%) - - (14.7) (10.3) (2.0)
August 21, 2017 2
CSC Steel Holdings
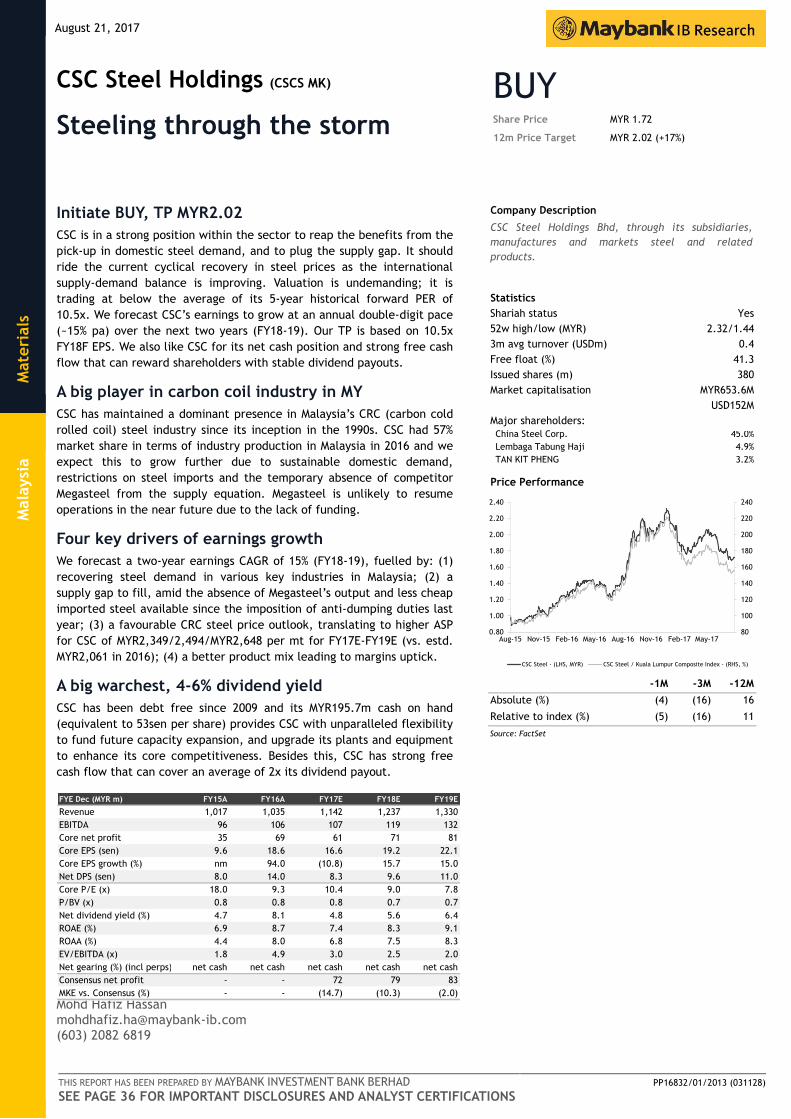
6.7%
7.6%7.2%
8.0%
8.9%
7.3%
8.3%7.9%
8.8%
9.8%
0.0%
2.0%
4.0%
6.0%
8.0%
10.0%
12.0%
FY15 FY16 FY17E FY18E FY19E
Return on assets Return on equity
0%
2%
4%
6%
8%
10%
12%
0
10
20
30
40
50
60
70
80
90
FY15 FY16 FY17E FY18E FY19E
MYR'm FCF (LHS) Div payout (LHS) Div yield (RHS) FCF yield
Value Proposition
Excluding Megasteel, CSC dominates in CRC production in
Malaysia with ~57% market share. Well positioned to plug
industry supply gap amid reducing imports.
CSC seeks to increase production of value-added products,
GI and PPGI, so that the company can stay profitable
throughout the varying market cycles.
The imposition of anti-dumping duties in Malaysia will
protect domestic CRC producers and support ASP and allow
CSC to expand production.
Debt-free and solid cash pile provides CSC the flexibility
to invest in any areas of needed improvements.
ROE to continue to improve from 7.3% in FY15 to 9.8% in
FY19, through better margins and asset utilisation.
ROE & ROA trends
Source: Company (data), Maybank KE
Price Drivers
Historical share price trend
Source: Company (data), Maybank KE
1. Share price plummeted as CSC plunged to a loss for FY14
due to provisions for MYR12.9m of doubtful debt. This
was caused by a weak steel market as steel prices fell.
2. The Malaysian government imposed anti-dumping duties
of 12.06% to 52.01% on PPGI imports from China and
Vietnam for five years from Jan 2016.
3. Imposition of anti-dumping duties of 3.06% to 23.78% for
five years for CRC products from China, South Korea, and
Vietnam in May 2016 was a huge relief.
4. China’s CRC inventory fell due to solid demand and
capacity cuts in China. This led to better pricing along
the steel value chain, including global CRC prices.
Financial Metrics
CSC operates 480,000 mtpa of CRC capacity at 90%
utilisation rate.
Growth will be supported by both GI and PPGI production
lines, which are still at immature stage.
Improving global steel price outlook will translate to
higher ASP.
Margins improvement from better product mix, ie. from
PPGI.
CSC is committed to 50% dividend payout ratio.
CSC has strong FCF with positive yields at 10% last year
and we expect this to rise to 11% in FY19.
FCF & dividend trends
Source: Company (data), Maybank KE
Swing Factors
Upside
Higher-than-expected average CRC selling price.
Robust steel consumption due to faster-than-expected
economic growth.
Stronger sale of higher margin, value-added products.
Increase in rates, extensions and wider coverage of the
existing anti-dumping duties.
Downside
Megasteel resumes CRC operation and ramps up
production.
A drastic decline in steel demand due to weaker-than-
expected economic growth.
Increased volatility in steel prices, especially if supply in
China is not sufficiently curbed.
60
80
100
120
140
160
180
200
220
0.80
1.00
1.20
1.40
1.60
1.80
2.00
2.20
2.40
Aug-12 Aug-13 Aug-14 Aug-15 Aug-16
CSC Steel - (LHS, MYR) CSC Steel / MSCI AC Asia ex JP - (RHS, %)
1
1
2
3
4
August 21, 2017 3
CSC Steel Holdings
Table of Contents
1. Investment thesis .................................................................................................................... 4
2. Focus Charts .......................................................................................................................... 6
3. Corporate Information .............................................................................................................. 7
4. Moving up the value chain .......................................................................................................... 10
5. Plugging the growth and supply gaps ............................................................................................. 10
6. Better pricing will improve bottomline .......................................................................................... 15
7. Protection from the Malaysian government ..................................................................................... 18
8. Financial analysis .................................................................................................................... 19
9. Valuations ............................................................................................................................. 23
10. Risks .................................................................................................................................... 27
11. Appendix ............................................................................................................................... 28

August 21, 2017 4
CSC Steel Holdings
Investment thesis
In a strong position for higher production
CSC has maintained a dominant presence in Malaysia’s CRC (carbon cold rolled
coil) industry. It has 45% share of the country’s 1.06m mtpa of active installed
production capacity. If including Megasteel’s 1.45m mtpa capacity, which ceased
operations in 2016, CSC would have 19.1% share of Malaysia’s total installed
capacity. In terms of production, CSC’s share is bigger, at 57% (Fig 1). With plant
capacity of 480,000 mtpa, CSC has made inroads into the CRC market over the
past three years. This was despite a lacklustre domestic steel market and
increase in CRC imports. All the while, competitors’ output was relatively
stagnant. CSC is in a strong position to capture a greater share of production and
to plug the supply gap as the market had been reliant on imported CRC. Imports
of CRC peaked at 1.10m mt in 2015 to fill the supply gap between net production
(excluding exports) of 502,000 mtpa and domestic consumption of 1.6m mtpa.
Moving up the value chain
CSC is moving up the value chain into galvanized iron (GI) and pre-painted
galvanized iron (PPGI) products to diversify its revenue sources and to improve
margins. There is ample room for CSC’s GI and PPGI production to grow as
utilisation rates are still low at 68% and 58% respectively. These products are
priced at a premium to conventional CRC products. This will help CSC to boost
margins. CSC’s revenue has been relatively stable in recent years despite the
decline in (hot rolled coil) HRC and CRC prices in China. Even more surprising,
CSC’s core net profit margin expanded from a low of 1.7% in FY11 to 2.4% in FY15
during turbulent times for steel prices.
Sustainability of domestic demand
The latest reading of Malaysia’s index of leading economic indicators shows a
positive trend after the better-than-expected 1Q17 GDP, signalling sustainable
momentum in economic activities. This should bode well for steel consumption,
and we believe CSC’s CRC will be mostly supplied to domestic industries. We
expect CSC to benefit from sustained/increasing orders from downstream
manufacturers in various steel-consuming sectors. Taking the improved outlook
into consideration, we expect CSC to increase CRC production to approximately
434,000/442,000/451,000 mtpa at capacity utilisation rates of 91%/92%/94% in
FY17E/FY18E/FY19E from 432,000 mt in FY16. Growth rates of CRC production
are approximately 1.8-2% pa.
Better pricing will improve bottomline
A silver lining for the sector has been the recovery in the ASP of CRC, led by a
broad-base upturn in China steel prices, which serve as the benchmark for
international steel prices. This ASP recovery has been due to the improvement in
China’s macro data recently and the government’s effort to curb steel
overcapacity. All these point to stronger CRC demand and ASP outlook. The price
of CRC globally was under stress in recent years due to supply imbalances caused
by dumping by China, which in turn led to oversupply in the international steel
market. We expect further improvement in the steel supply-demand balance in
the international market will help to stimulate CRC prices globally. We forecast
CSC’s CRC ASP to be MYR2,349/MYR2,494/MYR2,648 per mt for FY17E-FY19E, vs
an estimated average of MYR2,061 per mt in FY16.
Excluding Megasteel, CSC’s market share by installed capacity
Source: Companies, MISIF
45%
25%
19%
11%
CSC Steel Bhd
Mycron Steel Bhd
YKGI Bhd
Eonmetall Group
August 21, 2017 5
CSC Steel Holdings
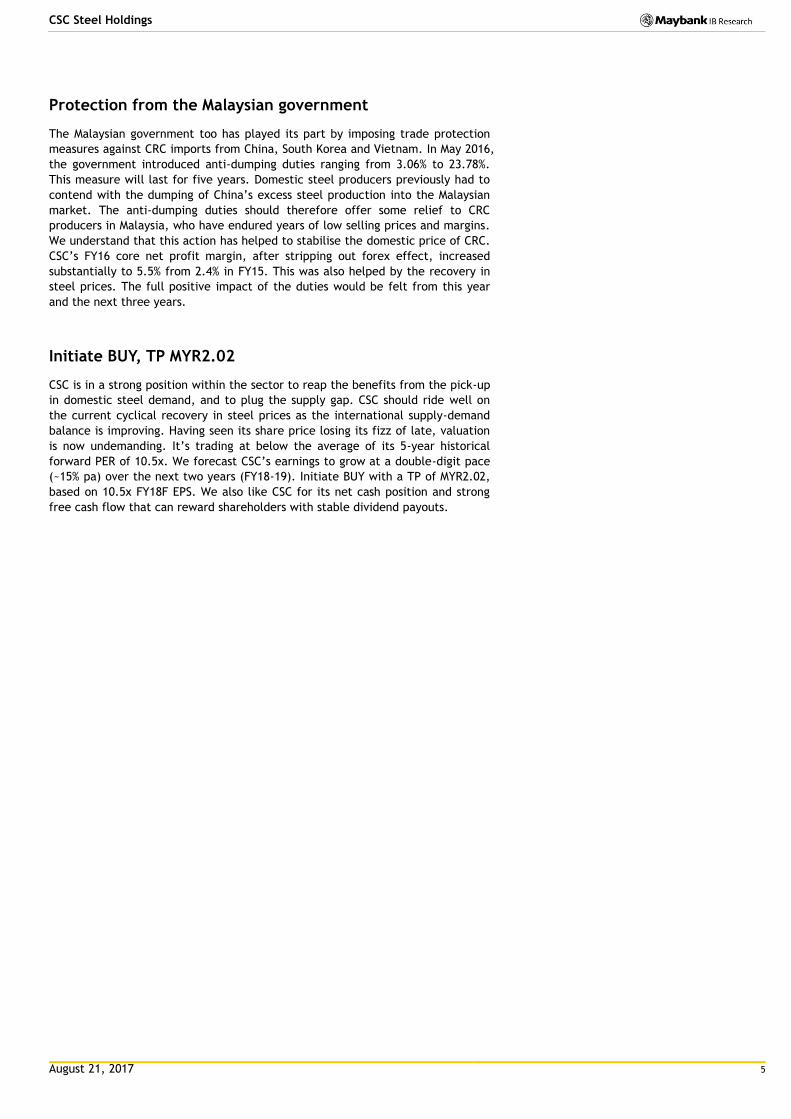
Protection from the Malaysian government
The Malaysian government too has played its part by imposing trade protection
measures against CRC imports from China, South Korea and Vietnam. In May 2016,
the government introduced anti-dumping duties ranging from 3.06% to 23.78%.
This measure will last for five years. Domestic steel producers previously had to
contend with the dumping of China’s excess steel production into the Malaysian
market. The anti-dumping duties should therefore offer some relief to CRC
producers in Malaysia, who have endured years of low selling prices and margins.
We understand that this action has helped to stabilise the domestic price of CRC.
CSC’s FY16 core net profit margin, after stripping out forex effect, increased
substantially to 5.5% from 2.4% in FY15. This was also helped by the recovery in
steel prices. The full positive impact of the duties would be felt from this year
and the next three years.
Initiate BUY, TP MYR2.02
CSC is in a strong position within the sector to reap the benefits from the pick-up
in domestic steel demand, and to plug the supply gap. CSC should ride well on
the current cyclical recovery in steel prices as the international supply-demand
balance is improving. Having seen its share price losing its fizz of late, valuation
is now undemanding. It’s trading at below the average of its 5-year historical
forward PER of 10.5x. We forecast CSC’s earnings to grow at a double-digit pace
(~15% pa) over the next two years (FY18-19). Initiate BUY with a TP of MYR2.02,
based on 10.5x FY18F EPS. We also like CSC for its net cash position and strong
free cash flow that can reward shareholders with stable dividend payouts.
August 21, 2017 6
CSC Steel Holdings
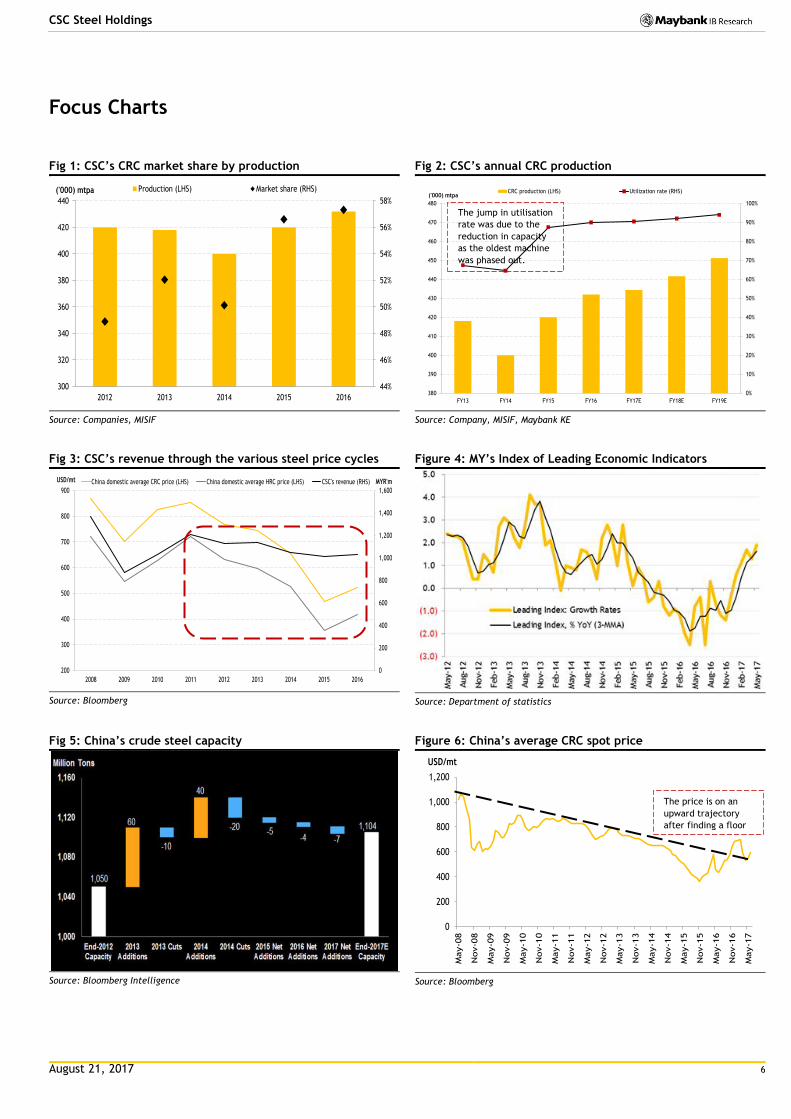
Focus Charts
Fig 1: CSC’s CRC market share by production
Source: Companies, MISIF
Fig 2: CSC’s annual CRC production
Source: Company, MISIF, Maybank KE
Fig 3: CSC’s revenue through the various steel price cycles
Source: Bloomberg
Figure 4: MY’s Index of Leading Economic Indicators
Source: Department of statistics
Fig 5: China’s crude steel capacity
Source: Bloomberg Intelligence
Figure 6: China’s average CRC spot price
Source: Bloomberg
44%
46%
48%
50%
52%
54%
56%
58%
300
320
340
360
380
400
420
440
2012 2013 2014 2015 2016
('000) mtpa Production (LHS) Market share (RHS)
0%
10%
20%
30%
40%
50%
60%
70%
80%
90%
100%
380
390
400
410
420
430
440
450
460
470
480
FY13 FY14 FY15 FY16 FY17E FY18E FY19E
('000) mtpaCRC production (LHS) Utilization rate (RHS)
0
200
400
600
800
1,000
1,200
1,400
1,600
200
300
400
500
600
700
800
900
2008 2009 2010 2011 2012 2013 2014 2015 2016
MYR'mUSD/mt China domestic average CRC price (LHS) China domestic average HRC price (LHS) CSC's revenue (RHS)
0
200
400
600
800
1,000
1,200
May-0
8
Nov-0
8
May-0
9
Nov-0
9
May-1
0
Nov-1
0
May-1
1
Nov-1
1
May-1
2
Nov-1
2
May-1
3
Nov-1
3
May-1
4
Nov-1
4
May-1
5
Nov-1
5
May-1
6
Nov-1
6
May-1
7
USD/mt
The jump in utilisation
rate was due to the
reduction in capacity
as the oldest machine
was phased out.
The price is on an
upward trajectory
after finding a floor

August 21, 2017 7
CSC Steel Holdings
Corporate Information
The market leader
CSC Steel Holdings Bhd, previously known as Ornasteel Holdings Bhd, was listed
on the main board of Bursa Malaysia on 30 Dec 2004. CSC is a mid-stream player
in the steel value chain. CSC has the capacity to produce 480,000 mt of CRC steel
pa (inclusive of 40,000 mtpa of pickled and oiled steel). CSC also has the
capacity to produce 240,000 mt of GI and 120,000 mt of PPGI steel annually.
If we exclude Megasteel, CSC is the largest manufacturer of CRC in Malaysia by
installed capacity with 45% market share. In terms of production, CSC has 57%
market share.
Megasteel’s flat steel products plant in Selangor was shut down in 2016 due to its
dire financial condition as it had accumulated losses of MYR2.4b as at FY15 and it
defaulted on a banker’s acceptance payment. The situation was exacerbated by
the fact that no fresh orders were coming in. We believe Megasteel will not be
able to resume production in the near future due to the lack of capital.
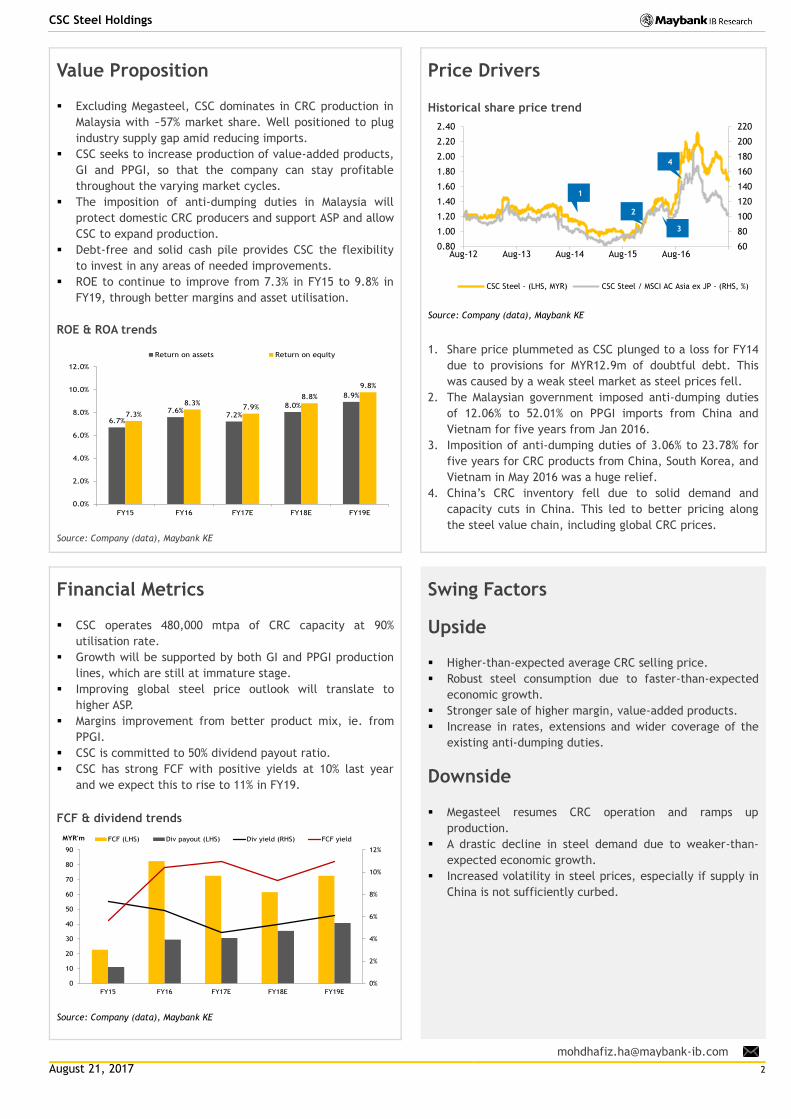
Room for further market share gains
CSC’s CRC production dropped to a low of 303,000 mt in 2009 (after peaking at
508,000 mt in 2008) due to the decline in steel prices following the global
financial crisis. Since then, however, CSC’s production has gradually rebounded
and it hit a recent high of 432,000 mt in 2016 (at 90% utilisation rate).
CSC has been on a roll (modest growth of 3-5% pa in production) since
Megasteel’s last output of 50,000mt in 2014 by taking advantage of the
opportunity to fill the supply gap in the industry (Fig 7).
We believe resumption of production by Megasteel in the future (if any) would
not be a threat to CSC’s market share as the former lacks the technical know-
how. In fact, Megasteel had experienced falling output and over the past five
years to 2014, production was less than 5% of its huge capacity.
Fig 7: Production of CRC in Malaysia
Source: Company, MISIF
60
50
25
25
25
110
105
120
110
110
204
180
203
187
187
420
418
400
420
432
65
50
50
0
0
0 100 200 300 400 500 600 700 800 900 1,000
2012
2013
2014
2015
2016
('000) mt/y
Eonmetall Group Bhd YKGI Bhd Mycron Steel Bhd CSC Steel Bhd Megasteel Sdn Bhd
August 21, 2017 8
CSC Steel Holdings
CSC’s position has also strengthened over the past three years despite the
lacklustre domestic steel market and increase in CRC imports while its
competitors’ output has been relatively constant. Therefore, we think CSC is in a
strong position to capture a bigger share of production to plug the supply gap as
the market had been reliant on imported CRC.
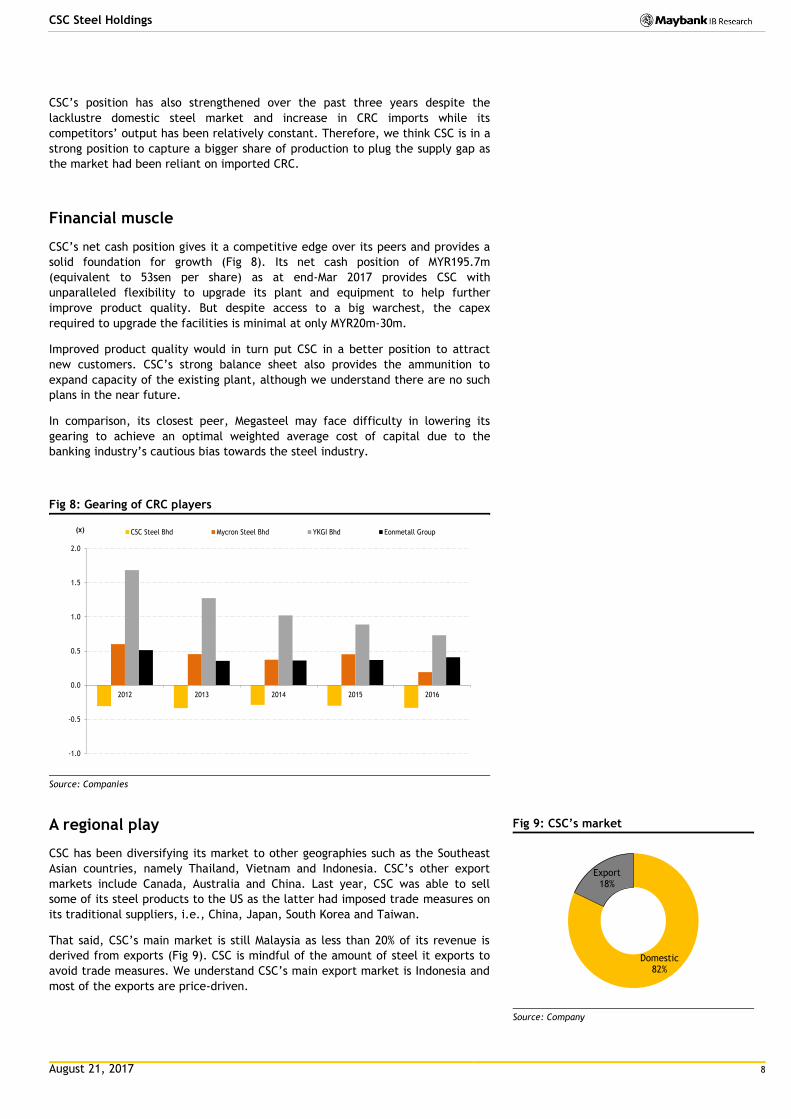
Financial muscle
CSC’s net cash position gives it a competitive edge over its peers and provides a
solid foundation for growth (Fig 8). Its net cash position of MYR195.7m
(equivalent to 53sen per share) as at end-Mar 2017 provides CSC with
unparalleled flexibility to upgrade its plant and equipment to help further
improve product quality. But despite access to a big warchest, the capex
required to upgrade the facilities is minimal at only MYR20m-30m.
Improved product quality would in turn put CSC in a better position to attract
new customers. CSC’s strong balance sheet also provides the ammunition to
expand capacity of the existing plant, although we understand there are no such
plans in the near future.
In comparison, its closest peer, Megasteel may face difficulty in lowering its
gearing to achieve an optimal weighted average cost of capital due to the
banking industry’s cautious bias towards the steel industry.
Fig 8: Gearing of CRC players
Source: Companies
A regional play
CSC has been diversifying its market to other geographies such as the Southeast
Asian countries, namely Thailand, Vietnam and Indonesia. CSC’s other export
markets include Canada, Australia and China. Last year, CSC was able to sell
some of its steel products to the US as the latter had imposed trade measures on
its traditional suppliers, i.e., China, Japan, South Korea and Taiwan.
That said, CSC’s main market is still Malaysia as less than 20% of its revenue is
derived from exports (Fig 9). CSC is mindful of the amount of steel it exports to
avoid trade measures. We understand CSC’s main export market is Indonesia and
most of the exports are price-driven.
-1.0
-0.5
0.0
0.5
1.0
1.5
2.0
2012 2013 2014 2015 2016
(x) CSC Steel Bhd Mycron Steel Bhd YKGI Bhd Eonmetall Group
Fig 9: CSC’s market
Source: Company
Domestic82%
Export18%

August 21, 2017 9
CSC Steel Holdings
Reliable raw material source is imperative
About 84% of CSC’s cost of goods sold comprises of raw materials, of which 80-
95% is hot rolled coil (HRC), zinc and paint, which are denominated in USD. HRC
is mainly supplied by its parent company, CSC of Taiwan, and a related company,
CSGT Metals Vietnam Joint Stock Company (CSMV) in Vietnam (a joint
venture of six shareholders, inclusive CSC of Taiwan and CSC of Malaysia) .
We understand that there is no transfer pricing by them.
Having support from its parent and a related company has major advantages,
such as: (i) an uninterrupted source of raw material supply; and (ii) cost savings
on logistics through bulk procurement from Vietnam. That said, the savings might
not be significant as the cost makes up less than 10% of total cost of goods sold.
Megasteel was previously the only HRC producer in Malaysia. But as Megasteel
has suspended production of HRC, Malaysian CRC producers will struggle to find a
reliable supplier, hence affecting output. Based on our channel checks, however,
CSC does not have a price advantage over the other CRC producers in terms of
HRC supply after taking into account the logistics costs and forex impact.
In terms of net forex impact, CSC’s net profit is exposed to 55-60% in the
movement of the USD. Based on our sensitivity analysis, every 3% appreciation in
the USD vs MYR would reduce our net profit estimate by 1.3-2% for FY17E-FY19E.

August 21, 2017 10
CSC Steel Holdings
Moving up the value chain
Value-added product mix through the cycle
Much of CSC’s focus has been centred on increasing contributions from GI and
PPGI steel products as these have higher margins. It has been a gradual and
flexible process subject to the market situation. Almost two-thirds of CSC’s
revenue last year comprised of valued-added steel products, namely GI and PPGI
(Fig 10).
As CSC produces CRC, this gives it the flexibility to rapidly change its product mix
as CRC is the feedstock for GI and PPGI. In addition, CSC has ample room to
increase GI and PPGI output as it’s operating at only 68% and 58% utilisation rate,
respectively.
Figure 10: CSC’s revenue breakdown
Source: Source: Company, Maybank KE
Fig 11: Revenue through the various steel price cycles
Source: Company, Bloomberg
As steel producers’ revenues are naturally vulnerable to fluctuations in steel
prices, CSC’s strategy has been to move up the value chain to diversify its
revenue sources and to improve profit margins.
These products are priced at a premium to the conventional CRC products as
they provide better corrosion protection. This strategy has been successful in
maintaining revenue stability for CSC throughout the various steel price cycles,
and even during the difficult pricing environment in 2011-2014.
CSC’s revenue has been relatively stable in recent years despite the decline in
HRC and CRC prices in China (Fig 11). This may be partly due to the higher ASP of
its GI and PPGI steel, even though production volume is relatively small
compared to its CRC output. Its core net profit margin also expanded from a low
of 1.7% in FY11 to 2.4% in FY15 during market turbulence when steel prices faced
downward pressure.
For every 3% decline in CSC’s PPGI steel ASP from our base-case price, assuming
other things remain constant, this would reduce our core net profit estimates by
8-9% for FY17E-FY19E.
468.2 474.3435.4 422.5 430.0
470.7 493.8530.6
401.8 407.0
373.4362.4 369.0
421.0
469.6
506.4
257.1 260.4
239.0232.0 236.1
250.7
273.3
293.0
0
200
400
600
800
1,000
1,200
1,400
FY12 FY13 FY14 FY15 FY16 FY17E FY18E FY19E
MYR'm Cold rolled coil (CRC) Hot-dipped galvanized (GI) Pre-painted galvanized (PPGI)
0
200
400
600
800
1,000
1,200
1,400
1,600
200
300
400
500
600
700
800
900
2008 2009 2010 2011 2012 2013 2014 2015 2016
MYR'mUSD/mt China domestic average CRC price (LHS) China domestic average HRC price (LHS) CSC's revenue (RHS)
August 21, 2017 11
CSC Steel Holdings
Plugging the growth and supply gaps
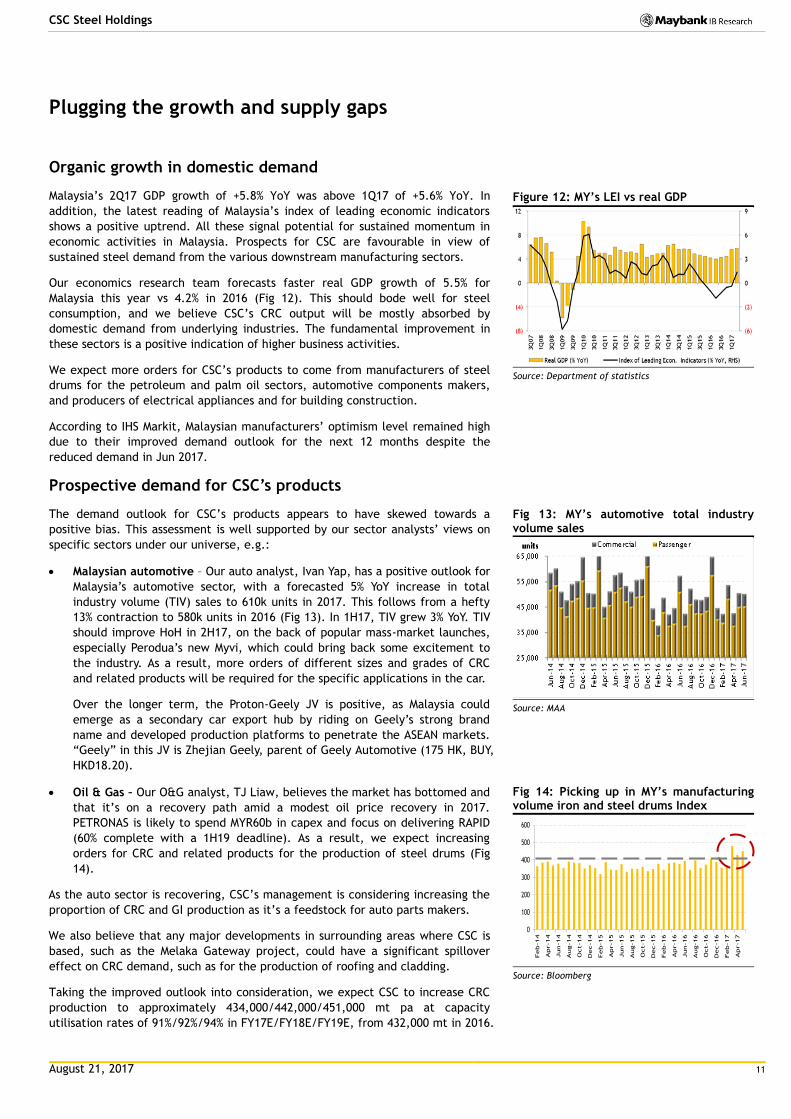
Organic growth in domestic demand
Malaysia’s 2Q17 GDP growth of +5.8% YoY was above 1Q17 of +5.6% YoY. In
addition, the latest reading of Malaysia’s index of leading economic indicators
shows a positive uptrend. All these signal potential for sustained momentum in
economic activities in Malaysia. Prospects for CSC are favourable in view of
sustained steel demand from the various downstream manufacturing sectors.
Our economics research team forecasts faster real GDP growth of 5.5% for
Malaysia this year vs 4.2% in 2016 (Fig 12). This should bode well for steel
consumption, and we believe CSC’s CRC output will be mostly absorbed by
domestic demand from underlying industries. The fundamental improvement in
these sectors is a positive indication of higher business activities.
We expect more orders for CSC’s products to come from manufacturers of steel
drums for the petroleum and palm oil sectors, automotive components makers,
and producers of electrical appliances and for building construction.
According to IHS Markit, Malaysian manufacturers’ optimism level remained high
due to their improved demand outlook for the next 12 months despite the
reduced demand in Jun 2017.
Prospective demand for CSC’s products
The demand outlook for CSC’s products appears to have skewed towards a
positive bias. This assessment is well supported by our sector analysts’ views on
specific sectors under our universe, e.g.:
Malaysian automotive – Our auto analyst, Ivan Yap, has a positive outlook for
Malaysia’s automotive sector, with a forecasted 5% YoY increase in total
industry volume (TIV) sales to 610k units in 2017. This follows from a hefty
13% contraction to 580k units in 2016 (Fig 13). In 1H17, TIV grew 3% YoY. TIV
should improve HoH in 2H17, on the back of popular mass-market launches,
especially Perodua’s new Myvi, which could bring back some excitement to
the industry. As a result, more orders of different sizes and grades of CRC
and related products will be required for the specific applications in the car.
Over the longer term, the Proton-Geely JV is positive, as Malaysia could
emerge as a secondary car export hub by riding on Geely’s strong brand
name and developed production platforms to penetrate the ASEAN markets.
“Geely” in this JV is Zhejian Geely, parent of Geely Automotive (175 HK, BUY,
HKD18.20).
Oil & Gas – Our O&G analyst, TJ Liaw, believes the market has bottomed and
that it’s on a recovery path amid a modest oil price recovery in 2017.
PETRONAS is likely to spend MYR60b in capex and focus on delivering RAPID
(60% complete with a 1H19 deadline). As a result, we expect increasing
orders for CRC and related products for the production of steel drums (Fig
14).
As the auto sector is recovering, CSC’s management is considering increasing the
proportion of CRC and GI production as it’s a feedstock for auto parts makers.
We also believe that any major developments in surrounding areas where CSC is
based, such as the Melaka Gateway project, could have a significant spillover
effect on CRC demand, such as for the production of roofing and cladding.
Taking the improved outlook into consideration, we expect CSC to increase CRC
production to approximately 434,000/442,000/451,000 mt pa at capacity
utilisation rates of 91%/92%/94% in FY17E/FY18E/FY19E, from 432,000 mt in 2016.
Figure 12: MY’s LEI vs real GDP
Source: Department of statistics
Fig 13: MY’s automotive total industry volume sales
Source: MAA
Fig 14: Picking up in MY’s manufacturing volume iron and steel drums Index
Source: Bloomberg
0
100
200
300
400
500
600
Feb-14
Apr-14
Jun-14
Aug-14
Oct-14
Dec-14
Feb-15
Apr-15
Jun-15
Aug-15
Oct-15
Dec-15
Feb-16
Apr-16
Jun-16
Aug-16
Oct-16
Dec-16
Feb-17
Apr-17

August 21, 2017 12
CSC Steel Holdings
Growth rates of CSC’s CRC production are approximately 1.8-2% pa. Although
room for growth in CRC output is limited as capacity maxes out at near 100%,
CSC’s revenue growth will be supported by the increase in GI and PPGI
production. CSC has considerable upside in GI and PPGI output as it’s still
operating at only 60-70% capacity utilisation given CSC is still exploring these two
product areas. Revenue contributions from CRC should gradually decline (Fig 15).
CSC’s principal markets
CSC sells its products to downstream manufacturers and service centres. As such,
demand is dependent on the growth of the manufacturing industries (Fig 16),
which are directly linked to the health of both the domestic and global economy.
CSC’s products are mainly sold to the following principle domestic markets:
Fig 16: Principal markets for CSC’s products
Product Principle market Application
CRC
Service centres Cutting, slitting, pressing and shaping of CRC for manufacturers of household products and industrial items
Drum makers Mainly for the manufacturing of drums for storage of palm oil, chemicals and petroleum products
Manufacturers Manufacturing of furniture, electronic and/or electrical home appliances and automobile parts
Pipe and tube makers Most of the pipe tube makers manufacture furniture for the export market
GI and PPGI Manufacturers Manufacturing of roofing sheets, steel truss, steel trunks and air ducts
Source: Company
Major customers will continue to support demand
The group has many long-established customers, with relationships dating back
over 15 years. These customers have contributed significantly to the group over
the years and some of them are public listed companies on Bursa Malaysia. We
understand that the group’s top 10 customers contribute not less than 30% of
group revenue.
Low capacity utilisation – supply availability
Like most other steel products in Malaysia, CSC’s CRC is meant primarily for
domestic consumption with only small quantities exported. There are only five
local producers of CRC sheets, namely CSC, Mycron Steel, YKGI Holdings,
Eonmetall Group and Megasteel, which have a combined capacity of 2.75m mtpa.
The production of CRC in Malaysia was reasonably steady at above 800,000 mt
before declining substantially to 742,000 mt in 2015, with utilisation rate of only
29.6% (Fig 17). This was primarily due to the suspension of output from Megasteel
as it had received no fresh orders for two years.
Based on our channel checks, CRC production in 2016 grew slightly to 754,000mt
with capacity utilisation of 30% (including Megasteel’s capacity) owing to higher
production by CSC. If we exclude Megasteel from the statistics due to the
temporary suspension of its operation last year, the industry’s capacity
utilisation was still low at only 71.1%.
Fig 15: Products’ contribution to revenue
Source: Company, Maybank KE
0%
5%
10%
15%
20%
25%
30%
35%
40%
45%
FY15 FY16 FY17E FY18E FY19E
CRC GI PPGI

August 21, 2017 13
CSC Steel Holdings
Fig 17: CRC production in Malaysia
Source: MISIF
Despite Malaysia’s large installed capacity of CRC, it still needs to import other
grades and qualities of CRC that are not readily available locally. As CSC and a
few other producers have been continuously upgrading their plants, we expect
their production quality to move towards higher grades to meet the local demand.
We understand the domestic market has also been overwhelmed by the influx of
cheaper imports of “boron-added” steel products. These imported products are
of a lower quality and they are used by downstream manufacturers mostly in the
steel tube and furniture sectors.
Imports of CRC peaked at 1.10m mt in 2015 to fill the supply gap between net
production (excluding exports) of 502,000 mtpa and domestic consumption of
1.6m mtpa (Fig 18). The imposition of anti-dumping duties for CRC in mid-2016
should reduce the inflow of these low-priced steel materials into the market and
help to improve the utilisation rate of domestic players.
Fig 18: Production vs consumption, exports vs imports of CRC
Source: MISIF
28%
29%
29%
30%
30%
31%
31%
32%
32%
680
700
720
740
760
780
800
820
840
860
880
2011 2012 2013 2014 2015
('000) mt CRC production (LHS) Capacity utilisation (RHS)
0
200
400
600
800
1,000
1,200
1,400
1,600
1,800
2,000
2011 2012 2013 2014 2015
('000) mt Production Import Export Consumption
Supply and demand gap
August 21, 2017 14
CSC Steel Holdings
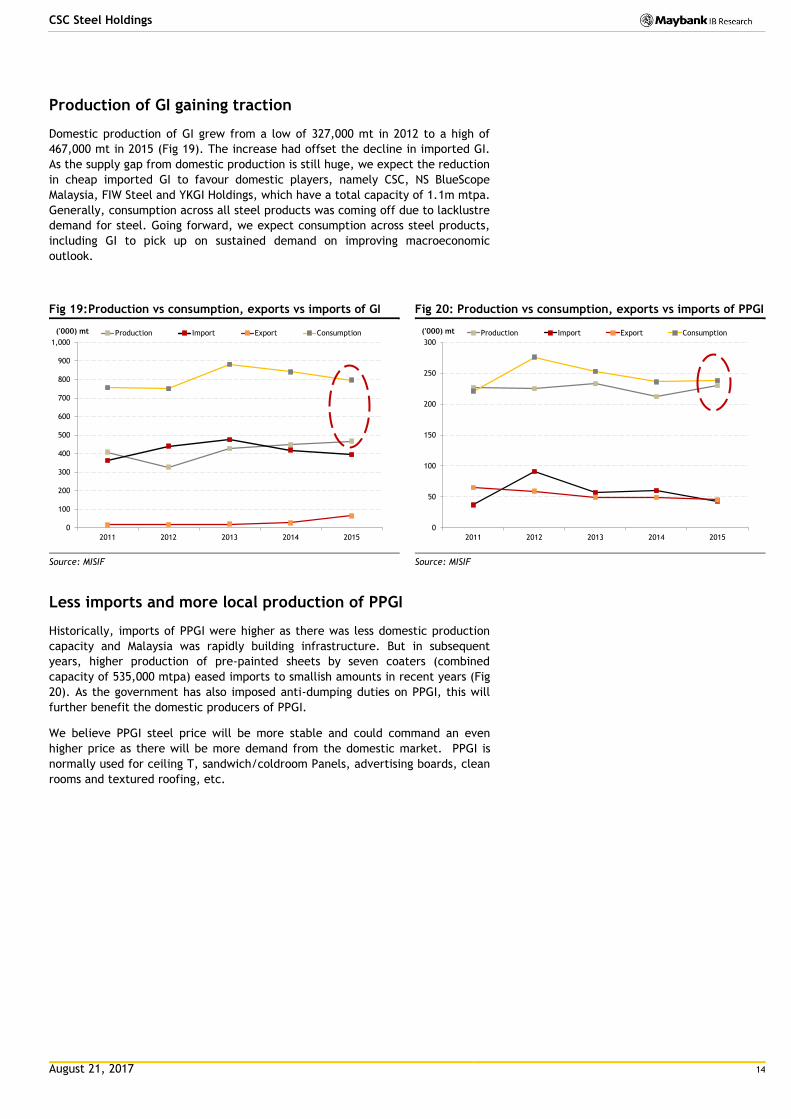
Production of GI gaining traction
Domestic production of GI grew from a low of 327,000 mt in 2012 to a high of
467,000 mt in 2015 (Fig 19). The increase had offset the decline in imported GI.
As the supply gap from domestic production is still huge, we expect the reduction
in cheap imported GI to favour domestic players, namely CSC, NS BlueScope
Malaysia, FIW Steel and YKGI Holdings, which have a total capacity of 1.1m mtpa.
Generally, consumption across all steel products was coming off due to lacklustre
demand for steel. Going forward, we expect consumption across steel products,
including GI to pick up on sustained demand on improving macroeconomic
outlook.
Fig 19: Production vs consumption, exports vs imports of GI
Source: MISIF
Fig 20: Production vs consumption, exports vs imports of PPGI
Source: MISIF
Less imports and more local production of PPGI
Historically, imports of PPGI were higher as there was less domestic production
capacity and Malaysia was rapidly building infrastructure. But in subsequent
years, higher production of pre-painted sheets by seven coaters (combined
capacity of 535,000 mtpa) eased imports to smallish amounts in recent years (Fig
20). As the government has also imposed anti-dumping duties on PPGI, this will
further benefit the domestic producers of PPGI.
We believe PPGI steel price will be more stable and could command an even
higher price as there will be more demand from the domestic market. PPGI is
normally used for ceiling T, sandwich/coldroom Panels, advertising boards, clean
rooms and textured roofing, etc.
0
100
200
300
400
500
600
700
800
900
1,000
2011 2012 2013 2014 2015
('000) mt Production Import Export Consumption
0
50
100
150
200
250
300
2011 2012 2013 2014 2015
('000) mt Production Import Export Consumption

August 21, 2017 15
CSC Steel Holdings
Better pricing will improve bottomline
Bright CRC price outlook but road to recovery is gradual
A silver lining for the sector has been recovery in the ASP of CRC, led by an
upturn across the board in steel prices in China, including China’s domestic CRC
spot price last year (Fig 21). Steel prices in China set the benchmark for
international prices, as China is the world’s largest steel exporter.
CRC prices were under stress in recent years around the world due to pricing
imbalances in the steel value chain (upstream-midstream-downstream), caused
by dumping by China, which in turn led to oversupply in the international steel
market. CRC products dumped by China are offered at prices below those in its
own domestic market.
Fig 21: Average CRC spot price in China
*As of end-June 2017
Source: Bloomberg
China’s average CRC spot price fell to a 10-year low of USD362/mt (equivalent to
MYR1,559) in Nov 2015 but recovered thereafter due to the country’s rosier
macro data, which indicated stronger domestic demand. The Caixin
Manufacturing PMI in China – a gauge to track steel demand outlook - rose to 51.7
in February, beating market expectations. As a result, the average CRC spot
price reached a high of USD702/mt in Feb 2017, but softened to USD535/mt in
Apr 2017 due to moderation in demand for steel and insufficient cuts in crude
steel supply.
While the price rally appears to have stalled, we believe this is likely to be only
temporary. June is traditionally a low season in China, and this would have led
traders to cut prices to reduce large inventories (Fig 22 & 23; Steelhome China
CRC – an indicator for China’s steel stockpile activities) that they had actively
stockpiled at higher prices in 1Q17.
0
200
400
600
800
1,000
1,200
May-0
8
Nov-0
8
May-0
9
Nov-0
9
May-1
0
Nov-1
0
May-1
1
Nov-1
1
May-1
2
Nov-1
2
May-1
3
Nov-1
3
May-1
4
Nov-1
4
May-1
5
Nov-1
5
May-1
6
Nov-1
6
May-1
7
USD/mt
The price is on an uptrend after finding a floor as the price outlook hinges on the level of manufacturing activities and the government’s success in cracking down on overcapacity in China.
August 21, 2017 16
CSC Steel Holdings
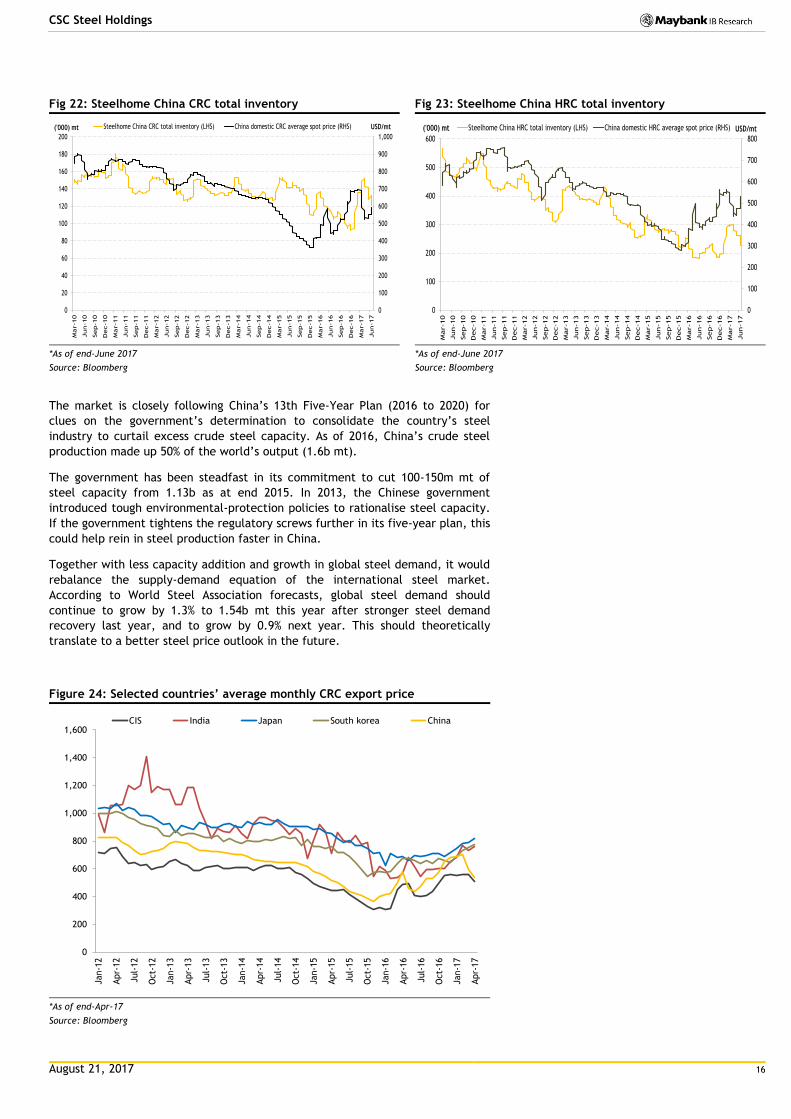
Fig 22: Steelhome China CRC total inventory
*As of end-June 2017
Source: Bloomberg
Fig 23: Steelhome China HRC total inventory
*As of end-June 2017
Source: Bloomberg
The market is closely following China’s 13th Five-Year Plan (2016 to 2020) for
clues on the government’s determination to consolidate the country’s steel
industry to curtail excess crude steel capacity. As of 2016, China’s crude steel
production made up 50% of the world’s output (1.6b mt).
The government has been steadfast in its commitment to cut 100-150m mt of
steel capacity from 1.13b as at end 2015. In 2013, the Chinese government
introduced tough environmental-protection policies to rationalise steel capacity.
If the government tightens the regulatory screws further in its five-year plan, this
could help rein in steel production faster in China.
Together with less capacity addition and growth in global steel demand, it would
rebalance the supply-demand equation of the international steel market.
According to World Steel Association forecasts, global steel demand should
continue to grow by 1.3% to 1.54b mt this year after stronger steel demand
recovery last year, and to grow by 0.9% next year. This should theoretically
translate to a better steel price outlook in the future.
Figure 24: Selected countries’ average monthly CRC export price
*As of end-Apr-17
Source: Bloomberg
0
100
200
300
400
500
600
700
800
900
1,000
0
20
40
60
80
100
120
140
160
180
200
Mar-10
Jun-10
Sep-10
Dec-10
Mar-11
Jun-11
Sep-11
Dec-11
Mar-12
Jun-12
Sep-12
Dec-12
Mar-13
Jun-13
Sep-13
Dec-13
Mar-14
Jun-14
Sep-14
Dec-14
Mar-15
Jun-15
Sep-15
Dec-15
Mar-16
Jun-16
Sep-16
Dec-16
Mar-17
Jun-17
USD/mt('000) mt Steelhome China CRC total inventory (LHS) China domestic CRC average spot price (RHS)
0
100
200
300
400
500
600
700
800
0
100
200
300
400
500
600
Mar-10
Jun-10
Sep-10
Dec-10
Mar-11
Jun-11
Sep-11
Dec-11
Mar-12
Jun-12
Sep-12
Dec-12
Mar-13
Jun-13
Sep-13
Dec-13
Mar-14
Jun-14
Sep-14
Dec-14
Mar-15
Jun-15
Sep-15
Dec-15
Mar-16
Jun-16
Sep-16
Dec-16
Mar-17
Jun-17
('000) mt USD/mtSteelhome China HRC total inventory (LHS) China domestic HRC average spot price (RHS)
0
200
400
600
800
1,000
1,200
1,400
1,600
Jan-1
2
Apr-
12
Jul-
12
Oct-
12
Jan-1
3
Apr-
13
Jul-
13
Oct-
13
Jan-1
4
Apr-
14
Jul-
14
Oct-
14
Jan-1
5
Apr-
15
Jul-
15
Oct-
15
Jan-1
6
Apr-
16
Jul-
16
Oct-
16
Jan-1
7
Apr-
17
CIS India Japan South korea China
August 21, 2017 17
CSC Steel Holdings
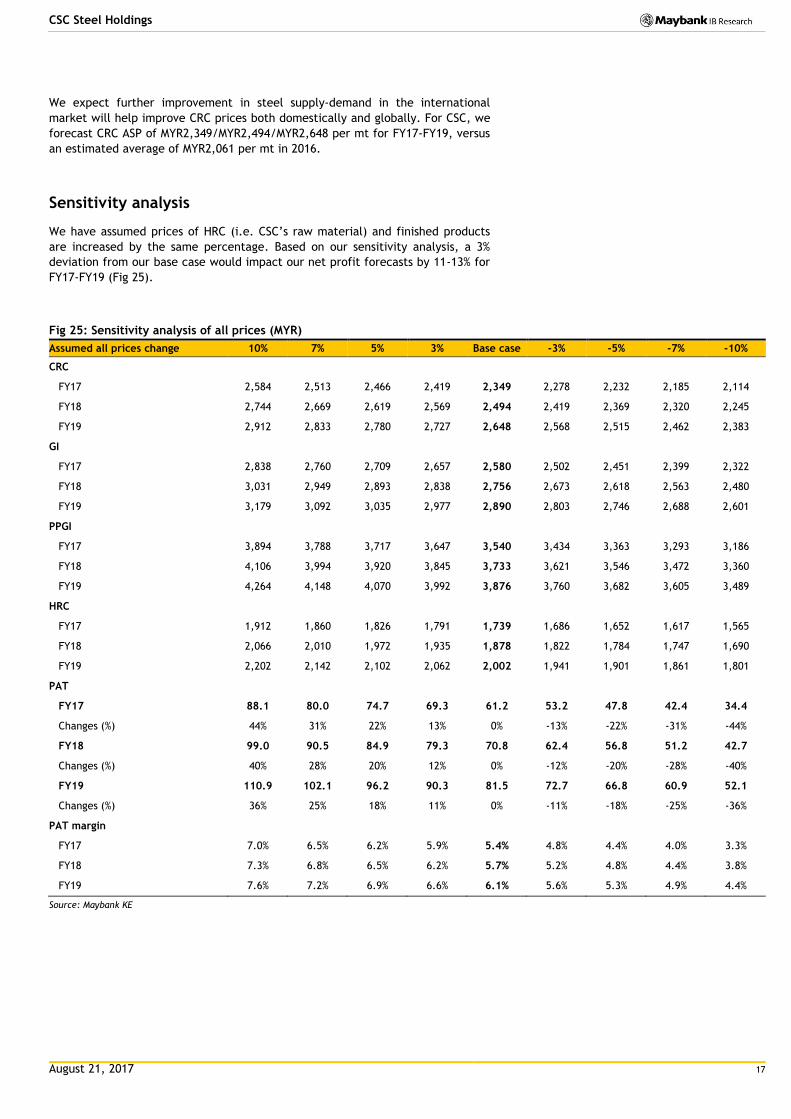
We expect further improvement in steel supply-demand in the international
market will help improve CRC prices both domestically and globally. For CSC, we
forecast CRC ASP of MYR2,349/MYR2,494/MYR2,648 per mt for FY17-FY19, versus
an estimated average of MYR2,061 per mt in 2016.
Sensitivity analysis
We have assumed prices of HRC (i.e. CSC’s raw material) and finished products
are increased by the same percentage. Based on our sensitivity analysis, a 3%
deviation from our base case would impact our net profit forecasts by 11-13% for
FY17-FY19 (Fig 25).
Fig 25: Sensitivity analysis of all prices (MYR)
Assumed all prices change 10% 7% 5% 3% Base case -3% -5% -7% -10%
CRC
FY17 2,584 2,513 2,466 2,419 2,349 2,278 2,232 2,185 2,114
FY18 2,744 2,669 2,619 2,569 2,494 2,419 2,369 2,320 2,245
FY19 2,912 2,833 2,780 2,727 2,648 2,568 2,515 2,462 2,383
GI
FY17 2,838 2,760 2,709 2,657 2,580 2,502 2,451 2,399 2,322
FY18 3,031 2,949 2,893 2,838 2,756 2,673 2,618 2,563 2,480
FY19 3,179 3,092 3,035 2,977 2,890 2,803 2,746 2,688 2,601
PPGI
FY17 3,894 3,788 3,717 3,647 3,540 3,434 3,363 3,293 3,186
FY18 4,106 3,994 3,920 3,845 3,733 3,621 3,546 3,472 3,360
FY19 4,264 4,148 4,070 3,992 3,876 3,760 3,682 3,605 3,489
HRC
FY17 1,912 1,860 1,826 1,791 1,739 1,686 1,652 1,617 1,565
FY18 2,066 2,010 1,972 1,935 1,878 1,822 1,784 1,747 1,690
FY19 2,202 2,142 2,102 2,062 2,002 1,941 1,901 1,861 1,801
PAT
FY17 88.1 80.0 74.7 69.3 61.2 53.2 47.8 42.4 34.4
Changes (%) 44% 31% 22% 13% 0% -13% -22% -31% -44%
FY18 99.0 90.5 84.9 79.3 70.8 62.4 56.8 51.2 42.7
Changes (%) 40% 28% 20% 12% 0% -12% -20% -28% -40%
FY19 110.9 102.1 96.2 90.3 81.5 72.7 66.8 60.9 52.1
Changes (%) 36% 25% 18% 11% 0% -11% -18% -25% -36%
PAT margin
FY17 7.0% 6.5% 6.2% 5.9% 5.4% 4.8% 4.4% 4.0% 3.3%
FY18 7.3% 6.8% 6.5% 6.2% 5.7% 5.2% 4.8% 4.4% 3.8%
FY19 7.6% 7.2% 6.9% 6.6% 6.1% 5.6% 5.3% 4.9% 4.4%
Source: Maybank KE
August 21, 2017 18
CSC Steel Holdings
Government protection
The Malaysian government too has played its part by imposing trade protection
measures against imports of CRC and galvanized steel products in May 2016 (Fig
26). Domestic steel producers previously had to contend with the dumping of
China’s excess steel production into the Malaysian market.
The anti-dumping duties should therefore offer some relief to CRC producers in
Malaysia, who have endured years of low selling prices and margins. These
restrictions should bring about greater stability to domestic ASP and in turn,
generate higher profitability for producers.
CSC’s FY16 core net profit margin, after stripping out forex, increased
substantially to 5.5% from 2.4% in FY15 thanks to the recovery in steel prices.
The full positive impact of the import duties would be felt from this year
onwards and over the next three years.
According to CRC industry players, the duties imposed is adequate to shield the
industry from dumping activities. But excessively high duties will create an
imbalance in domestic supply and demand for CRC and related products. It may
also tarnish Malaysia’s position as a major trading nation.
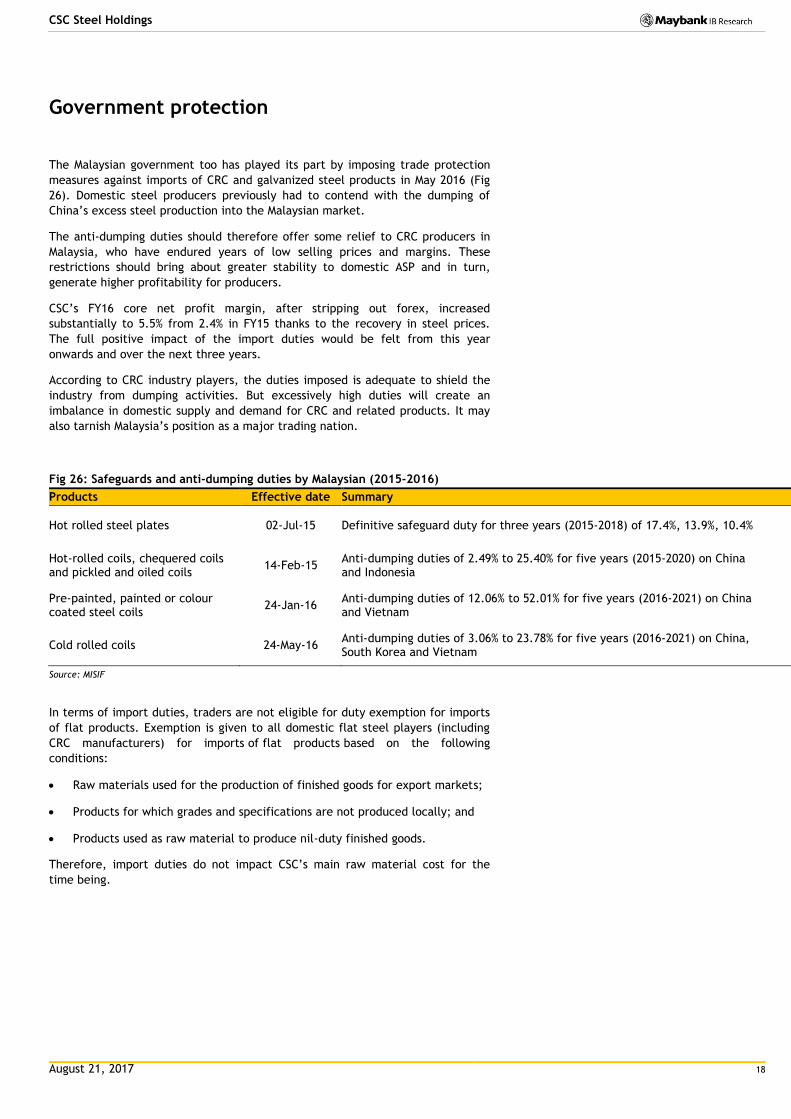
Fig 26: Safeguards and anti-dumping duties by Malaysian (2015-2016)
Products Effective date Summary
Hot rolled steel plates 02-Jul-15 Definitive safeguard duty for three years (2015-2018) of 17.4%, 13.9%, 10.4%
Hot-rolled coils, chequered coils and pickled and oiled coils
14-Feb-15 Anti-dumping duties of 2.49% to 25.40% for five years (2015-2020) on China and Indonesia
Pre-painted, painted or colour coated steel coils
24-Jan-16 Anti-dumping duties of 12.06% to 52.01% for five years (2016-2021) on China and Vietnam
Cold rolled coils 24-May-16 Anti-dumping duties of 3.06% to 23.78% for five years (2016-2021) on China, South Korea and Vietnam
Source: MISIF
In terms of import duties, traders are not eligible for duty exemption for imports
of flat products. Exemption is given to all domestic flat steel players (including
CRC manufacturers) for imports of flat products based on the following
conditions:
Raw materials used for the production of finished goods for export markets;
Products for which grades and specifications are not produced locally; and
Products used as raw material to produce nil-duty finished goods.
Therefore, import duties do not impact CSC’s main raw material cost for the
time being.

August 21, 2017 19
CSC Steel Holdings
Financial analysis
Figure 27: Condensed financial statements
Source: Company, Maybank KE
P&L (Dec yr-end) 2015 2016 2017E 2018E 2019E C/F (Dec yr-end) 2015 2016 2017E 2018E 2019E
Revenue 1,017 1,035 1,142 1,237 1,330 PBT 67 82 81 93 107
CRC 423 430 471 494 531 Depreciation & amortisation 35 33 33 35 36
GI 362 369 421 470 506 Working capital -30 9 -1 -22 -23
PPGI 232 236 251 273 293 Net interest expense -7 -9 0 0 0
COGS -940 -932 -1,027 -1,107 -1,187 Tax paid -9 -18 -19 -22 -26
Gross profit 78 103 115 130 143 Others 1 13 1 1 1
SG&A -39 -45 -47 -50 -51 Operating cash flow 56 109 94 84 95
Other expenses -3 -2 -2 -2 -2 Capex -40 -26 -22 -23 -23
Other income 26 17 7 6 6 Investments 0 -22 0 0 0
EBITDA 96 106 107 119 132 Others 19 6 0 0 0
Depreciation & amortisation -34 -32 -33 -34 -35 Investing cash flow -21 -42 -22 -23 -23
EBIT 62 74 74 85 96 Free cash flow 16 82 73 62 73
Net interest income 7 9 8 10 12 Dividend paid -11 -29 -31 -35 -41
Associates income -2 -1 -1 -1 -1 Net borrowings 0 0 0 0 0
PBT 67 82 81 93 107 Others -3 0 1 0 0
Income tax -15 -13 -19 -22 -26 Financing cash flow -14 -30 -29 -35 -41
PAT 52 69 61 71 81 Net cash flow 21 37 43 26 32
Minority interest 0 0 0 0 0 Beginning 210 231 270 313 339
Core NPAT 35 69 61 71 81 FX 0 1 0 0 0
Ending cash 231 270 313 339 371
B/S (Dec yr-end) 2015 2016 2017E 2018E 2019E
Cash & cash equivalents 231 270 313 339 371 PER SHARE 2015 2016 2017E 2018E 2019E
Receivables 91 89 94 101 109 No.of shares 370 369 369 369 369
Inventories 213 231 231 249 267 EPS 0.10 0.19 0.17 0.19 0.22
Other current assets 40 6 6 6 6 BPS 2.09 2.19 2.28 2.38 2.49
Current assets 576 596 644 696 753 DPS 0.08 0.14 0.08 0.10 0.11
PP&E 227 221 209 197 184 FCF 0.04 0.22 0.20 0.17 0.20
LT investments 9 51 50 49 49
Deferred taxes 0 0 0 0 0 VALUATION 2015 2016 2017E 2018E 2019E
Other assets 18 18 18 17 17 PER (x) 7.8 11.5 10.9 9.4 8.2
Non-current assets 255 290 277 264 250 P / BV (x) 0.5 1.0 0.8 0.8 0.7
Total assets 830 886 921 960 1,003 Dividend yield (%) 7.3 6.5 4.6 5.3 6.1
ST borrowings 0 0 0 0 0 -Payout ratio (%) 83.5% 75.3% 50.0% 50.0% 50.0%
Payables 39 35 38 42 45 P / FCF (x) 17.7 9.6 9.1 10.8 9.1
Other current liabilities 1 22 22 22 22 EV / sales (x) 0.2 0.5 0.3 0.3 0.2
Current liabilities 40 57 60 64 67 EV / EBIT (x) 4.3 7.1 4.8 3.9 3.1
LT borrowings 0 0 0 0 0 EV / EBITDA (x) 2.3 4.9 3.3 2.7 2.2
Deferred taxes 20 20 20 20 20
Non-current liabilities 20 20 20 20 20 BALANCE SHEET 2015 2016 2017E 2018E 2019E
Shareholders' funds 769 809 841 876 917 Receivable days 27 27 27 27 27
Minorities 0 0 0 0 0 Inventory days 85 87 82 82 82
Total stockholders' equity 769 809 841 876 917 Payable days 3 2 2 2 2
Total equity & liabilities 830 886 921 960 1,003 Cash conversion cycle 110 113 107 107 107
Net gearing / (net cash) (%) -30.1% -33.3% -37.2% -38.7% -40.5%
KEY METRICS (Dec yr-end) 2015 2016 2017E 2018E 2019E
Growth (% YoY): DuPont 2015 2016 2017E 2018E 2019E
Revenue -2.9% 1.8% 10.4% 8.3% 7.5% Three-stage
Gross profit 645.8% 32.8% 12.0% 12.7% 10.1% - Net profit margin 5.1% 6.6% 5.4% 5.7% 6.1%
EBIT 91.1% 19.9% -0.5% 14.7% 14.1% - Asset turnover 1.3 1.2 1.3 1.3 1.4
EBITDA 9437.3% 10.5% 0.4% 11.2% 11.0% - Equity multiplier 1.1 1.1 1.1 1.1 1.1
PBT 152.2% 22.9% -1.9% 15.7% 15.0% Five-stage
NPAT 294.4% 93.3% -10.7% 15.7% 15.0% - Tax burden 88.5% 88.5% 88.5% 88.5% 88.5%
EPS 296.2% 94.0% -10.8% 15.7% 15.0% - Interest burden 0 0 0 0 0
- Operating margin 6.0% 7.1% 6.4% 6.8% 7.2%
Margin (%): - Asset turnover 1.3 1.2 1.3 1.3 1.4
Gross 7.6% 10.0% 10.1% 10.5% 10.8% - Equity multiplier 1.1 1.1 1.1 1.1 1.1
EBIT 6.0% 7.1% 6.4% 6.8% 7.2% Return on equity 7.3% 8.3% 7.9% 8.8% 9.8%
EBITDA 9.5% 10.3% 9.3% 9.6% 9.9%
PBT 6.6% 7.9% 7.1% 7.5% 8.1%
NPAT 3.5% 6.6% 5.4% 5.7% 6.1%
August 21, 2017 20
CSC Steel Holdings
P&L analysis
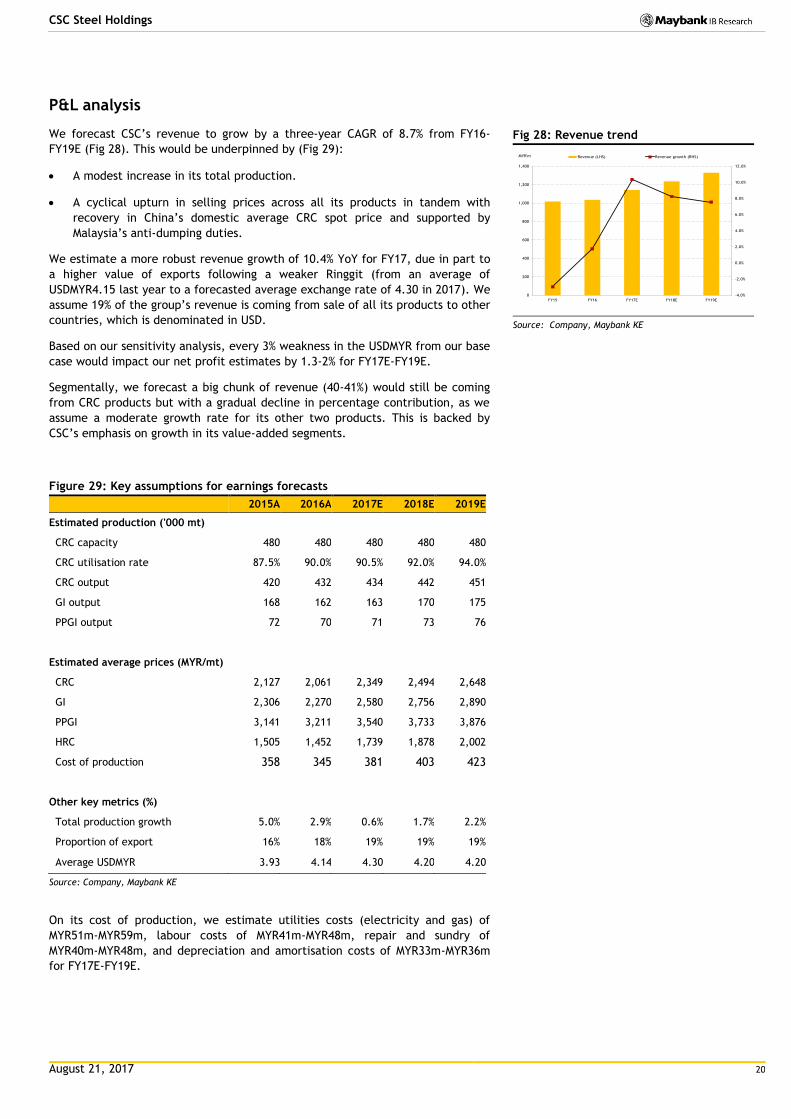
We forecast CSC’s revenue to grow by a three-year CAGR of 8.7% from FY16-
FY19E (Fig 28). This would be underpinned by (Fig 29):
A modest increase in its total production.
A cyclical upturn in selling prices across all its products in tandem with
recovery in China’s domestic average CRC spot price and supported by
Malaysia’s anti-dumping duties.
We estimate a more robust revenue growth of 10.4% YoY for FY17, due in part to
a higher value of exports following a weaker Ringgit (from an average of
USDMYR4.15 last year to a forecasted average exchange rate of 4.30 in 2017). We
assume 19% of the group’s revenue is coming from sale of all its products to other
countries, which is denominated in USD.
Based on our sensitivity analysis, every 3% weakness in the USDMYR from our base
case would impact our net profit estimates by 1.3-2% for FY17E-FY19E.
Segmentally, we forecast a big chunk of revenue (40-41%) would still be coming
from CRC products but with a gradual decline in percentage contribution, as we
assume a moderate growth rate for its other two products. This is backed by
CSC’s emphasis on growth in its value-added segments.
Figure 29: Key assumptions for earnings forecasts
2015A 2016A 2017E 2018E 2019E
Estimated production ('000 mt)
CRC capacity 480 480 480 480 480
CRC utilisation rate 87.5% 90.0% 90.5% 92.0% 94.0%
CRC output 420 432 434 442 451
GI output 168 162 163 170 175
PPGI output 72 70 71 73 76
Estimated average prices (MYR/mt)
CRC 2,127 2,061 2,349 2,494 2,648
GI 2,306 2,270 2,580 2,756 2,890
PPGI 3,141 3,211 3,540 3,733 3,876
HRC 1,505 1,452 1,739 1,878 2,002
Cost of production 358 345 381 403 423
Other key metrics (%)
Total production growth 5.0% 2.9% 0.6% 1.7% 2.2%
Proportion of export 16% 18% 19% 19% 19%
Average USDMYR 3.93 4.14 4.30 4.20 4.20
Source: Company, Maybank KE
On its cost of production, we estimate utilities costs (electricity and gas) of
MYR51m-MYR59m, labour costs of MYR41m-MYR48m, repair and sundry of
MYR40m-MYR48m, and depreciation and amortisation costs of MYR33m-MYR36m
for FY17E-FY19E.
Fig 28: Revenue trend
Source: Company, Maybank KE
-4.0%
-2.0%
0.0%
2.0%
4.0%
6.0%
8.0%
10.0%
12.0%
0
200
400
600
800
1,000
1,200
1,400
FY15 FY16 FY17E FY18E FY19E
MYR'm Revenue (LHS) Revenue growth (RHS)
August 21, 2017 21
CSC Steel Holdings
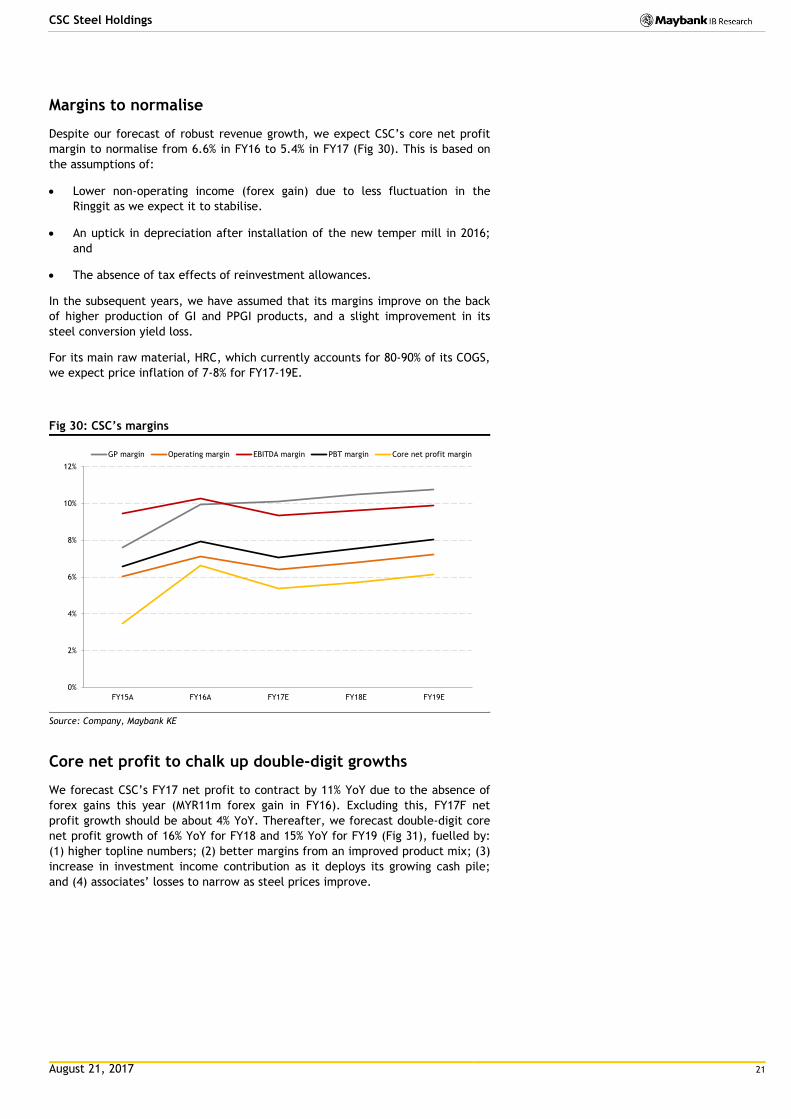
Margins to normalise
Despite our forecast of robust revenue growth, we expect CSC’s core net profit
margin to normalise from 6.6% in FY16 to 5.4% in FY17 (Fig 30). This is based on
the assumptions of:
Lower non-operating income (forex gain) due to less fluctuation in the
Ringgit as we expect it to stabilise.
An uptick in depreciation after installation of the new temper mill in 2016;
and
The absence of tax effects of reinvestment allowances.
In the subsequent years, we have assumed that its margins improve on the back
of higher production of GI and PPGI products, and a slight improvement in its
steel conversion yield loss.
For its main raw material, HRC, which currently accounts for 80-90% of its COGS,
we expect price inflation of 7-8% for FY17-19E.
Fig 30: CSC’s margins
Source: Company, Maybank KE
Core net profit to chalk up double-digit growths
We forecast CSC’s FY17 net profit to contract by 11% YoY due to the absence of
forex gains this year (MYR11m forex gain in FY16). Excluding this, FY17F net
profit growth should be about 4% YoY. Thereafter, we forecast double-digit core
net profit growth of 16% YoY for FY18 and 15% YoY for FY19 (Fig 31), fuelled by:
(1) higher topline numbers; (2) better margins from an improved product mix; (3)
increase in investment income contribution as it deploys its growing cash pile;
and (4) associates’ losses to narrow as steel prices improve.
0%
2%
4%
6%
8%
10%
12%
FY15A FY16A FY17E FY18E FY19E
GP margin Operating margin EBITDA margin PBT margin Core net profit margin

August 21, 2017 22
CSC Steel Holdings
Fig 31: Core net profit trend
Source: Company, Maybank KE
1Q17 results
1Q17 results were encouraging as revenue grew 40% YoY due to higher selling
prices across all steel products and as production volumes rose. This was despite
an increase in production cost. As a result, EBIT margin expanded 2.8%-pts YoY to
6.9% and net profit surged 85% YoY (Fig 35 & 36).
On a QoQ basis, net profit surged 167% despite only 8% QoQ revenue growth as
CSC was able to pass on the higher raw material cost to downstream customers.
We expect revenue growth to moderate in the coming quarters as China steel
prices have eased. All in all, however, we expect CSC to record double-digit FY17
revenue growth of 10.4% to MYR1.14b on improving domestic demand, backed by
a positive outlook for the aforementioned sectors.
Fig 32: Quarterly financial trend
Source: Company data
-50%
0%
50%
100%
150%
200%
250%
300%
350%
0
10
20
30
40
50
60
70
80
90
FY15 FY16 FY17E FY18E FY19E
MYR'm Core profit excl realised forex (LHS) Realised forex (LHS) Core profit excl realised forex growth (RHS) Core profit growth (RHS)
0%
2%
4%
6%
8%
10%
12%
14%
0
50
100
150
200
250
300
350
1Q15 2Q15 3Q15 4Q15 1Q16 2Q16 3Q16 4Q16 1Q17
MYR'm Revenue (LHS) Net profit (RHS) Net profit margin
August 21, 2017 23
CSC Steel Holdings
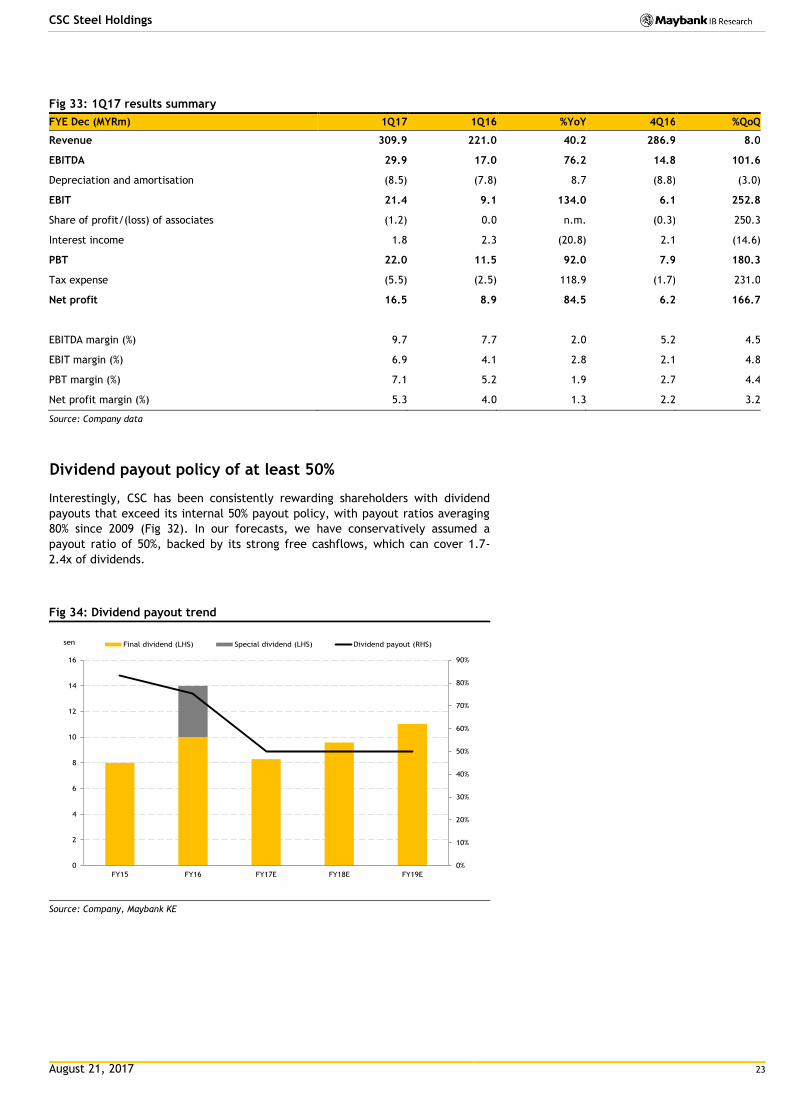
Fig 33: 1Q17 results summary
FYE Dec (MYRm) 1Q17 1Q16 %YoY 4Q16 %QoQ
Revenue 309.9 221.0 40.2 286.9 8.0
EBITDA 29.9 17.0 76.2 14.8 101.6
Depreciation and amortisation (8.5) (7.8) 8.7 (8.8) (3.0)
EBIT 21.4 9.1 134.0 6.1 252.8
Share of profit/(loss) of associates (1.2) 0.0 n.m. (0.3) 250.3
Interest income 1.8 2.3 (20.8) 2.1 (14.6)
PBT 22.0 11.5 92.0 7.9 180.3
Tax expense (5.5) (2.5) 118.9 (1.7) 231.0
Net profit 16.5 8.9 84.5 6.2 166.7
EBITDA margin (%) 9.7 7.7 2.0 5.2 4.5
EBIT margin (%) 6.9 4.1 2.8 2.1 4.8
PBT margin (%) 7.1 5.2 1.9 2.7 4.4
Net profit margin (%) 5.3 4.0 1.3 2.2 3.2
Source: Company data
Dividend payout policy of at least 50%
Interestingly, CSC has been consistently rewarding shareholders with dividend
payouts that exceed its internal 50% payout policy, with payout ratios averaging
80% since 2009 (Fig 32). In our forecasts, we have conservatively assumed a
payout ratio of 50%, backed by its strong free cashflows, which can cover 1.7-
2.4x of dividends.
Fig 34: Dividend payout trend
Source: Company, Maybank KE
0%
10%
20%
30%
40%
50%
60%
70%
80%
90%
0
2
4
6
8
10
12
14
16
FY15 FY16 FY17E FY18E FY19E
sen Final dividend (LHS) Special dividend (LHS) Dividend payout (RHS)
August 21, 2017 24
CSC Steel Holdings
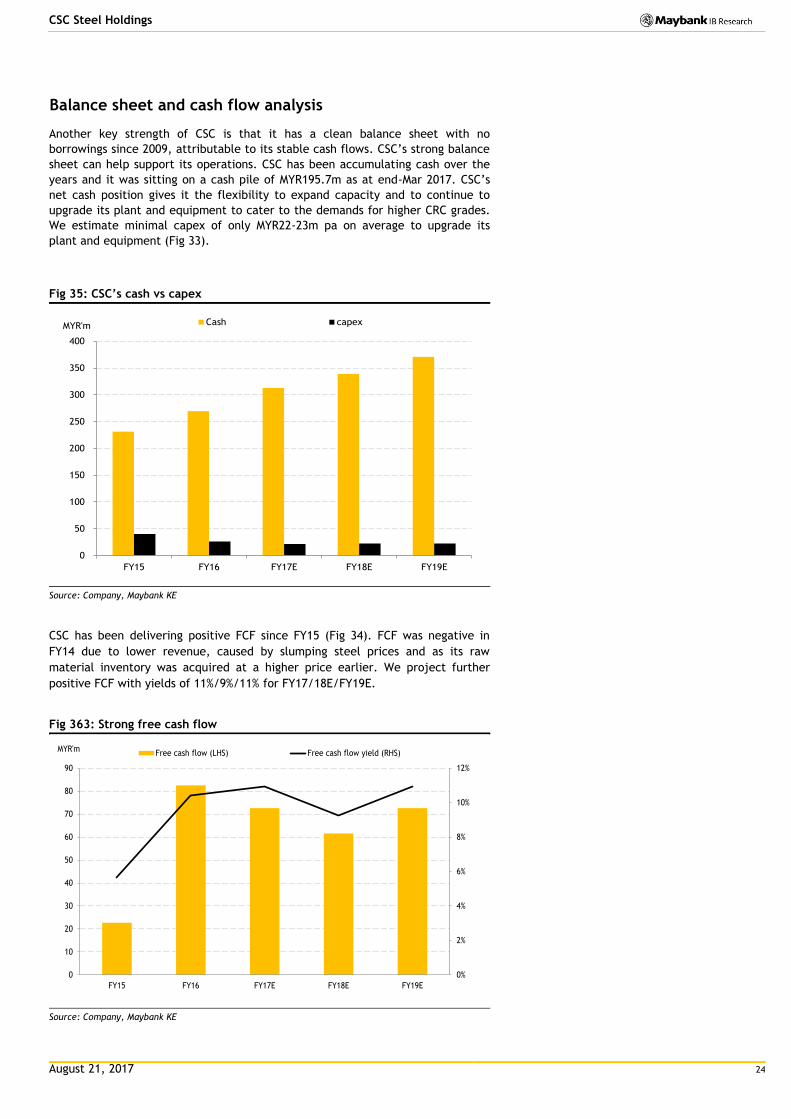
Balance sheet and cash flow analysis
Another key strength of CSC is that it has a clean balance sheet with no
borrowings since 2009, attributable to its stable cash flows. CSC’s strong balance
sheet can help support its operations. CSC has been accumulating cash over the
years and it was sitting on a cash pile of MYR195.7m as at end-Mar 2017. CSC’s
net cash position gives it the flexibility to expand capacity and to continue to
upgrade its plant and equipment to cater to the demands for higher CRC grades.
We estimate minimal capex of only MYR22-23m pa on average to upgrade its
plant and equipment (Fig 33).
Fig 35: CSC’s cash vs capex
Source: Company, Maybank KE
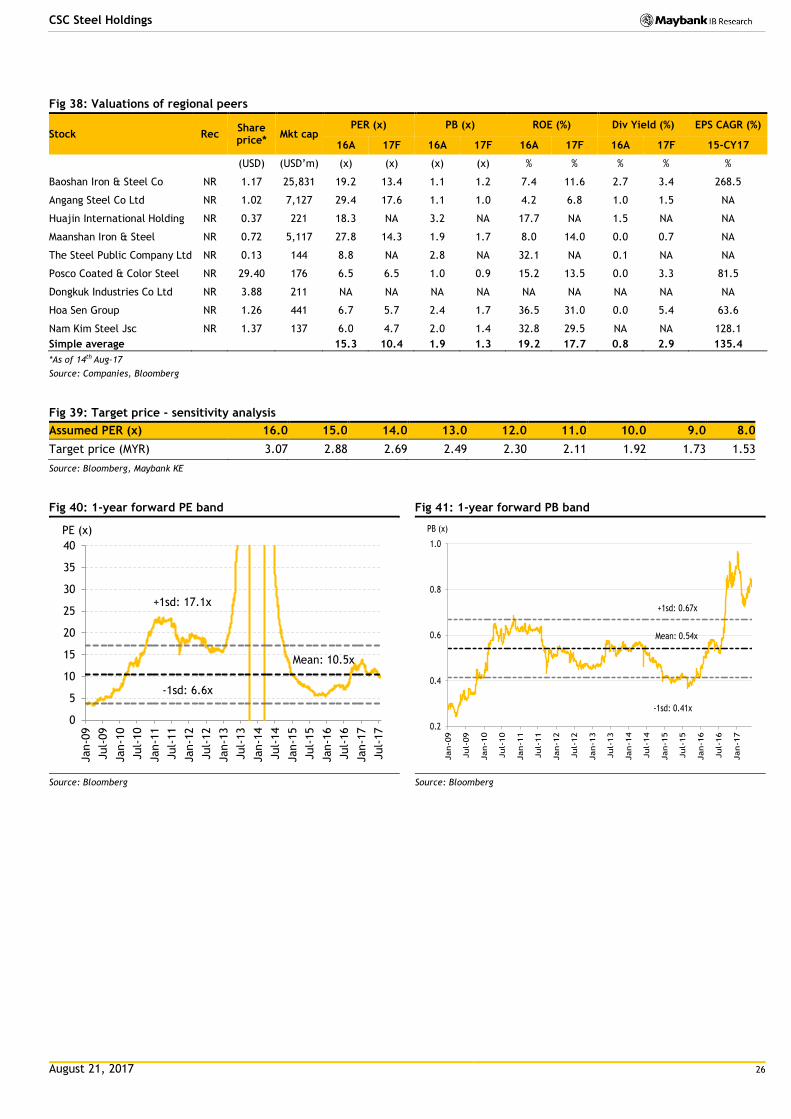
CSC has been delivering positive FCF since FY15 (Fig 34). FCF was negative in
FY14 due to lower revenue, caused by slumping steel prices and as its raw
material inventory was acquired at a higher price earlier. We project further
positive FCF with yields of 11%/9%/11% for FY17/18E/FY19E.
Fig 363: Strong free cash flow
Source: Company, Maybank KE
0
50
100
150
200
250
300
350
400
FY15 FY16 FY17E FY18E FY19E
MYR'm Cash capex
0%
2%
4%
6%
8%
10%
12%
0
10
20
30
40
50
60
70
80
90
FY15 FY16 FY17E FY18E FY19E
MYR'mFree cash flow (LHS) Free cash flow yield (RHS)

August 21, 2017 25
CSC Steel Holdings
Valuations
Initiate BUY and MYR2.02 TP
We initiate coverage on CSC with a BUY and MYR2.02 TP, based on 10.5x FY18F
EPS of 19.2sen. We believe our target PER of 10.5x (the average of its five-year
historical forward PER) is justified given CSC’s market leadership in the domestic
industry (Fig 37). We note that competitor Eonmetall Group’s ROE is higher than
CSC‘s but this is because Eonmetall also manufactures industrial process
machinery, and equipment for the palm oil industry, metalwork machinery and
equipment, and racking systems.
CSC has a healthy balance sheet with net cash per share of 53sen, which implies
an FY18 ex-cash PER of just 7.8x at our TP of MYR2.02. It also translates to a
reasonable 0.85x FY18 P/BV and a decent FY18 dividend yield of 4.7%.
Fig 37: Valuations of Malaysian peers
Stock Rec Share price*
Mkt cap PE (x) PB (x) ROE (%) Div Yield (%) EPS CAGR (%)
16A 17F 16A 17F 16A 17F 16A 17F 15-CY17
(MYR) (MYR'm) (x) (x) (x) (x) % % % % %
Mycron Steel NR 0.82 233 6.5 NA 0.7 NA 10.5 NA 0.0 NA NA
Eonmetall Group NR 0.76 128 10.5 7.9 0.8 0.8 8.0 9.9 3.2 3.2 64.0
YKGI Holdings NR 0.23 80 (6.6) NA 0.4 NA (5.9) NA 0.0 NA NA
Simple average
8.5 7.9 0.6 0.8 9.2 9.9 3.2 3.2 64.0
CSC Steel Holdings BUY 1.70 628 9.1 10.2 0.8 0.8 8.7 7.4 7.8 4.6 31.4
*As of 14th Aug-17
Source: Companies, Bloomberg
A slight premium valuation for multi-usage
Our 10.5x target PER for CSC represents a slight premium to the average for the
long steel sector (upstream production) of 10x (according to our steel analyst,
Yen Ling). We believe this slight premium is fair as CSC’s products are for
downstream manufacturing in various key end markets while long-steel products
are used primarily in the construction sector. Therefore, we can expect CSC’s
earnings to be more stable than long-steel players given CSC’s better product mix.
Against regional peers
We note that most of CSC’s regional peers (Fig 38) are involved in the complete
steel production chain. This is versus CSC’s focus on just the mid-stream value
chain. Therefore, we believe our target PER of 10.5x for CSC is reasonable as its
earnings would be less prone to the fluctuation in steel prices. In addition, CSC’s
earnings prospects will benefit from better pricing in the domestic market
following the reduction of cheaper steel imports due to the anti-dumping duties.
August 21, 2017 26
CSC Steel Holdings
Fig 38: Valuations of regional peers
Stock Rec Share price*
Mkt cap PER (x) PB (x) ROE (%) Div Yield (%) EPS CAGR (%)
16A 17F 16A 17F 16A 17F 16A 17F 15-CY17
(USD) (USD’m) (x) (x) (x) (x) % % % % %
Baoshan Iron & Steel Co NR 1.17 25,831 19.2 13.4 1.1 1.2 7.4 11.6 2.7 3.4 268.5
Angang Steel Co Ltd NR 1.02 7,127 29.4 17.6 1.1 1.0 4.2 6.8 1.0 1.5 NA
Huajin International Holding NR 0.37 221 18.3 NA 3.2 NA 17.7 NA 1.5 NA NA
Maanshan Iron & Steel NR 0.72 5,117 27.8 14.3 1.9 1.7 8.0 14.0 0.0 0.7 NA
The Steel Public Company Ltd NR 0.13 144 8.8 NA 2.8 NA 32.1 NA 0.1 NA NA
Posco Coated & Color Steel NR 29.40 176 6.5 6.5 1.0 0.9 15.2 13.5 0.0 3.3 81.5
Dongkuk Industries Co Ltd NR 3.88 211 NA NA NA NA NA NA NA NA NA
Hoa Sen Group NR 1.26 441 6.7 5.7 2.4 1.7 36.5 31.0 0.0 5.4 63.6
Nam Kim Steel Jsc NR 1.37 137 6.0 4.7 2.0 1.4 32.8 29.5 NA NA 128.1
Simple average
15.3 10.4 1.9 1.3 19.2 17.7 0.8 2.9 135.4
*As of 14th Aug-17
Source: Companies, Bloomberg
Fig 39: Target price - sensitivity analysis
Assumed PER (x) 16.0 15.0 14.0 13.0 12.0 11.0 10.0 9.0 8.0
Target price (MYR) 3.07 2.88 2.69 2.49 2.30 2.11 1.92 1.73 1.53
Source: Bloomberg, Maybank KE
Fig 40: 1-year forward PE band
Source: Bloomberg
Fig 41: 1-year forward PB band
Source: Bloomberg
0
5
10
15
20
25
30
35
40
Jan-0
9
Jul-
09
Jan-1
0
Jul-
10
Jan-1
1
Jul-
11
Jan-1
2
Jul-
12
Jan-1
3
Jul-
13
Jan-1
4
Jul-
14
Jan-1
5
Jul-
15
Jan-1
6
Jul-
16
Jan-1
7
Jul-
17
PE (x)
+1sd: 17.1x
Mean: 10.5x
-1sd: 6.6x
0.2
0.4
0.6
0.8
1.0
Jan-0
9
Jul-
09
Jan-1
0
Jul-
10
Jan-1
1
Jul-
11
Jan-1
2
Jul-
12
Jan-1
3
Jul-
13
Jan-1
4
Jul-
14
Jan-1
5
Jul-
15
Jan-1
6
Jul-
16
Jan-1
7
+1sd: 0.67x
Mean: 0.54x
-1sd: 0.41x
PB (x)

August 21, 2017 27
CSC Steel Holdings
Risks
Macro risks
Steel prices are highly cyclical as they’re affected by the strength of the
economy in general and the level of domestic activities. Therefore, a slowdown
in the domestic market would affect the consumption of CSC’s steel products.
Fluctuation in steel prices
Steel prices in China have become the benchmark for international steel prices as
China is the world’s largest steel exporter and as it produces cheaper steel
products. The Chinese government’s failure to curb overcapacity in crude steel in
China would harm prices along the steel value chain, including the primary
sources for HRC production, i.e., iron ore and coking coal.
Dumping activities
Although the Malaysian government has imposed anti-dumping duties on HRC and
CRC from the largest exporting country China and a few other countries, there
are still concerns over the influx of cheap and lower grade steel from other
countries such as India in the guise of boron-added steel products. Such products
fall under the alloy tariff codes, which require no duties and are brought in by
traders or stockists.
Dependence on parent company for HRC supply
CSC is dependent on its parent company in Taiwan for HRC supply for its
production. There could be risk of supply disruptions and discounts on bulk
purchases from its parent are not guaranteed. As such, CSC’s earnings could be
significantly affected if HRC supply from its parent is disrupted.
Regulatory risks
For now, CSC’s imported raw materials are still exempted from import duties
/tariffs under permits granted by the Ministry of International Trade and Industry
as CSC is a major producer in Malaysia. However, there are no assurances that
the Ministry of International Trade and Industry will continue to grant CSC with
such permits and/or exemptions. If the permits are not renewed, CSC would have
to source raw materials from local producers, who might take the opportunity to
increase prices due to higher demand.
Foreign-exchange risks
CSC’s raw material purchases (including HRC, zinc and various chemical
substances) are denominated in USD. Its export products are also denominated in
USD. Therefore, fluctuations in the MYR vs USD will have a material effect on
CSC’s earnings. Based on our sensitivity analysis, every 3% weakness in the MYR
vs USD from our base case would impact our net profit estimates by 1.3%/2%/2%
for FY17E/FY18E/FY19E, respectively.

August 21, 2017 28
CSC Steel Holdings
Appendix
1. CSC’s background
Through its subsidiary, CSC Steel Sdn Bhd, the group’s primary activity is in the
mid-stream segment of the steel value chain, which is the manufacture and
marketing of: (i) pickled and oiled steel coils; (ii) cold rolled steel coils; (iii) hot
dipped galvanized steel coils; and (iv) pre-painted galvanized steel coils.
Fig 42: Group structure
Source: Company
Production capacity
CSC Steel’s factory in Ayer Keroh Industrial Estate, Melaka, started producing and
marketing steel pipes in Jul 1993, followed by CRC in Aug 1994, with a total
capacity of 72,000 mt and 350,000 mt pa respectively at that point in time.
Meanwhile, CSC Steel’s galvanized steel and pre-painted steel plants, with
production capacity of approximately 240,000 mtpa and 120,000 mtpa
respectively, commenced commercial production in 1998.
In 2007, CSC Steel’s new 4-feet reversing cold rolling mill (RCM) started
commercial production. It expanded its CRC production capacity to 620,000mtpa
before the oldest RCM was phased out in 2015 as it was fully depreciated.
Vertical-integration strategy
In 2012, the group acquired 20% of Tatt Giap Group Berhad’s wholly-owned
subsidiary, Tatt Giap Steel Centre Sdn. Bhd, one of its customers. Tatt Giap Steel
provides downstream services and specializes in the slitting and sheering of steel
coils and sheets, thus complementing the overall services offered by CSC.
CSC Steel Holdings Bhd
CSC Steel Sdn Bhd
100%
Constant Mode Sdn Bhd
100%
Group Steel Corporation (M) Sdn Bhd
100%
Tatt Giap Steel Centre Sdn Bhd
20%

August 21, 2017 29
CSC Steel Holdings
Man of steel
CSC is a major subsidiary of Taiwan-based China Steel Corporation CSC of Taiwan.
CSC in Malaysia is headed by Mr Chen Huo-Kun (Fig 43) who has been with CSC of
Taiwan in Taiwan since 1983. Mr Chen was appointed CSC Malaysia’s Group
Managing Director in Aug 2016. He is assisted by executive director Mr Tan Chin
Teng and an experienced senior management team that comprises several people
from the parent company who are experts in their own areas.
Fig 43: CSC’s management team
Name Position Details
Chen, Huo-Kun Group Managing Director
Appointed as Group MD on 4 Aug 16
Graduated from National Sun Yat-Sen University, Taiwan with Doctor in Business Management
More than 30 years of experience in the steel manufacturing industry
Has been employed by China Steel Corporation, Taiwan ("CSC") since 1983, was Production VP at CSC Steel S/B, a subsidiary of CHB, prior to appointment to the Board of CHB
Tan Chin Teng Executive Director (VP
Finance Division)
Appointed as ED on 5 Oct 14
Graduated from Cambridge Management Institute, UK with a MBA
More than 30 years of accounting and finance experience,
More than 25 years of managerial experience overseeing financial matters
Hsu, Tse-Wei VP, Production Division
Date of appointment: 1 Aug 16
Graduated from National Sun Yat-Sen University, Taiwan with Executive MBA
More than 30 years of experience in steel manufacturing
Ten Ling Piew VP, Commercial Division
Date of appointment: 1 July 12
Graduated from National Chung Hsing University, Taiwan with Degree in Business Administration
More than 20 years of experience in marketing
Koh Kang Guan AVP, Production Division
Date of appointment: 1 Jan 07
Graduated from National Taiwan University, Taiwan with Degree in Mechanical Engineering
More than 20 years of experience in the steel manufacturing industry
Juang, Der-Feng AVP, Finance Division
Date of appointment: 1 Aug 16
Graduated from National Sun Yat-sen, Taiwan with Degree in Executive MBA
30 years of experience in finance and accounting
Source: Company
China Steel Corporation of Taiwan
Located in Kaohsiung, Taiwan, CSC of Taiwan was founded in Dec 1971. With
annual production of around 10m tonnes of crude steel, CSC is the largest steel
company in Taiwan, with more than 50% market share.
CSC produces a range of products, including plates, bars, wire rods, hot and cold
rolled coils, electrogalvanized coils, electrical steel coils, hot-dip galvanized
coils, and Ti/Ni-base alloy. The domestic market absorbs roughly 69% of CSC’s
production and exports make up the remaining 31%. Major export destinations
are China, Japan and Southeast Asia.
CSC of Taiwan is CSC’s largest shareholder with a 45% stake.
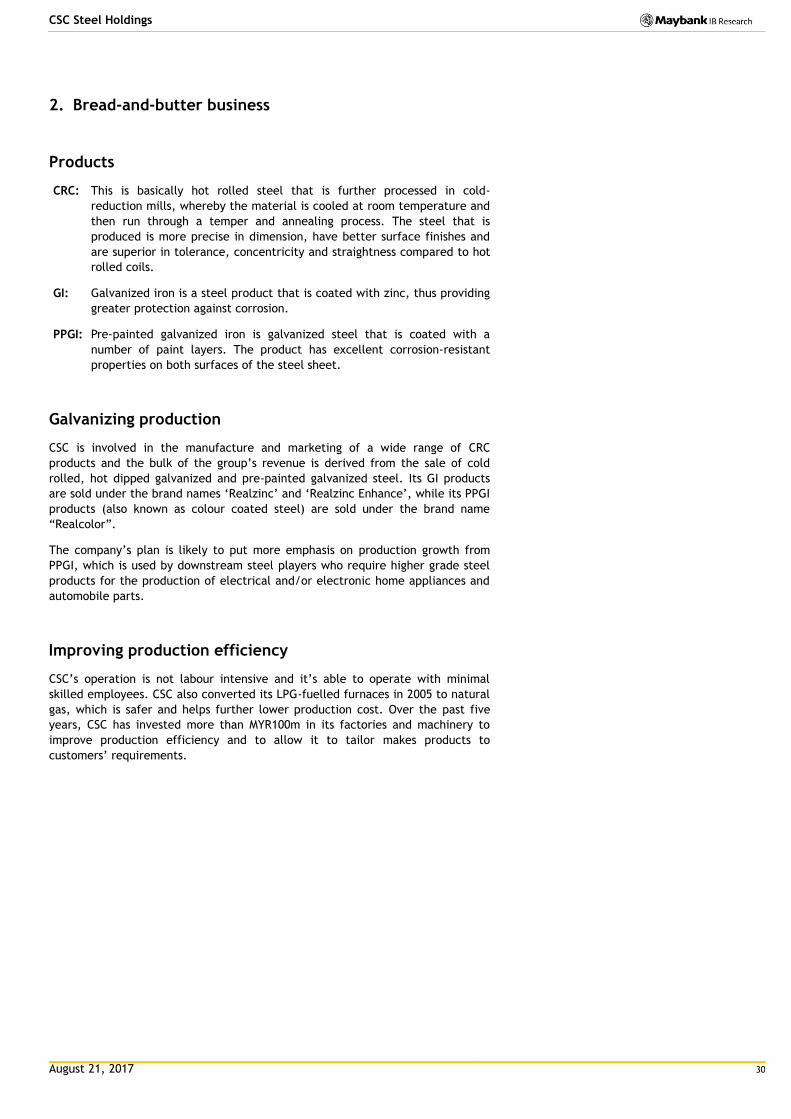
August 21, 2017 30
CSC Steel Holdings
2. Bread-and-butter business
Products
CRC: This is basically hot rolled steel that is further processed in cold-
reduction mills, whereby the material is cooled at room temperature and
then run through a temper and annealing process. The steel that is
produced is more precise in dimension, have better surface finishes and
are superior in tolerance, concentricity and straightness compared to hot
rolled coils.
GI: Galvanized iron is a steel product that is coated with zinc, thus providing
greater protection against corrosion.
PPGI: Pre-painted galvanized iron is galvanized steel that is coated with a
number of paint layers. The product has excellent corrosion-resistant
properties on both surfaces of the steel sheet.
Galvanizing production
CSC is involved in the manufacture and marketing of a wide range of CRC
products and the bulk of the group’s revenue is derived from the sale of cold
rolled, hot dipped galvanized and pre-painted galvanized steel. Its GI products
are sold under the brand names ‘Realzinc’ and ‘Realzinc Enhance’, while its PPGI
products (also known as colour coated steel) are sold under the brand name
“Realcolor”.
The company’s plan is likely to put more emphasis on production growth from
PPGI, which is used by downstream steel players who require higher grade steel
products for the production of electrical and/or electronic home appliances and
automobile parts.
Improving production efficiency
CSC’s operation is not labour intensive and it’s able to operate with minimal
skilled employees. CSC also converted its LPG-fuelled furnaces in 2005 to natural
gas, which is safer and helps further lower production cost. Over the past five
years, CSC has invested more than MYR100m in its factories and machinery to
improve production efficiency and to allow it to tailor makes products to
customers’ requirements.
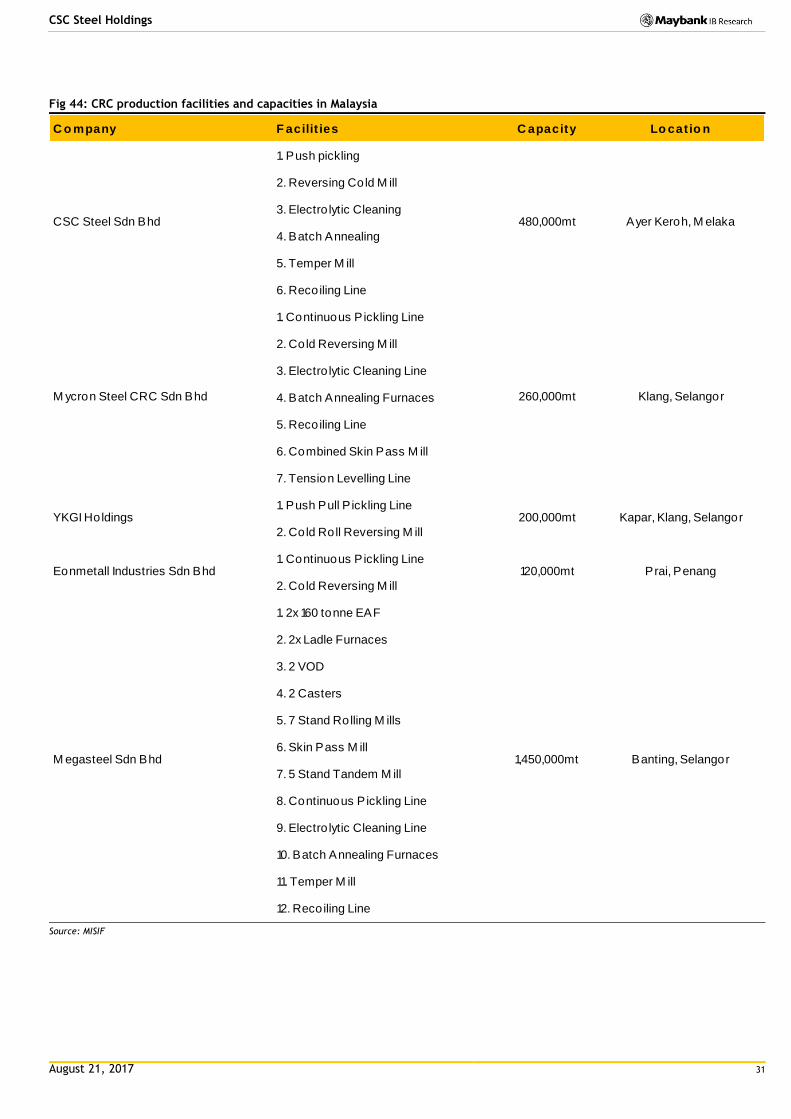
August 21, 2017 31
CSC Steel Holdings
Fig 44: CRC production facilities and capacities in Malaysia
Source: MISIF
C o mpany F acilit ies C apacity Lo cat io n
1. Push pickling
2. Reversing Cold M ill
3. Electro lytic Cleaning
4. Batch Annealing
5. Temper M ill
6. Recoiling Line
1. Continuous Pickling Line
2. Cold Reversing M ill
3. Electro lytic Cleaning Line
4. Batch Annealing Furnaces
5. Recoiling Line
6. Combined Skin Pass M ill
7. Tension Levelling Line
1. Push Pull P ickling Line
2. Cold Roll Reversing M ill
1. Continuous Pickling Line
2. Cold Reversing M ill
1. 2x 160 tonne EAF
2. 2x Ladle Furnaces
3. 2 VOD
4. 2 Casters
5. 7 Stand Rolling M ills
6. Skin Pass M ill
7. 5 Stand Tandem M ill
8. Continuous Pickling Line
9. Electro lytic Cleaning Line
10. Batch Annealing Furnaces
11. Temper M ill
12. Recoiling Line
480,000mt
260,000mt
200,000mt
120,000mt
1,450,000mt
Ayer Keroh, M elaka
Klang, Selangor
Kapar, Klang, Selangor
Prai, Penang
Banting, Selangor
YKGI Holdings
Eonmetall Industries Sdn Bhd
M egasteel Sdn Bhd
CSC Steel Sdn Bhd
M ycron Steel CRC Sdn Bhd
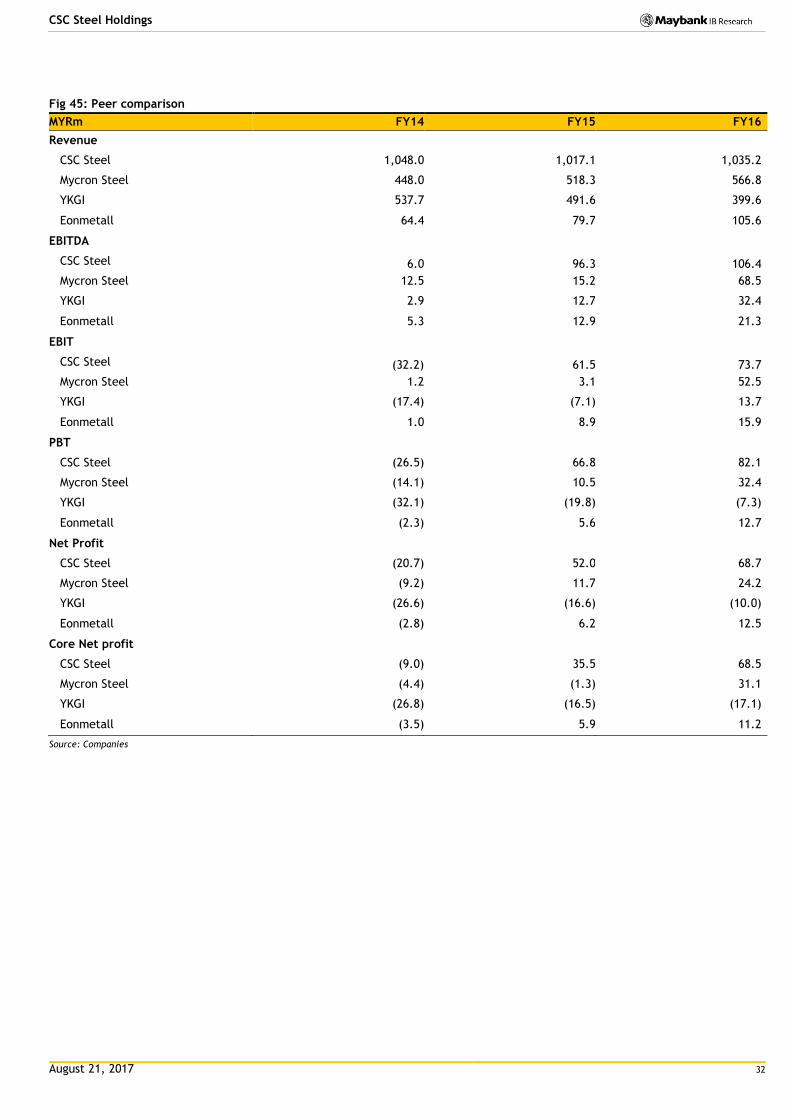
August 21, 2017 32
CSC Steel Holdings
Fig 45: Peer comparison
MYRm FY14 FY15 FY16
Revenue
CSC Steel 1,048.0 1,017.1 1,035.2
Mycron Steel 448.0 518.3 566.8
YKGI 537.7 491.6 399.6
Eonmetall 64.4 79.7 105.6
EBITDA
CSC Steel 6.0 96.3 106.4
Mycron Steel 12.5 15.2 68.5
YKGI 2.9 12.7 32.4
Eonmetall 5.3 12.9 21.3
EBIT
CSC Steel (32.2) 61.5 73.7
Mycron Steel 1.2 3.1 52.5
YKGI (17.4) (7.1) 13.7
Eonmetall 1.0 8.9 15.9
PBT
CSC Steel (26.5) 66.8 82.1
Mycron Steel (14.1) 10.5 32.4
YKGI (32.1) (19.8) (7.3)
Eonmetall (2.3) 5.6 12.7
Net Profit
CSC Steel (20.7) 52.0 68.7
Mycron Steel (9.2) 11.7 24.2
YKGI (26.6) (16.6) (10.0)
Eonmetall (2.8) 6.2 12.5
Core Net profit
CSC Steel (9.0) 35.5 68.5
Mycron Steel (4.4) (1.3) 31.1
YKGI (26.8) (16.5) (17.1)
Eonmetall (3.5) 5.9 11.2
Source: Companies
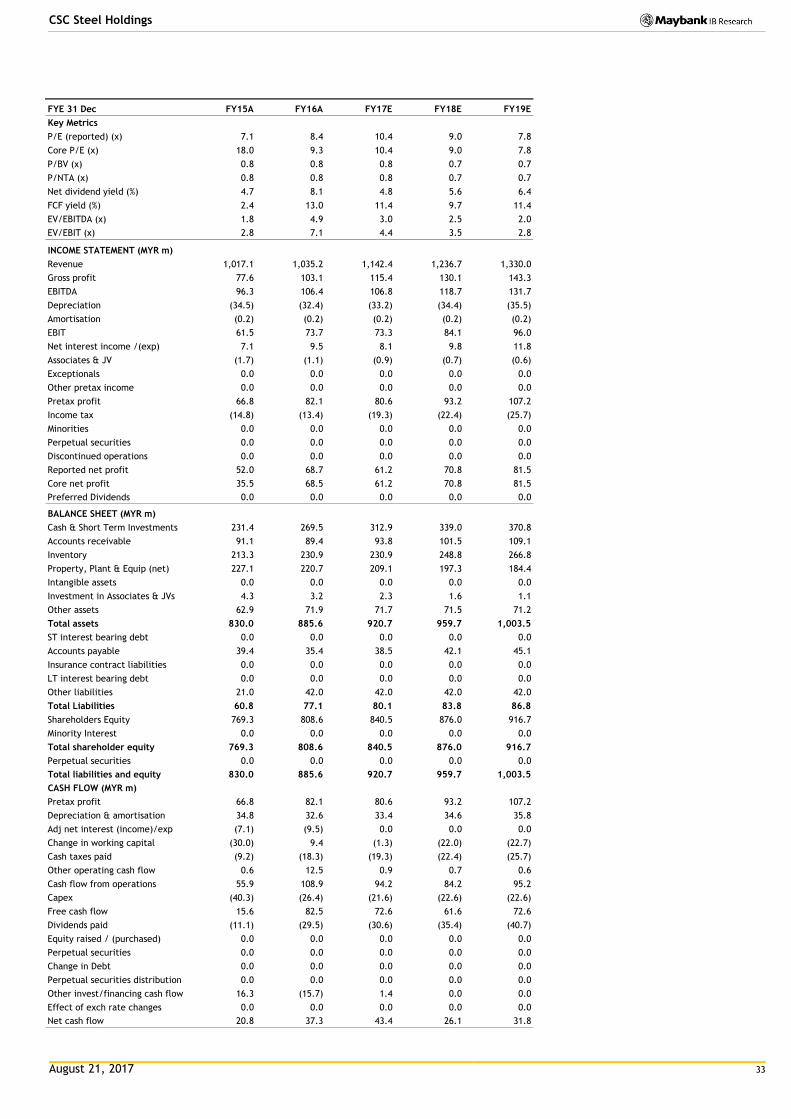
August 21, 2017 33
CSC Steel Holdings
FYE 31 Dec FY15A FY16A FY17E FY18E FY19E
Key Metrics
P/E (reported) (x) 7.1 8.4 10.4 9.0 7.8
Core P/E (x) 18.0 9.3 10.4 9.0 7.8
P/BV (x) 0.8 0.8 0.8 0.7 0.7
P/NTA (x) 0.8 0.8 0.8 0.7 0.7
Net dividend yield (%) 4.7 8.1 4.8 5.6 6.4
FCF yield (%) 2.4 13.0 11.4 9.7 11.4
EV/EBITDA (x) 1.8 4.9 3.0 2.5 2.0
EV/EBIT (x) 2.8 7.1 4.4 3.5 2.8
INCOME STATEMENT (MYR m)
Revenue 1,017.1 1,035.2 1,142.4 1,236.7 1,330.0
Gross profit 77.6 103.1 115.4 130.1 143.3
EBITDA 96.3 106.4 106.8 118.7 131.7
Depreciation (34.5) (32.4) (33.2) (34.4) (35.5)
Amortisation (0.2) (0.2) (0.2) (0.2) (0.2)
EBIT 61.5 73.7 73.3 84.1 96.0
Net interest income /(exp) 7.1 9.5 8.1 9.8 11.8
Associates & JV (1.7) (1.1) (0.9) (0.7) (0.6)
Exceptionals 0.0 0.0 0.0 0.0 0.0
Other pretax income 0.0 0.0 0.0 0.0 0.0
Pretax profit 66.8 82.1 80.6 93.2 107.2
Income tax (14.8) (13.4) (19.3) (22.4) (25.7)
Minorities 0.0 0.0 0.0 0.0 0.0
Perpetual securities 0.0 0.0 0.0 0.0 0.0
Discontinued operations 0.0 0.0 0.0 0.0 0.0
Reported net profit 52.0 68.7 61.2 70.8 81.5
Core net profit 35.5 68.5 61.2 70.8 81.5
Preferred Dividends 0.0 0.0 0.0 0.0 0.0
BALANCE SHEET (MYR m)
Cash & Short Term Investments 231.4 269.5 312.9 339.0 370.8
Accounts receivable 91.1 89.4 93.8 101.5 109.1
Inventory 213.3 230.9 230.9 248.8 266.8
Property, Plant & Equip (net) 227.1 220.7 209.1 197.3 184.4
Intangible assets 0.0 0.0 0.0 0.0 0.0
Investment in Associates & JVs 4.3 3.2 2.3 1.6 1.1
Other assets 62.9 71.9 71.7 71.5 71.2
Total assets 830.0 885.6 920.7 959.7 1,003.5
ST interest bearing debt 0.0 0.0 0.0 0.0 0.0
Accounts payable 39.4 35.4 38.5 42.1 45.1
Insurance contract liabilities 0.0 0.0 0.0 0.0 0.0
LT interest bearing debt 0.0 0.0 0.0 0.0 0.0
Other liabilities 21.0 42.0 42.0 42.0 42.0
Total Liabilities 60.8 77.1 80.1 83.8 86.8
Shareholders Equity 769.3 808.6 840.5 876.0 916.7
Minority Interest 0.0 0.0 0.0 0.0 0.0
Total shareholder equity 769.3 808.6 840.5 876.0 916.7
Perpetual securities 0.0 0.0 0.0 0.0 0.0
Total liabilities and equity 830.0 885.6 920.7 959.7 1,003.5
CASH FLOW (MYR m)
Pretax profit 66.8 82.1 80.6 93.2 107.2
Depreciation & amortisation 34.8 32.6 33.4 34.6 35.8
Adj net interest (income)/exp (7.1) (9.5) 0.0 0.0 0.0
Change in working capital (30.0) 9.4 (1.3) (22.0) (22.7)
Cash taxes paid (9.2) (18.3) (19.3) (22.4) (25.7)
Other operating cash flow 0.6 12.5 0.9 0.7 0.6
Cash flow from operations 55.9 108.9 94.2 84.2 95.2
Capex (40.3) (26.4) (21.6) (22.6) (22.6)
Free cash flow 15.6 82.5 72.6 61.6 72.6
Dividends paid (11.1) (29.5) (30.6) (35.4) (40.7)
Equity raised / (purchased) 0.0 0.0 0.0 0.0 0.0
Perpetual securities 0.0 0.0 0.0 0.0 0.0
Change in Debt 0.0 0.0 0.0 0.0 0.0
Perpetual securities distribution 0.0 0.0 0.0 0.0 0.0
Other invest/financing cash flow 16.3 (15.7) 1.4 0.0 0.0
Effect of exch rate changes 0.0 0.0 0.0 0.0 0.0
Net cash flow 20.8 37.3 43.4 26.1 31.8
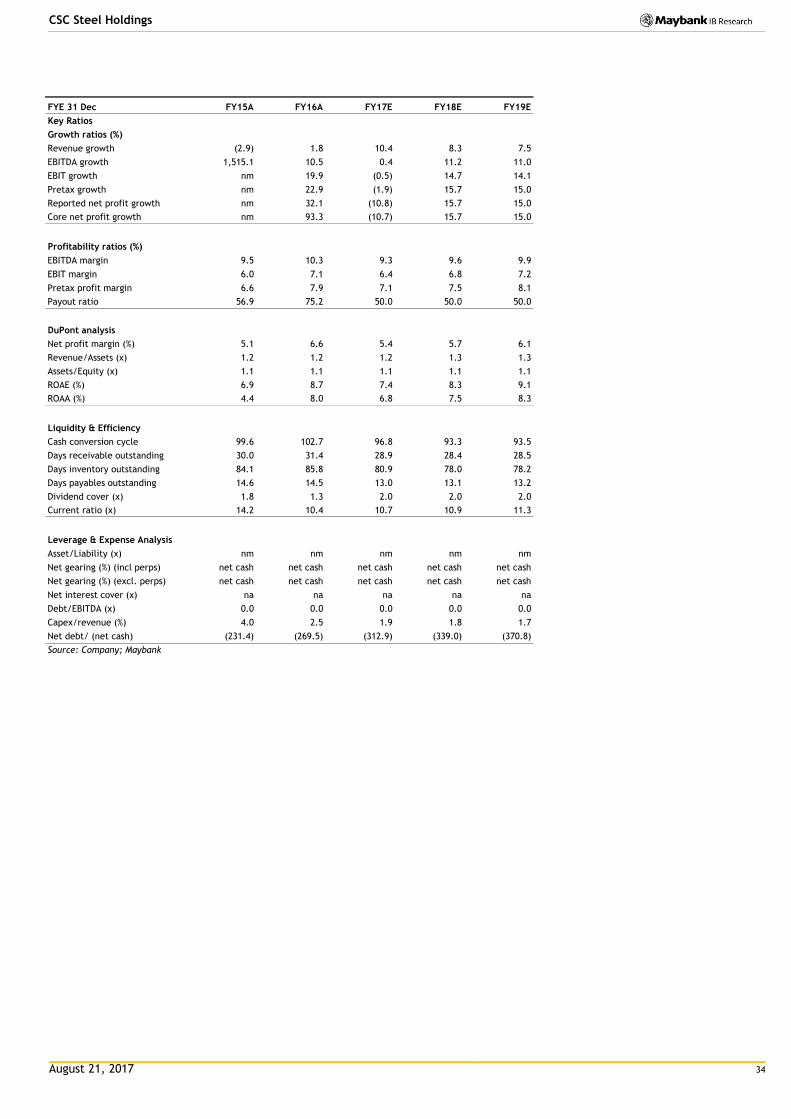
August 21, 2017 34
CSC Steel Holdings
FYE 31 Dec FY15A FY16A FY17E FY18E FY19E
Key Ratios
Growth ratios (%)
Revenue growth (2.9) 1.8 10.4 8.3 7.5
EBITDA growth 1,515.1 10.5 0.4 11.2 11.0
EBIT growth nm 19.9 (0.5) 14.7 14.1
Pretax growth nm 22.9 (1.9) 15.7 15.0
Reported net profit growth nm 32.1 (10.8) 15.7 15.0
Core net profit growth nm 93.3 (10.7) 15.7 15.0
Profitability ratios (%)
EBITDA margin 9.5 10.3 9.3 9.6 9.9
EBIT margin 6.0 7.1 6.4 6.8 7.2
Pretax profit margin 6.6 7.9 7.1 7.5 8.1
Payout ratio 56.9 75.2 50.0 50.0 50.0
DuPont analysis
Net profit margin (%) 5.1 6.6 5.4 5.7 6.1
Revenue/Assets (x) 1.2 1.2 1.2 1.3 1.3
Assets/Equity (x) 1.1 1.1 1.1 1.1 1.1
ROAE (%) 6.9 8.7 7.4 8.3 9.1
ROAA (%) 4.4 8.0 6.8 7.5 8.3
Liquidity & Efficiency
Cash conversion cycle 99.6 102.7 96.8 93.3 93.5
Days receivable outstanding 30.0 31.4 28.9 28.4 28.5
Days inventory outstanding 84.1 85.8 80.9 78.0 78.2
Days payables outstanding 14.6 14.5 13.0 13.1 13.2
Dividend cover (x) 1.8 1.3 2.0 2.0 2.0
Current ratio (x) 14.2 10.4 10.7 10.9 11.3
Leverage & Expense Analysis
Asset/Liability (x) nm nm nm nm nm
Net gearing (%) (incl perps) net cash net cash net cash net cash net cash
Net gearing (%) (excl. perps) net cash net cash net cash net cash net cash
Net interest cover (x) na na na na na
Debt/EBITDA (x) 0.0 0.0 0.0 0.0 0.0
Capex/revenue (%) 4.0 2.5 1.9 1.8 1.7
Net debt/ (net cash) (231.4) (269.5) (312.9) (339.0) (370.8)
Source: Company; Maybank
August 21, 2017 35
CSC Steel Holdings
Research Offices
REGIONAL
Sadiq CURRIMBHOY
Regional Head, Research & Economics
(65) 6231 5836 [email protected]
WONG Chew Hann, CA
Regional Head of Institutional Research
(603) 2297 8686 [email protected]
ONG Seng Yeow
Regional Head of Retail Research
(65) 6231 5839 [email protected]
TAN Sin Mui
Director of Research
(65) 6231 5849 [email protected]
ECONOMICS
Suhaimi ILIAS Chief Economist Malaysia | Philippines (603) 2297 8682 [email protected]
CHUA Hak Bin Regional Thematic Macroeconomist (65) 6231 5830 [email protected]
LEE Ju Ye Singapore (65) 6231 5844 [email protected]
Saktiandi SUPAAT Head, FX Research (65) 6320 1379 [email protected]
STRATEGY
Sadiq CURRIMBHOY
Global Strategist
(65) 6231 5836 [email protected]
Willie CHAN
Hong Kong / Regional
(852) 2268 0631 [email protected]
MALAYSIA
WONG Chew Hann, CA Head of Research (603) 2297 8686 [email protected] • Strategy
Desmond CH’NG, ACA (603) 2297 8680 [email protected] • Banking & Finance
LIAW Thong Jung (603) 2297 8688 [email protected] • Oil & Gas Services- Regional
ONG Chee Ting, CA (603) 2297 8678 [email protected] • Plantations - Regional
Mohshin AZIZ (603) 2297 8692 [email protected] • Aviation - Regional • Petrochem
YIN Shao Yang, CPA (603) 2297 8916 [email protected] • Gaming – Regional • Media
TAN Chi Wei, CFA (603) 2297 8690 [email protected] • Power • Telcos
WONG Wei Sum, CFA
(603) 2297 8679 [email protected] • Property
LEE Yen Ling (603) 2297 8691 [email protected] • Building Materials • Glove • Ports • Shipping
Ivan YAP (603) 2297 8612 [email protected] • Automotive • Semiconductor • Technology
Kevin WONG (603) 2082 6824 [email protected] • REITs • Consumer Discretionary
LIEW Wei Han
(603) 2297 8676 [email protected] • Consumer Staples
Adrian WONG
(603) 2297 8675 [email protected] • Constructions • Healthcare
Jade TAM
(603) 2297 8687 [email protected] • Media • Building Materials
TEE Sze Chiah Head of Retail Research (603) 2082 6858 [email protected]
Nik Ihsan Raja Abdullah, MSTA, CFTe (603) 2297 8694 [email protected]
HONG KONG / CHINA
Benjamin HO (852) 2268 0632 [email protected] • Consumer & Auto
Christopher WONG (852)2268 0652 [email protected] • HK & China Properties
Jacqueline KO, CFA (852) 2268 0633 [email protected] • Consumer Staples & Durables
Ka Leong LO, CFA (852) 2268 0630 [email protected] • Consumer Discretionary & Auto
Mitchell KIM (852) 2268 0634 [email protected] • Internet & Telcos
Ning MA, CFA (852) 2268 0672 [email protected] • Insurance
Ricky NG, CFA (852) 2268 0689 [email protected] • Regional Renewables • HK & China Properties
Sonija LI, CFA, FRM (852) 2268 0641 [email protected] • Gaming
Stefan CHANG, CFA (852) 2268 0675 [email protected] • Technology – Regional
Tony Ren, MBA, CFA (852) 2268 0640 [email protected] • Healthcare & Pharmaceutical
INDIA
Jigar SHAH Head of Research
(91) 22 6623 2632 [email protected]
• Strategy • Oil & Gas • Automobile • Cement
Vishal MODI
(91) 22 6623 2607 [email protected]
• Banking & Financials
Neerav DALAL
(91) 22 6623 2606 [email protected]
• Software Technology • Telcos
Vishal PERIWAL
(91) 22 6623 2605 [email protected]
• Infrastructure
SINGAPORE
Neel SINHA Head of Research (65) 6231 5838 [email protected] • Strategy • SMID Caps – Regional
CHUA Su Tye (65) 6231 5842 [email protected] • REITs
Derrick HENG, CFA (65) 6231 5843 [email protected] • Transport • Property • REITs (Office)
John CHEONG, CFA (65) 6231 5845 [email protected] • Small & Mid Caps • Healthcare
NG Li Hiang (65) 6231 5840 [email protected] • Banks
INDONESIA
Isnaputra ISKANDAR Head of Research (62) 21 8066 8680 [email protected] • Strategy • Metals & Mining • Cement
Rahmi MARINA (62) 21 8066 8689 [email protected] • Banking & Finance
Aurellia SETIABUDI (62) 21 8066 8691 [email protected] • Property
Janni ASMAN (62) 21 8066 8687 [email protected] • Cigarette • Healthcare • Retail
Adhi TASMIN (62) 21 8066 8694 [email protected] • Plantations
PHILIPPINES
Minda OLONAN Head of Research (63) 2 849 8840 [email protected] • Strategy
Lovell SARREAL (63) 2 849 8841 [email protected] • Consumer • Media • Cement
Rommel RODRIGO (63) 2 849 8839 [email protected] • Conglomerates • Property • Gaming • Ports/ Logistics
Katherine TAN (63) 2 849 8843 [email protected] • Banks • Construction
THAILAND
Maria LAPIZ Head of Institutional Research Dir (66) 2257 0250 | (66) 2658 6300 ext 1399 [email protected] • Strategy • Consumer • Materials • Ind. Estates • Oil & Gas • Telcos
Sittichai DUANGRATTANACHAYA (66) 2658 6300 ext 1393 [email protected] • Services Sector • Transport • Property • Telcos
Tanawat RUENBANTERNG (66) 2658 6300 ext 1394 [email protected] • Banks & Diversified Financials
Sukit UDOMSIRIKUL Head of Retail Research (66) 2658 6300 ext 5090 [email protected]
Surachai PRAMUALCHAROENKIT (66) 2658 6300 ext 1470 [email protected] • Auto • Conmat • Contractor • Steel
Suttatip PEERASUB (66) 2658 6300 ext 1430 [email protected] • Media • Commerce
Sutthichai KUMWORACHAI (66) 2658 6300 ext 1400 [email protected] • Energy • Petrochem
Termporn TANTIVIVAT (66) 2658 6300 ext 1520 [email protected] • Property
Jaroonpan WATTANAWONG (66) 2658 6300 ext 1404 [email protected] • Transportation • Small cap
VIETNAM
LE Hong Lien, ACCA Head of Institutional Research (84) 8 44 555 888 x 8181 [email protected] • Strategy • Consumer • Diversified
THAI Quang Trung, CFA, Deputy Head, Institutional Research (84) 8 44 555 888 x 8180 [email protected] • Real Estate • Construction • Materials
LE Nguyen Nhat Chuyen (84) 8 44 555 888 x 8082 [email protected] • Oil & Gas
NGUYEN Thach Lam (84) 8 44 555 888 x 8085 [email protected] • Utilities
NGUYEN Thi Ngan Tuyen, Head of Retail Research (84) 8 44 555 888 x 8081 [email protected] • Food & Beverage • Oil&Gas • Banking
TRUONG Quang Binh, Deputy Head, Retail Research (84) 4 44 555 888 x 8087 [email protected] • Rubber Plantation • Tyres and Tubes • Oil&Gas
TRINH Thi Ngoc Diep (84) 4 44 555 888 x 8208 [email protected] • Technology • Utilities • Construction
NGUYEN Thi Sony Tra Mi (84) 8 44 555 888 x 8084 [email protected] • Port Operation • Pharmaceutical • Food & Beverage
NGUYEN Thanh Lam (84) 4 44 555 888 x 8086 [email protected] • Technical Analysis
August 21, 2017 36
CSC Steel Holdings
APPENDIX I: TERMS FOR PROVISION OF REPORT, DISCLAIMERS AND DISCLOSURES
DISCLAIMERS This research report is prepared for general circulation and for information purposes only and under no circumstances should it be considered or intended as an offer to sell or a solicitation of an offer to buy the securities referred to herein. Investors should note that values of such securities, if any, may fluctuate and that each security’s price or value may rise or fall. Opinions or recommendations contained herein are in form of technical ratings and fundamental ratings. Technical ratings may differ from fundamental ratings as technical valuations apply different methodologies and are purely based on price and volume-related information extracted from the relevant jurisdiction’s stock exchange in the equity analysis. Accordingly, investors’ returns may be less than the original sum invested. Past performance is not necessarily a guide to future performance. This report is not intended to provide personal investment advice and does not take into account the specific investment objectives, the financial situation and the particular needs of persons who may receive or read this report. Investors should therefore seek financial, legal and other advice regarding the appropriateness of investing in any securities or the investment strategies discussed or recommended in this report.
The information contained herein has been obtained from sources believed to be reliable but such sources have not been independently verified by Maybank Investment Bank Berhad, its subsidiary and affiliates (collectively, “MKE”) and consequently no representation is made as to the accuracy or completeness of this report by MKE and it should not be relied upon as such. Accordingly, MKE and its officers, directors, associates, connected parties and/or employees (collectively, “Representatives”) shall not be liable for any direct, indirect or consequential losses or damages that may arise from the use or reliance of this report. Any information, opinions or recommendations contained herein are subject to change at any time, without prior notice.
This report may contain forward looking statements which are often but not always identified by the use of words such as “anticipate”, “believe”, “estimate”, “intend”, “plan”, “expect”, “forecast”, “predict” and “project” and statements that an event or result “may”, “will”, “can”, “should”, “could” or “might” occur or be achieved and other similar expressions. Such forward looking statements are based on assumptions made and information currently available to us and are subject to certain risks and uncertainties that could cause the actual results to differ materially from those expressed in any forward looking statements. Readers are cautioned not to place undue relevance on these forward-looking statements. MKE expressly disclaims any obligation to update or revise any such forward looking statements to reflect new information, events or circumstances after the date of this publication or to reflect the occurrence of unanticipated events.
MKE and its officers, directors and employees, including persons involved in the preparation or issuance of this report, may, to the extent permitted by law, from time to time participate or invest in financing transactions with the issuer(s) of the securities mentioned in this report, perform services for or solicit business from such issuers, and/or have a position or holding, or other material interest, or effect transactions, in such securities or options thereon, or other investments related thereto. In addition, it may make markets in the securities mentioned in the material presented in this report. One or more directors, officers and/or employees of MKE may be a director of the issuers of the securities mentioned in this report to the extent permitted by law.
This report is prepared for the use of MKE’s clients and may not be reproduced, altered in any way, transmitted to, copied or distributed to any other party in whole or in part in any form or manner without the prior express written consent of MKE and MKE and its Representatives accepts no liability whatsoever for the actions of third parties in this respect.
This report is not directed to or intended for distribution to or use by any person or entity who is a citizen or resident of or located in any locality, state, country or other jurisdiction where such distribution, publication, availability or use would be contrary to law or regulation. This report is for distribution only under such circumstances as may be permitted by applicable law. The securities described herein may not be eligible for sale in all jurisdictions or to certain categories of investors. Without prejudice to the foregoing, the reader is to note that additional disclaimers, warnings or qualifications may apply based on geographical location of the person or entity receiving this report.
Malaysia Opinions or recommendations contained herein are in the form of technical ratings and fundamental ratings. Technical ratings may differ from fundamental ratings as technical valuations apply different methodologies and are purely based on price and volume-related information extracted from Bursa Malaysia Securities Berhad in the equity analysis.
Singapore This report has been produced as of the date hereof and the information herein may be subject to change. Maybank Kim Eng Research Pte. Ltd. (“Maybank KERPL”) in Singapore has no obligation to update such information for any recipient. For distribution in Singapore, recipients of this report are to contact Maybank KERPL in Singapore in respect of any matters arising from, or in connection with, this report. If the recipient of this report is not an accredited investor, expert investor or institutional investor (as defined under Section 4A of the Singapore Securities and Futures Act), Maybank KERPL shall be legally liable for the contents of this report, with such liability being limited to the extent (if any) as permitted by law.
Thailand Except as specifically permitted, no part of this presentation may be reproduced or distributed in any manner without the prior written permission of Maybank Kim Eng Securities (Thailand) Public Company Limited. Maybank Kim Eng Securities (Thailand) Public Company Limited (“MBKET”) accepts no liability whatsoever for the actions of third parties in this respect.
Due to different characteristics, objectives and strategies of institutional and retail investors, the research reports of MBKET Institutional and Retail Research Department may differ in either recommendation or target price, or both. MBKET Retail Research is intended for retail investors (http://kelive.maybank-ke.co.th) while Maybank Kim Eng Institutional Research is intended only for institutional investors based outside Thailand only.
The disclosure of the survey result of the Thai Institute of Directors Association (“IOD”) regarding corporate governance is made pursuant to the policy of the Office of the Securities and Exchange Commission. The survey of the IOD is based on the information of a company listed on the Stock Exchange of Thailand and the market for Alternative Investment disclosed to the public and able to be accessed by a general public investor. The result, therefore, is from the perspective of a third party. It is not an evaluation of operation and is not based on inside information. The survey result is as of the date appearing in the Corporate Governance Report of Thai Listed Companies. As a result, the survey may be changed after that date. MBKET does not confirm nor certify the accuracy of such survey result.
The disclosure of the Anti-Corruption Progress Indicators of a listed company on the Stock Exchange of Thailand, which is assessed by Thaipat Institute, is made in order to comply with the policy and sustainable development plan for the listed companies of the Office of the Securities and Exchange Commission. Thaipat Institute made this assessment based on the information received from the listed company, as stipulated in the form for the assessment of Anti-corruption which refers to the Annual Registration Statement (Form 56-1), Annual Report (Form 56-2), or other relevant documents or reports of such listed company. The assessment result is therefore made from the perspective of Thaipat Institute that is a third party. It is not an assessment of operation and is not based on any inside information. Since this assessment is only the assessment result as of the date appearing in the assessment result, it may be changed after that date or when there is any change to the relevant information. Nevertheless, MBKET does not confirm, verify, or certify the accuracy and completeness of the assessment result.
US This third-party research report is distributed in the United States (“US”) to Major US Institutional Investors (as defined in Rule 15a-6 under the Securities Exchange Act of 1934, as amended) only by Maybank Kim Eng Securities USA Inc (“Maybank KESUSA”), a broker-dealer registered in the US (registered under Section 15 of the Securities Exchange Act of 1934, as amended). All responsibility for the distribution of this report by Maybank KESUSA in the US shall be borne by Maybank KESUSA. This report is not directed at you if MKE is prohibited or restricted by any legislation or regulation in any jurisdiction from making it available to you. You should satisfy yourself before reading it that Maybank KESUSA is permitted to provide research material concerning investments to you under relevant legislation and regulations. All U.S. persons receiving and/or accessing this report and wishing to effect transactions in any security mentioned within must do so with: Maybank Kim Eng Securities USA Inc. 777 Third Avenue 21st Floor New York, New York 1- (212) 688-8886 and not with, the issuer of this report.
August 21, 2017 37
CSC Steel Holdings
Disclosure of Interest
Malaysia: MKE and its Representatives may from time to time have positions or be materially interested in the securities referred to herein and may further act as market maker or may have assumed an underwriting commitment or deal with such securities and may also perform or seek to perform investment banking services, advisory and other services for or relating to those companies.
Singapore: As of 21 August 2017, Maybank KERPL and the covering analyst do not have any interest in any companies recommended in this research report.
Thailand: MBKET may have a business relationship with or may possibly be an issuer of derivative warrants on the securities /companies mentioned in the research report. Therefore, Investors should exercise their own judgment before making any investment decisions. MBKET, its associates, directors, connected parties and/or employees may from time to time have interests and/or underwriting commitments in the securities mentioned in this report.
Hong Kong: As of 21 August 2017, KESHK and the authoring analyst do not have any interest in any companies recommended in this research report.
India: As of 21 August 2017, and at the end of the month immediately preceding the date of publication of the research report, KESI, authoring analyst or their associate / relative does not hold any financial interest or any actual or beneficial ownership in any shares or having any conflict of interest in the subject companies except as otherwise disclosed in the research report. In the past twelve months KESI and authoring analyst or their associate did not receive any compensation or other benefits from the subject companies or third party in connection with the research report on any account what so ever except as otherwise disclosed in the research report.
MKE may have, within the last three years, served as manager or co-manager of a public offering of securities for, or currently may make a primary market in issues of, any or all of the entities mentioned in this report or may be providing, or have provided within the previous 12 months, significant advice or investment services in relation to the investment concerned or a related investment and may receive compensation for the services provided from the companies covered in this report.
OTHERS
Analyst Certification of Independence
The views expressed in this research report accurately reflect the analyst’s personal views about any and all of the subject securities or issuers; and no part of the research analyst’s compensation was, is or will be, directly or indirectly, related to the specific recommendations or views expressed in the report.
Reminder
Structured securities are complex instruments, typically involve a high degree of risk and are intended for sale only to sophisticated investors who are capable of understanding and assuming the risks involved. The market value of any structured security may be affected by changes in economic, financial and political factors (including, but not limited to, spot and forward interest and exchange rates), time to maturity, market conditions and volatility and the credit quality of any issuer or reference issuer. Any investor interested in purchasing a structured product should conduct its own analysis of the product and consult with its own professional advisers as to the risks involved in making such a purchase.
No part of this material may be copied, photocopied or duplicated in any form by any means or redistributed without the prior consent of MKE.
Definition of Ratings
Maybank Kim Eng Research uses the following rating system
BUY Return is expected to be above 10% in the next 12 months (excluding dividends)
HOLD Return is expected to be between - 10% to +10% in the next 12 months (excluding dividends)
SELL Return is expected to be below -10% in the next 12 months (excluding dividends)
Applicability of Ratings
The respective analyst maintains a coverage universe of stocks, the list of which may be adjusted according to needs. Investment ratings are only applicable to the stocks which form part of the coverage universe. Reports on companies which are not part of the coverage do not carry investment ratings as we do not actively follow developments in these companies.
UK This document is being distributed by Maybank Kim Eng Securities (London) Ltd (“Maybank KESL”) which is authorized and regulated, by the Financial Conduct Authority and is for Informational Purposes only. This document is not intended for distribution to anyone defined as a Retail Client under the Financial Services and Markets Act 2000 within the UK. Any inclusion of a third party link is for the recipients convenience only, and that the firm does not take any responsibility for its comments or accuracy, and that access to such links is at the individuals own risk. Nothing in this report should be considered as constituting legal, accounting or tax advice, and that for accurate guidance recipients should consult with their own independent tax advisers.
DISCLOSURES Legal Entities Disclosures Malaysia: This report is issued and distributed in Malaysia by Maybank Investment Bank Berhad (15938- H) which is a Participating Organization of Bursa Malaysia Berhad and a holder of Capital Markets and Services License issued by the Securities Commission in Malaysia. Singapore: This report is distributed in Singapore by Maybank KERPL (Co. Reg No 198700034E) which is regulated by the Monetary Authority of Singapore. Indonesia: PT Maybank Kim Eng Securities (“PTMKES”) (Reg. No. KEP-251/PM/1992) is a member of the Indonesia Stock Exchange and is regulated by the Financial Services Authority (Indonesia). Thailand: MBKET (Reg. No.0107545000314) is a member of the Stock Exchange of Thailand and is regulated by the Ministry of Finance and the Securities and Exchange Commission. Philippines: Maybank ATRKES (Reg. No.01-2004-00019) is a member of the Philippines Stock Exchange and is regulated by the Securities and Exchange Commission. Vietnam: Maybank Kim Eng Securities Limited (License Number: 117/GP-UBCK) is licensed under the State Securities Commission of Vietnam. Hong Kong: KESHK (Central Entity No AAD284) is regulated by the Securities and Futures Commission. India: Kim Eng Securities India Private Limited (“KESI”) is a participant of the National Stock Exchange of India Limited and the Bombay Stock Exchange and is regulated by Securities and Exchange Board of India (“SEBI”) (Reg. No. INZ000010538). KESI is also registered with SEBI as Category 1 Merchant Banker (Reg. No. INM 000011708) and as Research Analyst (Reg No: INH000000057) US: Maybank KESUSA is a member of/ and is authorized and regulated by the FINRA – Broker ID 27861. UK: Maybank KESL (Reg No 2377538) is authorized and regulated by the Financial Services Authority.

August 21, 2017 38
CSC Steel Holdings
Malaysia Maybank Investment Bank Berhad
(A Participating Organisation of
Bursa Malaysia Securities Berhad)
33rd Floor, Menara Maybank,
100 Jalan Tun Perak,
50050 Kuala Lumpur
Tel: (603) 2059 1888;
Fax: (603) 2078 4194
Singapore Maybank Kim Eng Securities Pte Ltd
Maybank Kim Eng Research Pte Ltd
50 North Canal Road
Singapore 059304
Tel: (65) 6336 9090
London Maybank Kim Eng Securities
(London) Ltd
PNB House
77 Queen Victoria Street
London EC4V 4AY, UK
Tel: (44) 20 7332 0221
Fax: (44) 20 7332 0302
New York Maybank Kim Eng Securities USA
Inc
777 Third Avenue, 21st Floor
New York, NY 10017, U.S.A.
Tel: (212) 688 8886
Fax: (212) 688 3500
Stockbroking Business:
Level 8, Tower C, Dataran Maybank,
No.1, Jalan Maarof
59000 Kuala Lumpur
Tel: (603) 2297 8888
Fax: (603) 2282 5136
Hong Kong Kim Eng Securities (HK) Ltd
Level 30,
Three Pacific Place,
1 Queen’s Road East,
Hong Kong
Tel: (852) 2268 0800
Fax: (852) 2877 0104
Indonesia PT Maybank Kim Eng Securities
Sentral Senayan III, 22nd Floor
Jl. Asia Afrika No. 8
Gelora Bung Karno, Senayan
Jakarta 10270, Indonesia
Tel: (62) 21 2557 1188
Fax: (62) 21 2557 1189
India Kim Eng Securities India Pvt Ltd
2nd Floor, The International,
16, Maharishi Karve Road,
Churchgate Station,
Mumbai City - 400 020, India
Tel: (91) 22 6623 2600
Fax: (91) 22 6623 2604
Philippines Maybank ATR Kim Eng Securities Inc.
17/F, Tower One & Exchange Plaza
Ayala Triangle, Ayala Avenue
Makati City, Philippines 1200
Tel: (63) 2 849 8888
Fax: (63) 2 848 5738
Thailand Maybank Kim Eng Securities
(Thailand) Public Company Limited
999/9 The Offices at Central World,
20th - 21st Floor,
Rama 1 Road Pathumwan,
Bangkok 10330, Thailand
Tel: (66) 2 658 6817 (sales)
Tel: (66) 2 658 6801 (research)
Vietnam Maybank Kim Eng Securities Limited
4A-15+16 Floor Vincom Center Dong
Khoi, 72 Le Thanh Ton St. District 1
Ho Chi Minh City, Vietnam
Tel : (84) 844 555 888
Fax : (84) 8 38 271 030
Saudi Arabia In association with
Anfaal Capital
Villa 47, Tujjar Jeddah
Prince Mohammed bin Abdulaziz
Street P.O. Box 126575
Jeddah 21352
Tel: (966) 2 6068686
Fax: (966) 26068787
South Asia Sales Trading Kevin Foy
Regional Head Sales Trading
Tel: (65) 6636-3620
US Toll Free: 1-866-406-7447
North Asia Sales Trading Andrew Lee
Tel: (852) 2268 0283
US Toll Free: 1 877 837 7635
Malaysia Joann Lim [email protected] Tel: (603) 2717 5166
Thailand Tanasak Krishnasreni [email protected] Tel: (66)2 658 6820
Indonesia Harianto Liong [email protected] Tel: (62) 21 2557 1177
London Scott Kinnear-Nock [email protected] Tel: (44) 207-332-0221
New York Andrew Dacey [email protected] Tel: (212) 688 2956
India Manish Modi [email protected] Tel: (91)-22-6623-2601
Vietnam Patrick Mitchell
Tel: (84)-8-44-555-888 x8080
Philippines Keith Roy [email protected] Tel: (63) 2 848-5288
www.maybank-ke.com | www.maybank-keresearch.com