Crystal Structure of Desulforedoxin from Desulfovibrio gigasDetermined at 1.8 Å Resolution: A Novel...
13
J. Mol. Biol. (1995) 251, 690–702 Crystal Structure of Desulforedoxin from Desulfovibrio gigas Determined at 1.8 Å Resolution: A Novel Non-heme Iron Protein Structure Margarida Archer 1 , Robert Huber 3 , Pedro Tavares 4 , Isabel Moura 4 Jose ´ J. G. Moura 4 , Maria A. Carrondo 1,2 , Larry C. Sieker 5 , Jean LeGall 6 and Maria J. Roma ˜o 1,2 * 1 Instituto de Tecnologia The crystal structure of desulforedoxin from Desulfovibrio gigas , a new Quı ´mica e Biolo ´gica homo-dimeric (2×36 amino acids) non-heme iron protein, has been solved Rua da Quinta Grande by the SIRAS method using the indium-substituted protein as the single Apt. 127, 2780 Oeiras derivative. The structure was refined to a crystallographic R-factor of 16.9% at 1.8 Å resolution. Native desulforedoxin crystals were grown from either Portugal PEG 4K or lithium sulfate, with cell constants a = b = 42.18 Å, c = 72.22 Å 2 Instituto Superior Te ´cnico (for crystals grown from PEG 4K), and they belong to space group P3 2 21. Departamento de Quı ´mica The indium-substituted protein crystallized isomorphously under the 1096 Lisboa Codex same conditions. Portugal The 2-fold symmetric dimer is firmly hydrogen bonded and folds as an incomplete b-barrel with the two iron centers placed on opposite poles of the 3 Max-Planck-Institut fu ¨r molecule. Each iron atom is coordinated to four cysteinyl residues in a Biochemie, Martinsried distorted tetrahedral arrangement. Both iron atoms are 16 Å apart but Germany connected across the 2-fold axis by 14 covalent bonds along the polypeptide 4 Departamento de Quı ´mica chain plus two hydrogen bonds. (and Centro de Quı ´mica Fina Desulforedoxin and rubredoxin share some structural features but show e Biotecnologia), Faculdade de significant differences in terms of metal environment and water structure, Cie x ncias e Tecnologia which account for the known spectroscopic differences between rubredoxin Universidade Nova de Lisboa and desulforedoxin. 7 1995 Academic Press Limited 2825 Monte de Caparica Portugal 5 Department of Biological Structures, SM-20 University of Washington Seattle, WA 98195, USA 6 Department of Biochemistry and Molecular Biology University of Georgia Athens, GA 30602, USA Keywords: rubredoxin type proteins; desulforedoxin; sulfate reducing *Corresponding author bacteria; X-ray; 3D structure; crystallization Abbreviations used: Dx, desulforedoxin; Dfx, desulfoferrodoxin; DXLI, native crystals of Dx grown from lithium sulfate; DXPE, native crystals of Dx grown from PEG 4K; DXIN, derivative crystals of indium-substituted Dx grown from lithium sulfate; Rd, rubredoxin; r.m.s., root mean square; CSD, Cambridge Structural Database; SIRAS, single isomorphous replacement and anomalous scattering; PEG, polyethyleneglycol; EPR, electron paramagnetic resonance. Introduction Desulforedoxin (Dx), isolated from the sulfate reducing bacterium Desulfovibrio gigas , is a small metalloprotein (homodimer of molecular mass 7.9 kDa) containing an iron atom bound to four cysteine residues (Moura et al ., 1977), a metal center similar to the one found in rubredoxin (Rd). The latter protein has been extensively studied and its crystal structure analyzed at very high 0022–2836/95/350690–13 $12.00/0 7 1995 Academic Press Limited
-
Upload
independent -
Category
Documents
-
view
2 -
download
0
Transcript of Crystal Structure of Desulforedoxin from Desulfovibrio gigasDetermined at 1.8 Å Resolution: A Novel...
JMB—MS 708 Cust. Ref. No. CAM 085/95 [SGML]
J. Mol. Biol. (1995) 251, 690–702
Crystal Structure of Desulforedoxin from Desulfovibriogigas Determined at 1.8 Å Resolution: A NovelNon-heme Iron Protein Structure
Margarida Archer 1, Robert Huber 3, Pedro Tavares 4, Isabel Moura 4
Jose J. G. Moura 4, Maria A. Carrondo 1,2, Larry C. Sieker 5, Jean LeGall 6
and Maria J. Roma˜o1,2*
1Instituto de Tecnologia The crystal structure of desulforedoxin from Desulfovibrio gigas, a newQuımica e Biologica homo-dimeric (2×36 amino acids) non-heme iron protein, has been solvedRua da Quinta Grande by the SIRAS method using the indium-substituted protein as the singleApt. 127, 2780 Oeiras derivative. The structure was refined to a crystallographic R-factor of 16.9%
at 1.8 Å resolution. Native desulforedoxin crystals were grown from eitherPortugalPEG 4K or lithium sulfate, with cell constants a = b = 42.18 Å, c = 72.22 Å2Instituto Superior Tecnico (for crystals grown from PEG 4K), and they belong to space group P3221.
Departamento de Quımica The indium-substituted protein crystallized isomorphously under the1096 Lisboa Codex same conditions.Portugal The 2-fold symmetric dimer is firmly hydrogen bonded and folds as an
incomplete b-barrel with the two iron centers placed on opposite poles of the3Max-Planck-Institut furmolecule. Each iron atom is coordinated to four cysteinyl residues in aBiochemie, Martinsrieddistorted tetrahedral arrangement. Both iron atoms are 16 Å apart butGermanyconnected across the 2-fold axis by 14 covalent bonds along the polypeptide4Departamento de Quımica chain plus two hydrogen bonds.
(and Centro de Quımica Fina Desulforedoxin and rubredoxin share some structural features but showe Biotecnologia), Faculdade de significant differences in terms of metal environment and water structure,Ciex ncias e Tecnologia which account for the known spectroscopic differences between rubredoxinUniversidade Nova de Lisboa and desulforedoxin. 7 1995 Academic Press Limited2825 Monte de CaparicaPortugal5Department of BiologicalStructures, SM-20University of WashingtonSeattle, WA 98195, USA6Department of Biochemistryand Molecular BiologyUniversity of GeorgiaAthens, GA 30602, USA
Keywords: rubredoxin type proteins; desulforedoxin; sulfate reducing*Corresponding author bacteria; X-ray; 3D structure; crystallization
Abbreviations used: Dx, desulforedoxin; Dfx,desulfoferrodoxin; DXLI, native crystals of Dx grownfrom lithium sulfate; DXPE, native crystals of Dx grownfrom PEG 4K; DXIN, derivative crystals ofindium-substituted Dx grown from lithium sulfate; Rd,rubredoxin; r.m.s., root mean square; CSD, CambridgeStructural Database; SIRAS, single isomorphousreplacement and anomalous scattering; PEG,polyethyleneglycol; EPR, electron paramagneticresonance.
Introduction
Desulforedoxin (Dx), isolated from the sulfatereducing bacterium Desulfovibrio gigas, is a smallmetalloprotein (homodimer of molecular mass7.9 kDa) containing an iron atom bound to fourcysteine residues (Moura et al., 1977), a metal centersimilar to the one found in rubredoxin (Rd). Thelatter protein has been extensively studiedand its crystal structure analyzed at very high
0022–2836/95/350690–13 $12.00/0 7 1995 Academic Press Limited

JMB—MS 708
Crystal Structure of Desulforedoxin 691
resolution, i.e. 1.0 A (Dauter et al., 1992). Desulfore-doxin is a dimer made up of two identical subunits,with 36 amino acid residues each, which lackhistidine, arginine, proline, isoleucine, phenyl-alanine and tryptophan. Each monomer of Dx hasone iron atom and four cysteinyl residues. Labelingof the Dx cysteine residues with tritium revealed nofree cysteine, confirming that all the cysteineresidues are coordinated to the metal (Moura et al.,1980).
The amino acid sequence of the polypeptide chainwas determined (Bruschi et al., 1979) and confirmedby sequencing the Dx encoding gene (Brumlik et al.,1990). The pattern of the iron-ligating cysteineresidues in Dx is different from that in rubredoxin.In rubredoxin, two pairs of cysteine residues, whichare each separated by two residues, coordinate theiron:
The -Cys-X-X-Cys- motif adopts a helical confor-mation. In Dx, the sequential arrangement of the firstpair of cysteine residues is similar, but the secondpair has vicinal cysteine residues:
It has been speculated that vicinal cysteine ligandscreate a distorted tetrahedral coordination and arethe origin of the observed spectroscopic differences(Moura et al., 1977, 1979a, 1980) between Dx and Rd.The redox potential of this type of center has a valueof −35 mV (Moura et al., 1979a), similar to that foundfor rubredoxin (between 0 and −50 mV; Moura et al.,1979b).
The reported Dx amino acid sequence has nosimilarities with other known non-heme ironproteins, with the exception of desulfoferrodoxin(Dfx) isolated from D. desulfuricans ATCC 27774(Moura et al., 1990) and from D. vulgaris (Brumlik &Voordouw, 1989; Moura et al., 1990), in which the Nterminus is highly homologous (67% identity;Brumlik et al., 1990) with the Dx sequence. Dfx hastwo types of iron: an Fe(Cys)4 site very similar to thatfound in desulforedoxin from D. gigas (center I) andan octahedral coordinated high-spin iron site mostprobably with nitrogen- and oxygen-containingligands (center II). A blue protein, isolated fromD. gigas, was shown to contain a similar center(Chen et al., 1994), thus supporting the idea that Dfxresults from a fusion between genes coding for Dxand another protein (Brumlik et al., 1990).
The visible spectrum of Dx is very similar to thatof rubredoxin, exhibiting maxima at 507, 370 and278 nm (Moura et al., 1977). The EPR spectrum of thenative protein has resonances at g = 7.7, 5.7, 4.1 and1.8 (Moura et al., 1979a, 1980). These resonances havebeen attributed to a high-spin ferric ion (S = 5/2)with E/D = 0.08. Rubredoxins have an E/D = 0.28,originating a typical ‘‘g = 4.3 EPR resonance’’ dueto the middle Kramer doublet. Mossbauer spec-
troscopy reveals, for the reduced form of Dx, aquadrupole doublet with DEQ = 3.55 mm/s andd = 0.70 mm/s (Moura et al., 1980). These values aretypical of high-spin ferric atoms with tetrahedralsulfur coordination and are similar to thosedetermined for rubredoxin from D. gigas, againindicating iron coordination by four cysteineresidues.
However, as mentioned above, the spectralproperties of the iron site in Dx are distinctlydifferent from those observed for rubredoxin,suggesting that the metal ligand geometry and/orcoordination environment of these proteins differ.The hyperfine coupling constant, for example,determined from Mossbauer spectroscopy for the Dxcenter, is smaller than the value determined for Rds,suggesting a Cys–Fe bond with a more covalentcharacter than is found in Rds (Moura et al., 1980).
Recently, it was suggested (Verhagen et al., 1993)that the Dx metal coordination could involve sulfurand oxygen ligands up to a coordination numberof 7. The X-ray structure determination of D. gigas
Dx now reported shows that the iron center iscoordinated by four cysteinyl residues, confirmingprevious suggestions based on spectroscopic studies(Moura et al., 1980).
Results and Discussion
Quality of the model
The final electron density map for Dx wascalculated using Fourier coefficients (2Fobs − Fcalc;Figures 1 and 2) and clearly shows density for allmain-chain atoms, iron centers and 70 watermolecules in the PEG structure (DXPE). For the dataobtained from crystals grown in lithium sulfate,DXLI and indium-substituted DXIN, one sulfate ionper molecule is present, together with 55 watermolecules for DXLI, and 46 for DXIN. In bothstructures the sulfate ion mediates a crystal contact.It is stabilized by hydrogen bonds to five watermolecules, to main-chain nitrogen atoms from Thr25and from Cys29 on one side, and by salt bridges tothe Ne of Lys17 from a symmetry-related moleculeon the other side.
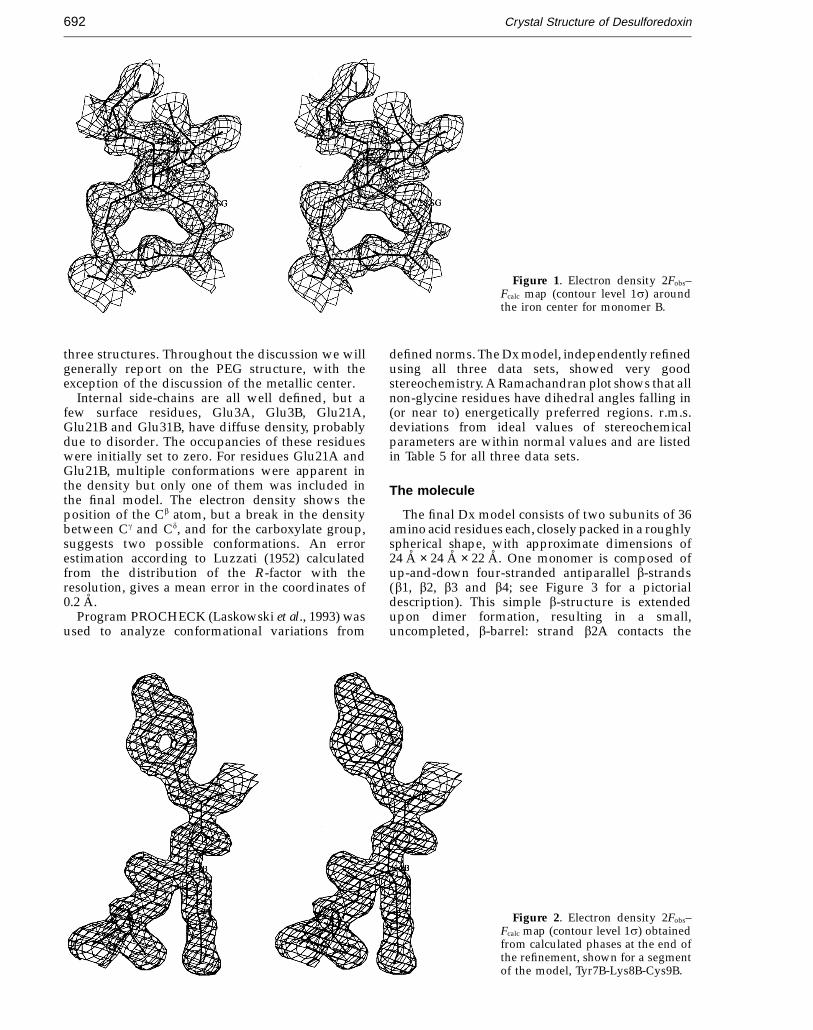
At the first stages of refinement, both iron centerswere very clear in density, allowing unambiguousidentification of the tetrahedral coordination forthe four cysteinyl residues around the iron atom.Figure 1 shows the electron density of the final2Fobs − Fcalc map around the iron center (for theDXPE data). All three structures (DXPE, DXLI andDXIN) were found to be equivalent. Relevant watermolecules are conserved and also the few disorderedside-chains of surface residues are the same for the
---Cys6---X---X---Cys9---[Xn ]---Cys39---Pro---X---Cys42---Gly---
---Cys9---X---X---Cys12---[Xm ]---Cys28---Cys29---Gly---
JMB—MS 708
Crystal Structure of Desulforedoxin692
Figure 1. Electron density 2Fobs–Fcalc map (contour level 1s) aroundthe iron center for monomer B.
three structures. Throughout the discussion we willgenerally report on the PEG structure, with theexception of the discussion of the metallic center.
Internal side-chains are all well defined, but afew surface residues, Glu3A, Glu3B, Glu21A,Glu21B and Glu31B, have diffuse density, probablydue to disorder. The occupancies of these residueswere initially set to zero. For residues Glu21A andGlu21B, multiple conformations were apparent inthe density but only one of them was included inthe final model. The electron density shows theposition of the Cb atom, but a break in the densitybetween Cg and Cd, and for the carboxylate group,suggests two possible conformations. An errorestimation according to Luzzati (1952) calculatedfrom the distribution of the R-factor with theresolution, gives a mean error in the coordinates of0.2 A.
Program PROCHECK (Laskowski et al., 1993) wasused to analyze conformational variations from
defined norms. The Dx model, independently refinedusing all three data sets, showed very goodstereochemistry. A Ramachandran plot shows that allnon-glycine residues have dihedral angles falling in(or near to) energetically preferred regions. r.m.s.deviations from ideal values of stereochemicalparameters are within normal values and are listedin Table 5 for all three data sets.
The molecule
The final Dx model consists of two subunits of 36amino acid residues each, closely packed in a roughlyspherical shape, with approximate dimensions of24 A × 24 A × 22 A. One monomer is composed ofup-and-down four-stranded antiparallel b-strands(b1, b2, b3 and b4; see Figure 3 for a pictorialdescription). This simple b-structure is extendedupon dimer formation, resulting in a small,uncompleted, b-barrel: strand b2A contacts the
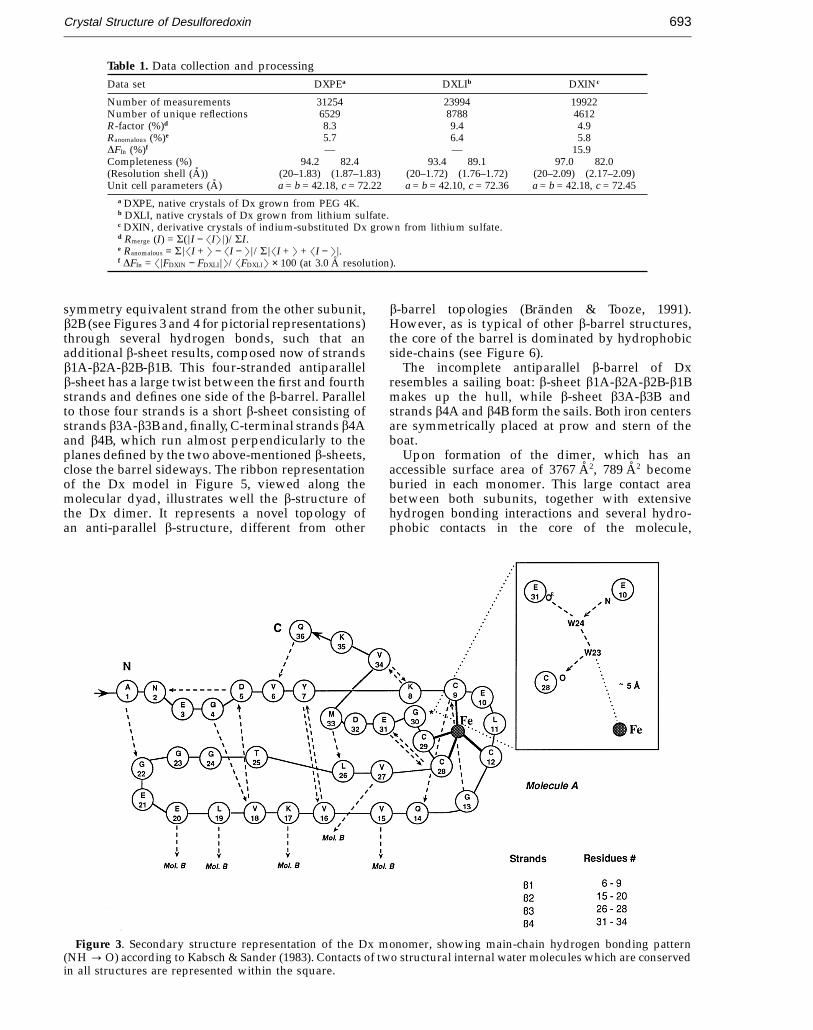
Figure 2. Electron density 2Fobs–Fcalc map (contour level 1s) obtainedfrom calculated phases at the end ofthe refinement, shown for a segmentof the model, Tyr7B-Lys8B-Cys9B.
JMB—MS 708
Crystal Structure of Desulforedoxin 693
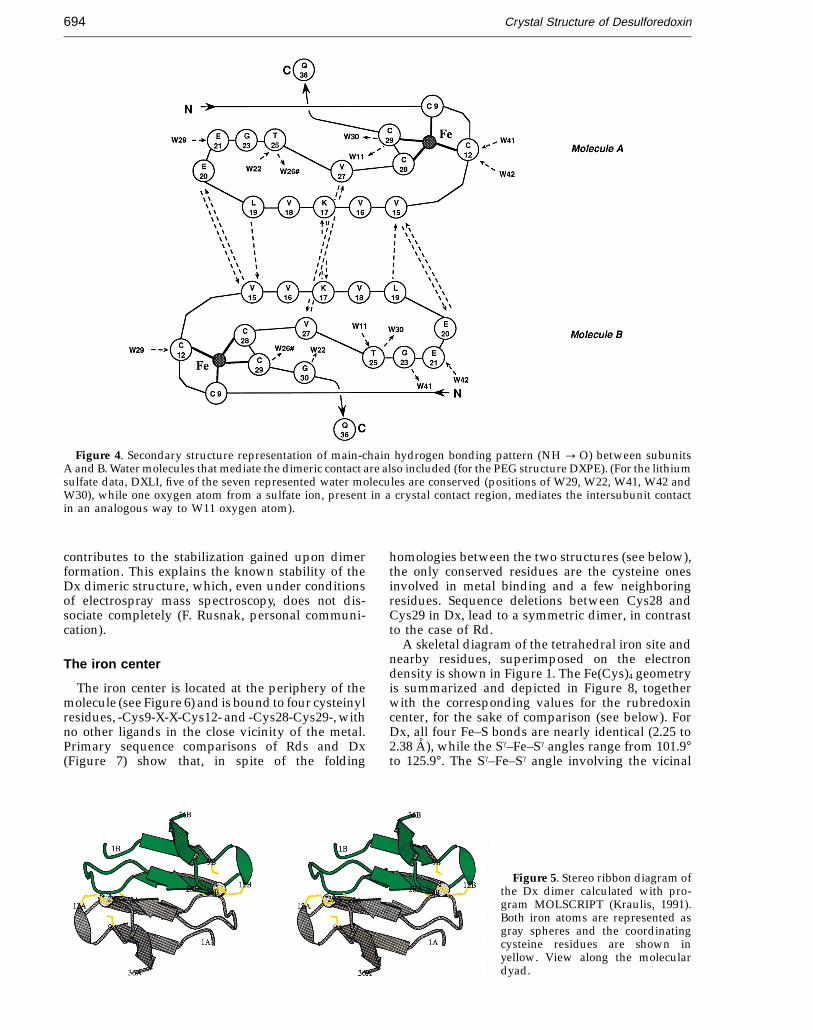
Table 1. Data collection and processingData set DXPEa DXLIb DXINc
Number of measurements 31254 23994 19922Number of unique reflections 6529 8788 4612R-factor (%)d 8.3 9.4 4.9Ranomalous (%)e 5.7 6.4 5.8DFIn (%)f — — 15.9Completeness (%) 94.2 82.4 93.4 89.1 97.0 82.0(Resolution shell (A)) (20–1.83) (1.87–1.83) (20–1.72) (1.76–1.72) (20–2.09) (2.17–2.09)Unit cell parameters (A) a = b = 42.18, c = 72.22 a = b = 42.10, c = 72.36 a = b = 42.18, c = 72.45
a DXPE, native crystals of Dx grown from PEG 4K.b DXLI, native crystals of Dx grown from lithium sulfate.c DXIN, derivative crystals of indium-substituted Dx grown from lithium sulfate.d Rmerge (I) = S(=I − �I�=)/SI.e Ranomalous = S=�I + � − �I − �=/S=�I + � + �I − �=.f DFIn = �=FDXIN − FDXLI=�/�FDXLI� × 100 (at 3.0 A resolution).
symmetry equivalent strand from the other subunit,b2B (see Figures 3 and 4 for pictorial representations)through several hydrogen bonds, such that anadditional b-sheet results, composed now of strandsb1A-b2A-b2B-b1B. This four-stranded antiparallelb-sheet has a large twist between the first and fourthstrands and defines one side of the b-barrel. Parallelto those four strands is a short b-sheet consisting ofstrands b3A-b3B and, finally, C-terminal strands b4Aand b4B, which run almost perpendicularly to theplanes defined by the two above-mentioned b-sheets,close the barrel sideways. The ribbon representationof the Dx model in Figure 5, viewed along themolecular dyad, illustrates well the b-structure ofthe Dx dimer. It represents a novel topology ofan anti-parallel b-structure, different from other
b-barrel topologies (Branden & Tooze, 1991).However, as is typical of other b-barrel structures,the core of the barrel is dominated by hydrophobicside-chains (see Figure 6).
The incomplete antiparallel b-barrel of Dxresembles a sailing boat: b-sheet b1A-b2A-b2B-b1Bmakes up the hull, while b-sheet b3A-b3B andstrands b4A and b4B form the sails. Both iron centersare symmetrically placed at prow and stern of theboat.
Upon formation of the dimer, which has anaccessible surface area of 3767 A2, 789 A2 becomeburied in each monomer. This large contact areabetween both subunits, together with extensivehydrogen bonding interactions and several hydro-phobic contacts in the core of the molecule,
Figure 3. Secondary structure representation of the Dx monomer, showing main-chain hydrogen bonding pattern(NH : O) according to Kabsch & Sander (1983). Contacts of two structural internal water molecules which are conservedin all structures are represented within the square.
JMB—MS 708
Crystal Structure of Desulforedoxin694
Figure 4. Secondary structure representation of main-chain hydrogen bonding pattern (NH : O) between subunitsA and B. Water molecules that mediate the dimeric contact are also included (for the PEG structure DXPE). (For the lithiumsulfate data, DXLI, five of the seven represented water molecules are conserved (positions of W29, W22, W41, W42 andW30), while one oxygen atom from a sulfate ion, present in a crystal contact region, mediates the intersubunit contactin an analogous way to W11 oxygen atom).
contributes to the stabilization gained upon dimerformation. This explains the known stability of theDx dimeric structure, which, even under conditionsof electrospray mass spectroscopy, does not dis-sociate completely (F. Rusnak, personal communi-cation).
The iron center
The iron center is located at the periphery of themolecule (see Figure 6) and is bound to four cysteinylresidues, -Cys9-X-X-Cys12- and -Cys28-Cys29-, withno other ligands in the close vicinity of the metal.Primary sequence comparisons of Rds and Dx(Figure 7) show that, in spite of the folding
homologies between the two structures (see below),the only conserved residues are the cysteine onesinvolved in metal binding and a few neighboringresidues. Sequence deletions between Cys28 andCys29 in Dx, lead to a symmetric dimer, in contrastto the case of Rd.
A skeletal diagram of the tetrahedral iron site andnearby residues, superimposed on the electrondensity is shown in Figure 1. The Fe(Cys)4 geometryis summarized and depicted in Figure 8, togetherwith the corresponding values for the rubredoxincenter, for the sake of comparison (see below). ForDx, all four Fe–S bonds are nearly identical (2.25 to2.38 A), while the Sg–Fe–Sg angles range from 101.9°to 125.9°. The Sg–Fe–Sg angle involving the vicinal
Figure 5. Stereo ribbon diagram ofthe Dx dimer calculated with pro-gram MOLSCRIPT (Kraulis, 1991).Both iron atoms are represented asgray spheres and the coordinatingcysteine residues are shown inyellow. View along the moleculardyad.
JMB—MS 708
Crystal Structure of Desulforedoxin 695
Figure 6. Stereo plot of the Dx dimer. Main-chain atoms are represented as small spheres. The only side-chain atomsare shown in yellow for the coordinating cysteine residues, as well as in black and green (subunits A and B, respectively)for the hydrophobic side-chains within the core of the molecule. Iron atoms are marked as large gray spheres.
cysteine residues, Cys28 and Cys29, is 120 to 126°,substantially widened when compared with exacttetrahedral geometry. We point out that in refinementthese values are biased to standard group geometry.Nevertheless, they indicate the direction of distor-tions for the bond angles.
The two metal atoms within the dimer are 16 Aapart, and are almost coplanar with strands b2Aand b2B. Residues at the Fe A. . .Fe B interfacecontribute two hydrogen bonds (Figure 4). Althoughdistant, the Fe A and Fe B centers are connectedacross the dimer 2-fold axis by these two hydrogenbonding contacts through main-chain atoms ofVal27A and its symmetry equivalent Val27B.The shortest through-bond electron transfer path-way between the two centers can thus be traced,involving 14 covalent bonds along the polypeptidechain, plus one hydrogen bond across thedimeric contact Cys28A-Val27A---Val27B-Cys28B(Figure 4). As described above, the Dx dimer is firmlyhydrogen bonded, which may contribute to andbe relevant for the proposed ET pathway to proceedthrough the length of the molecule. Furthermore,there are structural water molecules in the vicinity(05 A) of the iron center (see below, Solventstructure), which are not seen in Rd. These watermolecules may also play a role in the ET processin Dx. These structural features suggest rapidelectron exchange between the iron centers in thehalf-reduced species.
The indium center
The replacement of iron by indium did not changethe structure of the Dx molecule and even the waterstructure is rather well preserved. The geometryaround the In(Cys)4 center is summarized in Figure8. The bond distances were refined (unconstrained)to values that are comparable with literature data onsmall molecules containing the InS4 moiety (2.42 to2.49 A; Hirpo et al., 1993). The distortion from theideal tetrahedral geometry around the indium atom,due to the two vicinal cysteine residues, also leads toan enlargement of the Sg28–In–Sg29 angle (123.7 to123.9°) and to deviations in the other bond angles inthe same directions as was found for the Dx ironcenter.
Solvent structure
The refined model of Dx includes 70 watermolecules for DXPE, 55 water molecules forDXLI and 46 water molecules for DXIN (cf.Tables 4 and 5). The water molecules are foundessentially at the periphery of the Dx molecule,with two exceptions (see Figures 3 and 10): thesetwo internal, well ordered, water molecules (W23,W24) are in the second coordination sphere ofthe iron center and conserved in all three structures(Bav, DXPE = 10.9 A2; Bav, DXLI = 11.0 A2; Bav,DXIN = 8.4 A2). The hydrogen bonding network that
Figure 7. Amino acid primary sequence alignment of Dx with Desulfovibrio Rds and rubreritrin (D. vulgaris) sequences.

JMB—MS 708
Crystal Structure of Desulforedoxin696
Figure 8. Schematic representation of the metal site geometries for desulforedoxin (iron and indium) and rubredoxin(iron) structures. The values shown correspond to ranges of values for subunits A and B of desulforedoxin (structuresDXPE and DXLI) and to ranges of values for three different rubredoxin structures from Desulfovibrio species.
Figure 9. Stereo representation of the D. gigas rubredoxin structure (taken from the Protein Databank). Main-chain atomsare marked as black dots, cysteinyl side-chain atoms are colored yellow and the iron atom is represented as a large graysphere.
JMB—MS 708
Crystal Structure of Desulforedoxin 697
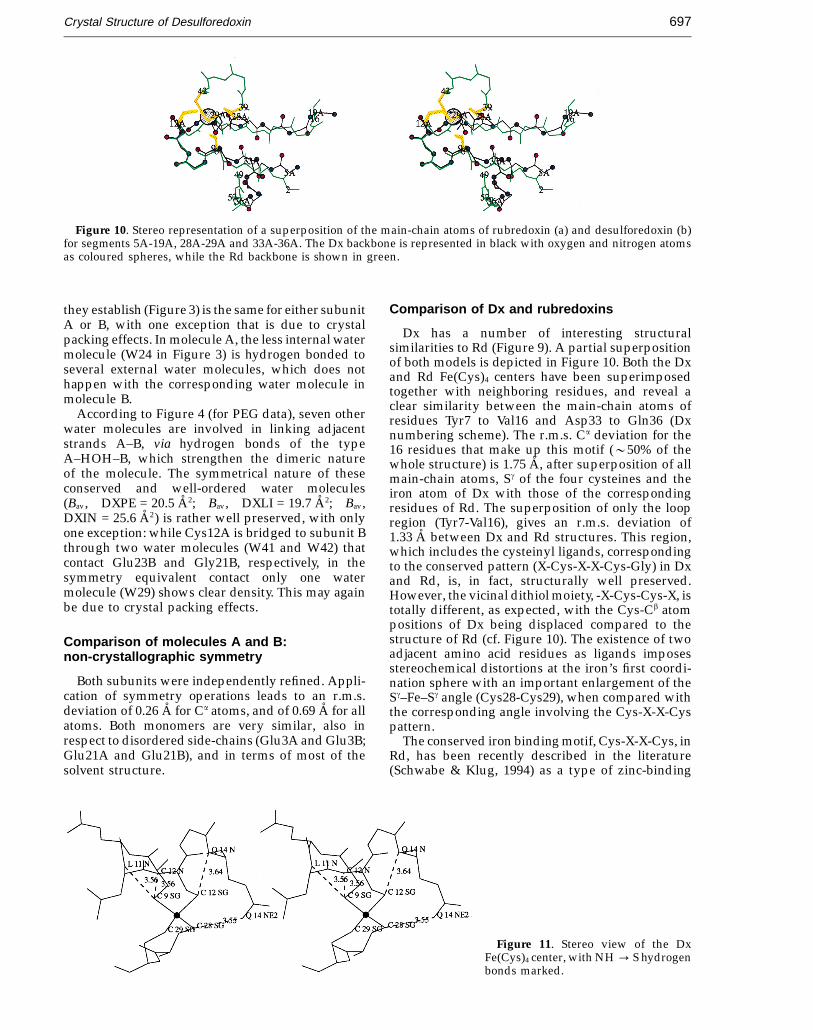
Figure 10. Stereo representation of a superposition of the main-chain atoms of rubredoxin (a) and desulforedoxin (b)for segments 5A-19A, 28A-29A and 33A-36A. The Dx backbone is represented in black with oxygen and nitrogen atomsas coloured spheres, while the Rd backbone is shown in green.
they establish (Figure 3) is the same for either subunitA or B, with one exception that is due to crystalpacking effects. In molecule A, the less internal watermolecule (W24 in Figure 3) is hydrogen bonded toseveral external water molecules, which does nothappen with the corresponding water molecule inmolecule B.
According to Figure 4 (for PEG data), seven otherwater molecules are involved in linking adjacentstrands A–B, via hydrogen bonds of the typeA–HOH–B, which strengthen the dimeric natureof the molecule. The symmetrical nature of theseconserved and well-ordered water molecules(Bav, DXPE = 20.5 A2; Bav, DXLI = 19.7 A2; Bav,DXIN = 25.6 A2) is rather well preserved, with onlyone exception: while Cys12A is bridged to subunit Bthrough two water molecules (W41 and W42) thatcontact Glu23B and Gly21B, respectively, in thesymmetry equivalent contact only one watermolecule (W29) shows clear density. This may againbe due to crystal packing effects.
Comparison of molecules A and B:non-crystallographic symmetry
Both subunits were independently refined. Appli-cation of symmetry operations leads to an r.m.s.deviation of 0.26 A for Ca atoms, and of 0.69 A for allatoms. Both monomers are very similar, also inrespect to disordered side-chains (Glu3A and Glu3B;Glu21A and Glu21B), and in terms of most of thesolvent structure.
Comparison of Dx and rubredoxins
Dx has a number of interesting structuralsimilarities to Rd (Figure 9). A partial superpositionof both models is depicted in Figure 10. Both the Dxand Rd Fe(Cys)4 centers have been superimposedtogether with neighboring residues, and reveal aclear similarity between the main-chain atoms ofresidues Tyr7 to Val16 and Asp33 to Gln36 (Dxnumbering scheme). The r.m.s. Ca deviation for the16 residues that make up this motif (050% of thewhole structure) is 1.75 A, after superposition of allmain-chain atoms, Sg of the four cysteines and theiron atom of Dx with those of the correspondingresidues of Rd. The superposition of only the loopregion (Tyr7-Val16), gives an r.m.s. deviation of1.33 A between Dx and Rd structures. This region,which includes the cysteinyl ligands, correspondingto the conserved pattern (X-Cys-X-X-Cys-Gly) in Dxand Rd, is, in fact, structurally well preserved.However, the vicinal dithiol moiety, -X-Cys-Cys-X, istotally different, as expected, with the Cys-Cb atompositions of Dx being displaced compared to thestructure of Rd (cf. Figure 10). The existence of twoadjacent amino acid residues as ligands imposesstereochemical distortions at the iron’s first coordi-nation sphere with an important enlargement of theSg–Fe–Sg angle (Cys28-Cys29), when compared withthe corresponding angle involving the Cys-X-X-Cyspattern.
The conserved iron binding motif, Cys-X-X-Cys, inRd, has been recently described in the literature(Schwabe & Klug, 1994) as a type of zinc-binding
Figure 11. Stereo view of the DxFe(Cys)4 center, with NH : S hydrogenbonds marked.

JMB—MS 708
Crystal Structure of Desulforedoxin698
Figure 12. Stereo representation ofthe first and second coordinationspheres around the iron atom for theDx structure, compared with the Rdstructure. Water molecules, con-sidered structurally part of the Dxmolecule, are included as bluespheres. In both structures somemain-chain oxygen atoms aremarked as red spheres.
(a)
(b)
motif, found in several zinc binding proteins. Thismotif has been termed by the authors the so-calledrubredoxin ‘‘knuckle’’ and is also found in Dx.Characteristic of this motif are the NH--S hydrogenbonds between Cys-Sg(i) and X-NH (i + 2), whichare shown in Figure 11 for Dx. The structuralcomparison between Dx and Rd highlights not onlythe similarities but also the essential differencesbetween them: the Rd coordination around theiron atom and the hydrogen bonding pattern areapproximately 2-fold symmetrical (Sieker et al., 1994)while that for Dx is not. The X-Cys28-Cys29-X motifforces a different structure, which is stabilized by adifferent NH--S binding pattern. A single additionalhydrogen bond occurs between the sulfur atom Sg ofCys28 and side-chain nitrogen atom Ne of glutamine14 (see Figure 11), while the Sg of Cys29 is nothydrogen bonded.
In conclusion, the two vicinal cysteine residues inthe Dx sequence, Cys28 and Cys29, imposestructural constraints upon the polypeptide chainfold (when compared with Rd), while the Cys-X-X-Cys pattern allows the rubredoxin knuckle to bemaintained. As a result, the coordination around themetal in Dx, although geometrically not verydifferent, lacks the pseudo-2-fold symmetry found inRd structures and has a different local environment(Figure 12). The analysis of the second coordinationsphere of the Dx and Rd centers (Figure 12) alsoshows several structural differences. Dx has severalpolar residues and internal water molecules incontrast to Rd. These differences in the localenvironment around the metallic centers for both Dxand Rd will lead to differences in the electrostatic
potentials at the iron site. This will contribute to theobserved differences in the spectroscopic propertiesof Dx and Rd.
As suggested in the literature (Adman et al., 1975;Sieker et al., 1994), the redox properties of theFe(Cys)4 iron centres are modulated by the NH--Shydrogen bonding pattern, and by aromaticside-chains in their vicinity. Dx has only one singlearomatic residue (Tyr7) but it is conserved within theRds of the Desulfovibrio family (Figure 7). Therefore,it is not surprising that the redox potential of Dx(around −35 mV) and Rd (0 to −50 mV) are similar.Apart from the partial superposition of the Dx andRd backbones, the hydrophobic cores of each of thestructures are rather different: in Dx, the core isessentially non-aromatic (Figure 6), while the coreof Rd is essentially aromatic (Sieker et al., 1994).Interestingly, in the Dx molecule Tyr7 can be exactlysuperimposed on Tyr4 from the Desulfovibrio Rds.
Conclusions
The high-resolution structure determination ofdesulforedoxin allows an accurate description ofthe iron centers as required for analysis of the
Table 2. Refined heavy atom parametersFractional coordinatesa
Derivative Occupancy x y z
DXINIn A 27.0 −0.1079 −0.6566 −0.1682In B 27.4 −0.5123 −0.4281 −0.0491
a Temperature factor B = 15 A2.

JMB—MS 708
Crystal Structure of Desulforedoxin 699
Table 3. Statistical data for single isomorphous replacementNo. of reflections used in
Derivative Resolution range (A) refinement FH/Ra f.o.m.b
DXIN 25–3.0 1525 3.02 0.61a FH/R, r.m.s. heavy-atom contribution/residual R = [S(Fcalc,DXIN − FDXIN)2/n]2 with sum
over all reflections.b f.o.m., figure of merit.
relationship between structure, function, reactivity,the control of electron transfer mechanisms, and thetuning of the redox potential of the center. These dataalso establish correlations between Dx and Rd andtheir spectral characteristics.
In spite of being a dimeric structure, the Dxmonomer shows a remarkable degree of homologywith Rd, within 13 of the first amino acid residuesand four of the C-terminal residues (050% of thesequence). The geometry of the Fe(Cys)4 centers,although similar, reflects the differences in thecysteinyl arrangement for both molecules. Alsodifferences in the dielectric constants and electro-static potentials arising from the different environ-ments of the two centers are to be expected.
The work presented here introduces a newthree-dimensional structure of a simple iron-sulfurprotein (variation of a rubredoxin type protein) andhighlights two interesting aspects in this field: (1) thepossibility of comparing two different Fe(Cys)4
geometries and correlating them with the EPR andMossbauer data. Dx and Rd represent two high-spinferric (S = 5/2) cases, four-cysteinyl coordinated,with a remarkable variation in the E/D values(Moura et al., 1980). (2) This paper also reportsstructural data of an indium-containing protein inatomic detail and compares it with the correspond-ing native iron-containing protein. As discussedabove, the indium geometry agrees well with resultsfrom the literature for In-S compounds (Hirpo et al.,1993).
Experimental Methods
Protein purification
Desulforedoxin was purified from a crude extract ofD. gigas cell with some modifications to the proceduredescribed previously (Moura et al., 1977). The first twopurification steps were identical to steps I and II describedby Moura et al. (1977) and a fraction enriched in Dx wasobtained. The following steps III and IV are improvementsto the procedure mentioned above.
Step III: the fraction containing Dx was concentratedon a Diaflo apparatus (Amicon) with a YM5 membraneand loaded onto a Superdex 75 (Pharmacia) column(2.6 cm × 70 cm) equilibrated with 150 mM Tris-HClbuffer (pH 7.6) at a flow rate of 2 ml/min. At this stage Dxcould be separated from small amounts of desulfoviridin(sulfite reductase), the visible spectrum of Dx presentinga ratio of A278/A507 = 1.8.
StepIV:theDxfractionwasconcentratedagainonaDiafloapparatuswithaYM5membraneandthe ionicstrengthwasdecreased by adding 10 mM Tris-HCl buffer (pH 7.6). Thelaststepofpurificationwasperformedbyhighperformance
liquid chromatography (LKB) on a protein-Pack columnDEAE 5PW (Waters). A linear gradient of 0.01 M to 0.3 MTris-HCl was applied with a flow rate of 3 ml/min forthree hours. After this step the protein had an A278/A507
ratio of 1.3 and was considered pure, as determined bySDS/polyacrylamide gel electrophoresis.
Reconstitution of desulforedoxin with indium
The procedure was very similar to that used previouslyto replace 56Fe by 57Fe (Moura et al., 1980) and 56Fe by Coor Ni (Saint-Martin et al., 1988; Moura et al., 1991; Kowalet al., 1988). The protein was precipitated at 4°C withtrichloroacetic acid (final concentration 5%) in the presenceof b-mercaptoethanol (final concentration 0.5 M). Thecolorless precipitate was collected by centrifugation andthen dissolved in 0.5 M Tris-base containing 60 mMb-mercaptoethanol. The procedure was repeated twice toremove traces of iron. To reconstitute the protein withindium (III), the apoprotein at a concentration of circa5 mg/ml, was incubated at 25°C in 0.5 M Tris-basecontaining 60 mM b-mercaptoethanol and a solution ofindium chloride was added in twice the molar amount.The mixture was allowed to react aerobically for one hour.The solution was then purified on a NAP-5 column(Pharmacia) with 10 mM Tris-HCl buffer (pH 7.6). Thereconstituted colorless protein was then concentrated in aCentricon 3 (Amicon) cell to a final concentration of circa8 mg/ml, which was then used for the crystallizationassays.
Crystallization of desulforedoxin
The crystallization of desulforedoxin (Dx) usingammonium sulfate has been described by Sieker et al.(1980), but such crystals were found to be X-ray-sensitive.Therefore, new crystallization conditions were explored.Suitable, better crystals, (used for this crystallographicanalysis) were obtained by using either PEG 4K or lithiumsulfate as precipitants.
Crystals were grown by the vapour diffusion method atroom temperature, from a protein solution of 8 mg/ml in10 mM Tris-HCl (pH 7.6). Good quality crystals wereobtained in 10% PEG 4K, 0.1 M sodium acetate (pH 4.5)and in 0.8 M lithium sulfate, 0.1 M sodium acetate,(pH 4.0). Native and indium-reconstituted Dx were crys-tallized under the same experimental conditions, givingred and colorless crystals, respectively. Elongated trigonalbypiramids grew within three to four days up to dimen-sions of 0.5 mm × 0.3 mm × 0.2 mm. These crystals wereonly stable for two to three weeks in the drop, with orwithout harvesting buffer. However, crystals mounted onglass capillaries could be kept for longer periods withoutlosing quality. Complete data sets could be collected fromthese single crystals. They diffract to beyond 1.7 A resol-ution on an Imaging Plate system and belong to spacegroup P3221, with cell dimensions as summarized inTable 1 for lithium sulfate (DXLI) and PEG (DXPE) native
JMB—MS 708
Crystal Structure of Desulforedoxin700
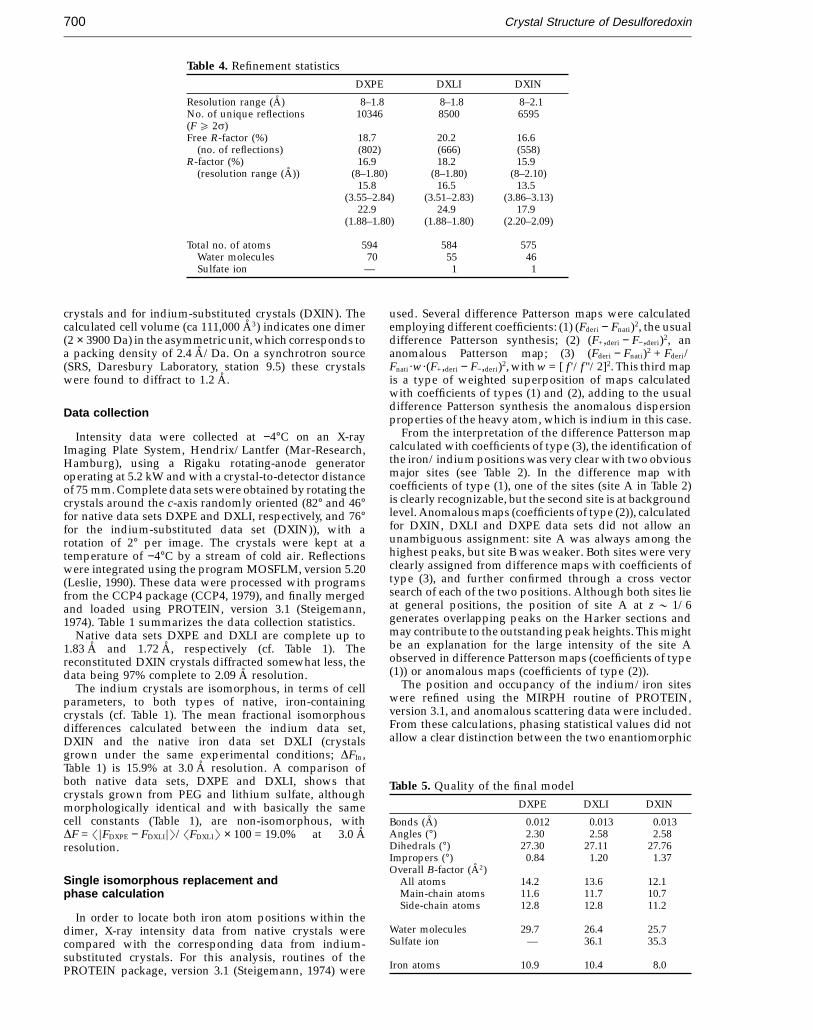
Table 4. Refinement statisticsDXPE DXLI DXIN
Resolution range (A) 8–1.8 8–1.8 8–2.1No. of unique reflections 10346 8500 6595(F e 2s)Free R-factor (%) 18.7 20.2 16.6
(no. of reflections) (802) (666) (558)R-factor (%) 16.9 18.2 15.9
(resolution range (A)) (8–1.80) (8–1.80) (8–2.10)15.8 16.5 13.5
(3.55–2.84) (3.51–2.83) (3.86–3.13)22.9 24.9 17.9
(1.88–1.80) (1.88–1.80) (2.20–2.09)
Total no. of atoms 594 584 575Water molecules 70 55 46Sulfate ion — 1 1
crystals and for indium-substituted crystals (DXIN). Thecalculated cell volume (ca 111,000 A3) indicates one dimer(2 × 3900 Da) in the asymmetric unit, which corresponds toa packing density of 2.4 A/Da. On a synchrotron source(SRS, Daresbury Laboratory, station 9.5) these crystalswere found to diffract to 1.2 A.
Data collection
Intensity data were collected at −4°C on an X-rayImaging Plate System, Hendrix/Lantfer (Mar-Research,Hamburg), using a Rigaku rotating-anode generatoroperating at 5.2 kW and with a crystal-to-detector distanceof 75 mm. Complete data sets were obtained by rotating thecrystals around the c-axis randomly oriented (82° and 46°for native data sets DXPE and DXLI, respectively, and 76°for the indium-substituted data set (DXIN)), with arotation of 2° per image. The crystals were kept at atemperature of −4°C by a stream of cold air. Reflectionswere integrated using the program MOSFLM, version 5.20(Leslie, 1990). These data were processed with programsfrom the CCP4 package (CCP4, 1979), and finally mergedand loaded using PROTEIN, version 3.1 (Steigemann,1974). Table 1 summarizes the data collection statistics.
Native data sets DXPE and DXLI are complete up to1.83 A and 1.72 A, respectively (cf. Table 1). Thereconstituted DXIN crystals diffracted somewhat less, thedata being 97% complete to 2.09 A resolution.
The indium crystals are isomorphous, in terms of cellparameters, to both types of native, iron-containingcrystals (cf. Table 1). The mean fractional isomorphousdifferences calculated between the indium data set,DXIN and the native iron data set DXLI (crystalsgrown under the same experimental conditions; DFIn,Table 1) is 15.9% at 3.0 A resolution. A comparison ofboth native data sets, DXPE and DXLI, shows thatcrystals grown from PEG and lithium sulfate, althoughmorphologically identical and with basically the samecell constants (Table 1), are non-isomorphous, withDF = �=FDXPE − FDXLI=�/�FDXLI� × 100 = 19.0% at 3.0 Aresolution.
Single isomorphous replacement andphase calculation
In order to locate both iron atom positions within thedimer, X-ray intensity data from native crystals werecompared with the corresponding data from indium-substituted crystals. For this analysis, routines of thePROTEIN package, version 3.1 (Steigemann, 1974) were
used. Several difference Patterson maps were calculatedemploying different coefficients: (1) (Fderi − Fnati)2, the usualdifference Patterson synthesis; (2) (F+,deri − F−,deri)2, ananomalous Patterson map; (3) (Fderi − Fnati)2 + Fderi/Fnati ·w·(F+,deri − F−,deri)2, with w = [ f '/f "/2]2. This third mapis a type of weighted superposition of maps calculatedwith coefficients of types (1) and (2), adding to the usualdifference Patterson synthesis the anomalous dispersionproperties of the heavy atom, which is indium in this case.
From the interpretation of the difference Patterson mapcalculated with coefficients of type (3), the identification ofthe iron/indium positions was very clear with two obviousmajor sites (see Table 2). In the difference map withcoefficients of type (1), one of the sites (site A in Table 2)is clearly recognizable, but the second site is at backgroundlevel. Anomalous maps (coefficients of type (2)), calculatedfor DXIN, DXLI and DXPE data sets did not allow anunambiguous assignment: site A was always among thehighest peaks, but site B was weaker. Both sites were veryclearly assigned from difference maps with coefficients oftype (3), and further confirmed through a cross vectorsearch of each of the two positions. Although both sites lieat general positions, the position of site A at z 0 1/6generates overlapping peaks on the Harker sections andmay contribute to the outstanding peak heights. This mightbe an explanation for the large intensity of the site Aobserved in difference Patterson maps (coefficients of type(1)) or anomalous maps (coefficients of type (2)).
The position and occupancy of the indium/iron siteswere refined using the MIRPH routine of PROTEIN,version 3.1, and anomalous scattering data were included.From these calculations, phasing statistical values did notallow a clear distinction between the two enantiomorphic
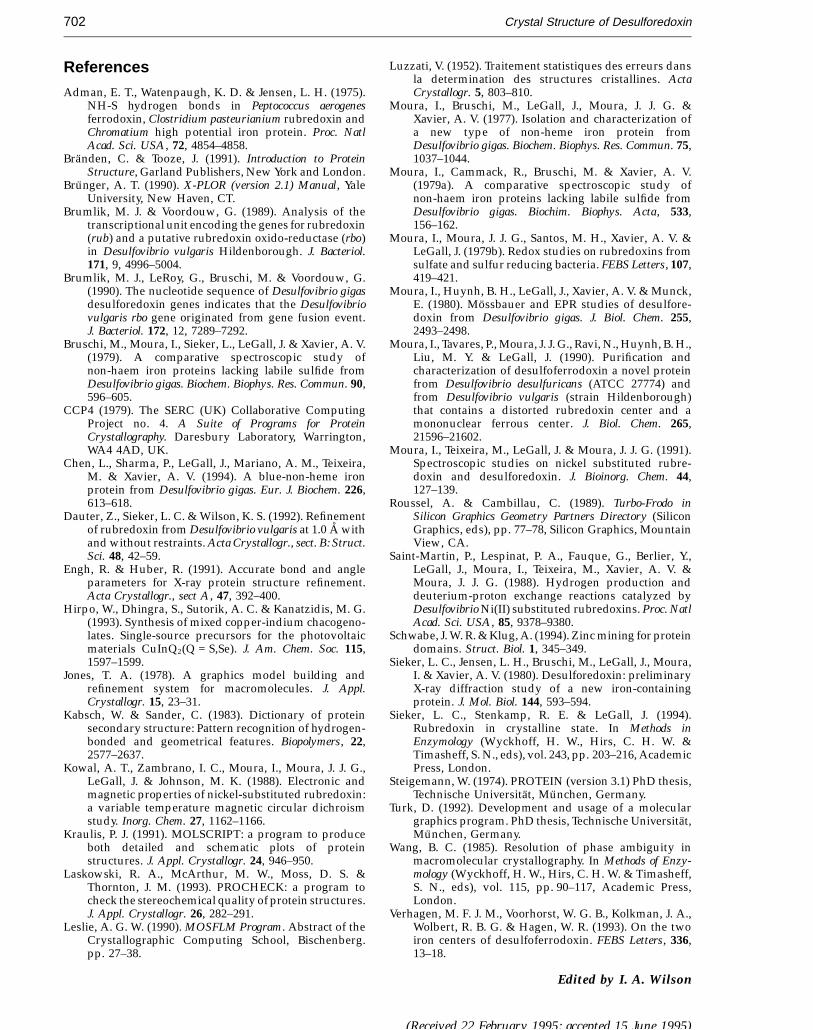
Table 5. Quality of the final modelDXPE DXLI DXIN
Bonds (A) 0.012 0.013 0.013Angles (°) 2.30 2.58 2.58Dihedrals (°) 27.30 27.11 27.76Impropers (°) 0.84 1.20 1.37Overall B-factor (A2)
All atoms 14.2 13.6 12.1Main-chain atoms 11.6 11.7 10.7Side-chain atoms 12.8 12.8 11.2
Water molecules 29.7 26.4 25.7Sulfate ion — 36.1 35.3
Iron atoms 10.9 10.4 8.0

JMB—MS 708
Crystal Structure of Desulforedoxin 701
space groups P31,221. Inspection of electron density mapscalculated for both space groups, showed immediately thatP3221 was the correct space group.
Several cycles of phase calculation and heavy-atompositional refinement converged rapidly. Temperaturefactors for both sites were set to 15 A2 and not refined,while occupancy factors refined to 27.0 e and 27.4 e,respectively, for sites A and B. The absolute scaling factorwas determined by a Wilson plot.
Phases were calculated for the native protein from theindium data set. The anomalous scattering of the iron atomwas included in the native phase calculations. The finalstatistical results of these SIRAS calculations aresummarized in Table 3 for the correct space group P3221.The mean figure of merit of 0.61 is found to be nearlyconstant out to 3.0 A resolution. The value for the phasingpower, FH/R is very high (3.01) and phase informationallowed the calculation of a largely interpretable SIRAS‘‘best’’ native Fourier map.
Solvent flattening
In order to improve the quality of the electron densitymap further, a density modification by solvent flatteningwas carried out by using the programs of M. Schneider(unpublished results) and the procedure of Wang (1985).For the calculations, a radius of 8 A was used for theaveraging sphere and the solvent level was set to 55%.
Electron density map interpretation
The 3.0 A resolution solvent flattened, SIRAS electrondensity map was improved such that the molecularboundaries were easily recognized and chain tracing couldbe started. The knowledge of the iron atom positions aidedthe localization of the two subunits within the unit cell andalso in the chain tracing.
At this stage, two segments of the Rd structure from D.gigas were used, where sequence homology with Dx wasrecognized: the first was from the binding motif, with thesequence -Y-X-C-X-X-C-G-X-, and the second was the C-terminal peptide. These structural parts were tentativelyfitted to the electron density map. As chain tracing progres-sed, the similarity in the folding of Dx and Rd was con-firmed for approximately 50% of the Dx polypeptide chain.
A starting model for the Dx dimer was thus created,although the electron density still had some breaks andwas not of sufficient quality to assign all side-chainsunambiguously. The map was improved further byaveraging techniques.
Averaging of the dimer
Partial models were built for the two subunits within theasymmetric unit independently, and the two models weresuperimposed by minimizing the r.m.s. distances betweenequivalent atoms, thus defining the two rotational matricesand translational vectors. The atomic models also outlinedmasks required for density averaging.
The solvent flattened electron density map was averagedby employing real-space density map manipulationprocedures within the program MAIN (Turk, 1992). Themap inside a mask was averaged about the non-crystallo-graphic 2-fold axis. The entire unit cell was then generatedand the density was Fourier transformed using routinesfrom PROTEIN. This procedure was repeated untilconvergence was reached. Averaging distinctly improvedthe map and showed that the original chain tracing wascorrect.
Model building
Model building was carried out using the programsystem FRODO (Jones, 1978) on an Evans & Sutherlandgraphics system and with the program TURBO-FRODO(Roussel & Cambillau, 1989) on a Silicon Graphics personalIris.
A model was built for both subunits of the dimerindependently. Both the Fe(Cys)4 centers (see Figure 1) andthe two polypeptide chains of approximately 36 aminoacid residues could be fitted to the maps.
Refinement
The Dx dimer model was subjected to an energyrestrained least-squares refinement using XPLOR, version3.1 (Brunger, 1990). Besides standard XPLOR force fieldparameters (param19 × .pro), standard group geometriesof Engh & Huber (1991) were employed for the refinement.Refinements were carried out independently for all threedata sets (DXPE, DXLI and DXIN). The iron-cysteinylsulfur center was modeled with ideal tetrahedral geometry(bond angles of 109.5°) and bond lengths of 2.33 A. For theindium–cysteinyl bond, lengths, taken from a CSD search,were 2.42 A (Hirpo et al., 1993). The restraints employed forboth metallic centers were very weak, allowing distortionfrom the starting geometry. At later stages of therefinement, individual isotropic temperature factors werealso refined.
Refinement started at the resolution of the SIR map(3.0 A) and the initial R-factor between observedand calculated structure factors was around 25%. Intensitydata were then included to 2.5 A and then graduallyto 1.8 A (DXPE and DXLI), accompanying several cyclesof adjustment of the polypeptide chain and subsequentrefinement. At the final stages, solvent molecules wereplaced at sites of Fobs − Fcalc difference density values above2.4s and 2Fobs − Fcalc density values above 0.8s, ifstereochemically reasonable. In the two data sets fromcrystals grown in the presence of lithium sulfate (DXLIand DXIN), one sulfate ion could be recognized at acrystal contact interface. This sulfate ion is stabilized bycontacts to several water molecules, to Thr25 and Cys29,and to Lys17 from a symmetry-related molecule. Therefinement parameters and quality of the final model aresummarized in Tables 4 and 5, respectively, for all threedata sets.
The DXPE structure refined to a final R-factor of 16.9%for data between 8.0 and 1.8 A (10,346 reflections), whilethe DXLI structure refined to a final R-factor of 18.2%, andDXIN to R = 15.9% (cf. Table 4).
AcknowledgementsThis work was supported by a JNICT-BMFT joint
collaboration project between ITQB and MPIB (M.A.,M.J.R. and R.H.) and by Junta Nacional de Investigac� aoCientıfica e Tecnologica grants: Research grant BIC/739/92(M.A.), STRDA/BIO/359 (I.M.), PBIC/QUI/616 (I.M.),PBIC/BIO/1668 (J.J.G.M.), and ERBCHRXCT920014 grantfrom the EC. Support by a grant from the National Instituteof Health (GM 41482) to J.L.G. and J.J.G.M. is alsoacknowledged. The authors thank the staff of the UGAFermentation Plant and Mr Y.-Liu for growing the cells.M.A. and M.J.R. thank Dr Ian Glover for assistance at theSRS, Daresbury.
JMB—MS 708
Crystal Structure of Desulforedoxin702
References
Adman, E. T., Watenpaugh, K. D. & Jensen, L. H. (1975).NH-S hydrogen bonds in Peptococcus aerogenesferrodoxin, Clostridium pasteurianium rubredoxin andChromatium high potential iron protein. Proc. NatlAcad. Sci. USA, 72, 4854–4858.
Branden, C. & Tooze, J. (1991). Introduction to ProteinStructure, Garland Publishers, New York and London.
Brunger, A. T. (1990). X-PLOR (version 2.1) Manual, YaleUniversity, New Haven, CT.
Brumlik, M. J. & Voordouw, G. (1989). Analysis of thetranscriptional unit encoding the genes for rubredoxin(rub) and a putative rubredoxin oxido-reductase (rbo)in Desulfovibrio vulgaris Hildenborough. J. Bacteriol.171, 9, 4996–5004.
Brumlik, M. J., LeRoy, G., Bruschi, M. & Voordouw, G.(1990). The nucleotide sequence of Desulfovibrio gigasdesulforedoxin genes indicates that the Desulfovibriovulgaris rbo gene originated from gene fusion event.J. Bacteriol. 172, 12, 7289–7292.
Bruschi, M., Moura, I., Sieker, L., LeGall, J. & Xavier, A. V.(1979). A comparative spectroscopic study ofnon-haem iron proteins lacking labile sulfide fromDesulfovibrio gigas. Biochem. Biophys. Res. Commun. 90,596–605.
CCP4 (1979). The SERC (UK) Collaborative ComputingProject no. 4. A Suite of Programs for ProteinCrystallography. Daresbury Laboratory, Warrington,WA4 4AD, UK.
Chen, L., Sharma, P., LeGall, J., Mariano, A. M., Teixeira,M. & Xavier, A. V. (1994). A blue-non-heme ironprotein from Desulfovibrio gigas. Eur. J. Biochem. 226,613–618.
Dauter, Z., Sieker, L. C. & Wilson, K. S. (1992). Refinementof rubredoxin from Desulfovibrio vulgaris at 1.0 A withand without restraints. Acta Crystallogr., sect. B: Struct.Sci. 48, 42–59.
Engh, R. & Huber, R. (1991). Accurate bond and angleparameters for X-ray protein structure refinement.Acta Crystallogr., sect A, 47, 392–400.
Hirpo, W., Dhingra, S., Sutorik, A. C. & Kanatzidis, M. G.(1993). Synthesis of mixed copper-indium chacogeno-lates. Single-source precursors for the photovoltaicmaterials CuInQ2(Q = S,Se). J. Am. Chem. Soc. 115,1597–1599.
Jones, T. A. (1978). A graphics model building andrefinement system for macromolecules. J. Appl.Crystallogr. 15, 23–31.
Kabsch, W. & Sander, C. (1983). Dictionary of proteinsecondary structure: Pattern recognition of hydrogen-bonded and geometrical features. Biopolymers, 22,2577–2637.
Kowal, A. T., Zambrano, I. C., Moura, I., Moura, J. J. G.,LeGall, J. & Johnson, M. K. (1988). Electronic andmagnetic properties of nickel-substituted rubredoxin:a variable temperature magnetic circular dichroismstudy. Inorg. Chem. 27, 1162–1166.
Kraulis, P. J. (1991). MOLSCRIPT: a program to produceboth detailed and schematic plots of proteinstructures. J. Appl. Crystallogr. 24, 946–950.
Laskowski, R. A., McArthur, M. W., Moss, D. S. &Thornton, J. M. (1993). PROCHECK: a program tocheck the stereochemical quality of protein structures.J. Appl. Crystallogr. 26, 282–291.
Leslie, A. G. W. (1990). MOSFLM Program. Abstract of theCrystallographic Computing School, Bischenberg.pp. 27–38.
Luzzati, V. (1952). Traitement statistiques des erreurs dansla determination des structures cristallines. ActaCrystallogr. 5, 803–810.
Moura, I., Bruschi, M., LeGall, J., Moura, J. J. G. &Xavier, A. V. (1977). Isolation and characterization ofa new type of non-heme iron protein fromDesulfovibrio gigas. Biochem. Biophys. Res. Commun. 75,1037–1044.
Moura, I., Cammack, R., Bruschi, M. & Xavier, A. V.(1979a). A comparative spectroscopic study ofnon-haem iron proteins lacking labile sulfide fromDesulfovibrio gigas. Biochim. Biophys. Acta, 533,156–162.
Moura, I., Moura, J. J. G., Santos, M. H., Xavier, A. V. &LeGall, J. (1979b). Redox studies on rubredoxins fromsulfate and sulfur reducing bacteria. FEBS Letters, 107,419–421.
Moura, I., Huynh, B. H., LeGall, J., Xavier, A. V. & Munck,E. (1980). Mossbauer and EPR studies of desulfore-doxin from Desulfovibrio gigas. J. Biol. Chem. 255,2493–2498.
Moura, I., Tavares, P., Moura, J. J. G., Ravi, N., Huynh, B. H.,Liu, M. Y. & LeGall, J. (1990). Purification andcharacterization of desulfoferrodoxin a novel proteinfrom Desulfovibrio desulfuricans (ATCC 27774) andfrom Desulfovibrio vulgaris (strain Hildenborough)that contains a distorted rubredoxin center and amononuclear ferrous center. J. Biol. Chem. 265,21596–21602.
Moura, I., Teixeira, M., LeGall, J. & Moura, J. J. G. (1991).Spectroscopic studies on nickel substituted rubre-doxin and desulforedoxin. J. Bioinorg. Chem. 44,127–139.
Roussel, A. & Cambillau, C. (1989). Turbo-Frodo inSilicon Graphics Geometry Partners Directory (SiliconGraphics, eds), pp. 77–78, Silicon Graphics, MountainView, CA.
Saint-Martin, P., Lespinat, P. A., Fauque, G., Berlier, Y.,LeGall, J., Moura, I., Teixeira, M., Xavier, A. V. &Moura, J. J. G. (1988). Hydrogen production anddeuterium-proton exchange reactions catalyzed byDesulfovibrio Ni(II) substituted rubredoxins. Proc. NatlAcad. Sci. USA, 85, 9378–9380.
Schwabe, J. W. R. & Klug, A. (1994). Zinc mining for proteindomains. Struct. Biol. 1, 345–349.
Sieker, L. C., Jensen, L. H., Bruschi, M., LeGall, J., Moura,I. & Xavier, A. V. (1980). Desulforedoxin: preliminaryX-ray diffraction study of a new iron-containingprotein. J. Mol. Biol. 144, 593–594.
Sieker, L. C., Stenkamp, R. E. & LeGall, J. (1994).Rubredoxin in crystalline state. In Methods inEnzymology (Wyckhoff, H. W., Hirs, C. H. W. &Timasheff, S. N., eds), vol. 243, pp. 203–216, AcademicPress, London.
Steigemann, W. (1974). PROTEIN (version 3.1) PhD thesis,Technische Universitat, Munchen, Germany.
Turk, D. (1992). Development and usage of a moleculargraphics program. PhD thesis, Technische Universitat,Munchen, Germany.
Wang, B. C. (1985). Resolution of phase ambiguity inmacromolecular crystallography. In Methods of Enzy-mology (Wyckhoff, H. W., Hirs, C. H. W. & Timasheff,S. N., eds), vol. 115, pp. 90–117, Academic Press,London.
Verhagen, M. F. J. M., Voorhorst, W. G. B., Kolkman, J. A.,Wolbert, R. B. G. & Hagen, W. R. (1993). On the twoiron centers of desulfoferrodoxin. FEBS Letters, 336,13–18.
Edited by I. A. Wilson
(Received 22 February 1995; accepted 15 June 1995)


![Nickel[iron-sulfur]-selenium-containing hydrogenases from Desulfovibrio baculatus (DSM 1743). Redox centers and catalytic properties](https://static.fdokumen.com/doc/165x107/6316e17bc32ab5e46f0dfeb7/nickeliron-sulfur-selenium-containing-hydrogenases-from-desulfovibrio-baculatus.jpg)