CRT and LCD Monitors for Soft Proofing
28
CRT and LCD Monitors for Soft Proofing Paul D. Fleming III*, Veronika Chovancova*, Ben Starr* and Abhay Sharma* Keywords: CRT, Display, LCD, Proof, Soft Abstract: Having a calibrated monitor with an accurate ICC monitor profile is a necessary, but not sufficient condition for an accurate soft proofing system. Soft proofing, using a computer monitor to proof a printed piece on a conventional or digital printing press, is an increasingly important component for remote proofing of mission critical printed materials. Soft proofing systems are current issues for proposed revisions of SWOP. This paper examines the requirements for an accurate, useful and certifiable soft proofing system. The accuracy of a monitor profile depends on both the stability of the monitor and the accuracy of the measuring device used to build the profile. In addition to an accurate monitor profile, the accuracy of a soft proofing system depends on the CMM (Color Management Module) utilized, the specified white point (color temperature) and, of course, how well the profile represents the device it is attempting to characterize. Results of colorimetric measurements using various emissive spectrophotometers are presented for CRT and LCD displays of controlled color patches in RGB, CMYK and Lab modes. The accuracy of these values, predicted from the profile versus measured, is highly dependent on the CMM employed. Surprisingly, the accuracy of the soft proof is highly dependent on the method used to display the soft proof. There are three different, a priori equivalent, and methods to display a soft proof using Photoshop. Only one of these gives colorimetric agreement with printed and Info Palette values. Care must be taken when interpreting displayed Lab or CMYK values. Differences between CRT and LCD monitors are discussed. A summary of unresolved issues and some recommendations for their resolution is presented. _____________________ *Department of Paper Engineering, Chemical Engineering and Imaging Western Michigan University Kalamazoo, MI 49008
-
Upload
independent -
Category
Documents
-
view
1 -
download
0
Transcript of CRT and LCD Monitors for Soft Proofing
CRT and LCD Monitors for Soft Proofing
Paul D. Fleming III*, Veronika Chovancova*, Ben Starr* and Abhay Sharma*
Keywords: CRT, Display, LCD, Proof, Soft
Abstract: Having a calibrated monitor with an accurate ICC monitor profile is anecessary, but not sufficient condition for an accurate soft proofing system. Softproofing, using a computer monitor to proof a printed piece on a conventional ordigital printing press, is an increasingly important component for remoteproofing of mission critical printed materials. Soft proofing systems are currentissues for proposed revisions of SWOP. This paper examines the requirementsfor an accurate, useful and certifiable soft proofing system. The accuracy of amonitor profile depends on both the stability of the monitor and the accuracy ofthe measuring device used to build the profile. In addition to an accurate monitorprofile, the accuracy of a soft proofing system depends on the CMM (ColorManagement Module) utilized, the specified white point (color temperature)and, of course, how well the profile represents the device it is attempting tocharacterize. Results of colorimetric measurements using various emissivespectrophotometers are presented for CRT and LCD displays of controlled colorpatches in RGB, CMYK and Lab modes. The accuracy of these values,predicted from the profile versus measured, is highly dependent on the CMMemployed. Surprisingly, the accuracy of the soft proof is highly dependent onthe method used to display the soft proof. There are three different, a prioriequivalent, and methods to display a soft proof using Photoshop. Only one ofthese gives colorimetric agreement with printed and Info Palette values. Caremust be taken when interpreting displayed Lab or CMYK values. Differencesbetween CRT and LCD monitors are discussed. A summary of unresolved issuesand some recommendations for their resolution is presented.
_____________________*Department of Paper Engineering, Chemical Engineering and ImagingWestern Michigan UniversityKalamazoo, MI 49008
Introduction
The world of color reproduction, whether in print, on the web, on film or onvideo, is highly dependent on the faithfulness of color images. ColorManagement Systems (Adams, 2001, Sharma, 2003a, Fleming, 2002) (CMS)have been developed to deal with this issue. Accurately matching color, betweencomputer Cathode Ray Tube (CRT) and Liquid Crystal Display (LCD)monitors, analog monitors, cinematic projection, companion books and wearingapparel, present an apparently insurmountable challenge. The InternationalColor Consortium (ICC) was formed in 1993 by Adobe, Agfa, Apple, Kodak,Microsoft, Sun Microsystems and Silicon Graphics (Adams, 2001, Sharma,2003a, Fleming, 2002, Brues, 2000, Green, 1999, ICC) to define the standardsfor color device characterization. This device characterization is presented interms of specially formatted files, which have come to be called profiles.
Soft proofing (Sharma, 2003a, Hutcheson) is the process of using a calibratedmonitor to accurately preview reproduction on a hard copy output device, suchas a digital printer or printing press. To accomplish this, it is necessary to haveaccurate (Sharma, 2003a, Fleming, 2002, Sharma, 2002, Sharma 2003b, Sharma2003c) profiles for the monitor and output devices. Monitor profiles and outputprofiles are constructed by measuring colors displayed or printed (Sharma2003a, Fleming 2002, Sharma 2001). For monitor profiles, a colorimeter or aspectrophotometer is attached to the screen by suction cups. A set of 40-50 RGBvalues is displayed and the colorimetric values are recorded. These are used toconstruct the monitor profile. Monitor profiles are generally characterized bywhite point color temperature, gamma (γ) value and tristimulus values for theRed, Green and Blue primary colors. The white point is interpreted as thetemperature of a perfect Planckian Black body radiator (Planck, 1901) thatproduces the same relative tristimulus (CIE, 1932) values (the Y value is usuallynormalized to 100). Generally, a color temperature of 5000 K (D50) or 6500 K(D65) is used to simulate “natural” daylight under different assumed conditions.The γ value is an exponent that is used to characterize the nonlinear response ofphosphor brightness to electron energy (voltage) in a CRT monitor (Berns, 1996,1993, Chovancova, 2000).
For output profiles (Sharma 2003a, Fleming 2002), it is necessary to print a fileof known CMYK values, such as the IT8.7/3 (ANSI, 1996). The printed patchesare then measured with a colorimeter or spectrophotometer. A mapping betweenCMYK values and L*a*b* values is generated and used to populate lookuptables in the profile. The mapping is complicated, because in order for it to beone to one and invertible, some sort of GCR (Gray Component Replacement)(Yule 1940, Field, 1986) or UCR (UnderColor Removal) (Yule, 1940, 1961)prescription must be specified to make the effective CMYK space a functiononly of three variables. Specifying the L*a*b* value for a given CMYK value isno problem, because that is what is specifically measured. However, specifying
the CMYK value for a given L*a*b* requires a constraint on the CMYK values.It is important that the output profile be reversible (Sharma 2003a, Sharma2003b, Sharma 2003c, Sharma 2002), so that transforming between CMYK andL*a*b* and then back again to CMYK yields the same (or equivalent) colorvalues. This feature is crucial for any digital proofing, hard or soft. Sometimes,an annealing process must be applied to assure this reversibility. (Sharma 2002)
Significant progress (Sharma 2003a, Fleming 2002, Sharma 2002, Sharma2003b, Sharma 2003c) has been made in evaluating the accuracy of ICCprofiles. Here we extend that process to evaluation of a soft proofing system.We consider both CRT (Cathode Ray Tube) monitors and LCD (Liquid CrystalDisplay) flat panel monitors. These are used for visualization on both Macintoshand PC platforms. CRT (Graphics World, 1997) and LCD (Tong, 2001) monitorsuse completely different technologies, and thus have quite different displaycharacteristics. Accordingly, special attention will be given to comparison ofcolor image faithfulness and profile quality for LCD and CRT monitors.
Soft proofing technology has been around since the first computer monitor. Theadvent of color monitors and color printers led to the immediate question; “Whydoesn’t the print look like my screen?” To a great extent, this question is stillunanswered today to everyone’s satisfaction. It was just for this, and otherissues, that the ICC (Green, 1999, ICC) and CMS (Adams, 2001, Sharma 2003a,Fleming 2002, Brues, 2000) were formed to address. Only with these isquantitative soft proofing even possible.
Recently, Integrated Color Solutions (2003) has SWOP (SWOP, 2001) certifieda soft proofing system, using its Remote Director TM software with AppleCinema LCD displays. Presumably, any good computer monitor (CRT or LCD)can be SWOP certified using the methods presented here.
The time to market is extremely important for both creatives and publishers forall media. Today, it is more critical than ever to provide faithful color in a timelyfashion. With Computer to Plate (CTP) (Adams, 1999) devices, the industry isapproaching a full digital production workflow, and soft proofing can offersignificant savings in time and money. It can also reduce supply requirements inmaterial and transportation costs. Monitors are now developed specifically forgraphic designers, digital photographers and prepress professionals. Also, colormanagement products let users calibrate (Rich) and profile (Sharma, 2003a,2003b, 2003c, 2002a, 2001, Fleming, 2002) any CRT or LCD monitor at theworkstation and can greatly help in translating what color looks like on thescreen, compared to its representation in hard copy.
PC monitors are not all the same any more. There are now more types ofmonitors being widely used. CRT displays are optical radiation sources and suchas, are treated as an extended diffuse radiator (Graphics World, 1997). LCD
monitors (Tong, 2002), also known as flat-panel, dual scan, active matrix andthin film transistor, (TFT). LCD stands for Liquid Crystal Display. Liquidcrystals are organic substances with highly anisotropic molecules that can beeasily orientated in an electric field to provide unique optical properties.
Cathode Ray Tube Monitors
The picture tube, or CRT, is the component that actually physically createscolors. It contains three important parts: electron guns, a mask and a phosphorscreen. In traditional CRT monitors, the electron guns continually send out veryprecisely aimed beams of electrons, scanning horizontally from pixel to pixel, aprocess known as a raster scan. The glass of the picture tube is covered withmillions of red, green and blue phosphor dots, arranged in a hexagonal pattern oftriangular triads of the three colors. The phosphor coating on the screen has thepeculiar ability to light up, when hit by electrons, but the light quickly fadesaway. In practice, the electron beam hits the phosphor again, before there is anyvisible fading of the light. The result is that it looks to us as a steady screenimage (Graphics World, 1997).
Liquid Crystal Display Monitors
As mentioned above, liquid crystals are organic substances whose opticalproperties depend on applied electric fields. The display consists of a liquidsuspension between two panels, glass or plastic. Liquid crystals in thissuspension are naturally aligned parallel with one another, allowing light to passthrough the panel. When an electric field is applied, the crystals changeorientation and block light, instead of allowing it to pass through, turning thecrystal region dark. The LCD is made of several layers that are arrangedaccording to the following order: polarizing filter, sheet of glass, electrode,alignment layer, liquid crystals, alignment layer, electrode, sheet of glass,polarizing filter.
The cross-section of the LCD panel looks like a multi-layer sandwich. At theoutermost layer on either side are clear glass substrates. Between the substratesare the thin film transistor, color filter panel that provides the red, blue and greenprimary colors, and the liquid crystal layer. Most liquid crystal molecules arerod-shaped. Just like the CRT, the red, green and blue liquid crystal chambersmake up one pixel – picture element. By subjecting the red, green, bluechambers to varying degrees of electrical charges, different colors can beachieved (Tong, 2002).
A liquid crystal phase is neither liquid nor solid but has special symmetriessomewhere in between the two. They are formed by blending certain polarmaterials (e.g. biphenyls, dioxene) with other materials to obtain various desiredproperties such as viscosity, elasticity, reflective index, etc. Under normalconditions when there is no electrical charge, the liquid crystals are in an
amorphous state. LCDs use these liquid crystals because they react predictablyto electric field in such a way as to control light passage (LCDFAQ, Poor, 2002,Publish, 1997).
CRT versus LCD
Currently, conventional CRT monitors are a challenge from the becoming lessexpensive, but high quality LCD screens. CRTs offer numerous advantages overflat panels for some applications. While flat panels have generally highercontrast than CRTs, the CRT has better black levels. The black level, themeasure of how much light comes through a black screen, is important in video,film, and TV broadcast. However, the most overwhelming advantage of CRTs isstill their cost.
CRTs also have their drawbacks. They are heavy, bulky, draw lots of power(typically on the order of 100 watts versus 20 to 40 watts for LCDs), and haverelated high heat dissipation. Compared to an LCD, a CRT can requireconsiderable work at setup time to achieve good screen geometry. Tuning iscomplicated by the fact that CRTs react differently when components are coldcompared to when they warm up. Ongoing maintenance may be required todegauss some monitor components because magnetism builds up on the yokecoil and the aperture grill (or shadow mask), causing color distortion (Werner,2001).
LCD thin film transistor (TFT) active-matrix digital displays offer severalbenefits, e.g. they are compact and space saving. LCD monitors consume muchless energy than CRT monitors do. LCD monitors do not emit harmful radiation,whereas CRT monitors produce it. They also are true digital devices, and thus,provide accurate representation of digital data. The dimensions of the display aremore representative of what is seen. A 17" LCD monitor has approximately thesame viewable area as a 19" CRT. New LCD technology provides a brightdisplay, clear focus, a wide viewing angle, and no screen flicker. The newmonitors are lightweight, compact, and less energy consumable than CRTscreens making them great for laptop and portable computers (Publish, 1997).
The white point, or color temperature, of the light is generally not the same asCRT displays. The color temperature of an LCD display differs from that ofstandard CRT displays. In addition, the primary colors in the display are verydifferent from the standard CRT phosphor colors (LCD&CRT, Cruickshank,2001, de Lancie, 2001).
With CRT displays, the phosphor dots must be refreshed by the electron gunsmany times per second to prevent them from fading. LCD pixels, on the otherhand, are either on or off, and remain that way with no fading or variation.While the maximum refresh rate of a CRT monitor is a good yardstick for itsquality, this isn’t the case for a comparable LCD monitor. In a cathode-ray tube,

an electron beam scans the image onto the panel. The faster it can scan thepanel, the better the display, and, consequently, the higher the refresh rate. In anLCD monitor, the image isn’t created by an electron beam. The image qualitydepends on how rapidly these diodes can be turned on and off again. Thisrapidity is known as the response time and it should have the advantage ofreducing eyestrain (LCD-02).
A CRT has three electron guns whose streams must converge faultlessly in orderto create a sharp image. There are no convergence problems with an LCD panel,because each cell is switched on and off individually. This is one reason whytext looks so crisp on an LCD monitor. Refresh rate as low as between 40-60Hzshould not produce any more flicker than one at a 75Hz refresh rate (Smith).Refresh rates are really only relevant for CRT monitors (GES).
The whole process of printing production has been specified in different ways.However, the most significant printing specification in the United States is thepress proofing portion of the current Specifications for Web Offset Publications(SWOP), which addresses the larger subject of the preparation and proofing ofinput material for reproduction by web offset and gravure publication printing.The SWOP specifications provide the necessary information for suppliers ofinput materials for advertising and editorial pages to magazines to do so in auniform way.
Experimental
This research describes the issues that concern with output profile – monitorprofile combinations. Two monitors were chosen to represent both groups: a 17"Mitsubishi Diamond Plus 73 CRT Monitor and a 17" Apple Studio LCDDisplay. Profiles were made for these monitors using GretagMacbethProfileMaker 4.1.1 and MonacoPROFILER 4.5 software. These have beenshown previously (Sharma, 2003b, 2003c, 2002a, Starr, 2003) to yield godquality profiles for all profile types. The procedures to create and evaluate thequality of monitor profiles are presented elsewhere (Adams, Sharma 2003a,Fleming 2002, Sharma 2002, Sharma 2003b, Sharma 2003c, Sharma 2001). Thequality of the monitor profiles was investigated using extended methodsdescribed later. All tests were done on the Macintosh platform with Mac OS10.2.3. Photoshop 7.0.1 was used to evaluate and measure the quality ofdisplayed images and profile quality. A general comparison is given for twotypes of displays, CRT and LCD. We found the profiles generated for the samemonitor by the different profiling tools were virtually identical and all profileswere of equivalent good quality results.
Two output profiles were used to simulate a printed SWOP proof appearance onthe displays: the U.S. Web Coated (SWOP) v2 distributed by Adobe and one webuilt from the ANSI/CGATS TR 001-1995 (ANSI, 1995), both based on the
SWOP specifications. The ANSI output profile was created from that report datasource, using GretagMacbeth ProfileMaker 4.1.1 software. We found that thereis only one correct way to soft proof on the display, even though there areseveral seemingly equivalent methods. The results for output profiles werecompared. Other features of the output profiles are considered such as display ofthe GretagMacbeth ColorChecker® Chart (Munsell, MacBeth) andANSI/CGATS TR 001-1995 Output Profile data.
The display of images, using profiles based on the concepts of ColorManagement, was quantitatively investigated. A comparison of CRT and LCDmonitor in the terms of Lab values and ∆E color differences is presented. Theresults show that the LCD monitor exhibits essentially equal quality and worksas well with the profiles as the CRT. In some cases, LCD appears slightly morestable than the CRT.
Images were printed on an Epson Stylus Pro 5000 using the output profile of theprinter. Printed proofs were put side by side with the displayed images and thevisual evaluation of their equality was performed.
Experimental Setup
Two monitors: a 17" Mitsubishi Diamond Plus 73 CRT monitor and a 17" AppleStudio LCD display were plugged in the Apple Macintosh computer. Using twodifferent video cards it is possible to independently manipulate the twomonitors. It is important to ensure that the light conditions at the monitorsurrounding are kept as stable as possible.
Results and Discussion
Creation of Monitor Profiles
The contrast and brightness controls on the monitors were adjusted with the helpof profile making software and were kept the same from the beginning to theend of the process. This step is also called calibration of the monitor. The desiretemperature of 5000 Kelvin (D50), 2° standard observer and γ value of 1.8 (thedefault value for Mac OS platforms) were set for the LCD and CRT monitors.Detailed discussions of this process are given elsewhere (Fleming, 2002,Chovancova 2000, 2002, 2003, Sharma 2002, 2003a-c)
Following the steps of the profile making software, the monitors werecharacterized and the information obtained from the new conditions was savedinto the monitor profile. In our case, GretagMacbeth ProfileMaker 4.1.1 andMonacoPROFILER 4.5 software were used with a GretagMacbeth Spectrolinospectrophotometer to create two different monitor profiles for each monitor.
The newly created profiles were selected as the profiles separately for the CRT
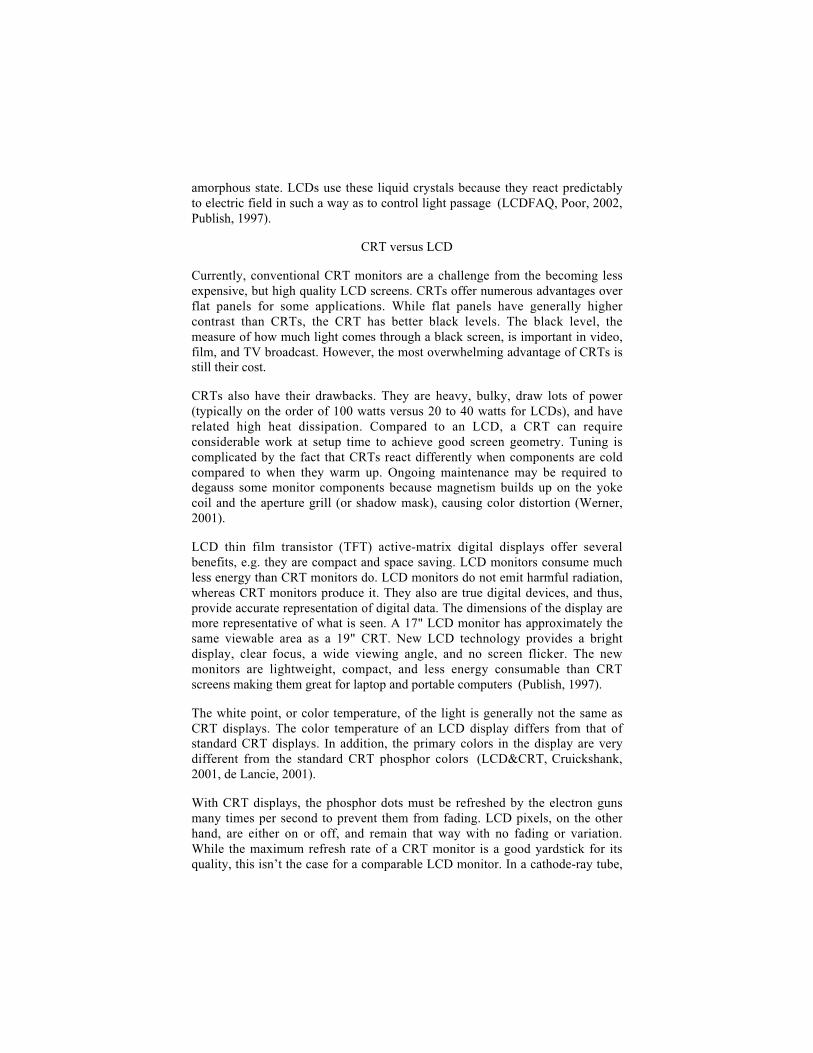
and LCD monitors. Then, these profiles were analyzed. The values of theprimaries (RGB) and the white point information are shown in following tablesand in figures 1-4.
CRT ProfileMaker CRT MonacoPROFILERX Y Z X Y Z
Red 0.5423 0.2949 0.0272 Red 0.5229 0.2821 0.0280
Green 0.2971 0.6429 0.1074 Green 0.3113 0.6552 0.1138Blue 0.1247 0.0621 0.8249 Blue 0.1300 0.0627 0.6831
White 0.9642 1.0000 0.8249 White 0.9643 1.0000 0.8251Table 1. The XYZ values of the primaries (RGB) and the white point for CRT
monitor.
Figure 1.CRT Profile Information from ProfileMaker; RGB Primaries andWhite Point.
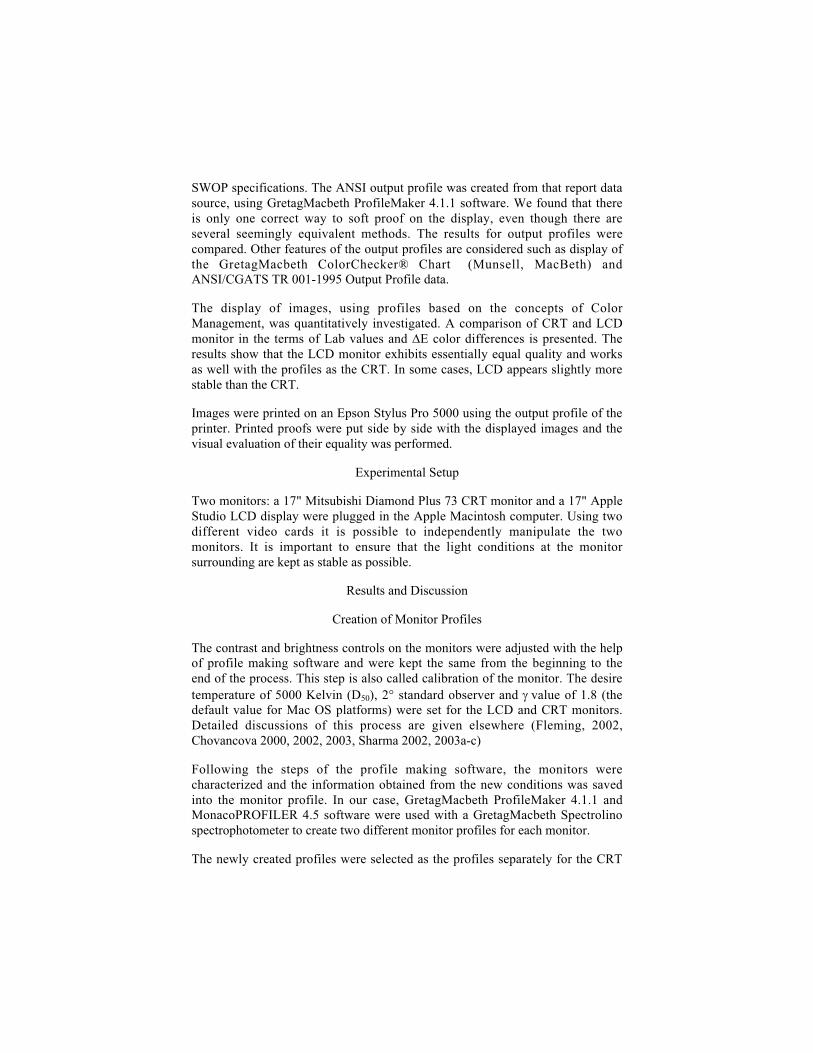
Figure 2. CRT Profile Information from MonacoPROFILER; RGB Primariesand White Point.
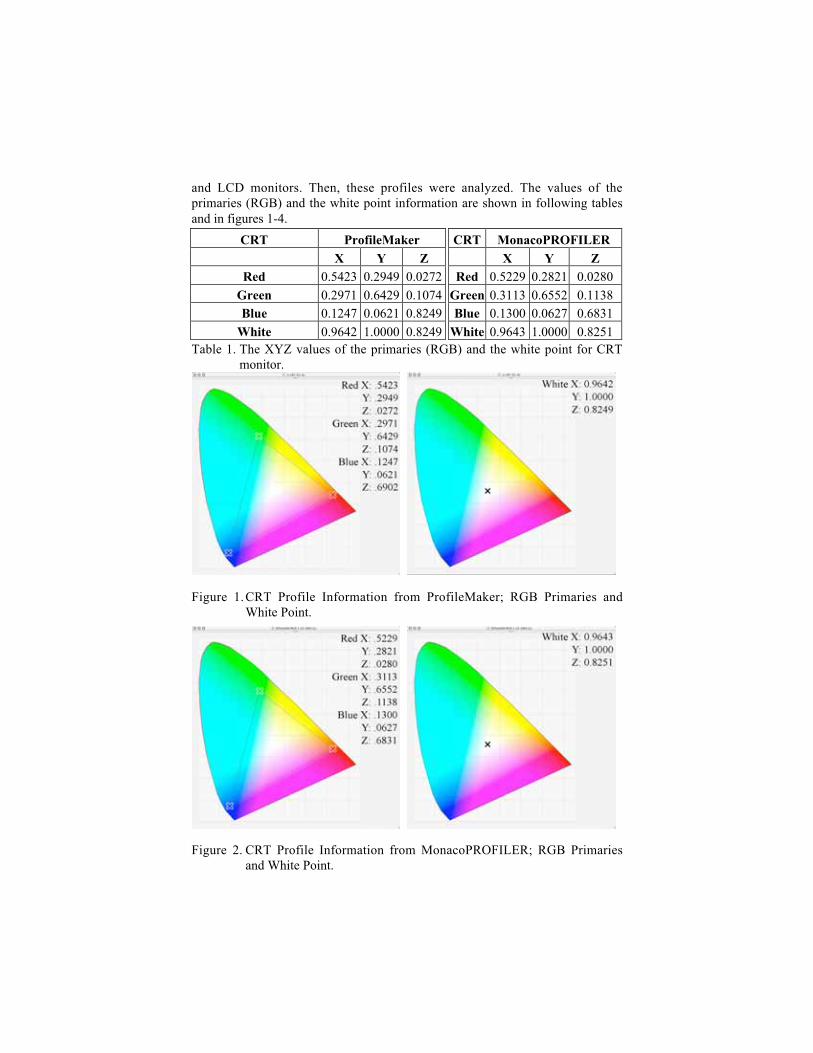
LCD ProfileMaker LCD MonacoPROFILERX Y Z X Y Z
Red 0.5027 0.2811 0.0190 Red 0.5022 0.2813 0.0246
Green 0.3320 0.6298 0.1280 Green 0.3343 0.6316 0.1256Blue 0.1294 0.0891 0.1280 Blue 0.1277 0.0870 0.6747
White 0.9642 1.0000 0.8249 White 0.9643 1.0000 0.8251
Table 2 The XYZ values of the primaries (RGB) and the white point for LCDmonitor
Figure 3. LCD Profile Information from ProfileMaker; RGB Primaries andWhite Point.
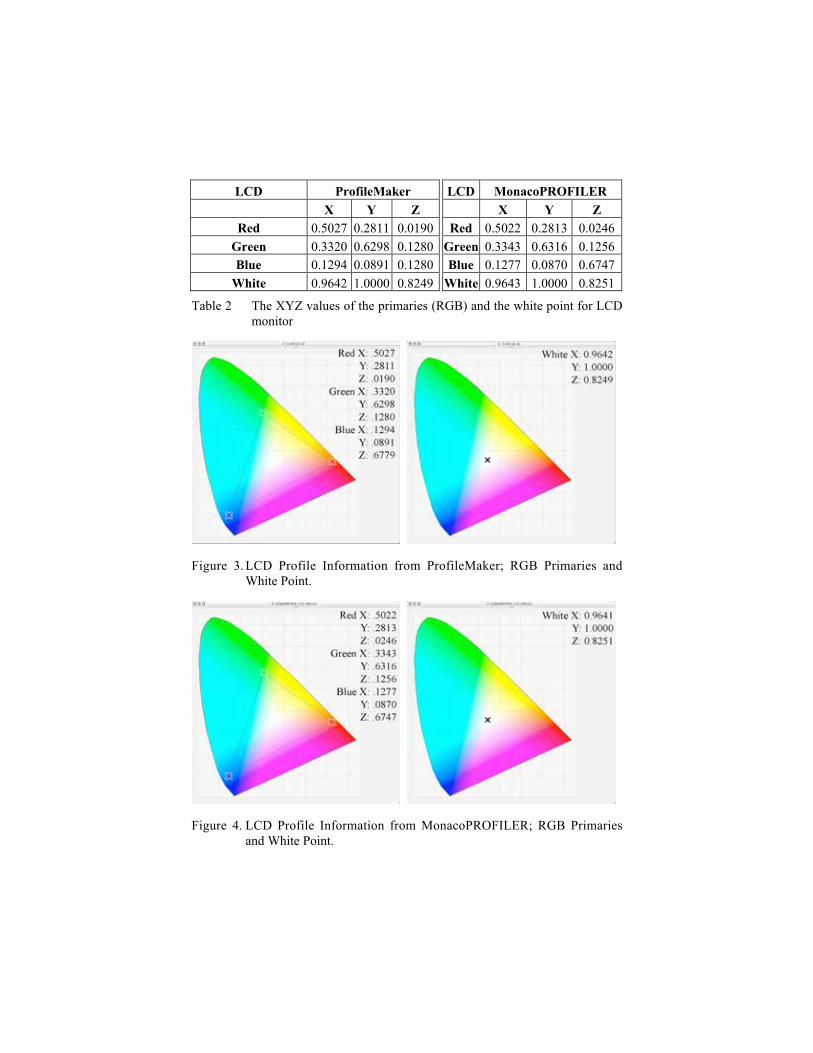
Figure 4. LCD Profile Information from MonacoPROFILER; RGB Primariesand White Point.
Accuracy of Monitor Profiles
Using Photoshop 7, four patches consisting of RGB primaries (255,0,0),(0,255,0), (0,0,255) and a white patch (255,255,255) were displayed on themonitors in RGB and LAB mode to check the accuracy of the profile fordisplaying color patches. The white patch represents the white point or colortemperature of the monitor. In Edit>Color Settings, the Working Space was setto the specific monitor profile space, the Conversion Engine was set to theAdobe Color Engine (ACE) and rendering intent to the Absolute Colorimetric.
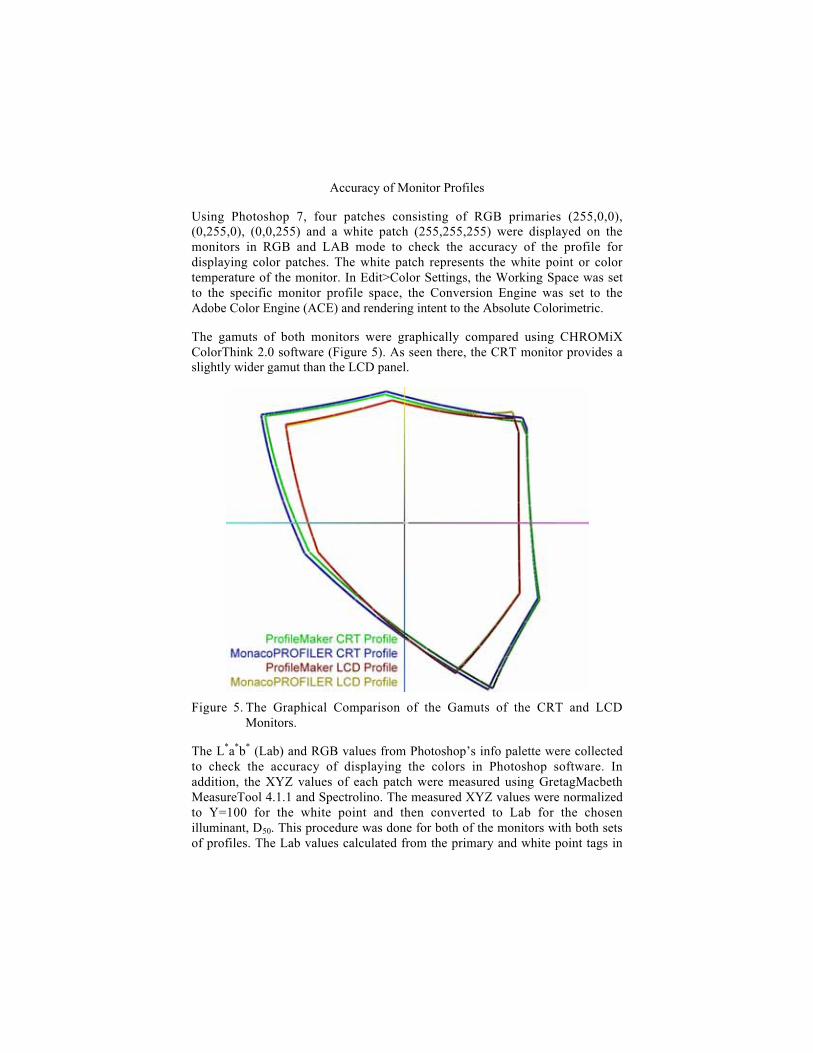
The gamuts of both monitors were graphically compared using CHROMiXColorThink 2.0 software (Figure 5). As seen there, the CRT monitor provides aslightly wider gamut than the LCD panel.
Figure 5. The Graphical Comparison of the Gamuts of the CRT and LCDMonitors.
The L*a*b* (Lab) and RGB values from Photoshop’s info palette were collectedto check the accuracy of displaying the colors in Photoshop software. Inaddition, the XYZ values of each patch were measured using GretagMacbethMeasureTool 4.1.1 and Spectrolino. The measured XYZ values were normalizedto Y=100 for the white point and then converted to Lab for the chosenilluminant, D50. This procedure was done for both of the monitors with both setsof profiles. The Lab values calculated from the primary and white point tags in
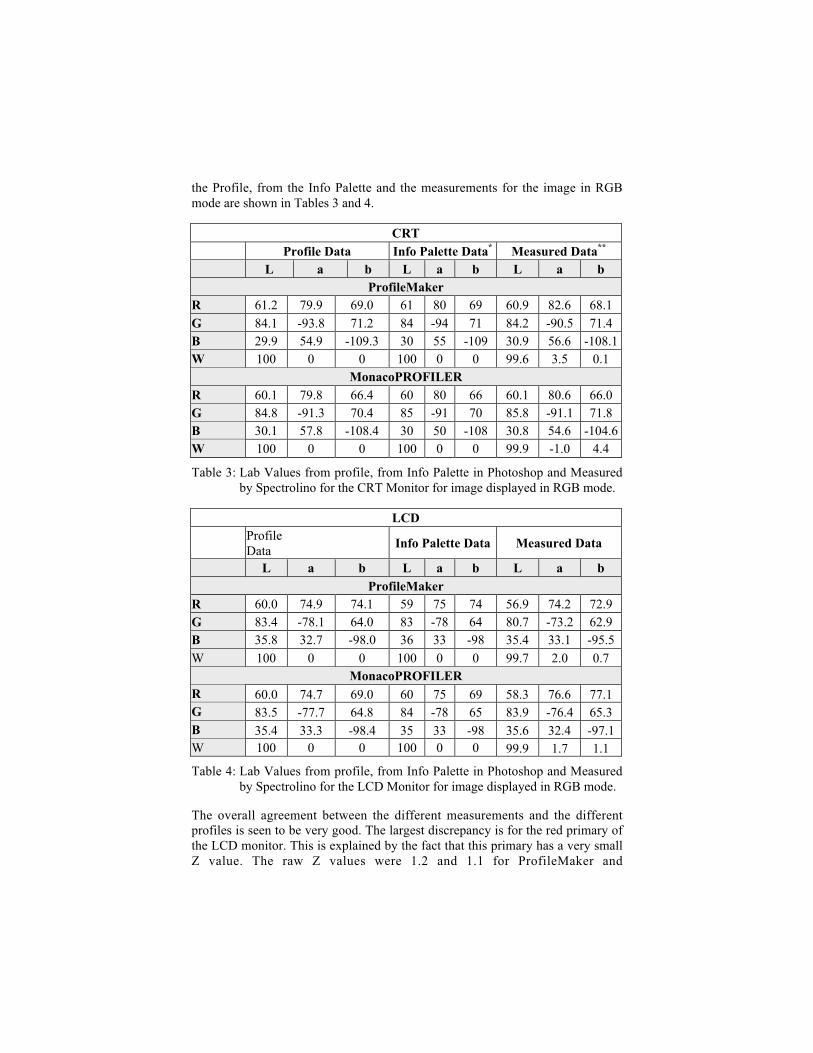
the Profile, from the Info Palette and the measurements for the image in RGBmode are shown in Tables 3 and 4.
CRTProfile Data Info Palette Data* Measured Data**
L a b L a b L a bProfileMaker
R 61.2 79.9 69.0 61 80 69 60.9 82.6 68.1G 84.1 -93.8 71.2 84 -94 71 84.2 -90.5 71.4B 29.9 54.9 -109.3 30 55 -109 30.9 56.6 -108.1W 100 0 0 100 0 0 99.6 3.5 0.1
MonacoPROFILERR 60.1 79.8 66.4 60 80 66 60.1 80.6 66.0G 84.8 -91.3 70.4 85 -91 70 85.8 -91.1 71.8B 30.1 57.8 -108.4 30 50 -108 30.8 54.6 -104.6W 100 0 0 100 0 0 99.9 -1.0 4.4
Table 3: Lab Values from profile, from Info Palette in Photoshop and Measuredby Spectrolino for the CRT Monitor for image displayed in RGB mode.
LCDProfileData
Info Palette Data Measured Data
L a b L a b L a bProfileMaker
R 60.0 74.9 74.1 59 75 74 56.9 74.2 72.9G 83.4 -78.1 64.0 83 -78 64 80.7 -73.2 62.9B 35.8 32.7 -98.0 36 33 -98 35.4 33.1 -95.5W 100 0 0 100 0 0 99.7 2.0 0.7
MonacoPROFILERR 60.0 74.7 69.0 60 75 69 58.3 76.6 77.1G 83.5 -77.7 64.8 84 -78 65 83.9 -76.4 65.3B 35.4 33.3 -98.4 35 33 -98 35.6 32.4 -97.1W 100 0 0 100 0 0 99.9 1.7 1.1
Table 4: Lab Values from profile, from Info Palette in Photoshop and Measuredby Spectrolino for the LCD Monitor for image displayed in RGB mode.
The overall agreement between the different measurements and the differentprofiles is seen to be very good. The largest discrepancy is for the red primary ofthe LCD monitor. This is explained by the fact that this primary has a very smallZ value. The raw Z values were 1.2 and 1.1 for ProfileMaker and
MonacoPROFILER, respectively. The corresponding normalized values were1.5 and 1.4, respectively. The corresponding normalized values from the profileswere 1.9 and 2.5, respectively. The wide variation is b value from 69-77 islargely explained by the large derivative of b with respect to Z;
∂b/∂Z|Z~1 ~ - 6 (1)
This is compounded by variations is Y values of 19.7 (24.8 normalized) forProfileMaker and 21.2 (26.3 normalized) for MonacoPROFILER. Thecorresponding normalized value in both profiles was 28.1.
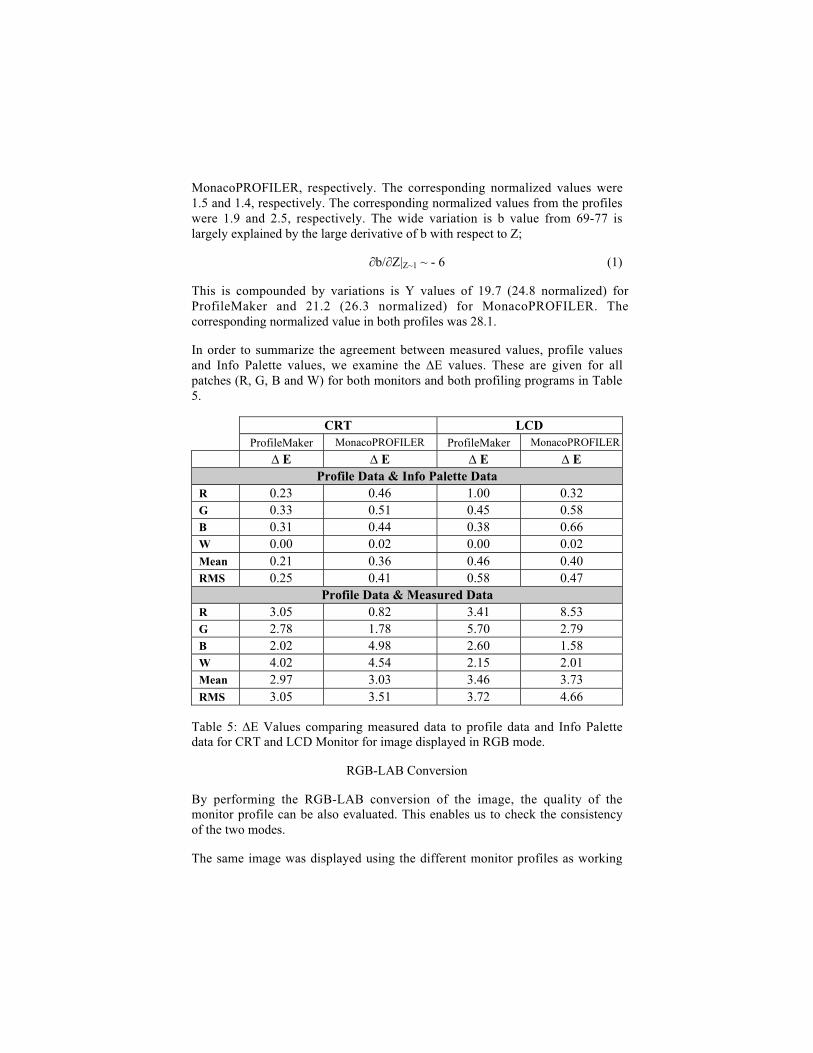
In order to summarize the agreement between measured values, profile valuesand Info Palette values, we examine the ∆E values. These are given for allpatches (R, G, B and W) for both monitors and both profiling programs in Table5.
CRT LCDProfileMaker MonacoPROFILER ProfileMaker MonacoPROFILER
∆ E ∆ E ∆ E ∆ EProfile Data & Info Palette Data
R 0.23 0.46 1.00 0.32G 0.33 0.51 0.45 0.58B 0.31 0.44 0.38 0.66W 0.00 0.02 0.00 0.02Mean 0.21 0.36 0.46 0.40RMS 0.25 0.41 0.58 0.47
Profile Data & Measured DataR 3.05 0.82 3.41 8.53G 2.78 1.78 5.70 2.79B 2.02 4.98 2.60 1.58W 4.02 4.54 2.15 2.01Mean 2.97 3.03 3.46 3.73RMS 3.05 3.51 3.72 4.66
Table 5: ∆E Values comparing measured data to profile data and Info Palettedata for CRT and LCD Monitor for image displayed in RGB mode.
RGB-LAB Conversion
By performing the RGB-LAB conversion of the image, the quality of themonitor profile can be also evaluated. This enables us to check the consistencyof the two modes.
The same image was displayed using the different monitor profiles as working
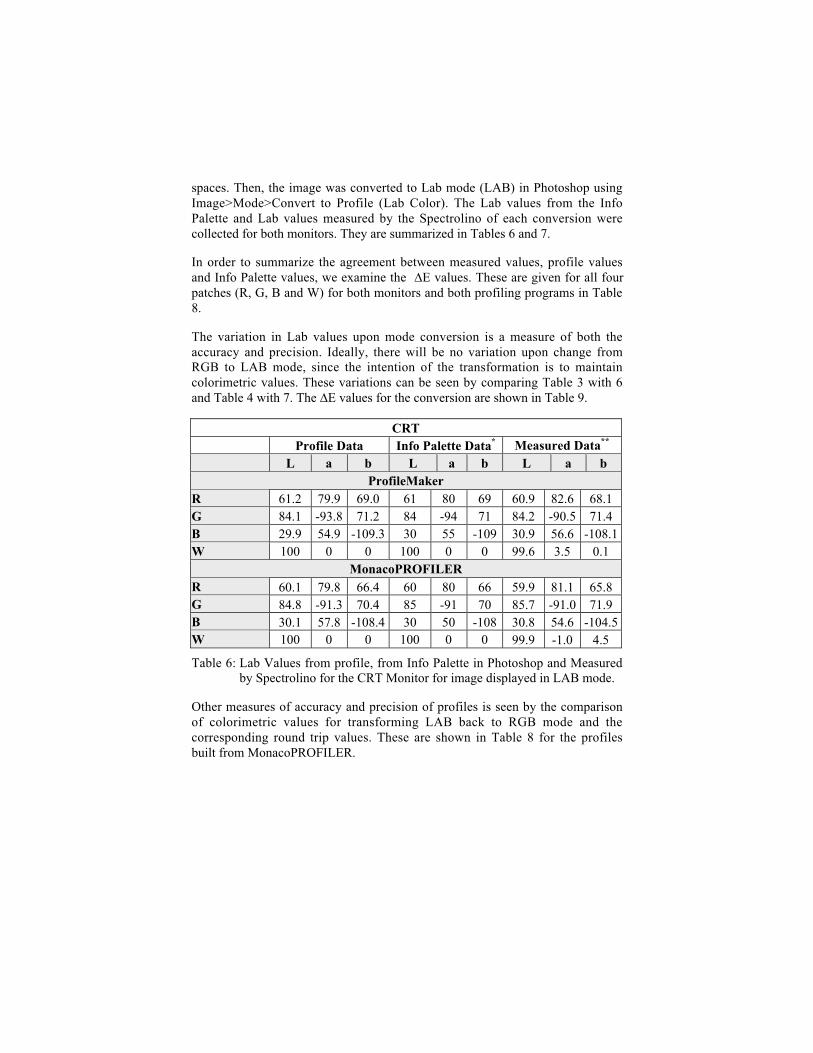
spaces. Then, the image was converted to Lab mode (LAB) in Photoshop usingImage>Mode>Convert to Profile (Lab Color). The Lab values from the InfoPalette and Lab values measured by the Spectrolino of each conversion werecollected for both monitors. They are summarized in Tables 6 and 7.
In order to summarize the agreement between measured values, profile valuesand Info Palette values, we examine the ∆E values. These are given for all fourpatches (R, G, B and W) for both monitors and both profiling programs in Table8.
The variation in Lab values upon mode conversion is a measure of both theaccuracy and precision. Ideally, there will be no variation upon change fromRGB to LAB mode, since the intention of the transformation is to maintaincolorimetric values. These variations can be seen by comparing Table 3 with 6and Table 4 with 7. The ∆E values for the conversion are shown in Table 9.
CRTProfile Data Info Palette Data* Measured Data**
L a b L a b L a bProfileMaker
R 61.2 79.9 69.0 61 80 69 60.9 82.6 68.1G 84.1 -93.8 71.2 84 -94 71 84.2 -90.5 71.4B 29.9 54.9 -109.3 30 55 -109 30.9 56.6 -108.1W 100 0 0 100 0 0 99.6 3.5 0.1
MonacoPROFILERR 60.1 79.8 66.4 60 80 66 59.9 81.1 65.8G 84.8 -91.3 70.4 85 -91 70 85.7 -91.0 71.9B 30.1 57.8 -108.4 30 50 -108 30.8 54.6 -104.5W 100 0 0 100 0 0 99.9 -1.0 4.5
Table 6: Lab Values from profile, from Info Palette in Photoshop and Measuredby Spectrolino for the CRT Monitor for image displayed in LAB mode.
Other measures of accuracy and precision of profiles is seen by the comparisonof colorimetric values for transforming LAB back to RGB mode and thecorresponding round trip values. These are shown in Table 8 for the profilesbuilt from MonacoPROFILER.
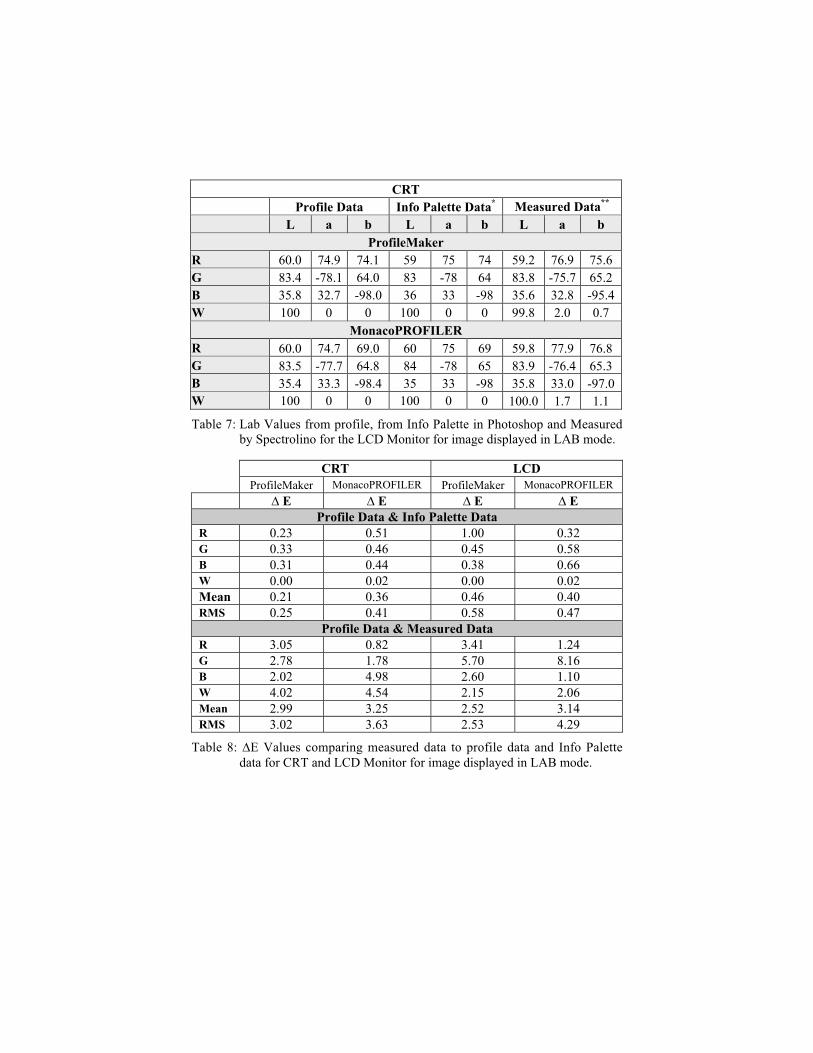
CRTProfile Data Info Palette Data* Measured Data**
L a b L a b L a bProfileMaker
R 60.0 74.9 74.1 59 75 74 59.2 76.9 75.6G 83.4 -78.1 64.0 83 -78 64 83.8 -75.7 65.2B 35.8 32.7 -98.0 36 33 -98 35.6 32.8 -95.4W 100 0 0 100 0 0 99.8 2.0 0.7
MonacoPROFILERR 60.0 74.7 69.0 60 75 69 59.8 77.9 76.8G 83.5 -77.7 64.8 84 -78 65 83.9 -76.4 65.3B 35.4 33.3 -98.4 35 33 -98 35.8 33.0 -97.0W 100 0 0 100 0 0 100.0 1.7 1.1
Table 7: Lab Values from profile, from Info Palette in Photoshop and Measuredby Spectrolino for the LCD Monitor for image displayed in LAB mode.
CRT LCDProfileMaker MonacoPROFILER ProfileMaker MonacoPROFILER
∆ E ∆ E ∆ E ∆ EProfile Data & Info Palette Data
R 0.23 0.51 1.00 0.32G 0.33 0.46 0.45 0.58B 0.31 0.44 0.38 0.66W 0.00 0.02 0.00 0.02Mean 0.21 0.36 0.46 0.40RMS 0.25 0.41 0.58 0.47
Profile Data & Measured DataR 3.05 0.82 3.41 1.24G 2.78 1.78 5.70 8.16B 2.02 4.98 2.60 1.10W 4.02 4.54 2.15 2.06Mean 2.99 3.25 2.52 3.14RMS 3.02 3.63 2.53 4.29
Table 8: ∆E Values comparing measured data to profile data and Info Palettedata for CRT and LCD Monitor for image displayed in LAB mode.
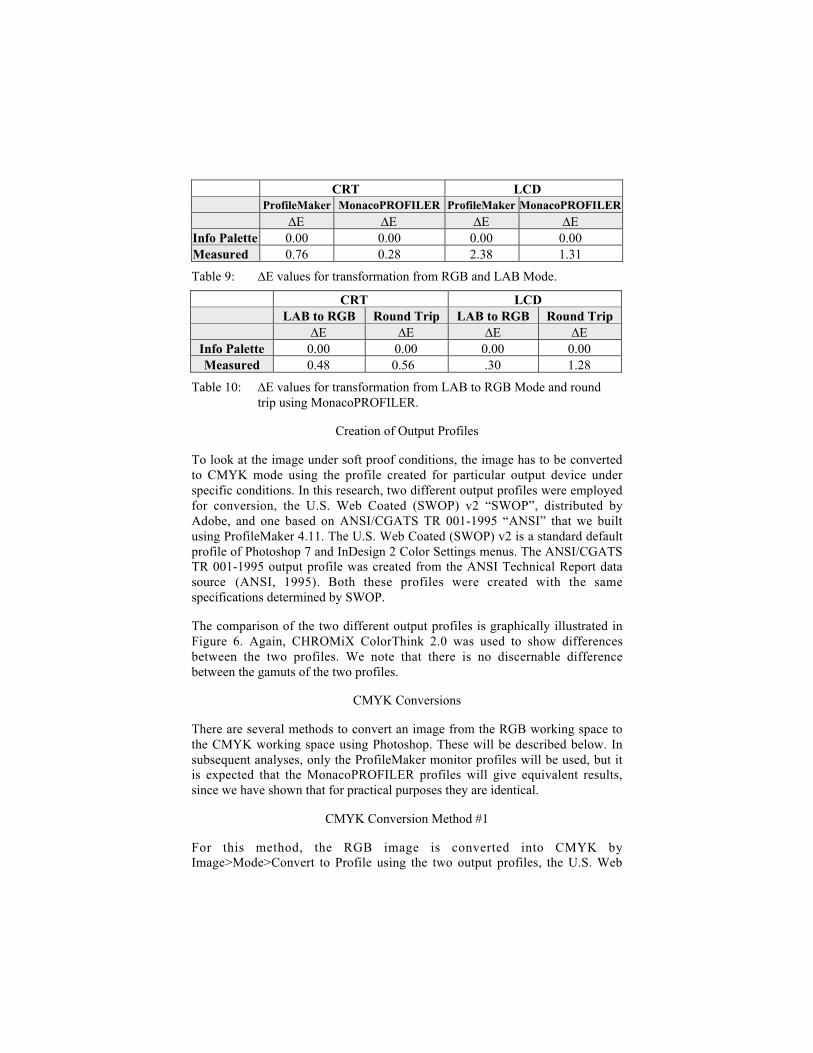
CRT LCDProfileMaker MonacoPROFILER ProfileMaker MonacoPROFILER
∆E ∆E ∆E ∆EInfo Palette 0.00 0.00 0.00 0.00Measured 0.76 0.28 2.38 1.31
Table 9: ∆E values for transformation from RGB and LAB Mode.
CRT LCDLAB to RGB Round Trip LAB to RGB Round Trip
∆E ∆E ∆E ∆EInfo Palette 0.00 0.00 0.00 0.00Measured 0.48 0.56 .30 1.28
Table 10: ∆E values for transformation from LAB to RGB Mode and roundtrip using MonacoPROFILER.
Creation of Output Profiles
To look at the image under soft proof conditions, the image has to be convertedto CMYK mode using the profile created for particular output device underspecific conditions. In this research, two different output profiles were employedfor conversion, the U.S. Web Coated (SWOP) v2 “SWOP”, distributed byAdobe, and one based on ANSI/CGATS TR 001-1995 “ANSI” that we builtusing ProfileMaker 4.11. The U.S. Web Coated (SWOP) v2 is a standard defaultprofile of Photoshop 7 and InDesign 2 Color Settings menus. The ANSI/CGATSTR 001-1995 output profile was created from the ANSI Technical Report datasource (ANSI, 1995). Both these profiles were created with the samespecifications determined by SWOP.
The comparison of the two different output profiles is graphically illustrated inFigure 6. Again, CHROMiX ColorThink 2.0 was used to show differencesbetween the two profiles. We note that there is no discernable differencebetween the gamuts of the two profiles.
CMYK Conversions
There are several methods to convert an image from the RGB working space tothe CMYK working space using Photoshop. These will be described below. Insubsequent analyses, only the ProfileMaker monitor profiles will be used, but itis expected that the MonacoPROFILER profiles will give equivalent results,since we have shown that for practical purposes they are identical.
CMYK Conversion Method #1
For this method, the RGB image is converted into CMYK byImage>Mode>Convert to Profile using the two output profiles, the U.S. Web

Coated (SWOP) v2 and ANSI/CGATS TR 001-1995. The Adobe ConversionEngine (ACE) and Absolute Colorimetric intent were used in theImage>Mode>Convert to Profile path of conversion. The CMYK image wasconverted back to the RGB image using Image>Mode>Convert to Profile usingthe particular monitor profile. The results are summarized in Table 11. DetailedLab values and the calculation of ∆E of the transformations to CMYK modeusing the output profiles for the CRT and LCD monitors are given elsewhere(Chovancova, 2003).
Figure 6. The Graphical Comparison of the Gamuts of ANSI andSWOP Output Profiles.
CMYK Conversion Method #2
For the second method, the RGB image was converted into CMYK, again usingthe two different output profiles, but a different conversion pathway. Thetransformations were made via View>Proof Setup>Custom menu. Thisconfiguration of the proof setup via the Custom menu option was done with noimage open. If attempting to configure the setup with an image open then theexisting Photoshop default soft proof profile will be retained as the default.Again, the Adobe Conversion Engine and the absolute colorimetric intent wereused. After these steps were executed, the RGB image can be displayed andconverted into CMYK mode with soft proof setup turned on. There are twoways to view the image as a soft proof, either with the paper “white” simulationturned “on” or “off”. The second set of the Lab values gathered for
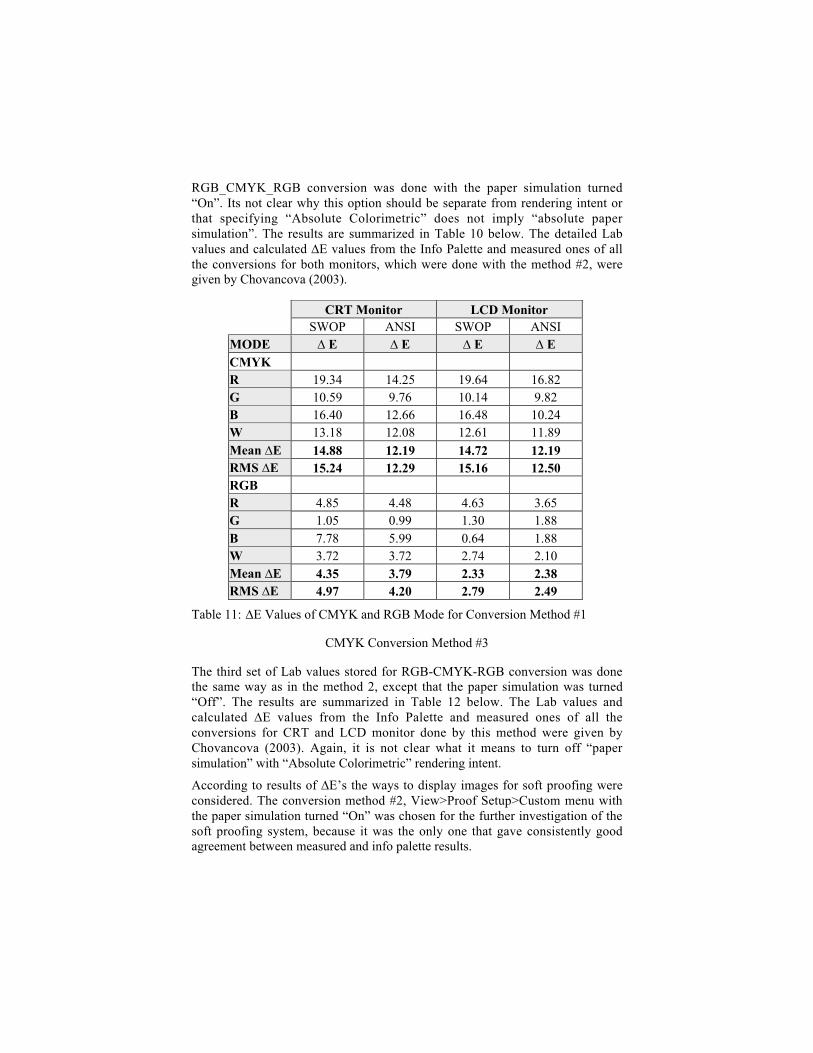
RGB_CMYK_RGB conversion was done with the paper simulation turned“On”. Its not clear why this option should be separate from rendering intent orthat specifying “Absolute Colorimetric” does not imply “absolute papersimulation”. The results are summarized in Table 10 below. The detailed Labvalues and calculated ∆E values from the Info Palette and measured ones of allthe conversions for both monitors, which were done with the method #2, weregiven by Chovancova (2003).
CRT Monitor LCD Monitor SWOP ANSI SWOP ANSIMODE ∆ E ∆ E ∆ E ∆ ECMYK R 19.34 14.25 19.64 16.82G 10.59 9.76 10.14 9.82B 16.40 12.66 16.48 10.24W 13.18 12.08 12.61 11.89Mean ∆E 14.88 12.19 14.72 12.19RMS ∆E 15.24 12.29 15.16 12.50RGB R 4.85 4.48 4.63 3.65G 1.05 0.99 1.30 1.88B 7.78 5.99 0.64 1.88W 3.72 3.72 2.74 2.10Mean ∆E 4.35 3.79 2.33 2.38RMS ∆E 4.97 4.20 2.79 2.49
Table 11: ∆E Values of CMYK and RGB Mode for Conversion Method #1
CMYK Conversion Method #3
The third set of Lab values stored for RGB-CMYK-RGB conversion was donethe same way as in the method 2, except that the paper simulation was turned“Off”. The results are summarized in Table 12 below. The Lab values andcalculated ∆E values from the Info Palette and measured ones of all theconversions for CRT and LCD monitor done by this method were given byChovancova (2003). Again, it is not clear what it means to turn off “papersimulation” with “Absolute Colorimetric” rendering intent.
According to results of ∆E’s the ways to display images for soft proofing wereconsidered. The conversion method #2, View>Proof Setup>Custom menu withthe paper simulation turned “On” was chosen for the further investigation of thesoft proofing system, because it was the only one that gave consistently goodagreement between measured and info palette results.
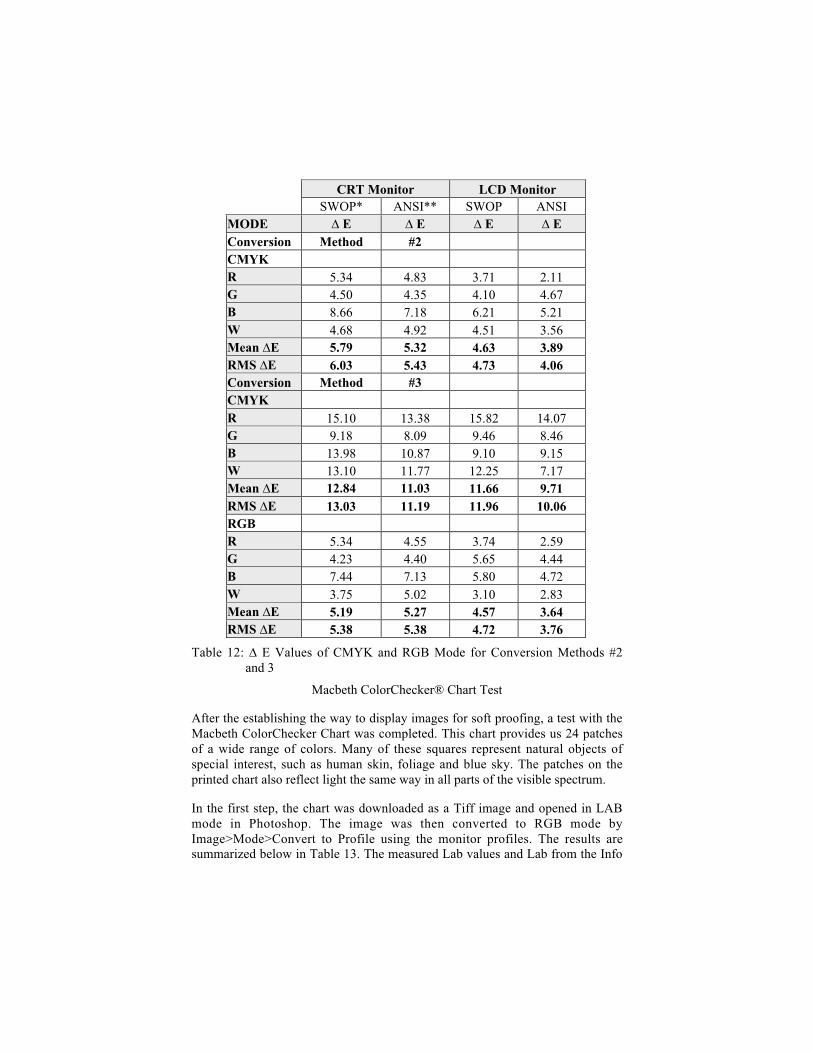
CRT Monitor LCD Monitor SWOP* ANSI** SWOP ANSIMODE ∆ E ∆ E ∆ E ∆ EConversion Method #2CMYKR 5.34 4.83 3.71 2.11G 4.50 4.35 4.10 4.67B 8.66 7.18 6.21 5.21W 4.68 4.92 4.51 3.56Mean ∆E 5.79 5.32 4.63 3.89RMS ∆E 6.03 5.43 4.73 4.06Conversion Method #3CMYKR 15.10 13.38 15.82 14.07G 9.18 8.09 9.46 8.46B 13.98 10.87 9.10 9.15W 13.10 11.77 12.25 7.17Mean ∆E 12.84 11.03 11.66 9.71RMS ∆E 13.03 11.19 11.96 10.06RGBR 5.34 4.55 3.74 2.59G 4.23 4.40 5.65 4.44B 7.44 7.13 5.80 4.72W 3.75 5.02 3.10 2.83Mean ∆E 5.19 5.27 4.57 3.64RMS ∆E 5.38 5.38 4.72 3.76
Table 12: ∆ E Values of CMYK and RGB Mode for Conversion Methods #2and 3
Macbeth ColorChecker® Chart Test
After the establishing the way to display images for soft proofing, a test with theMacbeth ColorChecker Chart was completed. This chart provides us 24 patchesof a wide range of colors. Many of these squares represent natural objects ofspecial interest, such as human skin, foliage and blue sky. The patches on theprinted chart also reflect light the same way in all parts of the visible spectrum.
In the first step, the chart was downloaded as a Tiff image and opened in LABmode in Photoshop. The image was then converted to RGB mode byImage>Mode>Convert to Profile using the monitor profiles. The results aresummarized below in Table 13. The measured Lab values and Lab from the Info
Palette of all 24 patches for both monitors were given by Chovancova (2003).
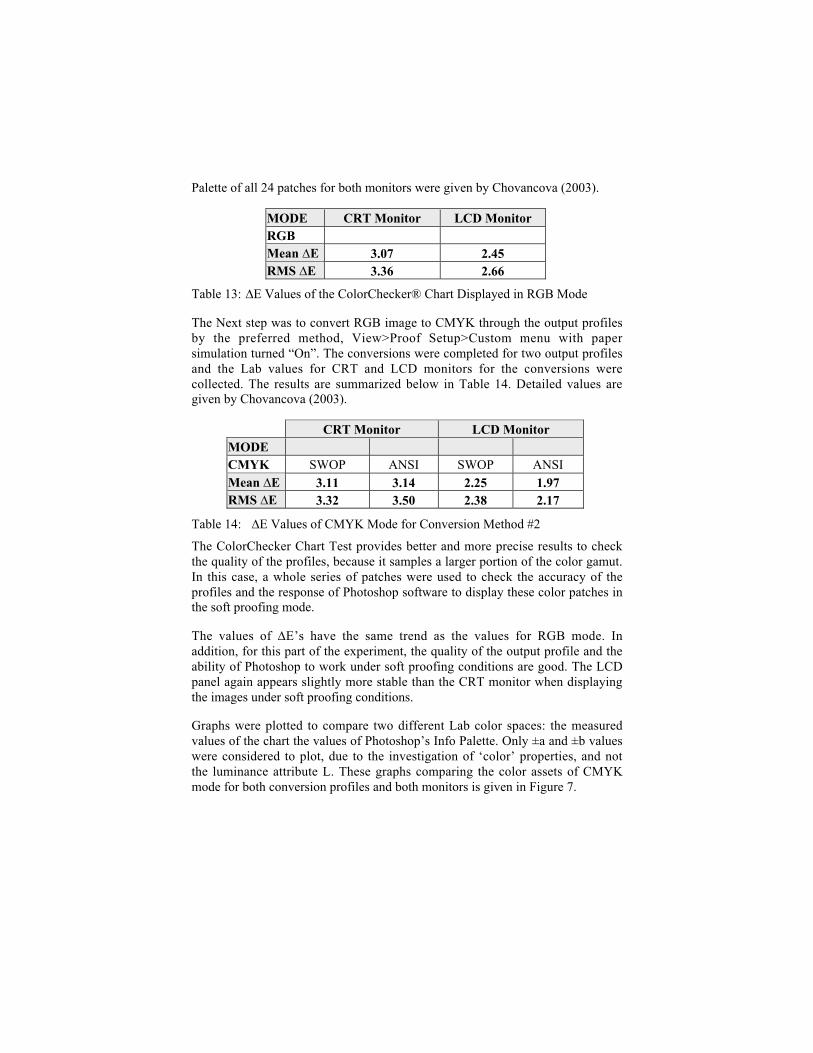
MODE CRT Monitor LCD MonitorRGBMean ∆E 3.07 2.45RMS ∆E 3.36 2.66
Table 13: ∆E Values of the ColorChecker® Chart Displayed in RGB Mode
The Next step was to convert RGB image to CMYK through the output profilesby the preferred method, View>Proof Setup>Custom menu with papersimulation turned “On”. The conversions were completed for two output profilesand the Lab values for CRT and LCD monitors for the conversions werecollected. The results are summarized below in Table 14. Detailed values aregiven by Chovancova (2003).
CRT Monitor LCD MonitorMODECMYK SWOP ANSI SWOP ANSIMean ∆E 3.11 3.14 2.25 1.97RMS ∆E 3.32 3.50 2.38 2.17
Table 14: ∆E Values of CMYK Mode for Conversion Method #2
The ColorChecker Chart Test provides better and more precise results to checkthe quality of the profiles, because it samples a larger portion of the color gamut.In this case, a whole series of patches were used to check the accuracy of theprofiles and the response of Photoshop software to display these color patches inthe soft proofing mode.
The values of ∆E’s have the same trend as the values for RGB mode. Inaddition, for this part of the experiment, the quality of the output profile and theability of Photoshop to work under soft proofing conditions are good. The LCDpanel again appears slightly more stable than the CRT monitor when displayingthe images under soft proofing conditions.
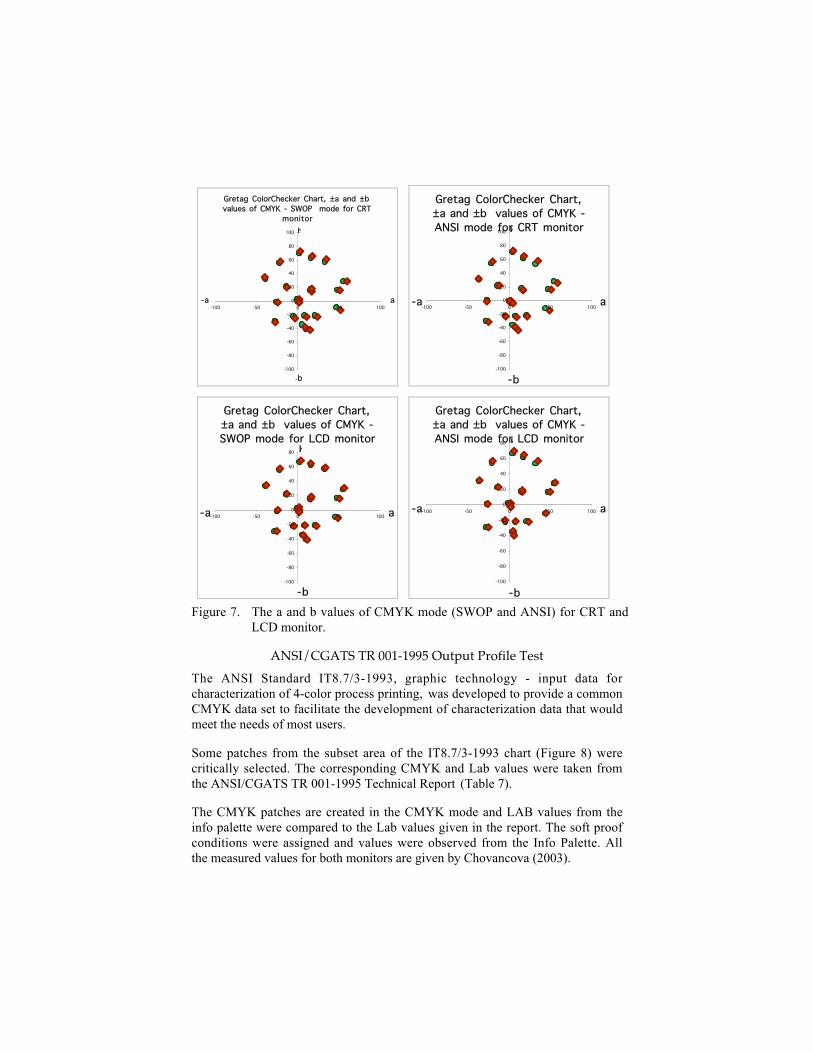
Graphs were plotted to compare two different Lab color spaces: the measuredvalues of the chart the values of Photoshop’s Info Palette. Only ±a and ±b valueswere considered to plot, due to the investigation of ‘color’ properties, and notthe luminance attribute L. These graphs comparing the color assets of CMYKmode for both conversion profiles and both monitors is given in Figure 7.
Gretag ColorChecker Chart, ±a and ±b values of CMYK - SWOP mode for CRT
monitor
-100
-80
-60
-40
-20
0
20
40
60
80
100
-100 -50 0 50 100
-
-b
b
a-a
Gretag ColorChecker Chart, ±a and ±b values of CMYK - ANSI mode for CRT monitor
-100
-80
-60
-40
-20
0
20
40
60
80
100
-100 -50 0 50 100-a
-b
b
a
Gretag ColorChecker Chart, ±a and ±b values of CMYK - SWOP mode for LCD monitor
-100
-80
-60
-40
-20
0
20
40
60
80
-100 -50 0 50 100-a
-b
b
a
Gretag ColorChecker Chart, ±a and ±b values of CMYK - ANSI mode for LCD monitor
-100
-80
-60
-40
-20
0
20
40
60
80
-100 -50 0 50 100-a
-b
b
a
Figure 7. The a and b values of CMYK mode (SWOP and ANSI) for CRT andLCD monitor.
ANSI/CGATS TR 001-1995 Output Profile Test
The ANSI Standard IT8.7/3-1993, graphic technology - input data forcharacterization of 4-color process printing, was developed to provide a commonCMYK data set to facilitate the development of characterization data that wouldmeet the needs of most users.
Some patches from the subset area of the IT8.7/3-1993 chart (Figure 8) werecritically selected. The corresponding CMYK and Lab values were taken fromthe ANSI/CGATS TR 001-1995 Technical Report (Table 7).
The CMYK patches are created in the CMYK mode and LAB values from theinfo palette were compared to the Lab values given in the report. The soft proofconditions were assigned and values were observed from the Info Palette. Allthe measured values for both monitors are given by Chovancova (2003).
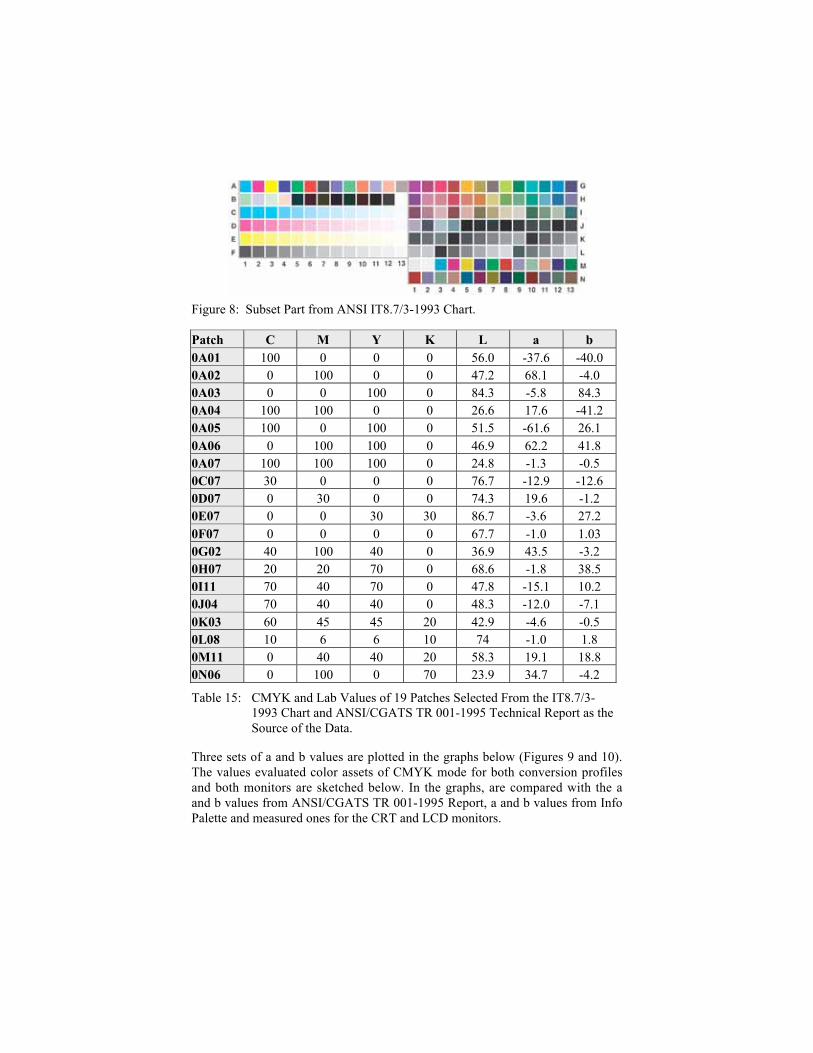
Figure 8: Subset Part from ANSI IT8.7/3-1993 Chart.
Patch C M Y K L a b0A01 100 0 0 0 56.0 -37.6 -40.00A02 0 100 0 0 47.2 68.1 -4.00A03 0 0 100 0 84.3 -5.8 84.30A04 100 100 0 0 26.6 17.6 -41.20A05 100 0 100 0 51.5 -61.6 26.10A06 0 100 100 0 46.9 62.2 41.80A07 100 100 100 0 24.8 -1.3 -0.50C07 30 0 0 0 76.7 -12.9 -12.60D07 0 30 0 0 74.3 19.6 -1.20E07 0 0 30 30 86.7 -3.6 27.20F07 0 0 0 0 67.7 -1.0 1.030G02 40 100 40 0 36.9 43.5 -3.20H07 20 20 70 0 68.6 -1.8 38.50I11 70 40 70 0 47.8 -15.1 10.20J04 70 40 40 0 48.3 -12.0 -7.10K03 60 45 45 20 42.9 -4.6 -0.50L08 10 6 6 10 74 -1.0 1.80M11 0 40 40 20 58.3 19.1 18.80N06 0 100 0 70 23.9 34.7 -4.2
Table 15: CMYK and Lab Values of 19 Patches Selected From the IT8.7/3-1993 Chart and ANSI/CGATS TR 001-1995 Technical Report as theSource of the Data.
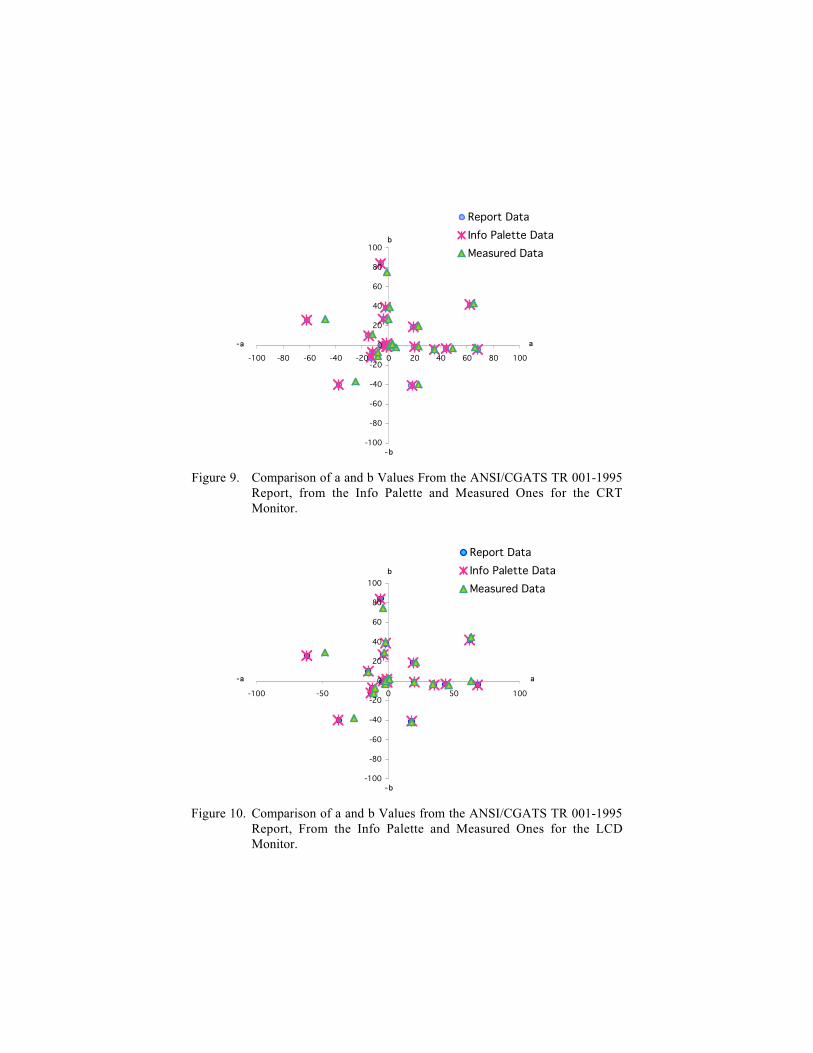
Three sets of a and b values are plotted in the graphs below (Figures 9 and 10).The values evaluated color assets of CMYK mode for both conversion profilesand both monitors are sketched below. In the graphs, are compared with the aand b values from ANSI/CGATS TR 001-1995 Report, a and b values from InfoPalette and measured ones for the CRT and LCD monitors.
-100
-80
-60
-40
-20
0
20
40
60
80
100
-100 -80 -60 -40 -20 0 20 40 60 80 100
Report DataInfo Palette DataMeasured Data
-a
-b
b
a
Figure 9. Comparison of a and b Values From the ANSI/CGATS TR 001-1995Report, from the Info Palette and Measured Ones for the CRTMonitor.
-100
-80
-60
-40
-20
0
20
40
60
80
100
-100 -50 0 50 100
Report DataInfo Palette DataMeasured Data
-a
-b
b
a
Figure 10. Comparison of a and b Values from the ANSI/CGATS TR 001-1995Report, From the Info Palette and Measured Ones for the LCDMonitor.
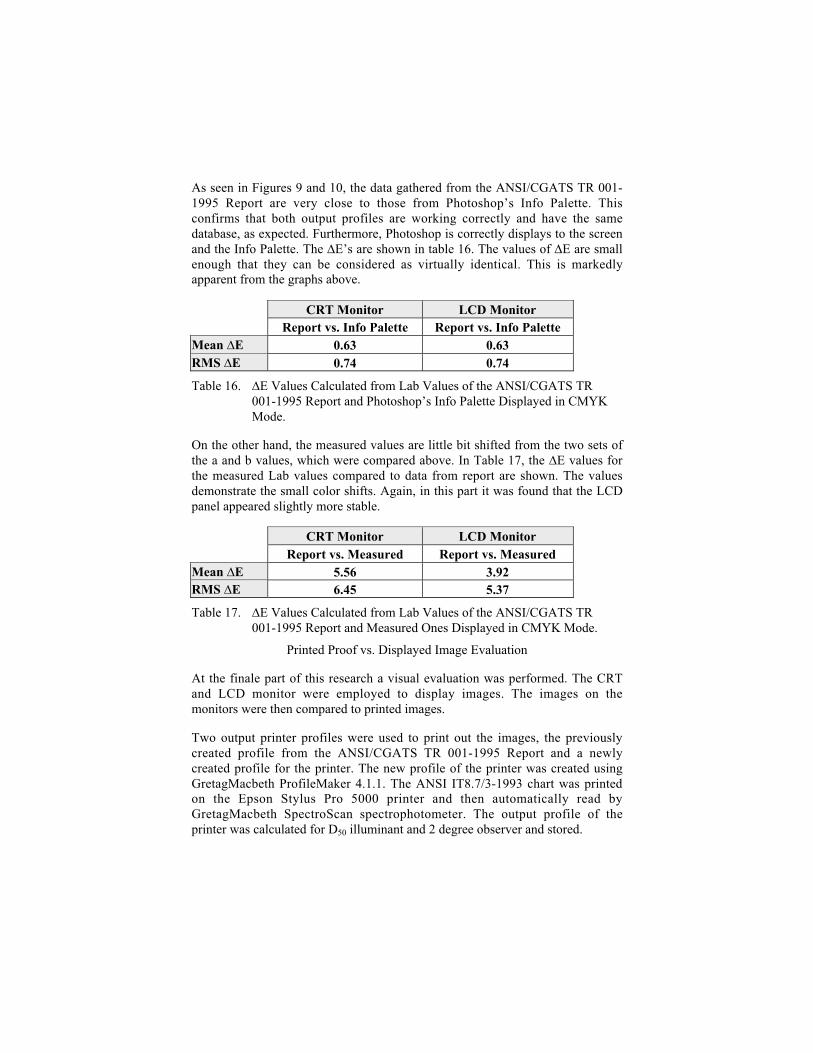
As seen in Figures 9 and 10, the data gathered from the ANSI/CGATS TR 001-1995 Report are very close to those from Photoshop’s Info Palette. Thisconfirms that both output profiles are working correctly and have the samedatabase, as expected. Furthermore, Photoshop is correctly displays to the screenand the Info Palette. The ∆E’s are shown in table 16. The values of ∆E are smallenough that they can be considered as virtually identical. This is markedlyapparent from the graphs above.
CRT Monitor LCD MonitorReport vs. Info Palette Report vs. Info Palette
Mean ∆E 0.63 0.63RMS ∆E 0.74 0.74
Table 16. ∆E Values Calculated from Lab Values of the ANSI/CGATS TR001-1995 Report and Photoshop’s Info Palette Displayed in CMYKMode.
On the other hand, the measured values are little bit shifted from the two sets ofthe a and b values, which were compared above. In Table 17, the ∆E values forthe measured Lab values compared to data from report are shown. The valuesdemonstrate the small color shifts. Again, in this part it was found that the LCDpanel appeared slightly more stable.
CRT Monitor LCD MonitorReport vs. Measured Report vs. Measured
Mean ∆E 5.56 3.92RMS ∆E 6.45 5.37
Table 17. ∆E Values Calculated from Lab Values of the ANSI/CGATS TR001-1995 Report and Measured Ones Displayed in CMYK Mode.
Printed Proof vs. Displayed Image Evaluation
At the finale part of this research a visual evaluation was performed. The CRTand LCD monitor were employed to display images. The images on themonitors were then compared to printed images.
Two output printer profiles were used to print out the images, the previouslycreated profile from the ANSI/CGATS TR 001-1995 Report and a newlycreated profile for the printer. The new profile of the printer was created usingGretagMacbeth ProfileMaker 4.1.1. The ANSI IT8.7/3-1993 chart was printedon the Epson Stylus Pro 5000 printer and then automatically read byGretagMacbeth SpectroScan spectrophotometer. The output profile of theprinter was calculated for D50 illuminant and 2 degree observer and stored.
The procedures described above were followed to obtain the soft proofingsystem pathway. Images were opened in Photoshop and converted to CMYKmode. Then the selected conversion method was chosen and the images weredisplayed at the screen as soft proofs. They were compared to printed imagesplaced in a 5000 K viewing booth. The visual comparison was quite satisfying.
Conclusions
In a soft proofing system, a monitor is supposed to show what a job will looklike when printed. Quantitative and visual considerations were accomplished inthis research work to provide these results. The process was focused on separateparts of a soft proofing system and each of the steps was quantitativelyevaluated.
The first part of the experiment explored the evaluation process of color monitorprofiles along with the color quality of software used to achieve the createdprofiles. Two monitor profiles each, for CRT and LCD monitors, were createdand the quality of the profiles was determined. The ∆E values obtained are morethan satisfactory. It was shown that the profiles working along with Photoshopsoftware give essentially exact results within the normal fluctuation of displaydevices. Generally, slightly better results were seen for the LCD display,suggesting that its values are slightly more stable. By performing the RGB-LABconversion of the image, the quality of the monitor profile was further evaluated.The ∆E values were again in the acceptable range, but in this case, slightly betterresults were seen with the CRT monitor.
Three methods to convert image from RGB space to the CMYK were analyzed.Surprisingly, only one was acceptable. To preview the image most accurately, itis advised that the following option be employed: “View>Proof Setup>Custommenu” conversion with paper simulation turned “On.” The other two options,“Image>Mode>Convert to Profile” & “View>Proof Setup>Custom menu”Conversion Path with paper simulation turned Off, reveal significantdiscrepancies, which will be investigated in the future. Because images could bedisplayed by too many ways, everybody should be aware of how the imageshould be displayed to match requirements. The conversion method #2,View>Proof Setup>Custom menu with the paper simulation turned “On” waschosen for all further investigation of the soft proofing system.
There is also another issue occurring during the experiment. As far as we know,both output profiles were created from the same data source. Thus, we wouldexpect the same results in our CMYK conversions. The diversity of two outputprofiles, the U.S. Web Coated (SWOP) v2 as well as the ANSI/CGATS TR 001-1995, should be verified in future work. The difference between these twoprofiles is not significant. The fact that every single profile, which is createdfrom the same source of data, can vary is further illustrated here.
The GretagMacbeth ColorChecker® Chart Test and ANSI/CGATS TR 001-1995 Output Profile Test were chosen to more precisely assess the color qualityof the monitors and output profiles in greater detail. These showed similarlygood quality results. The accuracy of monitor profiles can be deemed asexcellent. The output profiles are also working acceptably. In addition,Photoshop is able to display the right colors on the screen and in the Info Palette.
From the results found here the Liquid Crystal Display shows not significant butstill better results than the Cathode Ray Tube monitor. This confirms that thetechnology of LCD panels has developed sufficiently for their use in precisecolor work.
The enhanced quality of monitor profile of LCD panel could be based on thetechnology used to transform values. Profile making software usually uses amatrix for CRT’s and Look Up Tables (LUT) for LCD’s.
The CRT and LCD monitor were employed to display images and visualevaluation was performed. The images on the monitors were then compared tothe printed images. The procedures described in the experimental part werecompleted to obtain the soft proofing set up. Images were opened in Photoshopand converted to soft proofing mode by the selected conversion method. Theywere compared to printed images placed in the viewing booth under D50 lightconditions. Looking at the images, soft proofing set up was considered as verysatisfying. The appearance of both, the displayed and printed proofs were closein terms of both details and colors. The whole process described in this researchleads to predicted results that soft proofing can work under very specificconditions. Using these methods, the consumer is able to achieve high-qualityresults.
In conclusion, color management is an important element in most creativestudios whether prepress or art. Along with the explosion of digital devices allaround the world, it will be increasingly crucial to employ color management inthe workflow.
References
Adams, R. M. and Weisberg, J. B.2001 “The GATF Practical Guide to Color Management”, second edition,GATFPress, Pittsburgh.
Adams, R. M. and Romano, F. J.1999 “Computer to Plate: Automating the Printing Industry”, GATFPress.
ANSI1996 IT8.7/3 “Graphic technology – Input data for characterization of 4-colorprocess printing”, also published as ISO 12642:1996 (seehttp://www.npes.org/standards/order.html for ordering information).1995 Committee for Graphic Arts Technologies Standards (CGAT), “GraphicTechnology — Color Characterization Data for Type 1 Printing”, ANSI TechnicalReport, August.
Berns, R. S.1996 “Methods for Characterizing CRT Displays”, Displays (Technology andApplications), Vol. 16, #4, 1996.
Berns, R. S., Motta, R. J. and Gorzynski, M. E.1993 “CRT Colorimetry. (2). Metrology”, Color Res. Appl., v. 18, no. 5, Oct.
Brues, S.2000 “Postscriptum on Color Management”, GretagMacbeth, Second Edition.
Chovancova, V.2003 “CRT versus LCD Monitors for Soft Proofing; Quantitative and VisualConsiderations”, MS Thesis, Western Michigan University, April.2002 “Accuracy of Monitor Profiles”, Proc. TAGA.2000 “Color Monitor Colorimetry”, Proc. of the Nat. Grad. Student Comp. inPrinting and Paper Technology, Slovak Republic.
CIE1932 Proceedings, Cambridge University Press, Cambridge.
Cruickshank, A.2001 “LCD vs. CRT”, PC Direct, March.
de Lancie, P.2001 “Monitors for video workstations”, Digital Video, v. 9, no. 11, Nov., p. 56-64.
Field, G. G.1986 “Color Variability Associated with Printing GCR Color Separations”, TAGAProceedings, 145-157.
Fleming, P. D., and Sharma, A.2002 “Color Management and ICC Profiles: Can’t Live Without It So Learn To LiveWith It!”, Gravure Magazine, August.
GEShttp://www.ges.com.sg/refresh.html.
Graphics World1997 “Beginner’s Guide to Monitors”, Graphics World, no. 130, January/February.
Green, P.1999 “Understanding Digital Color”, 2nd Edition, GATFPress, Chapter 7.

Hutcheson, D.“Successful Soft Proofing – Making Your Monitor Really Match the Proof”,http://www.apple.com/colorsync/stories/hutcheson/
ICCHome page, http://www.color.org.
Integrated Color Solutions2003 “Remote Director; Collaborative Design & Soft Proofing,” downloaded fromhttp://www.swop.org.
LCD-02http://www6.tomshardware.com/display/20020114/lcd-02.html.
LCD&CRThttp://www.touchscreens.com/compare_lcd_crt.
LCDFAQhttp://www.eizo.co.jp/welcome/support/faqs/lcd/index.html.
MacBethhttp://www.digital-photography.org/mcbeth_color_checking/Macbeth_ColorChecker_Gray.html.
Munsellhttp://www.munsell.com/Specialty%20Color%20Charts.htm.
Planck, M.1901 “Ueber das Gesetz der Energieverteilung in Normalspectrum”, Ann. Physik 4,553.
Poor, Alfred2002 “LCD Monitors: Technology Update”, ExtremeTech, January,http://www.extremetech.com/article.
Publish1997 “Future (of Monitors) Is Flat”, Publish, v. 12, no. 3, March, p. 19.
Rich, J.2002 “Calibration; Choices in Real World Workflow”, Digital Output, vol. 8, no. 3,March.
Starr, B.2003 “In VIVID Color: Color Management Made EZ”. Digital Photographer,Volume 5 Number 2, 90-93.
Sharma, A.2003a “Understanding Color Management”, Delmar Thomson Publishing, July (inpress).2001 “The Square Window – Monitor Profiling”, Electronic Imaging, February.
Sharma, A. and Fleming, P. D.2003b “WMU ICC Profiling Review 3.0 - Measuring the Quality of CommercialICC Color Management Software”, January.2003c “Measuring the Quality of ICC Profiles and Color-Management Software”,The Seybold Report, v. 2, no. 19.2002a “WMU ICC Profiling Review 1.1 - Evaluating the Quality of CommercialICC Color Management Software”, Proceedings of TAGA Technical Conference,North Carolina, April 2002.
Sharma, A., Gouch, M. P., and Rughani, D. N.2002b “Generation of an ICC profile from a proprietary style file”, J. Imag. Sci.Tech, 46, 26.
Smith, D. J.http://home.houston.rr.com/djsmith7/refresh.htm.
SWOP2001 “Specifications for Web Offset Publications”, 9th Edition, February.
Tong, Kelvin2001 “LCD Technology”, HWExtreme, July,http://www.hwextreme.com/reviews/monitor/lcd/tech/.
Werner, L.2001 “CRT Flat Panel-Which Display Technology Is Best For You?” DesktopEngineering Magazine (on-line resource), May,http://www.deskeng.com/articles/01/may/resourceguide/main.htm.
Yule, J. A. C. and Clapper, F. R.1961 “Undercolor Removal Requirements of the Black Printer”, Graphic Arts Mon.,32, No. 5, 153-166, (1960), J. A. C. Yule, “Special Methods of UndercolorRemoval”, Graphic Arts Mon., 33, No. 12, 42-46.
Yule, J. A. C.1940 “Theory of Subtractive Color Photography III; Four-Color Process and theBlack Printer”, J. Opt. Soc. Am., 30, 322-331.