Cross-Cultural Analysis
505
-
Upload
khangminh22 -
Category
Documents
-
view
0 -
download
0
Transcript of Cross-Cultural Analysis


I would rather give advice than teach a dogma.
Erasmus of Rotterdam(1466–1536)


Copyright © 2013 by SAGE Publications, Inc.
All rights reserved. No part of this book may be reproduced or utilized in any form or by any means, electronic or mechanical, including photocopying, recording, or by any information storage and retrieval system, without permission in writing from the publisher.
Printed in the United States of America.
Library of Congress Cataloging-in-Publication Data
Minkov, Michael.
Cross-cultural analysis: the science and art of comparing the world’s modern societies and their cultures / Michael Minkov.
p. cm.
Includes bibliographical references and index.
ISBN 978-1-4129-9228-2 (cloth) ISBN 978-1-4129-9229-9 (pbk.)
1. Culture. 2. Cross-cultural studies—Research. I. Title.
HM623.M556 2013
306—dc23
2012001895
This book is printed on acid-free paper.
12 13 14 15 16 10 9 8 7 6 5 4 3 2 1
FOR INFORMATION:
SAGE Publications, Inc.
2455 Teller Road
Thousand Oaks, California 91320
E-mail: [email protected]
SAGE Publications Ltd.
1 Oliver’s Yard
55 City Road
London, EC1Y 1SP
United Kingdom
SAGE Publications India Pvt. Ltd.
B 1/I 1 Mohan Cooperative Industrial Area
Mathura Road, New Delhi 110 044
India
SAGE Publications Asia-Pacifi c Pte. Ltd.
3 Church Street
#10-04 Samsung Hub
Singapore 049483
Acquisitions Editor: Patricia QuinlinEditorial Assistant: Katie GuarinoProduction Editor: Astrid VirdingCopy Editor: Taryn BigelowTypesetter: Hurix Systems Pvt. Ltd.Proofreader: Pam SuwinskyIndexer: Diggs Publication ServicesCover Designer: Bryan FishmanMarketing Manager: Liz ThorntonPermissions Editor: Karen Ehrmann
Los Angeles London New DelhiSingapore Washington DC

Foreword xii
Geert Hofstede
Introduction 1
PART I: UNDERSTANDING “CULTURE” 7
1. The Concept of Culture 9
1.1. The “Unpackaging” of Culture 101.2. Meaning of the Word Culture and Definitions of the Concept 101.3. Culture As Is Versus Culture As It Would Be 121.4. Classifications of the Concepts of Culture 13
1.4.1. Subjective Culture: Mental Software 131.4.2. Objective Culture: Institutions and Artifacts 141.4.3. Culture as a System of Behaviors 141.4.4. Culture as a Set of Meanings 141.4.5. Culture as an Independently Existing Phenomenon 151.4.6. Culture as a Subjective Human Construct 16
1.5. Conclusions About the Conceptualization of Culture 16
2. Main Characteristics of Culture 192.1. Sharedness 20
CONTENTS

2.2. Normalcy 222.3. Integration, Functionality, Rationality, and Logic 222.4. Stability and Changeability 232.5. Transmittability 242.6. Complexity 24
2.6.1. National Culture 252.6.2. National Culture Versus Organizational Culture 272.6.3. National Culture Versus Religious Denomination Culture 28
2.7. Diffuseness 292.8. Uncontrollability 312.9. Predictability 32
3. The Elements of Culture 38
3.1. Particular Elements of Culture 393.2. Universal Elements of Culture 40
3.2.1. Self-Reports 403.2.1.1. Values 403.2.1.2. Norms and Ideologies 423.2.1.3. Values for Children 443.2.1.4. Beliefs 443.2.1.5. Behavioral Intentions 453.2.1.6. Self-Reported Behaviors 453.2.1.7. Attitudes 453.2.1.8. Self-Descriptions 45
3.2.2. Reports of Impressions of Others 463.2.2.1. Peer Reports 463.2.2.2. Idealistic Reports 463.2.2.3. Stereotypes 46
3.2.3. Mental Skills and Knowledge 513.2.3.1. General Intelligence and Related Domains 513.2.3.2. Perception Characteristics 52
3.2.4. Cognitive Patterns 523.2.5. Observable Behaviors 52
3.2.5.1. Direct Observation of Behaviors 523.2.5.2. National Statistics 53
3.2.6. Statistical Products 533.2.7. What Else Can Be Studied by Cross-Cultural Analysts? 54
PART II: STUDYING CULTURE 59
4. Types of Cross-Cultural Studies: Merits and Pitfalls 614.1. Studies of Culture Versus Studies of Something Else 624.2. Qualitative Versus Quantitative Studies 624.3. Idiographic Versus Nomothetic Studies 624.4. Insiders’ Versus Outsiders’ Studies 63

4.5. Studies Comparing Variables Versus Studies Comparing Cases 644.6. Structure-Oriented Versus Level-Oriented Studies 654.7. Synchronic Versus Diachronic (or Longitudinal) Studies 654.8. Deductive Versus Inductive Studies 664.9. Paper-and-Pencil Versus Observational Studies 66
4.10. Studies Using Primary Data Versus Studies Using Secondary Data 67
4.11. Studies Across Individuals First Versus Studies Directly Across Societies 68
5. Theoretical Versus Empirical Perspectives 725.1. Theory Before Empiricism 735.2. Empiricism Before Theory 755.3. The Goal of Culturology and the Other Social Sciences: Theory or Empiricism? 785.4. Defining Constructs Empirically 79
5.4.1. A Note on Operationalism as a Method of Defining Constructs in Culturology or Other Domains 79
5.5. A Search for Truth Versus a Search for What Works 80
6. Cross-Cultural Comparability 846.1. Etic Versus Emic Approaches 856.2. Incomparable Phenomena 876.3. Criteria for the Cross-Cultural Transferability of Etic Individual-Level Constructs and the Instruments for Their Measurement 876.4. Criteria for the Applicability of Etic Approaches to Studies at the Societal Level 896.5. Are Etic Tests Preferable to Emic Ones? 90
7. Paper-and-Pencil Studies 937.1. Selecting Samples of Respondents: Nationally Representative Samples Versus Matched Samples 947.2. Types of Items in Noncognitive Paper-and-Pencil Studies 95
7.2.1. Likert Scales 967.2.2. Free-Choice Items 967.2.3. Forced-Choice Items 967.2.4. Issues Associated With Likert Scales 97
7.2.4.1. The Reference Group Effect 977.2.4.2. Potential Meanings of Some Positions on a Likert Scale in Cross-Cultural Analysis 987.2.4.3. Extracting Societal Information From Items on a Likert Scale 987.2.4.4. Response Style 99
7.2.4.4.1. Detection of Response Style 1007.2.4.4.2. Treatment of Response Style: Undesirable Bias or Normal Style? 101

7.2.4.4.3. Causes of Response Style: The Number of Points on a Likert Scale 102
7.2.4.4.4. Causes of Response Style: The Language of the Questionnaire 103
7.2.4.4.5. Causes of Response Style: The Role of Culture 103
7.2.4.4.6. Causes of Response Style: The Nature of the Items 103
7.2.4.4.7. Causes of Response Style: The Role of Intelligence and Education 104
7.2.4.4.8. Conclusions About the Causes of Response Style 104
7.2.4.4.9. Dealing With Response Style Before the Study: Choice of Items and Scales 104
7.2.4.4.10. Dealing With Response Style After the Study: Standardization of Scores 105
7.2.5. Issues Associated With Forced-Choice Items 1087.2.6. Issues Associated With Free-Choice Items 108
7.3. Other Issues That Can Affect Data for Cross-Cultural Research 109
7.3.1. Poverty 1097.3.2. Distance From the Researcher 1097.3.3. Social Desirability 1097.3.4. Taboos 1107.3.5. Intelligibility Problems 1107.3.6. Semantic Differences 1117.3.7. Political Factors 112
7.4. Test-Retest Reliability of Paper-and-Pencil Studies at the National Level and Other Statistics 1137.5. Face Validity 1137.6. Common Method Variance and Validation 114
8. Data Analysis 1238.1. Sample Issues 124
8.1.1. Selection of an Appropriate Sample of Societies 1248.1.2. Galton’s Problem 1268.1.3. Missing Data Bias 127
8.2. Dimensions of Culture 1278.2.1. The Utility of the Dimension Paradigm in Cross-Cultural Research 1288.2.2. The Nature of Cultural and Other Dimensions 1298.2.3. Why Dimensions Are Subjective Human Constructs 131
8.2.3.1. Subjective Selection of Samples for the Construction of Dimensions 131

8.2.3.2. Subjective Selection of Items for theConstruction of Dimensions 131
8.2.3.3. Subjective Selection of the Number of Dimensions 131
8.2.3.4. Subjective Selection of the Nature of the Dimensions 132
8.2.4. Individual and Ecological Dimensions: Different Levels and Units of Analysis 132
8.2.5. Polarity 1348.2.6. Different Versions of the Same
Ecological Dimension? 1358.2.7. Dimensions and Polythetic Classes 1368.2.8. Data Reduction 136
8.2.8.1. Agreement and Aggregation 1368.2.8.2. Correlations and Scales 1378.2.8.3. Scale Reliability 1398.2.8.4. Multidimensional Scaling 139
8.2.8.4.1. Plotting Variables on an MDS Map 1408.2.8.4.2. Identifying Cultural Dimensions
on an MDS Map 1408.2.8.4.3. Plotting Cases on an MDS Map and
Calculating Case Coordinates 1448.2.8.4.4. Using MDS for Identifying Typologies 1468.2.8.4.5. Issues Related to Multidimensional
Scaling as a Data Reduction Technique 149
8.2.8.5. Factor Analysis 1498.2.8.5.1. Calculation of Factor Scores 1538.2.8.5.2. Issues Related to Factor Analysis
as a Data Reduction Method 1548.2.8.5.3. Factor Analysis as a Scale
Reliability Test 1568.2.9. How Do We Know That We Have
Constructed Appropriate Dimensions? 1578.2.10. Constructing Individual and
Ecological Dimensions 1648.3. Clustering 1668.4. Looking for Cause-and-Effect Relationships 171
8.4.1. The Consilience Approach 1728.4.2. Contextual Consilience 1728.4.3. Methodological Consilience 1728.4.4. Predictive Consilience 1738.4.5. Exclusive Consilience 1738.4.6. The Issue of Time Sequence 1738.4.7. Looking for Noncultural Variables
That May Be Determinants of Culture 1738.4.8. Multiple Regression Analysis 174
8.4.8.1. Divergent Results From Different Types of MRA 175
8.4.8.2. The Excluded Variables 175

8.4.8.3. Issues Related to Samples 1758.4.8.4. Issues Related to the Independent
Variables 1768.4.8.5. An Example of an MRA 177
PART III: MAJOR CROSS-CULTURAL STUDIES 197
9. Cultural Dimensions Across Modern Nations 199
9.1. Geert Hofstede (1980, 2001): A Study of Values, Beliefs, and Norms Across the IBM Corporation 201Geert Hofstede
9.2. Chinese Culture Connection (1987): A Study of National Values Based on a Chinese Questionnaire 217
9.3. Shalom Schwartz (1994): A Study of the Values of Schoolteachers and University Students 224
9.4. Peter Smith, Fons Trompenaars, and Shaun Dugan (1995): A Study of Locus of Control 232
9.5. Peter Smith, Shaun Dugan, and Fons Trompenaars (1996): A Study of the Values and Beliefs of Organizational Employees 238
9.6. Robert Levine and Ara Norenzayan (1999): A Study of the Pace of Life 246
9.7. Robert Levine, Ara Norenzayan, and Karen Philbrick (2001): A Study of Helping Strangers 251
9.8. Ashleigh Merritt (2000): An Attempt to Replicate Hofstede’s Four Dimensions 255
9.9. Ronald Inglehart and Wayne Baker (2000): An Analysis of the World Values Survey 261
9.10. Ulrich Schimmack, Shigeiro Oishi, and Ed Diener (2002): A Study of Personal Emotional Dialecticism and Frequencies of Pleasant and Unpleasant Emotions 268
9.11. Peter Smith, Mark Peterson, and Shalom Schwartz (2002): A Study of Managers’ Sources of Guidance 272
9.12. Evert van de Vliert and Onne Janssen (2002): A Study of Performance Motives 279
9.13. Robert McCrae (2002): A Comparison of Mean National and Ethnic Personality Traits (Self-Reports) 284
9.14. Robert McCrae and Antonio Terracciano (2005): A Study of Mean National or Ethnic Personality Traits (Peer Reports) 291
9.15. David Schmitt, Juri Allik, Robert McCrae, and Veronica Benet-Martinez (2007): A Study of the Geographic Distribution of the Big Five Personality Traits (Self-Reports) 297
9.16. Michael Bond, Kwok Leung, and Associates (2004): A Study of Social Axioms 305

9.17. Project GLOBE (2004): A Study of National Stereotypes and Ideologies 310
9.18. Project GLOBE (2004): A Study of Culturally Endorsed Leadership Profiles 330
9.19. Eva Green, Jean-Claude Deschamps, and Dario Paez (2005): A Study of Beliefs and Values 337
9.20. David Schmitt (2005): A Study of Sociosexuality 3419.21. Peter Kuppens, Eva Ceulemans, Marieke
Timmerman, Ed Diener, and Chu Kim-Prieto (2006): A Study of Positive and Negative Emotions 345
9.22. Christian Welzel (2010): An Analysis of the World Values Survey 350
9.23. Michael Minkov (2009a): A Study of Social Polarization in Social Opinions and Life-Quality Judgments 358
9.24. Michael Minkov (2011): A Study of Values Related to National Economic Growth and Educational Achievement 364
9.25. Michael Minkov (2011): A Study of National Homicide Rates and Their Correlates 377
9.26. Michael Minkov and Geert Hofstede (2012a): An Analysis of the World Values Survey Replicating Two Dimensions of the Chinese Values Survey 390
9.27. Geert Hofstede, Bram Neuijen, Denise Daval Ohayv, and Geert Sanders (1990): A Study of Organizational Cultures Across 20 Danish and Dutch Organization Units 397Geert Hofstede
PART IV: A SUMMARY OF THE OBSERVED CULTURAL DIFFERENCES ACROSSTHE GLOBE 407
10. Cultural Differences Between Rich and Developing Countries 409 11. Cultural Differences Across Rich Countries 417 12. Cultural Differences Between
Eastern Europe and Latin America 420 13. Cultural Differences Between East
Asia and the Arab World 425 14. Cultural Differences Between the
Arab World and Sub-Saharan Africa 430
Appendix 434
References 442
Index 470
About the Author 481

xii ◆
In my 1980 book Culture’s Consequences: International Differences in Work-Related Values, I compared 40 of the world’s nations along four
culture dimensions, statistically derived from large-scale survey data. Reactions in the academic world were slow at first, and when they came at all they varied from enthusiasm to derision. But since the 1990s, other comparative studies of societal cultures started following the dimensions approach, which gradually became a paradigm for quantitative cross-cultural research. The availability of more and more comparative data, better search methods, user-friendly statistical packages, and an increas-ing number of journals devoted to intercultural issues has since led to an explosive increase in the number of publications comparing societal cultures in terms of dimensions.
FOREWORD
◆ Geert Hofstede

Foreword ◆ xiii
One of these was a book, What Makes Us Different and Similar, by a Bulgarian scholar, Michael Minkov, based on a new analysis of published data from the World Values Survey and related sources. The book appeared in 2007 from Klasika i Stil, a Bulgarian publisher, and was not easily available in other countries. I had been in e-mail contact with the author since the end of 1999. We met in Sofia in 2001, and I was impressed with his scholarship and his talent to find and interpret new sources of comparative cross-cultural data. In his book, he introduced three new dimen-sions of national cultures mainly based on World Values Survey results.
In 2001, a rewritten second edi-tion of my original study, Culture’s Consequences, appeared, presenting five dimensions and bearing a new subtitle: Comparing Values, Behaviors, Institu-tions, and Organizations Across Nations. This was followed in 2005 by a second edition of my student textbook, origi-nally published in 1991: Cultures and Organizations: Software of the Mind. For this new edition, Gert Jan Hofstede had joined me as a coauthor. In view of the fast developments in the globalizing world economy and in the state of the art of cross-cultural research, we were considering a speedy third edition when Minkov’s book landed on our desks. From his three dimensions, two could be integrated with chapters from our previous book. The third—indulgence versus restraint—covered issues we had recognized before but had not been able to explain; we added it as a new, sixth dimension, and Michael Minkov became the third member of our authors’ trium-virate. Our joint third edition of Cultures and Organizations: Software of the Mind appeared in 2010.
Meanwhile, although Minkov’s 2007 book was hard to obtain, it drew the attention of colleagues in Western Europe and North America; a positive review by Peter Smith appeared in the International
Journal of Cross-Cultural Management in 2008, and a British publisher, Emerald, offered to publish a new edition of the book. Minkov’s insights had progressed in the meantime, so what Emerald pub-lished in 2011 differs considerably from the 2007 version; not only did the book have a new title— Cultural Differences in a Globalizing World— but it reshuffled and extended its new dimensions into four. I had the pleasure of writing a foreword for that book.
While his new book was in press, Michael Minkov had not been idling. His broad-ranging familiarity with the cross-cultural comparison literature inspired him to a daring proposal: to collect in a single volume more than 20 important cross-cultural studies, describing them, discussing their main contributions, and outlining the issues they raise. This part of the book was to be preceded by thorough conceptual and methodological introduc-tions. Together, this project represents a state of the art of the field that he proposes to rename culturology.
SAGE Publications, publisher of the 1980 and 2001 editions of Culture’s Consequences, gladly accepted Minkov’s proposal, and the result is in front of you. At Minkov’s request, I contributed the descriptions of two of my original studies: the cross-national comparison on which Culture’s Consequences (1980) was based; and the cross-organizational com-parison in Denmark and the Netherlands, authored by myself and three colleagues and published in Administrative Science Quarterly in 1990. It was my main con-tribution to the field in the 1980s and the basis of my insights into the differences between national and organizational cul-tures, their origin, and their meaning for management.
This is a handbook for doctoral stu-dents and other researchers. For general interest readers there is, as mentioned above, Hofstede, Hofstede, and Minkov, Cultures and Organizations: Software of

xiv ◆ Cross-Cultural Analysis
the Mind (2010), a revised and expanded third edition by McGraw-Hill. For trainers and teachers in cross-cultural programs, there is a manual by Gert Jan Hofstede, Paul B. Pedersen, and myself:
Exploring Cultures: Exercises, Stories and Synthetic Cultures (2002), published by Intercultural Press.
Geert Hofstede Velp, the Netherlands

◆ 1
INTRODUCTION
As a distinct order of phenomena, culture requires a special science for its study and interpretation. This science is most properly and precisely labeled culturology.
—Leslie White, American anthropologist (White, 1959/2007, p. 28)
All science is either physics or stamp collecting.
—Attributed to Ernest Rutherford, British Nobel Prize laureate, considered the father of nuclear physics
Geert Hofstede’s 1980 book Culture’s Consequences introduced a new way of exploring the world’s modern cultures through large-
scale quantitative comparisons. To his surprise, this approach became a widely used paradigm. An impressive number of similar projects have been reported in the academic literature, especially after 1990. Many of them have contributed to our understanding of cultural differences, elucidated interesting methodological issues, created fruitful academic debates, and stimulated further research. Like Hofstede’s work, a good number of these studies provide national indices on dimensions of national culture or other similar societal measures that illustrate and explain cross-cultural variation across the globe. Unfortunately, this research is scattered across diverse publications, some of which are not easily accessible to students of cultural differences. There is a clear need to bring a good selection of them together in a single publication that

2 ◆ Cross-Cultural Analysis
will present them briefly, discuss their main contributions, and outline some of the issues that they generate.
Because many of the controversies that emerge from those large-scale cultural comparisons show no sign of abating in the academic literature, a book of this kind inevitably has to start with a discus-sion of some fundamentals. Naturally, the first question is what culture is and how it can be studied. A wide spectrum of philosophical and practical issues branch out of this question, all of which are asso-ciated with the methodology of exploring and comparing the world’s societies and their cultures. One of the goals of this book is to provide succinct coverage of these issues and propose some guidance for their treatment. The main specificity of the proposed approach is a relativ-ist position and a philosophy based on pragmatism.
The readers of this book are familiar with the broad term “cross-cultural analy-sis.” It can be applied to different types of research: comparisons of whole societies and their more or less distinct cultures, the individuals in them, or something else, such as the economies of those societies. This book focuses on hologeistic compari-sons of national cultural characteristics for the identification of recurrent patterns or structures, yet the methods that it dis-cusses can also be used in cultural compar-isons of ethnicities or regions. Hologeistic (literally “whole-Earth” in Greek) refers to large-scale analyses that involve many diverse societies, preferably from all con-tinents, at the same time. “Recurrent patterns or structures” in this specific case means relationships between vari-ables and distances between cases that can be replicated and confirmed in different studies. The main goal of cross-cultural analysis of modern societies should be to discover such patterns and identify their practical implications. Leslie White’s “cul-turology” might be a good term for this domain of research, even though it is not a popular word in English. Its equivalent—
“culturologia”—is firmly established in some Eastern European languages, includ-ing Russian.1
The term “culturology” suggests an analysis of societal cultures, leaving the study of the individuals in those societ-ies to psychologists. To use an analogy from the natural sciences, the difference between the study of societies and the study of the individuals in them is like the difference between the study of ecological systems, such as forests or lakes, and the study of the trees or fish that live in them. There are many similarities in the methods that the two types of study can employ as well as some radical differences. Scholars who are trained in either of these domains do not necessarily appreciate all the speci-ficities of the other one.
Although this book focuses on the study of societal cultures as single entities with-out breaking them down to the individual level, its philosophy is not averse to the idea of studying relationships across indi-viduals and then comparing the patterns of those relationships across societies. This approach is only briefly mentioned in this book as it belongs to the domain of cross-cultural psychology; yet its potential to enrich the methods of hologeistic culturol-ogy is recognized.
Cross-cultural analysis can be carried out for theoretical or practical purposes. The second should have some priority over the first. The growing interest in cross-cultural awareness throughout the world is fueled by the spreading and intensifying globalization process driven by the expansion of international business. Because business is a practical endeavor, it requires practical solutions. Business con-sultants and international managers are often avid consumers of comparative cul-tural analyses as long as they are presented in an easily digestible form. Politicians, government employees, translators, and educators are also becoming increasingly interested in cultural differences as their contacts with members of unfamiliar soci-eties expand and deepen.

Introduction ◆ 3
To be able to arrive at a scientifically acceptable presentation of cultural differ-ences, one must be aware of the existing theoretical issues. Detaching theory from utilitarian practice is sometimes impos-sible. However, theory should always be connected to some practical outcome. If medical science consisted predominantly of abstract theories that could not have any demonstrable practical value, it would not be deemed useful. There is no reason to see any other science as being completely different from medicine in this respect. Culturology should ultimately produce results, which—when presented in a clear form—can help people deal with the cul-tural diversity that they experience in their lives. Managers should be able to use that knowledge for better performance in an international company. Politicians, if they listened to scholars, could make wiser decisions. Educators would be more effec-tive in their jobs. Even international tour-ists could benefit from some cross-cultural awareness. To achieve the practical goals of culturology, we need relatively simple models that can help a wide spectrum of people organize their knowledge of cultural differences and use it to make sense of, and formulate predictions about, the cultures that they are dealing with. The goal of this book is to help aspiring comparative cultural researchers construct such models.
Although this book is committed to flexibility and diversity in methodologi-cal issues, it takes a critical approach and exposes the controversies of the main methods that are employed in cross-cul-tural analyses. There is no perfect method, leading to an ultimate cultural model for the explanation of cultural differences. But this does not mean that any method is applicable in any circumstances. One of the goals of this book is to enable research-ers to weigh the strengths or weaknesses of various methods so that they can decide for themselves which are best for their particular purposes.
Whereas the study of human culture was initiated by anthropologists, cross- cultural
psychology has by now become a major source of knowledge about cultural dif-ferences between modern societies. Anthropology emerged as a study of what Europeans and Americans used to consider exotic or primitive societies. Research inter-ests within that discipline have expanded since its infancy, yet many anthropologi-cal studies still describe preliterate cul-tures. This book is mostly concerned with modern societies, which explains why the reader will come across many references to publications from the domain of cross-cultural psychology and, to some extent, from cross-cultural management. Yet, there is a crucial difference between culturology and cross-cultural psychology. Peterson and Wood (2008) summarize the fundamental problem in cross-cultural psychology as the understanding of how cultural characteris-tics of societies are reflected in the psychol-ogy of the individuals (p. 21). Culturology, among other things, is precisely about the opposite: understanding how the psycho-logical characteristics of individuals are reflected in the cultures of their societ-ies. Yet, societies are not large individuals and societal comparisons have their own logic. Some of the concerns that torment psychologists who study individuals are irrelevant in a study of nations, whereas the validation methods that should be used in a cross-national analysis are largely inap-plicable when individuals are compared.
The focus of this book is on cross-cultural analysis done with the methods of positivist science, emphasizing quantifica-tion and prediction. It practically ignores everything that is outside this domain or mentions it very briefly. For example, some scholars view the study of culture as a search for particular meanings of cultural phenomena that may differ from one society to another. This is outside the scope of the present book because what is particular and does not have measurable equivalents in many societies is not easy to compare with the tools of positivist sci-ence. Such specificities may call for inter-pretivist methods that are more typical of

4 ◆ Cross-Cultural Analysis
the humanities than of what is known as science.
Nevertheless, social science cannot be a pure science. It is well-known that its measurement methods are somewhat imprecise. But that is not all. An analysis can start with a simple observation that could be viewed as a scientific truth, such as the finding that national religious-ness is consistently and highly associated with national pride (Inglehart & Baker, 2000; Minkov, 2011). But a more complex and deeper analysis of the relationships between a high number of variables often involves the use of sophisticated statistical methods. The selection of the methods and the interpretation of the results is a form of art. Different choices for the treatment of the same data can result in very differ-ent models and theories. Sometimes, by choosing a convenient statistical tool, a researcher can almost fabricate the desir-able patterns of relationships that will fit some theoretical expectations and confirm the correctness of a hypothesized model. Realizing this, Leamer (1983) wrote:
Economists have inherited from the physical science the myth that scientific inference is objective, and free of per-sonal prejudice. This is utter nonsense. All knowledge is human belief; more accurately, human opinion. (p. 36)
As there is no one right way to treat complex data, some creativity in social science is inevitable. This book argues that the search for what is true and right often needs to be replaced by a search for what is practically useful. If several com-peting models explain one reality, and it is impossible to refute any of them with hard empirical evidence, let alone logical reasoning, the question of which of them is the best one boils down to which model is the most elegant, easiest to comprehend, and strongest and richest in terms of prac-tical predictive properties. The philosophy of this book is averse to ultimate and absolute solutions, yet the reader is not
left completely at sea. This work follows the motto of the great Dutch philosopher quoted at the beginning of the book: Giving advice is acceptable, enforcing a dogma is not.
To summarize, to be scientific, mod-ern hologeistic culturology should follow some specific principles. It is essential to enunciate them at the outset, although they are explained in greater detail later in the book.
Predictive rather than interpretivist. According to a definition of science attrib-uted to Galileo Galilei, a doctrine is scien-tific if it can produce quantifiable and veri-fiable predictions, not simply impressions and interpretations. That is what distin-guishes science from stamp collecting, to use Rutherford’s metaphor. Interpretations are indispensable in a scientific discourse, but they cannot be the backbone of science as they tend to be subjective and hence much closer to art than science.
Quantitative rather than qualitative. A prediction is verifiable and valid when it is quantifiable. Saying that the weather tomorrow will be “nice” is not a verifiable prediction because concepts of “nice” may differ. Saying that the temperature will be 20º centigrade is a verifiable prediction.
Nomothetic rather than idiographic. By definition, a cross-cultural analysis must involve different societies; it cannot focus on the specificities of a single culture that can be understood only on its own terms because the comparative element would be lost in that case. The importance of rich nomotheticism (see 4.3.) must also be stressed: comparing a wide spectrum of diverse societies at the same time. Only then can one discern any cultural regulari-ties and provide explanations with predic-tive properties.
Etic rather than emic. This book argues that research instruments developed in one culture can be used to study cross-cultural variation. Despite all of its pit-falls, this method has been shown to

Introduction ◆ 5
produce findings with good predictive properties. Strictly emic approaches to the study of culture, focusing on a search for culture-specific meanings or structures (see 6.1.), are rarely helpful in hologeistic culturology although they may serve other purposes.
Empirical rather than theoretical. The empirical element of any study is its sci-entific foundation because that is what is susceptible to statistical verification. A theory without an empirical quantitative underpinning is not science; it is closer to philosophy, theology, or literary criticism. Further, this book advocates operational-ism: defining concepts not only in terms of theoretical abstractions but also through the operations that are used for their measurement.
This being said, there is no need to completely reject interpretivist, qualita-tive, idiographic, and emic approaches. Although they should not be the main tool of hologeistic culturology, they some-times provide potentially useful ideas for new hypotheses that may be confirmed or rejected through quantitative etic and nomothetic methods.
This book is organized in four parts. The first one discusses various practi-cal and theoretical questions concern-ing the concept of culture. The second part is devoted to methodological issues in modern culturology. The focus is on comparisons of national cultures. The reason for that is purely practical: The best-known large-scale cross-cultural stud-ies that have yielded information about cultural differences have used national samples. Still, many of the methodologi-cal issues discussed in this book can also emerge when comparing the cultures of groups of people, such as ethnicities or regional populations.
The third part of the book presents and discusses the findings of some impor-tant hologeistic cross-cultural analyses by various authors who have provided
indices for variables that can be viewed as dimensions of national culture. Data reduction into a small number of dimen-sions is a major cognitive tool that is indispensable for our understanding of the universe. If employed properly, it can be especially fruitful in the social sciences and psychology. In cross-cultural analy-sis, the dimension paradigm has yielded extremely interesting and practically use-ful results.
The fourth part is a synopsis of the available practical findings about the main cross-cultural differences across the globe.
The experienced reader will detect the spirit of Geert Hofstede in this book. This is quite natural since I have been his main disciple and follower of his paradigm for many years. Geert read the whole manu-script and made many pertinent remarks. He also recommended and authorized the inclusion of some specific ideas from his classic work, Culture’s Consequences. His significant contribution to this book makes him its spiritual father despite the fact that he cannot be held responsible for, and need not agree with, every view expressed.
SAGE Publications and I also gratefully acknowledge the contributions of the fol-lowing reviewers: Frankie P. Albritton, Jr., Seminole State College of Florida; Timothy P. Johnson, University of Illinois at Chicago; and Mark. F. Peterson, Florida Atlantic University.
I hope that this book will answer exist-ing questions as well as stir new debates. If this goal is achieved, it could be consid-ered a success.
■ Note
1. Note however that in the Eastern European tradition, the term “culturologia” often refers to interpretivist analyses of culture that are more similar to philosophical treatises than to positivist science.


UNDERSTANDING “CULTURE”
PART I


◆ 9
This treatise on the study of cross-cultural differences between mod-ern societies starts with an examination of the various ways in
which culture has been conceptualized. Approaches to the concept and study of culture have varied between academic disciplines, and some-times even within them. The goal of this analysis is not to provide one right perspective. Culture can be whatever a scholar decides it should be. What we need is not a single best theoretical definition of culture but clear empirical operationalizations of each approach: Researchers need to explain exactly how they propose to measure culture in accordance with their conceptualizations, diverse as they may be.
1 THE CONCEPT OF CULTURE

10 ◆ Understanding “Culture”
◆ 1.1. The “Unpackaging” of Culture
Psychologists who compare individu-als from different nationalities or ethnic groups often observe differences between them on the dependent variables that they study. In such cases, they may show that various psychological variables, as well as age, gender, educational level, and more, produce a statistical effect that seems to account for the differences. But what if some of the variance remains unexplained? In that case, it was common practice until recently to refer to an obscure residual called “culture.” Originally, the concept of culture seemed even more opaque to researchers who compared organizations in different countries. In the words of Child (1981), “In effect, national differences found in characteristics of organizations or their members have been ascribed to . . . national differences, period” (p. 304).
To a cultural anthropologist, culture is neither obscure, nor a residual. It is a social phenomenon that manifests itself quite clearly, even if the manifestations are not always easy to explain. Anthropologists consider culture an important phenom-enon that warrants its own field of study. They do not view it as a single variable; being an extremely complex system, it is to be analyzed in terms of its components and their relationships. Although cross-cultural psychologists and organizational behavior experts accepted this logic rela-tively late, by now they too have grasped the need to unpackage culture rather than approach it as a monolithic block. 1 This chapter and the next prepare the reader for the third one, which represents an unpackaging exercise. We must start with a philosophical warning at the very outset of our journey. We will not try to find out what is in the package because that would be futile. Culture is not a specific material object that has its own objec-tive existence. It is underpinned by real phenomena that, however, we perceive
and analyze subjectively. Therefore, the best that we can do in a discussion of the nature of culture is to explore the subjec-tive conceptualizations of various schol-ars. Then, we can discuss the contents of the package labeled “culture” as they have been seen by cross-cultural experts.
◆ 1.2. Meaning of the Word Culture and Definitions of the Concept
The origin of the Latin word cultura is clear. It is a derivative of the verb colo (infinitive colere), meaning “to tend,” “to cultivate,” and “to till,” among other things (Tucker, 1931). It can take objects such as ager, hence agricultura, whose literal meaning is “field tilling.” Another possible object of the verb colo is animus (“character”). In that case, the expres-sion would refer to the cultivation of the human character. Consequently, the Latin noun cultura can be associated with edu-cation and refinement.
The etymological analysis of “culture” is quite uncontroversial. But in the field of anthropology, the situation is much more complex. Definitions of culture abound and range from very complex to very simple. For example, a complex definition was proposed by Kroeber and Parsons (1958): “transmit-ted and created content and patterns of values, ideas, and other symbolic- meaningful systems as factors in the shaping of human behavior” (p. 583). An even less easily comprehensible definition was provided by White (1959/2007): “By culture we mean an extrasomatic, temporal continuum of things and events dependent upon symbol-ing” (p. 3). Often cited is also a definition by Kluckhohn (1951):
Culture consists in patterned ways of thinking, feeling and reacting, acquired and transmitted mainly by symbols, constituting the distinctive achievements of human groups, including their

The Concept of Culture ◆ 11
embodiments in artifacts; the essential core of culture consists of traditional (i.e. historically derived and selected) ideas and especially their attached val-ues. (p. 86, no. 5)
But that is not all. Geertz (1973) noted sarcastically that “in some twenty-seven pages of his chapter on the concept, Kluckhohn managed to define culture in turn as . . . [what follows is 11 differ-ent definitions]; and turning, perhaps in desperation, to similes, as a map, as a sieve, and as a matrix” (p. 5). This lack of clarity and consensus about anthro-pologists’ main object of study may be one of the reasons that, in the words of Cochran and Harpending (2009), the social sciences—and especially anthropology—“haven’t exactly covered themselves in glory” (p. ix). 2 It also explains why to many researchers and practitioners, culture is “the c-word, mysterious, frightening and to be avoided” (Berry, 1997, p. 144). Some have even denied the utility of the concept (Barber, 2008b).
At the other extreme is a well-known simple and narrow definition: Culture is shared mental software, “the collective programming of the mind that distinguishes the members of one group or category of people from another” (Hofstede, 2001). The group or category can be a national society but Hofstede believes that his defi-nition applies also to other collectives, such as regions, ethnicities, occupations, orga-nizations, or even age groups and genders.
According to Jahoda (1984), “culture” is the most elusive term in the vocabulary of the social sciences and the number of books devoted to the topic would fill many library shelves. A practical solu-tion was proposed by Segall (1984), who believed that it was not worth the effort to enhance the concept’s clarity or attempt to articulate a universally acceptable defini-tion. In his view, cultural analysts should abandon the struggle to conceptualize cul-ture. Instead, they should “turn to the real business at hand,” which is to “intensify
the search for whatever ecological, socio-logical and cultural variables might link with established variations in human behavior” (p. 154).
Segall’s call for pragmatism in cross-cultural analysis is laudable. Theoretical debates about the meaning that “should” be attributed to the concept of culture are pointless. There is no absolute reason why one abstract theoretical concept of it should be better than another. However, disagreements have been voiced not only with respect to abstract definitions of culture but also concerning specific mat-ters, such as whether artifacts should or should not be considered part of culture (see the debate between Jahoda, 1984, and Rohner, 1984). The answer to a ques-tion of this kind can have practical conse-quences: It may determine what should or should not be studied for the purpose of a dissertation on culture or be published in a journal devoted to culture.
Culture can be pragmatically defined by the contents and boundaries of the inter-ests of the scholars who study it. Even bet-ter, we should look at what is in the focus of their interests. A culturologist may study climatic differences (for instance, van de Vliert, 2009), although climate is unlikely to be viewed by anybody as part of culture. Yet, that researcher would not be interested in climate per se, but in how it affects variation in values, beliefs, and behaviors, which could be considered ele-ments or expressions of culture.
Defining the contents and boundaries of culture may also be necessary for the purposes of clarity and avoidance of con-fusing statements. According to Jahoda (1984), if culture is seen as including behaviors, it is incorrect to say that culture causes behavior because that would be a circular explanation. Likewise, Fischer and Schwartz (2011) discuss the question of whether culture determines values. This makes sense only if values are not viewed as part of culture; otherwise the debate would be like the question of whether light produces photons.

12 ◆ Understanding “Culture”
Therefore, it might be useful that those who present cultural analyses explain how they conceptualize culture, specifying its contents and boundaries. This could help avoid a situation described by Child (1981), who pointed out that there is a danger of inferring culture as a national phenomenon from virtually any contrasts that emerge from a comparison of orga-nizations in different countries: “Even if such contrasts are unambiguously national in scope, they could possibly be due to other non-cultural phenomena such as national wealth, level of industrialization, or even climate” (p. 328).
A comment by Fischer (2009) illustrates another practical reason to define culture. In his view, if researchers do not focus on the shared aspect of culture (see 2.1.), there is no need to investigate agreement among the members of a national culture who provide information to a researcher. But if one adopts a definition of culture in which sharedness is emphasized, such an investigation becomes necessary.
Leung and van de Vijver (2008) dis-cuss two approaches to culture: holistic and causal. The first approach is taken by those who view culture as consisting of inseparable phenomena that cannot cause each other. Those who prefer the second approach may say that one cultural characteristic shapes another. If this is so, cultural researchers may need to explain how they conceive of culture: holistically or causally.
There are also other reasons for defin-ing culture. Some methodologists working in the domain of cross-cultural psychology have treated culture as a variable resem-bling some kind of noise that needs to be reduced or eliminated. Poortinga and van de Vijver (1987) suggested a procedure for explaining measured differences between societies by introducing various relevant variables, each of which explains part of the observed variance, until the effect of cul-ture disappears: “The consequence of our argument is that a cross-cultural psycholo-gist is not interested in the variable culture
per se, but only in specific context vari-ables that can explain observed differences on some dependent variable” (p. 272), and “In the ideal study the set of context vari-ables will be chosen in such a way that the remaining effect for culture will be zero” (p. 272). This begs the question of what variables can explain differences between groups of people but are not part of their cultures. 3
Some of the clearly external variables with respect to culture—also known as “exogenous” or “extraneous”—are cli-mate, geographic location, and patho-gen prevalence. But what about national wealth, main type of economy, or degree of democracy? Are these cultural variables or not? According to van de Vijver and Leung (1997a), gross national product, educational systems, and even health care institutions are culture-related variables (p. 4). Is this position acceptable?
Javidan and Houser (2004) describe two possible views: that a society’s wealth should not be confused with its culture and that wealth is an integral part of its culture. The position that we adopt may determine our research methodol-ogy. If wealth is an extraneous variable, a researcher may decide to partial it out of cultural measures using statistical tools. If wealth is viewed as an integral part of cul-ture, there is no need to control for it when cultural variables and the relationships between them are measured. Thus, the solution is a matter of subjective choice.
◆ 1.3. Culture As Is Versus Culture As It Would Be
Further to the previous point, Schmitt, Allik, McCrae, and Benet-Martinez (2007) indicate that studies of Big Five personal-ity traits usually correct for age and gender differences. Hofstede (2001) reports raw dimension indices as well as indices after correcting for age. Are such operations logical?

The Concept of Culture ◆ 13
In cross-cultural analysis, data that are adjusted in this way are not more correct than raw data. They simply provide a dif-ferent image of a particular culture: how it would look if certain conditions changed. Imagine that we are comparing nation A and nation B on “thrift” as a value. We find that people in A value thrift more. However, we also find that people in A are older and that older people are thriftier in principle. If age is controlled for, the thrift-related differences between the two nations disappear. What should our con-clusion be? Should we categorize nation A as having a thriftier national culture? Or should we say that it exhibits the charac-teristics of age culture, not national cul-ture, because if its members were younger they would be more profligate?
The answer depends on how we prefer to view and compare cultures. We can look at actual snapshots of them, reflect-ing their real characteristics at a specific point in time. Alternatively, we can choose to work with hypothetical constructs: cul-tures as they would be under certain hypothetical conditions that may become real some day. For instance, if two societ-ies have different demographic structures today, these differences might disappear in the future.
The first approach is the easier solution. The second may be attractive in some situ-ations but it is less practical. Controlling for various variables by means of statisti-cal tools does not guarantee that the statis-tically obtained situation depicts what we would observe in reality if culture A did not differ from culture B on the variable we have controlled for.
◆ 1.4. Classifications of the Concepts of Culture
Concepts of culture can fall into a num-ber of different categories. These clas-sifications cannot be easily contrasted in
terms of good versus bad or true versus false. They simply reflect diverse perspec-tives, all of which may have some merits. Cultural analysts should decide which perspective best suits the purpose of their research and explain it to their audiences.
Singelis, Bond, Sharkey, and Lai (1999) described two types of culture: residing inside individuals and outside them. The first type is what Triandis (1972) called subjective culture or what Hofstede (2001) referred to as software of the human mind: beliefs, values, and internalized interac-tion patterns. The second type consists of the man-made environment and can include everything that people have cre-ated, including institutions and art.
Rohner (1984) discusses two other dis-tinctions in the conceptualization of cul-ture. First, there is a contrast between culture as a system of behaviors versus culture as a set of meanings. Second, there are scholars, called realists, who attribute an independent existence to culture, versus others, called nominalists, who view it as a subjective human construct.
Because these categories are not easy to grasp, they require special attention.
1.4.1. SUBJECTIVE CULTURE: MENTAL SOFTWARE
Subjective culture is viewed as something invisible that resides in people’s minds. In his 1980 book, Geert Hofstede intro-duced his metaphor of culture as mental programming or software of the mind. However, Hofstede (2001) noted that not all elements of collective mental program-ming should be viewed as culture. For instance, collective and individual identi-ties may not be classifiable as cultural elements. They provide an answer to the question “Where do I belong” (p. 10) or “Who/what are we?” and “Who/what am I?” According to Hofstede (2001), populations that share similar cultural values may sometimes fight each other if they have adopted different identities. It

14 ◆ Understanding “Culture”
may also be useful to distinguish religious denominations (and thus religious identi-ties) from cultures. This point will be dis-cussed in 2.6.3.
1.4.2. OBJECTIVE CULTURE: INSTITUTIONS AND ARTIFACTS
Objective culture can be conceptualized as created by individuals and residing outside them. Art objects, clothing, work instruments, and residential constructions are examples of visible cultural artifacts that have an objective existence; these are studied mainly by ethnographers. Institutions, such as marriage systems, and laws (including inheritance systems, taboos, etc.), and political or religious bodies, are instances of invisible elements of objective culture. Traditionally, these were studied mostly by anthropologists and historians; today, political scientists and sociologists are interested in the insti-tutions of modern nations.
1.4.3. CULTURE AS A SYSTEM OF BEHAVIORS
According to Brown (1991), “culture consists of the conventional patterns of thought, activity, and artifact that are passed on from generation to generation” (p. 40). Thus, if a society demonstrates a recognizable pattern of activity, such as rice cultivation, that is part of its culture. Not all anthropologists agree with this view, though. Murdock (1940) dissociated behavior from the scope of culture, stating that the former does not automatically follow the latter, “which is only one of its determinants” (p. 366). The following statement by Haviland (1990) summarizes the views of many anthropologists:
Recent definitions [of culture] tend to distinguish more clearly between actual behavior on the one hand, and the abstract values, beliefs, and perceptions
of the world that lie behind that behav-ior on the other. To put it another way, culture is not observable behavior, but rather the values and beliefs that people use to interpret experience and generate behavior, and that is reflected in their behavior. (p. 30)
Whether behaviors should or should not be considered part of culture is of course a matter of abstract conceptual-ization. On a more practical note, the question is whether cross-cultural analysts who attempt to explain cultural differ-ences should compare behaviors, in addi-tion to whatever else they study, or not. The answer to this question can only be positive.
1.4.4. CULTURE AS A SET OF MEANINGS
American anthropologist Clifford Geertz is the best-known proponent of the view that meanings are central to the concept of culture (Geertz, 1973). This reflects one of the main preoccupations of Western field anthropologists in the past: They had to make sense of the incomprehensible symbols, rituals, and other practices in the preliterate and pre-industrial societies that they studied. But the meanings-based definition has been accepted by cross-cultural psychologists as well. Pepitone and Triandis (1987) define culture as “shared meanings that are encoded into the norms that consti-tute it” (p. 485).
Taken to an extreme, this position may severely reduce the perceived content and scope of culture while also clashing with the idea of cross-cultural analysis: “Culture is treated as a symbolic universe of gestures and their micro-interpretation within spe-cific contexts, whereas the broader brush-strokes of cross-cultural comparisons are suspect” (Liu et al., 2010, p. 452). Culture, as treated in the vast literature on it, is cer-tainly not just a system of meanings. Yet,

The Concept of Culture ◆ 15
there are multiple reasons to be interested in the meanings that a particular culture attaches to a given concept or behavior. One is purely academic. Without a good understanding of meanings, a researcher may not know how to design a study. Let us assume that we are interested in com-paring national suicide rates. What exactly constitutes suicide? Jumping off the top of a skyscraper in an act of despair would probably be viewed as suicide all over the world. Yet, so-called suicide attacks are considered combat casualties by their perpetrators.
There are also practical reasons to seek cultural meanings. According to Cheung and Leung (1998), most Chinese score high on American depression scales. Yet, this does not necessarily mean that they need clinical assistance. Endorsement of items that suggest depression in a Western context does not always reveal the same condition in China. Following this logic, an American clinician who does not understand depression in a Chinese con-text would not be very useful to Chinese patients, whereas cross-cultural analysts would have trouble comparing the depres-siveness of Americans and Chinese.
Maseland and van Hoorn (2011) noted that according to various surveys, people in predominantly Muslim countries value democracy more than other people, yet their societies are less democratic. They attempted to explain this apparent para-dox in terms of the so-called principle of diminishing marginal utility: People value highly that of which they have little. But an analysis of Muslim attitudes toward democracy can be very misleading unless it starts from what people in the Muslim nations mean by democracy. According to a nationally representative study by the Pew Research Center (2010a), the percent-ages of people who completely agree that women should be allowed to work outside the home are 22 in Jordan, 22 in Egypt, and 47 in Pakistan. Also, 82% in Pakistan, 75% in Egypt, and 68% in Jordan said that when jobs are scarce, men should have
more right to employment than women (in Western countries, these percentages ranged from 14 to 20). Another nationally representative study by the Pew Research Center (2010b) revealed that 82% of Egyptians and Pakistanis and 70% of Jordanians were in favor of stoning peo-ple who commit adultery, while 86% of Jordanians, 84% of Egyptians, and 76% of Pakistanis supported the death penalty for apostates who leave the Muslim religion. Obviously, these populations have a very different concept of democracy when com-pared to Europeans and Americans.
On the other hand, the explicit mean-ing that the members of a particular cul-ture attach to a cultural phenomenon may be too simplistic or superficial to be of much use for its understanding. Jews and Muslims do not have a convincing story about the meaning of the pork taboo; they will either simply refer to their Holy Scriptures, which ban the consumption of pork, or say that the pig is a dirty animal, although chickens and cattle are not cleaner (Harris, 1992). Cases of this kind raise an interesting dilemma. How do we make sense of the observed phenomenon: Should we seek its original meaning or attempt to attach a new meaning to it in the modern context? If we adopt the first option, we might accept Harris’s (1992) explanation: Unlike grass-grazing animals, pigs were costly to raise in the Middle East and were therefore banned. But today, the meaning of the ban may be quite different: It can be viewed as a means of instilling self-control and discipline, similar to the practice of fasting, or as a group identity reinforcer.
1.4.5. CULTURE AS AN INDEPENDENTLY EXISTING PHENOMENON
When cultural anthropologists say that culture has an independent existence, what they mean is that it can be studied independently of its carriers: the human beings. White (1959/2007) provides an

16 ◆ Understanding “Culture”
analogy with language: Linguists study languages, not the people that speak them. This conceptualization of culture is appro-priate for the purpose of what many anthropologists were interested in. They studied various social institutions, inheri-tance systems, kinship terminologies, color terms, taboos, and religions. The individ-ual did not matter in those studies. They were keyed at the supra-individual level.
Today, the collection of individual val-ues, beliefs, attitudes, and even aspects of personality, followed by aggregation to the societal level, is a legitimate approach in culturology, if not the main one. But the issue of the independence of culture is still relevant, albeit in a completely dif-ferent sense. For many scholars, cultural or psychological constructs such as indi-vidualism, uncertainty avoidance, or neu-roticism have an independent existence of their own and can therefore be objectively delineated and described in one single best way. Starting from this perspective, the goal of the researcher is to discover these objectively existing phenomena, just like a seafarer who stumbles upon a new island. For example, Welzel (2010) refers to a debate on the “true character of indi-vidualism” (p. 153). This implies that indi-vidualism is an entity independent of the minds of the researchers who study it and the goal of the researchers is to find its true nature. One study of individualism is sup-posed to reveal truer results than another. 4
1.4.6. CULTURE AS A SUBJECTIVE HUMAN CONSTRUCT
Two of the authors of the main prod-uct of Project GLOBE (a comparison of the societal and organizational cultures of 61 societies presented in 9.17. and 9.18.) make the following point (House & Hanges, 2004):
There are researchers and methodolo-gists that hold a measurement philoso-phy in which constructs are believed
to be completely bounded by the methods by which they are measured. This measurement philosophy, called operationalism, was extremely influ-ential during the 1940s and the 1950s. Operationalism was first proposed by Bridgman . . . , a Nobel prize-winning physicist, but made famous in the social sciences by B. F. Skinner and others. According to Bridgman, a construct is “nothing more than a set of opera-tions.” In other words, concepts such as intelligence, motivation, and even culture are synonymous with the way that they are measured. For example, Boring’s . . . definition of intelligence (i.e. “intelligence is what tests test”) is a classic illustration of the belief that constructs are bounded by the way they are measured. (p. 100)
The operationalist approach is explained in greater detail in 5.4.1.
◆ 1.5. Conclusions About the Conceptualization of Culture
It is possible to integrate and reconcile some, though not all, of the above-men-tioned positions on the nature of culture and its definitions. The scientific study of culture should have a practical orientation but this cannot be achieved without defin-ing culture; therefore discussions on the concept of culture are not quite useless. The goal of such discussions should not be to arrive at one right and commonly accepted definition that will once and for all lay the issue to rest. Rather, we should stay open to diverse conceptualiza-tions of culture, provided they are clearly explained by their proponents and make sense to others.
Consequently, the question of whether culture is a system of behaviors, meanings, mental characteristics, or artifacts, or of all

The Concept of Culture ◆ 17
of these, cannot and need not be answered categorically. It can be conceptualized one way or another. All approaches can lead to useful results in cross-cultural analysis.
“Culture” is a construct. In the words of Levitin (1973), a construct is “not directly accessible to observation but inferable from verbal statements and other behaviors and useful in predicting still other observable and measurable verbal and non-verbal behavior” (p. 492). A construct can also be thought of as a complex mental idea that reflects objectively existing phenomena. There are many subjective ways of think-ing of and describing an objective reality. Constructs are not the reality itself but imaginary models that we build in order to organize it in a way that makes sense to us and, we hope, to other people.
How culture is conceptualized and studied may depend on the constraining effect of a researcher’s cultural back-ground. This form of ethnocentrism has been recognized by authors of general treatises on scientific inquiry (Kuhn, 1962; Merton, 1949/1968), and cultural experts (Boyacigiller & Adler, 1991; Hofstede, 1980, 2001; Hofstede, Hofstede, & Minkov, 2010). 5 Extreme forms of that phenomenon are undesirable, but we have to learn to live with moderate manifesta-tions of it and accept the idea that there is no culture-free social science just as there is no absolutely unbiased journalism. Even the choice of a particular topic and the dis-regard for another theme by a scholar or a journalist may suggest individual prefer-ences that are associated with values. The fact that these investigators will present their own selection of stories, told in their own manner, should be viewed as normal as long as other voices are also allowed to be heard. Which of these is the true or real one is a meaningless question. It is like asking whether a description of grief by a Russian is more real than a description of sorrow by an Arab. Thus, culture can be construed in different ways, depending on a researcher’s cultural background, professional affiliation, or idiosyncratic
preferences, as well as a currently pre-dominant fashion or other social factors.
One popular approach to the concep-tualization of culture is the onion meta-phor (Hofstede, 2001). This is a simplified didactic tool for beginners in the field. Like an onion, culture can be seen as having dif-ferent layers: visible and invisible. At the surface are various practices that can be observed and compared. At the core of the onion is the mental software that people are not fully aware of. It normally takes a significant scientific effort to extract the contents of that core and understand how they relate to those of the outer layers.
At a more advanced level, culture could be viewed as an amalgamation of poten-tially related and relatively durable societal characteristics that describe an identifiable human population, such as a nation or ethnic group. More restrictive definitions are possible, yet impractical. For instance, conceiving of culture as something shared by the members of a particular population that distinguishes them from another popu-lation creates serious practical problems for researchers (see 2.1. and 2.6.1.). On the other hand, analyses of national indicators are required by the reality of the world that we live in, never mind that nations are not homogeneous and discrete entities in terms of values, beliefs, attitudes, or behaviors (see 2.6.1.). Ultimately, the concept of culture may be replaced by the concept of “societal indicators,” whereas the search for a precise definition of what exactly culture is or is not can be replaced by a search for useful indi-cators for analysis in order to understand and explain practically important issues.
■ Notes
1. In the early 1980s, Adler (1983) advised against the treatment of culture as a residual but stated that it could be viewed “as an inde-pendent or as a dependent variable” (p. 37). At the turn of the 20th century, van de Vijver and Leung (1997a) had to inform their readers that

18 ◆ Understanding “Culture”
“culture is too global a concept to be meaning-ful as an explanatory variable, however, and should be replaced by its constituents” (p. 3). Singelis et al. (1999) noted that cross-cultural studies in psychology had often been criticized precisely because culture was treated as a single package, although it can be unraveled into numerous variables, any of which might account for the observed differences between the populations that a researcher has studied; consequently, it is necessary to unpackage cul-ture. Almost a decade later, Leung (2008) still deemed it necessary to give the same advice: “In other words, researchers need to unpack-age culture into a set of elements.” (p. 60).
Treating culture as a single categorical variable (for instance, “American” versus “Japanese”) and using it as an explanation for any phenomenon is as pointless and confusing as doing the same with other categorical vari-ables, for instance, “man” versus “woman.” In fact, these are identification labels, not factors that can cause anything. If one finds any differ-ence between a male population and a female population on a variable of interest, such as aggressiveness, ascribing the difference to being “male” versus “female” does not elucidate anything about the nature of that difference. Differences in aggression are not produced by different labels but by differences in genes, hormones, patterns of upbringing, and so on. Only studies of such characteristics, expressed as numerical variables, can shed light on dif-ferences in aggression or other phenomena between individuals or groups.
2. The low status of the social sciences was noted also by Magala (2005).
3. In his treatise on cross-cultural analy-sis, Parker (1997) advocated controlling for factors that are “(1) exogenous to the depen-dent variable yet (2) independent to the theory under study” (p. 13). It is needless to say that selecting such factors would involve a lot of subjectivity since any theory that is still in the process of being studied empirically is inevi-tably subjective. Being aware of this problem, Parker (1997) noted that each discipline within the social sciences often treats the others’ vari-ables as exogenous to their variables of interest.
4. Consider also the following statement about personality factors by Paunonen et al.
(1996): “But those findings do not mean that other factors, equally real and equally impor-tant, do not exist, be it in North American, European, or other cultures. The problem is that people have yet to provide a convincing search for those other factors. For a variety of reasons having to do not only with vari-able selection but also with the methodology of factor analysis . . . , it is our belief that the number five is probably a lower bound to the true number of factors at this level of the personality hierarchy” (p. 351, italics added). The words real, exist, search, and true number suggest that these authors see personality fac-tors as having an existence of their own and an unknown fixed number. These real factors are lurking in the dark and waiting for researchers to find them with appropriate search engines.
5. The following example can serve as an illustration. Schwartz and Sagiv (1995) demon-strated that Schwartz’s value structure theory was essentially supported at the individual level throughout the countries from which Schwartz’s samples were drawn. However, Schwartz and Sagiv also published national estimates of deviations from the hypothesized structure. One such estimate—“deviations of value locations” (Table 2, p. 99) correlates with Hofstede’s individualism index as follows:
teachers’ samples –.68** ( n = 24) students’ samples –.60** ( n = 26)
(Note: Here and throughout the book, ** stands for correlation significant at the .01 level; * stands for correlation significant at the .05 level.)
GLOBE’s in-group collectivism index (see 9.17.) yields positive correlations of a similar magnitude with the deviation measures. This demonstrates that although Schwartz’s theory finds some universal empirical support, it is closest to the value structures in the minds of the respondents in the individualist nations. As Schwartz’s project evolved from the work of Milton Rokeach (Schwartz, 2011), it is not surprising that a Western perspective can be discerned in it.
Of note, Hofstede, Hofstede, and Minkov (2010) acknowledged that their perspective was partly shaped by their Dutch and Bulgarian backgrounds.

◆ 19
Culture is often viewed by cultural experts as possessing a number of important characteristics. These need to be addressed, at least
briefly. All of them are relevant in a debate on what culture is and whether a particular phenomenon is to be viewed as cultural or not. Besides, they all make excellent research topics.
2 MAIN CHARACTERISTICS OF CULTURE

20 ◆ Understanding “Culture”
◆ 2.1. Sharedness
According to Dorfman and House (2004), when the term “culture” is discussed, the focus is on the “sharedness” of the cul-tural indicators among members of the collective. Some scholars view sharedness as an important criterion in the defini-tion of culture; 1 what is not shared may be excluded from the concept. If most members of a particular community go to church every Sunday, that is part of their culture; but the occurrence of some serial killings in that same community would be viewed as an unshared pathology that is not part of the local culture. Vice versa, in the view of some authors, a culture exists or emerges whenever a set of assumptions is commonly held by a group of people (thus Boyacigiller, Kleinberg, Phillips, & Sackman, 2007).
Others are more cautious about the sharedness of culture. According to Fischer (2009), “culture is typically defined as a ‘collective’ phenomenon that is approximately ‘shared’ among members of a culture” (p. 29), whereas Inglehart (1997) stated that culture is a system of attitudes, values, and knowledge that are widely shared within a society (p. 15). “Approximately” and “widely” are important qualifications, suggesting that some cultural traits may not be shared by all members of a society. We will return to this point later.
Fischer (2009) stated that “any measure of cultural processes should show that (a) individuals within a cultural group approximately share whatever element of culture researchers choose to focus on (this may be values, beliefs, knowledge, ideas, etc.)” (p. 29). There are reasons to disagree with this view. Statistical tests that measure sharedness are not necessary at all in cross-cultural studies in which the level of analysis is societies. Barring the highly controversial case of stereotypes (see 3.2.2.3.), there is no need for agree-ment on any particular statement made
by respondents in different societies for those statements to be potentially usable in a study of cross-cultural differences. It is hypothetically possible that 50% of the respondents in a particular nation strongly approve of a particular behavioral norm, whereas the other 50% strongly denounce it. This absolute lack of agreement does not mean that we cannot compare this society with another, where the balance between strong approval and strong dis-approval of the same norm is 90 to 10, or a society where 0% approve of the norm strongly, 0% disapprove of it unequivo-cally, and everybody expresses moderate approval or disapproval. It is these differ-ences between societies that are relevant in cross-cultural analysis.
Fischer and Schwartz (2011) used cross-cultural data from three sources and dem-onstrated low within-society agreement around values. There is nothing surprising in this result; it is much harder to imagine that most members of most modern soci-eties would attach more or less the same importance to any given value. In fact, it is intuitively clear that descriptions of societ-ies in terms of values or other characteris-tics do not do justice to all their members because there is great individual variety in any society, as well as significant inter-generational differences (Inglehart, 1997) and important social contrasts in terms of values and beliefs. It is precisely this intra-societal variation that provides interesting information for cross-cultural analyses.
It is also possible to do cross-cultural analyses on the basis of marginal phenom-ena, such as murder rates or suicide rates. These do not reflect shared behaviors because the percentages of the population who are involved in them are very small. Yet, studying such marginal phenomena is a fully legitimate and very popular domain of cross-cultural research because they reveal important societal differences and shed light on other, more commonly observed elements of culture. Bovenkerk and Brunt (1976) argued that the spe-cial vocation of the anthropologist is to

Main Characteristics of Culture ◆ 21
highlight society’s marginal phenomena. Ever since Durkheim’s (1897/1930) work on suicide, the phenomenon has been studied in a cross-cultural perspective and conclusions have been drawn about societ-ies as a whole, even though the percent-age of people who take their own lives is small. 2
This does not mean that no part of culture is ever shared by all or most mem-bers of a given society. The emphasis on sharedness fits well in the tradition of viewing culture as a system of meanings. Indeed, these are often shared by all, or nearly all, members of a cultural com-munity. There is hardly an able-minded Bulgarian who does not know that a little black ribbon worn on a person’s chest means that a relative or friend has died recently. Any adult American in a normal state of mind is aware that the word Negro carries a strongly offensive connotation in the United States today and must be avoided, although it was commonly used, even in academic publi-cations, 50 years ago and is still a neutral term in other parts of the world, such as Eastern Europe. But culture does not need to be viewed only as consisting of shared meanings. The practice of wearing black ribbons as a sign of mourning can also be considered a cultural element, yet it is certainly not shared by all Bulgarians who have lost relatives. Different cultural char-acteristics are shared to various degrees within societies, and there can be no objective criterion concerning the degree of sharedness of a particular phenomenon that justifies its categorization as cultural and makes it a good study topic in cross-cultural analysis or disqualifies it.
If culture is not something monolithic that the individuals of a society share fully, what are the implications of cultural mea-sures for individuals? Whether differences between countries can be used to make predictions about the individuals in them or not depends on the measurement tech-nique. If a single cultural variable is mea-sured in percentages of people who have
adopted a specific position on it, we have a valid predictor of individual characteris-tics, provided we are aware of its proba-bilistic nature. Suppose that a nationally representative study has revealed that 50% of Swedes say that leisure is very impor-tant to them as a value. This means that a randomly chosen Swede has a 50% chance of making that statement. In many cases, the odds are far greater or lower, allowing more reliable predictions. For instance, according to the latest study by the nation-ally representative World Values Survey 3 (2006), 97.30% of Egyptians stated that religion was very important to them, ver-sus 2.70% of Chinese. As a result, it is possible to conclude that a randomly cho-sen Egyptian is extremely likely to be very religious, whereas a randomly selected Chinese is very unlikely to attach a great importance to religion.
When culture is measured in terms of average country scores or means, such pre-dictions about individuals become more difficult. Knowing that, on a scale from 0 to 5, Germany scores 2.25 on importance of leisure does not allow us to make an easily interpretable probabilistic predic-tion about a randomly selected German because we do not know the degree of sharedness of this cultural trait. 4
When complex constructs are measured using societies as a unit of analysis (see 8.2.4.), such as the individualism versus collectivism dimension in the sense that Hofstede (2001) ascribed to it, predic-tions about specific individuals are impos-sible for an additional reason that is not necessarily related to sharedness or a lack thereof. The relationships between the variables that define the construct of individualism versus collectivism at the country level may not exist in the same form across individuals (see 8.2.4.). Thus, comparing specific individuals on com-plex constructs that are operationalized for studying societies and their cultures is a meaningless exercise. We may know a lot about how American society scores on various national value-based complex

22 ◆ Understanding “Culture”
dimensions of national culture, but that does not allow us to predict any value scores for John Smith, a specific American whom we have met but have never studied. 5
◆ 2.2. Normalcy
The concept of normalcy is related to the previously discussed concept of shared-ness. Cultural traits are viewed as normal traits, whereas strong deviations from what is commonly regarded as normal would be considered idiosyncrasies or pathologies that are not part of the culture of the society where they are observed. What counts as deviant in one culture, however, may be accepted as normal in another. Eastern European publics would diagnose a transvestite as having a severely disturbed personality, but according to Haviland (1990) Mohave Indians consid-ered transvestism normal in some circum-stances. Further, views concerning what is normal or deviant can change within a dynamic society over a generation or two. In Western cultures today, there is a ten-dency to replace the concept of “deviant,” “abnormal,” or “pathological” with the concept of “simply different.”
Whether a social phenomenon is con-sidered pathological or part of a par-ticular culture or subculture may also depend on the theoretical perspective of the analyst. Murder can be viewed as social pathology, but some evolutionary psychologists consider it part of a fitness contest that is an element of the cultures of many societies (Barber, 2006; Buss & Duntley, 2003; Duntley & Buss, 2004). De Munck and Korotayev (2007) discuss evidence that polygyny and socialization for violence tend to co-occur. If we accept that polygyny is a normal element of the culture of some societies, there is no need to classify violence as abnormal even if we consider it undesirable. Minkov (2011) argues that corruption is pack and parcel of the tradition of any poor society with a
government despite attempts by Western analysts, and some intellectuals from the rest of the world who have been influ-enced by culture-bound Western ideas, to present it as deviant, pathological, or disruptive behavior.
◆ 2.3. Integration, Functionality, Rationality, and Logic
Haviland (1990) notes that the anthropol-ogist who examines one aspect of culture invariably finds it necessary to examine others as well. This interrelatedness of various phenomena within a given cul-ture is known among anthropologists as “integration.” As an example, Haviland (1990) discusses some elements of the society of Kapauku Papuans of West New Guinea, studied in 1955. They bred a lot of pigs and needed substantial amounts of food to feed them. The food consisted of sweet potatoes grown in gardens. This was women’s business and, logically, more women were needed to raise more pigs. Consequently, Kapauku men attempted to acquire more women through polygyny. But the practice of polygyny is easier if sex ratios are skewed: There should be more unmated women than men. One way to reduce the number of men was to resort to lethal violence. Thus, in the case of the Kapauku, pig raising seems associ-ated with endemic violence through a long chain of relationships.
This is only one possible way of inter-preting the observed situation in Kapauku society. But other interpretations would most likely also point out various relation-ships between the observed phenomena. Although in an abstract mental exercise it is possible to isolate various behaviors, values, and beliefs and study them sepa-rately, it is unlikely that any serious social scientist will claim that any of them can really exist in isolation.

Main Characteristics of Culture ◆ 23
The integration of cultural elements and the systems that those elements form can, and probably should, be viewed as functional, rational, and logical. There are no cultures whose elements are combined in a meaningless or haphazard way, pro-ducing a system that does not serve any purpose related to the survival of the com-munity in specific circumstances. Given a particular environment, the presence of some types of society can be attributed to their functional advantages (Inglehart, 1997). Their traits may be dysfunctional and seem irrational and illogical in a different environment. For instance, a high adolescent fertility rate is likely to be condemned in Europe and Japan but is a very rational survival strategy in an African environment where the average lifespan is 40 years and child mortality is high. Unless women start bearing children at a very young age and give many births, they may not leave any progeny who will survive until adulthood. As a result, the whole community would disappear.
This does not imply that all cultural characteristics of a given society are always functional in the sense of facilitat-ing its survival. It is quite possible that a sudden change in the physical, political, or economic environment will catch a society unprepared; some of its cultural traits may be liabilties in the new circumstances rather than assets.
◆ 2.4. Stability and
Changeability
Culture is normally viewed as possessing some stability. It is common knowledge that cultural characteristics, such as values, beliefs, and behavioral patterns, usually do not change drastically overnight. Dorfman and House (2004) point out that studies of such characteristics in many geographic regions show consistent results even when they are 20 years apart. Attitudes toward national governments can shift within a
day or a week. Unless political opinions persist over long periods—for example, several decades—they would not be con-sidered part of a nation’s culture. Yet their instability may be viewed as such, as long as one can show that some societies con-sistently tend to have less stable political opinions than others.
If we accept that the elements of cul-ture are stable and cannot change within a very short period, some definitions of culture become unacceptable. In Tylor’s (1871) view, culture includes a society’s laws. This concept may be tenable if what we have in mind is a preliterate society relying on traditional law that is rarely challenged by anybody. But in a modern nation, an official law can be repealed in a day: Parliament or a dictator may sud-denly decide to abolish or reinstate the death penalty. The European Union often attempts to impose various laws and regu-lations on some of its member countries even if the majority of their citizens disap-prove of them and do not accept them as fitting their culture.
The issue of cultural stability and changeability has various aspects. If we measure one cultural trait across a number of countries twice—say, over a period of 10 years—will the two measures be closely correlated? And what if we compare dif-ferent traits? For instance, measures of national religiousness are highly correlated with measures of obedience (Inglehart & Baker, 2000). Is this correlation stable over time? Further, how stable are coun-try scores on particular measures? If some 60% of Americans stated that religion was very important to them a decade ago, has that percentage risen or fallen since then?
The first of these questions can be explored in the World Values Survey. It appears that correlations between measures of a given single variable from different periods are more stable than correlations between measures of other variables—a situ-ation that raises various further questions. 6
There is a significant amount of litera-ture that treats some of the other questions
24 ◆ Understanding “Culture”
associated with cultural stability, albeit in an abstract way and without much empirical evidence; these are mostly trea-tises on the question of whether global cultural convergence will be achieved soon or at any time in the future. 7 There are some notable exceptions, though. One of the most interesting empirical stud-ies of cultural stability was provided by Ronald Inglehart and his associates. It shows a considerable diversity of trends. Depending on what cultural indicators are examined, over what period, and across what sample of countries, one may find evidence of cultural stability or change, and of predictability or randomness. 8
The available evidence suggests that the question of how stable or changeable culture is cannot have a definitive answer that is valid for all cases. It depends on the society, on the type and strength of factors that are exerting pressure on its culture, and on the kind of change that is measured. There are still tribes in the Amazon whose culture has hardly changed much in any respect in the past 10,000 years, at least in comparison to American, Swedish, or Japanese culture. There are societies that have evolved slowly on some measures but not at all on others. Modern as they seem in some respects, the Arab societies are almost as religious today as they were in antiquity. Elsewhere, there is evidence of astounding change in some respects and stability in others. In the two decades after the collapse of the totalitarian regime, marriage as an official institution has begun to crumble in Bulgaria; it is now considered acceptable even for prime ministers to cohabit with significant others without being married. Yet, corruption levels, happiness levels, and various other measures in Bulgaria have fluctuated insignificantly, without showing evidence of appreciable change.
◆ 2.5. Transmittability
Culture has often been described as something that can be transmitted across
individuals, either synchronically (between the individuals of one generation) or dia-chronically (from one generation to the next). For instance, Brown (1991) defines culture as consisting of patterns that are passed on from generation to generation (p. 40). Inglehart (1997) adopted a similar definition.
The prevalent view among anthropolo-gists and other social scientists is that the mechanism of the transmission of ethnic or national culture is social, not genetic (Brown, 1991; Fischer, 2009; Inglehart, 1997). According to Murdock (1940), the fact that culture is learned and not transmitted biologically is central to its nature. This means that any culture is acquirable by any normal person who has been exposed to it since childhood; consequently, it is nurture that trans-mits culture, not nature. The argument in support of this is that dramatic cultural change can occur over a few generations and that this is too short a period for any genetic change in the population. This does not prove, however, that culture can-not have anything to do with biology just as the substantial increases in IQ test per-formance during the 20th century across individuals within Western countries, and possibly within other countries as well (the so-called Flynn effect), does not prove that there is nothing genetic about individual or group intelligence. This issue is dis-cussed again in 2.7.
◆ 2.6. Complexity
The culture of a large group of people is a complex structure consisting of subcultures that exhibit some diversity. A nation’s cul-ture can be dissected along various lines: regional, social, professional, ethnic, or other. This complexity has prompted some authors to doubt the usefulness of studies in which nations are the unit of analy-sis. But choosing a higher or lower level of analysis is not more logical and does not make things easier. Murdock (1940)

Main Characteristics of Culture ◆ 25
criticized anthropologists who believed that there was only one culture: that of all humanity. It is intuitively clear to people as they move from one country to another that they encounter very different cultures; merging them all in one is not helpful.
On the other hand, choosing to work below the level of nations—for exam-ple, with country regions—is possible but not more logical because that does not make the problem of complexity disap-pear. Even the culture of a small band of hunter-gatherers may not be absolutely uniform; it may be possible to discern some gender- or age-specific differences in it. There is no one best unit of analysis in cross-cultural research, yet the most influential modern studies were carried out at the national level. The next section discusses the appropriateness of studying national culture. Then, we will turn to the issue of organizational culture and some of the differences between the two.
2.6.1. NATIONAL CULTURE
Using nations as units of analysis in cross-cultural studies is a controversial approach. Some political scientists and economists strongly defend this method: “Despite globalization, the nation remains a key unit of shared experience and its educational and cultural institutions shape the values of almost everyone in that society” (Inglehart & Baker, 2000, p. 37). According to Parker (1997), national cul-ture is viewed as a “critical factor affect-ing economic development, demographic behavior and general business policies” (p. 1). The use of nations as the unit of cross-cultural analysis has also been defended by cross-cultural psychologists (Smith, 2004b). Yet, some scholars express more cautious views: National borders may not be an adequate way to demarcate cul-tural boundaries, because many countries have large subcultures (House & Javidan, 2004). Lenartowicz and Roth (2001) and Boyacigiller et al. (2007) echoed similar concerns. The latter authors referred to
various cases in which nations had dis-integrated. In retrospect, speaking of a Yugoslav or Soviet culture may not have been justified even when Yugoslavia and the Soviet Union existed. 9
This brings up the question of whether national culture is a meaningful construct. The issue is extremely important because many cultural indices are provided for nations as if they were single entities, not only politically, but also culturally. But if national culture does not exist, as some authors have claimed (McSweeney, 2002), then there is little point in studying it.
After a literature review, Peterson and Smith (2008) identified three main kinds of critiques of the use of nations as units of cross-cultural comparisons:
1. Studies of individuals show signifi-cant within-nation variance.
2. Nations have regional, ethnic, or other subcultures.
3. Structural theories in general have been challenged.
The first of these critiques is simply irrelevant. It absolutely does not matter whether individual differences are large and whether they are larger or smaller than national differences. Nations are complex systems of people. If we were interested only in individuals and not in systems of people, whole branches of human knowledge—such as economics, management of orga-nizations, sociology, demography, history, and political science—would be wiped out. Comparisons of economic growth, murder rates, suicide rates, HIV rates, levels of industrialization, levels of democratiza-tion, corruption, socioeconomic inequality, gender equality, and many other variables that do not have exact equivalents at the individual level but are descriptors of societies should be discontinued because they do not make sense to the critics of group-level studies. Also, saying that groups, such as nations, should not be studied because the elements that they consist of are much more heterogeneous

26 ◆ Understanding “Culture”
than the nations that these elements make up is like saying that individuals need not be studied because the cells that they are made of are much more diverse than the human beings on our planet.
The existence of national subcultures is a more serious argument against using nations as a unit of cross-cultural analysis. Certainly, there are very peculiar small subcultures within some nations, such as the uncontacted tribes in Brazil or Venezuela and the nomadic Gypsies in the Balkans. Their cultures do not have much in common with those of the national mainstream. But are there nations without a mainstream at all? This is a complex issue and the answer depends on what is studied and how. 10
Perhaps the most convincing case for viewing nations as cultural units is pro-vided by Minkov and Hofstede (2012b). That study used the latest World Values Survey data and found that—with an appropriate choice of variables and methods—the available 299 in-country regions from 28 countries in East and Southeast Asia, sub-Saharan Africa, Latin America, and the Anglo world over-whelmingly cluster along national lines, with cross-border intermixtures being relatively rare. This is true even of the regions of countries like Malaysia and Indonesia, or Mexico and Guatemala, despite their shared official languages, religions, ethnic groups, historical expe-riences, and various traditions. Even the regions of neighboring African nations, such as Ghana, Burkina Faso, and Mali, can be sorted out along national lines in terms of their basic values. (Details of this study are available in 8.3.) Thus, the concept of national culture obviously makes sense, even in Africa. If there is no such thing as national culture, what holds together a country’s regions and accounts for the formation of fairly homogeneous clusters of such regions, clearly distinguished from the clusters that the in-country regions of the neigh-boring nations form?
The third argument against the use of nations as a unit of analysis that Peterson and Smith (2008) refer to is purely theoret-ical. Without empirical evidence, one can defend any abstract theoretical position.
Most important, there are powerful practical reasons for accepting the notion of national culture. Even if nations are not homogeneous entities, they are treated as such by politicians, nongovernment political organizations, economists, finan-cial analysts, demographers, and various other experts. Nations are also fixtures in the minds of ordinary citizens. As the European Union experiment shows, we are not anywhere near a single one-nation state, something like a United States of Europe. Not only do the politicians not want that, but also most European citizens are firmly opposed to the idea. They want to maintain the strong identities of their old nations rather than adopt a diffuse perception of pan-Europeanness.
As a result of these mind-sets, nations are here to stay. Consequently, in the foreseeable future there will continue to be national statistics, such as GDP per person, economic growth rates, average educational achievement, transparency versus corruption indices, homicide and suicide rates, HIV rates, adolescent fertil-ity rates, and road death tolls, to name just a few. These statistics vary enor-mously by nation and have been shown to correlate convincingly with measures of values, beliefs, and norms at the national level. The correlations validate both types of measures as meaningful and practically useful. The associations between national statistics and aggregate national measures of values, beliefs, and norms can be pro-vided only if the unit of cultural analysis is the nation.
This means that the concept of national culture is created and required by the real-ity that we live in. The same can be said of the concept of regional culture that may, for instance, refer to the cultures of the U.S. or Mexican states. Those who view culture as something shared within

Main Characteristics of Culture ◆ 27
a given population that distinguishes that population from another may object to this position. Some journal reviewers are strongly opposed not only to the concept of “national culture” but also to “regional culture,” because it has not been dem-onstrated that, for instance, Texas has a shared culture that distinguishes its popu-lation from that of Louisiana. But these concerns are irrelevant for many of the practical aspects of cross-cultural analy-sis. If we can show that murder rates and adolescent fertility rates correlate strongly both across nations and across U.S. states, it would not matter whether these nations and states have shared homogeneous cul-tures that distinguish them from other nations and states. What would matter is that we will have found an interesting statistical association across two types of units of analysis. That may suggest a cause-and-effect relationship between two important variables.
Thus, from a purely operationalist per-spective, “national culture” refers to a collection of measures of the elements of culture (described in the next chapter), gathered within a single nation. “Regional culture,” “ethnic culture,” or the culture of any other human group can be defined in the same way. From a practical perspective, what matters is not whether these groups have shared cultures that distinguish them from other groups but whether the statisti-cal indicators we have about them allow us to make some important predictions.
Insisting that a unit of cultural analysis can only be a human population that has a shared culture distinguishing it from other cultures is impractical, because deciding what should be shared and to what extent, and how distant the culture of one popu-lation should be from that of another, depends on highly subjective choices. It is practical to use units of analysis that have some clear political and geographic iden-tity, such as nations or national regions.
The issue of supra-national culture has also been addressed. For instance, Esmer (2002) attempted to answer the
question of whether there is an Islamic culture (called “civilization”). Inglehart and Baker (2000) and Project GLOBE (House, Hanges, Javidan, Dorfman, & Gupta, 2004) proposed clusters of coun-tries based on cultural similarities. The appeal of this approach is in the sim-plification that it provides. One incon-venience is that the delineation of the clusters involves a significant degree of subjectivism, no matter what sophisti-cated statistical methods one employs. Nations are a political reality, whereas the supra-national clusters in the litera-ture on culture are not. But the ultimate question is the practical utility of this approach: What do we learn from com-parisons of supra-national units? This is a poorly researched field that may yield some interesting findings in the future.
2.6.2. NATIONAL CULTURE VERSUS ORGANIZATIONAL CULTURE
How the different layers or components of culture relate to one another can be a fruitful topic of research. Of partic-ular interest to international managers and consultants is the interface between national and organizational culture. 11 The similarities, differences, and relationships between national or societal culture and organizational culture have been treated in various publications, the best known of which may be Project GLOBE’s main book (House et al., 2004). GLOBE concluded that societal culture significantly affects organizational culture (and consequently overlaps with it to a considerable degree), yet Gerhart (2008) challenged this conclu-sion. According to his analysis, national culture is not completely irrelevant to organizational culture but its effect is usu-ally overestimated. There is also a third view: The relationship between societal and organizational culture is not yet fully understood (Kwantes & Dickson, 2011).
This issue is important because manage-ment experts and consultants are some of

28 ◆ Understanding “Culture”
the most avid consumers of cross-cultural research. Their interest in cultural differ-ences is driven by the deepening global-ization process, which is closely associ-ated with the development of international business. Therefore, the interface between national and organizational culture is of significant practical importance.
First, we must remember that these two types of culture have their own specifici-ties. Many of the variables that are used to study national culture—such as approval or disapproval of divorce, agreement that a child needs a family with two parents to grow up happily, road death tolls or murder rates—would be meaningless in a study of organizational culture. Vice versa, asking employees if they must wear uni-forms may reveal something about their companies but not necessarily anything about their nations. This practice may be enforced in the military and the police force but not in an advertising agency in the same country.
But what about values? Are these not part of both national and organizational culture? Corporations like to speak of their corporate or organizational val-ues. Some academics have also endorsed this concept. Sagiv, Schwartz, and Arieli (2011) believe that company symbols, rituals, norms, and practices express the organizational values that constitute the organizational culture. Yet, Hofstede (2001) maintained the view that orga-nizational cultures can be distinguished mostly on the basis of practices (includ-ing rituals and symbols), and far less in terms of values (see 9.27.). 12 In his view, the so-called corporate values are actually statements by the company leaders that may not reflect the values held by the employees. The latter do not stem from company indoctrination but from one’s upbringing in the context of a particular national culture.
In that sense, the relationship between national culture and organizational cul-ture may be like the relationship between national culture and denominational
culture. Just like organizations, religious denominations can differ drastically in terms of the practices that they impose on their followers. But they do not necessar-ily differ much in terms of basic values. Following a specific religious denomina-tion may mean accepting a distinct dress code and some food taboos. But it is hardly associated with radically different basic values. This interesting finding is discussed in the next section.
If one studied the values of the nuns of a particular monastery and those of a group of cabaret dancers, one would probably discover important distinctions. However, Hofstede (2001) argued that differences of this type do not reflect orga-nizational cultures, as they are not created by organizations. Rather, people choose what type of organization to work for on the basis of their already existing values, acquired early in life. As for the so-called specific corporate values, organizations may be differentiated on the basis of such official slogans, but the extent to which the leaders have managed to instill their messages in their employees is another matter. It is an empirical question that cannot be answered on the basis of com-pany brochures and websites or interviews with chief executive officers.
2.6.3. NATIONAL CULTURE VERSUS RELIGIOUS DENOMINATION CULTURE
The view that different religious denomi-nations can have different values is prob-ably very old, yet it became especially prominent after Weber (1930) famously argued that, during a relatively short spe-cific period of its existence, Protestantism created an unprecedented combination of values in the mental software of its fol-lowers: thrift and hard work as ultimate goals rather than vehicles for accumulat-ing wealth so as to be able to indulge in pleasurable leisurely activities. Weber did not explain by what mechanism religious

Main Characteristics of Culture ◆ 29
ideology creates cultural values. He failed to consider a plausible competing hypoth-esis: that Protestantism provided an offi-cial justification for values that were already beginning to take root in northern Europe as a result of economic and social developments—expanding international trade and personal enrichment. The germs of capitalism were clearly visible long before the 17th century—the period when the so-called Protestant values flourished, according to Weber (Minkov, 2011).
Weber’s ideas are still strong today. For instance, in an influential article in the international management research field, Ralston, Holt, Terpstra, and Kai - Cheng (2008) stated that religions and ideologies, such as Confucianism, Buddhism, and Christianity, strongly influenced the cul-tures where they were propagated and can now account for such cultural differences as the good-of-the group in the East versus the good-of-the-individual in the West.
Section 9.3. presents research by Schwartz (1994), who found that the values of Israeli Muslim Arabs and Israeli Christian Arabs are nearly indistinguish-able. Esmer (2002) found small differences in some values held by Muslims and non-Muslims in a number of countries where such communities have cohabited for cen-turies, but these were dwarfed by the observed national differences. For exam-ple, Nigerian Muslims were far closer in their values to Nigerian Christians than to Bulgarian Muslims. Inglehart and Baker (2000) arrived at the same conclusion: “The differences between the values held by members of different religions within given societies are much smaller than are cross-national differences” (p. 19). Other studies also support this conclusion. 13
Thus, it is the secular element of soci-etal culture that accounts for religious beliefs and tenets, rather than the other way around. Most important, cultural values are not rooted in particular reli-gions and the ideologies of their sacred books; they are shaped by the interplay of environmental, economic, and political
factors, not by the specific religious indoc-trination that one can receive from a par-ticular religious denomination. Likewise, culture seems largely impervious to official political indoctrination from the ruling elites of totalitarian states. This point is elaborated in 2.8.
◆ 2.7. Diffuseness
Because culture can be defined in many dif-ferent ways, it is a diffuse concept whose boundaries cannot be determined in a way that will result in universal consensus. It is currently fashionable to see the core of culture as consisting of values, beliefs, and norms, but these are associated, both theoretically and statistically, with vari-ous other concepts, some of which can be viewed as part of culture, a peripheral area between culture and what is outside its boundaries, or something completely independent. Examples of these are insti-tutions, art, and language.
Language is a particularly interesting phenomenon. Traditionally, anthropolo-gists viewed it as part of culture. Murdock (1940) stated that grammatical rules are cultural because they represent collective habits. Yet, comparative linguists followed a different tradition, attempting to explain grammatical differences as if grammar were a closed system, totally detached from societal features. 14
Another domain whose association with culture is controversial is biology. The controversy has much to do with the interpretation of the consistently observed racial and ethnic differences on IQ tests, even when those are supposedly culture free. Various scholars (Arvey et al., 1994; Lynn & Vanhanen, 2002, 2006; Rushton, 2000; Rushton & Jensen, 2005, 2006, 2008, 2010) have claimed that these differ-ences have a partly genetic basis, whereas others (Neisser et al., 1996; Nisbett, 2005; Sternberg, 2005) have rejected this view. The controversy is important to

30 ◆ Understanding “Culture”
culturologists because measures of aver-age national or ethnic IQs are highly and positively correlated with national sui-cide rates (Voracek, 2004, 2006a, 2006b, 2009), and highly negatively correlated with national murder rates, adolescent fertility rates, and other important culture-related variables (Minkov, 2011). Like other personality characteristics, men-tal ability can be considered an element of a person’s mental software; hence a population’s average intelligence is intri-cately related to its culture. To complicate things, Rushton (2000) proposed a notori-ous theory, claiming that racial differences in IQ are part of more general, genetically determined, cognitive and behavioral dif-ferences among the three main races—Blacks, Whites, and East Asians—which can undoubtedly be viewed as aspects of their cultures. In other words, Rushton implies the existence of racial culture, strongly rooted in genes.
The academic debate on the association between genes and intelligence at the soci-etal level is too complex to be presented here. It will probably not die down until individual-level intelligence is convinc-ingly linked to particular genetic polymor-phisms or other genetic patterns; the next step would be to ascertain the geo-cultural distribution of these patterns and establish if it is associated with population differ-ences in average IQs. Yet, it is unlikely that even this association will satisfy all scholars unless it withstands various sta-tistical controls, such as socioeconomic measures, differences in nutrition, and other aspects of lifestyle.
Although Rushton’s theory finds few overt supporters, a number of prominent scholars have launched hypotheses implic-itly associated with it. Manning (2007) believes that racial differences in the CAG gene, which regulates men’s susceptibility to the effect of testosterone, may account for differences in IQ. Yet, the putative association between testosterone and intel-ligence has not been proven so far.
Manning is known for his pioneering work on digit ratios 15 and their association
with in-utero exposure to testosterone as well as their properties as predictors of aggression and aspects of sexuality, such as number of sexual partners, reproductive success, and family size. 16 Interestingly, Manning and his associates found evidence of significant racial and ethnic differences in finger ratios, sparking a series of simi-lar studies across the globe. 17 The totality of the available evidence demonstrates a positive association between finger ratios and latitude, suggesting higher in-utero exposure to testosterone around the equa-tor. Summarizing this evidence, Helle and Laaksonen (2009) noted that finger ratios rise from Africa to Central Europe but then seem to decline slightly in northern Europe; thus the geographic pattern resem-bles a J rotated clockwise at 180 degrees.
In a highly speculative hypothesis, Manning and his associates linked finger ratios to skin color and prevalence of polygyny (Manning, Bundred, & Mather, 2004). Of note, Manning’s (2007) data about population differences in the CAG gene match the data about differences in finger ratios. Yet, any connection to cul-tural traits appears highly speculative at this moment.
A direct attempt to link biological markers to cultural phenomena was also made by Faurie and Raymond (2005), who found a strong association between percentage of left-handers across prelit-erate societies and murder rates. In the absence of other similar studies, it would be premature to express an opinion of it. We must note however that handedness is only partly genetic.
The idea that group-level personality differences may result from differences in gene pools was entertained by Allik and McCrae (2004). If this speculative view is confirmed, it could suggest an association between biology and culture, as Hofstede and McCrae (2004) found high corre-lations between dimensions of national culture and national personality trait measures. Although still unsubstantiated beyond reasonable doubt, the speculation that some aspects of culture and genes may

Main Characteristics of Culture ◆ 31
have something in common is beginning to gain currency. Laland, Odling-Smee, and Myles (2010) stated that researchers from diverse backgrounds are converg-ing on the view that human evolution has been shaped by gene–culture interactions. Chasiotis (2011) defended essentially the same position. According to Chiao and Ambady (2007), genetic variation between cultures suggests that cultural variation may be a result of different interactions, including gene–brain (p. 238).
By now, significant ethnic differences in the distribution of polymorphisms in the serotonin-transporter gene (5-HTT) and the dopamine-transporter gene (DRD4), both of which affect brain activity, have been reported in a number of studies (Bastos-Rodriguez, Pimenta, & Pena, 2006; Batzer et al., 1996; Chang, Kidd, Livak, Pakstis, & Kidd, 1996). The effect of these polymorphisms is disputed, yet Wang et al. (2004) suggested that DRD4, whose poly-morphisms are very differently distributed among East Asians and Amerindians, is a prime candidate for investigating gene and culture interactions. Some authors have even attempted to associate the prevalence of some genetic polymorphisms with cul-tural indices such as individualism versus collectivism (Chiao & Blizinsky, 2010; Way & Lieberman, 2010). Although these studies are highly controversial in many ways, including their treatment of cultural dimensions, we are likely to see more of them in the future.
In summary, the view that culture can-not have anything to do with biology has been seriously challenged, although the opposite view has not been proven. We can only await further interdisciplinary studies in the future that could elucidate this challenging issue.
◆ 2.8. Uncontrollability
One of the eternal questions in culturology is what creates culture and cultural differ-ences. This topic has been discussed by
many authors: Hofstede (2001), Inglehart and Baker (2000), Minkov (2011), van de Vliert (2009), Weber (1930), and White (1959/2007), to name just a few. In view of the rapid advance of culturology in the past few decades, the topic warrants a whole new treatise.
This section focuses on just one par-ticular question concerning the origin of culture: Can people choose a particular cultural template and implement it in practice? We can start from an interesting observation: “Single individuals are largely prisoners of the culture they inherit” (Newson, Richerson, & Boyd, 2007, p. 456). This means that culture happens to people; they cannot choose what cul-ture to grow up with any more than they can choose their native language. And they cannot whimsically decide to adopt another culture later in life either. If they change some of their values, beliefs, and behaviors, that is an outcome of powerful external influence.
Societies are not freer than single indi-viduals to choose or change their cul-tures: “To argue that a people determines its social organization by its own free will and choice really explains nothing and shuts the door to further inquiry as well” (White, 1959/2007, p. 28). In a similar manner, Schumpeter (1942/2003) criticized the “delightful simplicity” of the assertion that “men have heads and can hence act as they choose”:
It is hardly necessary to dwell on the weakness of such arguments: of course men “choose” their course of action which is not directly enforced by the objective data of the environment; but they choose from standpoints, views and propensities that do not form another set of independent data but are themselves molded by the objective set. (p. 12)
A somewhat more guarded position in this respect was put forward by Parsons et al. (1951/2001), who indicated that social systems are not deliberately planned by

32 ◆ Understanding “Culture”
anybody, although that does not imply that those systems are created at random: “The structure of the social system in this respect may be regarded as the cumulative and balanced resultant of many selections of many individuals” (p. 25).
Factors such as the physical environ-ment and the predominant economy that a particular population practices (includ-ing the main technologies in that economy and the political developments that are associated with people’s economic pur-suits) have unintended and uncontrollable consequences for culture. It is not some-thing that societies, or their individual members, create and steer consciously. Certainly, culture cannot follow some-body’s ideology, contrary to assertions to the opposite: “Historically, individualism is a product of the ideology of liberal-ism” (Kemmelmeier et al., 2003, p. 305). Individualism is a product of economic development, not of a particular ideology.
Even when people think that they have made a deliberate collective choice—for example, to build a democratic society—that choice is actually imposed on them by economic, political, and historical factors, whereas their mental software forbids them to make some alternative choices. For the ancient Egyptians, it was unthink-able to decide to adopt a modern form of democracy, just as it is implausible that the population of the United States will choose to embrace Marxist values and ideologies in the foreseeable future.
Ruling elites are not in a better position than the masses when it comes to opting for a particular culture. National leaders cannot easily indoctrinate the majority of the citizens with values that clash with their existing mental software. Inglehart (1997) points out that after 70 years of indoctrination of an unprecedented extent, Soviet leaders were not able to shape the worldviews of their people to conform to their goals, and finally even the elite were disenchanted with the official ideology. In other words, political ideology cannot cre-ate a particular culture.
This explains why there is no such thing as a socialist or communist national cul-ture, just as there is no Christian culture. The early versions of Inglehart’s cultural maps, based on a selection of key indica-tors in the World Values Survey collected shortly after the fall of the Berlin wall, show that West and East Germany were as close together culturally as Serbia and Montenegro, which at that time were two regions of one national state, populated by a single ethnicity. In fact, East and West Germany were far closer together on Inglehart’s map than either of them was to Austria. Similarly, although China was at some distance from Taiwan on that cul-tural map, it was extremely close to South Korea, which never experienced a Marxist regime. We can safely conclude that the official political ideology exerted negligible direct influence on the values and beliefs of East Germans and Chinese. In fact, the Marxist regimes not only did not bring about any significant cultural transforma-tion but actually achieved the opposite. By preventing fast economic growth, they managed to prevent cultural change.
◆ 2.9. Predictability
Murdock (1940) stated that although cul-ture adapts to changing conditions, that does not imply an idea of progress or a theory of evolutionary stages of develop-ment or a rigid determinism of any sort (p. 367). He provided examples that show that “different cultural forms may rep-resent adjustments to like problems, and similar cultural forms to different prob-lems” (p. 367). In fact, it is intuitively clear that Murdock was right: The problem of food provisioning is shared by all human societies but is solved very differently.
The anthropologists of Murdock’s time, however, either observed static cultures or studied change within a single culture without being able to compare it to many others. They were therefore unable to see

Main Characteristics of Culture ◆ 33
that although similar problems may be solved in different ways, some similar pro-cesses tend to have similar consequences. Economic development is accompanied by roughly predictable cultural change.
In fact, this observation was made long before the advent of anthropology. It is usually Karl Marx who is credited with it (thus, Inglehart, 1997), but it goes at least as far back as Montesquieu (1748), who noticed that richer societies have softer mores; for instance, they inflict less cruel punishments on those who break the laws. Important insights into the predictability of cultural change were provided by Kerr, Dunlop, Harbison, and Myers (1960), who argued that industrialization has some similar social consequences across the world. Inglehart (1997) and Inglehart and Baker (2000) further developed this point on the basis of strong empirical evidence spanning decades of research: Although cultural change is probabilistic and not fully deterministic, it is possible to predict to a considerable extent what cultural developments will take place in a nation that experiences sustained eco-nomic growth and a significant increase of average personal income.
Nevertheless, it is important to note that it may take one or more generations for the effect of economic growth or other cultural determinants to become clear. Short-term cultural changes, as registered by Inglehart and Baker (2000), appear to follow random directions. Yet, Inglehart (2008) showed that a recognizable pattern might emerge across some societies when cultural change is traced over decades.
■ Notes
1. Because of the perceived importance of sharedness, Dorfman and House’s (2004) defini-tion of culture, adopted also by the whole Project GLOBE (see 9.17.), is “shared motives, values, beliefs, identities, and interpretations or meanings of significant events that result from common
experiences of members of collectives and are transmitted across age generations” (p. 57). 2. See Hofstede (2001, p. 24) for an example of why marginal phenomena can be of particular interest to a cross-cultural researcher. 3. The World Values Survey hosts the largest repository of values, beliefs, norms, and various self-descriptions measured across the world. It is a longitudinal international project for the study of national culture led by American political scientist Ronald Inglehart. Its results, spanning nearly three decades and covering almost 100 countries, are freely avail-able on the project’s several websites (for instance, www.worldvaluessurvey.org and www.worldvaluessurvey.com). 4. What we do not know in this case is the distribution of the individual scores. It is hypothetically possible that all Germans have scored 2.5 but it is also possible that 50% have scored 0 and 50% have scored 5. These are two very different situations, although the average country score would be 2.5 in both cases. One can assign a score of 2.5 to the hypothetical average German in both cases, yet that would be misleading in the second case. 5. When individuals are compared across cultures, the issue of sharedness or homogeneity versus intracultural variability can raise various interesting questions. For instance, what is the likelihood that two randomly chosen individu-als from two cultures will have significantly dif-ferent scores on a particular individual-level variable? Matsumoto, Grissom, and Dinnel (2001) addressed questions of this type. Apart from recommending various statistical tests for comparisons of individuals from different cultures, these authors argue that a statistical significance between two populations does not necessarily translate into a practically important significance, and they provide an interesting elaboration on the idea that may have useful applications in cross-cultural psychology. Of course, all these issues arise when the units of study are individuals, which is not the best method for comparisons of societal cultures in hologeistic culturology. 6. Below, correlations are provided between pairs of identical World Values Survey items that

34 ◆ Understanding “Culture”
were measured approximately 10 years apart. They all address the importance of certain val-ues that children should possess (for details, see Exhibit 1 in the appendix at the end of this book). Each correlation is between two measures of a single item: from the survey in 2005–2008 and from the latest (most recent) previously available survey, which in most cases is about a decade older. In the 2005–2008 survey, the codes of the variables start with a “v,” whereas those from the previous surveys start with an “A.” The reported correlations are across 43 nations.
religious faith v19 and A040 .95**
hard work v13 and A030 .87**
obedience v21 and A042 .82**
thrift v17 and A038 .76**
determination / perseverance
v18 and A039 .75**
independence v12 and A029 .73**
responsibility v14 and A032 .72**
unselfishness v20 and A041 .67**
imagination v15 and A034 .60**
tolerance v16 and A035 .55**
We observe stark differences in the correla-tions. However, the conclusion that religious faith is a far more stable value than imagina-tion and tolerance is premature at this point. Religion is a concept that people in almost all societies, except some isolated hunter-gatherers, understand well. Hard work and obedience are also concepts that probably make sense in all modern nations. But abstract Western notions such as imagination and tol-erance are far less likely to ring a bell. The fact that precisely the measures of these variables show the lowest correlations across studies probably suggests that some respondents do not understand them well, not necessarily that these variables evolve differently in different societies.
The format of the item may also affect cor-relations across surveys. When religiousness is measured in terms of the importance of religion as a personal value in the respondents’ own lives on a 4-point Likert scale, the national per-centages of World Values Survey respondents
who indicated that it was very important to them in 2005–2008 (item v9) correlate with the percentages from the latest previously avail-able surveys (item A006, latest data for each country from 1994–2004) at .99** ( n = 41)—a higher correlation than the one between the two corresponding measures of importance of faith for children as a free-choice item.
Yet, it would be wrong to assume that dif-ferences in correlations between measures from different periods can be explained simply as a function of item wording and format. If we compare World Values Survey measures of the importance of family in the respondents’ lives in 2005–2008 (item v4) and approximately a decade earlier (item A001 before 2005, lat-est data for each country from 1994–2004), we obtain a correlation of .76**. There is no reason to assume that the concept of family is less easily understood than the concept of reli-gion in any modern nation. Because the item format is the same as in the case of religion, we must conclude that religion was after all a more stable national value than family, at least between 1994 and 2008. 7. In an influential treatise on the societal effects of industrialization produced half a cen-tury ago, Kerr, Dunlop, Harbison, and Myers (1960) implied that some cultural convergence was inevitable and even stated that “the logic of industrialism will eventually lead us all to a common society where ideology will cease to matter” (p. 101). From a modern perspective, it is unlikely that either ideology or culture will cease to matter in the foreseeable future despite industrial or postindustrial development. As a result of his study of “modernity” and its reflection on values, Inkeles (1981) concluded that there was “movement toward a common pattern only with regard to certain specific qualities identified as part of the syndrome of individual modernity. There are clearly many realms of attitude and value that are indepen-dent of the industrial organizational complex common to the advanced nations” (p. 11).
Other critiques of the convergence hypoth-esis were published by Maurice (1976), Form (1979), and Smith and Bond (1993). Schumpeter (1942/2003) stated that social structures, types, and attitudes do not change

easily and may persist for centuries; hence, convergence is implausible. 8. Inglehart and Baker (2000) present a visual estimate of the degree to which 38 countries have changed their positions on two key dimensions of culture over a period of about 15 years (Figure 6 in their publication). Positions on each of the two dimensions are measured on a scale from approximately –2.00 to a little over +2.00. The figure shows that while South Korea barely moved from 1981 to 1996, Sweden saw huge cultural change during the same period and moved from approxi-mately 1.00 to about 2.25 on one of the two dimensions. Most other wealthy countries also registered very significant cultural change in a more or less similar direction. In the develop-ing world, the picture seems more mixed: The direction of cultural change appears completely unpredictable and, with the exception of China and Poland, whose cultures changed enor-mously and in opposite directions, there was greater cultural stability.
Inglehart (2008) also studied cultural change and convergence across some West European countries. He compared national percentages of respondents who embrace a wide range of values, norms, attitudes, and beliefs in Belgium, France, Italy, the Netherlands, the United Kingdom, and West Germany, mea-sured from 1970 to 2006. His results (Figure 2, p. 135) show clearly that the cultural differ-ences between the six countries were attenu-ated during the 36-year period of the study. The observed convergence, however, was par-tial. The cultural differences between the six countries did not disappear completely during the 36-year period. Most remarkably, all six countries at almost all times moved in the same direction on Inglehart’s measures. Their posi-tions fluctuated, but always in a fairly similar manner. As a result, the ranking of the six countries on Inglehart’s measures was practi-cally the same throughout the 36 years.
Inglehart (2005) also compared how societ-ies on all continents have changed in the past decades. He found that there had been no global cultural convergence at all. On the con-trary, there was evidence of divergence between the values of some rich and poor nations.
9. It is interesting that various scholars from the field of finance and accounting (for instance, Baskerville, 2003; McSweeney, 2002) have joined the debate on the meaningfulness of the concept of national culture and have proposed various simplistic arguments against it. For example, Baskerville (2003) refers to an Encyclopedia of World Cultures in which the Middle East is said to have 14 nations and 35 different cultures (p. 6). One can only wonder why Baskerville did not ask how those 35 cultures were identified and delineated but accepted the number 35 as a fact. 10. Hofstede (1980, 2001) found impor-tant cultural differences between Flanders and the Netherlands. However, German-speaking Switzerland was culturally associated with Germany, whereas the French-speaking part was culturally similar to France. There was a wide cultural gap between the two language areas, in particular on the dimension of power distance.
Some studies showed that Nigerian ethnic groups diverge substantially on some World Values Survey measures but are close together on other indicators (Peterson & Fanimokun, 2008; Peterson, Fanimokun, Mogaji, & Smith, 2006).
A classic study of the values of schoolteach-ers and university students by Schwartz (1994) shows that when countries and in-country regions are ranked, Shanghai in northeastern China and Guangzhou in southern China are wider apart in their aggregate scores on some groups of values than are the United States and Japan. On other groups of values, Shanghai and Guangzhou are farther apart than Hungary and New Zealand or Brazil and Turkey.
Lenartowicz, Johnson, and White (2003) reported some value differences between national regions in Latin America and similari-ties across national boundaries.
Hofstede, Garibaldi de Hilal, Malvezzi, Tanure, and Vinken (2010) compared the cultures of 27 Brazilian states using Hofstede’s Values Survey Module. Despite the cultural differences between the states, evidence of a common Brazilian national culture was found. Also, Brazil’s states were much more similar to each other than to the other Latin American countries, let alone countries worldwide.
Main Characteristics of Culture ◆ 35

36 ◆ Understanding “Culture”
11. The idea of organizational culture became popular in the late 1970s and early 1980s (Peterson, 2011). Reviews of the impli-cations of organizational culture for organi-zational phenomena can be found in Ouchi and Wilkins (1985), Trice and Beyer (1993), Martin (2002), and in edited collections such as Ashkanasy, Wilderom, and Peterson (2000) and Cooper, Cartwright, and Early (2001). Essentially, organizational culture is believed to be associated with organizational efficiency and effectiveness. 12. Note however that this view is based on a study (Hofstede, Neuijen, Ohayv, & Sanders, 1990) in which the concept and measurement method of “values” is different from what is described in 3.2.1.1. 13. Alexander and Welzel (2011) carried out a worldwide comparison of what they called “patriarchal values” of Muslims and followers of other religions in predominantly Muslim societies and outside such societies. According to the terminology adopted in this book, they did not study values but ideologies and beliefs (for the distinction see 3.2.1.1. and 3.2.1.2.). They found that in both types of societies, Muslims were more likely than non-Muslims to endorse patriarchal ideologies such as rejection of gender equality. However, as Figure 2 in that publica-tion shows, societal culture has a stronger effect on those ideologies than religious denomina-tion. In terms of their patriarchal orientation, non-Muslims in predominantly Muslim societies are closer to their Muslim fellow countrymen and women than to non-Muslims in predomi-nantly non-Muslim societies. On the other hand, Muslims in predominantly non-Muslim societies are closer to their non-Muslim fellow country-men and women than to Muslims in predomi-nantly Muslim societies.
Further, Alexander and Welzel (2011) found that inside predominantly Muslim coun-tries, there is only a weak positive correlation between men’s frequency of mosque or church attendance and endorsement of patriarchal ideologies (Figure 6 in their study). As far as women are concerned, this correlation is actually slightly negative. Thus, overall, there is no support for the view that people in those countries receive their ideologies from
institutionalized religion. The same authors found that outside predominantly Muslim societies, frequency of church attendance is positively correlated with endorsement of patriarchal ideologies. But this correlation does not show the direction of causation. People who have patriarchal ideologies may be more likely to go to the mosque or church.
Countries with more religious general popu-lations have more religious Pentecostals. The Pew Research Center (2006) provides a sur-vey of Pentecostal Christians in 10 coun-tries: Brazil, Chile, Guatemala, India, Kenya, Nigeria, the Philippines, South Africa, South Korea, and the United States, with country samples ranging from 119 to 483 respondents. Question 2 in the survey asks how important religion is in the respondents’ lives. There are two response options that indicate strong religiousness: “single most important” and “very important” (the next option is “some-what important”). The national percentages that have chosen the first two options can be added up to obtain a national religiousness index for Pentecostals. Conveniently, the same question was asked among the general popula-tion of the 10 countries as well, with samples ranging between 600 and 1,005, reaching national representativeness in most of the 10 countries. A religiousness index for the general population can be calculated using the same method as for the Pentecostals. The two indices—for the general population and for the Pentecostals—correlate at 97**. Correlations with World Values Survey mea-sures of religiousness yield only slightly lower correlations with the Pentecostals’ index.
One can safely conclude that national reli-giousness (measured as a value), which is a nondenominational component of culture, strongly affects the degree of religiousness of the Pentecostals, although in all countries Pentecostals are more religious than the general population. 14. Thus, Chomsky (1981) and others associated the so-called null subject parameter (the fact that some languages allow sentences without subjects) with verb inflection rich-ness. However, there are many languages for which this explanation fails, because they allow

Main Characteristics of Culture ◆ 37
sentences without subjects although their verbs do not have any person markers (Huang, 1984, 1989). Decades of linguistic research failed to provide a purely linguistic explanation of the null subject parameter (Neeleman & Szendroi, 2005). Kashima and Kashima (1998, 2003) proposed that this phenomenon—one aspect of which is known as “pronoun drop”—is associated with cultural differences such as individualism versus collectivism. Minkov’s (2006) research concurred with this finding; his historical analysis of English and Scandinavian languages from the early Middle Ages to the present day showed that grammatical change can follow economic and cultural change. Close associations between some aspects of language and culture were discussed also by Everett (2005), which brings up the question of whether these two phenomena should be classi-fied together or separately. 15. This is the length of the second digit (index finger) divided by the length of the fourth digit (ring finger). All over the world, women tend to have a higher ratio (usually close to 1.00) than men (lower than 1.00). Although this
gender difference has been known for over a century, it was British researcher James Manning who showed through his research at the end of the 20th century that digit ratios are associated with sex hormone levels (Manning, 2002). 16. Some landmark studies in this field are those by Honekopp, Voracek, and Manning (2006); Kuepper and Hennig (2007); Manning (2002), Manning et al. (2000); Manning, Bundred, Newton, and Flanagan (2003); Manning, Henzi, Venkatramana, Martin, and Singh (2003); Manning, Scutt, Wilson, and Lewis-Jones (1998). 17. See, for instance, Albores-Gallo, Fernandez-Guasti, Hernandez-Guzman, and List-Hilton (2009); Bang et al. (2005); Fink, Thanzami, Seydel, and Manning (2006); Loehlin, McFadden, Medland, and Martin (2006); Manning et al. (2000); Manning, Henzi, et al. (2003); Manning, Stewart, Bundred, and Trivers (2004); Oladipo, Fawehinmi, Edibamode, Osunwoke, and Ordu (2009); Von Horn, Backman, Davidsson, and Hansen (2010); Voracek, Bagdonas, and Dressler (2007); Voracek, Manning, and Ponocny (2005), and so on.

This chapter discusses conceptualizations of the main elements of cul-ture, mainly through an operationalist perspective (operationalism
is explained in 5.4.1.). Other approaches to the unpackaging of culture, rooted in different schools of thought, are also possible. Yet, operation-alizations of abstract concepts are needed to understand the empirical realities that they target.
This chapter briefly dwells on what can be called particular elements of culture: those that are found in small numbers of societies or are so specific that they make cross-cultural comparisons hard or impossible. Then, it devotes much greater attention to components that have a uni-versal or near-universal character, at least across modern nations and ethnic groups, and can therefore be used for the purpose of hologeistic cross-cultural analysis.
3 THE ELEMENTS OF CULTURE
38 ◆

The Elements of Culture ◆ 39
◆ 3.1. Particular Elements of Culture
There are various visible cultural artifacts that one cannot easily use for the pur-pose of hologeistic cultural comparisons. For example, at the beginning of March, Bulgarians and Romanians wear marten-itsas on their lapels: red and white figures of various shapes, sizes, and materials that may have been used to bring good luck in the past but are simply worn for fun today. One can compare only two ethnicities in terms of the physical appear-ance of martenitsas, the way that they are used, and the meanings that are attached to them.
Elements of subjective culture can also fall in this category. The classic example is meanings: Some may be so culture spe-cific as to be incomparable quantitatively across many societies. Symbols, another group of particular elements of culture, are closely associated with them (Cohen, 1974; Griswold, 1994). So can be rituals and even heroes, which may also be con-sidered components of culture (Hofstede, 2001).
Taboos are another example of particu-lar elements of culture. Many of them have a very limited distribution. In Bulgaria, hardly anybody would think of giving an even number of flowers to a woman; only odd numbers are acceptable. A study of this rare taboo cannot be used for the development of a universal cultural model because no large-scale comparisons with many other societies are possible.
Institutions are also an interesting case. Depending on one’s preference, they can be viewed as completely independent of culture, as influenced by it, or as part of it. There is some inevitable subjectivity in deciding how to classify institutions as well as some objective facts that need to be considered in some cases. For instance, one may defend the view that forms of mar-riage, such as polygyny versus monogamy,
should be considered extensions of a soci-ety’s culture. However, viewing different forms of government—say, kingdom versus republic—as cultural phenomena in the 21st century is hardly useful, as it is not easy to predict and explain any signifi-cant societal traits through these particular forms of government.
Even if an institution seems like part of culture or an extension of it, it may be culture specific and thus unsuitable for a comparative study whose goal is to iden-tify cultural regularities. The Icelandic government around AD 1000 is a case in point. At that time, the supreme political power in Iceland resided in an institution called althingi, reminiscent of a national general assembly in the sense that it made important political decisions such as the adoption of Christianity. It also had leg-islative functions and, interestingly, acted as a court of law that heard cases and pronounced verdicts and sentences. Yet, Iceland did not have an executive branch of government. Once a person was found guilty of a crime and sentenced, the case was closed; the role of the government stopped there. It was up to any private party with a stake in the matter to see to it that the sentence was carried out. This combination of peculiarities gives medieval Icelandic government a unique identity and makes it hard to use in a cross-cultural comparison that aims to identify cultural patterns.
Schwartz (2011) advocated measuring culture through proverbs and popular books (p. 314). He did not explain how exactly such measurements could be taken, and there is no known sound methodol-ogy for comparing texts for the purpose of quantitative hologeistic cross-cultural analysis. Many proverbs are culture spe-cific. Others have only partial equiva-lents across societies. Besides, studying a nation’s proverbs for the purpose of learn-ing something about its culture can be a very confusing experience. For example, Bulgarians have a close equivalent to “Every cloud has a silver lining,” but

40 ◆ Understanding “Culture”
they also say that every misfortune brings another misfortune. According to one Bulgarian proverb, work embellishes peo-ple while laziness makes them ugly. But another proverb states that the only thing one can gain from work is a humpback. So what do we learn about Bulgarians from these proverbs? Are they optimists or pes-simists? Do they worship work or hate it? Or are they simply confused people?
The particular elements of culture are studied mostly by ethnographers, adopting a descriptivist approach and idiographic interpretations (see 4.3.). These methods run the risk of being unscientific and may lack predictive properties since interpreta-tions are subjective human fabrications. Because the particular elements of culture are hard to compare in a way that allows the identification of broad cultural pat-terns, they remain largely outside the interests of researchers who focus on global cultural variation.
◆ 3.2. Universal Elements of Culture
The following sections are devoted to ele-ments of culture that are assumed to have a universal nature and can be measured holo-geistically, at least across modern societies, but often across preliterate ones as well. That can be done in different ways. A com-monly used method to study the software of the mind is to collect self-reports. The respondents are asked to say something about themselves: what is important or unimportant to them, what they approve or disapprove of, what they believe, what they like or dislike, what they do, or what kind of persons they are. Scholars who use this approach assume, often correctly, that they will tap and measure universal phenomena, such as happiness, religious-ness, or attitudes toward gender equality. The assumption is that all societies in the world can be compared on these concepts
because they make sense everywhere, pro-vided they are explained in an appropriate language. Some behaviors—such as murder and sex—also have a universal character; therefore, they justify comparisons of soci-eties in terms of various statistics related to them.
3.2.1. SELF-REPORTS
Self-reports are the most common outcome of paper-and-pencil studies in hologeistic cross-cultural analysis. Strictly speaking, self-reports are statements that respon-dents make about themselves. Yet some of the statements that they make about others can also provide information about the respondents. In a more general sense, these statements can also be viewed as self-reports, albeit implicit.
3.2.1.1. Values
Values are an important element of cul-ture, as social behavior is viewed as partly caused by dominant values and ideologies (Leung & Bond, 1989). 1 An early and pio-neering study of managers’ values, based on Abraham Maslow’s concepts, was car-ried out by Haire, Ghiselli, and Porter (1966), covering 11 countries. Milestone cross-cultural projects that have measured values are those by Hofstede (1980, 2001), the Chinese Culture Connection (1987), Schwartz (1994), and Inglehart and Baker (2000).
In terms of their operationalization, values are usually studied by asking people what is important to them in their own lives and how important it is. The answers obtained in this way reflect personal val-ues: those that individuals consider impor-tant to themselves, as opposed to what they may wish for others to consider important. This crucially important dis-tinction is explained in the next section. From this operationalist perspective, val-ues can be defined as whatever people describe or select as personally important

The Elements of Culture ◆ 41
or unimportant over a long period of their lives, usually expressed as abstract nouns. Examples of concepts that people have rated in that way are religion, work, lei-sure, family, and friends.
Theoretical definitions of values, such as the one proposed by Kluckhohn (1967) can be quite diffuse: “A value is a concep-tion, explicit or implicit, distinctive of an individual or characteristic of a group, of the desirable which influences the selection from available modes, means and ends of actions” (p. 395). More recent theoretical definitions are narrower. They associate values with goals or guiding principles. According to Schwartz and Bardi (2001), values are “desirable, transsituational goals, varying in importance, that serve as guiding principles in people’s lives” (p. 269). “Transsituational” is an important characteristic of values. If a person said, “It is important to me to be on time for the party tonight,” that would not reveal what is normally studied under the heading of “values” in cross-cultural research. But a more general statement—“It is important to me to always be on time”—reveals that the person who has made that pronounce-ment values punctuality.
Theoretical definitions are interesting, and perhaps somewhat helpful, yet we must not forget that values are a subjective human construct. The problem with any abstract theoretical definition of a subjec-tive construct, not specifying how the con-struct should be measured, is that it can create confusion with other constructs. Consider this definition of personality traits, which are a very different domain of study: “dimensions of individual dif-ferences in the tendencies to show con-sistent patterns of thoughts, feelings, and actions” (McCrae, 2009). Do we have a clear distinction between values and personality traits on the basis of this defi-nition and Schwartz and Bardi’s (2001) definition of values? Minkov (2011) pro-vides the following example. Imagine that a group of people has told us that power and dominance are very important to
them. Researchers would conventionally interpret this as an indication that the group scores high on power and domi-nance as a value: Their guiding principle in life is to strive to dominate others. Now suppose that the respondents have described themselves as “power seeking” and “dominant.” This format would be interpreted by psychologists as a self-description that reflects a personality trait: a consistent pattern of thought or action. In both cases, researchers are studying the same reality, distinguished mainly by the wordings of the questionnaire items. Nothing else unambiguously differentiates dominance as a value from dominance as a personality trait.
Schwartz et al. (2001) admit that the same term can refer to a value or goal and a trait but argue that the two are distinguishable: One may value creativity without being creative. Creativity is an ability (perhaps not exactly the same as a personality trait such as the Big Five), and it is certainly possible to value an ability that one does not possess. But is it pos-sible to value honesty (a personality trait) while being a crook? Or can one strive to achieve dominance as an important goal in life (a value) while being submissive (a trait)? 2
Further blurring the conceptual differ-ence between values and traits, Schwartz (2011) indicated that “valuing achieve-ment may be a socially approved trans-formation of the trait of aggressiveness” and “traits may transform into different values in different societies” (p. 311). And Roccas, Sagiv, Schwartz, and Knafo (2002) found high correlations between values and Big Five personality traits across individuals.
Admittedly, confusions between val-ues and personality traits have not been known to generate serious research prob-lems. But a failure to distinguish values from what should probably be called “norms” or “ideologies” has sparked heated academic conflicts that could have been avoided if values and norms had been

42 ◆ Understanding “Culture”
defined through their operationalizations; that is, the types of questions used for their measurement. This is one of the topics of the next section.
Another controversial issue, most recently discussed by Schwartz (2011), is the operationalization of, and difference between, individual and cultural (societal) values. A measure of the former can be obtained by asking individuals what is important to them. But how do we arrive at cultural values? By aggregating individ-ual responses? While acknowledging that this is common research practice, Schwartz is not convinced of its merits, since his own research has revealed quite low within-society agreement around values. 3
Some authors (most recently Knafo, Roccas, & Sagiv, 2011) endorse a defi-nition of nation-level values as “shared, abstract ideas of what is good, right, and desirable in a society” (p. 179). The last part of this definition is reminiscent of Hofstede’s (2011) concept of “values as the desirable”: that is, norms or ideologies as to what people in society should value or how they should behave. The reader is referred to the next section, which stresses the point that the values people endorse at a personal level and those they view as desirable for others may have nothing to do with each other. As for the sharedness of values, norms, and ideologies or any other element of culture, this issue was treated in 2.1., where it was argued that it is actually a nonissue: There is no need to assume any level of sharedness.
According to the operationalist phi-losophy of this book, it is of little practi-cal use to engage in purely theoretical debates on the nature of the hypothesized difference between personal and societal values. Like any other subjective human construct, societal values can be whatever people decide they are. The practically useful question is what to study and how to study it to obtain meaningful informa-tion about societies: a set of statistical data that can be used to predict other data. For that purpose, it certainly makes sense to
ask individuals what they consider impor-tant in their own lives and aggregate their answers to a societal level. What exactly these aggregates will be called—“societal values” or something else—is of no prac-tical importance as long as they have interesting and important correlates and as long as we do not use confusing termi-nologies: similar terms for operationally different measures.
A note on Rokeach’s (1968) distinction between instrumental and terminal values is also in order. The examples that he pro-vides of the former—“broadminded, clean, forgiving, responsible” (p. 23)—suggest that, from an operationalist perspective, these should be considered personality traits, which Rokeach probably perceived as positive. One can certainly paraphrase these adjectives as nouns and ask the respondents if they value broadminded-ness or forgivingness in their own lives; in that case, these items would become questions about values. How useful it is to ask such questions—which may amount to inquiring if the respondents wish that they possessed certain personality traits—and what the answers would predict is an altogether different issue that can only be answered empirically.
It might also be useful to note that the term “values” has been applied to state-ments in various other formats. Leung and Bond (2008) used the term “values” about judgments of what is good or bad. In the terminology of this book, these would be attitudes (3.2.1.7.).
3.2.1.2. Norms and Ideologies
Norms, or ideologies, are also an important cultural phenomenon. They are often studied together with other ele-ments of culture, as in Hofstede (1980, 2001), Inglehart and Baker (2000), and Smith, Dugan, and Trompenaars (1996). A large-scale cross-cultural study, with a large section devoted entirely to norms or ideologies (although the authors some-what confusingly called them “values”),
The Elements of Culture ◆ 43
was executed by Project GLOBE (House et al., 2004).
Norms or ideologies can be conceptual-ized, and consequently operationalized, in different ways. In much of the exist-ing research, respondents are asked what people in general should or should not do, or what they should or should not be. It seems that when respondents answer such questions, they usually describe the desir-able values, behaviors, or states of mind that they wish to see in others, which may or may not overlap with the values, behav-iors, or states of mind that they consider acceptable for themselves. As we need a special term for these answers, “norms” or “ideologies” would be quite appropriate.
Respondents’ formulations of norms and ideologies are not pure self-reports. Still, they reveal important information about the respondents. For example, “Women should be subservient to men” is a norm or ideology about the desirable behavior of women and men other than the respondent, but it speaks volumes about the respondent who has enunciated it.
Some authors (for example, Gelfand, Nishii, & Raver, 2006) see values as “internal” and norms as “external influ-ences on behavior.” A person may not attach a great importance to religion as a personal value in an Islamic society where the prevalent norm is to be guided by religious principles. Still, that person may refrain from eating in public during the month of Ramadan for fear of transgress-ing the generally accepted norm. But no norm can be enforced if it does not coin-cide with the personally endorsed values of the majority. Therefore, we do not have a good distinction between values and norms in terms of “internal” and “exter-nal influences on behavior”: What is an external influence to somebody must be an internal value to most other people in the same society or else it would not produce an impact.
Murdock (1940) provided a conse-quentionalist description of norms: One can expect sanctions to nonconformity
to norms. Again, we do not have a good distinction between values and norms. If a particular society vigorously punishes the transgression of a norm that means it is actually a strongly held value by many people; otherwise, they would not bother to enforce it.
According to Fischer et al. (2009), “self-referenced values” are about “what is important to me,” whereas “descriptive norms” are about “what is important to most people” (p. 190). Like the previous definitions, these do not indicate how values and norms should be studied so as to be distinguished. If descriptive norms are important to most people, then they can be studied by asking representative samples what is important to them person-ally; thus, there is no difference between values and norms. It turns out that norms are simply values with a high degree of sharedness.
The operationalist distinction between values and norms or ideologies proposed here is crucial. Norms, as prescriptions and ideologies for the desirable values and behaviors of others, may coincide with one’s own values or be radically different from them. A person who says “Religion is very important to me” would probably also agree with the statement that all people should be religious, which reflects a norm or ideology. But a person who values power would have nothing to gain if others also strived for it (Smith, 2006) and would prescribe submissiveness as a norm for others. Similarly, from the viewpoint of mating competition theory (Barber, 2006, 2007; Buss & Duntley, 2003; Duntley & Buss, 2004), a man who is pursuing sexual relationships with many women, and values promiscuity, would not gain anything by prescribing the same value to others because that would cre-ate unwanted competition. His ideology for them would most likely be sexual restraint.
Minkov (2011) refers to various real-life situations to illustrate this point. According to the World Values Survey,

44 ◆ Understanding “Culture”
sub-Saharan African populations, includ-ing Nigerians, are overwhelmingly opposed to free sex. However, a number of studies by Western and African schol-ars have provided evidence of extensive sexual networking in Nigeria and other African countries (Caldwell, 2000, 2002; Orubuloye, Caldwell, & Caldwell, 1992, 1997). This suggests that sexual restraint is endorsed as an ideology for others in much of Africa, but not necessarily as a personal value and behavior. Similarly, Minkov points out that there is abun-dant research evidence that corruption is denounced throughout the world, yet it is extremely widespread in all poor coun-tries, where it is not the prerogative of sleazy politicians but is often initiated by ordinary citizens. The underlying philoso-phy seems to be “Corruption is an awful thing unless I can benefit from it.” 4
This is an extremely important point to remember. Until recently, personal values and those that people prescribe to others (that is, norms or ideologies) were con-fused. For example, they were not clearly distinguished by Milton Rokeach (1968), an influential author on the subject of values:
To say that a person “has a value” is to say that he has an enduring belief that a specific mode of conduct or end-state of existence is personally and socially pref-erable to alternative modes of conduct or end-states of existence. (p. 16)
This definition seems to merge what one desires for oneself with what people desire for their society. Kluckhohn’s (1967) defi-nition, which was already quoted, does not differentiate between values and ideologies either. Yet it is important for researchers to distinguish between them just as they are often distinguished in the answers of respondents to value-format items and norm-format items. Therefore, it is hard to agree with Javidan, House, Dorfman, and Sully de Luque (2006), who argue that
as to Hofstede’s point that GLOBE mea-sured ideologies through its “should-be” items, our view is that introducing yet another label is not helpful. There is no shortage of labels in the literature, and adding another concept without clarity or depth adds to the confusion. (p. 903)
In this particular case, there is an evident shortage of clear terms, and it is very help-ful to understand what exactly researchers will tap when they ask respondents what is important to them or what people in general should or should not do or be. 5
The distinction between values and norms that this book proposes can help resolve some major controversies in the academic literature. An example is the exchange between Geert Hofstede and Project GLOBE in which others have also been involved (Hofstede, 2006; Javidan et al., 2006; Smith, 2006). A failure to see the difference between personal values and ideologies for others has also resulted in frequent misunderstandings of what Hofstede’s (1980, 2001) “uncer-tainty avoidance” dimension actually measures. 6
3.2.1.3. Values for Children
The World Values Survey asks its respon-dents to choose from a list of traits or val-ues that children should learn. An item of this type can be viewed as a combination of a norm and a value. If we are guided by the wording of the item, it asks the respondents to formulate norms or ideologies for other people: desirable values for children. But it most likely also reflects the respondents’ personal values that they will attempt to instill in their own children. 7
3.2.1.4. Beliefs
Beliefs are expressed as agreements or disagreements with worldviews: The respondents are asked if they agree with various statements, most often about what

The Elements of Culture ◆ 45
they consider true or false. They are part of many cross-cultural projects, one of which, discussed in Bond et al. (2004) (see 9.16.), was entirely a study of beliefs. Like norms, some beliefs can be formu-lated about other people (“I agree that most people are dishonest”) and in that sense they are not pure self-reports. Still, they can contain information about the respondent. A person who endorses the statement that most people are dishonest avows a cynical social outlook.
Leung et al. (2002) reviewed the litera-ture on beliefs and concluded that despite the different definitions, they typically refer to a perceived relationship between two objects or concepts. Another conclu-sion was that there are different types of beliefs, some of which are more gen-eral than others. These may be labeled “general expectancies” (p. 288). Because they are characterized by a high level of abstraction, they are viewed as being likely to relate to social behaviors. Leung et al. (2002) call these beliefs “social axioms” because, just like in mathematics, these are “basic premises that people endorse and use to guide their behavior in different sit-uations” (p. 288). A longer definition runs as follows (Bond et al., 2004): “Social axi-oms are generalized beliefs about oneself, the social and physical environment, or the spiritual world, and are in the form of an assertion about the relationship between two entities or concepts” (p. 553).
The study of beliefs is useful because they may have important social functions (Leung et al., 2002). Measures of beliefs in the World Values Survey and in Bond et al. (2004) have strong predictive prop-erties with respect to external variables and reveal interesting cross-cultural dif-ferences.
3.2.1.5. Behavioral Intentions
Behavioral intentions can be studied by asking people what they would do in a cer-tain situation. The best-known large-scale cross-cultural project that was partly a
study of behavioral intentions is described by Smith et al. (1996) (see 9.5.). As that study showed, behavioral intentions and norms are not exactly the same thing. One may agree with the norm that people should not do something, while still being intent on doing it.
3.2.1.6. Self-Reported Behaviors
In many studies, including the World Values Survey, respondents have been asked to describe their behaviors, for instance, how often they go to religious services or spend time with friends or how many sex-ual partners they have had. These reports represent statements that may or may not reflect real behaviors; therefore, studies of this kind are not studies of behaviors per se. For the sake of precision, they should be called “self-reported behaviors.”
3.2.1.7. Attitudes
Attitudes are studied by asking people what or whom they like or dislike. The format of the items can be quite diverse, but in all cases the responses that they elicit can be linked to the following definition of attitudes: “evaluative statements—either favorable or unfavorable— concerning objects, people, or events” (Robbins, 1998, p. 140). 8
Practical examples of studies of attitudes are provided by the World Values Survey. Its researchers show or read to the respon-dent a list of different groups—people of another race, foreigners, homosexuals, peo-ple with a criminal record, and so forth—and ask which of these the respondents would not like to have as neighbors. The answers reflect attitudes, showing who is disliked. Another common method to study attitudes is to ask whether something—for example, the performance of the national government—is good or bad.
3.2.1.8. Self-Descriptions
In a sense, all previously examined ele-ments of culture, and especially values,

46 ◆ Understanding “Culture”
beliefs, and behavioral intentions, can be viewed as indirect self-descriptions. This section focuses on direct self-descriptions in which the respondents describe them-selves explicitly in terms of adjectives, verbs, and nouns, usually starting with, or implying, the phrase “I am.”
When the adjectives in the respondents’ self-descriptions refer to stable disposi-tions, they can be viewed as referring to personality traits. Major cross-cultural studies of personality traits are described by McCrae (2002), McCrae and Terracciano (2005), and Schmitt et al. (2007) (9.13., 9.14., 9.15.). The World Values Survey also contains questions that elicit self-descriptions: The respondents are asked how happy or healthy they feel, or how proud of their nations they are. 9
It is also possible to ask the respon-dents to describe themselves in terms of verbs. Kuppens, Ceulemans, Timmerman, Diener, and Kim-Prieto (2006) carried out a large cross-cultural study in which they asked the respondents to depict themselves in that way. Note that what they stud-ied would not be considered personality traits or stable dispositions by personal-ity psychologists because the respondents were asked to indicate what positive and negative emotions they felt during the previous week or during the interview. Self-descriptions in verbs that target stable dispositions, and can therefore be viewed as personality traits, are available in the World Values Survey. For example, the respondents are asked to indicate how much personal life control they perceive in principle.
Respondents can also be asked to describe themselves in terms of nouns. These may be self-identifications, such as Muslim, Christian, or Jew, that are not strongly associated with the other ele-ments of culture described in this chapter. Yet, some of these self-descriptions may be highly correlated with cultural elements such as values. An example is the World Values Survey item that asks the respon-dents if they are religious persons, which
in fact is a combination of an adjective and a noun.
3.2.2. REPORTS OF IMPRESSIONS OF OTHERS
Another way to study societal phenomena related to culture is to ask the respondents to describe other people. There are various methods, described below.
3.2.2.1. Peer Reports
In the case of peer reports, respondents are asked to think of somebody they know well and describe that person. Then, the descriptions can be aggregated to the national level so that country means are obtained. This method has been used in studies of national differences in Big Five personality traits, for instance, by McCrae and Terracciano (2005).
3.2.2.2. Idealistic Reports
The term “idealistic” can be used broadly to refer to various descriptions of hypothetical persons as the respon-dents would like or hate them to be. An example is Fiedler’s (1967) Least Preferred Co-Worker questionnaire in which the respondents describe people with whom they would work least well. Project GLOBE’s study of leadership (Dorfman, Hanges, & Brodbeck, 2004) can prob-ably also be classified in this category: The respondents were asked to assess how much a particular behavior or character-istic inhibits a hypothetical person from being an outstanding leader or contrib-utes to that person being an outstanding leader. Of course, GLOBE’s leadership items can also be conceptualized as beliefs; the only difference is the wording.
3.2.2.3. Stereotypes
Stereotypes are measured by asking respondents to summarize their impres-sions of a group of people, of which they may or may not be members, or a social

The Elements of Culture ◆ 47
and political entity such as a country, which may or may not be their own. Items that elicit stereotypes may start with “Most people in this society . . .” or “Generally, this society . . .,” followed by what people in that society seem to do, or the collective traits that they or the society appear to possess.
Studies of stereotypes can be divided into two main categories. Some research-ers have studied the stereotypical views that the members of one nation hold of those of another nation, or of its cul-ture (Boster & Maltseva, 2006; Marin & Salazar, 1985; Peabody, 1985; Wilterdink, 1992). The utility of these studies tran-spires most clearly in the international business literature that employs the con-cept of psychic distance (Tung & Verbeke, 2010): the subjective distance between two societies as perceived by their members. Psychic distance is believed to affect vari-ous decisions in international business and is therefore deemed to be worth studying.
Other researchers have studied the stereo-typical views that people have of their fellow countrymen and women and their cultures, known as “auto-stereotypes” or “self-stereotypes.” Some of the studies in this cate-gory explicitly mentioned that they targeted stereotypes (Terracciano et al., 2005); their goal was to show that such stereotypes are false. In other studies, the notion of stereo-types is missing (for instance, in House et al., 2004; Kostova & Roth, 2002; Kuppens et al., 2006; Ralston, Egri, De la Garza Carranza, Ramburuth, et al., 2009; etc.). Nevertheless, this kind of research also captures stereotypes. For example, Kostova and Roth (2002) asked company employ-ees whether “people in this country know a great deal about quality,” and whether “people in this country care a great deal about the quality of their work” (p. 233). Studies of this type reflect a belief that the information obtained from the responses will be trustworthy.
It is possible to obtain stereotypical descriptions of any of the previously discussed elements of culture that are
normally measured by means of self-reports. If respondents are asked to describe the behaviors of their fellow countrymen and women (as in Javidan, 2004), they will provide stereotypical sum-maries of perceived behaviors. If they are asked about the average personality traits that they observe in their society, as in the measurement of Project GLOBE’s humane orientation practices (Kabasakal & Bodur, 2004), they will provide stereo-typical descriptions of personality traits as they perceive them.
Attitudes or ideologies can also be described stereotypically. Kuppens et al. (2006) presented their respondents from 48 nations with lists of emotions and, among other things, asked them the fol-lowing questions (as a single item) con-cerning some of those emotions: “How appropriate and valued is each of the following emotions in your society? Do people approve of this emotion?” (p. 501). This is a study of stereotypical perceptions of other people’s attitudes or ideologies. Some World Values Survey items also resemble stereotypes, as they ask respondents to describe the collective performance of the government members in their countries.
In the cross-cultural literature, ste-reotypes have been defined as “attri-butes thought to be characteristic of a group or contrasting groups” (McCrae, Terracciano, Realo, & Allik, 2007, p. 957). 10 A similar definition of ste-reotyping was adopted by Boster and Maltseva (2006), “attributing to each individual in a group the features that are viewed as inherent in group member-ship” (p. 49). The similarity in the two definitions is only superficial because the first does not imply that stereotypes are applied to each individual in a group: “Characteristic of a group” allows for exceptions to the general rule. One can hold the opinion that most Germans are punctual although some are not. But if we adopt the first definition, that could still be a stereotype. McCrae et al. (2007)

48 ◆ Understanding “Culture”
and Terracciano et al. (2005), however, actually expanded and clarified their def-inition by adding another defining fea-ture of stereotypes, especially when they represent descriptions of groups in terms of personality traits: They are untrue.
As we will see later in this section, whether a generalized description of a group of people can be validated or not is a very complex issue. In line with the operationalist approach of this book, the concept of stereotypes proposed here is restricted to the research instruments that are used to reveal them. Thus, the defining feature of a stereotype is its operationalization as a general statement about a complex entity, such as a nation or a society. Outside the context of the research instrument, it is possible to have an endless debate on what is or is not a stereotype.
There are divergent views in the aca-demic literature about the validity of auto-stereotypes. Some anthropologists seem to believe that ordinary people are so knowledgeable about the culture that they live in that they can provide a reli-able account of it through stereotypi-cal descriptions. According to Haviland (1990), “because they share a common culture, people can predict how others are most likely to behave in a given cir-cumstance and react accordingly” (p. 30). This is a debatable position. Naturally, without some predictability, any society would fall apart. But the degree to which people’s actions can be predicted by lay-persons depends on many factors. In a complex modern society, it is impossible to predict behaviors in a wide range of situations without sophisticated scientific studies. Otherwise, there would be no need for marketing experts, consumer behavior analysts, political scientists, and personality and social psychologists. We could simply ask a couple of randomly chosen people in the street whether a particular chocolate brand would be suc-cessful or how the next election would turn out.
Project GLOBE (House et al., 2004) is, among other things, the largest cross-cultural study of stereotypes to date (see 9.17.). The GLOBE researchers asked the respondents to describe prevalent practices and generalized personality traits in their own societies. Because they obtained an acceptably high level of agreement among the respondents, they concluded that their results were valid. Arguably, if most peo-ple in a particular society agree that the typical or average person in that society is “nice,” this is sufficient evidence that the typical person is indeed nice. Yet, the logic behind the idea that whenever people reach full agreement on a particular state-ment we have information that can be taken at face value is flawed. Suppose that we register full agreement among the respondents of a particular society with the statement “People in this society are extremely intelligent” or even “People in this society are the most intelligent in the world.” What do we learn from such statements? Most likely, they only reflect an inflated collective self-regard and con-tain no real information about collective intelligence. Of course, self-descriptions may also suffer from similar biases; one should not accept a statement such as “I am extremely intelligent” as hard cur-rency that needs no validation test. The only way to validate a measure, be it a stereotype or a self-description, is to find convincing correlations between that mea-sure and relevant external variables.
McCrae et al. (2007) and Terracciano et al. (2005) presented evidence that when people are asked to guess the personality traits of their fellow citizens, their guesses are quite far from the citizens’ averaged self-reports. 11 Which of the two should we believe then? According to these authors, stereotype-based methods for the study of national personality yield results that do not contain a kernel of truth. One main reason for that conclusion is that when countries are plotted on a map based on personality stereotypes scores, there are no recognizable geographic or cultural

The Elements of Culture ◆ 49
patterns. Nigerians are surrounded by a loose configuration of Icelanders, Americans, Argentines, Poles, Turks, Ugandans, and Croatians. A tight cluster at the opposite end of the map is formed by Canadians, Indians, Burkinabes, and Batswanas. There is also a fairly distinct cluster of Turks, Chileans, Indonesians, Croatians, and Moroccans (Figure 1 in McCrae et al., 2007). As the authors point out, such configurations do not make any sense. There is no reason why Canadians should have drastically different personali-ties from Americans and cluster together with Indians and Burkinabes, while Hong Kong Chinese cluster with Hungarians and Poles. There is also no logical reason for China’s position on the stereotype-based personality map: Its closest neighbor is Sweden.
Consider also the following example. Item E124 in the World Values Survey studies before 2005 asks the respondents how much respect for human rights there is today in their countries. The item effec-tively asks for a stereotypical summary of an important aspect of the behavior of the countries’ rulers, yet the respondents are not necessarily knowledgeable and objective political analysts. First, they may be unaware of the real situation in their country. Second, it is not clear what they understand by “human rights.” Therefore, some of the answers to this item are likely to be unreliable. The results confirm this hypothesis. 12 Smith (2006) cites research that illustrates the same point. Asked to guess how important the values in the Schwartz Values Survey are to their fellow citizens, respondents were correct about some values and completely wrong about others. 13
Some authors hold the view that when those who produce the stereotypes are not ordinary people but highly educated intellectuals, they can reveal the actual state of affairs. Heine, Lehman, Peng, and Greenholtz (2002) asked various intellec-tuals to describe Japanese and Americans in various terms. The intellectuals were
not instructed to cite research findings concerning the cultures of these nations. In fact, many were not even anthro-pologists or cross-cultural psychologists; they were specialists in history, literature, geography, economics, art, and political science (p. 908). Still, they were invited to guess various psychological and cul-tural characteristics of the typical Japanese and American. Fischer (2009) discussed a similar approach to cross-cultural analysis called the “aggregate properties model” (p. 31). As an example, he mentioned that experts could be asked to rate the characteristics of various cultures in terms of dimensions such as individualism ver-sus collectivism, religious practices, and so forth. But exercises of this kind have a proven tendency to go very wrong. Terracciano et al. (2005) discuss vari-ous experiments in which cultural experts were asked to rate the predominant per-sonality traits of people in societies they were familiar with. A panel of experts in cross-cultural psychology did not match beyond chance the self-reported personal-ity characteristics of people in a sample of 26 cultures. Comparisons by persons, supposedly very knowledgeable about U.S. and Filipino culture, failed to repro-duce the self-reported personality traits of Americans and Filipinos.
When experts summarize the values of their fellow citizens without referring to reliable studies, the effect can be the same. In his Cultural Anthropology, Haviland (1990), an American cultural anthropolo-gist, stated that Americans respected a number of values “in the abstract,” such as “thrift,” “hard work,” and “indepen-dence” (p. 34). However, World Values Survey (2006) data from the year that Haviland’s book was published revealed that this statement was misleading. 14
This is not to say that all stereotypi-cal descriptions are always impossible to validate. Heine, Buchtel, and Norenzayan (2008) found that some stereotypical descriptions of national character did pre-dict conceptually plausible variables. Some

50 ◆ Understanding “Culture”
of Project GLOBE’s stereotypes are in fact meaningful dimensions of national culture that can be validated through external variables (see 9.17.). Generally speaking, stereotypes may be valid if they describe some salient practices or strong taboos in a particular society, especially if there is a high level of agreement among the respondents. 15 If a high percentage of respondents in an Arab country agree that “in this society, it is unacceptable for an unmarried couple to live together,” it is likely that the answer will reflect a real taboo. This can be proven through correlations with census data or other reliable sources, showing that it is indeed highly unusual in that particular society for unmarried couples to live together.
Stereotypes are widely used in studies of organizational culture or climate: The respondents are asked to summarize the situation “in this organization” (as in House et al., 2004). Alternatively, they may be asked to guess what their cowork-ers think or how they feel about certain issues (as in Ralston et al., 2009). Whether these stereotypes will reflect something that can be corroborated or not depends on what they are about. Assuming that no deliberate false reporting is involved, it is likely that if the respondents agree that it is unacceptable in their organization to be more than five minutes late for work, and if they tell us that hardly anybody ever breaks this rule, the real situation is prob-ably as they describe it because everybody in the organization can be expected to be knowledgeable about it. It is far less clear if employees are competent to make an abstract evaluation to the effect that “the employees of this organization are encour-aged to strive for high performance” and what these statements would correlate with even if they reach a high level of agreement. In studies of societies, one should be even more skeptical. The fact that 61.9% of the Vietnamese respondents in the World Values Survey tell us that the human rights situation in their country is excellent—a world record—does not mean
that their statements should be taken at face value and Vietnam is a paragon of human rights.
We can now close the discussion of stereotypes with a note on the difference between items that measure stereotypes and items that measure beliefs. Some beliefs may be formulated in such a way that they can resemble stereotypes. Consider this: “Old people are usually stubborn and biased” is an item used to measure social axioms (beliefs) by Bond et al. (2004, Table 1, p. 557). The respon-dents are asked to provide a stereotypical description of old people, and they are likely to think of the old people of their own country. What can make all the dif-ference between a belief and a stereotype in this case is the subjective interpretation of the item. If we take it as a self-report (the respondents are divulging something about themselves), the revealed informa-tion is reminiscent of an attitude and probably tells us something meaningful about the respondents. If a lot of people in a particular society agree with that statement, we learn that they have a cul-ture characterized by a cynical outlook toward old people. If the item is taken as a report on others (the respondents are attempting to tell us something real about old people in their country), the item captures a stereotype. The informa-tion about the old people that it targets may or may not be meaningful. It is a matter that cannot be resolved without an empirical study.
It may be hard to decide what infor-mation a statement about a group of people carries and whether the informa-tion reveals more about those who make the statement or those whom it describes. In the absence of a good methodology for the extraction of meaningful information from generalized statements about people, researchers are probably best advised for the time being to refrain from using such items unless they can clearly and convinc-ingly demonstrate by means of empirical analyses what the items actually measure. 16

The Elements of Culture ◆ 51
3.2.3. MENTAL SKILLS AND KNOWLEDGE
The elements of culture that can be studied in terms of self-reports or reports on oth-ers can involve significant subjectivity. If for some reason the respondents decide to mislead the researcher, they can do that easily by deliberately providing untrue answers. Persons who go to church once a week may state that they go every day or once a year. Persons who hate foreigners may state that they like them. In that sense, the answer can be an inflated or deflated report and a correct or distorted repre-sentation of the real state of affairs. The available evidence from decades of cross-cultural analysis of self-reports shows that this is rarely a significant problem, but the possibility that it can arise should never be disregarded.
When the object of study is mental skills or knowledge, the respondents cannot inflate their results; one cannot pretend that one is more intelligent than one really is by solving more IQ items than one’s general intelligence and knowledge permit. And because intelligence and knowledge tend to have positive connotations in most cultures, it is unlikely that many respon-dents would have an incentive to present themselves as more dull and ignorant than they really are by deliberately ignoring items that they can solve or by purpose-fully providing wrong answers. Therefore, studies of mental skills and knowledge are largely free of the potential subjectivity of self-reports and reports on others. Of course, they can be subjective in other ways, for instance, in terms of the choice of items in the battery that is administered to the respondents.
3.2.3.1. General Intelligence and Related Domains
General intelligence, also known as the “g factor,” is measured by means of various mental tasks collectively known as IQ tests. As general intelligence can be
defined in as many ways as culture, the readers are invited to consider what IQ tests represent instead of searching for a single best definition. What those tests have in common is that the respondents are presented with some seemingly dis-organized and meaningless bits of infor-mation and requested to see a pattern or make a prediction. 17 Some of the typical objections that one may hear from lay-persons, as well as some scholars, are “But why do exactly these tasks capture the nature of general intelligence?” and “Why not other tasks?” The answer to the first question is that “general intel-ligence” is a name of a specific scientific construct that may not and need not have anything to do with laypeople’s (or some researchers’) divergent concepts of how intelligence should be construed. From an operationalist perspective, the concept of general intelligence is derived from empirical measures and is not an arbi-trary abstract concept for which measures are sought. The second question is also easy to answer. Tasks like those in the well-validated IQ tests are given because precisely one’s performance on such tasks predicts a wide range of important per-sonal developments, including at least some part of one’s success or failure in any complex profession, one’s personal income, and various health-related out-comes, including longevity (Deary, Batty, & Gottfredson, 2005; Gottfredson & Deary, 2004): Better performers on stan-dardized IQ tests, whatever they measure, are more successful across a wide range of domains and live longer.
The best-known compilations of studies of results of intelligence tests from different nations and ethnic groups were collected by Lynn and Vanhanen (2002, 2006). There is an ongoing debate on the question of what the national IQs in the publica-tions by these authors measure: genetically determined mental skills, acquired mental skills, acquired school knowledge, or a combination of some or all of these. The debate is outside the scope of this book.

52 ◆ Understanding “Culture”
Closely related to measures of national IQs, both statistically and conceptually, are measures of national achievement in a wide range of school subjects, espe-cially in mathematics, but also in science and reading. Measures of such achieve-ment are regularly provided by two large international projects: TIMSS (Trends in International Mathematics and Science Study) and OECD PISA (Organisation for Economic Co-operation and Development Programme for International Student Assessment). The data from the most recent TIMSS studies can be viewed in Mullis, Martin, and Foy (2005, 2007). OECD PISA (2003) provides similar data. One important difference is that TIMSS compares same-grade students from vari-ous countries, whereas OECD PISA com-pares same-age students.
Studying the national differences in IQ and what TIMSS and OECD PISA measure is important because these indica-tors are strongly correlated with national religiousness and various cultural val-ues (Minkov, 2007, 2011), suicide rates (Voracek, 2004, 2006a, 2006b, 2009), as well as adolescent fertility, HIV, and murder rates (Minkov, 2011), to name just a few variables. Despite the theoretical controversies surrounding what IQ tests measure and whether they are meaning-ful within different cultural contexts, the implications of a nation’s average score on IQ tests, or in TIMSS and OEDC PISA rankings, are quite uncontroversial.
3.2.3.2. Perception Characteristics
Cross-cultural differences in perception characteristics have been measured by giv-ing the study participants visual percep-tion tasks of very different natures. Studies in this field have compared color percep-tion (Franklin, Clifford, Williamson, & Davies, 2005), perception of emotions (Masuda et al., 2008), context-dependent versus context-independent perception (Kitayama, Duffy, Kawamura, & Larsen, 2003; Miyamoto, Nisbett, & Masuda,
2006), susceptibility to optical illusions (Segall, Campbell, & Herskovits, 1963), and so forth. As many of these studies have evidenced cross-cultural differences in perception, Nisbett and Miyamoto (2005) argued that perception should not be regarded as consisting of processes that are universal across all people at all times.
3.2.4. COGNITIVE PATTERNS
There are cross-cultural studies in which the participants are asked to classify objects on the basis of perceived similari-ties between them. These are not necessar-ily studies of intelligence because they do not involve a right or wrong answer. They are also different from the studies of visual perception characteristics because they involve conscious decision making: The participants in the experiment are asked to use logical reasoning on the basis of subjectively chosen criteria. Studies of this type can reveal cultural differences in cog-nitive patterns. 18 Unfortunately, there are no large-scale cross-cultural studies using similar methods.
3.2.5. OBSERVABLE BEHAVIORS
There are many measurable observable behaviors that can be studied for the pur-pose of cross-cultural analysis. There are two main ways to obtain data for such studies: direct observations and national statistics.
3.2.5.1. Direct Observation of Behaviors
Probably the best-known large cross-cultural studies involving direct observa-tion of behaviors are those by Levine and Norenzayan (1999) and Levine , Noren-zayan, and Philbrick (2001), described in 9.6. and 9.7. In those studies, the research-ers observed the behaviors of people in public places in different cities around the

The Elements of Culture ◆ 53
world and recorded their observations. The national differences in the results from studies of this type can be expressed as percentages of people who have engaged in a particular behavior.
3.2.5.2. National Statistics
There are vast databases maintained by large international organizations, such as the United Nations, the World Bank, and the World Health Organization, that provide many national statistics, reflecting various behaviors: murder rates, suicide rates, adolescent fertility, road death tolls, consumption of cigarettes and alcohol, and many more. Since these often corre-late significantly with measures of other elements of culture, for example, val-ues, norms, beliefs, or mental skills and knowledge, they are an invaluable source of information to the student of cross-cultural differences.
Parker (1997) collected a vast amount of national statistics, including mineral, marine, and land resources, and stated that “across all areas of the book the sta-tistics provided should be seen as an initial attempt to describe national cultures along comparable and quantifiable dimensions” (p. vii). It is unlikely that many cross-cul-tural experts would see all these statistics as cultural variables. National statistics should be viewed as indications of cultural traits when they unmistakably measure human behaviors, such as murder, sui-cide, reckless driving and its consequences, or consumption of tobacco and alcohol. Marine resources, land resources, or cli-mate need not be viewed as part of culture, although they may have an influence on it.
3.2.6. STATISTICAL PRODUCTS
Important knowledge about cultural dif-ferences can be obtained not only by mea-suring the previously discussed elements of culture but also by means of analyz-ing various statistical products, such as
correlations between variables, standard deviations, response style indices, qual-ity of response indices, and more. These products might not be viewed as reflect-ing elements of culture but, for instance, as relationships between such elements. Whatever conceptualization we prefer, it is evident that something can be learned about cultural differences by comparing statistical products.
Hofstede (2001) used the correlation across individuals within 18 countries between their satisfaction with work goals and their overall satisfaction in the com-pany as a psychological measure. He con-sidered the rank correlation between this measure and the average rating of the importance of work goals as an indicator of work centrality (pp. 291–292).
Section 9.10. describes a study by Schimmack, Oishi, and Diener (2002) in which one of the key variables is actually a correlation between two variables. It reflects the degree to which frequencies of pleasant emotions are correlated with frequencies of unpleasant emotions within 38 nations. The strength of the correla-tion represents a national measure of the emotional dialecticism observed in each of those nations.
Smith (2004a, 2011) showed that mea-sures of response style could correlate with reported dimensions of national culture. In that sense, those measures of response style can be considered cultural indices.
Au (2000) calculated intracultural vari-ations within 42 countries in the World Values Survey and showed that a factor analysis of these variations revealed cul-tural differences.
Minkov (2009b) used Pew Research Center data to calculate a national social polarization index that reflects the degree to which respondents within the same country exhibit polarization in their answers to questions about important social issues. The index is closely cor-related with measures of national culture derived from values (see 9.23.). Also, Minkov (2011) showed that the national

54 ◆ Understanding “Culture”
standard deviations reported in the Big Five personality study by Schmitt et al. (2007) are highly and positively corre-lated with World Values Survey measures of life satisfaction. 19 National standard deviations in other studies may or may not replicate this finding but they are potential indices of dimensions of national culture.
3.2.7. WHAT ELSE CAN BE STUDIED BY CROSS-CULTURAL ANALYSTS?
This list of what cross-cultural researchers can study in order to understand cross-cultural differences is not exhaustive and the classification proposed here is not the only one possible. There are many other variables of interest. Some of them are interesting because they correlate with cultural measures, although they are not elements of culture per se. Examples are climate and prevalence of various patho-gens (pathogenic microorganisms and parasites). There are also variables that may be considered elements of culture, reflections of culture, or neither of the two. Some of the examples that come to mind are HIV rates and national wealth.
◆ Notes
1. Maseland and van Hoorn (2009) attempted to discredit the use of what they called “value surveys” using data from Project GLOBE according to which measures of values seem to be negative predictors of practices. Those authors reasoned that if this is so, ques-tions about values elicit what they call “mar-ginal preferences,” not values. This conclusion is based on a confusion of terms and concepts. GLOBE did not measure either personal values or actual practices but ideologies and subjective stereotypes (see 3.2.1.1., 3.2.1.2., and 3.2.2.3.); therefore, their data have no implication for the utility of measuring personal values. Hofstede’s (1980, 2001) value-based dimensions have been used countless times to predict various behaviors
at the ecological level. Minkov (2011) shows that his value-based dimensions of national culture have strong predictive properties with respect to speed of economic growth, national educational achievement, suicide rates, and many other objective indicators.
2. Roccas, Sagiv, Schwartz, and Knafo (2002) attempted to provide various theoretical distinctions between values and personal-ity traits. Yet, none of their distinctions are categorical.
Perhaps the clearest and most useful of their contrasts is one that is close to an operational-ist distinction, implying how traits and values should be measured: Traits describe what people are like, whereas values refer to what people consider important. Yet, consider the following real situation. The 2005–2008 wave of the World Values Survey has a series of 10 items (v80 through v89), using the following format: “Now I will briefly describe some peo-ple. Using this card, would you please indicate for each description whether that person is very much like you, like you, somewhat like you, not like you, or not at all like you? (Code one answer for each description).” As an example, let us consider the description of item v84: “It is important to this person to help the people nearby.” The possible answers are
1. Very much like me
2. Like me
3. Somewhat like me
4. A little like me
5. Not like me
6. Not at all like me
If a woman tells us that she is very much like somebody to whom it is important to help the people nearby, what does that reveal? What she is like or what she considers important? Is it one of her personality traits (a tendency to show a consistent pattern of feelings such as compassion, benevolence, etc.) or one of her values (a guiding principle in her life)?
3. Schwartz favors the development of alternative measures of values that do not depend on aggregation of individual responses,

The Elements of Culture ◆ 55
and suggests studying proverbs, laws, and popular books. In 3.1., I discussed how con-fusing it might be to analyze proverbs for the study of culture. The same applies to laws: They may have been borrowed from foreign societies or even imposed by them, while strongly clashing with the spirit of the local culture. And, at this stage of our knowledge, it is unclear how exactly popular books can be studied with the methods of positivist science so that they yield statistical information for cross-cultural comparisons. To name just one problem, a book that is popular in one country may be unheard of in another.
4. I vividly remember the first large pro-democracy rally in Bulgaria right after the fall of the totalitarian regime in November 1989. Some 50,000 people gathered in Sofia and listened to several speakers who described the personal freedoms that everybody could expect from that time on. The crowd cheered approvingly every 15 seconds. Then, the next speaker brought up the plight of the ethnic Turks whose Muslim names had been replaced with Bulgarian ones by the previous regime. He said that now the Turks would be free to call themselves what they wished. The loud cheers suddenly turned into deafening boos. What the crowd wanted was “democracy for myself, totalitarianism for the Turks.” In 1.4.4., an apparently similar situation is described: the democracy paradox in the Arab world and Pakistan. It appears that large segments of the populations of some of those countries are not ready at this stage to share with everybody the democracy that they want for themselves.
5. The earliest evidence of distinction between values and norms and ideologies, albeit in a different terminology, was provided by Hofstede (1980, 2001). He distinguished between “values as the desired” (personally embraced values) versus “values as the desirable” (norms and ideologies that one may or may not endorse personally but would like to have others follow). Although Hofstede used the term “values” in both cases, he stressed the point that these are potentially very different phenomena.
Some theoreticians concurred with Hofstede. In a treatise on the desired versus the desir-able, in Hofstede’s sense of the terms, Varga
(2009) indicated that the two have been seen as opposites. While the desired is personal and in a sense true, the desirable may be “cynical hypocrisy” (p. 131). Varga proposes a distinc-tion between the “desirable” and the “desired” that very much approximates the difference between norms and personal values proposed in this book: “The desirable simply brings in the norm, while the desired captures human wishes, independently of their correspondence to or deviation from the norm ” (p. 132).
Unfortunately, while some researchers have understood Hofstede’s desired-versus-desirable distinction, many others have not. The issue has been muddled further by the fact that Schwartz defines personal values as “desirable” goals. He does not confuse what this book calls “(personal) values” with what it calls “norms” and “ideologies” either conceptually or opera-tionally, but his choice of words may lead to such confusions by others who have read both Schwartz and Hofstede. The newly proposed terminology—“values” versus “ideologies” or “norms”—may set the record straight and avoid any further misunderstandings.
Hofstede (2001) also indicated that the term “norm” is used in different ways. One is the deontological or prescriptive sense that is endorsed in this book for the concept of norms and ideologies: These are what individuals say that people in general should do or be. But “norm” is often popularly used in the sense of a prevalent practice, as in “Rudeness in this company is the norm.” This does not mean that anybody expects rudeness from the employees; it reflects a perception of a commonly observed behavior. To avoid confusion in the academic literature, one can use phrases like “common practice” or “common behavior” in this case.
6. Because one of the items used by Hofstede asked the respondents if it was acceptable to break company rules, uncer-tainty avoidance is often mistakenly viewed as a measure of personal rule orientation: the degree to which people in a particular society value respect for company rules as a personal principle of behavior. GLOBE authors Sully de Luque and Javidan (2004) quote French scholar d’Iribarne as indicating that although (according to Hofstede’s uncertainty avoidance

56 ◆ Understanding “Culture”
measure) French people profess a higher rule orientation than Americans, the real situation is the opposite. They also quote Schramm-Nielsen, who, “contrary to expectations” (p. 627), found that French respondents did not report that they refrain from bending or breaking company rules, whereas the Danish respondents were more likely to actually obey the rules.
In fact, the rule orientation item in Hofstede’s (1980, 2001) work is about people’s ideology for others: how rule oriented those others should be. It does not say anything about the respondents’ own rule orientation because it does not ask them what is important to them in their own lives. When this is prop-erly understood, uncertainty avoidance can be expected to predict differences in the number or strictness of the rules that powers-that-be attempt to impose on their followers, but not at all whether people in different societies will actually embrace these rules. Further, whether a rule will be followed or not depends on its nature; this has nothing to do with Hofstede’s uncertainty avoidance.
7. Across nations, the correlation between religion as a personal value and religious faith as a desirable value for children exceeds .90** in the different World Values Survey studies, whereas the correlation between importance of leisure as a personal value and importance of hard work as a value for children approximates –.60**.
8. Other concepts of attitudes are also found in the literature. For example, Rokeach (1968) proposed that “an attitude is thus a package of beliefs consisting of interconnected assertions to the effect that certain things about a specific object or situation are true or false and other things about it are desirable or unde-sirable” (p. 16). This diffuse definition cannot be used to distinguish what this book calls atti-tudes (“I like hardworking people”) from what it calls beliefs (“I believe/agree that most people are hardworking”) and what it calls ideologies or norms (“People should work hard”).
Rokeach’s more detailed—yet purely theo-retical—explanations also fail to distinguish well between values and attitudes: “Finally,
a value, unlike an attitude, is a standard or yardstick to guide actions” (p. 16). It is not clear why a package of beliefs to the effect that something is undesirable (an attitude, accord-ing to Rokeach) cannot guide an action. If I believe that eating red meat is undesirable (for people in general, including myself) because it is unhealthy, I may have a negative attitude toward it and refrain from consuming it.
9. Personality and culture may be concep-tualized as different phenomena, but their oper-ationalizations are statistically correlated. An association between the two was sought in the 1950s by Inkeles and Levinson (1954/1969), and by Parsons et al. (1951/2001), who stated that “with the institutionalization of culture patterns in the social structure, the threefold reciprocal integration of personality, social sys-tem, and culture comes full circle” (p. 26). This association was not demonstrated empirically, however, until Hofstede and McCrae (2004) showed high correlations between cultural dimensions and personality traits aggregated to the national level. 10. If we accept this definition, some state-ments by 18th-century English philosopher David Hume (1742/1964) might be good examples of stereotypes: “The Chinese have the greatest uniformity of character imaginable” (p. 249) and “The English, of any people in the universe, have the least of a national character; unless this very singularity may pass for such” (p. 252). 11. Also, Allik et al. (2011) showed that the stereotypes concerning the existence of a special and unique “Russian soul” do not cor-respond to any reality. These stereotypes are propagated by Russian and foreign observers (mostly authors of literary fiction) who are sup-posedly knowledgeable about Russian culture and psychology, yet they are unsupported by evidence. 12. The highest percentages of respondents who report a lot of respect for human rights in their countries (results for the 1994–2003 period but mostly from 1997–2001) are in Vietnam (61.9%). With its 32.2% of respon-dents choosing the same answer, China sur-passes Luxemburg (30.0%), Canada (28.7%),

The Elements of Culture ◆ 57
Ireland (25.8%), the United States (16.5%), the United Kingdom (16.1%), Austria (15.1%), and France (8.1%). The Philippines and Tanzania also score higher than much of the Western world: 37.8% and 36.2%, respec-tively. Interestingly, there are enormous dis-crepancies between some countries with very similar cultures and political regimes: 45.5% in Denmark versus 13.6% in Sweden. Because the item asks the respondents to describe something that they cannot judge adequately, it produces a confusing picture. 13. Heine, Lehman, Peng, and Greenholtz (2002) explicitly stated a belief in stereotypes as valid measures of national culture and per-sonality. They criticized Schwartz’s dimensions for failing to conform to popular stereotypes. In their view, it is illogical that East Germany should have the third-highest score out of 38 countries on Schwartz’s affective autonomy scale, defined by the values “enjoying life,” “pleasure,” “exciting life,” and “varied life,” whereas Italy is the second lowest. Similarly, it seems strange that Chinese respondents endorse the value of “independence,” and other values associated with it, more than any other culture in the world. Heine et al. openly stated that Schwartz’s findings “differ from some commonly held stereotypes of these coun-tries” (p. 907), suggesting that this makes them implausible. However, they do not provide evi-dence that the commonly held stereotypes are more valid than Schwartz’s measures. In fact, Green, Deschamps, and Paez (2005) found that among 20 nations in Asia, Europe, South and North America, and the Middle East, the Chinese respondents had the highest score on “self-reliance” (see 9.19.), which can be viewed as a form of independence. Schwartz’s findings for China do not seem implausible. 14. The following examples are from Minkov (2011). According to World Values Survey data, only 28.7% of American respon-dents considered thrift an important value for their children in 1990. Thrift was clearly not a very prominent American value at that time, at least not “in the abstract” as Haviland put it. “Hard work” was selected by 48.5%, a very low figure by international
standards. Independence for children was cho-sen by 52.3% of Americans, a somewhat more respectable figure, yet low from an interna-tional perspective. Independence was selected by 64.5% of Japanese, 69.7% of Hungarians, 70.8% of Germans, 81.2% of Danes, and 84% of Chinese. 15. For the need to establish agreement, see Peterson and Castro (2006, p. 515). 16. The whole debate on stereotypes as valid or invalid indicators of cross-cultural dif-ferences started after the publication of Project GLOBE’s main book (House et al., 2004), and some of the issues associated with it began to take clear shape only after publication of the article by McCrae, Terracciano, Realo, and Allik (2008), showing that some of GLOBE’s “as-is” dimensions reflect national stereotypes that do not correspond much to reality. 17. Some examples of tasks that can be given in an IQ test are
Rotation: The respondent is asked to predict how a pictured object would look if rotated in space at a particular angle.
Picture completion: The respondent is asked to fill a gap in a picture with an appropriate element.
Series of numbers or objects: The respon-dent is asked to predict the next logical number or object in a series such as 1, 3, 5, 7, _____?
Relationships between words denoting objects: Sock to foot is the same as glove to _____?
Scrambled letters: The respondent is given a sequence of scrambled letters (such as FPERTCE) and asked to form a meaningful word with them (PERFECT).
18. For example, Uskul, Kitayama, and Nisbett (2008) gave Turkish farmers, herders, and fishermen pictures of various objects and asked them to group them on the basis of the similarities that they perceived. They found that

58 ◆ Understanding “Culture”
herders were more likely to form a glove-scarf pair than a glove-hand pair because the criterion that they relied on was that a glove and a scarf are both clothing items. Farmers more often classified the glove together with the hand. The criterion that they used was functionality.
19. Low national standard deviations in self-reported personality traits suggest cultural conformity. One of the effects of this pressure for conformity seems to be a lower life satisfac-tion (Minkov, 2011).

PART II
STUDYING CULTURE


◆ 61
There are many different kinds of research across societies with dissimilar cultures. They can be classified on the basis of a wide
spectrum of characteristics. The classification that this chapter provides is neither complete nor categorical. One could probably think of stud-ies that cannot be easily placed in any of the proposed categories. The purpose of this chapter is not to arrive at the best possible classification but to highlight some of the potential merits and pitfalls characterizing various approaches to the study of culture. Also, students of cross-cultural differences might use this classification as a source of ideas for their research.
4 TYPES OF CROSS-CULTURAL STUDIES Merits and Pitfalls

62 ◆ Studying Culture
◆ 4.1. Studies of Culture Versus Studies of Something Else
A study across societies may or may not be about culture. Economists compare societies on economic measures but are normally silent about their cultures even if what they measure has a clear cultural underpinning. For instance, a treatise on savings rates across nations by the World Bank Research Advisory Staff (1999) did not even mention the word CULTURE although cross-cultural experts have shown that national differences in thrift have a strong cultural component (Chinese Culture Connection, 1987; Hofstede, 2001; Minkov, 2011). Naturally, in this book we are only interested in studies that address cultural issues.
◆ 4.2. Qualitative Versus Quantitative Studies
With respect to their research methods, studies can be qualitative or quantitative. Those of the first type do not use math-ematics and statistical methods, unlike the studies in the second category.
A purely qualitative cross-cultural study consists of narratives, interpretations, and comparisons of what was observed in two or more societies. Because such descrip-tions are not based on numerical data and statistical analyses, but on sheer impres-sionism, they are scientifically unreliable as they do not allow a mathematical verification of hypotheses, which is the backbone of science. Different scholars can forever argue about their diverse sub-jective impressions and interpretations, justifying the Latin proverb, Quot capita, tot sententiae —“As many opinions as people.” 1
Karasz and Singelis (2009) wrote a treatise on qualitative and mixed methods
in cross-cultural psychology, noting the marginalization of these methods in psy-chology and their recent renaissance. According to these authors, the view that qualitative research is subjective is fiction. They refer to Lewis and Ozaki (2009) as an example of the way in which “qualita-tive methods can shed light on the specific ways culture shapes psychological vari-ables” (Karasz & Singelis, 2009, p. 913). Yet, that study is anything but objective science. 2
A lack of quantification can result in serious errors in estimates of cultural characteristics. If a study starts from such a shaky platform, even if it later uses some quantitative methods, its conclusions will be untrustworthy. A classic example of this is a study by Ralston et al. (2008)—a Decade Award–winning article published in the Journal of International Business Studies . 3
Of course, one should not suffer from the illusion that every conundrum in social science can be solved by means of a series of mathematical operations—the more sophisticated the better. Statisticians often criticize each other’s methods (for some examples, see Dow & Eff, 2009), and a more complex statistical analysis is not necessarily a better analysis. Further, a researcher can treat the same data with different statistical tools and obtain differ-ent results. The choice of a statistical tool is often highly subjective and defended through abstract theoretical reasoning. According to a cynical popular saying, if one tortures the data long enough, they will confess anything (see 8.4.8.4.). Yet, when a researcher reports a correlation or other statistics, readers can decide for themselves if these appear convincing or not.
◆ 4.3. Idiographic Versus Nomothetic Studies 4
An idiographic analysis will start from the idea that each society has its own

Types of Cross-Cultural Studies ◆ 63
cultural traits, so individual indeed that no common factor can be found across all, or at least most, societies. 5 Nomothetic analyses are based on the assumption that comparisons of large numbers of societies will reveal one or more common factors that operate across all of them despite any potential local peculiarities.
Idiographic analyses are often purely qualitative and interpretivist, which can make them scientifically unreliable. Nomotheticism does not guarantee reli-ability but since it normally uses quantifi-cation, it allows a check that is unavailable with the idiographic approach. 6
The idiographic approach sits well with the concept of culture as a system of meanings that are not necessarily shared across societies, which makes nomotheti-cism impossible. The study of culture is then reduced to an interpretation of culturally specific meanings, much like the acquisition of a foreign language in adulthood. An idiographic approach may also seem preferable to a nomothetic one if culture is viewed as a set of institutions that have different structures. As these are hard to quantify and compare across many societies, nomotheticism becomes impossible.
However, culture need not be viewed solely as a package of meanings or a set of institutions. This is the old view of classic anthropologists who would spend some time with a particular tribe, observe some phenomena that appeared strange to them, and attempt to make sense of them, most often in the absence of information about many other human populations. 7 Today, there are plentiful numerical data about modern nations and national regions that can be compared statistically, and the quantified predictions that these com-parisons allow can be verified or falsified through statistical methods.
If the study of culture, or anything else, were reduced to impressionistic, purely qualitative and idiographic interpretations with no statistical support from nomo-thetic comparisons, it would not differ
much from literary criticism. One author’s impressions and interpretations would not be shared by others and there would forever be disagreement on basic points. Scholars who prefer statistical nomothetic analyses are not immune to disagreement but not about straightforwardly quantifi-able and comparable facts. It is hard to reject the World Values Survey findings that, compared to the United States, Egypt has a higher percentage of people who say they view religion as very important, whereas the United States has a higher percentage of such people than China or Sweden.
Of course, every quantitative nomothetic comparison requires an interpretation that inevitably opens the door to subjectivism. It is impossible to be fully objective in social science; it is not physics, let alone mathematics. But it need not be stamp collecting either, to use Rutherford’s meta-phor. It is actually something in between. Neither sophisticated statistical compari-sons of many countries nor qualitative idiographic interpretivism are sufficient on their own to produce convincing findings with practical relevance. We need a com-bination of scientific methods, grounded in statistics, and some inevitably subjective interpretation to make sense of cultural diversity or any other complex phenom-enon in the so-called social sciences.
◆ 4.4. Insiders’ Versus Outsiders’ Studies
Cultures can be studied through first-hand experiences with them or from a distance, by collecting and analyzing data about them. According to Padilla (2002), the first of these methods is preferable because the insider has deep cultural knowledge and is able to use it to draw a more accurate understanding of the inter-play of culture and behavior. Haviland (1990) also defended the view that total
64 ◆ Studying Culture
immersion in a foreign culture is the pre-ferred method:
Whenever possible, the ethnologist becomes ethnographer by going to live among the people under study. By eat-ing their food, speaking their language, and personally experiencing their habits and customs, the ethnographer is able to understand a society’s way of life to a far greater extent than any nonpar-ticipant anthropologist ever could; one learns a culture best by learning how to behave acceptably oneself in the society in which one is doing fieldwork. (p. 13)
Yet Haviland (1990) quotes a very dif-ferent view as well, that of British anthro-pologist Edmund Leach:
Surprising though it may seem, field-work in a cultural context of which you already have intimate first-hand experi-ence seems to be much more difficult than fieldwork which is approached from the naive viewpoint of a total stranger. When anthropologists study facets of their own society their vision seems to become distorted by prejudices which derive from private rather than public experience. (p. 17)
If one can have a distorted vision of one’s own society through private experi-ences, as Edmund Leach believes, what will prevent a fieldworker’s vision of a foreign culture from getting distorted? No matter what we look at—the society where we grew up, a foreign society where we have spent 10 years, or a totally new society—our perception will be influenced by our mental software. There is no such thing as absolutely true perception, and we must simply learn to live with the fact that there exist different perspectives, none of which is necessarily best in an absolute sense. The only way to reduce subjectivity is to use numerical data for the purpose of verifiable predictions and allow others to inspect our work and sug-gest alternative approaches.
Firsthand experience with a foreign cul-ture is a good idea, especially if one adopts an idiographic approach. Yet, acquiring inti-mate knowledge of a foreign culture takes many years, and one cannot study more than a few societies in this way. A nomo-thetic approach to the study of cultural dif-ferences becomes impossible; one can only become an insider of a few cultures, which does not allow far-reaching conclusions.
◆ 4.5. Studies Comparing Variables Versus Studies Comparing Cases
With respect to what is studied, the pri-mary object of interest in a study can be variables or cases. An example of the first type of research is regression analysis, the goal of which is to explain the variance in a dependent variable through some indepen-dent variables that may hypothetically be in a cause-and-effect relationship with the dependent (see 8.4.8.). This kind of study may report that nations with higher suicide rates have higher average IQs (Voracek, 2009) without mentioning any nations.
The second type of research may be a comparison of the positions of some popu-lations on a given variable. The simplest and most commonly found version of this type of research is a comparison of the average scores of the individuals from one society with those of a few other societies. Such a study may reveal that American stu-dents on average have a more positive atti-tude toward personal pride than Chinese students (Stipek, 1998) or that Russian students tend to place greater value on per-sonal cleanliness than American students (Williams & Ispa, 1999). These findings are interesting and instructive. They can be used, for instance, by someone who relocates from one country to another: international managers, educators, military personnel, or even tourists.
Studies that compare the mean scores of a few populations cannot reveal what the

Types of Cross-Cultural Studies ◆ 65
observed societal differences are associated with; in other words, they do not make good studies of variables at the societal level and should not be confused with such studies. When only a few countries are compared, relationships between variables across countries cannot be established and can only be based on guesswork. As McCrae and Terracciano (2005) put it, the observed country differences in this case might be due to almost anything. If one compares only Japanese and French, the only safe conclu-sion might be that “the Japanese are differ-ent from the French because the Japanese are Japanese and the French are French” (Parker, 1997, p. 12). Unfortunately, there is an abundance of academic publications, including some by experienced researchers, that ignore this simple fact. 8 The only way to explain why some populations have dif-ferent average scores on a given variable is to carry out a nomothetic study at the societal level and across many societies. That study should show associations between the variable of interest and some explanatory variables at the societal (ecological) level (see 8.2.4. and 8.2.10.).
The following example explains why this is so. Imagine that we are studying two large samples of randomly selected American and Greek children. We find that richer children (from families with a higher socioeconomic status) from both the United States and Greece have higher school performance in mathematics than their poorer peers from the same country. If we also find that the American children have a higher average score in mathematics than the Greek chil-dren, we might be tempted to explain this as a result of the higher national wealth of the United States (since a randomly chosen large sample of Americans is likely to be richer on average than a corresponding sample of Greeks). But this conclusion would be flawed. To see why, it would be enough to study another large sample of randomly chosen children, this time from South Korea. Although we are likely to find an association between socioeconomic status and educational achievement also across the Korean children, it is almost
certain that they will have a higher average score in mathematics than the American children, even though South Korea and its average citizen are poorer than the United States and the average American citizen. There may be various reasons for this, for instance, a superior schooling system in South Korea that overrides the wealth dif-ference between the United States and South Korea. If we add more countries to our sample, we may find that schooling systems, or other societal factors unrelated to wealth, explain far more of the national variance in educational achievement than national wealth differences. Thus, there may be factors discernible only at the level of the whole society that explain societal differ-ences but not individual differences. Vice versa, factors that operate across individu-als and explain individual differences may lose much of their relevance and explana-tory power when societal differences are analyzed (see 8.2.4. and 8.2.10. for more detailed discussions of levels of analysis).
◆ 4.6. Structure-Oriented Versus Level-Oriented Studies
Structure-oriented studies examine rela-tionships between variables within soci-eties and then compare these structures across societies. Level-oriented studies examine differences in the scores that the cases of interest register on some variables (Leung, 2008). 9
◆ 4.7. Synchronic Versus Diachronic (or Longitudinal) Studies
In a synchronic study, the researchers analyze data from a single point in time—for example, statistics from a particular year. In a diachronic study (also known

66 ◆ Studying Culture
as “longitudinal”), the data come from different time periods and the research goal is usually to assess the magnitude of change in some variables over a certain period. These studies are relatively rare because longitudinal data are often hard to collect. 10
There is another variant of this dis-tinction: contemporary versus historical studies. In the first type, the research-ers’ goal is to find some current pattern without explaining its historical origin. In the second case, the researchers attempt to explain the historical origin of a par-ticular cultural phenomenon. 11 This is an old distinction, reflecting the antagonistic positions in the way that anthropologists approached culture: “functional” versus “historical” (Murdock, 1940, p. 368).
Speaking of contemporary versus histor-ical studies, evolutionary analyses can be an interesting hybrid of the two. Although they attempt to explain the historical origins of a particular phenomenon, they are not necessarily longitudinal in terms of the data they use. In fact, evolution-ists often take a functionalist perspective. They attempt to explain a contemporary phenomenon through its function—how a particular feature facilitates survival and reproduction—without necessarily tracing its development through time. 12
◆ 4.8. Deductive Versus Inductive Studies
With respect to the role of theory, stud-ies can be deductive or inductive. In the first case, the researcher starts from some theory and seeks empirical support for a hypothesis associated with it. In the second case, the empirical part comes first. Then, a theory can be developed to explain the findings. The relationship between theory and empiricism is an academic topic in its own right, and this book devotes a special chapter (5) to it.
◆ 4.9. Paper-and-Pencil Versus Observational Studies
Most large-scale cross-cultural projects for the study of national culture have relied on questionnaires. Respondents were given some questions and asked to provide answers to them; then the answers were analyzed statistically. These are often called “paper-and-pencil stud-ies.” They can be subdivided into studies of traits measured through descriptions and studies of abilities measured through tasks. In the first type, the respondents are asked to describe themselves or somebody else. In the second type, the respondents have to solve problems, such as items in an IQ test. 13
In observational studies, the partici-pants are not asked to describe anybody. Instead, their behaviors are observed and compared by the experimenters. These studies can be subdivided into those in which the participants know they are par-ticipating in a study and those in which they do not.
If the participants do not know they are participating in an experiment, the study can be one of two types: obtrusive or unobtrusive. In the first type, the research-ers act obtrusively in the sense that they manipulate the research situation. For instance, they can leave an object in a pub-lic place and observe people’s reactions to it. It is also possible for the researchers simply to observe the behaviors of indi-viduals in a public place without neces-sarily setting up a special situation for them. That would be an example of an unobtrusive study. In the cross-cultural field, observational studies usually com-pare representatives of a small number of nations, because it is a daunting task to orchestrate an experiment involving people from many countries. The studies by Robert Levine and his associates are a refreshing exception to that rule. 14
Types of Cross-Cultural Studies ◆ 67
Some social scientists are suspicious of the validity of paper-and-pencil studies in some environments. The following state-ment by Chambers (2008) is an illustration:
The misfit between the concepts of urban professionals and those of rural people is likely to be substantial, and the questions asked may construct arti-ficial chunks of “knowledge” which dis-tort or mutilate the reality which poor people experience. Nor are question-naire surveys on their own good ways of identifying causal relationships—a correlation alone tells us nothing definite about cause—or of exploring social relationships such as reciprocity, dependence, exploitation and so on. Their penetration is usually shallow, concentrating on what is measurable, answerable and acceptable as a ques-tion, rather than probing less tangible and more qualitative aspects of society. (p. 6)
Among social scientists, it is probably anthropologists who are most weary of questionnaire surveys. Goody and Watt (1963) pointed out that “man as animal is studied primarily by the zoologist, man as talking animal primarily by the anthro-pologist, and man as talking and writ-ing animal primarily by the sociologist” (p. 27). As anthropologists have studied primarily preliterate societies, they have rarely used questionnaires, despite the fact that the questions could be read to illiterate people. Still, some have used this method and obtained remarkably mean-ingful results: Edgerton (1974) discovered important cultural differences between African farmers and agriculturalists that belonged to the same ethnic group.
Because paper-and-pencil studies are extremely popular, a separate chapter of this book (7) devotes special attention to the main controversies associated with them. As we will see, there are many issues with such studies, but they are most often dif-ferent from those raised by Chambers.
Paper-and-pencil studies can be very deep and provide reliable information even about poorly educated societies, provided the questionnaires are carefully designed and an appropriate approach is found to the respondents.
Observational studies are not without their own issues. If the participants know that they are being watched, a Hawthorne effect may take place: The participants may not act in the way they would if they were not being watched. Leung and van de Vijver (2008) use the term “demand characteristics” (p. 151) to refer to what participants might think that the experi-menter expects; as a result, they may adjust their behavior to fit the expecta-tions. In sum, participants in an experi-ment may not act naturally.
It seems better to stage hidden camera–type experiments in which participants do not know they are being watched. This method may contain a Heisenberg effect, in that the observed behavior may seem different from different perspectives. Also, in a cross-cultural study, like the one by Levine et al. (2001), different experimenters in different locations may have staged the experiment differently, despite the training and instructions they had received. As a result, the data they collected may not be directly comparable.
◆ 4.10. Studies Using Primary Data Versus Studies Using Secondary Data
Some researchers collect their own data whereas others rely on data collected by others. Who has collected the data is not really an important question as long as they are reliable.
Fortunately, there is plenty of secondary data about nations available from various Internet sources. The World Values Survey, the United Nations Statistics Division, the United Nations Development Program, the

68 ◆ Studying Culture
World Health Organization, the World Bank, Transparency International, TIMSS (Trends in International Mathematics and Science Study), OECD PISA (Organisation for Economic Co-operation and Develop-ment Programme for International Study Assessment), and other nongovernmental organizations provide free access to a wide range of national indicators that can be used for cross-cultural analysis.
As stated in the introduction, one of the goals of this book is to provide a collection of valuable secondary data for hologeistic cultural comparisons. The third part of the book discusses a wide range of cross-cultural studies and provides cultural indi-ces that can be used for that purpose.
◆ 4.11. Studies Across Individuals First Versus Studies Directly Across Societies
Cross-cultural comparisons of societies can be done by studying individuals, con-structing dimensions at the individual level, and aggregating the individuals’ dimen-sion scores to the societal level. Another possible approach is to do the analysis directly at the societal level: Scores can be assigned to each society on each vari-able; then these societal indicators can be used to construct dimensions of national culture, build regression models, and so forth. 15
The two approaches may or may not lead to similar outcomes. 16 The various differences between the two approaches are examined in greater detail in 8.2.4. and 8.2.10.
■ Notes
1. American anthropologist Donald Brown offers several examples of famous
interpretivist analyses, based on mere impres-sions that have been challenged by other authors (Brown, 1991). One involves Margaret Mead and her well-known book Coming of Age in Samoa (1928), where—based on her short stay in Samoa—she argued that adoles-cence among Samoans was not as stressful a period as in the West. Derek Freeman, who did six years of fieldwork in Samoa, demonstrated that adolescence was just as stressful in Samoa as in the West.
Another example given by Brown is Bronislaw Malinowski’s Sex and Repression in Savage Society (1927), where he argued that the Oedipus complex was peculiar to so-called patriarchal societies and was absent from matrilineal ones. He had observed a different complex among the matrilineal Trobrianders: Boys were hostile toward their mother’s broth-ers rather than toward their fathers. Melford Spiro reanalyzed Malinowski’s voluminous data and argued, convincingly according to Brown, that the Oedipus complex did exist in the Trobriand Islands. What Brown does not mention is that the whole idea of an Oedipus complex is an example of pure interpretivism and impressionism.
Interpretivist analyses have also been employed in comparative studies for the pur-pose of classifying cultures. Ruth Benedict’s comparison of the Kwakiutl of western Canada, the Zuni of the southeastern United States, and the Dobuans of Melanesia is a good example of that. Based on the subjectively perceived tendencies of these peoples to display various psychological states, she classified their cultures as Dionysian, Apollonian, and para-noid (Benedict, 1959). Later, her approach was abandoned as “impressionistic and not suscep-tible to replication” (Haviland, 1990, p. 139).
2. Lewis and Ozaki (2009) studied the use of two emotional terms: Japanese amae and English mardy (used in some parts of the United Kingdom) and concluded that “it is not true to say that the human need to be indulged, loved, or looked after is only noticed, concep-tualized, and given a word in Japanese. Our results suggest that it is recognizable in both the cultures considered here” (p. 932). Further, they state that their data indicate that amae and

Types of Cross-Cultural Studies ◆ 69
mardy have similar precursors and stand for a similar experience. The only important differ-ence is that they differ in acceptability.
How are these conclusions arrived at? In the section on antecedent circumstances, we are told that “many” antecedent events are similar for both amae and mardy (Lewis & Ozaki, 2009, p. 924), without any quantifica-tion. So, what does “many” mean? Thirty-three percent? Sixty-seven? Ninety-nine? This is not indicated anywhere. In the section on subjective experience, we are told that feel-ings of guilt and embarrassment are “com-mon” in the description of amae and that the subjective experience of feeling mardy is “largely” unpleasant (p. 925). How common should something be to be considered common enough? And how unpleasant should an emo-tion be to be largely unpleasant? How can the intensity of anything be gauged and compared without a measurement system?
3. Ralston et al. (2008) attempted to estimate the impact of national culture and economic ideology on managerial work values by comparing the situation in the United States, Russia, Japan, and China. Apart from the fact that a comparison of four nations cannot reveal any credible cross-cultural pattern, that study is plagued by a basic methodological error: It assigns characteristics to the four countries on the basis of unsupported superficial impres-sions rather than quantitative studies. Thus, Figure 2 in the article places Russia and the United States in the same “Western culture” column, separate from China and Japan, which are in the “Eastern culture” column. A quick look at the Inglehart-Welzel cultural maps of the world (available on the World Values Survey website at www.worldvaluessurvey.com) show that Russia is culturally far closer to China than to the United States; there is no basis for classifying Russia with the United States and separating it from Japan and China. It is equally wrong to classify China as having a socialist ideology and contrast it with Japan, which supposedly has a capitalist ideology. Certainly, if Ralston and his colleagues had not relied on pure impressions but on nationally representative quantitative data, they might have classified the United States and China as
supporting a capitalist ideology versus Japan and Russia, where this support is considerably lower.
Item Q17 in the nationally representa-tive Pew Research Center (2003) survey asks respondents whether they agree with the state-ment, “Most people are better off in a mar-ket economy, even though some people are rich and some are poor.” In China, 70% of the respondents chose “completely agree” or “mostly agree.” In Japan, this combined per-centage was only 43. In the United States, it was 72%—far closer to the Chinese pattern than to the Japanese. The Russian result was 45%—far closer to the Japanese pattern than to the Chinese. In a replication of this study, the Pew Research Center (2007) obtained very similar differences between the four countries, except that support for a market economy had fallen slightly in all four.
Depending on how we decide to mea-sure ideology, diverse country configurations might emerge. For instance, item v116 in the 2005–2008 World Values Survey asks the respondents whether “Incomes should be made more equal” or “We need larger income dif-ferences as incentives.” Answers are given on a scale from 1 (complete agreement with the first option) to 10 (complete agreement with the second option). The four nations have the following mean scores: China—5.8; United States—6.1; Japan—6.1; Russia—6.4. Thus, the highest public support for social inequality is found in Russia.
4. The distinction between idiographic and nomothetic research was made by Wilhelm Windelband in late 19th-century Germany. The idiographic style was mainly found in dis-ciplines looking for unique configurations of events, conditions, or developments, whereas the nomothetic style was used mainly in the natural sciences searching for general laws (Lammers, 1976, p. 31). Note that the word idiographic is not associated with “idea” but with “idiot,” which in its original Greek form— idiotes —literally means a “simple” indi-vidual (as opposed to a magistrate).
5. Levine et al. (2001) provided an excel-lent example of diverse factors operating in dif-ferent countries. The researchers staged a series

70 ◆ Studying Culture
of experiments in 23 cities in 23 countries to study helping behavior with respect to strang-ers. Some of their experiments failed for a num-ber of different reasons. Below, the authors explain why it was impossible to obtain small change from strangers in a number of cities around the world:
In the asking-for-change experiment, we found that for reasons ranging from mon-etary inflation to pre-paid telephone cards, people in several cities could not understand the need for specific small-value coins. In some cities (e.g. Calcutta), there was a gen-eral shortage of small-value coins and bills, a problem that occurs throughout India dur-ing some festival seasons. In a few cities (e.g. San Salvador), people were afraid to trans-act money with strangers (p. 558, Note 1).
6. Preferences for idiographic versus nomothetic and qualitative versus quantita-tive analyses may create different schools of research. According to Leung and van de Vijver (2008), there is a difference between cultural psychology (focusing on the culture of a single society) and cross-cultural psychol-ogy (comparing two or more societies): The former deemphasizes prediction and focuses on the explanation of meanings. This is a typical ingredient of an idiographic analysis. Modern cross-cultural psychology relies strongly on quantified verifiable predictions, requiring nomotheticism. This is what makes it a positiv-ist science.
The two approaches have also created ideo-logical divisions among anthropologists. There are those who think that the search for com-mon factors with numerical expressions that can explain cross-cultural variance is a wrong-headed idea (Boas, 1896). Consequently, anthropology is an interpretivist humanity, not a science. This view has many followers (Mace & Pagel, 1994).
7. Murdock (1940) deplored this state of affairs in anthropology but declared that it was “premature to conclude that anthropology cannot be made a science” (p. 364). In his view, if quantitative data were available for a large number of cultures, they could be compared
and used to formulate scientific generaliza-tions. Murdock founded the Cross-Cultural Survey for that purpose, which developed into the Human Relations Area Files (http://www.yale.edu/hraf/). Consistent with the established tradition in anthropology of the first part of the 20th century, most of the data in that project are about preindustrial societies.
8. Stipek (1998) associated the pride, shame, and guilt-related differences that she observed between Chinese and American stu-dents with cultural collectivism versus indi-vidualism. Singelis et al. (1999) compared respondents from the U.S. mainland, Hawaii, and Hong Kong and found differences in self-construals and embarrassability; they also explained these as a function of cultural indi-vidualism versus collectivism. Fischer (2009) reported a number of studies of three nations whose authors had associated the observed dif-ferences with cultural dimensions such as col-lectivism versus individualism even though the scores of three nations can be statistically asso-ciated with almost everything. If more nations were added to the three in the initial sample, the statistical association across all of them can be entirely different than across the three.
9. Examples of the first type of study are those by Schwartz and Bardi (2001) and Schwartz and Sagiv (1995). Examples of the second type are those by Hofstede (1980), the Chinese Culture Connection (1987), Smith et al. (1996), and Minkov (2011).
10. Inglehart (2008) provides a good exam-ple of a longitudinal study in which the values of West European societies are compared from 1970 to 2006.
11. Examples of contemporary studies are some of those by Israeli cross-cultural psy-chologist Shalom Schwartz, well known for his work on the structure of values across human societies (Schwartz & Bardi, 2001; Schwartz et al., 2001; Schwartz & Sagiv, 1995). This type of work demonstrates that some values coexist in a particular cultural environment and form predictable structures but says noth-ing about the historical developments that have created them.
Interesting as they are, historical studies are relatively rare in modern culturology, let alone

Types of Cross-Cultural Studies ◆ 71
in cross-cultural psychology. Yet, some exam-ples are worth mentioning. Although Inglehart and Baker’s (2000) study does not focus closely on historical developments, it does provide evidence that shows how and why the world’s cultures may have evolved over a number of decades. Hofstede (2001) and Minkov (2011) also attempt some speculative historical expla-nations of cultural change.
12. For instance, evolutionary psycholo-gists Wilson, Daly, and Pound (2002) explain homicide as a fitness contest and present some cross-cultural data but do not trace homicide back in time. Evolutionary analyses have a long history in anthropology but are rare in cross-cultural studies of modern nations.
13. Examples of studies of personality traits across nations using self-descriptions include McCrae (2002) and McCrae and Terracciano (2005). The World Values Survey is an example of a project that asks the respondents to describe their values, beliefs, ideologies, attitudes, and various personal characteristics. Aggregate national indices based on studies of mental abili-ties (mathematical intelligence) were published by Lynn and Vanhanen (2002, 2006).
14. Levine et al. (2001) describe a series of obtrusive experiments in public places that were staged by the experimenters (see 9.7.). An example of an unobtrusive study is provided by Levine and Norenzayan (1999), who stud-ied the accuracy of public clocks, pedestrians’ speed of walking, and the speed of task execu-tion by postal clerks (see 9.6.).
15. An example of the first type of study (across individuals first) is Schmitt and Allik’s (2005) cross-cultural study of self-esteem. The studies by Hofstede (1980, 2001), the Chinese Culture Connection (1987), and proj-ect GLOBE (House et al., 2004) are examples of the second type: directly across countries.
The two approaches can be combined: The second can follow the first. McCrae (2002) started out with individual-level constructs reported in studies within nations and ethnic groups, which provided societal means for those constructs. Then he factor-analyzed the societal scores (see 9.13.).
16. The idea that studies comparing find-ings within populations may not produce the same results as studies comparing results across populations is by now at least half a century old. Based on research from the 1950s, Rokkan, Verba, Viet, and Almasy (1969) pres-ent “an argument against the mere replica-tion of conceptually identical experiments or measurement operations in different national populations” and an argument “ for the devel-opment of specifically cross-national designs: these would relate overall system variations or aggregate population differences of one sort or another to dependent variables of a sociologi-cal or social-psychological character” (p. 30). Among the many justifications of the second approach was the contention that it could reveal variation that could not be established within any national or cultural unit but only across a number of such units.

It is a capital mistake to theorize before one has data. Insensibly, one begins to twist facts to suit theories, instead of theories to suit facts.
—Sherlock Holmes (Doyle, 1892/1993, p. 8)
There is a major issue in cross-cultural analysis as in all social sci-ences: whether to prioritize theory or empiricism. There are diver-
gent views on this matter and the clash of opinions is old. Some 30 years ago, Rohner (1984) stated that the concept of culture was largely unex-amined theoretically. He identified a need for a theory of culture. On the other hand, Segall (1984) criticized the devotion of so many “armchair efforts” (p. 161) to determine what culture is or is supposed to be. He believed that researchers simply needed to concentrate on empirical studies.
The relationship between theory and empiricism and the question of which of the two should come first are important issues. Different per-spectives have resulted in disagreement, confusion, and various concerns that need to be addressed.
5 THEORETICAL VERSUS EMPIRICAL PERSPECTIVES
72 ◆

Theoretical Versus Empirical Perspectives ◆ 73
◆ 5.1. Theory Before
Empiricism
The practice of inventing theoretical constructs before any empirical work, and subsequently testing their validity, is known as a deductive approach. Project GLOBE is a good example (see 9.17.). Before the study, the researchers con-ceptually constructed nine dimensions, and research items were written for each dimension. Empirical surveys were then conducted and analyzed to confirm the existence of the preconceived dimensions.
The focus on theory before empiricism is old yet still strong in many academic quarters. Murdock (1940) stated that “by this procedure, the most effective of sci-entific methods, all logical or deductive operations are performed prior to the empirical test; there remain no fallible logical steps to be taken after the induc-tive labor is completed” (p. 369). Similar views have been expressed more recently. According to Fischer (2009), cross-cul-tural researchers need more theory-driven inquiries because “post-hoc interpretation of cross-cultural patterns at the country level face a real danger of overlooking and missing important cultural processes” (p. 29). Berry, Guillen, and Zhou (2010) stated that Schwartz’s dimensions have an advantage over Hofstede’s because the values that Schwartz studied were derived from theory. None of these authors explains convincingly why a theory-driven approach is infallible, why it cannot over-look and miss important cultural pro-cesses, and in what way an abstract theory is an advantage. Why would an armchair theory be more penetrating in its depth or more encompassing in its scope, or less fallible, than one formulated after the col-lection and analysis of a large data bank?
Inventing a theoretical construct in an empirical vacuum is in fact a danger-ous exercise, yet it is acceptable as long as the researchers are mindful of some
important issues. First, this approach cre-ates a danger of reification or a belief that a particular scientific concept can exist in reality without its measurement. However, concepts without measurements do not belong in positivist science but in philoso-phy or religion. That is why philosophers and theologians of different schools rarely reach agreement on anything. The same occurs in social science when concepts are not operationalized empirically. In the absence of an operationalization, an abstract debate on what a construct is about can last forever. Therefore, a scien-tific construct must always be operational-ized in terms of a specific set of variables through which it has been measured. 1
Unfortunately, reification is a wide-spread phenomenon in social science and psychology today. Once an unmeasured abstract concept has been given a name, many will tend to view it as something that has an objective existence outside the minds of those who are discussing it. Then, attempts will be made to improve its conceptualization and demonstrate that alternative ideas about the nature of this concept are flawed.
“Individualism versus collectivism” is a case in point. Starting from diverse ideas about what these terms should stand for, various researchers have produced diverse empirical measures that do not correlate with each other and consequently do not have anything in common except that they misleadingly bear the same label. 2 The concept of intelligence has fared in a simi-lar way, leading to never-ending debates and confusion about its nature and how it should be measured: “Intelligence test content of course is related to the particu-lar test developer’s concept of the nature of intelligence” (Klippel, 1975, p. 365). 3
When we have many uncorrelated mea-sures of what was expected to be a single construct, it is impractical to maintain the same label for all of them. We are not dealing with a ghost that morphs into dif-ferent shapes. We simply have observed dissimilar phenomena. But, in the case of

74 ◆ Studying Culture
individualism and collectivism, which of the various uncorrelated measures is the right one? This is like asking whether an elephant is somehow more correct or real than a rhinoceros. Still, it makes perfect sense to ask another question. If we have many proposed measures of individual-ism, do any of them resemble—both sta-tistically and conceptually—the original empirical measure of the construct that was first given that name? If we accept that Hofstede (1980) provided the first cross-cultural measure of that construct at the societal level, new measures that are strongly correlated with it reflect more or less the same construct; those that are not very closely associated with it are about something else. There is no patent system in social science, and Hofstede is not the only one allowed to use the label “indi-vidualism versus collectivism” just because he was the first one to provide a measure-ment of it at the national level. But it is simply confusing to use the same term for empirically unrelated constructs. 4
It is equally confusing to reify a con-struct by attempting to find a single best concept and definition of it and by search-ing for subsequent empirical proof that other concepts and definitions that go by the same name are wrong. This prac-tice is exemplified by Project GLOBE’s work (House et al., 2004). The research-ers of that project produced new, sup-posedly improved, conceptualizations of Hofstede’s dimensions and set out to measure them. They seemed to view Hofstede’s constructs like physical objects that have an independent existence. They criticized Hofstede for failing to discern their real form and proposed to come up with some improvement. They reflected on what real uncertainty avoidance and real long-term orientation (or future ori-entation) are actually about as opposed to Hofstede’s supposedly mistaken con-cepts. The GLOBE researchers believed that they had discovered how these objec-tive phenomena should be measured prop-erly. When they obtained measures that
differed from Hofstede’s, they did not conclude that they had measured some-thing unrelated to Hofstede’s dimensions. Instead, they proposed their measures as better versions of Hofstede’s because they were closer to the real thing.
The statistical evidence demonstrates that some of the supposedly improved GLOBE measures clearly address some-thing different from Hofstede’s. Claiming that GLOBE’s constructs are truer is like insisting that it is more correct to measure a person’s temperature than a person’s height. Once a particular construct has been validated empirically and given a label, it cannot be invalidated on the basis of somebody’s insistence that, for theoreti-cal reasons, the label should be used about another construct. 5
Hui and Triandis (1986) studied researchers’ concepts of individualism ver-sus collectivism. This research could be used for the construction of potentially useful questionnaires that measure various interesting phenomena. But even if most of the world’s researchers reached consen-sus on a single purely theoretical concept of individualism versus collectivism, it is still possible that a study starting from this consensus will result in empirically diverse and unrelated measures of what was expected to be a unitary measure.
Some researchers have extended the practice of asking scholars how they con-ceptualize various constructs by includ-ing laypeople in their canvassing efforts. Neisser et al. (1996) report studies of what people from different cultures understand by intelligence. This exercise is rooted in the idiographic-emic tradition that sees the study of culture as a search for meanings. It may reveal interesting aspects of some cultures, but the results cannot be used to invalidate the scientific, empirically derived concept of general intelligence. That would be like accepting ordinary people’s explanations of mental deficiency and replacing scientific concepts, such as Alzheimer’s disease, with theories of demons and black magic.

Theoretical Versus Empirical Perspectives ◆ 75
On the other hand, there is no need to insist that theory should never precede empirical work. In fact, researchers need to have at least some vague theoretical expectation of what their projects might reveal. Yet, researchers who start from an abstract theory should be ready to accept the unexpected results of the empirical study and revise their theory accordingly. 6
◆ 5.2. Empiricism Before Theory
Starting from a theoretical perspective is not the only way to do research. There is also an inductive approach: One can write a questionnaire, design an experi-ment, or collect secondary statistical data without a strict theoretical formulation of what might be found. Of course, some justification for the study must always be provided; one cannot choose items completely at random. But there is no absolute need to start from an elaborate theory. It is not illogical, for instance, to ask respondents to provide a wide range of self-descriptions of their own choosing and reduce them to a small number of dimensions that stand for personality traits, the usual way in which personality models are developed. One can also collect values and beliefs in this way and produce dimensions of culture; the Chinese Culture Connection (1987), Noorderhaven and Tidjani (2001), and others used this approach. An excellent example of this method is the study of social axioms at the individual and cul-tural level described in Leung et al. (2002) and Bond et al. (2004). It first produced empirical results, from which Leung and Bond (2008) later developed a theory. What is more, these authors proposed guidelines for what they called “decipher-ing” the meaning of culture-level con-structs and endowing empirical constructs
with meaning. In other words, these are guidelines for the construction of a theory on the basis of empirical results.
Many journal reviewers in the field of psychology and social science are wary of this approach. Some even disdainfully call it “a fishing trip.” According to Russian physicist Alexander Kitaigorodskii (quoted in Eysenck, 1979/2007, p. 8), “a first-rate theory predicts, a second-rate theory for-bids, and a third-rate theory explains after the event.” This discrimination against theories that are built around empirical data, however, is unjustified.
Hanges and Dickson (2004) mention several problems with empirically derived dimensions of culture (all quotes below are from their 2004 work, p. 123). All of these criticisms of the inductive approach warrant attention.
1. Hanges and Dickson believe that it is very difficult to determine the “actual construct” when it is measured by empiri-cally derived scales. It is unclear what is meant by an “actual construct,” as all constructs in social science and psychology are subjective combinations of ideas gener-ated by human minds and there is nothing “actual.” A construct does not become actual if it is defined in the absence of empirical data; quite to the contrary, it is completely fictitious. 7
It may also be helpful to add a note on the definition of construct validity as “the overarching principle of validity, referring to the extent to which a psychological [or other] measure in fact measures the concept it purports to measure” (Brown, 2006, p. 214). This definition is acceptable if what it means is that a measure needs to be highly associated with a previously established empirical benchmark. If no such benchmark is available (the concept is being measured for the first time), it can always claim benchmark status. In this case, theoretical attacks to the effect that a particular measure does not cap-ture the actual thing become irrelevant because nobody knows what the actual

76 ◆ Studying Culture
thing is: Abstract theories are not reality. We return to this point in 5.4.
2. According to Hanges and Dickson, empirically derived constructs create ambiguity: “It is very difficult to interpret the nomological network (i.e., pattern of empirical relationships) obtained with the scale.” In fact, the interpretation of any scale can be difficult or easy, regardless of how it was developed. The degree of difficulty does not depend on whether the scale was constructed before or after the collection of empirical data but on what it predicts and how close the interpretation of the predictions is to the cognitive sche-mas of the consumers of the cross-cultural analysis. If the interpretation is based on a theory that is too novel and difficult to digest, they will reject it regardless of the sequence of events: theory before empiri-cal work or empirical work before theo-retical interpretation.
3. According to Hanges and Dickson, when no theory precedes the empirical work, the obtained relationships might be due to the construct of interest or to unintended constructs also measured by the scale. The answer to this is that when the empirical collection of data and the statistical analysis precede the abstract interpretation, there does not need to be an intended construct. For example, the Chinese Culture Connection (1987) did not intend to find any specific constructs but nevertheless produced four meaningful and useful dimensions of national culture.
Hanges and Dickson’s statement also generates the impression that it is possible to create pure constructs in an empirical vacuum and then measure pure versions of these constructs without any undesirable contamination. This issue is addressed in one of the sections on factor analysis (8.2.8.5.2.), where it is argued that the idea of orthogonal factors rests on the view that the world is governed by pure and independent forces that operate on their own, without any interaction with
other forces. In fact, pure constructs—that are not associated with anything else—are impossible. If they were, they would be useless because they would not predict anything and would be of no practical consequence.
In the same vein, Hanges and Dickson believe that empirically derived constructs can result in “mislabeling of the underly-ing construct.” The view that seems to emerge here is that constructs can have correct or incorrect names. In fact, con-struct naming is an art, just like giving a title to a poem, and has nothing to do with science. Therefore, the name of a construct cannot be right or wrong; that is not something that can be determined with the methods of positivist science.
4. The fourth problem with empiri-cally derived scales in Hanges and Dickson’s view is that the properties of the scale can be unstable if the data set used to generate the scale is small. This is a valid point, but it has nothing to do with how the scale was developed, theoretically or empirically.
5. Finally, Hanges and Dickson believe that empirically derived scales have “an increased probability of lacking desir-able psychometric properties (e.g. they might be multidimensional and exhibit poor internal reliability).” Again, this problem is not associated with the way in which a scale has been developed. There are many examples of scales created theo-retically for a single construct that turn out to capture multidimensional phenom-ena (see 9.4., for instance, where Rotter’s (1966) “locus of control” is discussed).
In essence, there is no logical support for the view that theory must always precede empiricism. It is hard to imagine in what way Leung and Bond’s (2008) dynamic externality and societal cynicism dimensions would have been more con-vincing if theories about them had been developed before the empirical collection

Theoretical Versus Empirical Perspectives ◆ 77
and analysis of the data. In fact, as Leung and Bond point out, some associations that these dimensions reveal are not intui-tively clear; therefore, it is highly unlikely that any theoretician would have guessed them.
This defense of the inductive approach does not imply that it is always problem-free. The empirical results may or may not make sense. If common sense is enough to understand the discovered relationships, that is all for the better. But what if common sense fails? Consider the ques-tions that define Hofstede’s (2001, p. 150) uncertainty avoidance dimension:
a. Rule orientation: agreement with the statement “Company rules should not be broken—even when the employee thinks it is in the com-pany’s best interest” (B60)
b. Employment stability: employees’ statement that they intend to con-tinue with the company (1) for 2 years at the most, or (2) from 2 to 5 years; this, of course, taken with a negative sign (A43)
c. Stress, as expressed in the mean answer to the question “How often do you feel nervous or tense at work?” (A37)
What kind of common sense explains the positive societal correlations among these items? Why should societies where people experience higher levels of work stress also have a higher preference for unbendable rules? And why should their members be more likely to expect that they will work longer for their companies? These findings may seem completely coun-terintuitive. But that does not mean they are unacceptable. During the 1960s, the fallacy that if something defies common sense it cannot be true was vigorously exposed by Russian physicists Mikhail Wolkenstein and Alexander Kitaigorodskii (Kuznetsov, 2003). Common sense can be nonsense. Five centuries ago, it was
common sense to believe that the Sun rotated around the Earth. Common sense is simply a set of subjective cognitive sche-mas that are deeply entrenched in people’s psyches. We need those schemas to find our way around the world around us but overreliance on them is not good science. As Harris (1981) put it, “One point that anthropologists have always made is that aspects of social life which do not seem related to each other, actually are related” (p. 8).
Nevertheless, if some unexpected asso-ciations are consistently replicated, they must be explained so convincingly that eventually our common sense will be altered. This can be done by means of a good new theory. Its worth depends on how solid it is as a bridge between our existing common sense and the seemingly incomprehensible logic of the findings of the empirical studies.
Another potential problem with empiri-cally derived scales is that they are based on patterns of correlations: Whatever vari-ables turn out to be highly intercorrelated and form a tight statistical cluster could be viewed as defining a single dimension. Then, a subsequent collection of data may reveal new variables that correlate with the previous variables in such a way that the cluster needs to be split, if conventional statistical criteria are used, or significantly reshuffled. Following the statistical conventions, we may now have to accept the existence of two or more dimensions, none of which is very close to the one from the previous research. One can easily imagine that each round of data collection can hypothetically turn up new evidence; consequently, new dimensions may need to be constructed all the time.
There is only one corrective to this problem: the practical utility test. It is true that one can construct huge numbers of empirically derived dimensions (as well as a limitless number of theoretical ones). The question is which of them are practi-cally useful. There is a naturally operat-ing survival-of-the-fittest contest in social

78 ◆ Studying Culture
science: Only the most useful constructs remain; the rest are forgotten. This is the ultimate test and one that renders the sequence of the theoretical and empirical elements of the study irrelevant.
◆ 5.3. The Goal of Culturology and the Other Social Sciences: Theory or Empiricism?
Pepitone and Triandis (1987) stated that the essential task for scientific social psy-chology was “the construction, through empirical research, of theories of social behavior that are generally valid” (p. 474). This book defends a different philoso-phy: The main task of any social science should be the same as the goal of any science: the construction of empirically supported models for practical purposes. Medicine would not be of any use if it only presented theoretical constructs that could not be used to predict what would happen to a particular patient after a spe-cific treatment or without any treatment. Personality psychology would also be use-less if it could not predict behavior.
The main goal of modern hologeistic culturology should be to give its consum-ers models that enable them to make quantifiable predictions, the simplest of which can take the form, “If country A is characterized by cultural trait x, we can also expect it to exhibit trait y. ” Dressing prediction models in theory is acceptable and even necessary when common sense fails to identify any logic in the observed pattern of relationships. But theory should not exist for its own sake.
Neisser et al. (1996) describe a common view among intelligence experts according to which the results of IQ tests indicate a hierarchy of factors with g (general intel-ligence) at the apex. They report that there is no full agreement as to what g actually reflects. According to some, it is just a statistical regularity, while others view it
as some real ability. According to the phi-losophy of this book, abstract reasoning as to the nature of g, or any other construct that emerges from empirical work, may be intellectually stimulating, but discussions of this matter are far less important than determining the construct’s practical util-ity. If we know a person’s IQ or Big Five scores, can we use those numbers to pre-dict anything else about that person? For instance, is it safe to assume that this per-son will perform better in a particular job than most other applicants whose scores are different? If the answer is positive, we need not worry that there are abstract theoretical disagreements concerning the true nature of what IQ batteries or Big Five tests measure. It is enough to know that these measures have useful practical applications.
American psychologist Howard Gardner is well known for his theory of multiple intelligences (Gardner, 1983). However, 13 years after the main pub-lication of Gardner’s theory, Neisser et al. (1996) reported that the stability and validity of performance tests in the domains that Gardner proposed were not yet clear. Hypothesizing constructs in the absence of experimentation is fine, but if they cannot eventually be supported empirically, they should be abandoned. Abstract theories must not exist forever without an empirical underpinning.
A focus on theory, without empiri-cal research, can result in endless and fruitless debates. A question like “Which theory should we believe if the insider’s and the outsider’s theories are divergent or inconsistent?” (Ho, 1998, p. 90) can-not be answered theoretically. The answer depends on the amount of empirical sup-port that has been provided for each of the two theories, which is in fact the solution proposed by Ho (p. 93). If no empiri-cal support can be found for either of them, both types of theories are practically worthless. If both have been only partly supported by research, we should accept and reject neither but wait for further findings.

Theoretical Versus Empirical Perspectives ◆ 79
At a purely theoretical level, it is pos-sible to generate any combination of ideas, no matter how bizarre it may seem to some. It is also easy to defend contra-dicting arguments. For instance, Clark and Daly (2005) point out that although Schmitt (2005) sees a surplus of women as a potential generator of greater male com-petition for women (because some women will be unmated and attract competitors), it is equally possible to construct a theory according to which a scarcity of females will exacerbate male competition. Neither of these two theories is worth much unless it is backed by empirical evidence.
◆ 5.4. Defining Constructs Empirically
Because it seems impossible to reach con-sensus among experts on how we should understand the term “intelligence,” one proposed solution is to accept a purely empirical approach: Intelligence is what intelligence tests measure. This solution has been defined as a “half-joking, half-exasperated claim” (Boring, 1923, p. 35, quoted in Richardson, 2002, p. 284). In fact, it should be considered in absolute seriousness; it is not at all nonsensical (Eysenck, 1979/2007). 8 The only way to understand the construct of general intelligence—as proposed by Charles Spearman and subsequently developed by Raymond Cattell, Hans Eysenck, Arthur Jensen, and many others—and distinguish it from other constructs is to examine the tests that one should be able to solve to qualify for the term “intel-ligent” and then investigate their predic-tive properties. Other researchers may prefer to administer different tests that do not measure the same ability but yield results that can be used to build a differ-ent construct. In that case, to understand what they have measured, it is necessary to examine their tests and find out what they predict.
In the same vein, “culture,” “individu-alism versus collectivism,” “neuroticism,” and all constructs in social science and psychology must be defined precisely by the tools that measure them and by the various external phenomena that are sta-tistically associated with them. This is the only way to describe them objectively. The opposite—defining a concept without bas-ing the definition on an analysis of empirical measures—risks creating confusion. It con-tradicts the principles of positivist science in which the world is described in terms of observed relationships between measurable phenomena. Science is concerned only with what can be measured and the predictions that can be made and verified on the basis of those measurements. Everything else can be viewed as “stamp collecting,” as Ernest Rutherford put it.
What follows is that whenever we hear a term that denotes a construct in social science and psychology, we should ask how it was measured and how the con-struct relates to external measures of other complex constructs or simple variables. Only then can we form a correct opinion of what the construct is about. Critics of this view may argue that some items that define a construct statistically may not have face validity; therefore, they are inappropriate as an explanation for the construct. This point is addressed in the section on face validity (7.5.).
5.4.1. A NOTE ON OPERATIONALISM AS A METHOD OF DEFINING CONSTRUCTS IN CULTUROLOGY OR OTHER DOMAINS
As the present book adopts operational-ism as a method of scientific inquiry, this philosophy must be explained in greater detail. It has been defined as “the intu-ition that we do not know the meaning of a concept unless we have a method of measurement for it” (Chang, 2009). This “intuition” was accepted by leading scholars; Eysenck (1979/2007) stated that

80 ◆ Studying Culture
operational definitions—that is, the meth-ods that are used to measure a concept or construct—are a good way to define that concept. Below, responses are provided to some of the main criticisms of operation-alism, 9 summarized in an entry on that subject in the Stanford Encyclopedia of Philosophy (Chang, 2009):
“Operational definitions do not exhaust meaning.” True. Operational definitions are necessary, yet not quite sufficient to define a concept.
“Operationalism cannot be right because each scientific concept can be measured in different ways.” This is not a real criticism. If different measure-ments are statistically correlated and lead to the same construct, they simply provide an enriched understanding of that construct. Of course, a good theory may be necessary to explain why the different measurements tap the same construct. This illustrates the previous point: Operational definitions are nec-essary, yet insufficient.
“Operational definitions are not required for all useful concepts.” Not true. Even very basic and common concepts, such as “intelligence,” “indi-vidualism,” or “value” require, among other things, an operational definition in a scientific treatise. The reason that scholars have been involved in useless semantic battles about the meanings of these concepts for decades is precisely the fact that they do not resort to opera-tional definitions. For instance, Section 3.2.1.1. explains why the concepts of “values” and “personality traits” can-not be distinguished categorically with-out operationalizations.
“ It is actually unclear what types of things operations are and how they should be specified. ” There is no need for a precise and universally accepted definition of an operation because such
a definition may never be agreed upon. In social science and psychology, it is enough to provide the measurement tool, for instance, the questionnaire that was used to measure a particular construct.
To summarize, modern operationalism—the scientific philosophy of this book—can be viewed as a strategy for enhanc-ing the empirical content of scientific theories (Chang, 2009). Without such enhancement, theories can be woefully impractical.
On the other hand, operationalism does not need to subscribe to the view that a construct is nothing more than a set of operations. Saying that intelligence is what well-designed and properly validated IQ tests measure does not mean that they are some sort of prestidigitation that produces numbers out of nothing. They are tools that help us form subjective ideas about objectively observed phenomena, rooted in biology and social experience. To say that IQ tests produce nothing but mea-surement artifacts is like believing that measurements of blood pressure do not reflect anything real.
◆ 5.5. A Search for Truth Versus a Search for What Works
The position defended so far may remind the reader of the credo of American phi-losopher Richard Rorty, summarized in the following manner (Kay, 2007):
Rorty was a modern representative of the American pragmatic tradition, asso-ciated with John Dewey and William James. By claiming that philosophical distinctions mattered only if they made a difference to practice, Rorty distanced himself from recent analytic philoso-phy. What mattered to him was not the

Theoretical Versus Empirical Perspectives ◆ 81
search for what is true, but the search for what works. The test of a model, a way of thinking or a theory is not truth but usefulness.
This is also known as a philosophy of pragmatism, summarized by Karasz and Singelis (2009) as the idea that “what is ‘true’ is closely linked to the reality of what ‘works’” (p. 910). They also point out that in the context of research meth-odology a pragmatic perspective proposes that research methods and designs should be judged on the basis of what they can accomplish.
This does not mean that the word truth has absolutely no place in a scientific dis-cussion. For instance, it is true that the World Values Survey maintains a web-site in which it reports specific data for nearly 100 countries. It is also true that if a specific selection of such data were analyzed with specific statistical meth-ods, there would be specific results that would also be mathematically true. But the selection of the data for the analysis, the statistical tools, and the interpreta-tion of the results cannot be a matter of absolute truth; some choices may sim-ply be conventionally more acceptable than others. Other choices might also make sense and be practically acceptable because they provide a view from a dif-ferent angle. In that sense, there may be more than one truth.
A search for absolute truth may be a distraction from more pragmatic goals. Is it true that everything in the world consists of atoms? Is an atom really made up of a nucleus of protons and neutrons with some electrons circling around it? These questions may be philosophically stimulating, but the ultimate issue is dif-ferent: Can we harness nuclear energy for a useful practical purpose? If the existing nuclear physics models help us do that, we need not worry whether they are true in an abstract sense or not. The same applies to the models of social science and psychology.
■ Notes
1. As an example, consider the debate on the universality of male dominance. According to Brown (1991), this is a human universal. But as he acknowledged, this view has been challenged on the grounds that dominance is not a unitary phenomenon; that is, it is not a single dimension. Even in societies seemingly governed by men, there might still be spheres where women dominate. In this case, the con-troversy stems from the fact that the arguing parties have not defined the constituents of dominance and how they have been measured.
2. Ralston et al. (2008) believed that Schwartz’s power and achievement val-ues would stand for individualism whereas benevolence and universalism would stand for collectivism. Welzel’s (2010) empirical work, using nationally representative samples from 50 World Values Survey countries, showed exactly the opposite. Schwartz’s universalism and benevolence were embraced in the rich countries, whereas power and achievement were prominent in the developing world. This makes Ralston et al.’s individualism the oppo-site of Hofstede’s.
Another good illustration is Oyserman, Coon, and Kemmelmeier’s (2002) much-cited study, which includes a review of the literature on individualism and collectivism. The authors noted the broad and diffuse ways in which these concepts had been conceptualized and measured. But instead of concluding that different concepts may result in diverse empirical dimensions that have only one thing in common—their confus-ingly homonymous names—Oyserman et al. carried out a meta-analysis of a large number of discordant studies united under a misleading single theoretical heading: individualism and collectivism. Then, without any evidence that the numerous scales used in those studies were empirically equivalent, the authors compared Americans to the members of other nations on individualism and collectivism as if all those scales measured a single bipolar dimension or no more than two dimensions.
3. Nevertheless, many intelligence experts have reached agreement on how to measure

82 ◆ Studying Culture
one specific type of intelligence—general intel-ligence or the g factor (defined by the evi-dence of some specific empirical tests)—and have accepted that it is a single dimension with extremely important predictive properties (Arvey et al., 1994).
4. Triandis et al. (1993) set out to mea-sure collectivism across 10 countries. The items that they chose were based on abstract ideas of what collectivism is. The researchers performed several analyses, each of which yielded multiple factors. However, instead of concluding that they did not measure one dimension but many, this is what the authors stated: “Thus, it appears that the cultures are not ‘monolithically col-lectivist’ but there is substantial complexity in their tendencies toward collectivism” (p. 377). Elsewhere in the same publication, they use an even more confusing expression: “ . . . all three factors are aspects of individualism” (p. 375). This suggests the existence of a single abstract construct that has multiple unrelated personifi-cations. The scientific merit of such a position is dubious.
If the results in Triandis et al. (1993) reveal multiple factors, only one of them should be called collectivism, if that is a good name for it in the first place. The other ones reflect entirely different phenomena and should bear entirely different names so as to avoid confusion. The term “collectivism,” or any other term for that matter, should not be used as an umbrella over a wide spectrum of empirically unrelated dimensions only because they are related in some scholars’ minds.
5. There are many examples of unneces-sary theoretical attacks on empirically vali-dated constructs. For instance, Heine et al. (2002) found fault with Hofstede’s individu-alism dimension for various reasons, one of which is the observation that two specific items did not load highly on his individualism scale: “Work with people who cooperate well with one another” and “Have a good working relationship with your manager” (p. 906). The problem, in the view of Heine and associates, was that precisely these items, rather than the other ones in Hofstede’s operationalization of individualism, appear to more closely reflect the theoretical literature on individualism. This
position is based on the view that the truth is anchored in the theory. Even when the empiri-cal results do not support it, the theory should still be considered good: The problem is in the respondents’ minds and the data they create, not in what theoreticians have imagined with-out empirical support.
Likewise, Heine et al. (2008) claimed that national measures of self-reported Big Five con-scientiousness did not correlate convincingly with supposedly objective national measures of conscientiousness. Their conclusion was that “country-level self- and peer-report mea-sures of conscientiousness failed as markers of between-nation differences in personality” (p. 309, abstract). However this failure stemmed from the fact that Heine and associates started from a purely theoretical (and hence imagi-nary) conceptualization of what the measures of self-reported national conscientiousness reflect and what they should predict. An exami-nation of the predictive properties of national conscientiousness, for example, as measured by McCrae (2002), reveals that it produces correlations with World Values Survey mea-sures of religiousness (item v19 after 2004 and A040 before 2004) of up to .55**. Therefore, national conscientiousness does not measure what Heine and associates believe it should. It is among other things a measure of religious-ness and traditional values as conceptualized by Inglehart and Baker (2000). It is not about being conscientious in a Western sense but is most likely about being conscientious in a sense that is very important in religious societ-ies: observing rules of fasting, sexual conduct, respect for elders, and so forth. If that is the case, it is illogical to attack the construct from the perspective that it is not about what some-body’s Western theory says it should be about.
6. A good-practice example is Peter Smith’s analysis (Smith et al., 1996) of the database collected by Dutch management con-sultant Fons Trompenaars, who had con-ceptualized seven independent dimensions of national culture based on existing theories of U.S. anthropologists and sociologists. Smith’s statistical analysis produced a convincing two-dimensional model with an optional third dimension, and that was the solution that

Theoretical Versus Empirical Perspectives ◆ 83
the authors adopted rather than insisting on keeping all of Trompenaars’ purely theoretical dimensions (see 9.5.). This was a departure from Trompenaars’ abstract conceptualization but it was empirically more defendable than the initial theories that he had espoused.
Ronald Inglehart’s cross-cultural analysis (Inglehart, 1997; Inglehart & Baker, 2000) is also a good example. Although the design of the World Values Survey was based on vari-ous theories, such as intergenerational value change, Inglehart (1997) implicitly defended induction by stating that the exact nature of the linkages among values, economics, and politics was “an empirical question, rather than some-thing to be decided a priori” (p. 4).
7. An example that comes to mind is Gelfand et al.’s (2006) theory of tightness-looseness. On purely theoretical grounds, these authors stated that tightness-looseness is not the same as individualism versus collectivism or Hofstede’s uncertainty avoidance. We are also told that “tightness-looseness consists of the strength of social norms (number and clar-ity) and the strength of sanctioning (tolerance for deviance of norms)” (p. 1227). Do these claims, made in the absence of any empirical evidence, capture the “actual construct”? And
what is “actual” about it except the fact that it exists in the minds of its creators?
Hofstede, Hofstede, and Minkov (2010) operationalized tightness-looseness as a sixth Hofstede dimension, called “indulgence versus restraint.” If one starts from purely theoretical platforms, countless other operationalizations are possible that may or may not be correlated with this sixth dimension.
8. Sternberg (2007) criticized this view: “This definition, unfortunately, is circular, because, according to it, the nature of intel-ligence determines what is tested, but what is tested must necessarily be determined by the nature of intelligence” (p. 548). In fact, the definition implies nothing of the sort; the cir-cularity is created by Sternberg. If intelligence is what intelligence tests test, intelligence tests define the nature of intelligence. What is tested is not defined by the nature of intelligence but by what it is practically useful to test—an entirely empirical issue.
9. It is noteworthy that operationalism was pronounced “dead” by Geertz (1973), a prominent follower of the idiographic- interpretivist school that is detached from the principles of positivist science emphasizing prediction.

Quantitative nomothetic comparisons of cultures inevitably bring up the question of whether the compared phenomena are comparable
in the first place. If the answer is negative, the whole idea of carrying out a comparative study would be compromised. This chapter discusses the comparability of cultural phenomena from various theoretical and practical perspectives.
6 CROSS-CULTURAL COMPARABILITY
84 ◆

Cross-Cultural Comparability ◆ 85
◆ 6.1. Etic Versus Emic Approaches
The terms “etic” and “emic” are derived from Pike’s (1967) work in linguistics. They have become popular in the literature on culture, yet their usage is not strictly defined. “Etic” can refer to an outside perspective, whereas “emic” implies an understanding of a particular culture on its own terms (Morris, Leung, Ames, & Lickel, 1999). But another distinction is also possible: “Etic” can designate uni-versals, whereas “emic” is associated with specifics that are observed only in some environments. 1 In essence, the etic-emic distinction often parallels the difference between nomothetic and idiographic in the sense that the etic approach is usually used in nomothetic studies looking for regulari-ties across cultures, whereas emic methods might appeal to researchers who prefer an idiographic focus on a single culture, seen as unique and incomparable.
If researchers view a phenomenon as etic, they can create a standard tool for its measurement across many different societies. The authors of such tools often start from their subjective cultural views of what is important and meaningful, dis-regarding local interests. Respondents sim-ply have to “cut their feet to fit the shoe” (Chinese Culture Connection, 1987, p. 145). For an illustration, Leung and Bond (1989) suspected that individualism versus collectivism is an etic dimension, meaning that it can be replicated both in compari-sons of various nations and in studies of individuals inside nations.
The emic approach is more popular, and easier to apply, within the tradition that sees culture as a set of meanings and emphasizes interpretivism. Since meanings and their relationships differ from one society to another, they are best stud-ied emically—by focusing on one society at a time and interpreting the observed specificities.
There is an old and persistent divide between scholars who prefer an etic or emic approach (Morris et al., 1999), 2 although some have proposed a sort of reconciliation of the two (Berry, 1990; Morris et al., 1999). The debate about the general intelligence construct, also known as the g factor , is a classic exam-ple of the clash between the etic and emic philosophies. Lynn and Vanhanen (2002, 2006) have published general intel-ligence indices (IQ scores) for most of the world’s nations. Some experts (Ceci, 1996; Sternberg, 2002), however, have chal-lenged the view that general intelligence is a universally valid construct. The meaning of “smart” may not be the same in all soci-eties. As a result, the different concepts of smartness may not be comparable.
The meaningfulness of other Western constructs outside the West has also been questioned. Ho (1998) stated that much of Western psychology may be irrelevant or inapplicable in Asia, and that Western ideological presuppositions, such as indi-vidualism, are alien to the Asian ethos. He also expressed political objections to the idea of universally valid science, originat-ing in the West:
Thus, a reliance on Western psychology can only lead to an incomplete, even distorted, understanding of Asia and Asians. Moreover, the wholesale impor-tation of Western psychology into Asia represents a form of cultural imperial-ism that perpetuates the colonization of the mind. To an alarming degree, Asians are now confronted by stereo-types about themselves generated not only by Western researchers but also by Asian researchers relying on imported, mainly American, psychology. (p. 89)
Ho is concerned that Western mea-surement tools are developed etically; therefore, they are used unethically. But mixing science with ideology and politics is not good scientific practice. Whether

86 ◆ Studying Culture
a Western tool can be used to study other cultures or not depends entirely on its capacity to generate verifiable pre-dictions. It absolutely does not matter what indigenous populations think of that tool and the constructs that it measures: whether they understand them or not and whether they prefer other constructs. If the imported tools and constructs per-form well in the local environment, they are not different from a thermometer and the concept of body temperature. Some peoples may find these imports alien and unintelligible, but that does not mean that their body temperature cannot be measured with a Western thermometer or that the measurements cannot be used to diagnose them.
Not everything is easy to study etically and nomothetically. Various social or psy-chological structures are hard to compare in their entirety across many societies. Institutions are one such example. 3 There are also many psychological syndromes that are found in some societies but not in others. 4
Yet, cross-cultural comparisons need not be about structures. It may be hard to compare 100 different houses, each having a very different interior design and external architecture. But one can think of universally shared aspects of those houses, measurable as single variables, such as total floor surface, proportion of window to wall surface, market price, and so forth. If one can show that some of these simple measures predict each other across the 100 houses—for instance, mar-ket price correlates positively with total floor surface—they become useful; never mind that, seen as whole entities, the 100 houses do not seem to have anything in common at first glance.
For the purpose of comparing societ-ies, institutions can be broken down to basic components that are expressed as single numerical variables with nation-level scores. Then, these variables—rather than the complex culture-specific patterns that they form—can be analyzed at the
societal level. Thus, instead of study-ing the structures of modern parliaments, which may indeed be difficult to compare meaningfully across the world, one can calculate the percentage of seats that are held by women. The result would be a variable on which all modern nations can be compared. If this variable correlates with other conceptually similar variables, these could produce a complex measure of something related to gender equality, and a score could be assigned to all nations for the purpose of a quantitative comparison. 5
Likewise, even if it can be shown that a particular concept has somewhat dif-ferent meanings in different societies, that finding will not immediately invalidate the society-level measures associated with that concept. Suppose that we study the meaning of shame through a correlation analysis and discover important cultural differences: In some cultures, it is associ-ated with humiliation and a loss of face, whereas in other cultures it tends to be related to modesty. This conceptual divergence may not be a problem for a cross-cultural study designed for the pur-pose of discovering the implications of the observed cultural differences in shame. The study may find that if shame is mea-sured as a value (importance of having a sense of shame), cultures with higher scores are also cultures with a more posi-tive attitude toward shame, whereas those with lower scores have a negative attitude. The study may also discover that the first type of cultures have higher average school achievement in mathematics and science than the second type. These results would be interesting and worth reporting, despite (or precisely because of) the nuances in the meaning of shame across cultures. 6
Parker (1997) identified another simi-lar issue: A direct comparison of caloric intake across all countries of the world may not make much sense, as different populations do not have the same thermo-regulatory needs. In other words, they dif-fer in terms of the utility that they derive from calories. But this does not necessarily

Cross-Cultural Comparability ◆ 87
make a cross-cultural comparison point-less. The English may drink alcohol mostly for pleasure, whereas Russians may seek solace in it. Yet, if one can show a correla-tion between alcohol consumption rates and suicide rates across nations, and if the correlation withstands plausible statistical controls, the cross-cultural comparison is useful. The factors that drive alcohol consumption, or the meaning and utility of drinking, may differ across nations, but that does not invalidate a cross-cultural study showing that some of the consequences of drinking have a universal element.
Boas (1896) noted that because a seem-ingly unitarian phenomenon may have different origins in different societies, correlations between two traits do not always indicate the operation of the same process. According to Chrisomalis (2006), Boas seems to have believed that even striking cross-cultural similarities have developed in each case in a completely unique manner (p. 379). Of course, any correlation, such as the one between alcohol consumption and suicide rates, could theoretically be spurious. Yet, more often than not, strong associations that withstand plausible controls suggest a common factor. If this logic is rejected, one might just as well accept the view that there are no regularities of any kind in the world and all events are completely unpredictable.
◆ 6.2. Incomparable Phenomena
The previous section defended the view that seemingly culture-specific incompa-rable phenomena may in fact be compa-rable. Yet, that is not always the case.
Transparency International is an orga-nization that publishes a transparency versus corruption index for most of the world’s countries. This makes sense for
modern nations, but studying corruption in a society without a government, such as a tribe of hunter-gatherers, would be meaningless. Evidently, one cannot com-pare all societies in terms of corruption.
Peng, Peterson, and Shyi (1991, p. 98) discuss various types of equivalence that may need to be considered in cross-cul-tural comparisons of management. They speak of functional equivalence and define it as the existence of similar activities that have similar functions in different cultural settings. 7 They define conceptual equiva-lence as the existence of similar activities with similar meanings in different settings. Establishing the existence of equivalence in this sense may be essential in some stud-ies. One cannot do a cross-cultural study of the values of accountants if their profes-sion does not exist in some of the societies that will be studied.
The lesson from this is that before choosing items for a cross-cultural analy-sis, researchers should always consider the possibility that some of them may have no meaning in some societies. This was understood by some authors (for example, Child, 1981) even before the emergence of any of the large-scale questionnaire-based cross-cultural analyses that are discussed in the third part of this book.
◆ 6.3. Criteria for the Cross-Cultural Transferability of Etic Individual-Level Constructs and the Instruments for Their Measurement
Although culturology is not a science or art that compares individuals from differ-ent societies, it is necessary to dwell briefly on some of the issues that are inherent to that domain, as many cross-cultural studies are done at the individual level. Despite their being outside the parameters

88 ◆ Studying Culture
of culturology, they can be informative to culturologists and warrant their attention.
An etic instrument for the study of indi-viduals that was developed in one cultural environment is usable in another culture and can serve the purpose of cross-cultural comparisons if it satisfies some condi-tions. First, the stimuli should be properly understood by the participants; it does not make sense to ask people to provide self-reports if they do not comprehend the questions. If the instrument measures mental abilities, the participants should be familiar with the format of the items. We are reminded of Berry’s (1990) recom-mendations for successful export of etic constructs, which involves elimination of items that are meaningless in a particular culture.
Second, etic instruments, such as psy-chometric tests, can be used to study indi-viduals across cultures if they are free of cultural item bias. 8
Fischer (2009) discussed two types of bias in cross-cultural research: uniform and nonuniform. The examples that he provides suggest that the first type refers to cases when an item can be used to measure a construct in different cultures, but because of a culture-specific factor some societies may have higher means. For example, mathematical problems can be used to measure intelligence or edu-cational achievement in all societies, but those that provide schooling would sys-tematically score higher than societies without schools. 9 The second type of bias identified by Fischer (2009) refers to items that cannot be used in some cultures because they refer to phenomena that do not exist there, an issue that was discussed in the previous section.
How to detect and eliminate item bias and ensure cross-cultural transferability of individual-level research instruments is an important topic in many methodological publications, for instance, van de Vijver and Poortinga (1982), Paunonen and Ashton (1998), van de Vijver and Leung (1997a), and van de Vijver (2011). In a
nutshell, if a study compares individuals from different societies, researchers should demonstrate that their instruments can be used in the same way in each of those societies. Unfortunately, the voluminous literature on detection and correction of item bias or differential item functioning (DIF) is characterized by such high com-plexity that it has produced frustration in some quarters; so much so that statistical research on DIF has been pronounced dead or nearly dying (Zumbo, 2007). There are various theoretical approaches to DIF as well, yet abstract theories have a notorious tendency to fail when they are used as solutions to practical problems. More precisely, specifying a priori what theoretical construct should be measured and what undesirable constructs should be partialed out of it so as to avoid contami-nation is a potentially dangerous exercise that is discussed in 5.1.
Nevertheless, there are some simple criteria that need to be satisfied as a minimum to ensure cross-cultural trans-ferability of research instruments for the comparison of individuals between dif-ferent societies. These are discussed by Paunonen and Ashton (1998):
1. Invariant pattern of correlations between items and invariant factor struc-tures. For instance, if in the original culture where the test was developed an item that measures depression correlates negatively with an item that measures happiness, the same correlation should materialize when the items are used in a new culture. 10
2. Similar predictive properties with respect to external variables. For example, if a neuroticism test predicts higher con-sumption of tobacco or alcohol, or both, in the culture where it was developed, it should predict the same in the new culture where it is administered.
Let us once again consider Western tests of general intelligence. If one objects

Cross-Cultural Comparability ◆ 89
to their administration outside Western countries, one should first of all show that there are societies in which Western IQ tests do not produce the same pattern of intercorrelated items as in the Western cul-tures for which they were originally devel-oped. Even more important, it should be demonstrated that when the same Western IQ test is administered in different soci-eties, the results do not have the same predictive powers with respect to external variables. If these conditions were met, the universal utility of the IQ test would be compromised.
If an IQ test works in many different societies, it would not be compromised by scholars who do not like what the test is called or by their objections to the effect that its label should be reserved for something else. This is a matter of linguistic usage, not of social or psycho-logical science. In fact, many studies have shown that appropriately designed IQ tests work well for various non-Western populations. 11
So far, we discussed the transferability of constructs from one society to another in order to study individuals in those societies. Let us suppose that we have established cross-cultural transferability. Does this ensure cross-cultural compa-rability? If the same IQ test works well within the United States and within Ghana (as it reveals the same cognitive patterns and has the same predictive properties for Americans and Ghanaians), can we use it not only to compare Americans with Americans or Ghanaians with Ghanaians, but also Americans with Ghanaians?
The answer is positive as long as we do not misinterpret what the test reveals. If we find a statistically significant difference between the means of the Americans and the Ghanaians, we do not have evidence of the origin and nature of this difference; we do not know if it can be ascribed to genetic, socioeconomic, or cultural fac-tors, or some combination of them. But we can use such test evidence to predict other differences between groups; for instance,
the average school performance in math-ematics of their societies and a variety of other variables. 12
◆ 6.4. Criteria for the Applicability of Etic Approaches to Studies at the Societal Level
When the units of the study are societ-ies, not individuals, there is no need to show factor invariance across individu-als. Etically selected items, for instance, by American or Chinese researchers, can be used to study cultural variation across nations or other groups of people if they simply lead to important, interesting, and comprehensible predictions across groups of people.
This view will probably be challenged by some scholars, for example, classic anthropologists, who advocate fieldwork to understand a foreign culture. According to Robert Chambers, surveys created out-side a particular culture create a danger because they can “embody the concepts and categories of outsiders rather than those of rural people, and thus impose meanings on the social reality” (quoted in Haviland, 1990, p. 21). However, cross-cultural research involves some ethno-centrism by default. According to Taft (1976), the very act of engaging in such research implies an imposition of the researchers’ values into the transaction with their subjects. If the researchers wish to go through with that exercise, an ele-ment of unavoidable ethnocentrism must be accepted.
In principle, there is no problem with imposing a meaning on a social reality different from one’s own as long as one recognizes the possibility that another meaning may also exist. But even more important than the search for meanings is a search for patterns that allow predict-ability. If, for example, we have discovered

90 ◆ Studying Culture
that, for whatever reason, in most societies people with higher IQs tend to live longer, that would be an interesting and useful discovery, regardless of the social meaning that anybody attaches to the concepts of IQ or longevity.
◆ 6.5. Are Etic Tests Preferable to Emic Ones?
To compare the quality of etic and emic tests, we need to have some criteria. A better instrument is one that has better predictive properties. Two aspects need to be considered here:
1. What important and interesting external variables are associated with the results that the instrument produces?
2. How strong are the predictions?
Depending on the answers to these questions, etic instruments may be pro-nounced superior to emic ones, or the other way around. 13
■ Notes
1. Although Peterson and Pike (2002) did not recommend this usage, they also stated that taking too restrictive a view of the concepts and requiring too much equivalence between their adaptations for different purposes can work against constructively improving social science (p. 14).
2. In the psychology literature, the phi-losophy according to which cross-cultural comparisons are inappropriate is known as “essentialism” (van de Vijver, Chasiotis, & Breugelmans, 2011). Its most famous pro-ponents were Franz Boas and the Boasian anthropologists who concluded that there were few interesting cross-cultural regularities to be found. Boas’s (1896) paper on the limitations
of cross-cultural anthropological analysis has been seen as a disaster for the comparative method (Chrisomalis, 2006).
3. Adler (1983) points out that accord-ing to some researchers comparing institu-tions across cultures is a false enterprise. This is known as the “Malinovskian dilemma” (Berry, 1969, p. 120), after Polish anthropolo-gist Bronislaw Malinowski, who introduced functionalism in anthropology in the 1920s. Functionalism stresses the purposive and emic nature of institutions in society. As the purpose is derived from a society’s culture, which is a unique whole, institutions are emic phenomena that can only be understood in terms of the cul-tures in which they have arisen. Consequently, functional equivalence cannot be assumed, nor proven.
4. Van de Vijver (2011) describes a phe-nomenon known as “amok,” a form of violent behavior occurring in Malaysia and Indonesia, and points out that “violent behavior among men is universal but the combination of trigger-ing, events, symptoms and lack of recollection is culture-specific” (p. 238). The cultural speci-ficity of this combination makes it seem unsuit-able for etic and nomothetic cross-cultural comparisons.
5. There are various situations in which seemingly emic phenomena may in fact be com-parable. According to van de Vijver and Leung (1997a), local informants in different cultures may provide widely divergent descriptions of shame-inducing situations. Based on those situ-ations, it may seem impossible to develop an instrument that contains identical stimuli for measuring shame. Yet, this example seems to confuse shame as a feeling with the factors that cause it. What makes people ashamed may be culture dependent, but the nature of the feeling may still be quite universal. For example, shame may be associated with blushing and avoidance of eye contact in all societies of interest.
6. This hypothetical example may actu-ally reflect the findings of the Chinese Culture Connection (1987) and Hofstede (2001), who discuss a national dimension of culture, under-pinned by the importance of shame (among other items), which is a positive predictor of educational achievement (see 9.2.).

Cross-Cultural Comparability ◆ 91
7. Note that “functional equivalence” can be defined differently, for instance, as “a spe-cific type of structural equivalence [that] refers to identity of nomological networks” (van de Vijver, 2011, p. 239). In other words, if two constructs—for instance, two personality dimensions—are functionally equivalent in two societies, they have the same predictive proper-ties within each of these two societies.
8. In general, item bias, also known as differential item functioning (DIF), is the prop-erty of an item to measure something different from the construct of interest. For instance, if one wishes to measure general intelligence as a fluid ability to process information and reason logically, not as crystallized knowledge, an item that asks when Napoleon was born would be characterized by strong bias: It mea-sures knowledge of French history, not logical reasoning.
9. The whole concept of item bias or DIF emerged as a result of concerns that in some situations where mental skills or knowledge are tested, persons from one group may have an unfair advantage that is unrelated to what is being tested and will find some items easier to answer than another group whose members do not have that advantage (Zumbo, 2007).
10. For an illustration let us consider the following example from the latest World Values Survey study between 2005 and 2008. In China, item v17 (importance of thrift as a value for children) correlates with item v13 (importance of hard work for children) at .37** (n = 2,015), a high correlation by the standards of individual-level correlations in the World Values Survey. In Burkina Faso, thrift is not associated with hard work but with selfish-ness. The thrift item correlates with item v20 (importance of unselfishness for children) at –.25** ( n = 1,534). In China, there is no asso-ciation between thrift and unselfishness. The consequence of this is that one cannot build a universal individual-level scale with items v13, v17, and v20, because the relationships between them are very different within some nations.
In Fischer’s (2009) opinion, when variables do not produce the same pattern of relation-ships for groups and for individuals, this is
an indication of some sort of item bias at the individual level and the instruments that the items form are unsuitable for cross-cultural comparisons because “apples and spark plugs” are being compared (p. 34). His statement can be paraphrased: What is compared through instruments that do not produce the same structures at the individual and ecological levels of analysis is not apples and spark plugs (simple items) but bags full of apples and spark plugs versus bags full of pears and bolts (complex systems). A comparison of complex systems in their entirety may be so difficult as to be inappropriate.
The fact that a particular test does not produce the same factor structures within all cultures means that it cannot be used for cross-cultural comparisons. But it does not mean that it cannot be used for any purpose at all outside the original culture. A test that pro-duces diverse factor structures in five cultures might tap meaningful phenomena in all five of them even if they are organized differently (Paunonen & Ashton, 1998).
11. Lonner, Thorndike, Forbes, and Ashworth (1985) measured the cognitive abili-ties of native Alaskan children with Western tests and found that the results from three of them—Koh’s Blocks, Raven’s Standard Progressive Matrices, and the Peabody Picture Vocabulary Test—were highly correlated. The tests evidently measured something that had the same structure in the Alaskan context as in a Western cultural environment. Therefore, general intelligence, as measured by standard Western IQ tests, is a valid construct for Native Alaskans.
Nunez, Corti, and Retschitzki (1998) studied the association between mental rota-tion and reaction times in Ivory Coast and Switzerland. Reaction times were a function of the angle of the rotated object in both countries and the correlation patterns were very similar. This Western test obviously made sense in both countries.
Bleichrodt, Hoksbergen, and Khire (1999) measured the intelligence of Dutch and Indian children, using a Dutch test and an adapted version for India. They found that coefficients of internal consistency and stability were high

92 ◆ Studying Culture
for both Dutch and Indian children, reaching .94. Both tests had high predictive properties with respect to reading abilities. The Indian version performed even better than the Dutch. That means that the tests measured a real cognitive skill in those populations, whatever it may be. Similarly, Western cognitive tests have been found to work for Filipinos (Church & Katigbak, 1988), Ghanaians (Amponsah & Krekling, 1997), U.S. Blacks (literature review by Neisser et al., 1996), and other cultural groups.
12. If cross-cultural transferability of tools for individual-level measures is a complex issue, cross-cultural comparability of their results may pose additional challenges. This topic is treated appropriately in the cross-cultural psy-chology literature where it belongs. Only one issue will be mentioned here as an example of the difficulties that it involves. If researchers wish to compare groups from different societies on individual-level constructs, they may have to demonstrate what cross-cultural psycholo-gists call scalar equivalence (Leung, 2008; van de Vijver & Leung, 1997b). Unfortunately, as Leung (2008) points out, the establishment of scalar equivalence may require sophisticated design and statistical techniques associated with item response theory.
13. Church and Katigbak (1988) com-pared what etic and emic tests of intelligence predicted for Filipino schoolchildren. The etic tests were based on standard Western IQ tests adapted to the local reality and included recog-nition of local objects, identification of missing parts of local objects, knowledge of Tagalog words, and so on. The emic tests were based on local concepts of intelligence. They con-sisted of items that would be viewed as part of a Western IQ test but also included items for traits such as politeness and ability to maintain a good appearance that are not associated with general intelligence. The etic scales were better predictors of school success. As for the emic scales, the picture was mixed. Only those related to cognitive skills consistently predicted school success. Some scales (“outdoor chores,” “mannerly behavior”) were negative predictors of school success for the students in some of
the school grades. In this case, the conclusion is that the Western tests are better predictors of what they are designed to predict. However, this does not render the emically constructed Filipino tests completely unusable. They do not predict well what Western IQ tests do, but they may be found to be an indicator of something else that is important in the Philippines.
According to Kuppens et al. (2006), the existing research suggests that the inclusion of culture-specific terms in cross-cultural studies of the structure of emotions does not substantially alter the obtained structure, “meaning that such terms generally tend to cluster with general emotion terms” (p. 500). If that is so, emic terms do not enrich the findings and may be redundant.
Cheung and Leung (1998) compared the Big Five personality inventory, which is an etic American tool for the study of individu-als, with an emic personality test developed in China. They discovered that the Chinese test generated six factors rather than five. The sixth factor predicted real behaviors; therefore, it had useful properties that were missing in the American test. In this case, the conclusion could be that even if the American Big Five inventory works in China, it is inferior in qual-ity to the emic instrument because its range of predictions is narrower.
Emic personality tests have also been reported for a number of countries: China (Cheung et al., 1996), Hungary (Szirmak & De Raad, 1994), Italy (Di Blas & Forzi, 1998), the Philippines (Guanzon-Lapena, Church, Carlota, & Katigbak, 1998), and Turkey (Wasti, Lee, Ashton, & Somer, 2008). In all these cases, the tests tapped factors that were similar to the Big Five, but there were also strong local flavors and even factors that did not bear a clear resemblance to any of the Big Five. For example, the Chinese six-factor model has a factor that is not represented in the Big Five; but it lacks the Openness dimen-sion (Cheung et al., 2001). Whether these emic personality models are superior to the Big Five is a matter of practical performance: A superior model provides clearer explanations and has better predictive properties.

◆ 93
As paper-and-pencil studies occupy a disproportionately large place in modern cross-cultural research, and because their use creates
a wide spectrum of controversies, a special chapter is devoted to this method. Here, the term “paper-and-pencil study” refers to any study that administers a standardized written questionnaire, or a similar research instrument, to a sample of respondents.
7 PAPER-AND-PENCIL STUDIES

94 ◆ Studying Culture
◆ 7.1. Selecting Samples of Respondents: Nationally Representative Samples Versus Matched Samples
One of the main issues in the design of any paper-and-pencil study is the selection of respondents. Some selections may produce misleading results if the findings of the study are overgeneralized. By now, many are familiar with the sarcastic observation that psychology appears to be the study of the minds of American undergradu-ate psychology students—the convenience samples of most professors of psychology in the country that publishes most of the world’s leading psychology journals. It is not hard to guess how representative the study of American psychology students is for humanity as a whole.
There are two main approaches to the sampling of respondents for a cross-cultural study. The first involves nationally repre-sentative samples in which all social and demographic groups are proportionately represented. The second approach con-sists of choosing matched samples that are more or less similar in all respects. If one compares the values of undergraduate students of management, studying at com-parable universities in their home countries, that would be a study based on matched samples.
Apart from the fact that nationally representative samples are costly and dif-ficult to obtain, they may seem preferable to matched samples in a study of cultural differences. Yet, that is a debatable point. First, there is strong evidence that matched samples work quite well. Most of the studies that are discussed in the third part of this book used matched samples, producing results that are not necessar-ily less valid than results from nation-ally representative samples. Straus (2009) investigated the question of whether data from matched samples (which he calls “convenience samples”) can be used for valid
cross-national comparisons and obtained a positive result: If the samples are compa-rable (matched), the results can be valid.
Some cross-cultural researchers have used loosely matched samples, for exam-ple, managers from various companies in different countries that they had access to. An example of this is the database collected by Dutch management consul-tant Fons Trompenaars and analyzed by Smith, Trompenaars, and Dugan (1995) and Smith et al. (1996). The respondents in those studies were employees from different companies, having different job descriptions. Yet, the analysis suggests that the results are probably not too far from what matched samples would have yielded. Project GLOBE also used loosely matched samples (see 9.17. and 9.18.). This does not seem to have distorted the results. The main controversies sur-rounding Project GLOBE’s dimensions of national culture are not related to the nature of its samples.
Second, in many comparative studies the results are affected not only by cul-tural differences but also by differences in age, professional occupation, and other noncultural variables (van de Vijver & Leung, 1997a). Suppose we are studying a value whose importance increases with age and nation A has a higher average age than nation B. The observed differences between the two nations may be largely explained by this age difference, not by difference in cultural upbringing. Matched samples eliminate many noncultural dif-ferences of this type. The issue of “culture as is” versus “culture as it would be” (see 1.3.) disappears.
Imagine also that we are comparing two nations, one largely agrarian, the other one consisting mostly of industrial workers and service sector employees. Can we ask representative samples from these nations to rate the importance of work goals such as achievement, training opportunities, and promotion? These may not make much sense to people who have spent their lives in subsistence agriculture.

Paper-and-Pencil Studies ◆ 95
Matched samples do not guarantee an uncontroversial cross-cultural analysis either. A serious problem with apparently well-matched samples is that they may turn out to be quite dissimilar. Imagine a country where studying a particular university subject is a matter of pres-tige that only socioeconomic elites can afford and a country where admission to that major is open to anybody with a high school diploma. Samples from this major in the two countries may not be equivalent. The same can be said of com-paring people from different countries who have the same profession. Attitudes toward the profession, and the socioeco-nomic status it bestows, may be radically different. Smith, Peterson, and Schwartz (2002) provide a specific example of how seemingly matched samples might dif-fer: Government employment is appre-ciated in Japan but not in the West. Consequently, Japanese and Western gov-ernment employees would probably not make a good sample for comparisons of national cultures.
Confusingly, results from different types of matched samples may differ. Schwartz’s (1994) study of values demonstrates that cross-cultural comparisons of teachers and cross-cultural comparisons of students do not produce perfectly identical results. The same transpires in the various replications of Hofstede’s study presented in Hofstede (2001). Some of his dimensions appear in analyses of some matched samples but not in analyses of other matched samples. The samples in many cross-cultural studies consist of university students. Differences between groups of students may not be replicated if groups of peasants were com-pared.
Nevertheless, there are dimensions of national culture that seem stable across different matched samples and nationally representative samples. Dimensions closely associated with Hofstede’s individualism versus collectivism have been extracted from samples of students (Chinese Culture Connection, 1987), company employees
(Gelfand, Bhawuk, Nishii, & Bechtold, 2004; Smith et al., 1996), teachers (Schwartz, 1994), nationally representative samples (Welzel, 2010), and a combina-tion of nationally representative samples and national statistics (Minkov, 2011). The country samples in these studies were also quite diverse. Still, what emerges in all of them is a family of highly correlated dimensions, each of which is strongly asso-ciated with differences in national wealth and can be explained, among other things, as a function of such differences.
Finally, a potential problem with matched samples is that all or most of them may simply be inappropriate for a particular study. 1
In the view of some authors, some types of matched samples provide a bet-ter image of cultural differences than others. Schwartz (1994) preferred teach-ers because of their shaping influence on the minds of children, whereas Duijker and Frijda (1960) advocated studying cultural elites. Without any empirical evidence, it is impossible to pronounce on this matter.
There is no definitive single answer to the question of what samples of individuals should be used in hologeistic culturology or other types of cross-cultural analysis. It all depends on a careful assessment of the particular situation that a researcher needs to deal with. Unfortunately, obtain-ing desirable samples is often difficult, and researchers tend to work with what is available.
◆ 7.2. Types of Items in
Noncognitive Paper-and-Pencil Studies
Paper-and-pencil instruments for the study of self-reports and peer reports use vari-ous types of items, all of which generate their own issues. There are three main types of scales: Likert-type scales (known

96 ◆ Studying Culture
simply as “Likert scales” in many pub-lications), free-choice scales, and forced-choice scales. Examples are given below.
7.2.1. LIKERT SCALES
Very often, respondents are asked to provide answers on what is known as a Likert scale. It is used when it is consid-ered necessary to measure the intensity of what is studied. The respondents are presented with an item and are asked to define the degree to which they endorse or reject the item. 2
Example: How important is religion in your life?
1. Very important
2. Rather important
3. Not very important
4. Not important at all
7.2.2. FREE-CHOICE ITEMS
In this type of research, the respondents are given a list of items and told to choose those they endorse. There is no indication of intensity.
Example: Which of the following are important
to you? You may choose more than one answer.
1. Work
2. Love
3. Entertainment
4. Achievement
5. Thrift
6. Wealth
7. Family
8. Friends
9. Religion
10. Fame
In some cases, as in the World Values Survey, the respondents are instructed to
choose a specific number of items: “Please choose up to five of these.” This is done when the researchers fear that a signifi-cant number of respondents will choose too many options or all of them, and their answer sheets will be too similar to analyze.
7.2.3. FORCED-CHOICE ITEMS
There are two types of forced-choice items. The first type asks the respondents to select one of two options that seem mutually exclusive, at least in the Middle Eastern and Western philosophical tradi-tions.
Example: What are you?
1. A religious person
2. An atheist (a nonbeliever)
If the researchers fear that respondents may not identify with either of the two answers, they may add a third option: “Neither of the two.” Additional options, such as “I do not know” or “I cannot answer,” are also possible. One could also think of providing an opportunity for dialectical answers, such as “Both” or “It depends on the situation.” Such options are rarely provided in Western question-naires but they may seem logical to some Asian or Eastern European respondents.
The second type of forced-choice item asks the respondents to choose one of sev-eral options that do not necessarily form opposites.
Example: Which of these work goals is the most
important to you?
1. A high salary
2. Promotion
3. Good human relationships
4. An interesting job
Optionally, the respondents may be asked to rank the importance of the work

Paper-and-Pencil Studies ◆ 97
goals. The result would be what is known as an ipsative measure—a ranking of the perceived importance of items, of one’s agreement with statements, and so forth.
7.2.4. ISSUES ASSOCIATED WITH LIKERT SCALES
Likert scales are probably the most con-troversial of all items in cross-cultural analysis. There is considerable academic literature on the issues associated with them and potential correctives for some of the problems they generate. Treatment of the subject in this book only touches on some of the most salient aspects of the use of Likert scales in cross-cultural research. Readers are referred to relevant literature for additional information.
7.2.4.1. The Reference Group Effect
Heine et al. (2002) expressed various concerns about the use of Likert scales in cross-cultural research. One of the prob-lems they identified is called the reference group effect. Essentially, this means that when people are asked to provide a self-description on a scale—such as “very,” “rather,” “not much,” and “not at all”—they use a group of people that they are familiar with as a reference. Americans will rate themselves using other Americans as a reference group, whereas Japanese will compare themselves to other Japanese. In the view of Heine and his associates, this may have a confounding effect on a com-parison of Americans and Japanese on a construct. The example that they provide illustrates the issue clearly:
There is no universal consensus on what the objective threshold is for being con-sidered tall—rather, being tall depends on comparisons with appropriate tar-gets, typically those of similar age, sex, and nationality. The same height—for example, 5 feet 9 in.—is seen as tall in some contexts (e.g., among elementary
school children or Japanese women) and short in others (e.g., among pro-fessional basketball players or Dutch men). (p. 904)
Although this is a valid concern, expe-rienced researchers rarely fall into the trap described here. When the concept of interest can be measured objectively, they will elicit numerical estimates, not vague descriptions. Instead of asking the respon-dents if they go to church “very often,” “quite often,” or “rarely,” researchers can ask them how many times on average they go to religious services per week or per month.
When the concept cannot be measured objectively, we have a very different case. A number of studies have found that different cultural groups do not neces-sarily mean the same thing when they choose the same position on a Likert scale (Cheung & Rensvold, 2000). According to Smith (2003), who refers to comparative studies of happiness, “even in the situa-tion in which the English adjective ‘very’ is consistently (and correctly) translated into the French ‘très,’ it is not known if its strength is sufficiently identical to cut through the underlying happiness con-tinuum at the same point” (p. 72). There is no universal yardstick for the intensity of happiness, importance of religion, or level of pride. All that we have are the respon-dents’ answers, “very proud,” “somewhat proud,” and so on. How do we know that “very proud” in China means the same thing as in Sweden? We do not. But we do not always need to, either.
As Heine et al. (2002) correctly point out, self-descriptions of this kind will be nothing but statements unless they can be validated. They mention a specific type of validation: comparisons with the views of cultural experts. As explained in 3.2.2.3., that would be a study of ste-reotypes and a very inappropriate type of validation. Real validation can be provided only through correlations with some objective variables. For example,

98 ◆ Studying Culture
if our measures of national religious-ness and other associated phenomena are good negative predictors of national suicide rates (Minkov, 2011), we have a meaningful validation and do not need to worry about Chinese and Swedes mean-ing different things by “very religious” and “somewhat religious.”
This may still not satisfy those who wish to know exactly how proud or reli-gious Chinese are compared to Swedes or Americans and are concerned about the lack of a universal yardstick. The fact that we have found that religiousness predicts suicide rates means that our mea-sure of religiousness is about something real, but we still do not know if we have successfully gauged the religiousness of Chinese, Swedes, and other populations for comparative purposes. Actually, such comparisons are not only impossible, but also unnecessary. An insistence on them would amount to the reification of the abstract concept that we are measuring, an attempt to transform religiousness into something like a rectangular stone that has an exact length, width, and height, as well as a weight. Abstract concepts like religiousness, happiness, and pride will never be rectangular stones. They can only be studied on the basis of some exter-nal manifestations, such as statements, as well as the predictions about real behav-iors (such as suicide) that can be made on the basis of those statements. Someday, a correlation may be found between mea-sures of verbally expressed happiness or pride and various objective physiological indicators. But that would still not be a direct measurement of the subjective human constructs known as happiness and pride. We should therefore abandon the idea that such constructs can be mea-sured like material objects. Instead, we should concentrate on the practical utility of our subjective measures. If we know that some nations have a higher percent-age of people who describe themselves as very proud, what practical predictions can we make?
7.2.4.2. Potential Meanings of Some Positions on a Likert Scale in Cross-Cultural Analysis
Related to the previous issue is the ques-tion of how researchers should interpret scale positions in cross-cultural analysis. Is there a good practical solution despite the potential cultural differences in the respondents’ interpretations of the Likert scale positions? This is a largely under-researched area. Yet, some insights can be obtained through correlation analyses.
When respondents are presented with a four-point Likert scale that does not have a “neither-nor” position, but one of the positions is marked “rather” or “quite,” endorsement of that position may amount to a transformation of the meaning of that position into a position of neutral-ity, or rejection of the other positions. “Rather” and “quite” may assume the meaning of “none of these” or “unde-cided.” Consequently, the percentages of respondents who have chosen such neutral options may not measure the same thing as the percentages who have chosen the other options on the scale. 3
7.2.4.3. Extracting Societal Information From Items on a Likert Scale
We saw that the rather/quite position on a four-point Likert scale may not cor-respond to its literal meaning and contain noise. Then, how should we extract infor-mation from similar items?
Most large-scale cross-cultural analy-ses (Chinese Culture Connection, 1987; Hofstede, 1980; etc.) have used means—the national average score for a particular item. This is an acceptable approach but not the only one. Inglehart and Baker (2000) reported a different way of scoring items at the national level. They worked with the national percentages of respon-dents who selected a particular position on the Likert scale. Interestingly, for some items they used the extreme posi-tive position on a four-point Likert scale

Paper-and-Pencil Studies ◆ 99
(“Religion is very important in respon-dent’s life,” p. 26), but for other items their preferred choice was the weak nega-tive position (“Respondent describes self as not very happy,” p. 24).
Analyzing cross-cultural data on the basis of percentages that have selected specific positions, rather than working with means, is justified if it can be dem-onstrated that the information the item should reveal at the societal level is con-centrated on a specific position of the Likert scale. This can be done only empiri-cally. Minkov (2009b) did this for the happiness item in the World Values Survey and demonstrated that it is the extreme positive position on the four-point Likert scale (national percentages who indicate they are “very happy”) that has the best predictive properties with respect to exter-nal variables that can be associated with happiness. The extreme positive position has better predictive properties than the item’s means or the other positions on the scale; therefore, it is more meaning-ful. Various World Values Survey items exhibit the same pattern. 4
Although further research is needed to confirm this, it seems that the best method to extract societal information from four-point Likert scales with expla-nations attached to the positions but with-out a clear neither-nor position might be to count the percentages who have chosen the extreme positive position (“very”) or the moderate negative position (“not very”). A different picture emerges, how-ever, when 10-point Likert scales are used without verbal explanations attached to each position. In that case, the extreme positive position may not be particularly informative in terms of predictive proper-ties, and national means may seem a better alternative.
There are other potential solutions. Item v46 in the 2005–2008 World Values Survey asks the respondents to describe their per-ception of life control on a scale of 1 to 10, with explanations of position 1 (“none at all”) and position 10 (“a great deal”).
Although the other positions have no verbal labels, the answers suggest that in most countries there is a psychological threshold between the first four positions (chosen respectively by 3.1, 1.7, 3.8, and 4.4% of all 80,842 respondents) and the remaining six positions, chosen by more than 10% each. In many countries, there is also a precipitous fall between position 8 on the one hand and positions 9 and 10 on the other, suggesting another thresh-old. Thus, item v46 can be split into three societal-level variables: low life control (the sum of the percentages who have selected positions 1, 2, 3, and 4), moderate life con-trol (the sum of the percentages who have selected positions 5, 6, 7, and 8), and high life control (the sum of the percentages who have selected positions 9 and 10).
7.2.4.4. Response Style
Many researchers have observed that some cultural groups exhibit specific response patterns or styles (Harzing, 2006; Hofstede, 2001; Johnson, Kulesa, Lic, Cho, & Shavitt, 2005; Marin, Gamba, & Marin, 1992; Smith, 2004a; van Herk, Poortinga, & Verhallen, 2004; Welken-huysen-Gybels, Billiet, & Cambre, 2003). These response styles (the term “response sets” is also used) are often viewed as a tendency to provide uniform answers to questions, regardless of their content. The various types of response styles dis-cussed in the literature can be grouped in two main categories according to their descriptions:
1. A tendency to choose a particular position on a scale regardless of the con-tent of the items. This tendency has two main variants—extreme response style and moderate (middle) response style—each of which is more typical of some cul-tural groups than others. When presented with a Likert scale, usually containing four to seven points, respondents from some cultural backgrounds may prefer an extreme of the scale. The answers of

100 ◆ Studying Culture
respondents from other cultures tend to be concentrated in the middle of the scale (Hanges & Dickson, 2004), on positions such as “rather,” “quite,” or “not very.”
2. A tendency to answer all items the same way, regardless of their mean-ing. For example, when the item asks the respondents if they agree or disagree with a statement, some cultural groups may exhibit a preference for agreement, known as “acquiescence”. Acquiescence may be indistinguishable from extreme response style on a Likert scale; this is the case, for instance, when respondents tend to strongly agree with most state-ments. But acquiescence can occur also when the items are worded categorically and the respondents must choose between only two options: agree or disagree. A negative form of acquiescence is known as “disacquiescence” (Harzing, 2006). This is the tendency to disagree with most items, regardless of their content.
By now, there is a large literature on response style, which also covers the situation in the cross-cultural field. There are various issues in this domain: how to detect response style, what causes it, how to avoid it, how to treat it when it has occurred, and so forth. All of these questions are addressed briefly in the next sections.
7.2.4.4.1. Detection of Response Style Much of the literature on the detection of response style is targeted at the individual level. As far as culturology is concerned, those findings are interesting to the extent that they can be easily extrapolated to the societal level.
Welkenhuysen-Gybels et al. (2003) dis-cuss a seemingly convincing method for the detection of acquiescence: the use of a behavioral variable for the purpose of comparison. Presumably, if statements do not match behaviors, there is evidence of acquiescence. As these authors indicate, however, behavioral variables are not
always available. Besides, even when they are available and they do indicate a mis-match between statements and behaviors, that is not necessarily any evidence for a peculiar response style. 5
According to Hanges and Dickson (2004), response style can be identified at the individual level if an individual’s mean is high or low on a wide range of constructs. Otherwise, there is no evi-dence that this individual tends to answer in a similar way to dissimilar items. To put it differently, it is possible that all of the items in the questionnaire measure something similar, in which case no par-ticular response style can be detected. 6 Unfortunately, Hanges and Dickson’s sound advice is not always heeded in stud-ies of response style. 7
If the items in the questionnaire measure a number of statistically and conceptually different dimensions and some individuals tends to score higher than others on most items, regardless of the dimensions they define, we can conclude that some kind of response style is at work. The same criteria can be used at the group level. If a par-ticular group of people has a high average score, or a moderate score, or a low score on most items in a database and most of the dimensions that can be extracted from it, the conclusion might be that they have a group tendency to answer questions in a predictable way, no matter what the ques-tions are.
According to Hanges and Dickson (2004), measures of deviations can be used as an indication of response style. Individuals or groups whose answers devi-ate little from their means (their average score on all items), or those who have large deviations, can be viewed as exhibit-ing two types of response style: uniform versus varied.
However, measures of deviations do not reveal which positions on the scale the respondents selected. To find out if the respondents preferred a particular posi-tion, a different method is needed. For example, Harzing (2006) calculated what

Paper-and-Pencil Studies ◆ 101
she calls “acquiescence levels” (p. 250) for 26 countries by dividing the number of questions that received a 4 or 5 response (agree/strongly agree or very important/of utmost importance) by the total number of questions for each respondent.
Johnson et al. (2005) describe another way to identify a particular response style at the individual level. If respondents tend to agree with items that measure oppo-sites, the answers indicate acquiescence, that is, endorsement of most items. For instance, if they agree with the statement that they are optimistic about the future and with the statement that they are wor-ried about the future, there is evidence of acquiescence. Following Harzing’s (2006) method, one can calculate the ratio between the number of these contradic-tions and the total number of items. There are also more sophisticated methods for the detection of response style discussed in Welkenhuysen-Gybels et al. (2003).
Although all of these methods can be used to form a relative idea about the pres-ence of response style in the answers of an individual or a group of people, there can be no absolute criteria as to the magnitude of an indicator that would justify the view that a particular response style has mate-rialized. Essentially, the identification of response style is an exercise in relativity in that an individual or a country exhibits a particular response style in comparison to other individuals and countries, not in an absolute sense.
7.2.4.4.2. Treatment of Response Style: Undesirable Bias or Normal Style? Many researchers have viewed response style as some kind of noise that distorts the information in the respondents’ answers and have called it “bias.” In the words of Smith (2003), “Though response effects are a source of measurement error in all surveys, cross-national surveys are espe-cially vulnerable to various error compo-nents being correlated with country” (p. 80). According to Hanges and Dickson (2004), if some respondents systemati-
cally prefer a particular position on a Likert scale, regardless of the content of the questions, or if they agree most of the time, their answers are probably affected by one or more unknown variables that are not necessarily related to what is being measured. The logic of these suspicions is that if an individual or a high percentage of respondents in a particular sample state that everything is very important to them, be it religion, wealth, achievement, work, leisure, thrift, friends, family, politics, protection of the environment, or anything else, one could suspect that this cannot be true. The respondents may have simply answered the questions somewhat mind-lessly. If that is the case, their response style is to be viewed as bias and something needs to be done to correct it.
There is an alternative view, though. Section 7.2.4.4.5. refers to studies that have demonstrated associations between various types of response style and cultural dimensions. This implies that a national or ethnic response style can be viewed as pack and parcel of a culture and cannot be easily decoupled from it. That would be like attempting to have content without form. Corrections of response style could amount to forceful disfiguration of cul-tures through an imposition of a foreign standard.
The treatment of response style as bias implies that the normal state of affairs is a set of answers in which no style can be detected. Thus, response style is marked. No style is unmarked; it is the desirable default. This philosophy is based on the fact that the default is typical of the West, whereas various types of marked style are more common in developing countries. The view that Western psycho-logical characteristics or cultural traits are the normal human standard will not find many adherents today. It has been forcefully criticized by Henrich, Heine, and Norenzayan (2010a, 2010b), who show that many peculiarities of Western minds are not shared outside the West; therefore, it is the Western minds that

102 ◆ Studying Culture
should be viewed as WEIRD because they reflect a very unusual combination: Western, Educated, Industrialized, Rich, and Democratic.
Indeed, there may be nothing illogi-cal about some types of response styles. If Latin Americans score high on most values, regardless of their content, that can be viewed as evidence that they have strong values that are expressed accord-ingly. Vice versa, East Asians are not as strongly attached to their values as Latin Americans and consequently express them in a less forceful manner. 8
According to Smith (2003), respondents who are attracted to extreme positions on a scale may do that “regardless of their true strength of attitude towards particu-lar items” (p. 82). Likewise, Fischer (2004) defines response bias as a systematic ten-dency to distort responses in such a way that they are unrelated to the “true score of the individual” (p. 263). This reflects the philosophy that there is an absolute truth that researchers must discover. The alternative philosophy, defended in this book, is that any research should be viewed as a quest for meaningfulness and utility. If some of our respondents tell us they are very happy, very religious, and very proud, what we are interested in is how we can use these answers to predict something else. We are not necessarily interested in the question of whether their happiness is really as great as they describe it because we do not know what “really” means in this case. What is somebody’s real happiness and how does one discover the truth about it?
The view that a particular response style indicates that the respondents are answering outside a theoretically speci-fied construct of interest implies that the theoretical construct is correct by default, whereas the fact that the respondents’ minds do not recognize it in the empiri-cal test is an indication of their bias. In 5.1., it was pointed out that specifying constructs theoretically makes sense only when the theoreticians are ready to test
their assumptions empirically and accept corrections from the respondents.
As we continue our explorations of various issues associated with response style, we will see that the question of how response style is to be treated does not have a categorical answer. There are cases when a response pattern indicates that some data cannot be trusted because they are obviously full of noise. In other situ-ations, disregarding the issue of response style or bias seems like the best course of action. The best guideline concern-ing response style is provided by van de Vijver’s (2011) summary: “The main ques-tion is whether the explanatory variable is helpful in understanding cross-cultural differences, no matter if these are based on valid differences or bias. . . . The dis-tinction between bias and valid differences may often be more theoretically than practically relevant in the explanation of cross-cultural differences” (p. 252).
7.2.4.4.3. Causes of Response Style: The Number of Points on a Likert Scale One of the many interesting findings associated with response style is that it may have something to do with the number of points on the scale. Hui and Triandis (1989) found that when Hispanic Americans were presented with a five-point scale, they were more likely than European Americans to choose extreme answers. When the items were scored on a 10-point scale, this difference between the two groups disappeared. Harzing et al. (2009) found that five-point scales were more likely to generate extreme response styles than seven-point scales.
However, there is clear evidence in the World Values Survey that a dramatic response pattern is possible in some coun-tries even on 10-point Likert scales. Item v200 in the 2005–2008 study asks the respondents if it is justifiable to cheat on taxes. Answers are given on a 10-point Likert scale, ranging from 1 (never justifi-able) to 10 (always justifiable). In Ghana, 100% of the 1,500 respondents chose

Paper-and-Pencil Studies ◆ 103
position 1! It takes strong trust in the local researchers to believe that these results are perfectly valid, but those from other countries suggest they are probably not too distorted through poor bookkeeping.
7.2.4.4.4. Causes of Response Style: The Language of the Questionnaire Harzing (2006) found that when respondents from some nations whose native lan-guage was not English answered ques-tionnaire items in English, they were less likely to choose extremes on a five-point scale and more likely to provide answers in the middle of the scale. Various other studies have also found that the language in which the questionnaire is answered can affect the response style. Apparently, when respondents are answering in a foreign language they have not mastered, they feel less bold than when the ques-tions are in their native language.
7.2.4.4.5. Causes of Response Style: The Role of Culture Hui and Triandis (1989) attempted to explain response style in the following way:
The cultural explanation focuses on the norms of responding. It argues that in some cultures, such as the Asian, it is important to be modest and respond cautiously. The use of the middle of the scale . . . is an expression of this modesty. To use the extremes of the scales would be in “poor taste” and boisterous. In the cultures around the Mediterranean by contrast an extreme response is used because people con-sider such a response sincere. To use the middle of the scale would be considered trying to hide one’s feelings, which is normatively disapproved. (p. 298)
These explanations reflect a degree of abstract interpretivism, yet they are plau-sible. They amount to saying that response style is associated with cultural character-istics. There is strong empirical evidence to support this view; high power distance and collectivism may account for a tendency
to acquiesce. 9 As Hofstede (2001) noted, respondents in high-power-distance coun-tries may perceive the researcher as a figure of authority and be disinclined to disagree with the statements in the ques-tionnaire because that could imply disre-spect. Collectivism can also be viewed as a tendency to agree with the group, hence it should encourage acquiescence. Although these two explanations sound plausible, they are not fully satisfactory.
First of all, how do the respondents know the opinion of the researcher on the items that they have to answer? Suppose that the researcher disagrees with the statement in the item. In that case, dis-respect would be shown in the case of agreement, not disagreement. Second, if power distance accounts for acquiescence, it does not explain why this acquiescence has to be extreme, as in the case when it is combined with extreme response style.
As there seems to be sustained inter-est in the cross-cultural differences in response style and their associations with cultural traits, we can hope to see more research in this interesting field.
7.2.4.4.6. Causes of Response Style: The Nature of the Items Another fact is also worth mentioning. Minkov (2009b) found that nationally representative samples of Latin Americans do not tend to choose extremes when they are asked to make qualitative judgments about various aspects of life in their own countries, such as the role played by various institutions. Latin Americans may have a tendency to score high on most general values or work goals in studies such as Hofstede’s (1980, 2001), as well as on Harzing’s (2006) items, but when they have to assess the sit-uation in their countries their scores are as balanced as those of Europeans. This sug-gests, among other things, that response style may be a function of the items’ content. One culture does not necessarily produce the same response style for all items, just as it does not generate the same response style for all Likert scales. 10

104 ◆ Studying Culture
7.2.4.4.7. Causes of Response Style: The Role of Intelligence and Education Apparently, some types of response style in some nations or ethnic groups are associated with the respondents’ poor understanding of some questionnaire items. Opposites may not be perceived as such not necessarily because of cultural dialecticism but because many respon-dents apparently fail to grasp the oppo-sition. 11 Yet this does not explain why respondents who do not understand the questions do not answer at random but tend to choose a particular posi-tion on the Likert scale, as in Harzing’s (2006) study.
7.2.4.4.8. Conclusions About the Causes of Response Style Several conclusions are possible on the basis of the evidence in the previous sections.
1. Different research instruments pro-duce different response styles. To put it in another way, response style is, among other things, a function of what is measured and the measurement method. What may seem like a single phenomenon—for example, a national or ethnic tendency to acquiesce or exhibit extreme responding—may actu-ally be something complex, consisting of uncorrelated or weakly correlated phenom-ena. Therefore, the traditional definition of response style as a tendency to answer all items in the same way regardless of their content is misleading. On the con-trary, some types of individual or societal response styles are a function of the content and format of the items, as well as other complex factors.
2. Some particular response styles in some studies appear to be due to a com-bination of the joint effect of the research instrument and national or ethnic cul-ture, although the mechanisms through which culture accounts for these response styles are not yet fully clear despite some encouraging findings in the academic literature.
3. Respondents in societies with relatively poor general education who have trouble understanding complex ques-tions will provide apparently meaningless answers that can sometimes be associated with a particular response style. The cause of the uniformity in the answers to unin-telligible questions is not clear.
In view of these conclusions, response style should not be viewed as a single phenomenon and must not be treated as such. Some of the specific response styles reported in the literature, such as acquiescence, are not single phenomena either; one must further specify what kind of acquiescence has been detected and in what kind of study. As a result, there can be no single method for the explanation or treatment of response style.
7.2.4.4.9. Dealing With Response Style Before the Study: Choice of Items and Scales If respondents with low educational levels have trouble understanding some questions, researchers should adminis-ter only simple questions about concepts that everybody is likely to understand. It is plausible that all modern societies have concepts of religion, friendship, and wealth; therefore, questions about these concepts would be meaningful to every-body despite the potential local nuances. It also makes sense to ask if women and men should have equal rights, if men or women need children to be happy, and if people should share their possessions with others or keep what they have for themselves. It is far less clear if it is sensible to ask nationally representative samples whether it is important to protect the environment, because this Western concept may not be part of the prevalent cognitive schemas in some societies, even if it has penetrated their native languages. 12
If the respondents do not represent nationally representative samples but are matched samples with a good educational level, a higher level of abstraction may be permissible in the questionnaire items.

Paper-and-Pencil Studies ◆ 105
Still, there are some limits. In 7.3.5., examples are provided of items whose intelligibility is dubious even if the respon-dents are educated.
If the questions in the survey are simple and easy to understand, fears that the information that the answers carry will be contaminated through response bias may be unfounded. Inglehart and Baker (2000) worked with raw scores on four-point Likert scales and obtained highly meaningful results. Minkov (2007, 2011) followed their example and also obtained meaningful dimensions. In 7.2.4.3., it was shown that sometimes it is precisely the positive extreme position on some (though not all) Likert scales that may reveal the most meaningful information in terms of predictive properties at the national level. Nevertheless, many researchers will not be satisfied by this observation and will insist on the elimination of what they consider response bias. They might adopt a num-ber of methods that can be used for this purpose.
The simplest way to avoid some response styles associated with Likert scales is not to use such scales in the first place. Researchers who design their own questionnaires and wish to avoid extreme responding or moderate responding may prefer free-choice items and forced-choice categorical items: “Work is more impor-tant than leisure” or “Leisure is more important than work” and, optionally, “The two are equally important.” 13
Still, these strategies are not a full guarantee that there will be no discern-ible pattern in the answers of any group of respondents. A peculiar response style can occur even if the items involve a free choice from a list and the score format is categorical, that is, item selected versus item ignored. 14
Smith (2003) advocates the balancing of scales with affirmative responses (for example, agreement) and negative responses (for example, disagreement) meaning the same thing: “It is hoped that such reversals force a respondent to consider the items’
meaning and reply in a substantively mean-ingful pattern. If this does not occur, then the answers cancel themselves out and the respondent reflects a middle position” (p. 81). This is hardly a perfect solution. First, this approach involves the use of opposites, such as “I often feel happy” and “I often feel sad” as different items, not as forced choices in the same item. Yet, various stud-ies (for instance, Schimmack, Oishi, et al., 2002) have shown that East Asians, some Eastern Europeans, and other populations do not necessarily disassociate such feelings; for them, one is not exactly the opposite of the other. Unless respondents are forced to choose one of these in a single forced-choice item, they might endorse both if they are presented as two different items. Researchers could interpret this as an indi-cation that these respondents do not have a pronounced tendency to feel either happy or sad, which may not be what the respondents meant when they endorsed both items in the same way. Second, as we saw in 7.2.4.4.7., if the respondents do not understand the questions well, using hypothetical opposites will not help. Thus, if some respondents answer that they are often frustrated and often fulfilled, we do not know if this is an instance of dialecticism or simply an inabil-ity to understand the items.
7.2.4.4.10. Dealing With Response Style After the Study: Standardization of Scores Researchers who insist on working with Likert scales but view response style as grime on an old painting that needs to be removed might attempt to deal with this issue after the collection of the respon-dents’ scores. One possible corrective is to standardize those scores using various pro-cedures, as described in Hofstede (2001), Leung and Bond (1989), Smith (2004a), and many other publications (for a review and a useful treatise, see Fischer, 2004). They are based on an assumption that there is an inflation or deflation factor at work that inflates or deflates all individual responses in a particular section of a database. The magnitude of that inflation
106 ◆ Studying Culture
or deflation can be calculated and its effect can be eliminated from the responses. The procedure involves the following:
1. Selection of a group of items to be standardized (most often a group of items that measure values, seemingly affected by extreme response style)
2. Calculation of a mean all-item score for each respondent
3. Subtraction of each respondent’s all-item score from that respondent’s scores on all selected items
4. (Optional) Division of each respon-dent’s transformed score (as described previously) by that respon-dent’s average deviation from the respondent’s average mean 15
Because this standardization is per-formed separately for each respondent and across the answers of that respon-dent, it has been called “within-subject standardization” (Fischer, 2004). In the terminology of SPSS, the popular statisti-cal software program, it is called z-score standardization by case and is available in the multidimensional scaling and hier-archical cluster analysis tools. 16 Z-score standardization by case can be applied at the individual level, at the societal level, or at both levels. 17
Scores that were z-standardized by case at the individual level were used in some major cross-cultural research projects such as the Chinese Culture Connection (1987). It is also possible to perform the standard-ization at the societal level. The procedure is the same as for individuals, except that the cases are now nations of other groups of people. For each country, an average all-items score is calculated, then sub-tracted from each score of that country on each item, and is optionally divided by that country’s average deviation from its all-items mean. 18
Z-score standardization may produce seemingly plausible results in some cases, yet various concerns have been expressed
regarding this procedure. First, one should remember Hanges and Dickson’s (2004) warning: If the data produce only one or two factors, it may be wise to leave the scores unstandardized. Fischer (2004) also argued that if the raw item scores are highly correlated, a factor analysis of stan-dardized scores might produce spurious results. Therefore, it makes sense to study the structure of the items before assuming the presence of response style and pro-ceeding with z-score standardization by case (Minkov, 2009a). If a factor analysis reveals only one or two conventionally defined factors across individuals or coun-tries, the standardization does not make sense at that particular level. There is no established rule to follow concerning the number of factors beyond which z-score standardization by case is permissible, but if a consistent response style is detected over more than three factors, it probably makes sense to standardize.
Hanges (2004) discusses several other concerns about z-score standardization by case. One limitation is that the stan-dardized scores are no longer directly interpretable because they cannot be linked to any verbally defined positions on a scale. If a person has chosen position 3 because it is defined as “[I go to church] every week,” the meaning of this choice is clear even if we suspect that the answer is inflated. But what is the meaning of a standardized score of 3 – 4.4 = –1.4 on that same item?
Another limitation noted by Hanges (2004) is that z-score standardization by case is applied across the whole sample as if all individuals or all countries exhibited a tendency toward a particular response style, but that may not be the case. It may be that while some individuals or countries have a regularity in their answers, others do not. If this is so, it is illogical to correct all respon-dents’ or all countries’ scores through this standardization because not all of them are obfuscated through response style.
Harzing (2006) pointed out another similar problem: Z-score standardization by case across the whole questionnaire

Paper-and-Pencil Studies ◆ 107
(or a whole section of it) implies that all items are affected to the same extent by a particular response style, but that may not be the case. Schimmack, Oishi, et al. (2002) argued that response styles have negligible effect on affect ratings. Thus, if the questionnaire involves a mixture of items, some of which address emotions, whereas others target other constructs, it might be illogical to standardize across all items because they would not be affected by response style to the same degree.
Finally, Hanges (2004) notes that z-score standardization by case amounts to an ipsatization of the scores, but the psychometric literature warns that ipsa-tive scores are difficult to compare across groups. 19
What are we to think of these con-cerns? The fact that standardized scores by case are hard to interpret because the initial scale is lost is a problem only if we are interested in absolute meanings. If we wish to compare the positions of societ-ies on a scale that measures religiousness, it may not matter whether position –1.5 means “somewhat religious” or “not very religious.” What we may want to know is whether the United States scores higher than Japan and Sweden or not.
The concern that some respondents may be prone to exhibiting a particu-lar response style, while others are not, stems from the philosophy that some respondents answer more truthfully than others and the researchers’ goal is to find that truth. If that philosophy is accepted, z-score standardization by case does not make sense indeed.
Z-score standardization by case is acceptable if it is viewed as a replace-ment of one type of scoring with another: Raw scores are replaced with scores that indicate something else: individual or country differences in the relative strength of endorsement of the question-naire items. 20
However, there is a different, yet very important issue here that is rarely considered in cross-cultural research. Some respondents may find some items
incomprehensible (see 7.2.4.4.7.) but, instead of admitting that, they may answer them in a more or less similar way, tend-ing to choose a particular position that is dictated by various individual or cultural factors. In that case, the answers that these respondents provide on items that they understand may be meaningful, while those on the incomprehensible items would indeed be nothing but noise. Z-score stan-dardization across all respondents or all nations disregards this possibility.
As for the ipsatization that z-score standardization by case creates, it is true that it makes cross-cultural comparisons more difficult than when raw scores (or scores standardized by variable) are used. One reason for that is that this standard-ization reveals not only intercultural dif-ferences but also intracultural structures that are not always easy to make sense of, let alone compare across societies. However, a careful analysis of intra-cultural structures can sometimes reveal interesting features that remain hidden when raw scores are used. 21
In conclusion, the answer to the ques-tion of whether one should use raw or standardized scores depends on the goals of the research. If the absolute scores of the cases matter for some reason, raw scores are naturally preferable. However, if one wishes to combine an intercultural comparison with an inspection of intra-cultural structures, z-score standardization by case may reveal what other methods cannot, despite the fact that its results are not necessarily easy to interpret and may require additional analyses.
There are researchers who believe that some score standardization proce-dures can eliminate not only a person’s individual response style from all item scores, but also the effect of culture on all respondents’ individual answers. This can be done, for instance, by subtracting the German national mean item score from all Germans’ scores on all items. This exercise would result in culture-free responses that can be used to identify cultureless individual variation. It can

108 ◆ Studying Culture
also be combined with standardization by case. According to Triandis et al. (1993), “a factor analysis based on these doubly standardized scores can extract factors that are independent of culture” (p. 369). This bespeaks an assumption that a soci-ety’s culture has the same effect on each respondent from that society and causes an inflation or deflation of all answers and of exactly the same magnitude across all individual responses from that society. Culture is like a perfectly flat horizontal platform that has the same “positioning effect” (Leung & Bond, 1989) on every-body: It gives exactly the same leg up to all members of a particular society, and if after that there are still some differences between some of them, those are culture-free individual differences. The logic of this argument is evidently flawed. Culture is not to be viewed as a flat platform but as an undulated wave: It lifts some people more than others because not all individu-als are equally susceptible to its effect. 22
Further, there are no human beings who can grow up and exist as normal people outside a culture. Imagining what they would be like if they existed in a hypothetical cultureless world, or even in a one-culture global nation, is not a practi-cally useful exercise. According to Jahoda (2011), attempts at arriving at a univer-sal, culture-free psychology are incoherent because they assume that there can be “a psychology of humans apart from culture but as Geertz . . . notes, such creatures would not be true humans but ‘unwork-able monstrosities’” (p. 51).
For all these reasons, wholesale calcula-tions of the positioning effect of culture on individuals for studying cultureless individual variation are to be avoided despite their appeal to some cross-cultural psychologists.
7.2.5. ISSUES ASSOCIATED WITH FORCED-CHOICE ITEMS
Some authors (Smith, 2003) argue that apparent dichotomies, such as work versus
leisure, may not be opposites in some languages or cultures. If this is so, it may be illogical to instruct people to choose between the two. That would be like asking them if they prefer to eat ice cream or go swimming. 23 Yet, forced-choice items in the World Values Survey, involving a selection of one of two apparent opposites, seem to work well even for the East Asian countries where some aspects of dialecticism appear to be stronger than in the United States or the Arab world. Such items have good predictive properties across all of the World Values Survey countries, and there is no reason to consider them problematic.
When the respondents are not instructed to choose between what seem to be oppo-sites but are instead required to prioritize various goals or values, there is a com-pletely new situation. Harzing et al. (2009) found that forced-choice items instructing the respondents to pick and rank the three best alternatives from a list of seven reduce what those authors call response bias. They concluded that researchers could have greater confidence in the validity of cross-cultural differences if they used this format instead of traditional Likert scales. However, when respondents are forced to make a choice from several items, the resulting information may have poorer predictive properties than the information from free-choice items. 24 Also, the best way to demonstrate validity is not to show absence of any pattern in the response style. A valid measure is one that predicts other measures reliably and meaningfully.
7.2.6. ISSUES ASSOCIATED WITH FREE-CHOICE ITEMS
Free-choice items are not quite problem-free. Compared to Likert-scale items, they may have poorer predictive properties with respect to relevant external variables. 25 There is also another potential problem with free-choice items. It is reasonable to expect almost identical results from two studies of the same society within the same short period. But that is not exactly

Paper-and-Pencil Studies ◆ 109
so. In the World Values Survey, Turkey was studied twice in 2001. The results of the two studies are not perfectly matched for all items. 26 “Religious faith” is a par-ticularly striking example: The score dif-ference between the two studies exceeds 10 percentage points. It appears that the reason for this discrepancy is the item for-mat, in that the respondents are asked to choose some items from a list and ignore others. Under those circumstances, they do not necessarily give the items as much thought as when they have to rate them one by one. When the respondents are not given a free choice but are forced to pro-vide an answer to an item, the results are more consistent. 27
◆ 7.3. Other Issues That Can Affect Data for Cross-Cultural Research
Respondents’ answers, as well as other statistical data, can be affected by various factors that are not necessarily associated with the scales of the items in the question-naire. It was argued in the previous sec-tions that if a database shows evidence of some specific response style, the answers are not necessarily contaminated with something to be viewed as false or unreal. The situations discussed in the following sections are more complex. For example, there is such a thing as deliberate lying—providing information that is proven false by means of external evidence. But there is often a thin line between lying and embel-lishment of the truth.
7.3.1. POVERTY
According to sociologist Robert Chambers, poor people may not only exhibit a par-ticular subconscious response style but also have an inclination to deliberately tell falsehoods: “For many reasons—fear, prudence, ignorance, exhaustion, hostility,
hope of benefit—poor people give infor-mation which is slanted or false” (quoted in Haviland, 1990, p. 22). If this is true, one should have serious doubts about the data from nationally representative samples from very poor countries in the World Values Survey, the studies of the Pew Research Center, and other similar projects.
7.3.2. DISTANCE FROM THE RESEARCHER
Respondents’ answers may differ as a function of the similarity that they perceive between themselves and the researcher (Rokkan et al., 1969). Smith (2003) refers to studies showing that some character-istics of the interviewer can affect the answers of the interviewees. When the interviewer belongs to a different racial or ethnic group, interviewees may be more likely to avow intergroup tolerance than if the interviewer is from their own group.
National stereotypes or statements about other touchy issues may also be partly affected by the nationality of the person who collects them, as the members of some societies may be more likely to provide positive presentations of their nation or of themselves in the presence of foreigners than in the presence of insiders. In a study that compares multiple cultures, it is advisable to have the data collected by local researchers in each of them so as to avoid mistrust of foreigners.
7.3.3. SOCIAL DESIRABILITY
Another type of distortion may be caused by social desirability. In that case, the respondents answer the questions in a manner that is approved by society. Smith (2003) provides the following explanation:
Image management and self-presen-tation bias lead respondents to give responses portraying them in a posi-tive light. The general tendency is to

110 ◆ Studying Culture
overreport popular opinions and under-report unpopular or deviant opinions, or—even more frequently—to over-report socially acceptable activities and underreport undesirable behaviors. (p. 80)
Social desirability may be a problem in some types of studies of individuals because image management can mask the answers that some individuals would provide without such management. As a result, researchers receive distorted infor-mation about those individuals. For exam-ple, some respondents may say that they drink very little although it is a public secret that they are alcoholics. In this case, we have a clear case of lying.
When the unit of study is a society, and the object of study is a value, the situation may be quite different. Consider the fact that over 95% of the population in some Arab countries state that religion is very important to them. Might the answers be inflated because of social desirability? Perhaps, but if the social desirability of religion is so great, that is an indication that we are dealing with a very religious society. Is there a method to prove that stated religiousness is not real religious-ness? One might attempt to show that the former does not correlate with another measure of religiousness, for example, fre-quency of attendance of religious services. Yet, in accordance with the point made in 5.1., that could mean we have two differ-ent constructs, not one false religiousness and one true.
Schmitt (2005) and Schmitt et al. (2004a, 2004b) studied human sexual-ity across a wide range of cultures on all continents. They employed self-reports: Respondents were asked various questions about their sexual preferences and prac-tices. In his commentary on that study, Bond (2005) pointed out that there is research evidence from all over the world that men tend to exaggerate their num-ber of lifetime sexual partners, whereas women are less forthcoming. In this case,
the difference is not the same as between reported religiousness and a hypothetical real religiousness, which may be impos-sible to gauge. The difference, if any, is between a statement about a practice and the practice itself. In principle, such differ-ences should be possible to detect, but we know how difficult that may be for a court of law; academic researchers are not in a much better position.
False reporting may also occur at the government level. For various political reasons, national governments may be reluctant to collect and report real sta-tistics. Some Arab countries report zero consumption of alcohol, which is unlikely to be true. Crime statistics are also notori-ously unreliable: A collection of murder rates should rely on more than one source.
7.3.4. TABOOS
There are also whole domains that may be closed to researchers in some coun-tries. One cannot approach a represen-tative sample of female respondents in most Arab countries with questions about sex, and especially their own sexuality. Undemocratic governments will not allow a wide spectrum of political questions. In its cross-national surveys, the Pew Research Center regularly drops such questions in a number of countries. The only option that researchers have in such cases is to abstain from asking questions about taboo subjects or using statistics whose reliability is dubious.
7.3.5. INTELLIGIBILITY PROBLEMS
Intelligibility is a serious issue in any paper-and-pencil study, even if it does not use Likert scales. According to Schwartz (2011), studies of value structures in sub-Saharan Africa resulted in many deviations from theoretical expectations. This repre-sented a challenge to the theory, but an alternative explanation was that the items

Paper-and-Pencil Studies ◆ 111
were too abstract for the respondents and consequently hard to grasp. A less abstract questionnaire produced results for South African and Ugandan respondents that were closer to the theoretical structure.
Consider the following item in Schmitt et al. (2004a), measuring insecure roman-tic attachment: “I want to be completely emotionally intimate with others, but I find that others are reluctant to get as close as I would like. I am uncomfort-able being without close relationships, but I sometimes worry that others don’t value me as much as I value them” (p. 380). One can only wonder how people interpret this overloaded item even if their education is not minimal.
Researchers should also avoid items such as “In this society, orderliness and consistency are stressed, even at the expense of experimentation and innova-tion” (Sully de Luque & Javidan, 2004, p. 619), given by Project GLOBE to middle managers. Even social scientists— let alone managers—are likely to have disagreements about the meaning of these concepts.
Even if the respondents understand the questions and can interpret them unam-biguously, they may have never given them much thought before. As Rokkan et al. (1969) put it in their treatise on opin-ion polls, “The questions an interviewer asks suddenly propel the respondent into a world of thought he never had. He may find the questions incomprehensible and throw up his hands or he may respond with spontaneous thoughts about politics that did not exist before the question was asked” (p. 75). Examples are available in the cross-cultural studies by the Pew Research Center (2002, 2003, 2007) in which nationally representative samples of respondents in developed and developing countries were asked to assess the desir-ability of a market economy, democracy, and a myriad of complex economic and political issues that some ordinary people in many parts of the world may never have thought much about.
Finally, even if the respondents have a perfect understanding of the concepts that the researcher brings up and have some experience discussing them in their own culture (for example, the importance of having children), the research format may be unfamiliar to them. Rokkan et al. (1969) pointed out that rating scales may not be easily comprehensible to respon-dents who are not used to them. This is one of the difficulties associated with paper-and-pencil studies in preliterate or subliterate societies.
7.3.6. SEMANTIC DIFFERENCES
Rokkan et al. (1969) noted that even if literal equivalence of the items can be achieved, it does not necessarily mean that the questions are equivalent in the differ-ent languages. They view this problem as severe, yet manageable. They suggest that the meaning of an item can be established through its statistical correlations with other items (across respondents within the same society), which is what is proposed in 7.5. But what if the correlations suggest diverse meanings in different societies? One can hardly repeat the study over and over again until all correlation patterns are satisfactory. In fact, this may never happen, as it is unrealistic to expect full isomorphism in all societies. Schwartz and Sagiv (1995) and Schwartz and Bardi (2001) found similar value structures within very diverse national cultures, yet some cross-cultural differences in those structures were also evident.
There are two possible solutions to this problem. As suggested in 7.2.4.4.9., when there is no guarantee that nearly all respondents have a good educational level, it makes sense to use only simple items about basic concepts that are likely to be understood in all societies. The sec-ond approach is to verify the meaning of each item in each culture by discussing it with linguists, local social scientists, and psychologists, as well as with the

112 ◆ Studying Culture
respondents. This is a far more time- and-effort-consuming approach, yet it might be indispensable in the case of risky items that have never been used before in large-scale comparative cultural studies. 28
7.3.7. POLITICAL FACTORS
Section 6.2. discussed how some phe-nomena are not comparable across all cultures because they may not exist in some of them. But a problem also may occur when some phenomena do exist in all of the societies in the sample. As Rokkan et al. (1969) pointed out, it would make little sense to compare voting rates across countries if voting is compulsory in some of them but not in others. There is a political factor here that cannot be easily attributed to cultural differences. Similarly, comparing abortion rates may not be very meaningful since abortion laws are very different, ranging from full or nearly full prohibition to allowing com-plete or almost complete freedom, at least in the initial stage of pregnancy. Before comparing statistics of this kind for the purpose of comparative cultural analysis, researchers should assess the degree to which the statistics seem to be affected by various political factors.
◆ 7.4. Test-Retest Reliability of Paper-and-Pencil Studies at the National Level and Other Statistics
Section 7.2.6. demonstrated that the item format may affect the consistency of the results of studies of nationally represen-tative samples in the same year. Some formats produce more consistent results than others and have greater test-retest reliability.
Perhaps the most consistent cross-cul-tural study results are those by the TIMSS
(Trends in International Mathematics and Science Study) project, measuring national differences in educational achievement in mathematics and science (Mullis et al., 2000; Mullis et al., 2005, 2007). For instance, the indices that measured aver-age national achievement in mathematics in the eighth grade in 1999 and 2007 correlate at .95** ( n = 21). The corrup-tion perception indices that Transparency International publishes every year also produce very high correlations of at least .85**, even if they are 10 years apart.
The temporal stability of national sta-tistics is also an important issue. This is, however, harder to estimate than the test-retest reliability of the previously men-tioned indices. Some economic indicators are updated every year in the databases of the World Bank and the United Nations, whereas statistics for other important variables, such as murder rates and sui-cide rates, are not. Still, the available data suggest that, despite some fluctua-tions, these variables are also very stable. Consequently, it is not a mistake to make cross-cultural comparisons on the basis of country data from different years within a five-year period or even longer. However, the reliability issue of these statistics has another aspect: how accurately govern-ments or nongovernment organizations collect and report data.
◆ 7.5. Face Validity
The concept of face validity has impor-tant philosophical and practical aspects. Discussing test comparability and quoting Ype Poortinga (a Dutch research method-ologist), authors Born, Bleichrodt, and van der Flier (1987) distinguished between the qualitative aspects of test comparability (“Does the test refer to the same theoreti-cal dimension?” p. 284) and its quantita-tive aspects (“Does the test measure this dimension on the same scale?” p. 285). The first of these questions illustrates the
Paper-and-Pencil Studies ◆ 113
concept of face validity. Two researchers may have obtained two statistically similar constructs but they may seem conceptually dissimilar because the items that were used to measure them were worded differently.
Absolute face validity exists when the name of an abstract concept is hom-onymous or closely synonymous with key words in the items that are used to mea-sure it. If we wish to measure religiousness and ask the respondents “How religious are you?” or “How important is religion in your life?” we have absolute face valid-ity. The concept is called “religiousness,” and we have words of the same root in the items we are administering. A question such as “How often do you go to church (or another temple)?” would probably also pass a face validity test because most people view churchgoing or attendance of mosque services as an outward expres-sion of religiousness. In that case, we would have good face validity, though not absolute.
There are many examples of cultural or psychological dimensions that are not even close to possessing face validity. If one wishes to measure individualism, one obvi-ously cannot measure it by asking people how individualistic they are because many will not understand this abstract term. Researchers who have studied individual-ism versus collectivism have extracted that construct from items that do not neces-sarily contain the morphemes “individ” or “collect.” This has caused confusion in some academic circles. Commenting on three of the items that define the collectiv-ist pole of Hofstede’s individualism ver-sus collectivism dimension, Bond (2002) made this observation: “How the last three work goals described anything resembling collectivism was, however, a mystery to many” (p. 74). Heine et al. (2002) raised similar concerns about the face validity of Hofstede’s individualism dimension. This is a common situation in the academic lit-erature. Sully de Luque and Javidan (2004) were not convinced that Hofstede’s uncer-tainty avoidance dimension possessed good
face validity, whereas Ashkanasy, Gupta, Mayfield, and Trevor-Roberts (2004) were critical of Hofstede’s fifth dimension, called “long-term orientation,” because they did not perceive anything in the way that it was measured as a clear indication of time orientation.
While face validity is a major issue in the view of some scholars, others are less concerned with it. According to Schwartz and Sagiv (1995), “the meaning of a value is reflected in its pattern of intercorrela-tions with other values” (p. 101). In other words, what an item measures is not defined only by its wording but also by its whole nomological network—the totality of variables in any possible database that it is meaningfully associated with. 29
Deutscher (1973) collected an impres-sive set of materials to show the risk of relying on words to predict deeds. What respondents say should never be taken at face value. The reason is not only that they may intentionally attempt to deceive the researcher. Although this is possible with some types of questions and some respondents, it has not been found to be a major problem in modern culturology (yet see 7.3.1.). A more serious issue is that the true meaning of an item cannot be established without an investigation of its nomological network. For instance, at the national level, importance of work as a stated personal value in the World Values Survey is not negatively associated with importance of leisure and does not tell us anything about how willing people are to sacrifice free time in order to work (Minkov, 2007, 2011). That item actually measures an aspect of pride—the degree to which it is important to the respondents to have an independent source of income so that they do not lose face and feel humiliated. 30 The item does not have face validity as a measure of face or pride, but that is what it measures nevertheless. If we want to measure work orientation, in the sense of a willingness to forgo leisure for the sake of work, as well as acceptance of hard work, we have to use the World

114 ◆ Studying Culture
Values Survey items that ask about the importance of leisure in the respondents’ lives and the importance of hard work as a value for children.
There are even more striking examples. At the national level, some items mea-sure precisely the opposite of what their wordings suggest. 31 We can conclude that although it is convenient to have face validity, it cannot be an ultimate criterion for the interpretation of what an item measures; the “face” of an item may be absolutely misleading.
The message that what items measure is determined by their nomological net-works may sound unnatural to psycholo-gists who work at the individual level. At that level, when there is no face validity, it is often unclear what one has measured. In most cases, once the respondents have disbanded, it is impossible to test the validity of the results by means of correla-tions with external variables. Imagine how hard it is to measure people’s personal-ity traits and obtain their health records, criminal records, school grades, and job performance appraisals for the purpose of validation of the personality test results. Such validation is not absolutely impossible and has been achieved in various research projects, but it is beyond the means of most individual researchers. For that reason, in the majority of cases, psychologists who study individuals have nothing to go by but the respondents’ answers. Face validity is highly desirable in that case, even neces-sary, for a researcher to make sense of the data. Additionally, the data may have to be subjected to various sophisticated statistical tests in order to confirm their reliability.
This is most often unnecessary when one analyzes countries. But examining the nomological networks of single items and complex constructs is a must. There is a wide spectrum of publicly available databases containing a wealth of country data that can be meaningfully related to the results that a researcher has obtained. This may require some additional work, but it is the only way to achieve reliability
in hologeistic culturology, which is a dif-ferent endeavor from psychologists’ stud-ies of individuals.
The conclusion that what an item or dimension measures is determined by its nomological networks may also sound unappealing to researchers who believe that constructs and the items that mea-sure them should be specified theoretically before the actual measurement. But this theoretical approach has resulted in so much confusion (see 5.1.) that it obviously needs serious revision.
◆ 7.6. Common Method Variance and Validation
Despite all controversies associated with paper-and-pencil studies, they have dem-onstrated acceptable reliability in cross-cul-tural research. The best way to prove reli-ability is to show that data from different sources yield similar results. Relying solely on one source may create a problem known as “common method variance,” explained in detail by Chang, van Witteloostuijn, and Eden (2010). In a nutshell, when variables are extracted from a single questionnaire, answered by a single sample of respon-dents, they may all be contaminated with some sort of bias. Therefore, validation is needed through correlations with external variables that are not part of the adminis-tered questionnaire. Any culture-level mea-sure, be it primary or secondary, should be validated in this way.
■ Notes
1. Diener and Lucas (2004) asked college students (60% of whom were 21 years old or younger) in 48 countries what emotions they wanted their children to experience. The three emotions that were rated—happiness, fearlessness, and anger suppression—create

Paper-and-Pencil Studies ◆ 115
geographically scattered country rankings, and their national indices cannot be explained con-vincingly through correlations with external variables. One possible explanation is that col-lege students do not make good samples for a study of issues related to children because they have little or no experience with them and may not even be very interested in that research topic.
2. When the wording of a Likert-scale item contains semantic opposites, it is known as a “semantic differential scale item.”
Example: How would you describe your personal
financial situation these days:
3. Excellent
2. Very good
1. Good
0. Neither good nor bad
–1. Bad
–2. Very bad
–3. Terrible
3. Some important value-measuring items in the World Values Survey are scored on a four-point Likert scale, one of the points being “rather important.” The percentages of respon-dents who choose this option are often negatively correlated with the percentages choosing “very important.” For some items, this correlation is quite strong. The percentages of those who have indicated that friends are “very important” to them (item A002, latest data for each country from the 1994–2004 period) correlate with those who have chosen “rather important” at –.80** ( n = 83). Thus, in a worldwide perspec-tive, “rather important” means “definitely not very important.” “Rather important” is weakly correlated with “not very important” and “not at all important,” suggesting something different from those positions. In summary, the correla-tion analysis suggests that, at the national level, “rather important” means “none of the provided options and absolutely not ‘very important.’”
The happiness item (A008, latest data from each country from the 1994–2004 period) in the World Values Survey is an even clearer exam-ple. The percentages of people who are quite happy are significantly and negatively correlated with the percentages that have endorsed the
other three positions, “very happy,” “not very happy,” and “not at all happy.” Thus, “quite happy” means “none of the other positions.”
Further, the percentages of respondents who have chosen the “rather” or “quite” options normally do not have the same predictive prop-erties as the percentages who have chosen the other positions and obviously do not measure what those positions do.
4. Item A040 in the World Values Survey is a free-choice item that respondents can select from a list of 11 items. It is about the impor-tance of religious faith as a value for children. The information that the item carries cannot concentrate on a particular point of the scale while receding from another point because both options—item selected or item ignored—provide the same information albeit with dif-ferent mathematical signs.
Item A006 measures importance of religion as a personal value on a four-point Likert scale. We can use the latest country scores from the 1994–2004 period to compare how the first item correlates with the second. Over 84 over-lapping countries, A040 (national percentages who have selected the item) produces the fol-lowing correlations with the four positions on A006 (national percentages who have selected a particular position on the Likert scale), as well as the national means for that item:
religion very important .96**
religion quite important –.52**
religion not very important –.90**
religion not at all important –.73**
national means –.92**
We can repeat this exercise with A003, mea-suring the importance of leisure in the respon-dents’ lives on a four-point scale. This item does not have an exact equivalent among the free-choice items. Yet, A030 measures more or less the opposite: the importance of hard work as a value for children. Over 83 overlapping countries, A030 correlates as follows with each of A003’s four positions on the Likert scale and the national means:
leisure very important –.57**
leisure rather important .15

116 ◆ Studying Culture
leisure not very important .55**
leisure not at all important .32**
national means –.54**
In the case of both items (A006, importance of religion, and A003, importance of leisure), it is the extreme positive position on the Likert scale that yields the highest correlation with the free-choice item. The extreme positive position appears to be the most informative, as it is the closest to the respondents’ free choice, which gives it the strongest validation.
It is also possible to test the predictive properties of the four positions of a Likert-scale item with respect to external variables, preferably measuring something real that is free of response style. At least three such variables can be used for testing the four positions and means of item A006 (importance of religion in respondent’s life): average annual suicide rates (calculated on the basis of the males’ and females’ rates from the World Health Organization, 2009b), average national achievement in math-ematics in the eighth grade at nationally repre-sentative schools in 2007 (Mullis et al., 2007), and average national IQs (Lynn & Vanhanen, 2002, excluding scores that are estimates, rather than based on real tests). Below, correla-tions are presented between these variables and national percentages who have chosen particu-lar positions on the Likert scale of item A006. The “quite important” position was dropped from the analysis as it does not have good predictive properties for any external variables and does not carry much information.
Suicide rates ( n = 67)
religion very important –.63**
religion not very important .63**
religion not at all important –.47**
national means –.60**
Achievement in mathematics ( n = 32)
religion very important –.77**
religion not very important –.78**
religion not at all important .53**
national means –.75**
Average national IQs ( n = 53)
religion very important –.79**
religion not very important –.78**
religion not at all important .63**
national means –.77**
The “not at all important” position yields lower correlations than the other options. “Very important” and “not very important” are the best choices, practically indistinguish-able in terms of their predictive properties. The national means are only slightly inferior in terms of the quality of the predictions that they validate. They can be used with nearly the same results as “very important” and “not very important,” but their calculation may require multiple operations. In the case of the World Values Survey, percentages who have chosen “very important” or “not very important” can be copied directly from the website of the organization, with no need for any calculations.
5. Van Herk et al. (2004) attempted to detect response style by comparing measures of attitudes toward men’s shaving and frequency of shaving within selected European nations. But this comparison proves nothing. If a respondent states a very positive attitude toward shaving but does not shave often, that could mean that he does not have much time to shave, that wear-ing a stubble is fashionable in his environment, or a variety of other scenarios that may have nothing to do with response style.
6. Imagine that the items are “How important is God in your life?” “How reli-gious are you?” “How often do you attend religious services?” and more of the same type. The answers must be provided on a 5-to-1 Likert scale, where 5 is the positive extreme, “very important,” “very religious,” and so forth. Respondent A is a born-again Christian, whereas respondent B is secular minded. It is only natural that many of A’s scores will be close to 5, whereas B will avoid that position. We have no basis for a conclusion that A’s or B’s answers reflect a peculiar response style that is not substantive.
7. For example, Harzing (2006) studied response style across 26 countries but did not verify the number of factors that the question-naire items yielded: “As we are interested in response style patterns, not in the scoring on individual questions or constructs, we did not construct scales” (p. 262, note 4).

Paper-and-Pencil Studies ◆ 117
8. Consider the case of Hofstede’s (1980) data. He calculated an index coded IMP—the mean importance that each nation in his samples attached to 14 work goals. Hofstede’s IMP is strongly correlated with item A169 in the World Values Survey (latest country data from 1994–2004), which asks the respondents what is better for promoting good human relationships: understanding others or expressing one’s own preferences. The item is not scored on a Likert scale and involves a free choice; the respondents can also choose “both” or “neither.” The national percentages who have chosen “express one’s own” correlate with Hofstede’s reversely scored IMP at –.80** ( n = 29); a lower IMP means a higher average importance of all work goals in Hofstede’s study and is associated with a stronger belief that one should express one’s own preferences, presumably in an unambiguous manner. Latin Americans had the highest IMP scores. This is not surprising in view of their proneness to be expressive.
9. In a study of the cultural determinants of response style, Johnson et al. (2005) found that all of Hofstede’s dimensions were associated with different response styles. Smith (2004a) studied a particular type of response style—acquiescence—and found that his measures of it were predicted by various cultural dimensions, including Hofstede’s individualism. He con-cluded that national indicators of acquiescence have substantive cultural meaning. Harzing (2006) arrived at the same conclusion. She stud-ied five types of response style: acquiescence, disacquiescence, positive extreme response style, negative extreme response style, and middle response style. Smith’s and Harzing’s studies concur in their findings: Acquiescence and posi-tive extreme response style are highly correlated with Hofstede’s power distance dimension and negatively with his individualism dimension. Johnson et al. (2005) also concluded that acqui-escence was positively associated with power dis-tance at the national level. The cases of the other types of response style studied by Harzing were less clear.
Most recently, Smith (2011) analyzed agree-ment, disagreement, and extremity in response styles across a large number of cross-cultural studies and reiterated his previous conclusion
(Smith, 2004b)—response styles are closely associated with cultural dimensions: “The ten-dency of individuals in different nations to agree or disagree is most concisely explained by measures derived from the concept of individualism-collectivism. The nation-level frequencies of agreement plus disagreement are best explained by Minkov’s dimension of monumentalism-flexumility” (Smith, 2011, p. 217, abstract).
10. The effect of the item content can also be observed in the answers of individuals. In my freelance work as a management consul-tant, I was once invited by the Bulgarian own-ers and top executives of a private company to do a project on the company’s culture. The company leaders were given a 30-item ques-tionnaire that asked them to describe the ideal company by rating the importance of various characteristics on a 10-point scale. A set of another 30 items, also scored on a 10-point scale, asked to what extent these characteristics were really present in the company. One of the leaders gave 28 of the 30 characteristics of the ideal company a score of 10, a remarkable case of extreme response style and an almost complete failure to discriminate between the 30 characteristics. Yet, in his assessment of the real situation in the company, the same leader provided lower and varied scores. Thus, the same person exhibited two very different response styles on the same scale, depending on the nature of the questions.
11. Schmitt and Allik (2005) adminis-tered Rosenberg’s self-esteem scale to 16,998 respondents from 53 nations. The scale con-tains positively and negatively worded self-esteem items, such as “I feel that I am a person of worth, at least on an equal plane with others” and “All in all, I am inclined to feel I am a failure.” The two types of items are scored inversely, so that one gets a high num-ber of points for agreeing with the positive statements but also for disagreeing with the negative statements. Consequently, the posi-tively and the negatively worded items should yield a high positive correlation. Indeed, this was the case in some countries in Schmitt and Allik’s study, but not in all. They published correlations between the positively and the negatively worded items for each nation.

118 ◆ Studying Culture
These correlations correlate with the average national IQs in Lynn and Vanhanen (2002, Table 6.5, excluding estimates) at .70** ( n = 40). Nations with a higher national IQ, which is indicative of higher average educa-tion, produced higher correlations between the positively and negatively worded items. The plausible interpretation is that respon-dents from poorly educated nations simply do not understand the items well. Hofstede’s power distance and individualism are not good explanations in this case as they cor-relate with Schmitt and Allik’s correlations at –.42* and .44* ( n = 37).
Harzing (2006) presented four types of response style scores for 29 nations and ethnic groups. Three of these are highly correlated with Lynn and Vanhanen’s (2002) national IQs: r = –.88** for positive extreme response style, –.63** for acquiescence, and .53** for middle response ( n = 25 for all correlations). A regression model with Hofstede’s dimen-sions would be unreliable as it would be based on only 18 common cases, yet the zero-order correlations leave little doubt that IQs pro-vide a better explanation for positive extreme response style (power distance correlates with it at .66** across 20 cases, whereas individu-alism produces a correlation of –.48). Power distance, however, is a better predictor of acquiescence: r = .72**.
McCrae and Terracciano (2005) studied personality profiles in 51 cultures and provided an acquiescence estimate. It correlates with Lynn and Vanhanen’s (2002) IQs at –.38* ( n = 38). Schmitt et al. (2007) also studied person-ality traits, this time across 56 nations. Their acquiescence estimate produces an insignificant Pearson correlation with the national IQs, although the Spearman correlation is –.38* ( n = 41). Neither of the two measures of acqui-escence is significantly correlated with power distance or individualism. It is also notewor-thy that the acquiescence indices in the three studies discussed so far are not intercorrelated significantly.
12. It is also unclear if it makes sense to ask nationally representative respondents if they are, for instance, “a citizen of the world” (item v210 in the 2005–2008 World Values Survey).
The highest percentages of people who agree strongly with this statement are in Mali—61.8, followed by Ghana—46.3, Burkina Faso—45.4, Rwanda—43.1, and Ethiopia—41.5; the lowest are in Japan—14.6, and Germany—17.7. Why should such high percentages of Africans have a strong feeling that they are citizens of the world, while Germans and Japanese are more reserved? Most likely, this question measures a particular type of response style—the degree to which respondents are likely to endorse the positive extreme when they do not understand the question.
13. A decision not to use Likert scales will not have the same consequences at the individ-ual level and the societal. At the individual level, the opportunity to measure intensity would be lost. At the societal level, there would still be an indication of intensity as far as the whole soci-ety is concerned: the percentage of respondents who have endorsed a particular free-choice item or answered positively to a categorical forced-choice item. It is also noteworthy that a decision not to use Likert scales will generate its own issues, as we see in 7.2.5. and 7.2.6.
14. In the 2005–2008 World Values Survey, Hong Kong exhibits an unprecedented response style in the answers on a group of free-choice items—v12 to v21—that measure the importance of various values for children. Hong Kong is the lowest scorer among 57 countries on 9 of those 10 items, measured as percentages of respondents who have endorsed them. While the average 10-item score ranges from 37.4 (in Ukraine) to 51.6 (in Indonesia) for the other 56 countries in the survey, Hong Kong’s average is only 9.7; it seems that hardly any values for children are considered impor-tant in Hong Kong!
15. An alternative standardization method for eliminating extreme responding is described by Fischer (2004): The mean all-item scores can be partialed out of each respondent’s raw scores by means of partial-correlation analysis or regression analysis. This procedure creates various dilemmas, however, as discussed in Fischer’s article: For instance, should the item of interest (which is being purified of response bias) be included in the calculation of the all-items mean or not?

Paper-and-Pencil Studies ◆ 119
16. Within-subject (z-score by case) stan-dardization is the opposite of within-group (z-score by variable) standardization (Fischer, 2004). Both standardizations involve a trans-formation into z-scores, a procedure discussed in all handbooks on statistics. It boils down to a subtraction of a mean score from a raw score followed by a division by a standard deviation. The difference between the two standardiza-tions is what mean and what deviation are used.
The more common procedure is the z-score standardization by variable. In this case, one calculates the difference between a respon-dent’s score on a particular item and the mean score of the whole sample of respondents on that same item. This difference is then divided by the group’s standard deviation for the same item. Thus, z-score standardization by variable is performed on a single item/variable. It is useless for correcting response style, but it is a good tool for preparing differently scored items for data reduction (see 8.2.8.).
Z-score standardization by case requires many items and gives an estimate of how a respondent has answered each item relative to the other items. In SPSS, it is available only for some analyses, such as multidimen-sional scaling and hierarchical cluster analysis. Researchers who wish to use this standardiza-tion for the purpose of factor analysis with SPSS must perform it themselves.
17. Example: Let us consider z-score standardization by
case at the individual level. Imagine that we have seven items on a five-point Likert scale. Person A and person B have provided the fol-lowing answers to those seven items:
A 5 5 5 4 5 5 5 B 3 3 3 4 5 3 3
Because the items are conceptually and sta-tistically unrelated, we suspect that person A has a tendency to choose one of the extremes of the scale (5), whereas person B tends to avoid the extremes and prefers the middle (3). We conclude that most of person A’s answers are inflated by his or her response style, whereas person B’s answers may be deflated. What is the magnitude of this inflation and/or deflation? An assumption can be made that in
both cases it is equal to the respondents’ mean scores: 4.86 for person A and 3.43 for person B. Following this logic, we subtract 4.86 from all of A’s scores and 3.43 from all of B’s scores.
However, we may be concerned that this procedure is not sufficient to eliminate extreme responding in the answers of individuals who endorse both ends of the scale. Imagine the following response patterns for respondents A and B on a Likert scale from 0 to 10:
A 10 0 10 0 10 0 B 6 4 6 4 6 4
After subtracting the means from these scores (5 for A and 5 for B), we obtain the fol-lowing scores:
A 5 –5 5 –5 5 –5 B 1 –1 1 –1 1 –1
Even after the subtraction of the mean, it is clear that A uses a wider range of the scale than B. If we are concerned that this is still an indication of bias, we can further divide each respondent’s transformed scores by their aver-age deviation from their mean raw (untrans-formed) score: 5 for A and 1 for B. After this operation, their scores become fully identical:
A 1 –1 1 –1 1 –1 B 1 –1 1 –1 1 –1
18. Fischer (2004) also discusses standard-ization across constructs (p. 267). Whatever the logic of such standardization may be at the individual level, its utility at the country level is unclear.
19. Ipsative (from the Latin ipse, “the same”) refers to the study of one individual without comparing this individual to other individuals. An example of this could be a comparison of an individual’s item scores to the same individual’s all-items mean.
20. Suppose person A has a raw score of 5 on importance of religion, whereas person B has a raw score of 4. Yet, person A’s stan-dardized score on that item may be only 0.5 (because that person attached a great impor-tance to many other values as well and religion does not stand out much for that person), whereas person B’s standardized score may be 2.5 (because that person attached a very low

120 ◆ Studying Culture
importance to most other values while religion stands out for that person ). In that case, the z-score standardization by case has revealed that—in relative terms—religion is not a very prominent value for person A but it looms large for person B. The standardization may be deemed useful because it highlights relative differences of this kind, not because it reveals some absolute truths.
21. Note 14 describes a peculiar Hong Kong response style in the 2005–2008 World Values Survey. In a multidimensional scaling model based on raw-score Euclidian distances between the 10 values for children, Hong Kong is such a strong outlier that it seems to have a culture from outer space. However, if z-score standardization by case is applied, Hong Kong will be found amid the other East Asian countries. Despite its improbably low raw scores on all 10 variables, it appears that, after all, Hong Kong society prioritizes these 10 values for children much like the other East Asian countries. The same is true of other countries: Although Malaysia is not as strong an outlier as Hong Kong, it is far from East Asia if raw scores are used, but close to it on z-standardized scores by case.
22. After a review of influential books and papers on the effect of environment on children’s psychological development, Plomin, Asbury, and Dunn (2001) reported that even siblings who grow up in the same family react differently to ostensibly shared environmental influences.
23. Fang (2003) criticized the study by the Chinese Culture Connection (1987) because, in his view, its results suggested that some of the items in the research questionnaire reflect oppo-sites in Chinese culture while in fact the concepts behind them exist in a dialectical unity.
24. Item A044 of the World Values Survey (prior to 2005) asks the respondents to choose the most important of four values for children: thrift, obedience, determination, or religious faith. The percentages who chose religious faith as a first priority correlate with the per-centages who chose religious faith for children as a free-choice item from a list (item A040, latest data for each country from 1994–2004 for both items) at only .71** ( n = 50). The
forced-choice and the free-choice item produce the following correlations with an important external variable that can be used for valida-tion purposes— average annual suicide rates for men and women (calculated on the basis of data from the World Health Organization, 2009b):
A044 (forced choice) –.56** ( n = 44)
A040 (free choice) –.64** ( n = 68)
Another similar test yields similar results. This time, we correlate the two items that mea-sure importance of religious faith for children with measures of national IQs (disregarding estimates), collected by Lynn and Vanhanen (2002), which is a reliable national indicator of level of modern education:
A044 (forced choice) –.39** ( n = 32)
A040 (free choice) –.76** ( n = 54)
These examples suggest that forced-choice rankings yield less valid information than free-choice items, yet additional research is obviously needed on this important methodological issue.
25. A comparison between World Values Survey item A006 (religion is very important in respondent’s life, latest data for each country from 1994–2004), which is scored on a Likert scale, and item A040 (importance of religious faith for children, latest data for each country from 1994–2004), which is a free-choice item, reveals that the former yields higher correla-tions than the variables that we used previously for validation:
Suicide rates ( n = 67 in both cases)
A006 –.63**
A040 –.58**
IQ ( n = 54 in both cases)
A006 –.80**
A040 –.76**
26. The respondents were presented with a list of items and asked which of them are important for children. They were instructed to choose up to five items. The percentages of respondents who chose each item in the two studies in Turkey in 2001 are provided below as reported on the World Values Survey website.

Paper-and-Pencil Studies ◆ 121
Item Description and Code
Percentage of Turkish Respondents Who Chose Item in Study 1a
Percentage of Turkish Respondents Who Chose Item in Study 2b
good manners (A027) 92.1 93.0
independence (A029) 15.7 12.7
hard work (A030) 74.3 73.2
feeling of responsibility (A032) 62.7 62.7
imagination (A034) 23.0 19.9
tolerance and respect for other people (A035)
64.3 57.5
thrift: saving money and things (A038)
28.7 30.1
determination/ perseverance (A039) 20.4 22.2
religious faith (A040) 44.1 54.3
unselfishness (A041) 20.4 26.0
obedience (A042) 39.7 47.0
Source: World Values Survey website (www.worldvaluessurvey.org), data for Turkey, 2001.a. September 1, 2001 to October 31, 2001.b. December 1, 2001 to January 1, 2002.
27. Compare the answers to question A006, which measures the importance of religion in the respondents’ lives and forces the respon-dents to provide an answer. The following
table shows the percentages of Turkish respon-dents who chose the extreme positive position “very important” on a four-point Likert scale in each of the two studies in Turkey in 2001.
Item Description and Code Percentage in Study 1 Percentage in Study 2
importance of religion in respondent’s life (A006) 80.4 81.9
Source: World Values Survey website (www.worldvaluessurvey.org); data for Turkey, 2001.
28. On the other hand, some concerns about potentially divergent meanings may be exaggerated. Criticizing a study of willingness to fight for one’s country by Paez et al. (2008), Gibson and Noret (2010) argued that some studies have shown that when people say they are willing to fight for their country, they could mean either the people and the territory or the national government; hence, “country” is ambiguous. Yet, except in the case of civil war or guerrilla warfare, it is not clear how some-one could claim to be fighting for the people or territory of his country without fighting for the national government.
29. As an example, consider “wisdom,” measured as a value. Without any analysis, one might think that importance of wisdom is associated with the importance of some kind of cognitive ability. Country-level analyses of value structures by Fischer, Vauclair, Fontaine, and Schwartz (2010), however, revealed that “wisdom” may refer to “maintaining con-nections to the past (e.g. devout, honoring elders). Societies high on embeddedness [that is, traditionalism and conservatism], attribute importance to wisdom” (p. 147). As a result, importance of wisdom may be a good item to measure something associated with Schwartz’s

122 ◆ Studying Culture
conservatism, even if it lacks face validity for that purpose. A cross-cultural study by Noorderhaven and Tidjani (2001) revealed that “wisdom” was considered especially important in Africa, but far less so in East Asia.
30. World Values Survey item A005 asks the respondents how important work is in their lives. Interestingly, East Asia and Vietnam have relatively low percentages of respondents who endorse this item, far lower than respon-dents in Latin America, the Arab world, or Africa. Response style cannot explain this geographic pattern because it is not exhibited in the same way in the answers to other items in the same section.
A list of correlations is provided below between A005 (percentages of respondents who indicate that work is very important to them) and some other World Values Survey items, using latest data for each country from 1994–2004:
Item Code and Description
Correlation With Item A005
D054 (percentage who agree strongly that one of the major goals in their lives is to make their parents proud)
.72** (n = 70)
C037 (percentage who agree strongly that living on welfare is humiliating)
.72** (n = 59)
G006 (percentage who are very proud to be citizens of their countries)
.62** (n = 84)
A003 (percentage to whom leisure is very important)
.06 (n = 84)
A030 (percentage who choose hard work as an important value for children)
.16 (n = 83)
On the other hand, importance of leisure as a personal value (A003) and importance of hard work for children (A030) are cor-related at –.57** ( n = 53). Nations with high percentages of respondents who are indifferent to leisure are also nations where high percent-ages of respondents would like their children to be hardworking. Of note, this combination is most typical of the developing parts of Asia and in the Eastern European countries, whereas Latin America, just like Northwest Europe, scores low on it.
31. Minkov (2008) reported the follow-ing example. OECD PISA (2003) is a project that measured the educational achievement of same-age students from nationally representa-tive schools in 41 countries. The students were also asked about their attitudes toward the school subjects in which their performance was measured. The national percentages of students who agreed strongly that they would like to be among the best mathematicians in the class, as well as the national percent-ages of students who stated that they always tried to be better in mathematics than the rest of the class, are negative predictors of average national achievement in mathematics. The statements of the students who indicate they want to be among the best and strive to achieve that goal may seem to have face validity as indicators of positive motivation and willingness to put a lot of hard effort into the study of mathematics, but they reflect the opposite. The apparent paradox can be inter-preted in the light of Dweck’s (2007a, 2007b) findings: The students are actually telling us that they want to earn admiration, not that they are ready to study hard.

◆ 123
Sociologists and most other social scientists regard the establishment of generalizations or “laws,” i.e. verified statements of correlations between phenomena, as their primary aim.
—George Murdock, American anthropologist (Murdock, 1940, p. 364)
Subjective constructions are the essence of art, but do they also occur in science? Do scientists see vastly different things when they look at the same constellation of data?
—Stephen J. Ceci, American psychologist and intelligence expert (Ceci, 1996, p. xiii)
This chapter discusses various issues associated with the analysis of cross-cultural data, mostly at the societal level. It defends a relativist
position. Although it is reasonable to adhere to some generally accepted conventions, one should not believe in absolute rules in data analysis because they cannot have an objective foundation. Hence, the selection of a particular analytical tool should be guided by practical consider-ations that may depend on the nature of each specific scenario.
In the words of Gorsuch (1983), “All scientists are united in the com-mon goal: they seek to summarize data so that empirical relationships can
8 DATA ANALYSIS

124 ◆ Studying Culture
be grasped by the human mind” (p. 2). Hologeistic culturology pursues the same goal and uses data analysis to produce easily understandable models of cultural variation across large samples of societies. These models can be used to make valid predictions, such as “Because society S belongs to type T, it most probably carries characteristic C,” or “Because society S has a high score on value V, it must have a relatively low score on norm N and a high score on behavior B.” Also—although cause-and-effect relationships are most often impossible to prove in the social sciences—an analysis might at the very least result in the conclusion that behavior B is attributable to cultural value V and not to value W.
This chapter omits, or mentions only briefly, various types of analyses that pertain to the study of individuals, as in cross-cultural psychology or cross-cultural management. Examples of such analyses are comparisons of intracultural factor structures across societies, assessment of agreement among respondents to justify data aggregation to the societal level, and multilevel analysis of variance. Because these analyses reveal patterns across individuals, they are outside the domain of hologeistic culturology. Nevertheless, we must recognize their potential to provide interesting insights for cultural comparisons and welcome interdisciplinary studies that compare not only whole cultures but also individuals from different cultures.
As this is not a book on statistics, it largely disregards the mathematics behind the tools that researchers can use to construct models. The focus is on the potential practical appli-cations of these tools and the main controversies that are associated with their use. This, it is hoped, will help students of cultural differences or other domains in the social sciences and psychology gain a clearer understanding of the inevitable relativity and subjectivity of the results that the statistical tools yield. As a result, they should be able to make more informed decisions when selecting an appropriate instrument for the analysis of their data.
Before researchers can start looking for patterns across cultures, they need to resolve a number of data selection issues. The next sections provide a short overview.
◆ 8.1. Sample Issues
Section 7.1. discussed the implications of different samples of individuals for cross-cultural analysis. The choice of those samples—provided different choices are available in the first place—should be made before the data are collected. In that sense, the sampling of individuals is not part of the data analysis in cross-cultural research. What may be the first step in that analysis is the selection of cultural units for which data are available.
8.1.1. SELECTION OF AN APPROPRIATE SAMPLE OF SOCIETIES
In many cases, sociologists try to collect, and work with, representative s amples
of individuals adequately representing a particular community. For instance, if they need to predict general election results, they will attempt to obtain a nationally representative sample providing a minified image of the whole society. Sociologists know how to select such samples so that they reliably reflect the composition of a given population and are usable for making valid predictions. But how can one select a representative sample of soci-eties, for instance, nations, that paints a representative cultural picture for the whole world? In the words of Schwartz (1994), “Unless the sample of nations studied is a reasonable representation of the full heterogeneity of cultures, different dimensions may emerge in culture-level analyses of different samples of nations” (p. 90). This is true. A pattern found across one sample of countries may not be confirmed across a different sample.

Data Analysis ◆ 125
It is well known that savings rates are a strong predictor of economic growth across developing nations but not across rich ones (Dornbusch, Fischer, & Startz, 2004). Each time we alter the sample, we may obtain a somewhat different correla-tion, a different dimension, or different predictors in a regression model. Can we select a relatively small number of coun-tries, such that if one finds a particular pattern of results across those countries, the same pattern would be confirmed if one could study all countries of the world at the same time? Unfortunately, at this stage of the development of the cross-cultural field, the answer is negative: No one knows how to compose a globally representative sample of nations. There are opinions to the contrary, but it is hard to agree with them.
Unlike the situation in sociology, there is only a vague idea in the cross-cultural field of the potential criteria for the selec-tion of countries that might be repre-sentative of the whole world. Usually, researchers imply that their samples are representative by stating something along the lines of “The samples come from every inhabited continent” (thus Schwartz, 1994, p. 98). Having countries from all continents seems good but is not sufficient. A researcher could select only the rich countries from Europe, North America, and Asia, plus some relatively wealthy South American and African countries: Argentina, Chile, Uruguay, South Africa, and Botswana. What will emerge from this analysis of well-to-do nations is unlikely to be representative of the globe. But such a selection of predominantly developed countries is quite plausible because there are reliable data about the rich nations in most international databases, but the situation in the rest of the world is much more obscure. There are many African countries whose cultures have never been studied in a large-scale project that allows comparisons with other countries. For instance, currently there is hardly any African nation for which suicide rates—an
extremely important cultural indicator—are available from a reliable source.
Having a balanced sample from all continents, including rich and poor coun-tries, may be a step in the right direction but it is still not sufficient. It may be the case that for the purpose of what is being studied, some continents are quite homogeneous, whereas others are not. In Europe, HIV rates vary within a narrow range—between 0.2 and 1.5%—but in Africa the range is between 3 and 30%. While two or three European countries may be enough to represent the situation in Europe, many more African countries are needed for a realistic picture of that continent. This would not be the case, however, if the object of study were reli-giousness. The available evidence from the World Values Survey and the Pew Research Center shows that there is little variation in Africa in terms of religious-ness, as almost all nations on that conti-nent score very high by any standard. But in Asia, the variation in religiousness is enormous. This creates an obvious conun-drum. If we want a representative sample, what should it represent: the worldwide situation with respect to HIV rates, reli-giousness, or something else? One sample of countries cannot be representative of the world for all possible practical pur-poses in cross-cultural analysis. 1 Besides, adding or removing a single country from a sample of 40 or 50 can sometimes result in a completely new cross-cultural model or structure even if that country does not appear to be an outlier (a case with unusu-ally high or low scores on some variables). Which variant of the sample better rep-resents the world: with or without that country?
Apparently, we must accept the idea of working with convenience samples of nations or ethnic groups and remember that our results may not be confirmed across a different sample. This uncertainty may upset those who believe in absolute truth and imagine that the study of a sample that does not truthfully represent

126 ◆ Studying Culture
the globe gives only part of the truth about the world’s cultures or no truth at all. It was already stated in this book that the task of the cross-cultural researcher or any other social scientist need not be seen as a quest for an absolute truth. A piece of research may be interesting and valid even if it is based only on European countries and reveals what seems like a European truth. A study of exclusively African countries may also have its logic and yield practically useful results. The ultimate criterion by which a particular study should be judged is not how close it is to a hypothesized absolute truth about the whole world but what practical utility it has for a specific purpose.
8.1.2. GALTON’S PROBLEM
This problem bears the name of English mathematician Francis Galton (1822–1911) and is an extension of the problem discussed in the previous section. Galton critiqued a paper by the famous anthropol-ogist Edward Tylor because, in Galton’s view, some of the societies in Tylor’s sam-ple were so similar by virtue of their geo-graphic proximity and common history that they need not be counted as different cases but as one. From Galton’s perspec-tive, societies in neighboring or historically related regions can sometimes be viewed as duplicates of one another in terms of many traits (Dow, Burton, White, & Reitz, 1984). This can obfuscate cause-and-effect relationships.
For an illustration of Galton’s problem (also known as an “autocorrelation prob-lem”), consider the following example. There is evidence that pastoralist societies are more likely than those of hunter-gath-erers, horticulturalists, or intensive agri-culturalists to have a concept of a supreme deity that is supportive of a certain human morality (Moor, Ultee, & Need, 2009). But does that mean that it is animal hus-bandry that breeds such concepts? A con-fusion of correlation and causation is not
the only issue here. There are at least two additional issues to be considered:
1. Some of the seemingly different pastoralist societies in the available sample may in fact be relatively recent offshoots of a single ethnic group, for instance, clans that have split for political reasons but are still almost indistinguishable cultur-ally. What is the logic of counting them as different cultural observations? Doing so may create a statistical problem: We might be comparing a few observations of significantly different agriculturalist soci-eties with many duplicates of the same pastoralist society.
2. Even if the pastoralist societies are not recent offshoots of a single ethnic group, they may have lived for a long period in the vicinity of each other. As a consequence, they all share an idea of a supreme deity that is supportive of human morality but the reason for that may not be associated with animal husbandry. The common concept may have been transmit-ted from one society to another without having anything to do with the main type of economy.
Many modern nations exist not because they have a distinct culture that developed on its own but because of various quirks of history. If the political scenario had unfolded differently, Pakistan, India, and Bangladesh could have stayed together after the British rule. Or the British could have split the region into 50 countries and today we would have had 50 observa-tions. From a cultural viewpoint, what justifies the treatment of Pakistan, India, and Bangladesh as precisely three cases and not one or 10 or 20 or 50? The same question applies to the Arab world and Latin America.
Anthropologists have been particularly sensitive to Galton’s problem. Cross-cultural psychologists and management experts have usually ignored it, although Lenartowicz and Roth (2001) did suggest

Data Analysis ◆ 127
that cross-cultural studies should identify and verify “‘proper’ cultural groupings prior to examining cultural influences” (p. 306). Parker (1997) also devoted sig-nificant attention to what he called the “positive spatial autocorrelation” prob-lem, which amounts to “confusing statisti-cal degrees of freedom with theoretical degrees of freedom” (p. 15). This means that the number of observations that are available for statistical analysis is not nec-essarily the number (and type) of observa-tions that are needed for a good analysis, at least from a theoretical perspective. Parker pointed out that it is unrealistic to expect that Belgium and the Netherlands will ever have very different economic growth rates or that substantial productivity gaps will appear among Central American nations; therefore, those countries are not indepen-dent observations.
There are multiple approaches to Galton’s problem. 2 All of these are asso-ciated with various difficulties, and their proponents have been notoriously prone to criticizing each other’s arguments.
Ultimately, Galton’s problem is a prob-lem of the search for truth. According to Dow et al. (1984), “the presence of auto-correlation produces inefficient estimates of the regression coefficients: estimates will vary widely from the true coefficient” (p. 755). The authors subscribe to the idea that there is an absolute truth out there, waiting to be discovered. Some samples of cases give a better glimpse of the truth, while oth-ers obfuscate it. In view of all the debates about Galton’s problem and other com-plexities in the social sciences, one can only wonder who can define that truth. How samples are to be selected is a matter of practical purpose, not a search for absolute truth. There is no one best way to select a sample. If different samples produce differ-ent results, a good practical solution is not to search for the ideal sample but to pro-vide a plausible explanation for the differ-ent results that the available samples yield.
Besides, the fact that Galton’s problem is so acutely felt by anthropologists but not
by cross-cultural psychologists may reflect the different interests of the two fields. Anthropologists study meanings, institu-tions, taboos, technologies, and practices—such as the use of the plow or rice cultivation—that can travel across soci-eties. Cross-cultural psychologists study values, beliefs, norms, cognitive skills, and perceptions that are not at all easy to adopt from another culture. A secular society cannot decide that another society’s strong religiousness is a good thing and borrow it. Nor can values be imposed on a population that rejects them. 3
Thus, if two societies have similar scores on a particular value, the question of who borrowed from whom is largely irrelevant because most likely no borrow-ing was involved.
8.1.3. MISSING DATA BIAS
Missing data are often a problem: One wonders whether the results would be the same if all available cases were represented on all of the variables in the study. Missing data can be imputed by means of various related imputation techniques that use multiple regression models. Comparisons of simulated and actual data sets dem-onstrate that the approach is acceptable (Raghunathan, Lepkowski, van Hoewyk, & Solenberger, 2001). 4 Yet, as Dow and Eff (2009) admit, these tools work under some theoretical conditions but not others. Therefore, the simplest way to treat miss-ing data is to leave them out and accept the fact that if they were not missing the results may have been somewhat different.
◆ 8.2. Dimensions of Culture
Cross-cultural psychologists Kuppens et al. (2006) discuss two main approaches to the study of emotions: the discrete emotions approach and the dimensional approach. Followers of the first approach assume

128 ◆ Studying Culture
that there are “a number of (basic) discrete emotions that are qualitatively different in terms of antecedent conditions, physiologi-cal correlates, subjective experience, and/or expressive behavior” (p. 492). From this perspective, emotions have a categorical structure. Another possibility is the dimen-sional approach: Emotions can be orga-nized into two basic dimensions, although their nature has been debated.
This illustrates two possible approaches to organizing complex data in such a way that the human mind can make better sense of the available rich information. One is discrete typological classification. This implies that the objects of the study possess some categorically different traits that place them in mutually exclusive cat-egories, such as man versus woman. The second approach assumes that the differ-ences between the objects of the study are clinal (gradual). For example, one person is more religious than another, but yet another person can be still more religious. The levels of religiousness of these people are not categorically and discretely differ-entiated; they can instead be imagined as different points along a single continuum, called a “dimension,” conceptually similar to physical length or height.
The typological approach has produced convincing results in the natural sciences; think of Mendeleev’s periodic table of chemical elements or the assignment of liv-ing organisms to kingdoms, phyla, classes, orders, and other categories. However, typologies of modern societies are rare. 5 On the other hand, Leung and Bond (1989) described the identification of dimensions of culture as a major goal in cross-cultural psy-chology. 6 This is also one of the main goals of hologeistic culturology to which signifi-cant attention is devoted throughout 8.2.
8.2.1. THE UTILITY OF THE DIMENSION PARADIGM IN CROSS-CULTURAL RESEARCH
The dimension paradigm has become extremely popular in many research areas
and especially in the personality domain. Dimensions have been reported for human personality (Costa & McCrae, 1985; McCrae & Costa, 1989; McCrae & John, 1992), chimpanzee personality (King & Figueredo, 1997; Weiss, King, & Figueredo, 2000), dog personality (Svartberg & Forkman, 2002), horse per-sonality (McGrogan, Hutchison, & King, 2008), and even android personality as perceived by humans (Ho & MacDorman, 2010). The practical implication of the lat-ter type of research is that people’s comfort zone is affected by the facial features of computer characters and robots depend-ing on how they score on “humanness,” “eeriness,” and other android dimensions. This can be useful information for the entertainment and robot-manufacturing industries. Studies of brand personality (Aaker, 1997; Aaker, Benet-Martinez, & Garolera, 2001; Geuens, Weijters, & De Wulf, 2009) have produced dimensions that can be of good use to marketing and consumer behavior experts.
Before explaining what dimensions of cultures are and how they can be con-structed, it is necessary to address their practical utility. As all dimensions in the same research paradigm, they possess a number of characteristics that make them practically useful:
1. Dimensions of culture reduce the enormous record of observed cultural dif-ferences in the world to a small number of imaginary variables that help us make sense of the seemingly unfathomable com-plexity across the globe. They highlight cultural regularities and broad patterns that would otherwise remain invisible or obscure.
2. Dimensions of culture explain the similarity between the variables that define them. They can be conceptualized as the invisible glue that holds together seemingly unrelated social phenomena, for instance, religiousness and national pride, or a sense of personal life control and happiness.

Data Analysis ◆ 129
3. Dimensions of culture have predic-tive properties with respect to exogenous (external) variables. For instance, Hofstede’s (1980) uncertainty avoidance dimension, derived from 1970 data, predicts national differences in the perceived importance of job security in the 2005–2008 World Values Survey, whereas Minkov (2011) showed that a dimension called “industry versus indulgence,” measured around 1998, predicts national differences in speed of economic growth from 1998 to the global financial crisis in 2008. Although dimen-sions of culture are not, strictly speaking, determinants of what they predict, it is often possible to conceptualize them as factors that are instrumental in the occurrence of various social phenomena and are therefore in a hypothetical cause-and-effect relation-ship with them.
4. Dimensions of culture highlight differences and similarities between coun-tries. They can be used to assess cultural distances (albeit roughly and probabi-listically) and draw cultural maps of the world. Hofstede’s (1980, 2001) dimen-sions of national culture served as a basis for a cultural distance index developed by Kogut and Singh (1988), subsequently used by many researchers to estimate the impact of cultural differences and dis-tances on a wide range of business mergers and acquisitions outcomes (Stahl, 2008). Although Shenkar (2001) and others chal-lenged this method, the concept of cultural distance still has some popularity in the cross-cultural management literature. 7
8.2.2. THE NATURE OF CULTURAL AND OTHER DIMENSIONS
In social science and psychology, two main approaches—one simple and one complex—can produce dimensions. The simple approach involves construction of a dimension by selecting a few correlated variables of interest and merging them into a single dimension (in this case, it is often called a “scale”), disregarding the
relationships among other (unselected) variables and the selected ones. The com-plex approach is used to establish the dimensionality created by all variables in a particular data set: It is like producing a coordinate system for a space without such a system. The construction of dimen-sions in this way is called “extraction” in the jargon of statisticians.
Let us start with the simple approach. In this case, a dimension can be concep-tualized as a continuum defined by sev-eral strongly correlated variables. At the individual level, if people who are often nervous are also often shy and depressed, it appears logical to view shyness, ner-vousness, and depressiveness as related facets of one single personality dimension. Each person who has participated in stud-ies of these traits can be assigned a single score on that single dimension or scale. The simplest way to do that is to average each person’s shyness, nervousness, and depressiveness scores. The same can be done with a selection of some correlated country indicators to produce a nation-level dimension.
How does this reductionism help us simplify the complexity of the world? By allowing us to make predictions about what we do not know on the basis of what we know. If it is true that shyness, nervousness, and depressiveness are cor-related, it is enough to know that someone scores high on just one of these traits to predict that the person is likely to score high on the other two as well. And, if we know that a country has a high score on measures of religiousness or pride, we can predict with a great amount of certainty that it has a low educational level and low suicide rates (Minkov, 2011).
This simple approach to the construc-tion of dimensions is indeed easy and straightforward. We are only interested in what a few chosen variables—for instance, var1, var2, and var3—stand for and disre-gard the possibility that some of them may also be correlated with variables var4, var5, and var6. This will bring up an inevitable question: Why did we merge precisely var1,

130 ◆ Studying Culture
var2, and var3 and exclude the other cor-relates? An apparently convincing answer might be that var1, var2, and var3 are very highly correlated and form a tight cluster, whereas var4, var5, and var6 are weakly correlated with them. Consequently, var1, var2, and var3 can be used for mutual pre-dictions, but knowing how our cases score on var5, var6, and var7 does not help us predict well how they would score on var1, var2, and var3.
A situation of this kind can arise in a small data set, but the more one expands it by adding new variables, the greater the likelihood that the boundaries of the ini-tially clear-cut var1-var2-var3 cluster will become blurred, making it impossible to identify a small number of variables that are strongly intercorrelated while having weak associations with the remaining variables.
The complex approach is designed for identifying dimensions in large data sets, consisting of many intercorrelated vari-ables. With this approach, all variables in the data set can be considered at the same time to establish the most appropri-ate dimensionality for that data set. This exercise amounts to arranging the avail-able variables or cases in an imaginary space to create a convenient coordinate system for it.
Let us consider an unlikely simple sce-nario. We have two variables: var1 and var2. We also have six cases: A, B, C, D, E, and F. The cases have the following scores on var1 and var2:
var1 var2
A 1 1
B 2 2
C 3 3
D 4 4
E 5 5
F 6 6
We can arrange these six cases in the two-dimensional space of a sheet of paper, using var1 and var2 as two orthogonal
coordinates (usually denoted x and y in geometry). We will see that all six cases are arranged along one unidimensional line. We conclude that although the sheet of paper is two-dimensional, our data form only one single dimension on it. All the observed variance between our cases can be accounted for in terms of that single dimension.
Now let us consider a slightly dif-ferent scenario. Our six cases have the same scores as before on var1 and var2 except that D’s score on var2 is not 4 this time but 4.5. Consequently, the spatial arrangement of our six cases will not form a perfect straight line since D will not be aligned with the other cases. As it is no longer possible to arrange all cases along a straight line, we conclude that we have evidence of a second dimension. But does it really help us understand much about our data? If we use the near-perfect line as an abscissa (the x axis) of a coordinate system, all cases will have different scores on that first dimension, yet five cases will have a score of 0 on the second dimension; only D will have a score that differs from theirs. This means that the first dimension explains a lot of variance (dissimilarity between our cases), whereas the second dimension explains very little. We might just as well forget the second dimension and still accept that our data set contains a single dimension, albeit a slightly imper-fect one.
The more diverse the scores of our cases are on var1 and var2, the more it will make sense to speak of two dimensions. Researchers often try to estimate the most appropriate dimensionality of data sets with a lot of variables and cases. What is meant by “most appropriate” usually refers to the most parsimonious yet most comprehensive dimensionality: the small-est number of dimensions that captures the greatest amount of variance in the data set.
There are many issues with this com-plex approach and the various statistical tools that have been designed for it. Some

Data Analysis ◆ 131
of them will be discussed in 8.2.8.—a section devoted to data reduction. Before that, it is crucially important to explain why dimensions are subjective human constructs that are created by researchers rather than objectively existing entities that are discovered through research.
8.2.3. WHY DIMENSIONS ARE SUBJECTIVE HUMAN CONSTRUCTS
Dimensions—be they cultural or psycho-logical—do not exist outside people’s minds. It is researchers who create them by analyzing subjectively chosen vari-ables and cases with subjectively pre-ferred statistical tools. This view echoes a statement by Eysenck (1979/2007): “There is no such thing as ‘intelligence’ somewhere out there; we have invented the term to classify and coordinate a large number of facts, and the concept has no existence outside this large array of facts” (p. 11).
Dimensions fit the definition of a con-struct (see 1.5.): They are constructed for a specific purpose rather than being found. Because a set of dimensions can represent a spatial coordinate system, the creation of that system is as subjective as select-ing which way is up, down, left, or right in outer space. The available statistical tools—such as multidimensional scaling and factor analysis—used to create coordi-nate systems in the cultural or psychologi-cal space attempt to imitate objectivity by discovering supposedly natural clues for identifying dimensions. In fact, as Section 8.2.9. explains, those “natural” clues are created by subjective research designs. 8
8.2.3.1. Subjective Selection of Samples for the Construction of Dimensions
We saw in Section 8.1.1. that different samples of countries, or whatever else is studied, can produce different correlations among the selected variables. Hence, the dimensions that the variables form (as well
as the regression models or any other con-structs) will not necessarily be the same for all samples. Expansions, reductions, or alterations of the sample may produce similar or different dimensions. As objec-tivity in sample selection is impossible to define and achieve, a researcher’s experi-ence with subjectivity starts already at this initial stage of research.
8.2.3.2. Subjective Selection of Items for the Construction of Dimensions
The selection of items for a cross-cultural analysis can be compared to a painter’s decision about the color of the ocean: blue, green, gray, or orange. Any choice may seem acceptable or not as there is substantial subjectivity in it. Sometimes, the addition or removal of a single variable is sufficient to generate an entirely new solution. Whether this variable should or should not be included in the analysis is a question that cannot have a fully objective answer. Often, this decision is made on the basis of some abstract theory.
Some researchers try to avoid their own subjectivity by asking others to suggest questionnaire items. The Chinese Culture Connection (1987) wished to avoid eth-nocentric Western bias and had Chinese scholars propose items for a cross-cultural study of values. But this is a replacement of one type of subjectivity with another: Western with Chinese. By selecting what to study and how, social scientists cannot be much more objective than journalists who choose what to report and how. The best that one can expect from both pro-fessions is a presentation of subjectively chosen objective facts (as opposed to a presentation of fabricated data, which would be unacceptable).
8.2.3.3. Subjective Selection of the Number of Dimensions
We conceive of the space around us as being three-dimensional, but the number of dimensions in an abstract mathemati-cal space is potentially unlimited as long

132 ◆ Studying Culture
as we have an unlimited supply of items. Deciding how many dimensions to extract from a database is a subjective exercise. Some of the later sections of this chapter discuss statistical tools that are used to imitate objectivity in the search for the right number of dimensions within a given data set. In fact, those tools use subjectively chosen conventional criteria. Besides, as a data set is altered through the addition or removal of cases and variables, its dimensionality is likely to change even if the conventions are respected.
8.2.3.4. Subjective Selection of the Nature of the Dimensions
One of the most important choices in the construction or extraction of dimen-sions is to decide what the dimensions should be about; that is, which of the variables in the database they should be most closely associated with. Although there are some conventional mathematical constraints when one treats a particular database with data reduction tools, there is significant artistic freedom as well. Sections 8.2.8. and 8.2.9. explain how different creative choices can generate different, yet fully legitimate and useful, dimensions.
It is true that if one decides to adhere to a set of data reduction conventions, the available variables and cases in a particu-lar data set will impose some restrictions on a researcher’s choice of number and nature of dimensions. But no matter what conventions are followed, a modification of the data set can lift some of the initial constraints. Because there is no such thing as an absolutely true or correct data set, there are no once-and-for-all true or cor-rect data reduction solutions either in culturology or psychology. One can only look for a seemingly most appropriate solution for a given data set of variables and cases. The issue of appropriateness is treated in 8.2.9.
Since the availability of variables that can be used for hologeistic cross-cultural
analyses has increased significantly in the past few decades, researchers can select from a practically infinite number of com-binations of national indicators (without ever being able to analyze all imaginable indicators at the same time) and use these selections to obtain a practically infinite variety of dimensions. This is the beauty of culturology. Unlike individual-level psy-chology, it has chosen to study subjects that do not disband and disappear after filling out a questionnaire but can be approached over and over again until a vast amount of data is accumulated about many of them.
8.2.4. INDIVIDUAL AND ECOLOGICAL DIMENSIONS: DIFFERENT LEVELS AND UNITS OF ANALYSIS
Dimensions can be constructed from variables that correlate at the individual level: The units of analysis are individuals. Examples are the five factors that explain personality traits, labeled the “Big Five”: Knowing how a person scores on a par-ticular trait facet, we can roughly predict how that person scores on some other trait facets. The practice of constructing individual-level dimensions has a long history in the academic world and can be traced back to the work of Spearman (1904). Naturally, individual-level dimen-sions appeal to psychologists who are interested in individual differences.
Dimensions can also be constructed at the group level (known as “ecological”), where the units of analysis are groups of people, for example, nations or ethnic groups and their cultures. 9 If it can be shown that nations with high adolescent fertility rates also have high murder rates, and vice versa, and if this covariation can be explained satisfactorily through some theory, the two variables can be merged into a single ecological dimension.
Many variables, such as murder rates, suicide rates, HIV rates, road death tolls,

Data Analysis ◆ 133
or socioeconomic inequality (measured in terms of Gini coefficients or other similar indicators), make sense only or primar-ily at the ecological level: The units of analysis must be groups of people. But other variables can be meaningful at both levels: individual and ecological. One can calculate how religious individuals are by asking them to indicate that on a scale of 1 to 4, or 1 to 5, and so on. These answers can be aggregated to the ecological level. For instance, it is possible to measure the average religiousness of the United States as a nation by averaging the responses of a representative sample of Americans or by counting the percentage of respondents who have answered “I am religious” (ver-sus “I am not religious”). The same can be done for other countries. Once we have national scores for each variable of inter-est, we forget about the individuals who supplied individual scores; from this point onward, each nation is treated as an indi-vidual case, with its own national score on each variable of interest. Then, correla-tions between variables, or other patterns, are sought across the nations.
A confusion of the two levels of analysis is known as an “ecological fallacy”—an assumption that patterns of relationship found at the ecological level will be rep-licated at the individual level or the other way around. 10 The following fictitious example explains this. A researcher may find that forests with a lot of caterpillars also have a lot of butterflies; those with few caterpillars logically have few but-terflies. But this does not mean that trees with a lot of caterpillars will also have a lot of butterflies around them: The but-terflies may leave the trees for a different habitat in the same forest.
A good real example is available from Minkov’s (2011) research. Using World Health Organization and World Values Survey data, he found that nations with high road death tolls are nations with high percentages of adults who live together with their parents. But this does not mean, among the citizens of India, or Egypt, or
Argentina, that those who live with their parents have a higher chance of getting killed in a car crash. 11
A positive correlation at one level of analysis may be negative at the other level. An example is provided by some studies of the antecedents of obesity. Logically, very poor countries do not have an abun-dance of food and are less likely to have a high percentage of obese people than rich countries: Obesity and national wealth are positively correlated. However, within rich countries, such as the United States, it is the poorer individuals who are more likely to be obese (Drewnowski & Specter, 2004) since they have unhealthy eating habits, either because they cannot afford high-quality nutrition or because of their low education and ignorance of, or indif-ference to, health issues. Obesity and personal wealth are negatively correlated.
However, it is also possible that the rela-tionships of some variables will be more or less similar at both levels: individual and ecological. This phenomenon is known as “isomorphism”. It is a convenient situation because isomorphic structures are often perceived as natural. Students of cross-cultural differences are often perplexed by an observed lack of isomorphism. Still, there is nothing unnatural in that situation. Some structures of variables are isomor-phic, while others are not. 12
A construct that is operationalized at one level of analysis may be meaningless at another level because of a lack of isomor-phism. It may be statistically possible to fuse variables var1, var2, and v3 when the cases in the analysis are nations or ethnic groups, but when the cases are individuals, the same variables may show no statistical association. Hence, attempts to fuse them would be like trying to assemble pieces that come from different jigsaw puzzles; they simply will not fit together, let alone produce a coherent picture. Unfortunately, this simple truth often goes unnoticed. Kirkman, Lowe, and Gibson (2006) found that despite Hofstede’s explicit warnings that his dimensions do not make sense at

134 ◆ Studying Culture
the individual level, many researchers have attempted to adapt them to that level.
The most elementary mistake is to give the respondents a tool designed for the cal-culation of indices of national culture—such as Hofstede’s Values Survey Module—and use the results to calculate individual-level dimensions without checking whether the items combine into anything statistically reliable and conceptually meaningful across individuals (as an example, see Migliore, 2011).
Some researchers have attempted a seemingly more sophisticated approach: using ecological indices to predict individ-ual-level outcomes. For instance, Taras, Kirkman, and Steel (2010) measured the predictive properties of Hofstede’s dimen-sions of national culture for individual characteristics, including general mental ability and job performance. Their analysis was not clearly explained. But it is unlikely that one can devise a logical statistical operation permitting the use of dimensions that have been operationalized directly at the ecological level as convincing predic-tors of individual-level variables. 13
There is another potential source of confusion. Sometimes theoretically defined constructs are operationalized entirely differently at different levels of analysis. Despite the lack of isomorphism, the same label is often attached to both constructs. Hofstede (1980, 2001) oper-ationalized individualism versus collec-tivism at the ecological level whereas Triandis, Chen, and Chan (1998) did that at the individual level. In both cases, the constructs were defined by correlated variables and were fully legitimate. But both the nature of the variables and the patterns of their correlations were very different. Hence, individual-level individ-ualism versus collectivism has nothing to do with Hofstede’s construct except the name. It is like Moscow, Russia, and Moscow, Idaho. To avoid confusions between the two, it may be practical to use different names: Based on the sugges-tion by Triandis, Leung, Villareal, and
Clack (1985), the individual-level con-struct should probably be called “idiocen-trism versus allocentrism.”
The distinction between the two levels of analysis—individual and ecological—is not simply an academic issue without prac-tical consequences. When levels of analysis are confused, findings from one level may be erroneously applied to the other level, resulting in misleading advice to interna-tional managers, educators, or other prac-titioners in the cross-cultural field.
Interestingly, some researchers have operationalized reliable constructs at the individual level and used them to measure cultural phenomena at the national level. This issue is discussed in 8.2.10.
8.2.5. POLARITY
There is some confusion in the literature concerning the polarity of dimensions. Is it justifiable to speak of two opposite poles or not? Fang (2003) perceived Hofstede’s fifth dimension (long-term orientation) as problematic because, in Fang’s view, some of the concepts that define it are not opposites in the typical Chinese mind but can exist in a dialectical unity. Following this logic, it would not be justifiable to propose a bipolar dimension defined by a leisure orientation at one pole and work orientation at the other. We can think of a person who values work and leisure equally and another one who is indifferent to both. What is the logic of speaking of opposites in this case?
It is the logic of the measurement. Abstract conceptualizations are one thing, an empirical measurement is another. Whether work and leisure orientation form a bipolar dimension in which they occupy opposite poles depends on how they have been measured. Depending on what data we have collected, from whom, at what level we have carried out the analysis and with what statistical tools, we can find that work and leisure orienta-tion form a single bipolar dimension, two

Data Analysis ◆ 135
correlated dimensions, or two independent dimensions. There is no single abstract truth about the relationship between val-ues like work and leisure and the polarity of the dimensions that they can form. It is the empirical study that creates that truth. And different studies give us different truths. 14
The World Values Survey regularly asks its respondents how important work and leisure are to them. These are two different items that produce weak and insignificant correlations at the national level. Thus, measured in this way, the importance of work and the importance of leisure (and the importance of their various correlates) produce two independent bipolar dimen-sions of culture at the national level. Now suppose that we ask the respon-dents a forced-choice question: “What is more important to you: (a) work, or (b) leisure?” This measure—combined with some other variables that correlate with it—will give us a single bipolar dimension. The importance of work would be at one of the poles and the importance of leisure would be at the other. It is all a matter of how we construct our measures.
The academic literature abounds in situations where researchers attempt to determine the polarity of a particular dimension as if it were something real, having an independent existence, that does not depend on the researchers’ subjective conceptualizations and their measurement techniques. 15 But a question like “Are individualism and collectivism one dimen-sion or two or many in principle? ” is meaningless. Just like any other construct in a science that claims to be positiv-ist, individualism and collectivism can-not exist without their measurements. Some empirical studies will yield a single dimension; others will produce two or more. 16 A statement to the effect that individualism and collectivism are in prin-ciple one dimension (or more) is unscien-tific because these concepts cannot exist “in principle,” in an empirical vacuum. Dimensions are not part of nature; they
are created by researchers’ minds and their analyses. Therefore, the only scientifically safe statement is that individualism versus collectivism and other similar dimensions were constructed by Hofstede (1980) and others as single bipolar dimensions, while some other scholars put these labels on two or more orthogonal (independent) dimensions, because that is how they con-structed them.
8.2.6. DIFFERENT VERSIONS OF THE SAME ECOLOGICAL DIMENSION?
Referring to a suggestion by Harry Triandis, researchers Gabrielidis, Stephan, Ybarra, Dos Santos Pearson, and Villareal (1997) believed that Latin American col-lectivism might possess qualities that dis-tinguish it from Asian collectivism. A position of this kind is justifiable if the dimension at issue is constructed at the individual level. One can most probably demonstrate that the pattern of correla-tions between items that measure Big Five neuroticism is somewhat similar across individuals in the United States and Japan but not absolutely identical. In this case, one can speak of American neuroticism as being somewhat differently structured with respect to Japanese neuroticism.
When we are analyzing an ecological dimension, our approach is entirely etic and we do not consider emic peculiari-ties. If individualism versus collectivism is constructed at the national level, it reflects correlations across nations. It cannot be a dimension that has different manifesta-tions within one cultural environment or another because the measurement tech-nique gives it a different status: It shows a pattern across nations, not inside them. Individualism versus collectivism, as mea-sured and defined by Hofstede (2001), is a single bipolar dimension, constructed at the national level. Speaking of different aspects of that particular dimension in different environments is no more logical

136 ◆ Studying Culture
than saying that “length,” “width,” or “altitude” has different aspects in Latin America and Asia.
8.2.7. DIMENSIONS AND POLYTHETIC CLASSES
American cross-cultural psychologist Harry Triandis is known for his attempts to use cultural dimensions for the con-struction of polythetic classes (Triandis et al., 1993). 17 Triandis et al. (1993) suggested that different and uncorrelated measures of what was originally supposed to be a collectivism dimension define polythetic classes of countries: collectivist versus individualist. A country belongs to the collectivist class if it scores high on at least half of the factors that are viewed as measures of collectivism for purely theo-retical reasons.
Triandis et al. (1993) have a confusing approach to dimensions because they call a dimension a “dichotomy” (p. 381) and a “continuum” (p. 367). According to the Merriam-Webster dictionary, a dichotomy is “a division into two especially mutually exclusive or contradictory groups or enti-ties” (Merriam-Webster, 2010), such as man versus woman or dead versus alive. A continuum implies gradual differences, such as smart versus stupid. Something cannot be a dichotomy and a continuum at the same time. Cultural dimensions are normally constructed as continuums, not dichotomies that define classes, be they polythetic or monothetic. This does not mean that there should be a ban on attempts to construct cultural classes, but that would be a very different idea from that of cultural dimensions.
8.2.8. DATA REDUCTION
The term “data reduction” suggests a pro-cess by which some complex information is summarized for simplicity. It is most often used in a narrower sense: i dentification of
dimensions that are statistically associated with groups of simple variables. Section 8.2.2. outlined a simple and a complex approach to data reduction for the purpose of constructing dimensions. The following sections provide more information, includ-ing explanations of some basic statistical concepts. However, mathematical details that belong in a handbook on statistics are omitted.
8.2.8.1. Agreement and Aggregation
In some types of cross-cultural analysis, and especially in cross-cultural manage-ment studies, researchers are advised to perform a special operation before begin-ning to aggregate individual data to the societal level: They need to demonstrate agreement among the respondents to jus-tify aggregation. Hanges and Dickson (2004) and Peterson and Castro (2006), among others, have proposed various sta-tistical methods for this purpose.
The view that a lack of agreement in the responses might be problematic stems from the use of stereotypes in management research; researchers ask company employ-ees to provide a generalized description of the situation in the company. When there is a high level of agreement among the respondents, the stereotypes may be consid-ered valid: If they all tell us the atmosphere in the company is awful, it is illogical to reject this information and claim that the employees do not know what they are talking about. If there are serious disagree-ments among them about the situation in the company, however, the information they provide becomes an unreliable descrip-tor and assigning an aggregate score to the company may not be justifiable.
As Section 3.2.2.3. explains, stereo-types are a slippery tool for the study of culture, especially that of a complex modern nation, which is far more complex than any company. Even in the case of full agreement, many national stereotypes are nonsensical although others may be vali-dated. The best way to avoid all the com-plexities associated with the interpretation

Data Analysis ◆ 137
of national stereotypes is to abstain from using them. When the research items are not stereotypes but self-reports or behav-ioral statistics, such as murder rates or suicide rates, the issue of aggregation justification disappears. Also, there is no absolute need to check for consistency within a society when norms or ideologies are studied. We may find that norm N is supported by 75% of the respondents in society x versus 45% in society y and 10% in society z. We may be able to demon-strate the implications of these differences by showing correlations with external variables. That would be enough to justify the measurement of norms that receive only partial support within some societies. The reader is referred back to 2.1., where it is argued that in hologeistic culturology there is no need to always test for what some theorists call “sharedness.”
8.2.8.2. Correlations and Scales
The simplest way to reduce data for the purpose of constructing a dimension is to merge some correlated variables into a single scale on which cases (countries, or whatever units of analysis have been used) can be ranked. By knowing a coun-try’s position on the single scale, we can roughly predict its position on each of the variables that were merged.
Let us analyze a data set from the World Values Survey and attempt to iden-tify dimensions of national culture. We do not start from any particular theory; our exercise is empirical. Nevertheless, we do make the assumption, based on previous research (Chinese Culture Connection, 1987; Schwartz, 1994), that a study of basic values can reveal interesting dimen-sions of national culture. The 10 impor-tant values for children that are regularly measured by the World Values Survey are particularly appropriate for that; details are available in Exhibit 1 in the appen-dix at the end of the book. Table 8.1 provides the correlation matrix of 10 of those values across the 43 countries in our analysis. 18
We notice that hard work, imagination, and tolerance are highly intercorrelated; any correlation between any two of them exceeds ±.50**. This means that if we know how a particular country scores on any one of these three variables, we can roughly predict how it will score on the remaining two. For example, in nations in which hard work is deemed important for children, imagination and tolerance are not. Vice versa, if imagination is important, so is tolerance, but not hard work. Obviously, these three variables go together: There is something invisible that binds them together like flowers in a bouquet. Some other values are closely associated with some of these three but not with all of them. Independence is highly correlated with imagination but not with tolerance and hard work. Consequently, it would look like an odd flower in that bouquet, bearing a resemblance to only one of its other members. Thrift is a somewhat better candidate for membership in the bouquet as it is associated with both hard work and (in)tolerance, yet it has hardly anything to do with imagination. Therefore, the best and safest solution for the data set that we have seems like dropping all other items and merging hard work, imagination, and tolerance into a single dimension by aver-aging their scores. 19
The sum of these three variables (with a negative sign for hard work) represents an index for 43 countries on the dimension into which they were merged. The three variables correlate with the index in the following way:
tolerance .89**
hard work –.88**
imagination .82**
Because these correlations are quite strong, we can predict with a reasonable degree of certainty that a nation that has a high score on the single dimension scale that we created attaches a great impor-tance to tolerance and imagination and a low importance to hard work.

Tabl
e 8.
1 C
orre
latio
n M
atri
x of
Ten
Val
ues
for
Chi
ldre
n in
the
Wor
ld V
alue
s Su
rvey
hard
wor
kre
spon
sibi
lity
imag
inat
ion
tole
ranc
eth
rift
dete
rmin
atio
n/pe
rsev
eran
cefa
ithun
selfi
shne
ssob
edie
nce
inde
pend
ence
−.2
739
**51
**.1
1.2
1.4
8**
−.3
8*.0
1−
.54*
*
hard
wor
k−
.48*
*−
.54*
*−
.70*
*.4
5**
−.1
4.2
0−
.26
.06
resp
onsi
bilit
y.3
4*.2
1.1
4.3
7*−
.37*
*−
.19
−.3
9**
imag
inat
ion
.61*
*−
.19
.36*
−.4
7**
.09
−.3
5*
tole
ranc
e
−.4
3**
.14
−.3
5*.2
3−
.13
thri
ft.2
5−
.20
−.1
8−
.27
dete
rmin
atio
n/pe
rsev
eran
ce−
.60*
*.0
8−
.46*
*
faith
.08
.65*
*
unse
lfish
ness
.28
138 ◆

Data Analysis ◆ 139
The statistical relationship is undeniable, but it might take a stretch of the imagina-tion to perceive a conceptual relationship among these variables. Why would hard work be the opposite of tolerance? Note that the fact that these findings do not make intuitive sense to us does not invali-date them: We are dealing with a reality created by the respondents’ answers and we cannot reject it because we do not have a good theory for it. Nevertheless, finding or creating such a theory may be indispens-able; otherwise, we would be left with the unpleasant feeling that we have a valid empirical discovery that, unfortunately, sounds too puzzling to be useful. 20
8.2.8.3. Scale Reliability
What is a sufficiently high correlation that justifies merging two or more variables into a single dimension and building a uni-tary measurement scale in that way? There is no objective answer to this question. Ideally, we should merge only variables that yield strong correlations with each other because that would mean that they predict each other quite reliably. In that case, the scale would be considered reliable, or—to use another term—internally consis-tent. Unfortunately, strong correlations are hard to come by and we often have to make compromises.
There exists an indicator, available in all statistical software products, that estimates the strength of the average cor-relation between two or more variables that are candidates for a merger into a single dimension. It is called “Cronbach’s alpha”. 21 A high alpha, however, does not always mean that the tested variables are all highly intercorrelated. Because the number of variables affects the value of the alpha, it is possible to have a conven-tionally high alpha for a high number of variables, many of which are weakly cor-related. 22 This means that although the alpha test suggests that we have a more or less reliable scale, other methods—such as correlation analysis and especially
factor analysis—can strongly contradict this finding and suggest that we should adopt several dimensions, not one. Factor analysis is a better tool than Cronbach’s alpha for testing scale reliability; details are available in 8.2.8.5.3.
8.2.8.4. Multidimensional Scaling
If we have to construct dimensions from a large database with many coun-tries (or any other units of analysis) and many variables, a good way to start is to perform one of a set of related techniques, known as “multidimensional scaling” (MDS). Developed by Torgerson (1952) and popularized by Kruskal (1964) and Kruskal and Wish (1977), MDS is widely used in many sciences, including cross-cultural research. 23
One attractive feature of MDS is that it can provide a visualization of the relation-ships between what is being studied. MDS can use the available variables to show dis-tances or (dis)similarities between coun-tries or other units of analysis. Distances between variables can also be shown. The visualized MDS solution resembles a geographic map on which proximities between towns are shown on a coordinate system: latitude versus longitude. 24
Unlike physical space, which has three dimensions, a data set to be analyzed with MDS does not have a defined dimen-sionality. MDS is not a tool designed to establish the right or true number of dimensions in a particular data set but to provide a representation of the avail-able data in a space with an appropriate number of dimensions. When MDS is used, an important criterion for choos-ing an appropriate dimensionality is the similarity between the actual data, such as the distances between the cases, and their representation on an MDS map. An appropriate, or simply acceptable, number of dimensions is one that does not visually distort the data too much. Unlike factor analysis, MDS does not suggest how many dimensions should be chosen on the basis

140 ◆ Studying Culture
of how much variance in the data set each dimension explains (see 8.2.8.5.).
Despite the logical requirement for a more or less faithful representation of the actual data, plus some mathematical con-straints, the exact number of dimensions in which an MDS solution will be calcu-lated and presented is largely up to the researcher: Typically a choice is available from two to four dimensions, sometimes even five or six.
This creates a dilemma. In order to achieve the best visualization, it is advis-able to request a two-dimensional solution even though it may be somewhat mis-leading as it distorts the actual distances between the items. 25 A three-dimensional solution may provide a more correct rep-resentation of the distances, but it is too hard to read on a two-dimensional com-puter screen or sheet of paper. Solutions in four, five, and six dimensions are also possible with a sufficient number of vari-ables and cases but entirely impossible to visualize.
The next sections provide examples of how MDS works.
8.2.8.4.1. Plotting Variables on an MDS Map Using SPSS 17, our task is to plot the values for children that we worked with in 8.2.8.2. on a two-dimensional MDS map and obtain a visual idea of the similarities and distances between them. We can drop the unselfishness item as it is not highly correlated with any other items and repre-sents an odd variable. Let us now plot the remaining nine values for children.
The first dilemma arises with the selec-tion of a distance measurement method. Most people probably think the distance between point A and point B is an uncon-troversial concept: It is equal to the length of the straight line between them. But con-sider this: What is the distance between the Earth’s two poles? Is it equal to the length of a meridian or to the length of the Earth’s axis? And the concept of a straight line may be elusive if we adopt Einstein’s idea of warped space or Lobachevskian geometry. Therefore, the answer to the
question of how to measure the distance between two points involves considerable subjectivity. Berry et al. (2010) indicate that there is no agreement in the literature as to the best way to do that.
MDS can use various measurement methods, 26 most of which tend to yield fairly similar results. As the Euclidian dis-tance method is the most simple and prob-ably the most common, we can choose it for our purpose.
The next dilemma is whether to use raw data or transformed. If the data are transformed, what kind of transforma-tion should we adopt? Should the item scores be plotted on a single scale, say from –1 to +1 or from 0 to 1 (or from 0 to 100)? Or should we use z-score standard-ization? If we choose the latter option, should the standardization be by variable or by case?
If our goal is to discover relationships between variables, raw scores are a bad option, especially if the variables are on different scales. In that case, the solution may reflect the ranges of the scales rather than the relationships between the vari-ables. For the creation of an MDS map of variables that shows approximately how they relate to each other, it is always advisable to z-standardize the scores by variable. After that procedure, provided we have a good balance of positively and negatively correlated variables, we are likely to obtain a visualization that resem-bles a circle, an ellipse, or a horseshoe, often called a “circumplex.” In Graph 8.1, we have a good ellipsoid. 27
A comparison with Table 8.1 reveals that variables shown close together on Graph 8.1 tend to be positively correlated. Variables that are diametrically opposed are typically negatively correlated, espe-cially if they are at the two poles of the long diameter of the ellipse. 28
8.2.8.4.2. Identifying Cultural Dimensions on an MDS Map Provided we have many variables in an MDS circumplex, those that are close to the two ends (poles) of any diameter drawn across it are likely

Data Analysis ◆ 141
candidates for a merger into a single dimension, using the simple method that was explained in 8.2.2. and 8.2.8.2. Disregarding the other items in the cir-cumplex, we can view such diametrically opposed items as defining a single bipolar dimension. At one of the diameter’s ends we will probably find positively correlated variables that define one of the dimen-sion’s two poles. At the opposite end of the diameter, there might be positively correlated variables that define the other pole. The two groups of variables are likely to be negatively correlated; often, each variable at either of the two poles is negatively correlated with each of the variables at the opposite pole.
Because the number of diameters that can be drawn across a circle is limitless, so is in principle the number of dimen-sions that can be identified across a circumplex. But the idea of data reduc-tion is to produce a small number of dimensions. What exactly should guide our choice of a few dimensions out of all
possible variants? This is one of the most complex issues in any social science or psychology. The discussion of it can start with a couple of conventional points that need to be remembered. These can be used as selection criteria in data reduction.
1. For practical purposes, we are interested in saturated dimensions. This means that there should be as many variables as possible around the two poles. There is a practical reason for this requirement. Because a dimension has explanatory properties (8.2.1.), it can be conceptualized as a beam of light that crosses a dark space and illuminates the items near its path while explaining what holds them together. It is simply economi-cal and efficient to illuminate and explain as many items as possible with a single beam of light.
Yet, the saturation criterion becomes irrelevant if we can show that although a dimension captures a small number of the variables in the MDS circumplex, it is
–
–
–
– –
Graph 8.1. Multidimensional scaling solution for nine values for children from the World Values Survey

142 ◆ Studying Culture
a satisfactory predictor of many external variables. A dimension is not defined only by what is close to its poles on an MDS map but by its whole nomological net-work: all possible external variables that are highly correlated with it.
2. Another practical requirement is that we should prefer strong dimensions, meaning that at least some (but preferably most) of the variables that define the two poles should be highly correlated and con-sequently find themselves close together on the MDS map and close to one of the ends of the diameter that stands for the dimension. In the statisticians’ jargon, a dimension that is defined by weakly cor-related variables is said to lack “internal consistency” or “scale reliability.” Another way to think of this situation is to use the previous analogy with a beam of light. When a dimension is not closely associated with the items that define it, it does not throw much light on them and they remain murky and insufficiently explained. 29
3. The dimensions that we propose should be as weakly intercorrelated as possible. Dimensions that are highly cor-related (for instance ±.70 and above) simply reflect facets of the same phenom-enon. It is not practical to treat them as separate entities, especially if they come from the same database and do not have a demonstrably strong conceptual differ-ence. To continue the analogy with the beam of light, it would be wasteful to use two beams to illuminate objects that are so close together that a single ray would light them up sufficiently. What this means in terms of our MDS map is that the angle between the dimensions that we choose to draw across the circumplex should be as close to 90 degrees as possible.
4. The dimensions should produce recognizable geographic and cultural pat-terns. This criterion is borrowed from McCrae et al. (2007). If Australia’s posi-tion on a particular dimension is more like
that of India or Burkina Faso than New Zealand and Canada, and if Germany is much closer to Venezuela than to Austria, there is probably something seriously wrong with that dimension. 30
If we manage to draw diameters that fulfill these four conditions, we are likely to have convincing dimensions, although further tests will be necessary before we decide that we are ready to go public with them. We return to this issue in 8.2.9.
One way to go about the drawing of the diameters is to rely on our vision and then run a correlation analysis to validate our choice. Graph 8.1 shows that hard work is situated across from imagination and tolerance; as we saw, these three vari-ables do form a strong dimension. But we have other options as well. Perseverance, independence, responsibility, and imagi-nation form a fairly compact cluster situ-ated across from faith and obedience, which are also close together. These are good candidates for a bipolar dimension contrasting these two opposite groups of values. We can now examine the correla-tions between these variables and ascertain if they really form a reliable scale by using a reliability test, preferably a factor analy-sis (8.2.8.5.3.). Then, we can look at the country positions on this dimension and see if they make sense.
This simple method can work well if we have a small number of variables but it may be difficult with a large number. In that case, deciding how to draw diameters and how many of them we need becomes a very complex task that requires very sig-nificant experience with large databases, like the World Values Survey, and a very well-trained eye. Fortunately, we can do something seemingly easier: use the help of the available statistical tools for complex data reduction. As we do that, we must remember that although they use various mathematical formulas to imitate objectiv-ity, it would be a naïve endeavor to search for the “true” solution among the many diverse options that they can provide.

Data Analysis ◆ 143
While we are at MDS, we might con-sider what solution it recommends for our data reduction exercise. In Graph 8.1, we have an MDS arrangement of our variables in a two-dimensional space. The stress value (see note 25) for the solution is .067; therefore, it is on the side of the accept-able. The two spatial dimensions—which would be West versus East and North versus South on a geographic map—could be used as cultural dimensions. Like all dimensions in an MDS solution, they are almost perfectly orthogonal; consequently, the correlation between them is about .00.
The MDS solution in SPSS comes with the coordinates of the variables on the two dimensions. A higher absolute value suggests a closer association with the dimension. 31
The coordinates of the variables on the two spatial dimensions that our MDS analysis produced are
Dimension 1 (East-West)
Dimension 2 (North-South)
faith -1.64 -.63
obedience -1.44 -1.01
hard work -1.43 1.00
imagination 1.12 -.39
responsibility 1.11 .04
independence .91 .35
tolerance .90 -1.23
perseverance .86 .64
thrift -.41 1.24
faithobediencehard work
thrift
versus imaginationresponsibility
independencetolerance
perseverance
thrifthard workperseverance
independence
versustoleranceobedience
faithimagination
Our first dimension is defined by the variables in the West versus those in the East (or the other way around):
Our second dimension is defined by the variables in the North versus those in the South (or the other way around):
This solution highlights two contrasts. The first opposes values that emphasize group cohesion and conformism through faith and obedience to values that empha-size independent thought and action, cou-pled with individual responsibility.
We also have another contrast, high-lighted by the second dimension. It opposes values that are associated with the achievement of individual economic
prosperity to values that emphasize ori-entation toward other people. If we had not dropped the unselfishness value from our analysis, it would have occupied the southern-most position, across from thrift and between obedience and tolerance. The World Values Survey item that measures the importance of service to others as a personal value (item A007, prior to 2005) would also be found in that same space.

144 ◆ Studying Culture
8.2.8.4.3. Plotting Cases on an MDS Map and Calculating Case Coordinates After we have plotted our nine variables on an MDS map, we may wish to do the same for our 43 countries to see how they are arranged on the two dimensions that we obtained.
There is a very simple method for that, for which we do not need the MDS tool in SPSS provided we already have the variables’ coordinates on the MDS dimen-sions. We can use these coordinates as weights and add up the weighted scores for each item on the first dimension, repeating this procedure for the second dimension. This operation will provide us with dimension scores for each country for each of the two dimensions. Each of the two sets of scores will represent a dimen-sion index. 32 After we have calculated the two dimension indices, we can use them to arrange our 43 countries on a scatterplot.
We can obtain virtually identical results by plotting our 43 countries on an MDS map. We can obtain their coordinates in a numerical form by using the MDS tool in SPSS; we just have to request distances between cases. But before we do that, we have to decide once again what data to use: raw or transformed.
Using raw data creates the same problems for the plotting of cases as for the plotting of variables; therefore, we should transform the country scores. If we are mostly inter-ested in intercultural comparisons (rather than intracultural), we can use either z-score standardization by variable or plot the raw scores on a scale from 0 to 100 (see note 19). When countries are plotted on an MDS map, the difference between the results from these two options will usually be small.
Choosing the 0 to 100 transformation, 33 we obtain the map shown in Graph 8.2.
Graph 8.2. Visualization of the positions of 43 countries on a two-dimensional MDS map after z-score standardization “by variable”
Note: See Exhibit 6 in the appendix at the end of the book for the expansions of the abbreviated country names.

Data Analysis ◆ 145
If we compare Graph 8.1 and Graph 8.2, we will notice that the positions of the values for children in the first graph essentially cor-respond to the country positions in the sec-ond. Thus, thrift and hard work (Northwest in Graph 8.1) are most strongly valued in the developing Asian countries and Eastern Europe (Northwest in Graph 8.2). Faith and obedience (Southwest in Graph 8.1) are most strongly endorsed in the Arab world and the Middle East (Southwest in Graph 8.2), whereas tolerance and imagi-nation (Southeast in Graph 8.1) are most cherished in the richest European countries (Southeast in Graph 8.2). Both of our MDS maps—for the nine variables and for the 43 countries—are obviously highly convincing.
Now we may wish to create an MDS map of countries that will reveal not only intercultural differences but also some
intracultural structures. For that purpose, we should use z-standardized scores by case. Graph 8.3 shows such a map. 34
We see at a glance the differences between Graph 8.2 and Graph 8.3. We notice that in Graph 8.2 Jordan and Egypt have the lowest positions on dimension 2 but in Graph 8.3 that lowest position is occupied by some Latin American countries. What does that mean? Both maps suggest that, compared to other regions, the Arab world and Latin America attach a relatively low importance to the combination of hard work and thrift for children. Yet, inside the Arab countries these values are not the low-est priorities. But they are at the bottom of the importance scale in Latin America: Both the intercultural and the intracultural com-parisons reveal that hard work and thrift for children are not emphasized in that part of
Graph 8.3. Visualization of the positions of 43 countries on a two-dimensional MDS map after z-score standardization “by case”
Note: See Exhibit 6 in the Appendix at the end of the book for the expansions of the abbreviated country names.

146 ◆ Studying Culture
the world. Of course, MDS maps based on z-score standardization by case provide only vague intracultural images and can only be used as inspiration for further and deeper investigation.
The dimension indices that result from an MDS analysis can be used to identify broad geographic patterns or to explain other variables through correlations or regression models (see 8.4.8.). They can-not be relied on to determine details, for instance, whether Norway scores higher than Japan on dimension 1 or whether China scores higher than Vietnam on dimension 2. The answers to these ques-tions depend on the method that was used to calculate country scores.
8.2.8.4.4. Using MDS for Identifying Typologies MDS can also be used in a way advocated by Shalom Schwartz: Rather than attempt to identify dimen-sions on an MDS map, one can produce an MDS circumplex and partition it into sec-tions, using a previously enunciated the-ory. The sections should contain clusters of variables that fit together theoretically. Naturally, one cannot expect a perfect fit between the theory and the MDS solution. For that reason, some arbitrariness in the partitioning of the circumplex should be allowed (Schwartz, 2011). The final result can figuratively be thought of as a round pie carved up in such a way that each of its more or less triangular pieces stands for a typological class of variables or cases. These classes are not categorically distinct: Each of them blends with its right and left neighbors on the circumplex. For instance, if items related to pride and to happi-ness are found in two adjacent sections, that means they are partly distinct, partly similar: Pride is a feeling of high personal worth, whereas happiness is not neces-sarily about that; yet both reflect positive emotions.
Some researchers may prefer to work with typologies than with dimensions as many people find it almost natural to clas-sify individuals or countries. As long as this is based on real data, and on the condition
that one remembers Schwartz’s point about the blending of adjacent classes, the use of noncategorical typologies arranged in a circumplex may be a useful alternative to the use of dimensions. An example is provided below of how MDS can be used for the construction of a circumplex typol-ogy of self-descriptions at the national level and a typology of societies based on such descriptions. Obtaining a circumplex is not a must for the creation of a typology. But this shape has a clear advantage over other visualizations of variables, as it can roughly suggest how they are intercorrelated.
The World Values Survey asks its respon-dents to provide various self-descriptions. Some of these items seem to target person-ality traits; for instance, the respondents are asked how happy they are in general. There is also an item that gauges percep-tions of personal life control and can be seen as a measure of self-confidence. It is possible to select such items, apparently providing self-descriptions of stable traits; details about their selection for the analy-sis below are available in Exhibit 2 in the appendix at the end of this book.
MDS will produce a good circumplex if the matrix contains a balanced selection of positively and negatively correlated items. For that purpose, we can split each selected item into two negatively corre-lated variables: national percentages that have made contrasting self-descriptions, such as percentage “religious person” ver-sus percentage “convinced atheist,” or percentage “very happy” versus percent-age “not very happy.” The logic of this type of scoring is explained in 7.2.4.3.
The selection of items targets the fol-lowing conceptual domains:
◆ subjective well-being (items coded HAPPY and UNHAPPY)
◆ a perception of personal freedom and life control (items coded FREE and CONSTRAINED)
◆ trust of familiar people (items coded TRUSTING and DISTRUSTFUL)

Data Analysis ◆ 147
◆ self-stability/self-consistency (items coded INVARIANT, CONSISTENT, ADAPTABLE, and FLEXIBLE)
◆ self-enhancement (items coded PROUD and HUMBLE)
◆ religiousness (items coded RELIGIOUS and ATHEIST)
In accordance with Minkov’s (2011) monumentalism theory, based on Heine et al. (2001) and Heine (2003a) (see 9.24.), items that measure self-enhancement and self-stability should be correlated and found close together on the MDS map. Their opposites should also form a cluster across from them. Religiousness should be associ-ated with self-stability and self-enhancement (Minkov, 2011) and should emerge in the same section. Subjective well-being should be closely associated with a perception of life control (Inglehart & Baker, 2000; Minkov, 2009b; Minkov, 2011). Based on
Inglehart and Baker’s (2000) findings, trust should be found in the same section as sub-jective well-being.
Graph 8.4 visualizes the spatial positions of the 14 items after z-score standardiza-tion by variable, using Euclidian distances. There is not much need for arbitrary parti-tioning of the circumplex in Graph 8.4 as the MDS dimension axes can be used for that purpose; all variables appear in the expected sections. Nevertheless, the posi-tions of the axes have been slightly tilted for greater visual clarity. We identify four classes of variables:
A northwestern class (coded IPCR: INVARIANT, PROUD, CONSISTENT, RELIGIOUS) versus a southeastern class (coded AHAF: ADAPTABLE, HUMBLE, ATHEIST, FLEXIBLE)
A southwestern class (coded DCU: DIS-TRUSTFUL, CONSTRAINED, UN HAPPY) versus a northeastern class (coded TFH: TRUSTING, FREE, HAPPY)
–
–
– –
–
Graph 8.4. Partitioning of 14 self-descriptions into four sections (classes), representing typological characteristics of societies based on relative occurrence of salient personal traits

148 ◆ Studying Culture
Graph 8.5 shows how 50 countries are categorized in the four classes defined by our 14 variables. 35 Excluding the border cases whose positions are ambiguous, the IPCR class consists mostly of Middle Eastern and African nations. Its opposite—the AHAF class—is mainly represented by East Asia and Germany. Although the Eastern European countries and Vietnam tend to be border cases, they also gravitate toward this class. Only two countries are firmly in the DCU class—Zambia and Romania. The TFH countries are chiefly West European and Anglo.
A graph like 8.5, combined with its antecedent—Graph 8.4—may be a useful and simple reminder of essential cross-cultural differences. We observe that Graph 8.5 is reminiscent of Graph 8.2. Both pro-vide somewhat similar cultural maps of
the world but seen from different angles: desirable values for children versus self-descriptions of stable personal character-istics. The reader of Graphs 8.4 and 8.5 is not required to think how the scaled items intercorrelate and define dimensions or whether a country’s position on a par-ticular dimension can really be used to guess its position on a given single variable. Yet, Graph 8.5 also illustrates one inconvenience of the typological approach: There is a huge cluster of countries in the middle of the map that cannot be easily categorized anywhere. One potential solution is to assign the label “ambiguous” to them. Further, the typolog-ical approach is not as easy or as accurate as the dimensional approach for the purpose of statistical predictions: Without a score attached to each case, predictions become fluid and hard to validate.
Graph 8.5. Partitioning of 50 countries into four sections (classes), representing typologi-cal characteristics of societies
Note: See Exhibit 6 in the Appendix at the end of the book for the expansions of the abbreviated country names.

Data Analysis ◆ 149
8.2.8.4.5. Issues Related to Multidimensional Scaling as a Data Reduction Technique
1. MDS imposes some restrictions on the number of dimensions that can be extracted. SPSS will not extract more than six MDS dimensions. An MDS solution is practically impossible with fewer than four variables.
2. There is no simple method that suggests to the researcher how many dimensions to extract from a particular set of variables by means of MDS. A two-dimensional solution is the best for visu-alization purposes, but if we have many variables it may be a crude oversimplifica-tion of their relationships. Nevertheless, in view of point 7 below, when cultural dimensions are sought it rarely makes sense to work with MDS solutions that are not two-dimensional.
3. There is no simple rule that allows researchers to decide what combination of methods to use in an MDS analysis. For instance, SPSS offers six measurement principles for the interval method, each of which can be combined with different data transformation methods. Sometimes the selection of a particular combination of approaches can be limited by various prac-tical or theoretical considerations but quite often there is significant room for subjec-tive choice. Although different methods often yield similar results as a whole, some important details—such as the positions of specific variables or cases on specific dimensions—can be dramatically affected by the researcher’s subjective choice of a particular combination of methods.
4. The positions of the variables on a two-dimensional map can sometimes be deceptive in the sense that they are not necessarily good representations of the Pearson correlations between them. Although, strictly speaking, MDS is not a tool for visualizing Pearson correlations, it would be much less useful in cross-cultural analysis if it did not have that property as well.
5. The coordinates of the variables are an indication of how they relate to the dimensions that the MDS solution has proposed, but it is advisable to check their Pearson correlations with those dimensions as well. This means that case coordinates (country scores on the dimensions) should be obtained for each dimension and then correlated with each variable in the analysis.
6. When a variable is equally closely associated with more than one dimension, a single dimension index does not allow an easy prediction of how a particular case scores on that variable. For instance, hard work is closely associated with both of the MDS dimensions in Graph 8.1: negatively with the first dimension and positively with the second. Jordan and Egypt have low positions on both dimensions. Their low positions on dimension 1 (Graph 8.2) suggest that hard work may be viewed as very important in these two societies, but their low position on dimension 2 suggests the opposite.
7. Unlike factor analysis, MDS tools do not provide rotation (factor rotation is discussed in 8.2.8.5.). An unrotated solu-tion is one in which the first dimension is positioned in such a way that it is associ-ated as closely as possible with as many variables as possible because in that way it explains as much as possible of the total variance. Each next dimension explains less and less because its associations with the variables in the matrix become weaker. A third or fourth unrotated dimension may be (and often is) positioned so far from any variables that it does not really explain much—nor is its nature clearly revealed by any variables—and is practically meaning-less and useless. This situation is observed not only in MDS but also in factor analy-sis. Rotation can deal with this problem but it is not an option in MDS. 36
8.2.8.5. Factor Analysis
The aim of factor analysis (FA) has been defined as summarizing interrelationships among variables in a concise but accurate

150 ◆ Studying Culture
manner as an aid in conceptualization (Gorsuch, 1983, p. 2). Like MDS, FA is a set of related tools that can arrange vari-ables in a multidimensional space based on their statistical similarity. However, this similarity is estimated on the basis of Pearson correlations, not Euclidian distances or similar measures, as in MDS.
In FA, the dimensions are called “fac-tors” or “components,” 37 whereas the spa-tial coordinates of the variables are called “factor loadings.” 38 The position of the first factor is chosen in such a way that it explains as much variance in the factor-analyzed data set as possible. 39 The second factor must be orthogonal to the first one and explain as much as possible of the remaining variance. The third factor must be orthogonal to each of the first two and explain as much as possible of the remain-ing variance, and so forth. This process con-tinues until the number of extracted factors equals the number of variables in the factor-analyzed data set. Some of these factors will
explain so little variance, however, that they will not be considered worth retaining.
Although FA does not use the same mathematical formulas as MDS, the solu-tions that the two tools create may closely resemble each other. Consequently, coor-dinate systems (dimensions) derived from MDS and FA analyses can be quite similar. Another shared feature of the two methods is that they propose orthogonal (uncorre-lated) dimensions. However, FA provides additional options that can be used to cre-ate oblique (correlated) dimensions as well.
Let us now factor analyze the nine val-ues for children that we used for our MDS analysis. Unlike MDS, FA has conventional methods for deciding how many factors to retain. 40 Graph 8.6 visualizes the unrotated two-factor solution that we can adopt.
This unrotated FA solution is very similar to the MDS solution in Graph 8.1. Although the factor loadings are not expressed in the same way as the MDS coordinates, they define very similar space
–
–
– –
p
Graph 8.6. Unrotated factor solution (loading plot with two principal components) for nine values for children from the World Values Survey

Data Analysis ◆ 151
positions as the MDS solution did for the variables that we are studying:
Factor 1 Factor 2imagination .77 –.30faith –.74 –.26
independence .69 .25responsibility .68 .10obedience –.67 –.44perseverance .66 .39hard work –.60 .65tolerance .58 –.65thrift .02 .84
As in the case of the MDS solution, the first factor is defined by all variables 41 except thrift: hard work, faith, and obe-dience versus imagination, independence, responsibility, and tolerance. The second
factor is defined by thrift and hard work versus tolerance. It also has a negative asso-ciation with obedience, albeit much weaker.
Graph 8.7 shows the positions of the 43 countries on the two unrotated factors. We observe the same phenomenon as in the case of MDS: The country positions in Graph 8.7 correspond to the item posi-tions in Graph 8.6.
Unlike MDS, FA can also provide what is known as a “rotated solution.” This means that the two diameters of the ellip-soid in Graph 8.6 can be rotated so as to run through somewhat different clusters of variables in such a way that the factors are differentiated more clearly. 42 The effect of the rotation may be significant, or almost indiscernible. In the second case, it does not make much sense to rotate.
–
–– –
Graph 8.7. Visualizations of the positions of 43 countries on two unrotated factors (principal components)
Note: See Exhibit 6 in the Appendix at the end of the book for the expansions of the abbreviated country names.

152 ◆ Studying Culture
Graph 8.8 shows the effect of the rota-tion in our case. In fact, instead of rotat-ing the axes, the graph has rotated the positions of the items clockwise, which amounts to the same. We see that the axis that stands for the first factor is now more closely associated with obedience and faith versus independence and perseverance. Also, it has shifted away from tolerance and hard work.
Below, factor loadings are provided for the rotated factors:
Factor 1 Factor 2obedience –.79 .00faith –.79 –.19perseverance .77 –.04independence .73 –.17responsibility .66 –.28imagination .58 –.67hard work –.28 .88tolerance .26 –.86thrift .36 –.70
This solution illustrates the nature and the effect of the rotation. It is a statistical procedure that rotates the axes in the FA space (or the positions of the items, which is the same) in such a way that they stand for more clearly defined factors: They receive more unambiguous identities that should be easier to interpret as there are now fewer variables that are closely associ-ated with more than one factor. However, we have an issue. Although in our case the rotation disambiguated the positions of two items—hard work and tolerance—it also created a new ambiguity: Imagination was associated only with factor 1 in the unrotated solution but is associated with both factors in the rotated one because it is now more or less between them.
Graph 8.9 shows the effect of the factor rotation on the country positions. Instead of rotating the two axes, the graph has rotated clockwise the whole constellation of 43 countries, which amounts to the
–
–
– –
p r s
Graph 8.8. Rotated factor solution for nine values for children from the World Values Survey

Data Analysis ◆ 153
same. Just as the item rotation moved the positions of faith and obedience clockwise and upward, the country rotation moved the positions of Egypt and Jordan in the same way, while lowering the positions of the East Asian countries.
Now, we have a dilemma: Did we gain much from the rotation? We will return to this issue in the next section.
8.2.8.5.1. Calculation of Factor Scores Once we have obtained factors—be they unrotated or rotated—we can calculate country scores on each factor. These will give us dimension indices. 43 Unrotated fac-tor scores are likely to be strongly correlated with the country coordinates on the cor-responding MDS dimensions. In our case, these correlations are .99** for the first
pair (MDS dimension 1 and factor 1) and .98** for the second (MDS dimension 2 and factor 2).
Below are factor scores for the two unrotated factors. The scores have been multiplied by 100.
Factor 1Sweden 221.99Japan 204.80Norway 190.66Finland 153.85Germany 150.28Switzerland 148.07Netherlands 96.98Slovenia 72.63South Korea 70.99
–
–
–– – –
Graph 8.9. Visualizations of the positions of 43 countries on two rotated factors (prin-cipal components)
Note: See Exhibit 6 in the Appendix at the end of the book for the expansions of the abbreviated country names.
(Continued)

154 ◆ Studying Culture
Factor 1Australia 69.18Canada 65.47Uruguay 64.49Taiwan 53.89New Zealand 53.44Chile 33.50United Kingdom 26.68China 23.96France 23.73Italy 16.84United States 16.31Bulgaria –15.32Vietnam –18.52Mexico –31.86Serbia –32.25Spain –34.22Moldova –37.63Russia –45.04Indonesia –46.31Colombia –47.91Poland –49.27Argentina –50.83Ukraine –64.72India –68.43Georgia –80.84Iran –86.95South Africa –90.69Peru –105.07Turkey –116.35Brazil –129.97Romania –130.79Morocco –142.15Jordan –163.25Egypt –169.40
Factor 2South Korea 237.57Vietnam 172.79China 168.85Bulgaria 167.27Russia 143.69Japan 126.40Taiwan 122.04India 120.51Ukraine 102.27Romania 78.95
Factor 2Georgia 71.94Indonesia 65.94Serbia 63.67Moldova 61.71Slovenia 55.13Germany 43.00Iran 26.30Italy 5.31Turkey –3.56South Africa –13.44France –21.00Poland –32.79Brazil –37.22Morocco –42.43Switzerland –44.70Canada –46.96Spain –50.18United States –50.22New Zealand –52.00Netherlands –63.06Uruguay –82.46Chile –83.19Finland –83.76Mexico –84.56Australia –92.06Argentina –95.91Sweden –106.98Peru –109.69United Kingdom –115.89Colombia –121.53Norway –123.63Jordan –134.38Egypt –141.75
The unrotated and rotated pairs of fac-tor scores are strongly correlated and have nearly the same predictive properties. 44 Therefore, we can ignore the rotated factors.
8.2.8.5.2. Issues Related to Factor Analysis as a Data Reduction Method
1. It is quite possible that an FA will extract a factor whose eigenvalue exceeds 1.00 but is nevertheless defined by a few weakly correlated items that consequently do not define it well. As in the case of

Data Analysis ◆ 155
MDS dimensions, the likelihood of this situation increases for each next unro-tated factor after the first. Rotation may align the factors more closely with some variables and give them a clearer identity, yet even some rotated factors sometimes remain weak (internally unreliable) and conceptually diluted.
2. It is possible that a factor will have an eigenvalue below 1.00 or explain less than 10% of variance in a particular data set and seem unworthy of retaining. Yet, the country scores for this factor may be highly associated with important exter-nal variables. Psychologists who developed factor analysis disregarded this important issue in culturology, as their colleagues are usually narrowly focused on a particular data set of individual-level data and can rarely work with external variables. But in culturology, external variables are always available from a variety of sources and one must always consider how well a particu-lar solution explains such variables.
3. Sometimes a slight change—such as taking an item out or adding a new one—can cause a major reshuffle of some items in the FA solution, thus creating new factors. Therefore, a particular factor solu-tion applies only to a specific selection of items; it does not reveal the existence of fac-tors outside that selection, in an objectively existing social or psychological world. As a consequence, a dimension obtained through FA may be impossible to replicate closely without factor analyzing exactly the same items as those in the original FA or at least a very close approximation. Dimensions obtained through FA are often like inseparable conjoined twins: They can-not have an existence on their own because they depend on a statistical symbiosis with their siblings, born in the same FA.
4. Varimax rotation is probably the most popular method associated with FA. But a preference for orthogonal fac-tors rather than oblique ones bespeaks a
philosophy that the world is governed by separate and unrelated forces. The goal of scientists is to discover them and explain them separately. While such a separa-tion is possible in abstract human think-ing, it does not reflect reality where no single phenomenon can exist without any relationship to any other phenomenon. In the words of Costello and Osborne (2005), who criticize the existing inclina-tion toward orthogonal factors, “In the social sciences, we generally expect some correlation among factors, since behavior is rarely partitioned into neatly packaged units that function independently of one another” (p. 3). Schwartz (2011) is also critical of the idea of independent factors because they contradict the concept of cultural variables, such as values, form-ing a continuum. Also, the insistence on unrelated factors violates the principle of integrated culture, so dear to cultural anthropologists (see, for example, Haviland, 1990, pp. 38–39). That prin-ciple may also be viewed as a challenge-able abstraction. Yet, it is practically useful because it can help us understand the interrelatedness of various elements of culture that can hardly be viewed as existing each for its own sake (see 2.3.).
On the other hand, highly correlated factors create a redundancy problem: They measure more or less the same construct. Deciding if and how exactly factors should be related to each other is a form of art that requires considerable experience with large databases. Ultimately, the solution should be governed by practical considerations: Good factors are those that are easy to interpret, are not too similar to each other, and have strong predictive properties with respect to important external variables.
5. FA is a good illustration of the subjectivity of statistical methods in social science. The results of an FA can be manipulated within some margin by at least three methods. First, because all cri-teria for factor retention are purely con-ventional, it is possible to disregard them

156 ◆ Studying Culture
and retain as many factors as postulated by a supposedly good, yet subjective, theory (see 9.13., for an example of how McCrae, 2002, disregarded conventional factor retention criteria in order to retain five factors and replicate the theoreti-cal structure of the Big Five personality traits at the ecological level). Second, there is no fully objective reason to pre-fer one type of rotation to another or to adopt an unrotated solution. Different rotations will produce different factors, with correlations of different magnitudes between them. Third, manipulation of delta and kappa values in direct oblimin and promax rotations will change the magnitudes of the correlations between the factors and the variables that define them. It is also possible to apply a so-called Procrustes rotation. 45 If data col-lected from two different populations produce somewhat different factor struc-tures, Procrustes rotation can be used to make them converge.
As a result, researchers who use FA have considerable freedom to create the kind of dimensions that they want. There is no real problem with this; the philoso-phy that is defended throughout this book is that abstract models in social science and psychology are artificial human cre-ations, not discoveries of absolute truths. But young and inexperienced research-ers may have significant trouble deciding what FA method to use and what dimen-sions to create.
6. Just like MDS coordinates, FA scores may be misleading. A country’s high or low score on a particular factor does not always allow a good prediction of that coun-try’s scores on the variables with high factor loadings. Like MDS, FA is not exactly a tool that merges several correlated variables into a single index, allowing a prediction at a glance of how each case will score on each of those variables, although it often has such a side effect. It is not conceptualized as a clustering tool either (see 8.3.). Strictly speak-ing, FA is supposed to create imaginary vari-
ables—called “factors”—that can explain some of the variance in the real variables that are being analyzed. When FA assigns a factor score to a country (or any other unit of analysis), that score depends not only on the country’s position on the variables that load high on that particular factor but also on the country’s positions on all other variables in the matrix. Ultimately, a factor is most often a lot about something and a little bit about everything else in the data set.
8.2.8.5.3. Factor Analysis as a Scale Reliability Test FA can perform as an excellent scale reliability test, superior to a Cronbach’s alpha. It is surprising that it is not used more often for that purpose.
When an FA yields a particular solu-tion, it is often normally accepted with-out testing the correlations between the variables that define the factors. But this approach can result in weak and uncon-vincing factors. If researchers wish to obtain strong factors, it may be a good idea to perform another series of factor analyses: one per each cluster of items that have high loadings on a particular factor and therefore give it its identity. Each of these factor analyses should result in a single factor. Its item loadings will indicate if the items form a strong dimension or not.
A possible criterion for the identifi-cation of a strong factor is that any of the key items that defined it initially by virtue of their high loadings, and were subsequently factor analyzed together but without other items, should have a fac-tor loading that is at least equal to ±.70 or higher. When a particular item fails to satisfy this condition, the factor and the item share less than 50% of variance and do not explain each other well.
The same criterion can be applied to dimensions that were created by a simple merger of some correlated variables. Factor analyzed together, these variables should yield a single factor on which no single variable has a loading of less than ±.70.

Data Analysis ◆ 157
8.2.9. HOW DO WE KNOW THAT WE HAVE CONSTRUCTED APPROPRIATE DIMENSIONS?
If different data reduction techniques can produce different results for the same data, how are we to judge the merits of a specific set of dimensions?
It may not matter much what data reduc-tion technique was used to construct dimen-sions as long as the criteria in 8.2.8.4.2. are satisfied. In summary, dimensions should be interpretable and practically useful. Just as a good coordinate system should ensure easy navigation, dimensions should be con-structed in such a way that the relationships between the variables that define them are not only statistically strong but also rela-tively easy to understand, although a good theory may help elucidate seemingly murky associations. Also the dimensions should predict interesting and important external variables in a convincing way. 46
This view is in strong disagreement with the anonymous author of a contribution on factor analysis on the popular website Wikipedia. Apparently echoing the views of many like-minded scholars, this author indicates that one potential factor-retention criterion is comprehensibility and goes on to say that this is the worst approach to factor retention. It is actually the best, if not the only one worth bothering about. If a fac-tor or a dimension is incomprehensible, it is useless and not worth discussing. On the other hand, a comprehensible factor is a fac-tor that explains something. If it statistically predicts a lot of variables and the associa-tions are logical, it is worth retaining.
Let us once again look at Graphs 8.1 and 8.2. The MDS solution suggests that we should adopt an East versus West dimension as well as a North versus South dimension, and the unrotated FA factors concur. This solution would highlight two contrasts on the MDS and FA maps:
1. East versus West: The cultures of the richest countries versus those of the poorest countries
2. North versus South: The cultures of what economists call emerging Asia and Eastern Europe versus the cultures of Latin America, the Arab world, the Anglo world, and the Scandinavian countries
Are these contrasts meaningful and useful? The first one is well known from a number of studies, discussed in Part IIIof this book. Dimensions that are closely associated with national wealth and are strongly intercorrelated have been called “individualism versus collectivism,” “uni-versalism versus exclusionism”, and vari-ous other names. The different members of this family of dimensions reveal a wide spectrum of cultural differences between the richest and poorest societies. Our variant captures a familiar cultural fla-vor: disengagement from one’s group versus conformism. Unrotated factor 1 correlates with GLOBE’s in-group col-lectivism practices index (Gelfand et al., 2004) at –.73** ( n = 32) and with Minkov’s (2011) exclusionism versus uni-versalism at –.83** ( n = 42). We must note that Minkov’s dimension is not based on values but on real behaviors: corruption, road death tolls, and percent-ages of adults who live with their parents. There is no doubt that the East to West dimension explains some real differences and is strongly convincing. We can call it “autonomy versus conformism,” keep-ing in mind that it is a variant of the well-known individualism versus collec-tivism syndrome as described by Hofstede (1980, 2001).
The North versus South contrasts on the MDS maps and factor plots are less well known, but they are also interesting. We defined that dimension as a focus on achievement of individual economic pros-perity versus a focus on concern for oth-ers. Indeed, unrotated factor 2 correlates with World Values Survey item A007 (percentages of respondents who indicate that “service to others” is very important to them, latest data for each country from 1994–2004) at –.78** ( n = 21).

158 ◆ Studying Culture
Unrotated factor 2 is also closely asso-ciated with Green et al.’s (2005) measure of self-reliance: r = .75** ( n = 13). Self-reliance was found to be greatest in China, lowest in Latin America (the Arab world was practically unrepresented). Most important, the North to South dimension is a convincing predictor of economic development for the period when the values for children were measured by the World Values Survey. One of the com-monly used indicators by economists is gross national income per person at pur-chasing power parity (GNI per person at PPP); data are available from the World Bank Group (2009). If we divide the 2008 data by the 1998 data, the resulting eco-nomic development index will correlate with unrotated factor 2 at .61** ( n = 42). After controlling for GNI per person at PPP in 1998 (since poorer economies tend to grow faster than richer ones by default), this correlation is lowered to .55**. Evidently, societies whose cultures place a stronger emphasis on values asso-ciated with self-reliant achievement of personal prosperity, such as hard work and thrift, had faster-growing economies in the first decade of this millennium. This finding is in full agreement with the views of leading economists (Dornbusch et al., 2004) who associate fast economic growth in the developing world with saving and self-sacrificial work, among other factors.
It is also possible to calculate an eco-nomic growth per person index from 1970 to 2007, using raw gross domestic prod-uct (GDP) per person, which is practically the same indicator as GNI per person. In this case, however, we must exclude the former Marxist economies from the anal-ysis, as there is ample evidence that in the long run a Marxist regime will devastate any economy regardless of the culture in which it operates. The 1970–2007 eco-nomic growth index (based on GDP data from UN Statistics Division, 2009) cor-relates with unrotated factor 2 at .59** ( n = 31). Controlling for GDP per person in 1970 has no effect on this correlation.
Finally, the North versus South dimen-sion is strongly correlated with the Chinese Culture Connection’s (1987) “Confucian work dynamism,” renamed by Hofstede (2001) “long-term orientation.” Unrotated factor 2 yields a correlation with it of .81** ( n = 15). It is also strongly correlated with another dimension pro-posed by the Chinese Culture Connection: “moral discipline” ( r = .77**).
In summary, there is little doubt that the North versus South contrast on the MDS and FA maps gives us a convincing dimension of national culture that we can call “egoism versus altruism.”
Thus, the East to West and North to South diameters on our cultural maps stand for meaningful dimensions of national culture. But is that the only possible solution? What would we capture if we drew a Northeast to Southwest diameter and another one that ran from Northwest to Southeast?
Hologeistic culturology requires famil-iarity with large databases covering many countries. Anyone who is familiar with the TIMSS (Trends in International Mathematics and Science Study) nation-ally representative studies of educational achievement of schoolchildren in the fourth and eighth grades (Mullis et al., 2005, 2007) will immediately remember the cultural contrast that transpires from the schoolchil-dren’s results in standardized mathematics tests: The East Asian countries are always at the top of the world’s ranking, whereas the Arab countries share the lowest posi-tions with those of the sub-Saharan nations. Apparently, a cultural dimension that runs from Northeast to Southwest on the MDS and FA maps will account for this difference in educational achievement.
As indicated in Section 5.2., some schol-ars would disdainfully describe this exercise as a “fishing trip”: Let us cast the net and see what we will catch. Incidentally, we have a good old theory for the purpose of constructing a Northeast to Southwest dimension. Hofstede’s (2001) long-term orientation reveals the same contrast: thrift and perseverance versus personal stability. In

Data Analysis ◆ 159
our case, the concept of personal stability is reflected in the great importance of religion in the Southwest of the MDS and FA maps; the Middle Eastern religions teach adherence to immutable values, beliefs, behaviors, and personal and group identities.
A Northeast to Southwest dimension cannot be produced through factor rota-tion. But there is a simpler method for that: One can add up the country scores for thrift and perseverance and subtract those for faith. This should be done after plotting all these items on a scale from 0 to 100. As that is not enough to give them equal weights, the thrift scores should be multi-plied by 2. After we apply our index cal-culation formula (thrift × 2 + perseverance – faith), we obtain a dimension of national culture with the following structure:
thrift .79**perseverance .72**faith -.70**
This results in the following index for the Northeast to Southwest dimension:South Korea 235.7Japan 225.7Vietnam 215.0China 192.9Taiwan 187.6Russia 186.7India 166.6Ukraine 157.8Bulgaria 156.7Slovenia 151.6Germany 148.5France 146.6Switzerland 117.6Sweden 116.4Finland 106.2Moldova 102.3Serbia 101.2Poland 95.7New Zealand 95.3Netherlands 94.6Chile 94.4Italy 94.3
UK 82.7Indonesia 79.5Mexico 79.0Canada 78.2Australia 77.4Uruguay 70.4South Africa 62.7Spain 54.2Romania 52.0Turkey 49.0Brazil 44.0US 42.1Georgia 38.6Colombia 37.9Norway 36.8Iran 23.3Morocco 21.1Argentina –13.2Peru –21.2Jordan –47.5Egypt –81.6
This index is strongly correlated with the TIMSS measures of overall educational achievement in mathematics in the eighth grade in 2007 and 2003 (data from Mullis et al., 2005, 2007):
2007 .78** ( n = 22) 2003 .63** ( n = 25)
Controlling for national wealth does not affect these correlations; in fact, con-trolling for GNI per person at PPP in 2007 (World Bank Group, 2009) slightly raises the first correlation to .81**.
The index for the Northeast to Southwest dimension is also strongly correlated with a combined national suicide rate index for men and women (data from World Health Organization, 2009b): r = 79** ( n = 37).
Somewhat surprisingly, although this dimension is highly correlated with Hofstede’s long-term orientation ( r = .71**, n = 15), its association with it is less strong than what we obtained for egoism ver-sus altruism. This creates an interesting dilemma: Which of the two dimensions is a

160 ◆ Studying Culture
better replication of long-term orientation: the one that is a little closer to it statistically or the one that resembles it a little more closely conceptually? This issue can be left to those who like abstract theorizing.
Evidently, the fishing trip has paid off: The catch is rich and interesting. But what explains the reported associations?
Long-term orientation theory provides one possible explanation. Also, because the Northeast to Southwest dimension replicates Minkov’s (2011) monumental-ism dimension ( r = –.84**, n = 40) more closely than its conceptual sibling, long-term orientation, the reader is referred to 9.24. for a presentation of Minkov’s mon-umentalism theory as an explanation for educational achievement and suicide rates and to Minkov (2011) for further details. For the purpose of identification, we can call this Northeast to Southwest dimen-sion “determination versus stability.”
Finally, we may wish to consider a Northwest to Southeast dimension. It would contrast the most salient values of Eastern Europe, the Caucasus region, and Southern Asia (hard work) to those of Northwestern Europe (tolerance and imagination). We know a similar dimension from the work of Ronald Inglehart (see 9.9.), called “survival versus self-expression values”; this should justify our next fishing trip in the eyes of those who insist on a theory. Again, we can plot our items on a scale from 0 to 100 and apply the appropriate formula for the calculation of a dimension index:
hard work – tolerance – imagination
This is how these three items correlate with the resulting dimension:
tolerance –.89**hard work .88**imagination –.82**
The resulting dimension index isGeorgia 76.4Bulgaria 75.1Romania 70.2
Russia 68.1Vietnam 61.9Ukraine 52.7Iran 43.7Serbia 40.4India 39.9Turkey 32.2South Korea 30.6Brazil 22.5China 19.9Indonesia 19.7Moldova 14.2Morocco 10.8Egypt 10.0South Africa 7.7Peru 4.3Jordan 0Taiwan –2.7Spain –10.9Argentina –16.4Italy –21.55Slovenia –26.1Poland –40.0US –50.8France –51.2Mexico –62.5Colombia –62.6Canada –72.8Japan –76.8Germany –82.1New Zealand –83.3Uruguay –86.7Chile –88.5Netherlands –93.8Australia –102.9UK –106.7Switzerland –112.9Finland –127.9Norway –149.9Sweden –200.0
Now, what can this dimension be used for? It is an excellent predictor of life sat-isfaction (although it is less closely associ-ated with happiness—the other aspect of subjective well-being) as measured by the World Values Survey. Correlations with

Data Analysis ◆ 161
item A171 (mean national life satisfac-tion, latest data for each country from 1994–2004) and item v22 (mean national life satisfaction, 2005–2008) are provided below:
A171 –.78** ( n = 43) v22 –.68** ( n = 39)
This fishing trip has yielded another extremely important catch. Our find-ings show that national life satisfaction is strongly and positively associated with a dimension underpinned by tolerance and a focus on leisure, whereas the opposite pole—intolerance and an emphasis on hard toiling—stands for dissatisfaction. Imagination, as an expression of indi-vidual freedom and creative thinking, also appears to be involved in this equation.
Also, this dimension correlates with Inglehart’s self-expression values (data from Inglehart & Welzel, 2005a) at –.87** ( n = 32). For the purpose of identification, we can call this dimension “hardship ver-sus tolerance.”
Now, let us once again examine Graph 8.4 and Graph 8.5. Although we used them to identify classes of self-descriptions and countries, they can be used to identify dimensions of culture as well, using the principle described in 8.2.8.2.: Items in the same section might form a scale. The IPCR class is a good can-didate for that. After plotting all country scores on a scale from 0 to 100, we apply the following formula to give all items roughly similar weights:
INVARIANT × 2 + PROUD × 1.5 + CONSISTENT + RELIGIOUS
We obtain the following correlations between the dimension index and the vari-ables that define it ( n = 50 in all cases):
RELIGIOUS .77** PROUD .74** CONSISTENT .73** INVARIANT .70**
This results in the following index for a dimension of national culture based on self-reported personality characteristics:
Mali 462Jordan 455Egypt 437Ghana 416Burkina Faso 410Georgia 391Ethiopia 367Trinidad 356Turkey 352Morocco 347Rwanda 334Poland 324South Africa 315Chile 311India 309Norway 307Cyprus 305Mexico 296Zambia 293Malaysia 288France 284Romania 278Switzerland 268Canada 265Indonesia 251Finland 250Italy 248Argentina, US 246Slovenia 245Brazil 244Thailand 243Russia 241Serbia 231Uruguay 222Bulgaria 210UK 206Vietnam 205Spain, Ukraine 200Australia 188Moldova, Netherlands 187Germany 169Andorra 162Sweden 152

162 ◆ Studying Culture
South Korea 95Taiwan 75Japan 32China 30
This index correlates with Minkov’s (2011) monumentalism index at .86** ( n = 37) and is evidently a variant of the monumentalism versus flexumility dimen-sion. But it also correlates with its sister dimensions:
Determination versus stability–.74** ( n = 39)
Long-term orientation (Chinese Culture Connection, 1987; Hofstede, 2011)
.67** ( n = 15)
These correlations show beyond any doubt that long-term orientation is under-pinned by—among other things—national differences in some aspects of self-stability and self-enhancement (Hofstede, Hofstede, & Minkov, 2010).
The variables in the other classes (AHAF, DCU, and TFH; see 8.2.8.4.4.) can also be used to construct dimen-sions of national culture, although not all classes will yield as strong a dimension as the IPCR class; in some cases, it may be more appropriate to split the variables within a given class into two dimensions.
What have we learned from these exercises?
A good database, like the World Values Survey, can provide rich material for cross-cultural comparisons. In that case, a search for dimensions of national culture can yield different solutions for a given selection of items, highlighting various cultural contrasts between major regions of the world. Which solution should we adopt? It depends on what we need our dimensions for. If we wish to explain the cultural differences between the poor and rich countries, we need con-formism versus autonomy. For the best asso-ciation with economic growth, we should use egoism versus altruism. If our goal is to predict educational achievement, not only in mathematics but also in other domains, no other dimension can perform better than
determination versus stability, except the different variants of monumentalism, which are members of the same family. But if we are looking for the roots of the national dif-ferences in life satisfaction, our best bet is the hardship versus tolerance dimension.
This being said, one should not subscribe to the view that any oval configuration of variables can be crisscrossed with diameters any which way and the resulting dimensions will always be meaningful. With relatively few variables and an incomplete circum-plex, the number and type of dimensions that one can choose from may be very lim-ited. Consider Graph 8.10. It presents an MDS solution for seven national statistics. These variables were analyzed by Minkov (2011) in an attempt to understand why some nations consistently have higher mur-der rates than others (see 9.25. for details). The MDS solution in the graph suggests a West versus East dimension contrasting var-ious characteristics found in poor countries (high HIV rates, high murder rates, high adolescent fertility, high road death tolls, and high percentages of adults living with their parents) with a combination of charac-teristics found mainly in rich countries (high IQ and high transparency/low corruption). But this solution does not explain why there are many developing countries that have low murder and HIV rates. The MDS solu-tion also proposes a North to South dimen-sion contrasting high HIV rates with high percentages of adults living with parents. It is hard to make sense of this dimension and associate it with any societal indicators.
A rotated solution, however, proposes meaningful contrasts. One of the rotated dimensions captures transparency versus road death tolls and living with parents. The other dimension contrasts murder, HIV, and adolescent fertility rates with high IQ. The first dimension is interpre-table as national differences in universalism and rule of law for everybody versus exclu-sionism (see 9.25.). The second dimension can be explained through mating competi-tion theory and what Minkov (2011) called “hypometropia” (see 9.25.). As Graph 8.10 suggests, oblique factors may be preferable

Data Analysis ◆ 163
in this solution to strictly orthogonal ones as transparency and IQ are close to each other and the dimension axes that run from them to the clusters of variables opposite them are visibly not orthogonal.
The cultural spaces of the nine values for children in Graph 8.1, the 14 self-descriptions in Graph 8.4, and the seven national statistics in Graph 8.10 are cer-tainly not the only ones possible. There are many other cultural spaces and sub-spaces, overlapping to various degrees, such as those defined by Hofstede’s (2001) dimensions or those proposed by the Chinese Culture Connection (1987), Smith et al. (1995), Smith et al. (1996), Smith et al. (2002), Minkov (2011), and others. All those spaces and their coordi-nate systems are interesting in their own right and have their merits for particular purposes.
I hope this section has driven home the point that cultural and psychological dimensions (or any other for that matter) do not exist but are created by research-ers. It was demonstrated why the success of this exercise in creativity cannot be ensured by strict adherence to statistical conventions. It is wrong to assume that one can use mathematical tools to discover some natural coordinate systems in the entire social or psychological space. The fact that the space between hard work and thrift in Graph 8.1 appears empty does not mean that there is nothing between those variables in reality; it means that no appropriate questions have been asked to tap what is there. If researchers ask a wide spectrum of questions about religiousness-secularism–related phenomena, as is the case in the World Values Survey, and one about thrift and hard work each, they will
–
–
–
Graph 8.10. Multidimensional scaling solution for national murder rates and their correlates
164 ◆ Studying Culture
create a space with tight religiousness and secularism clusters opposite each other, and a strong religiousness factor, whereas thrift and hard work will remain isolated. But the opposite situation can also be cre-ated by asking many questions associated with hard work and thrift and one or two about religion. It is this subjectivism in the design of questionnaires that results in clusters of variables and relatively void spaces between some of them. A different subjective choice can fill up some of the gaps in the studied space while poking holes elsewhere. The result of this can be an infinite range of statistical solutions. As the construction of dimensions is inevita-bly a creative exercise, their utility should be an essential consideration; otherwise, they would be like coordinate systems for an empty space that nobody ever visits.
This answers the important question asked by Stephen J. Ceci in the quote at the beginning of this chapter. Yes, one constellation of data in the social sciences and psychology can be treated in different ways, reflecting diverse artistic choices. All existing cultural and psychological dimen-sions in the academic literature are prod-ucts of such human creativity: They are subjectively invented coordinate systems for objectively existing spaces. Believing that these dimensions have an absolute existence on their own is like saying that there is one single absolutely correct way to draw coordinate axes across the uni-verse. Social scientists and psychologists can create as many coordinate systems as they wish, since there is no limit to the number and nature of items that they can introduce in the space that they are study-ing; thus, they can alter its composition at any time and as they see fit. A search for a once-and-for-all absolutely correct set of specific dimensions of culture or human personality would be a naïve endeavor.
We have also learned that statistically similar dimensions can be extracted from different types of items: for instance, val-ues for children versus self-descriptions in the World Values Survey. Comparisons
with dimensions in other publications, such as the Chinese Culture Connection (1987), also demonstrate that question-naires produced in different cultural envi-ronments can lead to similar results. Each of the sister dimensions obtained in this way can help elucidate the other mem-bers in the same family and their facets, some of which (for instance, Confucian work dynamism/long-term orientation as presented by the Chinese Culture Connection, 1987) may be hard to grasp on their own.
8.2.10. CONSTRUCTING INDIVIDUAL AND ECOLOGICAL DIMENSIONS
A major question in the construction of cultural dimensions is whether the units of analysis should be individuals or societies. Several approaches are possible.
1. Dimensions from individual-level analyses
Peterson and Castro (2006) call this approach “ILSA” ([create] individual-level scales and aggregate). 47 The first step is to analyze correlations between items across individuals in each culture from which a sample is available. This could involve a simple search for significant and high cor-relations between some items, or a more complex data reduction technique such as factor analysis. The second step is to com-pare the patterns of these correlations or factor structures across cultures. If the pat-tern is the same—that is, the same dimen-sions emerge in all cultures— dimension scores for each individual and for each dimension are calculated separately within each culture to be subsequently compared across cultures. 48 The classic example of this are Lynn and Vanhanen’s (2002, 2006) collections of average national IQs from individual-level IQ studies within nations. National IQs are calculated by first calcu-lating individual scores on the complex IQ construct (defined by items that correlate across individuals); then these individual

Data Analysis ◆ 165
IQs are added up within each nation and divided by the number of people in the national sample. Because well-designed IQ tests yield similar factor structures within different cultures, national IQ scores calcu-lated in this way seem comparable.
Peterson and Castro (2006) point out that this approach is logical when what is being studied is a fundamentally individual phenomenon, such as a group of personal-ity traits. IQ is also in this category. But when culture is studied at the individual level, the result is what Maznevski, Gomez, Di Stefano, Noorderhaven, and Wu (2002) called “cultural dimension at the individual level of analysis” (p. 275). This is an oxy-moron that flies in the face of any known definition of culture as a collective phenom-enon. Yet, the theoretical conceptualiza-tions of culture and the terminology are not the only problem here. If different countries display markedly different correlation pat-terns and factor structures across their respondents, a cross-cultural comparison becomes extremely difficult. It would be like discovering that in some countries peo-ple who drink a lot of alcohol also smoke a lot, but in other countries there is no such association; instead, drinkers tend to com-mit suicide more often, which is not the case in the first set of countries. Discovering such diverse patterns of correlations across individuals inside countries does not help us make easy comparisons of societies.
2. Dimensions from a pan-cultural analysis Leung and Bond (1989) popularized the
term “pan-cultural analysis.” When the pan-cultural approach is used, all respon-dents from all countries in the sample are pooled together, as if they came from a single country, and correlations between items or factor structures are sought within this pool, across all individuals in it. Once a dimension is identified, scores are calculated for each individual. Then, average country scores are calculated for each dimension and for each country by aggregating the dimension scores of the respondents from each country. 49 After
that, one can compare the country scores on each dimension.
Pan-cultural factor analyses are quite popular. 50 Yet, Leung and Bond (1989) point out that they are not appropriate for identifying individual variation. 51 But they are no more appropriate for iden-tifying cross-cultural variation. Despite Leung and Bond’s (1989) apparently cor-rect observation that pan-cultural analyses yield factor structures that are somewhat similar to those in ecological analyses, we cannot simply assume strong isomor-phism. Therefore, pan-cultural analyses are not recommendable for any purpose, least of all for constructing dimensions of national culture.
3. Dimensions from an ecological analysis This type of analysis disregards correla-
tions across individuals and treats coun-tries or other groups of people as if they were single indivisible entities. Correlations between items, or factor structures for the purpose of identification of dimensions, are sought directly across countries or other groups of people. Note that this is the only possible analysis of variables that are meaningless at the individual level. One can measure and compare degrees of industrialization and degrees of democrati-zation at the national level, but there is no such thing as industrialized or democrati-cally governed individuals. 52
One of the obvious limitations of this approach is that it requires a high number of countries because correlations and factor structures across a small number of cases could be very unstable. Twenty countries is probably the lowest number in the avail-able literature that is known to have given meaningful results that could be replicated across expanded samples of countries.
Working with variables scored at the national level is not inappropriate even if those variables do not produce the same associations across the respondents in each country that is being studied. Societies are complex systems. As in the case of all systems, they can be studied at the system

166 ◆ Studying Culture
level without necessarily analyzing their components. One can learn something about individuals by studying their cells, but that is absolutely not necessary in all studies of individuals. If relationships between the cells in the human body are not the same as those between individuals, that does not make a study at the level of individuals inappropriate.
It is also necessary to mention some creative approaches to the construction of cultural or culture-related dimensions.
McCrae (2002) carried out an ecological analysis of group indicators derived from various individual-level analyses. This is an unusual approach, discussed in 9.13.
Peterson and Castro (2006) discuss a variant of the ecological analysis in which correlated ecological dimension indices are fused into a smaller number of dimen-sions. This is like using simple ingredients to prepare two separate mixtures—for instance, ketchup and soy sauce—and then mixing the two mixtures together. Project GLOBE used this approach for its leader-ship dimensions (Dorfman et al., 2004; Hanges & Dickson, 2004). Welzel (2010) also used it in his analysis of World Values Survey items. The inconvenience of this method is that it dilutes the tastes of the simple ingredients; one’s palate is no lon-ger sure if the mixture of ketchup and soy sauce contains a tomato flavor or not. In other words, second-order dimensions may be hard to explain in terms of the simple items that went into the first-order dimen-sions. Explaining second-order dimensions in terms of first-order dimensions (rather than simple items) means that a group of subjective constructs will be used to produce and explain another subjective construct. This is hardly an easy method.
◆ 8.3. Clustering
As its name suggests, the goal of a clus-tering analysis is to form clusters: groups of objects based on statistical similarities
and differences. One can cluster variables or cases. Clustering is reminiscent of a data reduction technique although it does not produce dimensions and rankings but typologies. Seemingly, these have a cat-egorical nature: Country A (or var1) will be clustered together with country B (or var2) but not with C (or var3). In fact, the clusters are probabilistic. As in MDS and FA, the results depend on various subjec-tive choices—the selection of variables, cases, and clustering techniques, as well as the number of requested clusters.
Like MDS, clustering can be a first step toward the identification of groups of vari-ables that may be intercorrelated, defining single dimensions. But just like in MDS, the fact that several variables have clus-tered together is not a guarantee that they will form a reliable scale or a single factor.
Clustering tools can also help identify groups of countries or within-country regions that share cultural similarities as well as calculate cultural distances between countries or regions on the basis of selected variables. 53
What is the utility of clustering coun-tries on cultural indicators? It is tempting to surmise that clusters of countries might prove to be a good parallel alternative to nations as units of analysis. Yet, any clustering results will depend on a num-ber of subjective choices, starting with the selection of variables. For example, Russia and Bulgaria will cluster together on most World Values Survey measures, but if murder rates and HIV rates were chosen, Russia would gravitate toward Latin America (Minkov, 2011) and the two countries would seem worlds apart. Based on suicide rates, Russia is in the same league as Japan, but if corruption were used as a criterion it would be in the company of the African countries. In all these cases, Russia would be a long distance from Bulgaria. Whether Japan will cluster together with China and South Korea also depends on what variables are chosen. On measures that are associated with differences in national wealth—such

Data Analysis ◆ 167
as corruption, road death tolls, or impor-tance of leisure versus hard work—Japan resembles Germany far more than it does East Asia (Minkov, 2011).
In 8.2.8.4.4., we saw how MDS can be used to produce typologies of variables or cases by partitioning clusters of items on an MDS map. In fact, that is not the main utility of MDS; there are tools designed specifically for the purpose of clustering. One potentially useful and relatively user-friendly instrument available in SPSS is hierarchical clustering (HC). It can gener-ate various statistical products, three of which are relatively easy to interpret.
1. Dendrograms: These are visualiza-tions of similarities and distances between variables or cases resem-bling family trees.
2. Cluster memberships: Variables or cases are grouped into a number of clusters determined by the researcher.
3. Distance matrices: Distances between all pairs of variables or cases are cal-culated and presented in a matrix.
Although HC is user-friendly in terms of results interpretation, it is not at all a straightforward tool in terms of preparing the data for analysis and selecting the right combination of approaches for the right purpose. Different approaches do not nec-essarily produce the same results.
One of the first choices to be made is the selection of the measurement method, an issue mentioned in 8.2.8.4.1. In addition to the methods available in the SPSS ver-sion of MDS—such as Euclidian distances, squared Euclidian distances, or block—HC can use Pearson correlations and more.
Another dilemma is how distances between groups of objects should be mea-sured: Should one use the nearest neighbor method, the farthest neighbor method, average linkage, or something else? 54 A third issue is whether the scores should be standardized or not and, if they should, what standardization method should be
applied. The answers to these and other methodological issues in HC can create a bewildering variety of combinations of methods that can lead to diverse results for the same data.
For an illustration, consider this simple scenario. We have six cases (A, B, C, D, E, F) and two variables (var1, var2). The six cases have the following scores on the two variables:
var1 var2 A 1 1 B 2 2 C 3 3 D 7 7 E 8 8 F 9 9
The scatterplot in Graph 8.11 shows the configuration that the six cases form when their scores on var1 and var2 are used as space coordinates. How should A, B, C, D, E, and F be clustered?
One is perhaps inclined to feel that A, B, and C form one cluster, whereas D, E, and F form another. Indeed, this is what the HC dendrogram will show if we use raw scores and the measures are Euclidian distances. But if the measures are Pearson correlations, the dendrogram will show a single cluster. In fact, the Pearson method does not measure real spatial distances but transposes rows (cases) into columns (variables) and vice versa, and calculates correlations between these new columns. 55
Although the Euclidean method with raw scores may appear more logical, it is not without its controversies. Depending on the linkage principle that we use, the dendrogram may show that we have only two homogenous clusters (ABC and DEF) or two clusters with sub-clusters. In the second case, one sub-cluster may be formed by B and C (versus A), and another one by E and F (versus D). But why not A and B versus C, and D and E versus F?
Obviously, clustering is like attempting to identify constellations of stars in the sky. Depending on the method—how the

168 ◆ Studying Culture
observer decides to group the stars, the angle of observation, and other subjective factors—the results can vary significantly. Similarly, HC involves a lot of relativity. As in the case of all other statistical tools, the choice of a particular combination of methods should be defended by some theory. Different theories can lead to dif-ferent choices, however, and the relativity will remain.
Fortunately, when a large body of real data is analyzed, the results that the dif-ferent combinations of methods yield may not be so discordant as to discredit the use of HC. For instance, if we cluster the 43 countries that we worked with in the sections on MDS (8.2.8.4.) and FA (8.2.8.5.), using the nine values for chil-dren in the World Values Survey, we will obtain some more or less clear geographic configurations. Most combinations of
methods will produce an Eastern European cluster, an Anglo cluster, a Middle Eastern cluster, and an Eastern Asian cluster. But some important details will be different: The United States may or may not cluster with the other Anglo countries, Uruguay may cluster with the Netherlands or with Italy, and so on. Thus, HC cannot be used to answer specific questions, such as “Does the United States belong in the same cultural cluster as Australia and Canada?” The answer to this question is “It depends on the subjective choice of methods” and, of course, on the selection of variables.
Yet, HC can be used to verify a claim made by Inglehart and Welzel (2005b):
The fact that a society was historically shaped by a Protestant or Confucian or Islamic cultural heritage leaves an enduring impact. . . . Thus, although
Graph 8.11. Positions of six cases in a two-dimensional space to be clustered through hierarchical cluster analysis

Data Analysis ◆ 169
few people attend church in Protestant Europe today, the societies that were historically shaped by Protestantism continue to manifest a distinctive set of values and beliefs. The same is true of historically Roman Catholic societies and historically Islamic or Orthodox or Confucian societies. (p. 22)
Regardless of the HC method one uses, the World Values Survey values will not delineate clear clusters along the lines of religious denominations: There will be no clear Buddhist cluster, Islamic cluster, Orthodox Christian cluster, and so forth. Most selections of values and most HC methods are likely to place Vietnam amidst Eastern Europe, whereas Indonesia will be far from the Arab world, just as Catholic Lithuania and Poland will be very far from Latin America. 56 As it was pointed out in 2.6.3., the view that religious denominations are associated with cultural values does not stand up to empirical scrutiny.
HC can be used for another purpose as well: to assess the meaningfulness of the concept of national culture. This vexing question was discussed in 2.6.1. It is now time to address it empirically and at the same time show how HC works.
One possible way to find out if it makes sense to speak of national culture is to estimate how in-country regions cluster on the basis of given cultural variables. If the regions of a country are scattered across many clusters and are intermixed with the regions of other countries, the concept of national culture will be compromised. But if the regions of a country can be clustered together, without too many intermixtures from other countries, at least one argu-ment against the concept of national cul-ture will be rejected. 57
Note that an exercise of this kind can-not and should not attempt to answer an abstract question such as “Do in- country regions cluster along national lines?” The answer to a question of this type depends on the variables and clustering
methods that one chooses. A more practi-cal question is “Can one select a combi-nation of variables and methods that will sort out in-country regions into existing nations?” 58
Let us focus on sub-Saharan Africa, whose national boundaries were drawn by European colonial powers without any regard for local cultures. Would the available African in-country regions in the World Values Survey produce clusters that resemble existing nations?
The latest World Values Survey data (from 2005–2008) is appropriate for this exercise as it provides the most extensive data for Africa. The individual data from each nation (files wvs2005a_v20090901_spss and wvs2005b_v20090901_spss, available at www.worldvaluessurvey.org) can be aggregated to the in-country regional level, which is what we need for our analysis. These in-country regions are most often administrative units although sometimes other principles seem to have been followed by the World Values Survey researchers.
The latest World Values Survey cov-ers seven sub-Saharan countries, repre-sented by a total of 64 regions. Three of those countries—Ghana, Burkina Faso, and Mali—are in West Africa and form a geo-graphic continuum. Burkina Faso is between the other two, sharing borders with them. The remaining four countries—Ethiopia, Rwanda, Zambia, and South Africa—are in Eastern, Central, and Southern Africa and do not share borders.
After entering the 64 African regions as separate cases in SPSS, we can perform a hierarchical cluster analysis with 26 World Values Survey items, measuring values. 59 Although values are not the only components of culture, they are essen-tial; we have already stressed the point that they have strong predictive proper-ties at the national level with respect to diverse behavioral and cognition-related variables.
The results are presented in Dendro-gram 8.1.

170 ◆ Studying Culture
C A S E 0 5 10 15 20 25 Label Num +---------+---------+---------+---------+---------+
ETHI2 2 -┐ETHI4 4 -| ETHI1 1 -+-┐ETHI3 3 -┘ |-------┐ETHI5 5 ---┘ |-----------------------┐
BURK12 48 -----------┘ |---┐
ZAMB4 53 -----------------------┐ | | ZAMB9 58 -------------------┘ |-----------┘ | ZAMB3 52 -------------┐-------┐ | | ZAMB5 54 -------------┘ |-┘ | ZAMB1 50 ---------------------┘ | ZAMB8 57 ---------------┘ |
SAFR2 29 ---------------┐ |-----┐SAFR5 32 ---------┘ | | | SAFR1 28 ---------┐ |-------┐ | | SAFR9 36 ---------+---┐ | | | | SAFR3 30 -------┐ | | | | | | SAFR8 35 -┘ |-┘ |-┘ |---------┐ | | SAFR4 31 -------┘ | | | | | SAFR6 33 -------------┘ | |-----┘ | SAFR7 34 -----------------------┘ | |
BURK13 49 ---------------------------------┘ |
RWAN2 17 -----┐ |---┐RWAN7 22 -┘ |-┐ | | RWAN10 25 -----| | | | RWAN11 26 ---┘ | | | | RWAN1 16 ---┐ | | | | RWAN4 19 ---┘-┘ | | | RWAN3 18 ---┐ | | | RWAN5 20 ---| | | | RWAN6 21 ---┘ |-------------------------------┐ | | RWAN8 23 -------| | | | RWAN9 24 -----┘ | |-----┘ | RWAN12 27 -------┘ | |
ZAMB6 55 ---------------------------------------┘ | ZAMB7 56 -----------------------┘ |
GHAN2 7 ---------┐ | GHAN7 12 -------┘ |-┐ | GHAN1 6 ---------┘ |---┐ | GHAN4 9 -----------┘ |-----┐ | GHAN5 10 ---------┘ | | | GHAN3 8 ---------------┘ |---------┐ | GHAN9 14 -------------------┐ | | |
GHAN10 15 ---------------┘ |-┘ |-----┐ | GHAN8 13 -------------------┘ | | | GHAN6 11 -------------------------------┘ | |
BURK4 40 -----------------------------------┐ | | ZAMB2 51 -----------------------------┘ | |-----------┘
BURK2 38 -----------------┐ | | BURK3 39 -------------┘ |-----┐ | | BURK9 45 -----------------┘ | | | BURK7 43 -------------------┐ |-----┐ |-┘BURK11 47 -----------┘ | | | | BURK1 37 -------------┐ |---┘ | | BURK5 41 ---------┘ | | | | BURK6 42 -------------+-----┘ | | BURK10 46 -----------┘ | |-----┘BURK8 44 -------------┘ |
MALI1 59 -----------------┐ | MALI6 64 ---------┘ |-----┐ | MALI3 61 -----------------┘ |---┐ | MALI4 62 ---------------┘ | |-┘MALI2 60 -----------------------┘ | MALI5 63 ---------------------------┘
Dendrogram 8.1. Hierarchical clustering of 64 regions in 7 sub-Saharan African countries clustered on 10 values for children, 6 personal values, and 10 Schwartz values

Data Analysis ◆ 171
In summary, the dendrogram yields the following results:
Country
Number of Regions Forming a Homogeneous National Cluster
Burkina Faso 10 of 13
Ethiopia 5 of 5
Ghana 10 of 10
Mali 6 of 6
Rwanda 12 of 12
South Africa 9 of 9
Zambia 6 of 9
We see that all of the seven African countries have well-delineated national cultures. Even the most controversial case—Zambia—has two-thirds of its regions in a single cluster. It is noteworthy that the three neighboring countries—Ghana, Burkina Faso, and Mali—form a supra-national cluster as well as three distinct national clusters within it: They do not show any intermixture of regions. In summary, 58 of the 64 African regions, or 90.6%, cluster together with the other regions of their nation, forming homoge-neous national clusters.
Minkov and Hofstede (2012b) repeated this exercise with the available East and Southeast Asian regions in the World Values Survey, then with the Latin American regions, and finally with the regions of the English-speaking coun-tries. The results were very similar: All regions, with the exception of those of New Zealand, tended to cluster together with the other regions of their respec-tive nations. Interestingly, the East and Southeast Asian countries had the clos-est linkages between their respective in-country regions—a finding that strongly contradicts Fletcher and Fang (2006), who believed that national dimensions of cul-ture are an unsuitable research paradigm for Asia because of the great regional cul-tural diversity on that continent. Quite to the contrary, the East and Southeast Asian
countries have very compact national cul-tures, at least in terms of their values.
Naturally, different selections of regions, items, and clustering methods will produce somewhat different results. However, it is unlikely that our general conclusion will be seriously challenged: National culture is not an absolutely clear-cut entity, but it is a sufficiently meaningful concept. The empirical evidence weighs more strongly than any theoretical objections. As this type of research is in its infancy, we can only hope that it will generate the amount of interest that it deserves and we will see some good studies that estimate link-ages between regional cultures and the homogeneity and compactness of national cultures.
◆ 8.4. Looking for Cause-and-Effect Relationships
A cause-and-effect relationship can be established beyond any doubt only after a series of experiments. However, scholars cannot experiment with societies; only political leaders can attempt to do that, and the results of their actions are often unintended, sometimes disastrous.
What researchers have at their disposal are various statistical tools that can dem-onstrate associations between variables but do not prove cause-and-effect relation-ships. As Leung and van de Vijver (2008) put it, these associations may amount to “no more than fitting a hypothesized set of relationships to a correlational data set” (p. 147). For instance, cross-cultural differences in intrasocietal violence, and especially in murder rates, have tradition-ally been attributed to national differences in socioeconomic inequality. This sug-gests that socioeconomic inequality breeds intrasocietal violence. Yet Minkov (2011) refers to studies that claimed the oppo-site direction of causality: from violence to accumulation of wealth and hence to socioeconomic inequality.

172 ◆ Studying Culture
Despite the wealth of techniques pro-posed by statisticians that may help to get from correlation to causation, none of them is seen as fully reliable in anthro-pology (Chrisomalis, 2006) or any other social science, especially in the absence of historical data. Even when longitudi-nal data are available, it may be hard to identify causal relationships because some phenomena may coevolve.
Further, theoretical assumptions can determine whether a potential cause is viewed as such or not. 60 Consequently, when cause-and-effect relationships are discussed in social science, including com-parative culturology, one’s conclusions should always be guarded. As we can rarely find the exact cause of a particular cultural difference, we can only attempt to provide an explanation through some model that can later be challenged.
8.4.1. THE CONSILIENCE APPROACH
Leung and van de Vijver (2008) pro-pose a framework called a “consilience approach” (p. 152) for inferring cause-and-effect relationships in cross-cultural research. It represents a checklist of impor-tant points to remember in a search for the causes of a particular cultural difference. Fulfillment of these requirements does not prove that a cause-and-effect relationship has been found. Yet, if these points are not heeded, any claim about the existence of such a relationship may not be convincing.
8.4.2. CONTEXTUAL CONSILIENCE
What Leung and van de Vijver (2008) mean by their recommendation for contex-tual consilience is that diverse evidence is needed from a wide range of cultural con-texts and groups. A comparison of a few societies is not enough for any general con-clusion about the effect of a particular inde-pendent variable on a dependent variable
because if that small sample were expanded the previously observed pattern is likely to disappear or change significantly.
However, we must remember that dif-ferent patterns may emerge across differ-ent samples of societies. Murdock (1940) insisted that a valid cross-cultural hypoth-esis should hold true in any area: “To a valid scientific principle, there are no exceptions; apparent exceptions are always due to the intrusion of another counter-vailing principle” (p. 370). Although this position may be philosophically satisfying, it is often hard to establish what a valid principle is precisely because different associations may be found across different samples and it is impossible to determine which of these is the default and which is an exception due to the intrusion of a countervailing principle. If a correlation and potential cause-and-effect relationship are found across rich countries but not across poor ones, which is the valid prin-ciple and which is the exception?
8.4.3. METHODOLOGICAL CONSILIENCE
Methodological consilience requires the use of diverse methods in the search for cause-and-effect relationships. Leung and van de Vijver (2008) explicitly mention experiments and longitudinal studies as recommendable methods. Although exper-iments with cultural change are impos-sible, one can observe how groups of people react to specific stimuli in a specific situation and attempt to draw conclusions about societies.
As for longitudinal analyses, they can at the very least confirm the cause-and-effect relationship impressions that are obtained from analyses that focus on a given point in time. For instance, if adolescent fertil-ity is highly correlated with murder rates (Minkov, 2011), and if this relationship withstands appropriate statistical controls (which would usually be selected on the basis of some theory), one might conclude

Data Analysis ◆ 173
that the high adolescent fertility in sub-Saharan Africa and northern Latin America is a determinant of the high murder rates in those parts of the world. This view could be strengthened by a finding that the fall in the rate of adolescent fertility across a particular sample of countries over a certain period is highly and positively cor-related with the fall in murder rates across the same countries and over the same period. 61 But even this longitudinal study would not provide the ultimate proof of a cause-and-effect relationship between the two variables. It would still be possible to surmise that there is a third variable—a known or unknown factor—that depressed adolescent fertility and murder rates at the same time.
8.4.4. PREDICTIVE CONSILIENCE
In Leung and van de Vijver’s (2008) view, this type of consilience involves the formulation of various predictions and their verification. In fact, this could be a variant of the methodological consil-ience discussed in the previous section. For example, if savings rates really boost economic growth in the developing world, this correlation should be observed not only across a number of countries but also within most of those countries. In other words, an increase of savings rates in a developing country over a certain period should be associated with an increase in economic growth in the same country dur-ing the same period.
8.4.5. EXCLUSIVE CONSILIENCE
According to Leung and van de Vijver (2008), it is essential that if we propose a determinant of a particular phenomenon there should be no alternative explanation for it—a situation that they call “exclu-sive consilience.” This is an interesting point that raises various tough questions. Perhaps the most difficult one is what to
do when two or more competing explana-tions seem to work equally well from a theoretical viewpoint and there is no con-vincing statistical proof that either of them is strongly preferable.
8.4.6. THE ISSUE OF TIME SEQUENCE
An interesting point was made by Smith (2004b). Despite the fact that variable var1 predicts variable var2 statistically and seems like a plausible determinant of it, one cannot claim that var1 causes var2 unless it can be shown that the phenomenon mea-sured by var1 predates the one measured by var2. Minkov (2011) provides exam-ples of incorrect conclusions by authors who have disregarded this principle. For instance, Bhattacharyya (2004) attempted to estimate the contribution of “rule of law” as an economic growth factor in a cross-national sample for the period from 1960 to 1996 (p. 588) but used a rule of law index for 2002! The author completely disregarded the possibility that the rule of law could be a consequence of economic growth, not its determinant.
8.4.7. LOOKING FOR NONCULTURAL VARIABLES THAT MAY BE DETERMINANTS OF CULTURE
If it can be shown that a particular cultural variable is associated with a phenomenon that is clearly not affected by culture, that phenomenon may be viewed as a plausible determinant of the cultural characteristic, especially if the cause-and-effect relation-ship could be explained in terms of a good theory. This approach is common in development economics where research-ers (for example, Rostow, 1990) attempt to identify exogenous variables, such as urbanization rates or fertility rates, and use them to explain endogenous economic variables, such as gross domestic product

174 ◆ Studying Culture
growth. The problem is that the seem-ingly exogenous variables may in fact be affected by the endogenous ones: The independent and dependent variable may change places in the model. High fertil-ity rates can be viewed as an impediment to fast economic growth, but economic growth boosts education, which, in turn, depresses fertility rates.
As far as culture is concerned, at least two good examples of exogenous variables come to mind: climate and historical prev-alence of communicable diseases. Van de Vliert (2009) is well known for his theory explaining cultural variables in terms of climatic factors. Although human activity seems to be affecting climate at present, it still has a negligible effect on geographic variation in climate. Thus, if an association is found between a measure of climate—such as mean annual temperature or harshness of summers or winters—and a cultural variable, one might surmise that climate has affected culture, not the other way around. Still, it is possible that the relationship between climate and culture is not direct but is moderated by other variables, such as type of economic activ-ity (Minkov, 2011).
Fincher, Thornhill, Murray, and Schaller (2008) and Murray and Schaller (2010) are some of the main proponents of the view that some cultural phenomena, including differences in individualism versus collectiv-ism, can be explained in terms of the histor-ical prevalence of communicable diseases within a particular society. Lafferty (2006) launched the hypothesis that national rates of infection with the Toxoplasma gondii parasite may explain national differences in neuroticism or Hofstede’s uncertainty avoidance. Barber (2008a) linked polygyny intensity to pathogen prevalence. Although all of these explanations of culture through noncultural determinants are debatable, what is probably uncontroversial is that, historically, the prevalence of many patho-gens preceded the emergence of a specific culture. Nevertheless, the direction of this relationship may be inversed by now as
national governments nearly all over the world attempt to eradicate communicable diseases.
8.4.8. MULTIPLE REGRESSION ANALYSIS
Multiple regression analysis (MRA) is not officially a statistical tool for the discov-ery of cause-and-effect relationships but it is often implicitly used for that pur-pose. 62 Although the results of MRA are normally presented in cautious language, where words like explains and predicts are preferred to determines and causes, those results are often viewed as implying cause-and-effect relationships. For that reason, a few notes on MRA might be useful.
MRA can be roughly summarized as identification of relevant and redundant associations for the purpose of retaining the former and discarding the latter. A fic-titious example from medicine can roughly illustrate this. Imagine a patient suffering from high blood pressure. Experiments have shown that 20 different substances can reduce blood pressure to some extent but none of them is sufficient to bring it to a normal level; the patient should take a combination of substances. But what is the best combination? By “best” we mean most efficient and effective: the lowest number of substances that produce the maximum desirable effect. If a combina-tion of two substances is sufficient, the remaining 18 are redundant and need not be taken. MRA can help solve some-what similar problems in social science. However, medicine can rely on experi-ments and confirm or reject the putative cause-and-effect relationships that have emerged in an MRA. Social science does not have that privilege. The MRA that it has at its disposal can only provide a hypothetical model that cannot normally be proven in practice.
Suppose that we are interested in find-ing out why the respondents of some nations report higher personal happiness

Data Analysis ◆ 175
than those of other nations. We have found that happier nations tend to be wealthier, score higher on some measures of personal freedom, value leisure (and probably have more leisurely activities), and have younger populations. But what if some of these potential explanations are redundant? What if we can show that a feeling of freedom is enough to explain a large percentage of the national variance in happiness whereas the other variables do not contribute anything over and above the effect of freedom? That is what MRA can be used for. It will attempt to iden-tify those few variables that are enough to explain as much of the variance in a variable of interest as it is statistically pos-sible to explain. The explanatory variables are called “significant predictors.” The remaining ones, identified as redundant, are called “excluded variables.”
MRA is an elegant tool for the con-struction of parsimonious models that can explain how a number of independent variables affect one dependent variable. Yet, it raises many issues—so many and so serious that analysts should always maintain a strong degree of skepticism concerning the results of any MRA that cannot be backed up by experimentation. Before providing an example of how MRA works in practice, some of those issues are explored in the next sections.
8.4.8.1. Divergent Results From Different Types of MRA
There are different types of MRA. First, there is a distinction between linear and nonlinear regression. Mathematical details are outside the scope of this book, but it is necessary to point out that it is not at all easy to estimate whether the relation-ships between the analyzed variables are linear or not. Most reported MRA models in social science are linear, but a closer inspection may show that the linearity assumption was unjustified. Naturally, lin-ear and nonlinear models do not produce exactly the same results.
Even when we feel confident of the linear nature of the relationships between our variables, we will have a choice of different methods for the treatment of the independent variables in MRA. The popular statistical program SPSS labels these “enter,” “stepwise,” “backward, “remove,” and “forward.” Sometimes there is no appreciable difference between the results that they yield, but in some cases it can be drastic. Various theoretical and mathematical considerations can be used to decide which method is preferable in a particular situation, but their merits can be difficult to compare in practice when cultural variables are involved. The examples in 8.4.8.5. illustrate this.
8.4.8.2. The Excluded Variables
The fact that a patient does not need to take a particular substance because other substances work better does not mean that this substance cannot cause an effect. Likewise, if a measure of perceived personal freedom is enough to explain national differences in happiness and all other variables must be excluded from the regression model, that does not mean we have proven that, say, age differences cannot produce any effect. The primary goal of an MRA model is parsimony and elegance, but that can lead to extremely misleading or even nonsensical results, as we will see in 8.4.8.5.
8.4.8.3. Issues Related to Samples
As in the case of other statistical tools, the sample of cases that a researcher ana-lyzes can affect the MRA results dramati-cally. Minkov (2009b) shows how listwise deletion 63 of some 10 countries from an ini-tial list of about 90 can radically change the results of an MRA model in which national happiness is the dependent variable and the two main predictors are a perception of personal freedom and leisure as a value. Which of these is a better predictor depends on the sample of countries. A sample of 90 countries may intuitively be viewed

176 ◆ Studying Culture
as a better sample than one consisting of 80 countries, but that is not necessarily so. Larger is not always better. If we have a balanced sample of 80 countries from all continents and we add another 10 from a single geographic and cultural region, the initial balance may be compromised. If our goal is to seek global representativeness, that will be a problem.
Therefore, the safest conclusion to draw from the results of an MRA is not “Variables var1 and var2 are the best pre-dictors (let alone determinants) of var3 in principle,” but “Variables var1 and var2 are the best predictors of var3 across this particular sample of cases and variables.” There are many countries that have never been studied in any cross-cultural projects and there is hardly any information about their cultures. We do not know how these countries would affect an MRA model if we could obtain data about them.
8.4.8.4. Issues Related to the Independent Variables
The results of MRA depend on the nature of the independent variables that one has entered into the regression model. If common sense is not enough, it is custom-ary to refer to some theory that justifies the selection of an independent variable. But a theoretical justification is not the same as objectivity. It might therefore be advisable to add a statistical criterion: The indepen-dent variables should be highly and sig-nificantly correlated with the dependent. 64 Even when that condition is satisfied, the introduction or deletion of a single indepen-dent variable can alter a regression model beyond recognition. 65 This means that an MRA model in social science may never be final: It provides a solution based on specific selections of independent variables and individuals, countries, or other units of analysis, but that solution may not be con-firmed across other selections. In a treatise on the subjectivity and relativity of econo-metric models, Leamer (1983) showed how different selections of independent variables
can lead to the conclusion that executions definitely deter murders, that the evidence is inconclusive, or that executions definitely encourage murder, “possibly by a brutal-izing effect on society” (p. 42).
Another issue related to the selection of independent variables is (multi)collinearity—a situation in which some of the indepen-dents are so highly correlated that it is hard or impossible to disentangle them and estimate how well each of them explains the dependent. 66
A situation in which it is hard to estimate the individual effect of each of several con-ceptually different independent variables may be frustrating. Suppose that we want to explain national differences in transpar-ency versus corruption as measured by the Transparency International associa-tion. Our best candidates for independent variables may be measures of national wealth and measures of individualism or universalism, because transparency is highly and positively correlated with both of them; vice versa, there is less corrup-tion in the rich, universalist/individualist nations. These statistical associations are strong and it is easy to attach a theory to them. But if we wish to determine whether national wealth explains corruption better than universalism/individualism, we may have a difficult situation because these two variables are strongly correlated (a problem noted by Schimmack, Oishi, & Diener, 2005). The MRA model results may not be a reliable indicator of the relative strengths of these two variables as potential determi-nants of national differences in transpar-ency versus corruption. Because national wealth is closely correlated with a wide spectrum of cultural variables, it has the potential to cause multicollinearity. As a result, the effect of that plausible determi-nant of many cultural phenomena is often hard to distill and gauge in a pure form.
Van de Vijver and Leung (2000) pro-pose a practical solution to this problem. When each of several correlated inde-pendent variables explains a dependent one equally well, and if a conceptual and

Data Analysis ◆ 177
statistical similarity can be shown among the independents, it could make sense to merge them into a single dimension. This is a good suggestion, but it remains to be seen how it will be accepted by the aca-demic community.
Even if the MRA model is not affected by multicollinearity problems, it may be challenged for conceptual reasons. Van de Vijver and Leung (1997a) consider a hypothetical case in which the dependent variable is reading achievement at school whereas the independent variables are number of hours spent reading and a motivational variable. If there is a positive relationship between reading achievement and number of hours of reading, and an absence of a relationship between moti-vational factors and reading achievement, the hypothesis that motivation explains achievement will be falsified. Indeed, this is what we would have to conclude if we adhered strictly to the statistical results. But how is it possible to spend many hours reading without any motivation? Every human activity can be conceptualized as a result of some need, and—from the viewpoint of needs theories—motivation is precisely a drive to satisfy needs.
8.4.8.5. An Example of an MRA
Let us attempt to find out if national economic growth can be explained in terms of cultural values and their interplay with initial national wealth. Since Weber (1930), many analysts have viewed culture as a determinant of economic growth, but no convincing empirical association was found until the work of Hofstede and Bond (1988), subsequently continued by Minkov (2011). As for the association between initial wealth and economic growth, it is common knowledge that it is easier for a national economy to grow fast from a low economic basis than from a high one.
We can once again use the values for children that we worked with in our MDS and FA (to review the values, see Exhibit 1 in the appendix at the end of the
book). We will attempt to find out if any of those values predict economic growth from 1998 to 2008, the period in which they were measured in most countries in our sample. We will use gross national income per person at purchasing power parity (GNI per person at PPP) in 1998 (World Bank, 2009) as a measure of ini-tial national economic wealth. To obtain a measure of national economic growth from 1998 to 2008, we can divide GNI per person at PPP in 2008 by GNI per per-son at PPP in 1998 (data from the World Bank, 2009). This indicator is provided in Exhibit 5 in the appendix. We have data for MRA models across 42 countries.
Now we have to decide which of the val-ues for children to enter in the MRA tool as independent variables. One solution is to enter them all together. Unfortunately, we would have a multicollinearity prob-lem if we did that. 67 Besides—as was already pointed out—it is impractical to enter independents that are not signifi-cantly correlated with the dependent.
It seems that our best strategy would be to try hard work, thrift, unselfishness, and tolerance, as well as GNI, as these five variables produce significant correlations with the dependent on their own. Which of these are significant predictors when their predictive powers are tested indi-vidually against the powers of the other independents? This question does not have an objective answer. It depends on what combinations of independents and what MRA method we use.
Let us start with the method that SPSS calls “enter.” This method uses the prin-ciple of the partial correlation between the dependent and a given independent, with all other independents as simultaneous controls. If we enter n independent vari-ables in the model, a partial correlation will be calculated between each of them and the dependent while the remaining n – 1 independents are held constant simul-taneously in each test: Their joint effect on the dependent and the independent under investigation will be statistically removed.

178 ◆ Studying Culture
At the end, the enter method will rule that the significant predictors of the depen-dent are those independents that produced significant partial correlations with the dependent while all other dependents were held constant at the same time. 68
The problem with this method is that a single independent may now be a signifi-cant predictor of the dependent, now an insignificant one, depending on what we control for. For instance, if we control only for hard work, GNI will yield a partial cor-relation with the dependent of –.29, with p = .076. Because the p value indicates statistical insignificance, we must conclude that GNI has no effect on the dependent over and above the effect of hard work (which yields a significant partial cor-relation with the dependent when GNI is controlled for). If we control for hard work and unselfishness at the same time, how-ever, GNI will yield a partial correlation with the dependent of –.33, significant at .039, which is conventionally acceptable. Now GNI is a significant predictor. Add tolerance as a third control to the previous two, and once again the partial correlation between GNI and the dependent slips into insignificance: r = –.29, p = .069.
The use of multiple controls at the same time as in the enter method has the poten-tial to create all sorts of statistical artifacts. By juggling a large number of variables, selected for theoretical reasons, it is pos-sible to fabricate almost any imaginable result. One can defend the enter method by referring to an analogous situation in chemistry: By changing the composition of a chemical cocktail, substance X may be neutralized in a particular combination with other substances but become active when mixed with a different selection—adding or removing substances may now activate X, now block its effect. In the absence of experimentation in social science, however, it may be hard to under-stand why various combinations of inde-pendents unleash or cancel the effect of another given independent. We may need an endless number of theories—one for
each combination. Ultimately, the whole MRA exercise can degenerate into statisti-cal prestidigitation.
An alternative to the enter method is the stepwise method. It tends to yield much more consistent results. In our case, it does not matter how we combine the five independents; as long as we have hard work in the model, it will be pronounced the sole significant predictor of economic growth. The logic of the stepwise method in this case is that if controlling for hard work reduces the association between GNI and the dependent to insignificance, there is no need to test this association again using various combinations of multiple controls. The same applies to all other independents.
The stepwise method obviously aims for consistency and parsimony as opposed to the enter method, which does not empha-size these concerns so strongly. 69 This may be viewed as an attractive feature of the stepwise method that makes it preferable. But consider this. When we entered all five independents at the same time, the enter method produced a model with an R Square value 70 of .560, adjusted to .498. This means that the five independents jointly explain 56% of the variance in the dependent, although this estimate may have to be reduced to 49.8% to account for potential errors. The stepwise method produced an R Square of .421, adjusted to .406; it explains as much as the hard work variable explains on its own. By ruling that only hard work is a significant predictor of the dependent, the stepwise method fails to account for the statistically obvious fact that the other independents also explain something over and above the variance explained single-handedly by hard work. In fact, the stepwise method spirits away at least 10% of explained variance by fail-ing to acknowledge it. The enter method acknowledges the whole variance that the five independents explain jointly but fails to discern their predictive powers unequiv-ocally. Like the stepwise method, it will rule that only hard work is a significant

Data Analysis ◆ 179
predictor and that the other independents also explain something but their predic-tive powers are impossible to disentangle. With other variables, it is even possible that the enter method will yield a high R Square but will fail to identify a single significant predictor. This situation can occur even when none of the independents produces a VIF (variance inflation factor) value exceeding 3.00 (note that VIF values between 1.00 and 3.00 are frequent in MRA models with societal indicators). Finally, it is quite possible that the enter and stepwise methods will yield entirely different significant predictors.
These issues do not stem from the relatively low number of countries that we worked with. We can replace the depen-dent with Lynn and Vanhanen’s (2002) average national IQs (Table 6.5, pp. 73–80) and attempt to explain national intelligence (or another measure of educa-tional achievement that is strongly corre-lated with it 71 ) in terms of values measured
in 1994-2004 and national wealth. In that case, we will be able to build MRA mod-els across 71 countries. Depending on which values for children we enter in the model as independents, GNI may or may not emerge as a significant predictor.
As a potential solution in the case of the predictors of economic growth, let us adopt the approach that we mentioned in 8.4.8.4. Instead of choosing from the 10 values for children as independents, let us use our two unrotated factors for which we provided indices in 8.2.8.5.1., subse-quently named autonomy versus conform-ism and egoism versus altruism in 8.2.9. When we enter them together with GNI, we obtain the following MRA model with the enter method:
R Square .528 Adjusted R Square .491 Standard error of the estimate .295 F change 14.194 Significance F change .000
Independent Variable
Standard Error
Standardized Beta t p
Partial Correlation VIF
GNI .000 –.541 –2.75 .009 –.41 3.104
Factor 1 (autonomy versus conformism)
.001 .167 .89 .377 .14 2.793
Factor 2 (egoism versus altruism)
.001 .443 3.50 .001 .49 1.288
And this is the stepwise model: R Square .518 Adjusted R Square .494 Standard error of the estimate .294 F change 11.688 Significance F change .001
Significant predictors and R Square change: Factor 2 (egoism versus altruism): .374 GNI: .144
Excluded: Factor 1 (autonomy versus conformism)
The results of the two models are nearly identical. Across our 42 countries, economic growth per person is predicted primarily by factor 2 (egoism versus altruism): It accounts for about 37% of the national variance in speed of economic growth per person. Initial national wealth explains another 14%; we do not have a contradiction with the eco-nomic theory postulating that initial wealth matters. The only cause for slight concern might be the VIF value for GNI. Although many analysts are happy with even higher VIF values, collinearity may be an issue here as GNI is strongly correlated with factor 1

180 ◆ Studying Culture
(autonomy versus conformism); decoupling these two variables by means of mathemati-cal tools is not a fully reliable approach. Nevertheless, our results allow a broad general conclusion despite any potential controversies about details: Both cultural values and initial national wealth are factors in national economic development.
What have we learned from these exer-cises? Several points need to be remem-bered.
1. The key to a convincing MRA model in cross-cultural analysis is not in the selection of one right method—enter, stepwise, or other—but in the selection and preparation of the independent vari-ables for the model.
2. As the number of variables in an MRA model increases, so does the likeli-hood that the results of the enter method will be inconsistent if different combinations of independent variables are tested. When that method is used, another factor that can wreak havoc with an MRA model and cause erratic results as independent variables are taken in and out of the model is the presence of intercorrelated independents.
3. To avoid the problems described in the previous point, the number of inde-pendents should be as low as possible and they should be as weakly correlated with each other as possible. Ideally, we want only two or three independents that corre-late at .00. While this criterion may sound unrealistic, it may be possible at the very least to reduce the number of intercorre-lated variables by merging them into a few dimensions. Merging variables into dimen-sions before an MRA requires additional work as well as knowledge of the state-of-the-art of hologeistic culturology in order to produce interpretable dimensions. But MRA is not for beginners in the field. Those who cannot produce meaningful dimensions out of the values for children in the World Values Survey, or any other good data set, should not attempt to use
those values, or any other variables, to explain any cross-cultural differences by means of MRA.
4. A convincing MRA analysis is one in which the enter and stepwise methods yield identical results: the same significant predictors and very similar R Square val-ues. One cannot trust the multiple control (enter) method on its own, as it might be relatively easy to assemble a combination of control variables that will jointly reduce any significant zero-order correlation to insignificance. This would totally compro-mise the utility of MRA. One cannot trust the stepwise method on its own either, especially in a situation where it produces a much lower R Square than the enter method and thus fails to account for a large part of the explained variance in the dependent.
5. Even if the enter and stepwise methods yield consistent results, that means only that they have produced an acceptable solution for a specific configu-ration of independent variables and cases, not that they have revealed an absolute truth about what explains the dependent.
6. Even if the enter and stepwise methods yield consistent results, that does not mean they should be trusted entirely. We can have MRA models—both enter and stepwise—in which initial GNI is not a significant predictor of economic growth: It is all about cultural values. But what economist would agree with this? Also, it is easy to build MRA models in which national wealth per person is not a significant predictor of national dif-ferences in IQ or school achievement in mathematics or science (all of which are strongly correlated); only cultural values, such as religiousness and pride, provide an explanation. But who would accept these findings? How can one claim that the observed differences in educational achievement between the children in a Ghanaian village and those in a small

Data Analysis ◆ 181
Finnish town have nothing to do with the wealth differences between Ghana and Finland and would almost disappear without any investment in the quality of Ghanaian education if only the Ghanaian children did not have to listen to religious sermons and were less proud? 72
Evidently, as a matter of principle, the results of an MRA analysis may not mean anything unless they are supported by strong methodological and predictive con-silience (8.4.3. and 8.4.4.). For instance, to rule out the effect of wealth on edu-cational achievement it is not enough to build an MRA model in which that effect is insignificant. We would also have to provide examples from a num-ber of different countries showing that massive investment in their educational systems and subsequent strong improve-ment of the quality of educational facili-ties and teaching methods did not result in any significant improvement in edu-cational achievement as this process was not accompanied by a change in relevant national values.
We can conclude our discussion of data analysis with a final word of advice: Keep it as simple as possible. The more sophisticated the analytical tool for the treatment of a large and diverse collec-tion of data, the greater the likelihood of producing an artifact that can be used to tell the world an entertaining story; yet it will be easily challenged if other analytical tools, or other methods for the same tool, were chosen. By torturing the data with different torture devices, they will make a variety of confessions, even contradictory ones. This is how economics has earned itself a popular nickname: “the dismal sci-ence.” There is no need for culturology to be known in the same way.
■ Notes
1. Anthropologists have developed a “Stand ard Cross-Cultural Sample” (Murdock &
White, 1969) of 186 ethnic groups that suppos-edly represent the much greater total number of ethnic groups for which some ethnographic information is available. The main goal of this endeavor was to produce a sample of societies that apparently have not influenced each other—a potential solution to Galton’s problem described in 8.1.2. A sample that sup-posedly deals with Galton’s problem, however, is not necessarily a sample that adequately represents the cross-cultural variance across all the ethnic cultures from which it was drawn.
2. One potential solution to Galton’s problem was described in the previous note. Mace and Pagel (1994) criticized that approach. In their view, the most informative sources of information for testing cross-cultural hypothe-ses are groups of related cultures. But this boils down to replacing one problem with another. How do we form groups of related cultures? Are Bulgarian and Turkish cultures related? They are historically, as Bulgaria was part of the Ottoman Empire for nearly five centuries; this closeness has produced some commonali-ties, such as nearly identical cuisines and some-what similar musical tastes. But Inglehart and Welzel’s cultural maps of the world, available on the World Values Survey website, show an enormous cultural distance in values and beliefs between Bulgaria and Turkey.
There are also various statistical solutions to Galton’s problem (see, for instance, Dow et al., 1984), but their authors have never been even close to consensus.
3. Peterson and Smith (2008) indicate that some development scholars have argued that cultural values can be coerced through education systems and political processes; for example, the United States, Canada, and Australia show many liberal political values that were advocated in Britain during the colonial period (p. 39). But this does not prove coercion; there is no evidence that the colonists had strongly authoritarian values but their leaders altered them by force and made them liberal. Although Bulgaria spent nearly five centuries under Turkish rule and became inde-pendent only at the end of the 19th century, there is ethnographic evidence that even at that time it had a fairly secular-minded population

182 ◆ Studying Culture
(Minkov, 2011) that had not embraced the strong religiousness of Ottoman culture.
4. Some authors have even argued that modern statistical tools, such as multiple impu-tation by chained equations (MICE), produce more reliable results than listwise deletion of cases with missing data. For instance, Dow and Eff (2009) used MICE to challenge the research findings of Ember, Ember, and Low (2007), which were based on listwise deletion.
5. Todd (1983) provides an example of a cultural typology using family structure as the main indicator. Interesting typologies of cul-tural values are presented in Schwartz (1994), Schwartz and Bardi, (2001), Schwartz et al. (2001), and in other publications by Shalom Schwartz and his associates. Section 8.2.8.4.4. briefly explains how a typology of variables or societies can be drawn up using a variant of Schwartz’s method.
6. Researchers in the domain of culture have not always accepted this approach. In the late 1920s, cultural anthropologists were strongly averse to the idea of any regularity across human cultures, let alone the con-cept of dimensions of culture, and grand syntheses were avoided (Carneiro & Brown, 2007) despite the fact that they had been popular previously. By the 1950s, the situa-tion had changed again. Most important, the concept of cultural dimensions had emerged and was gaining some popularity. Parsons and Shils (1951/2001) postulated five pat-tern variables that should operate at both the individual and social levels, involving basic choices that humans are confronted with. Hall (1959) conceptualized the well-known cultural dimensions “high context” and “low context,” whereas Kluckhohn and Strodtbeck (1961) postulated the existence of several value dimensions that could be used to characterize human societies. Yet, the first large empirical study that described dimensions of culture and produced usable indices for societies (nations) was that by Hofstede (1980, 2001).
7. Tung and Verbeke (2010) note that a number of studies in international business have shown that the cultural distance between two countries is not necessarily symmetrical. This is only possible if what one measures from
A to B is not the same as what one measures from B to A. One example of this is so-called psychic distance—the subjectively perceived similarity between two nations that depends on who perceives whom. As Tung and Verbeke explain, the members of culture A may feel that culture B is similar to theirs and may adapt eas-ily in it, for instance, as expatriate managers, whereas the members of culture B may find A quite alien and have adaptation problems.
8. Note that this position does not involve affiliation with the interpretivist school. According to Boyacigiller et al. (2007), the interpretivist paradigm sees reality as socially constructed, and different sets of actors may define their reality differently. According to the same school of thought, reality cannot be fragmented into variables that are in cause-and-effect relationships. These positions are not helpful for the advancement of science.
First of all, in social science the reality is the respondents’ self-reports or observed behaviors, that is, their inner world expressed as specific answers to specific questions or as specific behaviors in specific circumstances. But a subjective element is activated as scholars start selecting items to analyze and combine them into various patterns. These are scientific products if they can be used to make valid predictions. But they are also art products because different subjective choices concerning the treatment of a single data set can lead to different models.
9. Cross-cultural anthropology has virtu-ally always used cultures as the unit of analysis (Chrisomalis, 2006), be it for the construction of dimensions or other purposes. Dimensions defined by variables that correlate at the soci-etal level, rather than the individual, were discussed in the middle of the 20th century by Cattell (1949) and Robinson (1950) and called “ecological.” 10. Thorndike (1939) discussed the eco-logical fallacy. Classic examples are found in the work of Robinson (1950), Meltzer (1963), and Schweder (1973), who demonstrated con-vincingly that variables do not necessarily correlate in the same way across individuals and across groups. More recently, this point was stressed by Hofstede (1980, 2001), Leung

Data Analysis ◆ 183
and Bond (1989), Smith (2004b), Peterson and Castro (2006), and others. Note that in this case, “ecological fallacy” does not refer to the assumption that “individual members of a group have the average characteristics of the population at large” (Berry, Guillen, & Zhou, 2010, p. 1462). Rather, it refers to the erro-neous assumption that relationships between variables at a particular level of analysis will be recovered at another level.
Na et al. (2010) discussed another type of ecological fallacy: the assumption that if two groups can be distinguished (have statistically significant different means) on some variables, these variables will be correlated at the indi-vidual level. This type of fallacy suggests a confusion of two unrelated concepts: group mean and correlation. If ascetic Protestants can be distinguished from other denominations in terms of thrift and hard work, these different group means on thrift and hard work do not imply that thrift and hard work are correlated at any level: not only across individuals, as Na et al. indicate, but also across denominations or any other groups. Comparisons of group means and correlations at any level of analysis are just two very different things that must not be confused. 11. A variant of the ecological fallacy can occur also when both levels of analyses involve groups, not individuals. According to Boyacigiller et al. (2007), the image of Japan as a paragon of management has been chal-lenged by an uninterrupted economic slump since 1991. “Management” in this case clearly refers to the microeconomic domain—the way organizations are run—whereas “economic slump” refers to the macroeconomic situation. What happens at these two levels need not be associated. One can imagine a country with a number of well-managed and highly perform-ing corporations that can serve as a paragon of management; yet that country is not achieving fast GDP growth because a very high percent-age of the population are unemployed, the government levies heavy taxes and squanders the money, and a variety of other reasons. A real example of the same issue is available from Svensson (2005): Although various stud-ies have suggested that corruption can have a
deleterious effect at the microeconomic level (it can be bad for some companies), no such macroeconomic effect can be proven (the argu-ment that corruption is bad for the growth of national wealth per person is flawed). 12. Fischer (2009) argued that it is intel-lectually unsatisfying to find non-isomorphism without investigating the causes of this situa-tion. Of course, scientific curiosity should have no limits, but tests of isomorphism and studies of the causes of non-isomorphism are not an absolutely essential part of culturology. 13. Naturally, one cannot take France’s individualism score, assign it to all French individuals in the available sample, and, on the basis of those identical scores, explain any dif-ferences across French individuals. Arguably, one can do something else. In a comparison of a French sample and a German sample, it is technically possible to assign France’s individualism score (71) to all research par-ticipants in the French sample and Germany’s individualism score (67) to all participants in the German sample. In effect, this would result in a categorical dichotomous variable, similar to “man” (coded, for instance, 1 for each man) versus “woman” (coded, for instance, 2 for each woman), to be used as a predictor in an ANOVA analysis. Mindful of the fact that the structure of Hofstede’s ecological indi-vidualism is not recoverable at the individual level, experienced researchers would avoid the mistake of interpreting these French and German individual scores as meaning that the French participants are more individual-ist than the German participants since “an individualist individual” makes no sense in terms of Hofstede’s construct. But it is pos-sible to construe the scores as meaning “com-ing from a more individualist nation” versus “coming from a less individualist nation.” If the ANOVA analysis demonstrates a signifi-cant difference between the French individuals (from a more individualist nation) and the German individuals (from a less individualist nation) on a given dependent variable of inter-est, the statistical operation may seem to make sense. Yet, this logic is weak.
First, speaking of individuals who come from a more individualist culture versus those

184 ◆ Studying Culture
who come from a less individualist one is not very helpful: What exactly does that tell us about these individuals? Creating a variable of this kind is like a return to the old days when “culture” was not unpackaged but used as a dichotomous categorical variable: “par-ticipant from culture 1” versus “participant from culture 2.” The exact meaning of being a participant from culture 1 or 2 was unknown. Similarly, we do not know what exactly it means for an individual to be from a more indi-vidualist culture or a more collectivist one. The combination of societal traits that has emerged in an analysis of societies cannot be assigned to the individuals in those societies.
Then, there is a purely statistical problem. If a particular study has found that France’s individualism score is 71 whereas Germany’s is 67, that does not mean that a replication of this study will confirm this difference between the two nations.
Being aware of the fact that national scores are probabilistic, the Project GLOBE research-ers provided not only country scores for their dimensions but also performed a procedure called “test banding”: “This procedure groups test scores into bands in which the scores within a particular band are considered as being not meaningfully different. The ratio-nale for such banding lies with the concept of measurement unreliability. Test banding was thus developed to identify a range of scores that cannot be distinguished from the top score in a band” (Hanges, Dickson, & Sipe, 2004, p. 220). GLOBE’s 61 country scores for their various dimensions were typically grouped into no more than three or four bands, suggesting that large groups of countries were statisti-cally indistinguishable on the GLOBE dimen-sions. Something similar is likely to happen if any national scores, including Hofstede’s, were banded. Therefore, it is not at all safe to assume that France and Germany really differ in terms of individualism versus collectivism. In the absence of bands for Hofstede’s dimen-sions, such an assumption can be made only for countries that are wide apart in the individual-ism ranking.
Even if we were sure that France’s higher score on the individualism dimension was not a
statistical artifact, the fact that a French sample has a significantly higher average score than a German sample on a given dependent variable does not mean that this difference is an outcome of ecological individualism versus collectivism. France and Germany have different scores on all of Hofstede’s dimensions of national cul-ture; therefore, the observed difference between the two samples is statistically associated with all of them. One would have to take a purely interpretivist approach to decide which dimen-sion of national culture explains the observed difference in the dependent variable.
In summary, attempts to use ecological dimensions in individual-level analyses are likely to be fraught with insurmountable prob-lems and should be avoided. 14. Similar controversial situations are well known in psychology. Kuppens et al. (2006) discuss two main proposals within the dimen-sional approach to the study of the structure of emotions. In one of them, the two main dimen-sions are positive affect and negative affect. However, another proposal merges these into a single dimension—pleasantness versus unpleas-antness—and adds another dimension: sleepi-ness versus arousal. 15. Schimmack et al. (2005) note that indi-vidualism and collectivism were traditionally seen as opposite ends of a single dimension, yet empirical studies across individuals have failed to find negative correlations between scales for these concepts, and one study has found that individualism and collectivism may also be independent at the national level. In another example, Kemmelmeier et al. (2003) point out that the available research evidence suggests that this is a single dimension at the ecological level but two dimensions—individualism and collectivism—at the individual level. Oyserman et al. (2002) also discuss the polarity of indi-vidualism versus collectivism and conclude that instead of speaking of a single bipolar dimen-sion “IND and COL are better understood as domain-specific, orthogonal constructs” (p. 9). 16. The number of dimensions that we obtain depends, among other things, on the number and type of items that we analyze. Suppose that we factor analyze a couple of items that seem to address issues related to

Data Analysis ◆ 185
individualism and collectivism. Using conven-tional criteria, we are likely to obtain a single factor. But if we add more items to the fac-tor matrix, we have an increasing probability that they will split into two factors even if we believe that, theoretically, they should define a single bipolar dimension. 17. A polythetic class is a group whose members cannot be identified on the basis of any single shared trait, carried by all of them, which is not carried by any members of any other classes (if such a categorically distinctive trait existed, those who possessed it would form a monothetic class). Rather, any given member of a polythetic class shares relatively many traits with many, although not all, mem-bers of the same class, while sharing relatively few traits with the members of all other classes. 18. Beginners in statistics are reminded of a simple way to conceptualize a correlation: It can be viewed as an indicator of the similarity between two sets of scores (two variables) for the same cases. For instance, if people who are faster swimmers are also faster runners, a swimming and running event with the same 100 competitors in each will produce similar scores (albeit on different scales because swimming is slower than running) and similar rankings. The correlation between the two sets of scores can be compared using two methods: Pearson’s or Spearman’s. The first will compare the times of the competitors, whereas the second will compare only their ranks. In social science, the two methods most often yield similar results, but exceptions are quite possible when some cases are strong outliers (have unusually high or low scores): The Spearman method will not take this into account.
A Spearman correlation of 1.00 means that the two rankings are identical, whereas –1.00 means that one is like the other one upside down: We have found that the fastest swim-mers are actually the slowest runners. A corre-lation of .00 means that the two rankings have nothing in common and one cannot predict how good people are in running by measur-ing how good they are in swimming, and vice versa. Likewise, a Pearson correlation of 1.00 means that the two sets of scores are identical (or could be made identical through some scale
transformation), whereas a correlation of .00 means that they have nothing in common and neither can be predicted from the other.
There are no absolute conventions for esti-mating how great the magnitude of a correla-tion should be for it to be considered high or strong. When countries are compared, correla-tions beyond ±.50, and especially beyond ±.60, can be considered high; those beyond ±.70, and especially above ±.80, can be called strong.
Apart from the magnitude of the corre-lation, it is also customary to consider its statistical significance. Conventionally, if a correlation is found not to be significant at a .05 or lower level, it is considered unreliable and likely due to chance through various mea-surement errors or biases. This book follows the established tradition of reporting statistical significance. But the merits of this practice, at least in culturology, are debatable.
Let us consider three definitions of “statistical significance.”
1. A popular textbook definition: An indi-cator of the likelihood that “we might be falsely concluding that there is a relationship [between two variables in a given sample] when there is not one in the population from which the sample was taken” (Bryman & Bell, 2007, p. 369).
2. A definition in the STATISTICA elec-tronic manual: “The statistical significance of a result is the probability that the observed relationship (e.g., between variables) or a dif-ference (e.g., between means) in a sample occurred by pure chance (‘luck of the draw’), and that in the population from which the sample was drawn, no such relationship or differences exist. Using less technical terms, we could say that the statistical significance of a result tells us something about the degree to which the result is ‘true’ (in the sense of being ‘representative of the population’)” (StatSoft, 1984–2004). Further in the same source, we are told that “statistical significance represents the probability that a similar outcome would be obtained if we tested the entire population.”
3. A definition in the manual in the Help section of SPSS 17: “The probability that a statistical result as extreme as the one observed would occur if the null hypothesis were true.”

186 ◆ Studying Culture
What do these definitions mean collectively and what is their practical utility?
First, the concept of statistical significance is associated with the concept of a null hypoth-esis: no relationship at all in an entire popula-tion or no difference at all between two entire populations. Such a hypothesis can sometimes be plausible with some categorical variables and small populations. Suppose we are study-ing an endangered species of mammals con-sisting of 100 specimens. In a sample of 20 specimens, we find that the female to male ratio is 11:9. But does this allow us to conclude that the females outnumber the males in the entire population? It is quite possible that our sample is unrepresentative and the actual ratio is exactly 50:50. A null hypothesis of this kind (no difference between the number of females and males in the entire population) is plausible.
But suppose that we are studying two human populations—for instance, nations A and B—consisting of 1,358,912 and 1,247,081 people, respectively. The variables we are interested in are scale variables (also known as “quantitative” or “continuous”): height and weight. Are height and weight correlated across the members of each of these populations? Also are the average height and weight of popula-tion A greater than those of B? We draw a random sample of 500 males and 500 females from A and the same numbers from B. Now, according to the manuals, we need to formulate the following null hypotheses:
1. Even if the correlations between weight and height across the people in our samples are different from .00, the true correlation between weight and height across all 1,358,912 people in population A and across all 1,247,081 people in B is actually .00, with an endless row of zeroes after the decimal point (according to StatSoft, 1984–2004, the null hypothesis when analyzing correlations between variables amounts to “assuming that in the population there was no relation between those variables whatsoever”).
2. Even if we find a difference between the average height (or weight) of the 1,000 indi-viduals from A and those from B, there is no difference between the means of the 1,358,912 people in A and the 1,247,081 people in B. The
average height of A and that of B are absolutely identical and, if measured with absolute preci-sion, it could be expressed as a row of abso-lutely identical digits, both before and after the decimal point, no matter how long that row is. The same goes for the difference in weight between A and B.
The scenarios that these two hypotheses describe are empirically impossible: They refer to miraculous coincidences that probably have no analogue in human experience. Null hypoth-eses assuming no relationship between two real and precisely measured scale variables describ-ing large human populations, and null hypothe-ses assuming no difference whatsoever between two large human populations on any precisely measured real scale variable, are illogical and their formulation does not make empirical sense. And, if the concept of a null hypothesis is part of the concept of statistical significance, the latter is seriously compromised.
When the units of analysis are nations, the available measures often have a low level of precision. Also, the number of nations in a sample is typically between 40 and 80. Even so, correlations of .00 (let alone .000 or a longer row of zeros) are virtually impossible between any two normal scale variables and across any normally used sample of nations. There is absolutely no reason to expect that the entire population of nations on the globe would be different in this respect and would yield a cor-relation of a perfect .00. In culturology and psychology, the null hypothesis is never true empirically under normal conditions.
It does make sense, however, to hypothesize that although we have found a correlation of, say, +.40 across our sample, if we could recal-culate this correlation across another sample it would not be as extreme as +.40: It could be, for instance, any number between .00 and +.40. But that would not be a null hypothesis.
Further, ecological analyses in culturology are most often performed across nations. As Section 8.1.1. explains, there is no reason to believe that one particular sample of nations (including a complete sample of all nations) reveals a “true” relationship between variables, or another type of pattern, that another sample conceals or distorts. There is no such thing as

Data Analysis ◆ 187
a truer or more reliable sample of nations in an absolute sense. Different samples of nations reveal different truths.
In summary, the practical utility of the con-cept of statistical significance, as defined in the existing popular manuals, is of dubious utility in culturology, if any at all. 19. Before the merger, the researcher must ensure that the items are scored on similar scales. In our case, they are all expressed as percentages but the items may have been quite diverse, such as gross national income in U.S. dollars and murder rates. In that case, the item scores must be transformed.
The most commonly used score trans-formation procedure is z-score standardiza-tion by variable (see note 16 to Chapter 7). Alternatively, one can transform the items in such a way that they are plotted on a scale from 0 to 100. This can be done using the following formula for each item:
(score – min) / (max – min) × 100
where “score” is each case’s raw (untrans-formed) score on the relevant item, “min” is the lowest score on that item that any case has produced, and “max” is the highest score on that item that any case has produced. SPSS, one of the most commonly used software packages for statistical analyses in social science and psychology, can perform this operation simul-taneously for all cases.
This transformation procedure might make sense even if the raw item scores are expressed as percentages of respondents and therefore seem to be on the same scale. The reason for that is that the range of those percentages may be 2 to 98 for one particular item versus 20 to 50 for another item. In that case, if we simply add up the two items, they will not have the same impact on the dimension index.
Once we have performed either of the two score transformations (other methods are also possible), the variables are ready to be merged by adding up and subtracting the transformed scores. In our case, the formula would be:
tolerance score + imagination score – hard work score
The two score transformation methods (z-scores by variable and 0–100 scale) pro-duce minimal differences in the positions of the cases: The two dimensions that emerge from them are likely to be correlated at .99. However, the rank positions of some cases may not be the same. 20. For an interpretation of the dimen-sion that we constructed here, we may adopt Inglehart and Baker’s (2000) theory that con-trasts survival values (such as hard work), typi-cal of the developing countries, and self-expres-sion values (such as tolerance for the expression of other people’s values, and imagination), typical of the rich countries. The country rank-ing on our dimension confirms this. The high-est scorers are the Scandinavian nations and the other rich countries, whereas the lowest-scoring countries are those of Eastern Europe and the Caucasus region. 21. Conventionally, the alpha’s value should exceed .70, although values as low as .60, and even lower, are sometimes accepted by psychologists who work at the individual level where correlations are typically weaker than at the ecological level. Note that before the calculation of a Cronbach’s alpha, all variables should be positively correlated. Those that yield negative correlations with the rest should be multiplied by –1. 22. As an example, we can use a study by McCrae et al. (2007) providing 30 facets of national character stereotypes collected in 49 nations. If only five of these facets were excluded (compliance, modesty, trust, order, and deliberation), the remaining 25 facets would yield an alpha of .60, which may seem on the acceptable side. However, those 25 fac-ets produce six factors with eigenvalues greater than 1.00 (see 8.2.8.5.), three of which on their own explain at least 10% of the total variance. 23. Borg and Groenen (2005) provide a good treatise on MDS for social scientists, psychologists, and others who are not experts in statistics. These authors note that some vari-ants of MDS are sometimes called “smallest space analysis,” although their main principle is the same. 24. In fact, if distances between cities are entered in an MDS matrix, MDS can produce

188 ◆ Studying Culture
a fairly realistic geographic map of those cities, although the positions of north and south or east and west may be reversed. 25. The reliability of the MDS solution is measured in terms of a “stress value” (provided with the MDS solution in SPSS) or various other tests, which usually amount to computing the sum of the squared deviations of the reproduced distances from the observed distances. In other words, the stress value is an estimate of how faithfully the MDS map repro-duces what was measured. Borg and Groenen (2005) adopted a criterion suggested to them by Guttman: A stress value of .15 may be acceptable when the number of scaled items n “clearly” exceeds the number of dimensions m in the MDS solution, adding that according to other authors, n/m > 4 is a desirable condition. If n/m > 10, higher stress may be acceptable (p. 47). As it is normal to have more cases than variables, the acceptable stress values for the MDS map of cases is higher than the acceptable stress value for the corresponding MDS map of variables, the number of dimensions being the same.
If the stress value of a two-dimensional MDS solution seems too high, the researcher has the option of increasing the number of dimensions. That is likely to reduce the stress value, often without dramatic changes in the structure of the first and second dimensions. However, the discussion in the previous para-graph suggests that an increase in the number of dimensions would result in a decrease of the acceptable stress value; therefore, selecting a right number of dimensions and deciding if the corresponding stress value is appropriate for it involves some subjectivity. 26. Imagine that we are interested in the distance between two objects in a two-dimen-sional space. Point A is exactly in the middle of the coordinate system: x = 0, y = 0. Point B is at x = 2, y = 2. What is the distance between A and B? The following three solutions are only some examples of the various principles that can be used in MDS or hierarchical clustering (discussed in 8.3.):
1. Euclidean distance. This is the length of the straight line between A and B. In our case, this length is equal to the hypotenuse of a right triangle whose legs are 2 units long. Thus,
the distance between A and B is √(2 2 + 2 2 ) = √8 = 2.82 units.
2. Squared Euclidian distance. As its name suggests, this is a Euclidean distance multiplied by itself. Thus, the distance between A and B is 8 units.
3. Block (or Manhattan) distance. This is, figuratively speaking, the distance that a pedes-trian would have to walk from A to B if they were situated in a city like New York: Walk 2 units to the end of the block, then turn at 90 degrees and walk another 2 units. Thus, the distance between A and B is 4 units.
SPSS also provides “Minkowski” and “cus-tomized” measures, whose default settings normally yield very similar results to those from the Euclidean method. Another avail-able measure in SPSS is called “Chebyshev.” Generally speaking, this measurement method is to be avoided in cross-cultural analysis as it often yields severely distorted high-stress solu-tions in comparison to the other methods. The Chebyshev solutions cannot be easily validated through comparisons with external data. 27. For this solution, Euclidian distances were used, with z-standardized scores by variable. 28. In fact, this is a more or less typical side effect of MDS visualizations after z-score standardization by variable but it is not guar-anteed, as MDS is not sensitive to correlations. Sometimes items that are shown close together can yield a lower positive correlation than items that are shown wider apart. 29. Schwartz (2011) proposes a differ-ent methodology for the interpretation of an MDS map of values: “We arbitrarily partition the continuum into broad value domains” (p. 308). These broad value domains may contain weakly correlated or uncorrelated vari-ables that do not pass a scale reliability test. Consequently, Schwartz’s method is appropri-ate for the identification of loosely defined typologies whose members may or may not define reliable dimensions of culture. 30. Exceptions to this rule are naturally possible. Minkov (2011) shows that on a dimension that reflects murder and HIV rates, Russia is closer to Ghana and Mexico than to Bulgaria and Romania. Yet, other countries in the European part of the former Soviet Union score like Russia on that dimension. After all,

Data Analysis ◆ 189
the dimension does produce a recognizable geographic and cultural pattern even if for some reason it separates Southeast Europe from the northeast parts of the continent. 31. There are no absolute criteria to deter-mine whether the coordinates of a particular variable suggest that it is closely associated with a particular dimension. The range of the coordinates of the variables depends on the number of dimensions in the solution. For instance, if the solution is two-dimensional, most measurement methods will produce coor-dinates for the variables on our first dimen-sion that fall approximately between +1.20 and –1.70; a solution in three dimensions will widen this range, possibly to +1.40 and –1.90. 32. To calculate country scores and a dimension index for our first MDS dimension, we can use the following formula:
Country scores = faith scores × –1.64 + obedience scores × –1.44
+ hard work scores × –1.43 + responsibility scores × 1.11 + imagination scores × 1.12 + independence scores × .91 + tolerance scores × .90 + perseverance scores × .86 + thrift scores × –.41
Once this formula is fed into the “trans-form” function of SPSS, the software will cal-culate and provide all dimension scores for all countries in the main file. 33. The two indices that the MDS solu-tion yielded were multiplied by –100 to align the indices with the mathematical signs of the coordinates of the variables. 34. The map in Graph 8.3 was created with the MDS tool in SPSS. For each of the nine variables, country scores were used that were plotted on a scale from 0 to 100 (see note 19) before entering them in the MDS matrix; then z-score standardization by case was applied. With the exception of the Chebyshev’s method, all measurement methods yielded a very similar circumplex. The block (Manhattan) method was chosen, as it yielded the most oval circumplex; this was considered convenient for didactic purposes. Two-, three- and four-dimensional solutions were tried, but
the structures and country rankings of the first two dimensions were very similar regardless of the total number of dimensions in the solution. A four-dimensional solution was adopted; it had a stress value of .08. (Note that accord-ing to Borg and Groenen, 2005, a lower stress value as a result of higher dimensionality does not imply better metric recovery. In our case, it did not matter much which solutions were adopted.) The scores for the first two dimen-sions in the four-dimensional solution were retained and used to create the MDS map. The third and fourth dimensions were discarded, as they were impossible to represent on a sheet of paper. The country coordinates for the first and second dimensions were multiplied by –100 to align the country positions with those of the variables that corresponded to the most salient values in their cultures. 35. As Japan is not represented on the trust item, its position on the MDS map was calculated through linear regression, using all remaining items as predictors. 36. The fact that SPSS does not provide a rotation option for MDS does not mean that an MDS solution cannot be rotated. For instance, given the initial coordinates of the variables on a two-dimensional MDS map and a selected rotation angle, it is possible to use simple trigo-nometry and calculate the new coordinates of the variables after the rotation. The same can be done for cases. The results of such freehand rotation would not necessarily be the same as those from a variance maximization rotation in factor analysis; there is a danger that the rotated dimension axes will run through a relatively empty space, far from any variables. However, whether the rotation is logical and useful or not will ultimately depend on what external variables the rotated dimensions predict. 37. Some statistical packages separate fac-tor analysis (FA) from the closely related principal components analysis (PCA). PCA is performed on the variables in the matrix as they are. FA is performed on the variance that the variables share; what is not shared is partialed out statistically. The results of the two methods are often very similar despite the theoretical and practical distinction between them, but they can be quite different, too. PCA can be considered a method that simply reduces

190 ◆ Studying Culture
a number of variables to a smaller number of dimensions. Since FA focuses only on what the variables have in common statistically, it can be viewed as a search for factors that cause (or at least account for) these communalities.
SPSS does not maintain a terminological distinction between FA and PCA. PCA is the default method in the “factor analysis” tool, followed by several methods based on the shared variance principle. In the analyses in this book, “factor analysis” always refers to PCA. 38. A factor loading is a Pearson correla-tion between a variable and a set of factor scores (a dimension index). A loading with a higher absolute value suggests a closer associa-tion between the variable and the factor. 39. A factor or dimension explains as much variance as possible when it is associated with as many variables in the data set as possible and these associations are as strong as possible. 40. The most commonly used indicator is called “eigenvalue” and is provided by default with the results of the FA. If a factor has an eigenvalue greater than 1.00, it is conven-tionally considered worth retaining. Factors with eigenvalues below 1.00 are normally dropped because they explain too little vari-ance. Another, somewhat similar, method is to look directly at the percentages of the total variance in all analyzed variables that are explained by each factor. If a factor explains more than 10% of total variance, it is conven-tionally considered worth retaining. These two criteria are associated. Usually a factor that has an eigenvalue of 1.00 or more also explains at least 10% of the total variance and vice versa, but exceptions to this rule are quite possible.
Both of these criteria are purely conven-tional. There is no natural reason for choosing thresholds such as 1.00 and 10 other than the fact that the human brain finds it easier to work with round numbers, preferably divisible by 10. It may also seem convenient to accept the common philosophy that a factor should explain at least as much variance as one vari-able in the data set, but it is also logical to set a higher threshold: A factor should explain at least as many as two variables because that is the minimum number of variables that one can reduce to a single dimension.
There is also another method, called a “scree test.” The number of factors worth retaining is estimated visually, based on the number and positions of elbows in a graph. Reliance on visual perceptions is of course notoriously unreliable.
In our case, we have two conventionally determined factors with eigenvalues exceeding 1.00: 3.67 and 2.13. Together, they explain 64.5% of the total variance, which is quite acceptable. 41. There is no strict convention concern-ing how high an item loading on a particular factor should be so that one can decide that the item is closely associated with that factor and defines what it is about. Many publications have adopted a ±.50 threshold, and we can accept this for didactic purposes. However, a loading of ±.50 means that the item and the factor share only 25% of variance; conse-quently, items with such weak loadings do not explain the factor well. It may be advisable to adopt a higher threshold, for instance, ±.60, which means just over one-third of shared variance, or even ±.70, which means almost one-half of shared variance. 42. There are various rotation principles, the most popular of which is called “varimax.” It produces strictly orthogonal (independent) factors, correlating at about .00. Other rota-tion principles, such as “direct oblimin” and “promax” can produce oblique (correlated) factors. Their correlations will depend on the magnitude of the “delta” value in oblimin and “kappa” value in promax; thus delta and kappa can be viewed as tools that determine the positions of, and hence the correlations between, the factors in the rotated space. For instance, if two factors are extracted , choosing a higher kappa value in promax will enhance the correlation between them. A higher kappa will also enhance the factor loadings.
Costello and Osborne (2005) believed that researchers should use the default delta and kappa in SPSS as the manipulation of their val-ues introduces unnecessary complexity. Further, they reported that their literature search did not reveal any explanation of when, why, or to what one should change the settings of the delta and kappa. In fact, changing the default settings

Data Analysis ◆ 191
of these tools does not render the solution more complex in any way. As for the second concern of the authors, they have probably searched in the wrong place; this is not a question for statisticians but for practitioners in the social sciences. The settings of the delta and kappa should be chosen in such a way that the results are easily interpretable and have convincing predictive properties. Thus, it is the practical utility of the solution that should determine the values of the delta or the kappa.
Note also that sometimes an orthogonal varimax rotation will be impossible, whereas some of the oblique rotations (but not neces-sarily all) may be possible. Further, an oblimin rotation will sometimes be feasible with some delta values but not with others. In those cases, if one wishes to rotate the solution, one will simply have to accept what is feasible, provided the outcome makes sense.
For our exercise, an oblimin rotation was chosen, with the SPSS default delta at zero. It produced practically orthogonal factors, cor-relating at –.15. Thus, the solution is nearly the same as if it were varimax rotated. However, the varimax-rotated, two-dimensional visu-alization (called “loading plot”) shifted the positions of North and South, making a com-parison with the visualization of the unrotated solution more difficult. 43. We can use the method described in 8.2.8.4.3.: All variables are multiplied by their relevant weights, which are the factor loadings in this case, and these products are added up. However, SPSS provides an easier solution: Factor scores are calculated upon request for each case and are entered in the file. Although the two methods will produce scores on different scales, the correlation between two versions of the same set of factor scores will be close to 1.00. 44. In our case, the oblimin-rotated factors correlate with the unrotated ones at .91** and .84**. The varimax-rotated pairs of factors correlate with the unrotated ones at +.86** and −86**. 45. According to Greek mythology, Procrustes was an evil personage who would mutilate people in such a way that they would fit exactly the length of a particular bed: He would either stretch their bodies or cut off their feet.
46. In the middle of the 20th century, Raymond Cattell analyzed a large database of variables across more than 40 countries (Cattell, 1949; Cattell, Breul, & Hartman, 1952; Cattell & Gorsuch, 1965). The vari-ables were extremely varied: demographic, geo-graphic, historical, legal, religious, medical, and more. Cattell even considered the number of Nobel Prizes each country had won. He obtained more than 12 dimensions, most of which are difficult to make sense of, except for a relationship with economic development. As a result, Cattell’s dimensions have been forgotten. 47. Leung and Bond suggested another term: “citizens’ scores,” referring to country scores based on scales derived from an individ-ual-level analysis (Leung, 2008, p. 73). 48. Example: A researcher is studying five countries—A, B, C, D, and E—with 100 respondents from each. The research reveals that life satisfaction (LS) and a feeling of per-sonal life control (PLC) are strongly correlated across the 100 respondents in country A. An individual in country A who is highly satisfied with life is also likely to perceive high PLC and vice versa. A correlation between LS and PLC of approximately the same magnitude is also found in countries B, C, D, and E. The conclusion is that LS and PLC form a single individual-level dimension—LSPLC—within all five countries. Provided LS and PLC have been plotted on the same scale, average scores for LSPLC can be calculated for each individual in each of the five countries, using this formula:
Individual LSPLC score = individual LS score + individual PLC score (Optionally,
this number can be divided by 2)
Once LSPLC scores are available for each individual in each country, average LSPLC scores for each country can be calculated. For country A, this would be the sum of the LSPLC scores of all respondents from that country, divided by their number. The same process will produce average country scores for LSPLC for countries B, C, D, and E.
Alternatively, items LS and PLC can be fac-tor analyzed separately within each country. The first FA will use the LS and PLC item

192 ◆ Studying Culture
scores of the respondents in country A. This will produce LSPLC factor scores for each individual in country A. Then, these individual factor scores can be used to calculate an aver-age LSPLC score for country A. The same procedure will be repeated for countries B, C, D, and E.
The two methods—simple addition of item scores or factor analytical scores—yield nearly the same results: They are normally very strongly correlated. 49. For this example, we can use the same scenario as in the previous note. A researcher discovers that LS and PLC correlate highly across the 500 respondents from countries A, B, C, D, and E (100 respondents from each country). LS and PLC can be collapsed into a single dimension, LSPLC, across the 500 individuals. LSPLC scores can be calculated for each of those individuals by adding up their scores on the two items (optionally, the sum can be divided by 2), or by calculating factor scores for each individual on the basis of the two items that produced a single factor across the 500 individuals. Then, an average LSPLC score is calculated for country A by separating the 100 respondents of that country from the five-country pool of 500, adding up their indi-vidual LSPLC scores, and dividing the sum by 100. The same process is repeated for countries B, C, D, and E. Then, the country scores on LSPLC are ready for comparison.
This process is not as time-consuming as it may seem because software packages like SPSS can break pan-cultural scores into country scores through a single operation for as many countries as needed, provided each individual respondent has been assigned a numerical country code. 50. Pan-cultural analysis was used by Bigoness and Blakely (1996), Green et al. (2005), Schmitt et al. (2007), and Welzel (2010), among others. 51. For studying individual-level variation in multicultural data sets, Leung and Bond (1989) advocate score standardization proce-dures that will produce an “uncontaminated picture of the relationship between the vari-ables at the individual level” (p. 145); that is, a culture-free picture. Analyses of this kind were
used in several large-scale projects (Alonso-Arbiol et al., 2011; Welzel, 2010, etc.). Section 7.2.4.4.10. explains why it is unacceptable to partial the effect of culture out of individual responses through statistical procedures or any other means for that matter. To reiterate, a cultural environment does not have the same effect on everybody who has grown up in it and one cannot calculate a single estimate of that effect that is valid in each individual case. Also an attempt to decouple individuals from their cultures amounts to statistically creating people who are not human.
If one wishes to study universal individual variation, another type of analysis may be more appropriate. Cross-cultural studies normally treat each society as if it consisted of the same number of people. They try to use equally balanced samples from each country—for instance, 100 Chinese, 100 Nigerians, and 100 Lithuanians—or weight the samples in such a way that they become approximately equal. There is an assumption here that this will result in a “universal” dimensional structure (Kuppens et al., 2006, p. 497). But the world’s countries do not have the same numbers of inhabitants. If we want to study mankind rep-resentatively, the ratio of Chinese to Nigerians to Lithuanians should be approximately 1,300 to 100 to 1. And of course, we would need about 1,200 Indians, 170 Brazilians, and so forth, to obtain a globally representative sam-ple of individuals. Naturally, the effect of their national or ethnic culture will be included in their individual scores; we cannot imagine nor-mal individuals who have felt no such effect. The utility of studying such a representative sample of humanity is an altogether different question, to be answered by researchers who are interested in individual variation. 52. Once again we can use the same sce-nario as in note 48. In this case, the first step in our study of countries A, B, C, D, and E would be to assign each country two scores: one for LS and one for PLC. There are two ways to do this. Psychologists would prefer to calculate country means: Add up the LS scores of each of the 100 respondents in country A and divide the sum by 100. The same would be done for PLC. Then the procedure would be repeated

Data Analysis ◆ 193
for countries B, C, D, and E. Alternatively, one can use a sociological approach: national percentages of people who have answered each of the items in a particular way (see 7.2.4.3.).
Once country scores have been obtained for LS and PLC for all five countries, the five LS and PLC scores can be correlated at the national level, thus treating each country as an individual, to ascertain if LS and PLC form a single dimension across the five countries. If they do, they can be merged into a single dimension by adding up a country’s LS score and its PLC score. Alternatively, one can factor analyze the five national LS and PLC scores and obtain factor scores for each country.
Of course, this simplified example is given for purely didactic purposes. In reality, it would not make any sense to construct dimen-sions of culture on the basis of data from only five countries. 53. Ronen and Shenkar (1985) provided a much-cited review of country-clustering stud-ies; yet this line of research has not gained momentum. The country clusters that were proposed in some subsequent influential pub-lications—Inglehart and Baker (2000) and Project GLOBE (House et al., 2004)—did not result from clustering techniques but were largely impressionistic. Nevertheless, Gupta, Hanges, and Dorfman (2002) showed that GLOBE’s a priori clusters could be replicated through discriminant analysis.
The impressionistic approach to the cluster-ing of cultures was considered normal by some cultural anthropologists of the past. For exam-ple, White (1959/2007) wrote, “Actually, of course, Seneca culture is but a distinguishable portion of Iroquoian culture, just as Iroquoian culture is a distinguishable portion of North American culture” (p. 17). White does not explain what clustering tool and variables pro-duced these findings. 54. Consider the following question: What is the distance between the capitals of the West European countries and the European coun-tries of the former Soviet bloc? If we choose the nearest neighbor method, that distance is equal to the distance between Vienna and Bratislava, the two nearest capitals of the two groups of countries. If we choose the farthest
neighbor method (called “furthest neighbor” in SPSS), that distance is equal to the distance between Reykjavik and Moscow, as they are farthest apart. If we choose the average link-age method, we have to calculate the average distance between all capitals in the two groups. 55. Imagine columns corresponding to coun-tries and rows corresponding to variables. If China’s column correlates with Korea’s column at .80, the two countries’ scores on the given variables are very similar and they are culturally close. Note that the magnitude of the correlation depends on the type of z-score standardization: by variable or by case. 56. The Inglehart-Welzel 2005–2008 cul-tural map of the world on the official World Values Survey website features an arbitrarily delineated “South Asia” cluster that includes Confucian-Buddhist Vietnam, Hindu-Muslim India, Orthodox Cyprus (!), Buddhist Thailand, Catholic Poland (!), and Muslim-Confucian Malaysia. It might just as well have included Ethiopia, Turkey, and Chile, as these countries are exactly on the cluster’s border. Although the map arbitrarily separates the Confucian countries from the Orthodox, Bulgaria is situ-ated between Taiwan and China and is about five times closer to each of them than to its neighbor Romania, also an Orthodox country. 57. A journal reviewer once objected to this logic, arguing that it has not been proven that the in-country regions in the World Values Survey have clearly delineated cultures. Although this is true, it is irrelevant to this type of analysis. Regardless of whether in-country regions have clearly delineated cultures or not, if they cluster together along national lines and do not intermix with regions from other nations, there is an objectively existing force that binds these national regions into a national cluster and keeps them apart from the other national clusters. If that force is not national culture, what else could it be? 58. In essence, this mirrors the difference between the concept of biological race as something that exists, regardless of how it is studied, versus the concept of biological race as a category to which people can be assigned if an appropriate combination of genetic markers is chosen (see Tang et al., 2005). The second

194 ◆ Studying Culture
concept is preferable because it can have practi-cal consequences: If a hair is found at a crime scene, can one select genetic markers to narrow down the circle of potential suspects by deter-mining the race of the hair owner? The answer to this question is positive. 59. The items are
10 values for children: items v12 through v21 (see Exhibit 1 in the appendix)
6 main personal values: items v4 through v9 (see Exhibit 3 in the appendix)
10 Schwartz values: items v80 through v89 (see Exhibit 4 in the appendix)
Data are available from the official World Values Survey files for 2005–2008, provided on the organization’s official website (www.world valuessurvey.com): file wvs2005a_v20090901_sppss and file wvs2005b_v20090901_spss. The scores in the HC analysis are average regional scores for each of the 64 regions produced by SPSS after aggregating the individual data to the regions where the interviews were con-ducted (item v257).
The clustering was based on Pearson cor-relation distances with z-standardized scores by variable, between-groups linkage. The stan-dardization is justified by the fact that the three groups of items were not originally measured on the same scale. 60. Peterson and Wood (2008) point out that personality traits are sometimes treated as verbal explanations of people’s behavior. Being descriptions of behavior, they are not causal explanations of the behavior (p. 30). If this theo-retical platform is accepted, it makes little sense to attribute behaviors to personality traits. 61. This is a variant of a technique for inferring causal relationships and ruling out spuriousness known as “cross-lagged correla-tion,” the simplest form of which is a compari-son of the relationships between two variables at two different time points (alternatively, one can compare the evolution of this relationship across a series of time points). This technique was criticized by some authors (Rogosa, 1980), defended by others (Locascio, 1982), and
viewed as viable under some conditions yet in need of further investigation (Clegg, Jackson, & Wall, 1977). The totality of the evidence suggests that cross-lagged correlation is an interesting, yet not infallible, method for the discovery of cause-and-effect relationships. 62. Another approach for similar purposes, known as “Guttman scaling,” has been used in anthropology. Starting from a set of cultural traits and a set of societies, it is possible to draw up what anthropologists call a “scalogram”: a society-trait matrix. The presence of one trait in the scalogram can be used to predict the presence of other traits (Chrisomalis, 2006). Scale analysis has also been advocated as an instrument for the study of cultural evolution (Carneiro, 1962; Peregrine, Ember, & Ember, 2004). 63. If a particular case (country or other unit of analysis) is not represented on a particu-lar variable, it will normally be excluded from all operations in MRA (or MDS, FA, and HCA for that matter) and the analysis will continue without it. This is called “listwise deletion.” Alternatively, one can choose “pairwise dele-tion”: A case is discarded only from those operations that involve a variable on which it is not represented. Pairwise deletion may seem an attractive option as it helps retain cases that would otherwise be dropped. Yet, it is rarely preferred to the listwise alternative because it allows operations across changing numbers of cases that may produce inconsistent and con-fusing results. 64. Cautious language—“might be advis-able”—is in order here because a counterargu-ment to this is that although an independent variable yields a low and insignificant zero-order correlation with a dependent variable, it may after all emerge as a significant predictor in an MRA model with other independent variables. Unfortunately, no definitive univer-sal solution can be found to this basic problem of MRA.
However, the reader is invited to consider the following argument. Although independents that yield insignificant zero-order correlations with the dependent may emerge as significant predictors of it when their predictive properties are tested together with those of other indepen-dents, one cannot enter all imaginable variables

Data Analysis ◆ 195
in an MRA model, regardless of their zero-order correlations with the dependent, simply because there is a conceivable statistical chance and a theoretical expectation that some of them may turn out to be significant predictors. 65. For example, Voracek (2004, 2006a, 2006b, 2009) argued that suicide rates are best predicted by aggregate group-level measures of general intelligence (IQs) and presented evidence that this is so both across in-county regions and across countries. Voracek (2009) claimed that this association had withstood all sorts of plausible controls, including measures of national subjective well-being, and presented a convincing MRA model in which average national IQs were the best predictors of sui-cide rates. Yet, Minkov (2010) showed that a World Values Survey measure of national religiousness rendered national IQs an insig-nificant predictor and an excluded variable. But this still does not mean that Minkov’s solution is the ultimate truth about the predic-tors of suicide rates. There are other known predictors that perform like national religious-ness, for example, a measure of the importance of parental pride in the World Values Survey (item v64 in the studies after 2004 and item D054 before 2004). It is hypothetically possible that still other predictors will be found that are currently unknown. 66. Multi(collinearity) is measured in terms of “tolerance” or in terms of a variance infla-tion factor (VIF), which are inversely related. There is no strict convention that one can use to determine if these indicators are acceptable or not: It is sometimes said that a VIF value over 5.00 should be viewed as problematic, but it is probably safer to be suspicious about VIF values that exceed 4.00 or even 3.00. However, apparent collinearity problems can sometimes occur even with VIF values below 3.00. According to the SPSS 17 manual in the Help section, VIF values exceeding 2.00 may be problematic, yet this restriction is too severe, as it would render most MRA analyses across nations impossible. 67. The VIF value for GNI would be 4.28. 68. MRA models are provided with a variety of estimates of the predictive powers of each inde-pendent and the reliability of those estimates.
The beta value is an estimate of how the independent variable seems to affect the dependent. Its unstandardized version reflects the absolute values of the measurement units, whereas the standardized beta is not sensitive to those values: If we multiply or divide an independent variable by any number, its stan-dardized beta will not change. When there is only one independent in the MRA model, the standardized beta is equal to the independent’s zero-order correlation with the dependent. When there are several independents, the stan-dardized beta of each independent is somewhat similar in magnitude to the independent’s partial correlation with the dependent after controlling for all other independent variables.
T is equal to the unstandardized beta divided by an estimate of its likely error (called “standard error”) and is therefore another esti-mate of the effect of the relevant independent variable on the dependent.
P is the statistical significance value. It is the same as the significance of the partial correla-tion between the relevant independent and the dependent while all remaining independents are held constant. P is conventionally the ulti-mate indicator on the basis of which a verdict will be pronounced on each independent vari-able. The other indicators are interesting, yet not crucial. Betas and partial correlations that exceed .300 and t values that exceed 2.000 can be considered convincing, yet there are no strict conventions about their acceptability levels. Note that in our example the obedience item has a higher beta than the GNI item, yet it has a lower t and a lower partial correlation . By convention, it is the statistical significance of the partial correlation between an independent variable and the dependent that determines whether the independent should be considered a predictor or an excluded variable. This means that, basically, MRA with the enter method boils down to calculating partial correlations and their significance (an operation that can also be performed with the simpler SPSS tool created specifically for that purpose), plus vari-ous tests of the reliability of the solution. 69. Our example is a conveniently simple illustration of the difference between two types of MRA. In reality, there are a number

196 ◆ Studying Culture
of different MRA approaches to the selection, combination, and testing of independent vari-ables, treated in books on statistics. Yet, none of them has proven definitively superior to the other approaches across all possible scenarios. 70. MRA models are provided with various indicators that serve as reliability estimates.
R is the correlation between the dependent and all independents as if they formed a single factor.
R Square is R multiplied by itself. This is an estimate of the variance in the dependent that is explained jointly by all independents.
The adjusted R Square is the initial R Square corrected for potential measurement errors. As we have an adjusted R Square of .597 in our case that means all the independents in our model jointly explain 59.7% of the variance in the dependent.
The standard error of the estimate is a self-explanatory statistic.
Mathematically, the F value is the mean square value of the regression divided by the mean residual square value. The interpretation of these concepts requires advanced knowl-edge of statistics. Fortunately, social scientists need not be troubled if they have no such knowledge; the F value is meaningless on its own. It depends, among other things, on the number of independent variables in the model and does not provide any indication about their predictive properties. A single significant predictor can produce a high F value; adding
an insignificant predictor can halve that value without changing appreciably any other statis-tics. What is conventionally important about the F value is its statistical significance.
Significance of F change is considered a crucial reliability indicator of the whole regres-sion model. The usual conventions apply: .05 is the highest acceptable level. If we have an F that is not significant, at or below that level, the whole regression model is conventionally viewed as unreliable as it may be due to chance. 71. Lynn and Vanhanen’s (2002) IQs con-sistently correlate with the TIMSS measures of national achievement in mathematics at about .95**. These two variables evidently measure the same phenomenon at the national level. 72. To cause even greater confusion, one can show that national annual cigarette con-sumption as provided by the World Health Organization’s The Tobacco Atlas (Mackay & Eriksen, 2002) is strongly and positively asso-ciated with national differences in educational achievement, and especially with IQ differences ( r = .73**, n = 130!). One can build an MRA model in which cigarette consumption is a sig-nificant predictor of national IQ, together with some cultural values, whereas GNI per person at PPP is not. One can object to the inclusion of cigarette consumption in the MRA model on theoretical grounds or because this defies common sense. The reader is referred back to Chapter 5, which discusses the pitfalls of abstract theory and common sense in science.

PART III
MAJOR CROSS-CULTURAL STUDIES


◆ 199
We have now entered into a fully pluralistic and democratic era of cross-cultural social science, where publishing country- or society-level scores so that they can be used in subsequent cross-cul-tural studies by future researchers is both norma-tive and popular.
—Paez et al. (2008, p. 453)
The third part of this book discusses major studies of cross-cultural variation across modern nations or ethnic groups reporting national
indices that can be viewed as measures of dimensions of national or ethnic culture. The definition of a study as “major” is based on two main criteria. First, it should involve at least 20 countries from differ-ent continents. One exception to the rule was made for Merritt’s (2000) attempted replication of Hofstede’s dimensions, which was included even though it is based on only 19 nations. The second criterion was academic reliability. The studies had to be peer reviewed and published in leading journals or in monographs by renowned international publishers.
Some other selection criteria were also used. The studies should report at least some comprehensible dimensions, grouping national cultures into meaningful geographic patterns and exhibiting convincing predic-tive properties. Some of the selected studies satisfy this criterion only partly, because not all of the dimensions they report have strong and
CULTURAL DIMENSIONS ACROSS MODERN NATIONS
9

200 ◆ Major Cross-Cultural Analysis
interesting correlates. Still, even if a study provides only one important and convincing dimension of national culture, it warrants a presentation in this part of the book.
Some presentations contain a section entitled “Additional Statistical Analysis,” report-ing findings that are not part of the original study. These were obtained in the course of the work on this book. The additional statistical analyses were deemed necessary as they shed more light on the nature of some of the reported dimensions of national culture.
The presentations of studies are of unequal length. The longest are those about my work. Geert Hofstede, who was originally expected to be a coauthor of this book but could not fully participate in this project due to his advanced age, also provided fairly detailed descriptions of his studies of national and organiza-tional culture. The length of a particular presentation does not reflect its impor-tance or scientific merit. It is simply easier to discuss one’s own work than that of others. Significant attention is also devoted to Project GLOBE—an immense cross-cultural study that has generated enormous controversies.
Although an effort was made to describe the studies as clearly as possible, this task could not always be accomplished successfully. Many of the studies presented in this part of the book do not explain their methodologies unambiguously; for instance, it is not always clear exactly how the dimension indices were calculated. Some of the authors were contacted for clarification, but it was not always possible to obtain one.
It is hoped that this collection of presentations and analyses of cross-cultural studies that have reported dimensions of national culture will prove useful to many. Among other things, it contains a database of national indices that researchers can use to explain cul-tural differences or validate their own dimensions, clustering solutions, regression models, or other findings.
To illustrate the difference between national and organizational culture, a study of the latter was also included (9.27.). Although this book is not about organizational culture, some readers may find this comparison useful.

◆ 201
◆ Introduction
Geert Hofstede 1 worked as a management trainer and person-nel researcher for IBM Europe from 1965 to 1971. At that time, employee opinion surveys had just been introduced at IBM Domestic (USA) and IBM United Kingdom, and psychologists on the staff of IBM World Trade (IBM’s non-U.S. operations) had proposed extending the surveys to other countries. 2 In Europe, they were a novelty and Hofstede had to sell the idea to the various coun-try general managers. His main
argument was that about 50% of IBM’s employees directly commu-nicated with customers and pros-pects, so their opinions about the company and their work strongly affected the company’s image and its success. The surveys produced an impressive international data-base. Hofstede and his colleagues trained personnel officers from the various countries to analyze the data and feed the results back to managers and employees.
Hofstede left IBM in 1971 on a two-year leave of absence as a visiting lecturer at IMEDE (now IMD) business school in Lausanne, Switzerland; all divisions of the
GEERT HOFSTEDE (1980, 2001): A STUDY OF VALUES, BELIEFS, AND NORMS ACROSS THE IBM CORPORATION
9.1
◆ Geert Hofstede

202 ◆ Major Cross-Cultural Studies
corporation in most countries had been sur-veyed by this time. His successors at IBM organized a second and even more complete round of surveys between 1971 and 1973. One of the reasons for Hofstede’s leave application was a desire to look deeper into the country differences in the IBM opinion survey database. It had become clear to him and some of his colleagues that, in particular, items asking about relationships with superiors, personal goals, and beliefs tended to produce stable and predictable differences in answer patterns across coun-tries and across occupations, pointing to differences in basic values.
In his courses at IMEDE, Hofstede administered a 17-item selection from the IBM questionnaire to 362 course participants, managers from 30 differ-ent countries and from a variety of pri-vate and public organizations unrelated to IBM. The major country differences found among IBM employees reproduced themselves significantly in the IMEDE par-ticipants’ sample. This supplied the first hard proof that certain differences among countries found inside IBM were not com-pany specific but stemmed from the shared socialization of persons having grown up in the same country, before they joined the corporation. At IMEDE, all respondents used an English version of the question-naire, whereas IBM used a large variety of language versions. The similarity between IBM and IMEDE data therefore also ruled out the hypothesis that country differences could be due to translation.
Convinced of the importance of these findings, Hofstede in 1973 did not return to his job at IBM but found a research position at the European Institute for Advanced Studies in Management (EIASM) in Brussels, Belgium, while simul-taneously teaching part-time at INSEAD business school in Fontainebleau, France. IBM allowed him to use the survey data-base for further analysis and sponsored EIASM for it. Between 1973 and 1979, Hofstede analyzed the database in a vari-ety of ways and related his findings to
existing literature from psychology, sociol-ogy, political science, and anthropology. The results were gradually published in 18 subsequent EIASM working papers and integrated into his 1980 book, Culture’s Consequences: International Differences in Work-Related Values (Hofstede, 1980). An almost entirely rewritten edition of this book with a new subtitle (Culture’s Consequences: Comparing Values, Behaviors, Institutions and Organizations Across Nations) appeared in 2001.
◆ Samples
Between 1967 and 1970, most employees of the IBM World Trade Corporation were surveyed, different divisions being covered in different years. The U.S. Domestic IBM corporation was not included in the sur-veys; it ran its own programs, but wherever comparable respondents had answered the same questions, U.S. data were included in the international comparison. Between 1971 and 1973, most divisions were sur-veyed a second time, and a number of countries not yet covered were added. The database (without the U.S. data) contained some 117,000 questionnaires, deriving from about 88,000 different respondents. They worked in 71 country subsidiaries and were classified into 38 occupations, from unskilled workers to research profes-sionals and managers of managers. The international comparison was based on a set of seven occupations that existed in all countries; initially it was limited to 40 countries for which at least four of these occupations were represented with a mini-mum of eight incumbents. In later publi-cations, using a slightly less conservative criterion, data from 10 more countries and three multi-country regions were added.
Numbers of questionnaires per country varied from over 11,000 in Germany to 56 in South Korea. Smaller samples were merged into regions (seven Arabic-speaking countries, four East African countries, and

Cultural Dimensions Across Modern Nations ◆ 203
three West African countries). Eight coun-tries with fewer than 26 respondents were not included in the analysis. Detailed infor-mation can be found in Hofstede (2001). The analysis was limited to local person-nel; expatriates (relatively scarce in IBM) were surveyed separately in a study focus-ing on their expatriate work situation.
◆ Hypothesized Dimensions
The four dimensions that Hofstede iden-tified in the IBM database emerged one by one from his data analysis over a period of several years. He held no previ-ous notions about what he would find beyond the fact that country differences on certain survey questions had shown striking regularities; the concept of dimen-sions itself only emerged gradually in his thinking. The choice and definition of the four dimensions followed from their validation by their nomological networks. After the dimensions had been defined, Hofstede discovered a 1954 article by the U.S. scholars Alex Inkeles and Daniel Levinson that predicted almost exactly the same four concepts as “standard analytical issues” in the study of “national charac-ter.” Inkeles and Levinson (1954/1969) based their ideas on a literature search of the then-available anthropological, socio-logical, and psychological sources; their article represented a post-hoc theoretical foundation for Hofstede’s model.
◆ Questionnaire Items 3
The survey questionnaires followed the state of the art of work and motiva-tion psychology at the time and used preliminary surveys in the United States and United Kingdom as models. In Europe, a team of internal and external psychologists coordinated by Hofstede conducted random-sample interviews with
employees from the main subsidiaries to identify issues prominent in the employees’ minds. Another source were managers in the international head offices who were asked about the differences in employee mind-sets they had noticed between the various country subsidiaries with which they dealt. The team’s general purpose was to obtain content validity for the questionnaires from the employees’ point of view. The questionnaires used precoded answer formats and were composed of a general part common to all respondents worldwide, specific sections related to the particular target group, and a page for written-in comments. The general part dealt with satisfaction, perceptions of the work situation, personal goals and beliefs, and standard demographic information. Personal goals represented “values as the desired” (what people claimed to want for themselves), while general beliefs rep-resented “values as the desirable” (what people included in their world view). Bilingual company personnel carefully translated questions from an English base version into local languages. Worldwide, a total of 20 language versions were used, not counting the various Arabic, Dutch, English, French, German, Portuguese, and Spanish versions tailored to local idiom.
ITEMS IN THE IBM QUESTIONNAIRE USED FOR COMPUTING THE POWER DISTANCE INDEX (PDI)
(PDI-a) How frequently, in your experi-ence, does the following problem occur: Employees being afraid to express dis-agreement with their managers?
1. Very frequently
2. Frequently
3. Sometimes
4. Seldom
5. Very seldom

204 ◆ Major Cross-Cultural Studies
(PDI-b and c) The descriptions below apply to four different types of man-agers. First, please read through these descriptions:
Manager 1. Usually makes his decisions promptly and communicates them to his subordinates clearly and firmly. Expects them to carry out the decisions loyally and without raising difficulties.
Manager 2. Usually makes his decisions promptly, but, before going ahead, tries to explain them fully to his subordinates. Gives them the reasons for the decisions and answers whatever questions they may have.
Manager 3. Usually consults with his subordinates before he reaches his deci-sions. Listens to their advice, considers it, and then announces his decision. He then expects all to work loyally to implement it whether or not it is in accordance with the advice they gave.
Manager 4. Usually calls a meeting of his subordinates when there is an impor-tant decision to be made. Puts the problem before the group and invites discussion. Accepts the majority viewpoint as the decision.
(PDI-c) Now for the above types of manager, please mark the one which you would prefer to work under.
1. Manager 1
2. Manager 2
3. Manager 3
4. Manager 4
(PDI-b) And, to which one of the above four types of managers would you say your own manager most closely corresponds?
1. Manager 1
2. Manager 2
3. Manager 3
4. Manager 4
5. He does not correspond closely to any of them.
ITEMS IN THE IBM QUESTIONNAIRE USED FOR COMPUTING THE UNCERTAINTY AVOIDANCE INDEX (UAI)
(UAI-a) Please indicate the extent to which you personally agree or disagree with the following statement: Company rules should not be broken—even when the employee thinks it is in the company’s best interests.
1. Strongly agree
2. Agree
3. Undecided
4. Disagree
5. Strongly disagree
(UAI-b) How long do you think you will continue working for this company?
1. Two years at the most
2. From two to five years
3. More than five years (but I probably will leave before I retire)
4. Until I retire
(UAI-c) How often do you feel nervous or tense at work?
1. I always feel this way
2. Usually
3. Sometimes
4. Seldom
5. I never feel this way
QUESTIONS ABOUT PERSONAL GOALS, USED FOR COMPUTING THE INDIVIDUALISM INDEX (IDV) AND THE MASCULINITY INDEX (MAS)
In this section, respondents were pre-sented with 14 work goals and asked to rate their importance on a five-point Likert scale:
1. Of utmost importance to me
2. Very important

Cultural Dimensions Across Modern Nations ◆ 205
3. Of moderate importance
4. Of little importance
5. Of very little or no importance
In completing the following section, try to think of those factors which would be important to you in an ideal job; disregard the extent to which they are contained in your present job (choose one answer for each line across).
How important is it to you to:
1. Have challenging work to do—work from which you can get a personal sense of accomplishment?
2. Live in an area desirable to you and your family?
3. Have an opportunity for high earnings?
4. Work with people who cooperate well with one another?
5. Have training opportunities (to improve your skills or to learn new skills)?
6. Have good fringe benefits?
7. Get the recognition you deserve when you do a good job?
8. Have good physical working condi-tions (good ventilation and lighting, adequate work space, etc.)?
9. Have considerable freedom to adopt your own approach to the job?
10. Have the security that you will be able to work for your company as long as you want to?
11. Have an opportunity for advance-ment to higher-level jobs?
12. Have a good working relationship with your manager?
13. Fully use your skills and abilities on the job?
14. Have a job which leaves you suf-ficient time for your personal or family life?
◆ Statistical Analysis
The crucial innovation in Hofstede’s analysis was the dimensions approach. Being trained as a psychologist, he initially sought statistical structure in the survey data at the level of individual respondents. It took him two years to recognize that what he needed was an ecological analy-sis, in which answers by individuals were aggregated to the level of their countries—focusing on societies rather than on indi-viduals, on national cultures rather than on personalities. This implied a switch to an anthropological frame of mind. The eco-logical dimensions approach became a new paradigm in the study of national cultures. 4
The ecological dimensions approach produces scores for each country on each dimension. This means a partial quanti-fication of national culture differences, which—when wisely applied—can guide and support qualitative analyses. It allows the construction of a nomological network for each dimension composed from its ecological correlations with other soft and hard measures and indices, clarifying the dimension’s meaning and importance and positioning it in relation to other dimen-sions. Hofstede’s (1980) ecological analy-sis of the IBM database produced four dimensions: power distance, uncertainty avoidance, individualism, and masculin-ity. In 1991, he added a fifth and in 2010, a sixth dimension, based on the Chinese Culture Connection (1987) and the work of Michael Minkov, described elsewhere in this book. The present discussion will be limited to the four IBM dimensions.
By the time Hofstede started working at EIASM (1973), IBM had completed its second international survey round, which permitted a stability test of country rank-ings on common survey questions between 1967–1969 and 1971–1973. The stable items were those dealing with personal goals and beliefs, and some perceptions of the work situation. The others were excluded from further analysis.

206 ◆ Major Cross-Cultural Studies
Below, the four dimensions of national culture that Hofstede extracted from the IBM database are described in the order in which they were identified in the data.
POWER DISTANCE
The distribution of power in society was a hot issue in the public mind in Western countries in the late 1960s: 1968 was the year of student revolts in France, Germany, the United States, and elsewhere. So it was not surprising that the IBM questionnaire contained many items related to aspects of power and authority. The term “power distance” was derived from the work of the Dutch scholar Mauk Mulder (1971). In Hofstede’s ecological analysis, the follow-ing three items formed a scale:
(a) Nonmanagerial employees’ percep-tion that employees were afraid to disagree with their managers
(b) In a choice between five styles of management, subordinates’ percep-tion that their boss tended to take decisions in an autocratic (1) or per-suasive/paternalistic (2) way
(c) In a choice between four styles of management, subordinates’ prefer-ence to work for a manager whose style is autocratic (1), persuasive/paternalistic (2), or democratic (4), but not consultative (3)
The descriptions of the styles of manage-ment were derived from Tannenbaum and Schmidt (1958). The actual computation of the country power distance index (PDI) used for questions (b) and (c) was based on percentages of respondents who had selected a particular option. In the case of (b), data from 1967–1969 and 1971–1973 were used. In the case of (c), the data were from 1967–1969 only, as the wording of the ques-tion was unfortunately changed in 1970. For question (a), only the answers from the nonmanagerial occupation categories were used, and mean scores on a five-point scale
(1 = very frequently, 5 = very seldom) were multiplied by 25 to make their range, and therefore their contribution to the index, roughly equal to the percentage range in the answers to questions (b) and (c). 5
Power distance is a classic example of the difference between ecological and individual analysis: Across individuals, the three questions were uncorrelated ( r = .05, .03, and –.07).
Hofstede defines power distance as fol-lows:
The extent to which the less powerful members of institutions and organiza-tions within a country expect and accept that power is distributed unequally.
The nomological network of the power distance index has been exten-sively described in Hofstede (2001); some recent additions can be found in Hofstede, Hofstede, and Minkov (2010). Some main facets of power distance are listed in Table 9.1. As the relationship is probabilistic, not every line applies equally strongly to every country.
UNCERTAINTY AVOIDANCE
One issue that had emerged regularly in employee interviews had been work stress, and a corresponding question in the sur-veys had shown strikingly regular country differences, but these were unrelated to power distance. A search of the ecological correlation matrix of all common survey items revealed two other questions signifi-cantly related to the stress question and to each other ( r = .59, .40, and .44 across 40 countries; r = .58, .46, and .44 across 50 countries and three regions). The three questions could be used to form a new index.
(a) Rule orientation: Agreement with the statement “Company rules should not be broken—even when the employee thinks it is in the com-pany’s best interest”

Cultural Dimensions Across Modern Nations ◆ 207
(b) Employment stability: Employees’ state-ment that they intended to continue with the company until retirement (4) or at least more than five years (3) rather than from two to five years (2) or for two years at the most (1)
(c) Stress, as expressed in the mean answer to the question “How often do you feel nervous or tense at work?”
The association of these three items seemed puzzling at first, but a study of the organization sociology and political science literature led to an explanation of all three as societal reactions to ambiguity. The term “uncertainty avoidance” was derived from the work of the U.S. organi-zation sociologists Richard M. Cyert and James G. March (1963). It measures a need for structure rather than ways of dealing with power; in fact, power distance and uncertainty avoidance together produce a meaningful 2 × 2 classification of prevalent ways of organizing across countries.
The actual computation of the uncer-tainty avoidance index (UAI) used per-centages for question (b) and mean scores on five-point scales for questions (a) and (c). These mean scores were multiplied by 30 for (a) and 40 for (c) to make their range, and therefore their contribution to UAI, roughly equal to the percentage range in the answers to question (b). 6
Like the three power distance questions, the three uncertainty avoidance ques-tions were uncorrelated across individuals ( r = .14, .00, and –.11).
Hofstede defines uncertainty avoidance as follows:
The extent to which the members of a culture feel threatened by ambiguous or unknown situations.
For the nomological network of the uncertainty avoidance index, see again Hofstede (2001) and Hofstede,
Table 9.1 Small Versus Large Power Distance
Small Power Distance Large Power Distance
Use of power should be legitimate and is subject to criteria of good and evil
Power is a basic fact of society ante-dating good or evil: its legitimacy is irrelevant
Parents treat children as equals Parents teach children obedience
Older people are neither respected nor feared
Older people are both respected and feared
Student-centered education Teacher-centered education
Hierarchy means inequality of roles, established for convenience
Hierarchy means existential inequality
Subordinates expect to be consulted Subordinates expect to be told what to do
Pluralist governments based on major-ity vote and changed peacefully
Autocratic governments based on co-optation and changed by revolution
Scandals end political careers Scandals are covered up
Income distribution in society rather even
Income distribution in society very uneven
Religions stressing equality of believers Religions with a hierarchy of priests

208 ◆ Major Cross-Cultural Studies
Hofstede, and Minkov (2010). Some main facets of uncertainty avoidance are listed in Table 9.2. As the relationship is probabilistic, not every line applies equally strongly to every country.
INDIVIDUALISM VERSUS COLLECTIVISM
The questionnaire contained a set of 14 questions about employees’ personal goals in their jobs; each goal was scored from 1 = of utmost importance to me to 5 = of very little or no importance. It was followed by a corresponding set of 14 questions about the respondents’ present satisfaction with these goals, from 1 = very satisfied to 5 = very dissatisfied. This latter set was not used in the analysis; answers depended on local situations and did not produce stable differences between countries and over time.
Scores on “importance” scales are subject to acquiescence response set (a tendency to score everything more or less important). For the analysis, absolute importance scores were irrelevant; the information was in the relative impor-tance of each goal versus the 13 others. Therefore, response set was eliminated for each one-country, one-occupation subset of the data, by means of stan-dardization across the 14 goals (z-score standardization by case; see 7.2.4.4.10.). In Hofstede’s books (1980, 2001), stan-dardized scores were given a mean of 500 and a standard deviation of 100, and signs were reversed, so that the most important goals (raw score 2 standard deviations below the mean) now ran around 700 and the least important goals below 300. The standardized scores for each country were arrived at by averaging across the seven occupational groups and across the two
Table 9.2 Weak Versus Strong Uncertainty Avoidance
Weak Uncertainty Avoidance Strong Uncertainty Avoidance
The uncertainty inherent in life is accepted and each day is taken as it comes
The uncertainty inherent in life is felt as a continuous threat that must be fought
Ease, lower stress, self-control, low anxiety Higher stress, emotionality, anxiety, neuroticism
Tolerance of deviant persons and ideas: what is different is curious
Intolerance of deviant persons and ideas: what is different is dangerous
Comfortable with ambiguity and chaos Need for clarity and structure
Teachers may say “I don’t know” Teachers supposed to have all the answers
Changing jobs no problem Staying in jobs even if disliked
Dislike of rules—written or unwritten Emotional need for rules—even if not obeyed
In politics, citizens feel competent when dealing with authorities
In politics, citizens feel incompetent when dealing with authorities
Outside observers perceive less corruption
Outside observers perceive more corruption
In religion, philosophy, and science: relativism and empiricism
In religion, philosophy, and science: belief in ultimate truths and grand theories

Cultural Dimensions Across Modern Nations ◆ 209
survey rounds (filling missing spaces by regression from filled spaces).
A factor analysis of the 14-goal, 40-country matrix produced two factors, together explaining 46% of the variance. The two factors were of virtually equal strength even before rotation. After vari-max rotation, the loadings were as follows:
Factor 1 (explaining 24% of variance)
personal time .86 freedom .49 challenge (2nd loading) .46
training −.82 physical conditions −.69 use of skills −.63 benefits −.40
Factor 2 (explaining 22% of variance) manager .69 cooperation .69 desirable living area .59 employment security .48
earnings −.70 recognition −.59 advancement −.56 challenge −.54
The first factor supplied the scores for a dimension labeled “individualism versus collectivism”; the second for a factor called “masculinity versus femininity.”
The three goals with positive load-ings on the individualism factor stress the respondent’s independence from the organization. Personal time (“have a job which leaves you sufficient time for your personal or family life”), freedom (“have considerable freedom to adopt your own approach to the job”), and challenge (“have challenging work to do—work from which you can get a personal sense of accomplishment”) reflect the individual’s personal involvement. The four goals with negative loadings rather stress what the organization provides to the individual: training (“have training opportunities—to improve your skills or learn new skills”),
physical conditions (“have good physical working conditions: good ventilation and lighting, adequate work space, etc.”), use of skills (“fully use your skills and abilities on the job”), and benefits (“have good fringe benefits”).
The factor analysis produced factor scores for each of the 40 countries. The contrast between goals stressing indepen-dence from the organization and goals reflecting dependence has been the argu-ment for using these country factor scores as the basis for a national individualism versus collectivism index (IDV). Factor scores varied from –1.54 for Venezuela to +1.64 for the United States. They were multiplied by 25 and a constant of 50 was added; thus, they were brought into a range between close to zero (collectivist) and close to 100 (individualist).
The terms “individualist” and “collec-tivist” were already in use in the literature, although the former was most frequently used for personalities and the latter for political systems. Hofstede defines the dimension as follows:
Individualism stands for a society in which the ties between individuals are loose: everyone is expected to look after himself or herself and his or her imme-diate family only. Its opposite, collec-tivism, stands for a society in which people from birth onwards are inte-grated into strong, cohesive in-groups, which throughout people’s lifetime con-tinue to protect them in exchange for unquestioning loyalty.
The different forms of society that go with more collectivistic and more individualistic self-concepts were rec-ognized early by sociologists, since the German Ferdinand Tönnies (1887/1963) introduced the distinction between Gemeinschaft and Gesellschaft (translated as “community” and “society”). Tönnies noted a transition in history from a pre-dominantly Gemeinschaft -like to a pre-dominantly Gesellschaft -like social order,
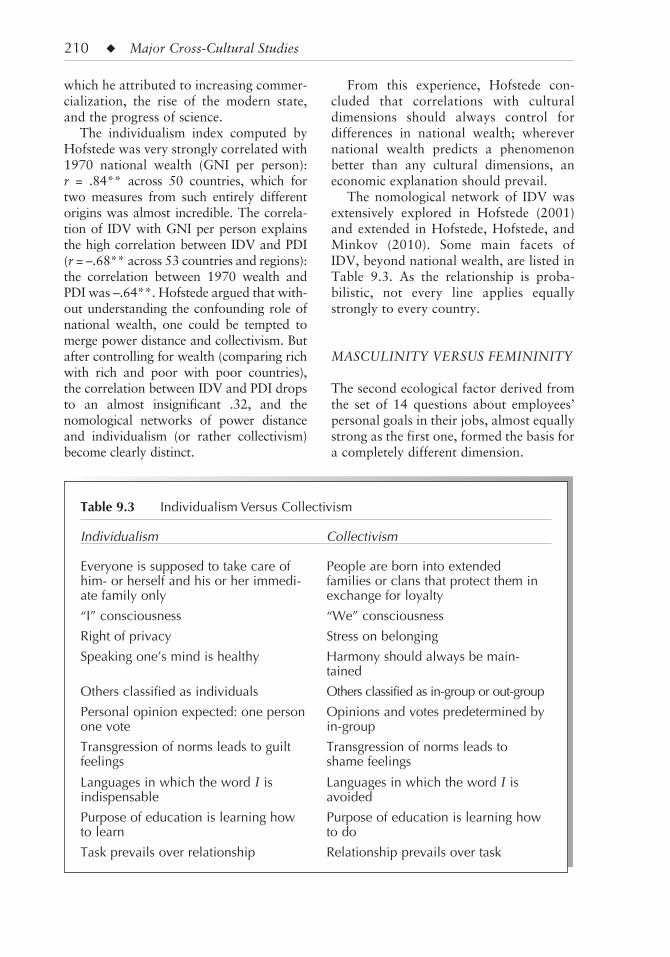
210 ◆ Major Cross-Cultural Studies
which he attributed to increasing commer-cialization, the rise of the modern state, and the progress of science.
The individualism index computed by Hofstede was very strongly correlated with 1970 national wealth (GNI per person): r = .84** across 50 countries, which for two measures from such entirely different origins was almost incredible. The correla-tion of IDV with GNI per person explains the high correlation between IDV and PDI ( r = –.68** across 53 countries and regions): the correlation between 1970 wealth and PDI was –.64**. Hofstede argued that with-out understanding the confounding role of national wealth, one could be tempted to merge power distance and collectivism. But after controlling for wealth (comparing rich with rich and poor with poor countries), the correlation between IDV and PDI drops to an almost insignificant .32, and the nomological networks of power distance and individualism (or rather collectivism) become clearly distinct.
From this experience, Hofstede con-cluded that correlations with cultural dimensions should always control for differences in national wealth; wherever national wealth predicts a phenomenon better than any cultural dimensions, an economic explanation should prevail.
The nomological network of IDV was extensively explored in Hofstede (2001) and extended in Hofstede, Hofstede, and Minkov (2010). Some main facets of IDV, beyond national wealth, are listed in Table 9.3. As the relationship is proba-bilistic, not every line applies equally strongly to every country.
MASCULINITY VERSUS FEMININITY
The second ecological factor derived from the set of 14 questions about employees’ personal goals in their jobs, almost equally strong as the first one, formed the basis for a completely different dimension.
Table 9.3 Individualism Versus Collectivism
Individualism Collectivism
Everyone is supposed to take care of him- or herself and his or her immedi-ate family only
People are born into extended families or clans that protect them in exchange for loyalty
“I” consciousness “We” consciousness
Right of privacy Stress on belonging
Speaking one’s mind is healthy Harmony should always be main-tained
Others classified as individuals Others classified as in-group or out-group
Personal opinion expected: one person one vote
Opinions and votes predetermined by in-group
Transgression of norms leads to guilt feelings
Transgression of norms leads to shame feelings
Languages in which the word I is indispensable
Languages in which the word I is avoided
Purpose of education is learning how to learn
Purpose of education is learning how to do
Task prevails over relationship Relationship prevails over task

Cultural Dimensions Across Modern Nations ◆ 211
The four goals with positive load-ings stress relationships and the qual-ity of life. The goals manager (“have a good relationship with your manager”) and cooperation (“work with people who cooperate well with one another”) directly address interpersonal relation-ships; desirable living area (“live in an area desirable to you and your family”) and employment security (“have the secu-rity that you will be able to work for your company as long as you want to”) express two important aspects of the quality of life. The four goals with negative load-ings rather stress the respondent’s ego: earnings (“have an opportunity for high earnings”), recognition (“get the recog-nition you deserve when you do a good job”), advancement (“have an oppor-tunity for advancement to higher-level jobs”), and challenge (“have challenging work to do—work from which you can get a personal sense of accomplishment”). The contrast between goals stressing rela-tionships and goals stressing ego had also been found in various studies in the literature comparing gender differences in work goals. In the IBM database, 9 of the 38 occupations were occupied by both women and men of equal status; across these nine, women had stressed the work goals cooperation and manager , men had put a significantly stronger emphasis on advancement and earnings . The factor analysis of country work goal scores had shown that these goals also represented the poles of a cross-national dimension. Hofstede called the new dimension “femi-ninity versus masculinity.” Country factor scores on the second work goals factor supplied a country masculinity versus femininity index (MAS). Among the 40 countries in the matrix, factor scores varied from –2.23 for Japan to +2.23 for Sweden; by multiplying them by 20 and deducting them from 50, they were brought into a range between close to zero (feminine) and close to 100 (masculine).
The terms “masculine” and “feminine” as social scientific concepts (as opposed to
the biological terms “male” and “female”) were obviously already in use, although almost exclusively at the individual per-sonality level. Hofstede defines the dimen-sion as follows:
Masculinity stands for a society in which emotional gender roles are clearly distinct: men are supposed to be assertive, tough, and focused on mate-rial success; women are supposed to be more modest, tender, and concerned with the quality of life. Its opposite, femininity, stands for a society in which emotional gender roles overlap: both men and women are supposed to be modest, tender, and concerned with the quality of life.
The labels “masculine” and “femi-nine” have sometimes been considered politically incorrect, but only in masculine cultures like the United States and the United Kingdom, not in feminine cultures like Sweden and the Netherlands. A number of validations have been col-lected in a reader Masculinity and Femininity: The Taboo Dimension of National Cultures (Hofstede, 1998b). Taboos are powerful expressions of cultural values.
For the nomological network of MAS see again Hofstede (2001) and Hofstede, Hofstede, and Minkov (2010). Some main facets of MAS are listed in Table 9.4. As the relationship is probabilistic, not every line applies equally strongly to every coun-try. Resulting from an orthogonal rota-tion with IDV, MAS scores are entirely independent from national wealth; the differences apply equally to wealthy and to poor countries.
COUNTRY SCORES ON THE FOUR INDICES
Below, the national indices for Hofstede’s four IBM dimensions are reproduced from Hofstede (2001).

212 ◆ Major Cross-Cultural Studies
Power distance (p. 87)
Malaysia 104Guatemala, Panama 95Philippines 94Mexico, Venezuela 81 Arab countries (Egypt, Iraq, Lebanon, Libya, Saudi Arabia, United Arab Emirates)
80
Ecuador, Indonesia 78 India, West Africa (Ghana, Nigeria, Sierra Leone)
77
Yugoslavia 76Singapore 74Brazil 69France, Hong Kong 68Colombia, El Salvador 66Belgium 65 East Africa (Ethiopia, Kenya, Tanzania, Zambia), Peru, Thailand
64
Chile, Portugal 63Uruguay 61Greece, South Korea 60Iran, Taiwan 58Spain 57Pakistan 55Japan 54Italy 50 Argentina, South Africa (White)
49
Jamaica 45United States 40Canada 39Netherlands 38Australia 36 Costa Rica, Germany, United Kingdom
35
Switzerland 34Finland, Norway, Sweden 31Ireland 28New Zealand 22
Table 9.4 Femininity Versus Masculinity
Femininity Masculinity
Minimum emotional and social role differentiation between the genders
Maximum emotional and social role differentiation between the genders
Men and women should be modest and caring
Men should be and women may be assertive and ambitious
Balance between family and work Work prevails over family
Sympathy for the weak Admiration for the strong
Both fathers and mothers deal with facts and feelings
Fathers deal with facts, mothers with feelings
Both boys and girls may cry but nei-ther should fight
Girls cry, boys do not; boys should fight back, girls should not fight
Mothers decide on number of children Fathers decide on family size
Many women in elected political positions
Few women in elected political positions
Religion focuses on fellow human beings
Religion focuses on God or gods
Matter-of-fact attitudes about sexuality; sex is a way of relating
Moralistic attitudes about sexuality; sex is a way of performing

Cultural Dimensions Across Modern Nations ◆ 213
Denmark 18Israel 13Austria 11
Uncertainty avoidance (p. 151)
Greece 112Portugal 104Guatemala 101Uruguay 100Belgium, El Salvador 94Japan 92Yugoslavia 88Peru 87 Argentina, Chile, Costa Rica, France, Panama, Spain
86
South Korea, Turkey 85Mexico 82Israel 81Colombia 80Brazil, Venezuela 76Italy 75Austria, Pakistan 70Taiwan 69 Arab countries (Egypt, Iraq, Lebanon, Libya, Saudi Arabia, United Arab Emirates)
68
Ecuador 67Germany 65Thailand 64Finland, Iran 59Switzerland 58 West Africa (Ghana, Nigeria, Sierra Leone)
54
Netherlands 53 East Africa (Ethiopia, Kenya, Tanzania, Zambia)
52
Australia 51Norway 50 South Africa (White), New Zealand
49
Canada, Indonesia 48United States 46Philippines 44India 40Malaysia 36Ireland, United Kingdom 35Hong Kong, Sweden 29Denmark 23
Jamaica 13Singapore 8
Individualism-Collectivism (p. 215)
United States 91Australia 90United Kingdom 89Canada, Netherlands 80New Zealand 79Italy 76Belgium 75Denmark 74France, Sweden 71Ireland 70Norway 69Switzerland 68Germany 67South Africa (White) 65Finland 63Austria 55Israel 54Spain 51India 48Argentina, Japan 46Iran 41Jamaica 39 Arab countries (Egypt, Iraq, Lebanon, Libya, Saudi Arabia, United Arab Emirates), Brazil
38
Turkey 37Uruguay 36Greece 35Philippines 32Mexico 30 East Africa (Ethiopia, Kenya, Tanzania, Zambia), Portugal, Yugoslavia
27
Malaysia 26Hong Kong 25Chile 23 Singapore, Thailand, West Africa (Ghana, Nigeria, Sierra Leone)
20
El Salvador 19South Korea 18Taiwan 17Peru 16Costa Rica 15Indonesia, Pakistan 14

214 ◆ Major Cross-Cultural Studies
Colombia 13Venezuela 12Panama 11Ecuador 8Guatemala 6
Masculinity-Femininity (p. 286)
Japan 95Austria 79Venezuela 73Italy, Switzerland 70Mexico 69Ireland, Jamaica 68Germany, United Kingdom 66Colombia, Philippines 64Ecuador, South Africa (White) 63United States 62Australia 61New Zealand 58Greece, Hong Kong 57Argentina, India 56Belgium 54 Arab countries (Egypt, Iraq, Lebanon, Libya, Saudi Arabia, United Arab Emirates)
53
Canada 52Malaysia, Pakistan 50Brazil 49Singapore 48Israel 47 Indonesia, West Africa (Ghana, Nigeria, Sierra Leone)
46
Taiwan, Turkey 45Panama 44France, Iran 43Peru, Spain 42 East Africa (Ethiopia, Kenya, Tanzania, Zambia)
41
El Salvador 40South Korea 39Uruguay 38Guatemala 37Thailand 34Portugal 31Chile 28Finland 26Costa Rica, Yugoslavia 21Denmark 16Netherlands 14Norway 8Sweden 5
◆ Contributions
Commenting on Hofstede’s lifelong contri-bution, Michael Bond, one of the world’s best-known researchers in cross-cultural psychology, indicated that his colleagues had long been “held in thrall” by Hofstede’s intellectual achievement (Bond, 2002, p. 73). International management professor Mark Peterson has made a similar assess-ment of the impact of Hofstede’s work: “Perhaps the first edition of Culture’s Consequences did not create the field of comparative cross-cultural studies but it certainly has shaped the field’s basic themes, structure and controversies for over 20 years” (Peterson, 2003, p. 128).
The Hofstede model arrived in 1980 at a time when cultural differences between societies had become increasingly rel-evant for economic as well as politi-cal reasons. Hofstede’s message, while scientifically derived, was understand-able to practitioners, especially after the appearance in 1991 of his student book, Cultures and Organizations: Software of the Mind. It inspired many readers, even to the extent—according to fan mail—of changing careers and saving marriages.
Hofstede’s books, including the 2002 trainer guide Exploring Culture: Exercises, Stories and Synthetic Cultures (primarily written by his eldest son and coauthor Gert Jan), have appeared so far in 23 lan-guages. In the Wall Street Journal of May 5, 2008, Hofstede was ranked among the Top 20 “most influential business think-ers.” The citation indexes of the World Wide Web between 1981 and January 15, 2011, listed 8,992 articles in peer-reviewed journals citing one or more of his publications—with 897 in 2010 alone. This made him the most-cited European social scientist of the time. Journals citing his work cover a wide variety of disci-plines and areas:
◆ Cross-cultural psychology
◆ Structure of language, cognition, intelligence

Cultural Dimensions Across Modern Nations ◆ 215
◆ International and diversity management
◆ International business, acquisitions, alliances
◆ International marketing, advertising, consumer behavior, packaging
◆ International politics and economics
◆ International legislation, procedural justice, imprisonment, insurance
◆ Architecture, urban/country planning, office design, industrial design
◆ Health, medicine, psychiatry, medica-tion, care
◆ Ethics, religion, spirituality, sexuality
◆ Food for Thought
1. Some common misunderstandings of Hofstede’s work are outlined below. They tend to be based on incomplete read-ing of Hofstede’s publications. The four most common errors are
(a) Confusion of levels of analysis: the assumption that the dimensions describe individuals from differ-ent countries while actually they describe national societies. This leads to unfounded accusations of stereotyping.
(b) The impression that Hofstede assumed IBM subsidiaries to be representative of their societies. He used them as matched samples from their societies (like others used, for example, students) and interpreted the differences between their values, to the extent they replicated themselves in other pop-ulations and could be validated against other measures, as evidence
of differences in shared mental programming among people hav-ing grown up in different national societies.
(c) The belief that Hofstede considered cultures as unchangeable. Of course cultures change, but certain dif-ferences between national cultures turn out to be amazingly stable over centuries. In this respect, the distinc-tion between values and practices is crucial; it will be explained in 9.27., which deals with Hofstede’s organizational cultures study. Most visible cultural changes in our soci-eties concern practices, not values; value changes tend to affect many countries at the same time, with dif-ferences between them remaining the same.
(d) Misunderstandings of specific dimen sions. They are most frequent for uncertainty avoidance and mas-culinity-femininity. For example, uncertainty avoidance is not risk avoidance but ambiguity avoid-ance; femininity is not feminism or “women’s lib”; if anything, it is men’s lib.
2. Over the years, a significant amount of criticism of Hofstede’s work has been published. Hofstede (2001) dealt with the main points, so only some of those after 2001 need to be noted here. They can be divided into those against the dimen-sions paradigm and those within the para-digm. For instance, McSweeney (2002) (with a reply by Hofstede, 2002), provided the fierce paradigm rejection predicted by Kuhn (1970), whereas the GLOBE study (House et al., 2004, with a reply by Hofstede, 2010) criticized Hofstede’s dimensions but built upon his paradigm.
A U.S. feminist critic tried to decon-struct Hofstede’s personal values (Ailon,
216 ◆ Major Cross-Cultural Studies
2008, with a reply by Hofstede, 2009). A book called Beyond Hofstede (Nakata, 2009) collects 12 very diverse articles on “culture frameworks” without a common message; most of its authors cite only Hofstede’s 1980 book and give little evi-dence of having read it. The dimensions paradigm tends to be ignored by many sociologists and most anthropologists (as argued by Baskerville, 2003, with a reply by Hofstede, 2003), as well as by compar-ative historians, who are ill prepared for the idea of quantifying aspects of culture.
■ Notes
1. Geert Hofstede (born in 1928) studied mechanical engineering at Delft University in his native Netherlands. After 10 years of prac-tice as a mechanical and industrial engineer, while employed as a textile plant manager, he started part-time doctoral study at Groningen University and graduated cum laude with a PhD in social psychology in 1967. His thesis, The Game of Budget Control, compared goal setting in five manufacturing plants in the Netherlands, based on 400 hours of inter-viewing plus hard plant-related data. One of the five was the Amsterdam typewriter fac-tory of International Business Machines, and Hofstede’s contact with IBM resulted in a job offer. He joined IBM in 1965. His IBM expe-rience enabled him to carry out the research project that he is known for.
2. Founded in the United States in 1911 by Thomas J. Watson, Sr., a practicing Quaker, IBM had developed the reputation of an ethical employer. Compared to other U.S. companies, IBM had been exceptional in its care for its employees, respect for its customers, and inte-gration in the local societies of the countries where it founded subsidiaries, often appointing local aristocrats as country general managers. Employee opinion surveys fit well into this tradition.
3. While Hofstede was still working on his 1980 book, others asked for his question-naire to use it on other populations. He there-fore included in the book an updated version called “Values Survey Module,” recommended for future cross-cultural studies. New versions of the VSM, adapted to new insights, were issued in 1982, 1994, and 2008. The VSM can only measure differences between scores on each dimension in matched samples from two or more countries; the meaningfulness of repli-cations increases with the number of countries. Hofstede, Hofstede, and Minkov (2010, p. 35) list six replication studies between 1990 and 2002 covering at least 14 countries.
4. A paradigm is “a model from which spring particular coherent traditions of scientific research” (Kuhn, 1970, p. 10). According to Kuhn, new paradigms initially meet fierce rejec-tion and later become new normal science. The ecological dimensions paradigm has become the normal approach for post-1980 study of national culture differences (e.g., GLOBE in House et al., 2004; Schwartz, 1994).
5. The actual formula used was PDI = 135 – 25 (mean score employees afraid) + (percentage perceiving manager 1 or 2) – (percentage prefer-ring manager 3). The constant 135 was added to bring the country index values into a range from about zero (small power distance) to 100 (large power distance). Theoretically, the index could range from 90 (no one afraid, no manager 1 + 2, everyone prefers 3) to +210 (everyone afraid, all managers 1 + 2, no one prefers 3).
6. The actual formula used was UAI = 300 – 30 (mean rule orientation score) – (percent-age intending to stay less than five years) – 40 (mean stress score). The constant 300 brought the country indexes into a range from close to zero (weak uncertainty avoidance) to around 100 (strong uncertainty avoidance). The theo-retical range of the index is from –150 (all think that rules can be broken, no one wants to stay, no one ever feels nervous) to +230 (nobody thinks that rules should be broken, everyone wants to stay more than five years, everyone always feels nervous).

◆ 217
◆ Introduction
Inspired by Geert Hofstede’s work, Canadian cross-cultural psycholo-gist Michael Bond—an internation-ally known figure—was interested in the issue of ethnocentricity in cross-cultural analysis. As Hofstede used a Western questionnaire, his dimensions of national culture may be culture bound (Chinese Culture Connection, 1987). Bond asked Chinese scholars to draw up a list of basic Chinese values that could be used to design a non-Western value survey to be admin-istered to samples from different nations. The results of that study were published under the collective name Chinese Culture Connection (1987), referring to all those who provided country samples.
◆ Samples
The respondents were university stu-dents from 23 countries: 50 males and 50 females from each country. To ensure comparability of results, only institutions with relatively high admission standards were selected in the developing nations. At the time of conception of the 1987 arti-cle, the data from Mainland China had not yet come in, so the article is based on 22 countries. Scores for China were added later.
◆ Hypothesized Dimensions
This was an empirical study. The authors did not expect to produce
CHINESE CULTURE CONNECTION (1987): A STUDY OF NATIONAL VALUES BASED ON A CHINESE QUESTIONNAIRE
9.2

218 ◆ Major Cross-Cultural Studies
particular dimensions of national culture, although they were apparently interested in finding out whether any of Hofstede’s dimensions would emerge in their study.
◆ Questionnaire Items
The designers of the survey had been asked to list values that are fundamental and basic to Chinese people. The origi-nal items were all formulated in Chinese and translated directly into the survey languages.
The final list included the following basic values that were supposedly essen-tial in Chinese culture (Chinese Culture Connection, 1987):
1. Filial piety (obedience to parents, respect for parents, honoring of ances-tors, financial support of parents)
2. Industry (working hard)
3. Tolerance of others
4. Harmony with others
5. Humbleness
6. Loyalty to superiors
7. Observation of rites and social rituals
8. Reciprocation of greetings, favors, and gifts
9. Kindness (forgiveness, compassion)
10. Knowledge (education)
11. Solidarity with others
12. Moderation, following the middle way
13. Self-cultivation
14. Ordering relationships by status and observing this order
15. Sense of righteousness
16. Benevolent authority
17. Noncompetitiveness
18. Personal steadiness and stability
19. Resistance to corruption
20. Patriotism
21. Sincerity
22. Keeping oneself disinterested and pure
23. Thrift
24. Persistence (perseverance)
25. Patience
26. Repayment of both the good or the evil that another person has caused you
27. A sense of cultural superiority
28. Adaptability
29. Prudence (carefulness)
30. Trustworthiness
31. Having a sense of shame
32. Courtesy
33. Contentedness with one’s position in life
34. Being conservative
35. Protecting your “face”
36. A close, intimate friend
37. Chastity in women
38. Having few desires
39. Respect for tradition
40. Wealth
(Chinese Culture Connection, 1987, Table 1, p. 147; used by permission)
The 40 values were presented with instructions for the respondents to indicate how important each of them was to them personally on a Likert scale from 9 (supreme importance) to 1 (no importance at all).
◆ Statistical Analysis
The obtained data were standardized separately in each participating country (and presumably by case) to eliminate response bias (see 7.2.4.4.10.). Mean standardized scores were calculated for

Cultural Dimensions Across Modern Nations ◆ 219
each country for each item and these were factor analyzed, using the principal axis method (an FA method that differs from PCA; see note 37 in Chapter 8). The solution was varimax rotated. A multidi-mensional scaling solution was compared to the results of the factor analysis and deemed sufficiently close to allay fears of flat-matrix problems in the factor analy-sis. The results from the two methods were similar and the factor structures were deemed acceptable. The four fac-tors, with the names that the Chinese Culture Connection gave them, and the factor loadings after varimax rotation, are presented below.
Factor 1 (integration)Tolerance of other[s] .86Harmony with others .86Noncompetitiveness .85A close, intimate friend .75Trustworthiness .69Contentedness .65Solidarity with others .61Being conservative .56
Filial piety –.74Chastity in women –.70Patriotism –.62
Factor 2 (Confucian work dynamism)Persistence (perseverance) .76Ordering relationships .64Thrift .63Having a sense of shame .61
Personal steadiness –.76Protecting your “face” –.72Respect for tradition –.62Reciprocation –.58
Factor 3 (human heartedness)Patience .88Courtesy .76Kindness .72
Patriotism –.62Sense of righteousness –.57
Factor 4 (moral discipline)Having few desires .67Moderation .65 Keeping oneself disinterested and pure
.56
Adaptability –.71Prudence –.58
The Chinese Culture Connection researchers interpreted the first factor, and more precisely the items with positive load-ings, as reflecting a “broadly integrative, socially stabilizing emphasis” (p. 150). They noted that filial piety and chastity in women, which indicate “a strong familial bonding,” had negative loadings.
The second factor was viewed as reflect-ing a Confucian work ethic at the positive pole versus values at the negative pole that represented “checks and distractions at the personal, interpersonal, and social levels” (p. 150).
The third factor was interpreted as gen-tleness and compassion versus a “harsher, legalistic approach” (p. 150).
The fourth factor was said to be about moral restraint versus adaptability and prudence, suggestive of a lack of self-control. The Chinese Culture Connection noted that moderation was seen as rep-resenting a “firm and disciplined stance, rather than the flexibility it can so easily be construed to endorse” (p. 151).
The country factor scores for the four dimensions are presented below. All scores were multiplied by 100.
Integration West Germany 134 Netherlands 106 Japan 81 New Zealand 78 Australia, England 75 Brazil 65 Canada, Sweden 60 United States 44 Philippines 42 Poland 39

220 ◆ Major Cross-Cultural Studies
South Korea 26 Singapore 21 Zimbabwe 13 Hong Kong 10 Thailand –2 Nigeria –13 Taiwan –19 Pakistan –65 India –72 Bangladesh –107
Confucian work dynamism Hong Kong 91 Taiwan 74 Japan 59 South Korea 49 Brazil 30 India 21 Thailand 11 Singapore –4 Netherlands –13 Bangladesh –20 Sweden –34 Poland –36 Australia, West Germany –38 New Zealand –39 United States –42 England, Zimbabwe –50 Canada –53 Philippines –61 Nigeria –67 Pakistan –100
Human heartedness Japan 142 Philippines 110 Canada 109 Hong Kong 108 England 101 United States 100 Zimbabwe 96 New Zealand 95 Australia 87 Singapore 80 Nigeria 79 Brazil 75 Taiwan 58 West Germany 50
Sweden, Thailand 49 Poland 48 South Korea 45 Bangladesh, Pakistan 39 India 27 Netherlands –109
Moral discipline Philippines 104 South Korea 68 Poland 54 Pakistan 33 Japan 14 West Germany 7 India –2 Taiwan –7 Thailand –8 Hong Kong –17 Nigeria –21 Singapore –32 Netherlands –34 Bangladesh –40 Australia –50 Brazil, Canada, England –66 New Zealand –67 United States –71 Zimbabwe –74 Sweden –77
The Chinese Culture Connection researchers compared their dimensions to Hofstede’s. They noted that Hofstede’s individualism and power distance as well as their integration and moral discipline were all statistically correlated and produced a strong single factor. Another reported cor-relation was between Hofstede’s masculin-ity and human heartedness ( r = .70**, n = 19). The Chinese Culture Connection researchers found this positive correlation surprising; perhaps a negative one would have been closer to common sense.
◆ Contributions
1. The Chinese Culture Connection project is crucially important despite the

Cultural Dimensions Across Modern Nations ◆ 221
fact that it has not generated as much general interest as it deserves. This is sur-prising, in view of the high correlations between Hofstede’s national indices and those of the Chinese Culture Connection. These show that similar dimensions can be extracted through questionnaires that come from very different cultural back-grounds: Western and Chinese. This means that etic tools for cross-cultural analysis can work well. Fears that when a questionnaire is developed in a particular cultural environment it will be so ethno-centric as to be useless are not necessarily justified, especially in the case of carefully designed projects.
2. The study contributed to our under-standing of the individualism-collectivism dimension as measured by Hofstede, con-trasting the cultures of rich and develop-ing countries. What Hofstede’s dimension reflects transpires mostly from its nomo-logical network, whereas integration has strong face validity and clearly shows that harmony, noncompetitiveness, and solidar-ity with others are Western values: individ-ualist, not collectivist. In collectivist societ-ies, these values are reserved for in-group relationships, whereas Western nations extend them to everybody. Schwartz (2007) presented further evidence, show-ing that Western samples are more likely to have universalist values in the sense of having a benevolent orientation toward everybody, not mostly toward in-groups.
3. The Chinese Culture Connection produced a dimension of culture associ-ated with subsequent economic growth. This property of Confucian work dyna-mism was subsequently discussed by Hofstede and Bond (1988) and Hofstede (1991, 2001). Rates of raw gross national product (GDP) per person growth can be calculated for 1970–2007, using GDP data from the UN Statistics Division (2009).
Confucian work dynamism is a good predictor of raw GDP per person growth for 1970–2007 ( r = .57**, n = 20, excluding
the countries with Marxist regimes). It also predicts GNI per person at PPP per person growth for 1998–2008 ( r = .60**, n = 21). 1
◆ Food for Thought
1. The four dimensions of the Chinese Culture Connection were obtained by means of factor analysis. As pointed out in 8.2.8.5.2., some factor analytical dimen-sions may be hard to replicate unless one factor analyzes the same or very similar items. While integration is clearly one of the many variants of individualism ver-sus collectivism—a dimension that is easy to extract in different ways from vari-ous databases—the other three dimensions are not easy to replicate. Minkov (2008) demonstrated how a dimension statistically close to Confucian work dynamism/long-term orientation (LTO) could be extracted from the World Values Survey, yet the con-ceptual similarity between the two required a stretch of the imagination. Hofstede, Hofstede, and Minkov (2010) discussed a more plausible attempt, whereas Minkov and Hofstede (2012a) (see 9.26.) pre-sented a close replication of that dimension only after imitating the Chinese Culture Connection’s approach: They factor ana-lyzed items that reflected the spirit of LTO together with items that measured individ-ualism-collectivism (that is, integration).
2. The country rankings for integration and Confucian work dynamism appear plau-sible, but with some salient exceptions. If inte-gration is similar to Hofstede’s individualism versus collectivism, it is strange that Brazil has a higher score than Sweden, Canada, and the United States. Subsequent measures of dimensions similar to Hofstede’s—for example, Project GLOBE’s in-group collec-tivism practices (Gelfand et al., 2004) and Minkov’s exclusionism (Minkov, 2011)—do not assign such a position to Brazil. We seem

222 ◆ Major Cross-Cultural Studies
to have a situation described in 8.2.8.5.2.: Factor analysis may produce misleading country scores.
3. Brazil has a surprisingly high posi-tion also on Confucian work dynamism/LTO, which puts it close to the East-Asian league. Barring the Chinese Culture Connection, there is no indication from any other source that Brazil has anything Asian in its culture. That country does not have a fast-growing GDP or GNI per person (notwithstanding some popular myths) and is in fact an economic laggard compared to many Asian and Eastern European countries. Also, Confucian work dynamism/LTO predicts high school achievement, especially in mathematics (Hofstede, 2001; Hofstede, Hofstede, & Minkov, 2010; Minkov & Hofstede, 2012a), but Brazil’s performance in that respect is quite poor (see the results in Organisation for Economic Co-operation and Development Programme for Inter-national Student Assessment [OECD PISA], 2003). It is evident that Brazil’s positions on integration and Confucian work dyna-mism/LTO are measurement artifacts.
4. Confucian work dynamism/LTO was criticized by Fang (2003). This is regularly one of the most-read articles in the International Journal of Cross-Cultural Management. The main point in Fang’s criticism is that many of the items that the Chinese Culture Connection used are correlated and therefore redundant. To support this claim, he simply relied on a semantic analysis of the corresponding Chinese words. He did not refer to any research that showed whether these val-ues were really correlated across Chinese individuals as he suggested. But Fang also ignored the fact that the Chinese Culture Connection carried out a cross-cultural study at the level of nations. For the pur-pose of that study, it does not matter at all whether the items are correlated across Chinese individuals but how they corre-late across nations. The Chinese Culture
Connection (1987) provides the only evi-dence we have for that.
Fang also finds fault with the fact that some of the values that define Confucian work dynamism/LTO are not opposites at two different poles of a bipolar dimension, as their factor loadings suggest but can exist in a dialectical unity. This is a clas-sic attempt to reject empirical facts on the basis of abstract imagination. Even if some of the values that define Confucian work dynamism/LTO can form dialectical pairs in China, the Chinese Culture Connection was not a study of Chinese culture but of the cultures of 23 nations.
◆ A Replication of Confucian Work Dynamism/LTO
If Confucian work dynamism/LTO is a predictor of national economic growth and national educational achievement in crucially important subjects, such as math-ematics, it deserves very special attention. This section discusses a partial replica-tion of Confucian work dynamism/LTO extracted from very different samples and questionnaires. A closer replication of that dimension by Minkov and Hofstede (2012a) is discussed in 9.26.
The example of the Chinese Culture Connection led Hofstede to suggest a similar exercise for Africa, leading to a publication by Noorderhaven and Tidjani (2001). African scholars in Africa and African students abroad were asked to suggest value survey items. The resulting questionnaire, in an English or French ver-sion, was administered to samples of male and female students in Cameroon, Ghana, Senegal, Tanzania, and Zimbabwe, to white students in South Africa, and to students in Belgium, Germany, the United Kingdom, Guyana, Hong Kong, Malaysia, the Netherlands, and the United States—a total of 1,100 respondents in 14 countries.

Cultural Dimensions Across Modern Nations ◆ 223
An ecological factor analysis produced six factors. The second of these cor-related nearly perfectly with Confucian work dynamism/long-term orientation ( r = –.95**), albeit across only 10 cases. This dimension was called “wisdom.” It was defined by the following items:
It is important to show hospitality to strangers.
Wisdom is more important than knowledge.
Wisdom comes from experience and time, not from education.
It is better to discuss a decision than to impose a decision.
The conceptual negative link between a dimension defined by such items and Confucian work dynamism/LTO is not obvious. But a more profound analysis will reveal that the two dimensions share some conceptual similarity. The first item suggests generosity rather than thrift, and the importance of doing favors for others that might be reciprocated in the future. It may also reflect a concern for face, because a lack of generosity is strongly condemned in some African cultures and treated as despicable stinginess (Lee, 1979). Further, studies of the structure of values have shown that importance of “wisdom” can be closely associated with importance of tradition and honoring the past (Fischer et al., 2010)—the opposite of what Confucian work dynamism/long-term orientation stands for. Therefore, the wisdom dimension is, among other things,
a measure of the importance of face and tradition.
Noorderhaven and Tidjani’s (2001) study is important for empirical and methodological reasons. It evidences the short-term orientation of African culture expressed as discounting the importance of education as an investment in the future. It also demonstrates a focus on the traditions and values of the past. On the other hand, the study shows that nearly identical dimensions of culture can be extracted through questionnaires that are based on very different cultural traditions and perspectives: Chinese and African. This represents a triumph for the etic approach to the study of culture.
■ Note
1. Interestingly, the integration index is an even better predictor of GNI per person at PPP growth from 1998 to 2008: –.65**. It also yields the same Spearman correlation, whereas Confucian work dynamism produces a weak and insignificant Spearman correla-tion with GNI per person at PPP growth for 1998–2008. However, integration is strongly correlated with static GDP or GNI per per-son, which means that it is, among other things, a measure of national wealth. The fact that it is so highly correlated with sub-sequent economic growth may simply reflect what economists are well aware of: High eco-nomic growth is easier from a lower base. On the other hand, Confucian work dynamism is not correlated with static GDP or GNI. This makes it an independent predictor of economic development.
224 ◆
◆ Introduction
Israeli cross-cultural psychologist Shalom Schwartz is known as a leading researcher in the domain of cultural values and the structures they form across individuals within societies as well as across societies. He started out by administering the Rokeach Values Survey to teachers. From that basis, he and his students defined theoretically 56 abstract value items that should reflect rec-ognizable values in all cultures, and be associated with goals that all humans must pursue (Schwartz, 2011). Schwartz (1994) apparently believed that this value set reflected all-important human values:
No omissions in this set were revealed by a review of the value
categories proposed as universal in the social science and human-ities literature. Moreover, when researchers in many nations added values they thought might be special to their cul-tures and missing from the core set of 56, no additional distinct types of values were revealed in analyses of data from these nations. Instead, the added val-ues emerged with the appropriate a priori value types. (p. 89)
The 56 values were used for the construction of the Schwartz Values Survey (SVS). In the late 1980s and the early 1990s, Schwartz and his associates used international contacts to admin-ister the SVS in various loca-tions and obtained data from 20 countries. A few years later
SHALOM SCHWARTZ (1994): A STUDY OF THE VALUES OF SCHOOLTEACHERS AND UNIVERSITY STUDENTS
9.3

Cultural Dimensions Across Modern Nations ◆ 225
that number doubled. Schwartz felt that he could study culture at the culture level, “following the lead of Geert Hofstede” (Schwartz, 2011, p. 308).
Among other things, Schwartz’s (1994) project, which is described below, 1 was intended as a “check on the reliability of Hofstede’s dimensions” (p. 87). Schwartz had hypothesized different possible out-comes: support for Hofstede’s dimensions, a need to refine them into finer-tuned dimensions, or a set of different dimen-sions. Schwartz mentioned various reasons for which unpredictable results were pos-sible: For instance, Hofstede’s sample did not include any socialist countries from the Soviet bloc and his data were from around 1970.
◆ Samples
Schwartz used data collected from 1988 to 1992 from 86 samples coming from 41 cultural groups in 38 nations on all continents. About 80% of his samples included between 150 and 300 respon-dents. In terms of professional occupation, Schwartz’s respondents were schoolteach-ers and university students. The dimen-sions of national culture for which he reports indices are extracted from the teachers’ data.
◆ Hypothesized Dimensions
Schwartz postulated the existence of three “universal requirements of human existence to which all individuals and societies must be responsive: needs of individuals as biological organisms, requisites of coordinated social interac-tion, and survival and welfare needs of groups” (p. 88).
Before starting the analysis of his data, Schwartz enunciated several hypotheses
concerning the dimensions that he expected to find:
1. There is a broad dimension inter-pretable as a more sharply defined version of I/C [individualism versus collectivism]. This dimension can and should be refined into more specific types of values to reduce confusions in the literature. (p. 94)
The name that Schwarz chose for this dimension was “autonomy versus conservatism.” He expected that at the autonomy pole one would find cultures where the person is viewed as an autono-mous entity relating to others in terms of self-interest and negotiated agree-ments. Those cultures would endorse values that favor autonomy of individual thought (“curiosity, creativity, varied life,” p. 95). At the opposite pole—conservatism—there should be cultures where individuals are viewed as part of the social fabric. The significance of the individual should “derive from his or her participation in and identification with the group in carrying on its shared way of life” (p. 95). As a result, the conservatism pole should capture values that emphasize propriety and harmony in interpersonal relationships. Examples of such traits and values provided by Schwartz are “moderate, social order, security, reciprocation of favors” (p. 95). The autonomy pole should consequently be defined by values that, in Schwartz’s view, disturb propriety and harmony: “excitement, adventure, enjoying life.”
2. In every society, people must manage their independence with one another. There is a culture-level value dimension that reflects the way societ-ies procure and/or enforce the neces-sary consideration for the welfare of others and coordination with them in the course of coping with interdepen-dencies. One pole of this dimension is related to the use of power. (p. 96)

226 ◆ Major Cross-Cultural Studies
Schwartz expected that the values at the power pole of this hypothesized dimen-sion would be related to conservatism and wondered how distinguishable the two would be. Still, he expected a distinction for abstract theoretical reasons, “because I define the latter [conservatism] in terms of embeddedness in group rather than in terms of individual versus group interests” (p. 96).
3. There is a culture-level value type that emphasizes actively mastering the environment and changing the world (expressed in such values as success, ambition, daring). (p. 96)
Schwartz called this dimension “mas-tery” and expected it to be associated with Hofstede’s masculinity dimension. He also hypothesized an association between mas-tery and power.
4. There is a culture-level value type that includes values that express con-cern for the welfare of others and emphasize harmony with nature (e.g. social justice, equality, protecting the environment). This type is the societal response to the problem of eliciting prosocial action. (p. 96)
Schwartz believed that this value type would resemble the values defined by Hofstede as feminine, as well as what Kluckhohn and Strodtbeck called har-mony with nature.
◆ Questionnaire Items
Schwartz started out with 56 values. He supposed that some values would not have the same meaning in all cultures in his sample. His method of determining the meaning of a value in a particular society was to examine the pattern of the value’s correlations with other values across the individuals that formed his samples. In that sense, Schwartz obviously did not
rely on face validity alone but also on the nomological networks of his items. Following this procedure, he dropped some of his values and continued his fur-ther work with 45 values for which he had found consistent meanings across cultures.
Schwartz believed that his definition of values should be provided in the wordings of the items. Therefore, they started with “as a guiding principle in my life” (p. 99). Then, the respondents were asked to rate the importance of each value on a scale from 7 (supreme importance) to 0 (not important).
◆ Statistical Analysis
Schwartz used smallest space analysis (SSA)—a variant of multidimensional scaling. He identified seven groups or categories of values in his two-dimen-sional solutions. The names of these cat-egories and the values they consist of are presented below (Schwartz, 1994):
Hierarchy: wealth, social power, authority, influential, humble
Conservatism: national security, recip-rocation of favors, social order, honor-ing elders, moderate, preserving public image, self-discipline, politeness, fam-ily, security, devout, obedient, respect tradition, wisdom, forgiving
Harmony: world of beauty, protecting environment, unity with nature
Egalitarian commitment: helpful, social justice, equality, accepting my portion, loyal, honest, world at peace, respon-sible, freedom
Intellectual autonomy: creativity, broad-minded, curious
Affective autonomy: pleasure, varied life, exciting life, enjoying life, pleasure

Cultural Dimensions Across Modern Nations ◆ 227
Mastery: successful, ambitious, indepen-dent, capable, daring, choosing own goals
(Schwartz, 1994, Figure 7.1, p. 102; used by permission)
The visual arrangement of these value categories on the SSA plot suggested that some of them would be in opposition. As Schwartz noted, intellectual and affective autonomy were found opposite conserva-tism, whereas egalitarian commitment was opposed to hierarchy and mastery.
Schwartz provided national indices for the seven categories of values as if they were dimensions. He did not explain how exactly he obtained those scores and did not report correlations between the values that define a particular dimension and the national index for that dimension. The national indices for his seven categories are reproduced below (Schwartz, 1994). All scores have been multiplied by 100.
Conservatism Israel (Druze) 451 Malaysia 446 Bulgaria (Turks) 443 Singapore 438 Estonia (rural) 437 Israel (Christian Arabs) 436 Israel (Muslim Arabs) 433 Poland, Taiwan 431 Slovakia 428 Slovenia, Turkey 427 Estonia (urban) 426 Thailand 422 Zimbabwe 421 China (Shanghai) 410 Israel (Jews) 408 China (Heibei) 407 Australia 406 Hong Kong 404 Mexico 403 Brazil, China (combined), Hungary 397 United States 390 Japan 387 Finland 384 Italy 382 Portugal 376
China (Guangzhou) 375 New Zealand 373 Greece, Netherlands 368 Denmark 364 East Germany 350 Spain, West Germany 342 France 335 Switzerland (French) 325 Affective autonomy France 441 Switzerland (French) 424 East Germany 416 West Germany 403 Denmark 401 New Zealand 398 Spain 397 Greece 396 Zimbabwe 385 Slovenia 376 United States 365 Israel (Jews), Thailand 362 Japan, Portugal 354 Finland, Netherlands 351 Australia 350 China (Heibei) 346 China (Guangzhou) 345 Hungary 334 China (combined) 332 Brazil 330 Israel (Muslim and Christian Arabs) 327 Turkey 325 Mexico 323 Taiwan 321 Israel (Druze), Malaysia 316 Bulgaria (Turks), Poland 313 Hong Kong 311 China (Shanghai) 309 Estonia (urban) 308 Singapore 304 Estonia (rural) 303 Italy 295 Slovakia 276 Intellectual autonomy Switzerland (French) 533 France 515 Slovenia 503 Spain 490 West Germany 475

228 ◆ Major Cross-Cultural Studies
Japan 468 Finland 462 Italy 460 China (Guangzhou), Denmark 458 East Germany 447 Hungary, Netherlands 444 New Zealand 436 Israel (Jews) 431 China (combined) 427 China (Shanghai) 425 Mexico, United States 420 Brazil 413 Australia, Portugal, Turkey 412 Greece, Poland 409 Hong Kong, Thailand 408 Israel (Druze, Muslim Arabs), Malaysia 407 Slovakia 403 China (Heibei) 401 Estonia (urban), Taiwan 393 Zimbabwe 382 Israel (Christian Arabs) 380 Bulgaria (Turks) 378 Estonia (rural) 369 Singapore 368 Hierarchy China (Heibei) 398 China (Guangzhou) 378 China (combined) 370 China (Shanghai) 336 Thailand 332 Turkey 330 Israel (Muslim Arabs) 317 Zimbabwe 314 Bulgaria (Turks) 307 Israel (Christian Arabs) 303 Japan 286 Taiwan 285 Hong Kong, Israel (Druze) 283 Singapore 275 East Germany, Israel (Jews) 269 Brazil 264 Poland 253 Malaysia 243 Hungary 242 United States 239 New Zealand 238 Australia 236 Mexico 235 West Germany 227 Netherlands 226
Switzerland (French) 220 Estonia (rural) 218 France 216 Slovakia 211 Portugal 208 Finland, Spain 203 Greece 201 Estonia (urban) 200 Denmark 186 Slovenia 176 Italy 169 Mastery China (Guangzhou) 484 China (Heibei) 476 China (combined) 473 Zimbabwe 462 China (Shanghai) 457 Greece 453 Malaysia, Mexico, United States 434 Japan 427 Portugal 425 New Zealand 423 Israel (Muslim Arabs) 422 Israel (Christian Arabs) 421 Hong Kong, Switzerland (French) 418 Brazil, East Germany, Israel (Druze) 416 Spain, Taiwan 411 Australia, Slovakia 409 Italy 408 West Germany 407 Israel (Jews) 406 Bulgaria (Turks) 404 Poland 400 Thailand 399 Netherlands 398 Denmark 397 Hungary 396 Singapore 393 Turkey 390 France 389 Slovenia 376 Estonia (urban) 373 Estonia (rural) 364 Finland 363 Egalitarian commitment Portugal 562 Italy 557 Spain 555 Denmark 552

Cultural Dimensions Across Modern Nations ◆ 229
France 545 Netherlands 539 West Germany 537 Greece 535 East Germany 529 Finland 526 Switzerland (French) 519 New Zealand 515 Turkey 512 United States 503 Estonia (rural) 502 Mexico 499 Australia, Slovakia 498 Estonia (urban) 496 Brazil 492 Israel (Muslim and Christian Arabs) 488 Hungary 487 Israel (Druze) 486 Hong Kong 485 Bulgaria (Turks) 483 Poland 482 Singapore 479 Israel (Jews) 478 Japan 469 Taiwan 468 Malaysia 466 China (Shanghai) 465 China (combined) 449 Zimbabwe 448 China (Heibei), Slovenia 436 China (Guangzhou) 435 Thailand 434 Harmony Italy 480 Slovenia 472 Mexico 467 Estonia (urban) 465 Finland 454 Estonia (rural), Spain 453 Hungary 451 Switzerland (French) 450 West Germany 442 Slovakia 440 Greece 439 Bulgaria (Turks) 432 France 431 Portugal 429 Turkey 426 Taiwan 417 Denmark 416
Poland 410 East Germany 408 Japan 407 Australia 405 Brazil 402 New Zealand 399 Netherlands 398 Thailand 393 China (Guangzhou) 383 Singapore 372 China (Heibei, combined) 371 United States 370 China (Shanghai) 363 Israel (Druze), Malaysia 350 Zimbabwe 342 Hong Kong 334 Israel (Christian Arabs) 328 Israel (Muslim Arabs) 305 Israel (Jews) 301
(Schwartz, 1994, Table 7.3, pp. 112–115; used by permission)
Schwartz reported correlations between his categories and Hofstede’s dimensions. In the teachers’ sample, five of his cat-egories were significantly correlated with Hofstede’s individualism at a reported .05 level of significance: conservatism (–.56), intellectual autonomy (.53), egalitarian commitment (.51), hierarchy (–.51), and affective autonomy (.46). Two categories were correlated with Hofstede’s power distance: conservatism (.45) and affec-tive autonomy (–.45). One category was correlated with Hofstede’s uncertainty avoidance: harmony (.43). One was corre-lated with Hofstede’s masculinity: mastery (.56). Thus, all of Schwartz’s categories based on teachers’ samples were each correlated with at least one of Hofstede’s dimensions. As for Schwartz’s catego-ries based on students’ samples, harmony and mastery were not significantly corre-lated with any of Hofstede’s dimensions, whereas uncertainty avoidance and mas-culinity versus femininity were not signifi-cantly correlated with any of Schwartz’s categories. On the other hand, Hofstede’s individualism was strongly correlated with affective autonomy (.85). Power distance

230 ◆ Major Cross-Cultural Studies
yielded almost the same correlation with affective autonomy (–.83).
Schwartz believed that in the students’ data, factors other than nation-culture might have affected the national indices (p. 110). In his view, this makes the indices based on teachers’ samples more reliable. If that is so, all of Schwartz’s categories can be viewed as variants of Hofstede’s dimensions albeit distant ones, because the significant correlations are not strong.
◆ Additional Statistical Analysis
Although the Chinese Culture Connection (1987) had published its work by the time Schwartz published his, he did not report correlations with their dimensions. Across 14 common cases, integration is strongly correlated with conservatism (–.87**), intellectual autonomy (.82**), egalitar-ian commitment (.81**), and hierarchy (–.75**). It is also correlated with affective autonomy (.50), although this correla-tion does not reach statistical significance, probably because of the small number of overlapping countries in the samples of the Chinese Culture Connection and Schwartz’s databases.
Confucian work dynamism/LTO (long-term orientation) is related to hierarchy (.65*).
◆ Contributions
1. Schwartz’s work is a milestone in cross-cultural research. The large num-ber of countries and ethnic groups that he sampled, and the high number of respondents in them, make his project particularly interesting. His analyses of the structure of values (Schwartz, 1994; Schwartz & Bardi, 2001; Schwartz et al., 2001; Schwartz & Sagiv, 1995) have by now achieved the status of a classic opus
that every student of culture should read. The structure that he proposes is sensible and easy to comprehend. It is important to emphasize these strengths of his model rather than saying that it reflects the true structure of values. The important ele-ment in Schwartz’s work is not his search for an ultimate model but the fact that he has given the consumers of cross-cultural research a good model, backed by empiri-cal evidence that can be used for practical purposes—an easy visualization of the relationships between some of the basic values that motivate human behavior.
2. After Hofstede and the Chinese Culture Connection, Schwartz provided additional evidence about the cultural differences that distinguish the economi-cally developed countries from the devel-oping ones. In that sense, he illuminated important aspects or facets of the dimen-sion called “individualism versus collectiv-ism” by Hofstede and “integration” by the Chinese Culture Connection.
3. Schwartz’s analysis demonstrates that religious denomination is not an impor-tant determinant of cultural differences in values. Muslim and Christian Arabs who have lived together in Israel for centu-ries have nearly indistinguishable values or appear to be more similar than the popula-tions of some cities in the same country, such as Shanghai and Guangzhou in China, which Schwartz studied separately.
◆ Food for Thought
1. Schwartz did not provide correla-tions between his national indices and the values that define them. As a result, we can-not be sure which values contribute most to a particular index and whether some of them are not redundant. Visualizations of relationships between variables (through multidimensional scaling maps or factor analysis loading plots) are a good starting

Cultural Dimensions Across Modern Nations ◆ 231
point in an analysis, but as Schwartz him-self has acknowledged, the visual solution can sometimes by misleading (Schwartz & Sagiv, 1995): Items that are shown close together may in fact yield weak correlations. Still, Schwartz (2011) does not recommend factor analysis for the study of values and distances himself from researchers who “prefer narrowly defined constructs measured with items that form clusters that emerge in factor analysis and yield high alphas” (p. 308). But the problem with broadly defined constructs like Schwartz’s is obvious: Their empirical identity is vague even though they may have a strong theoretical basis. It is a prob-lem of respondents’ minds (empiricism) versus researchers’ minds (theory).
2. Schwartz’s (1994) indices produce different correlations with each other. Some are so closely correlated as to be strong candidates for a merger: Across 30 nations, both affective autonomy and intellectual autonomy correlate with con-servatism at –.74**, whereas egalitarian commitment correlates with conservatism at –.72**. When two indices share more than 50% of their variance, as is the case here, they obviously measure something very similar, even if it is possible to split it into different theoretical concepts.
3. Schwartz believed that the values he chose would cover all basic human values. If this is so, even if a value is not explicitly mentioned in his model, it should be subsumed under a key category of val-ues and yield a high correlation with it. If this is so, one can wonder where Chinese values such as perseverance, thrift, and shame would show up in his circumplex.
4. Three of the 10 important values for children in the 2005–2008 wave of the World Values Survey—independence, hard work, and unselfishness—are not significantly correlated with any of the
national indices in Schwartz (1994). This suggests that his value model is not exhaus-tive: It leaves out some basic human val-ues. Starting from a theoretical position, one could argue that independence, hard work, and unselfishness (from the World Values Survey) are conceptually close to some of Schwartz’s values. Nonetheless, the lack of a statistical correlation indi-cates a lack of empirical equivalence.
Further, if Schwartz’s seven categories capture all human values, they should have very strong predictive properties with respect to many important external vari-ables. Yet, a variety of important variables are not predicted well by any of Schwartz’s (1994) national indices. For example, item A040 in the World Values Survey (latest data for each country from 1994–2004), which measures the importance of religious faith as a value for children, correlates sig-nificantly only with intellectual autonomy and the correlation is quite modest: –.44** ( n = 27). National achievement in math-ematics in the eighth grade as measured by the TIMSS (Trends in International Mathematics and Science Study) project in 2007 (Mullis et al., 2007) yields only weak and insignificant correlations with Schwartz’s seven national indices.
■ Note
1. Schwartz (2011) stated that he some-times regrets the publication that is discussed here without explaining why. There is a clue in his next sentence though: “Despite signifi-cant changes and refinements to the theory of cultural orientations over the last 15 years . . . many still use that chapter as the key source” (p. 308). This suggests that Schwartz considers his 1994 publication somewhat dated from a theoretical viewpoint. Nevertheless, in this book we are mostly interested in a practical issue: what Schwartz’s cultural indices from 1994 reflect and predict.

232 ◆
◆ Introduction
Peter Smith is a renowned cross-cultural psychologist who has a strong interest in national dimen-sions of culture. In association with his academic assistant Shaun Dugan and Dutch management consultant Fons Trompenaars, he analyzed a database collected by Trompenaars in the 1980s and the early 1990s. The goal of the analysis was to measure and map the existing cross-cultural varia-tion on Rotter’s locus of con-trol scale. The results of that study were published by Smith, Trompenaars, and Dugan (1995), which is the article discussed here.
During the 1950s, American psy-chologist Julian Rotter developed a questionnaire for the measure-ment of what is known as “locus of control” (Rotter, 1966). This is a complex concept referring to
people’s perceptions of the degree to which they believe diverse life events can be controlled. Internal locus of control refers to the view that people can control such events, whereas external locus of control stands for the opinion that what happens to people is controlled by external circumstances.
Rotter’s questionnaire includes two types of questions. Question 28 illustrates the first type: It asks respondents if they feel that they control their own lives or not. Question 2 illustrates the second type: It asks whether people’s misfortunes come from their own mistakes or from bad luck (which they are not respon-sible for). Questions of the first type measure the degree to which respondents believe they control their own lives, whereas the sec-ond type measure the degree to which respondents believe other people can control their own lives.
PETER SMITH, FONS TROMPENAARS, AND SHAUN DUGAN (1995): A STUDY OF LOCUS OF CONTROL
9.4

Cultural Dimensions Across Modern Nations ◆ 233
Whether these are two different dimen-sions or not is a matter that cannot be resolved without empirical research. To complicate things, some of Rotter’s ques-tions tap aspects of social cynicism versus a belief in a just society: They ask whether in the long run people get the respect they deserve or their worth will be unrecog-nized, and whether school exams tend to be unfair or not. A final complication is that some items present the respondents with two choices that are not opposites. A glaring example is Question 21, asking whether most misfortunes are the result of personal faults, or the bad things that happen to people will be balanced by good things.
Considering this conceptual diversity in Rotter’s scale, it would be surprising if it measured a single dimension. In fact it does not. Individual-level studies have revealed that Rotter’s scale does not mea-sure a unitary phenomenon (Cherlin & Brookover-Bourque, 1974); hence, it is not justifiable to speak of individual locus of control, measured in the way proposed by Rotter, as if it were one dimension. 1
The number and the structures of the factors that Rotter’s scale yields at the individual level in a particular culture may or may not be replicated at the level of nations. The study by Smith, Trompenaars, and Dugan (1995) was designed to address the issue of dimen-sionality of the concepts in Rotter’s scale at the national level.
◆ Samples
The researchers used Trompenaars’ data-base, collected from his business clients and participants in his seminars. After data cleaning, data from 9,140 respondents, representing 43 countries, could be used for analysis. A subsequent article by Smith, Dugan, and Trompenaars (1996) (see 9.5.) specified that 54.2% of the respondents in Trompenaars’ database were categorized as
managerial or professional workers, 24.2% had lower socioeconomic status, and 21.6% could not be categorized because their ques-tionnaire version had not requested this information.
◆ Hypothesized Dimensions
The authors expected that the responses to Rotter’s scale would correlate with Hofstede’s individualism and power dis-tance and Schwartz’s mastery and harmony. They also predicted a correlation with national indices for income and literacy as well as with the proportions of Christians in each country since Christianity does not emphasize the role of fate as much as some other religions.
◆ Questionnaire Items
This particular part of Trompenaars’ research was based on the 29-item scale developed by Rotter. It presents respon-dents with 29 pairs of apparent opposites and asks them to endorse one. However, only 23 of these items are normally used to calculate locus of control scores. The ques-tionnaire is freely available for personal inspection from many websites.
◆ Statistical Analysis
The authors analyzed the 23 relevant Rotter items that Trompenaars had administered to his respondents. After aggregating the scores by nation, they applied z-score standardization by case (see 7.2.4.4.10.), the cases being nations.
The standardized data were analyzed by means of multidimensional scaling (MDS). A two-dimensional solution seemed reasonable but its stress value was deemed too high. The researchers adopted

234 ◆ Major Cross-Cultural Studies
a three-dimensional solution, noting that this did not lead to any losses in the two-dimensional solution: The third dimension was basically an addition to the previous two. The data were also factor analyzed. After varimax rotation, the three factors correlated with the three MDS dimensions at .85, .84, and .82. This is an indication that both data reduction methods pro-duced essentially the same results.
The first dimension created a very clear contrast between Eastern Europe and Asia. Russia, East Germany, Yugoslavia, Bulgaria, Romania, and Czechoslovakia were found at the positive pole of the dimen-sion, whereas China, Indonesia, Singapore, Hong Kong, South Korea, and Pakistan were at the negative pole. In between were the European, Middle Eastern and African countries, as well as Japan.
Some of the items endorsed in the high-scoring countries are supposed to indicate internal locus of control on Rotter’s scale, whereas other endorsed items should reflect external locus. In the low-scoring countries, the pattern of item endorsement was the opposite. For example, Eastern Europeans tended to agree that people can influence political decisions through their actions (supposedly an indication of inter-nal locus of control) but did not believe in a fair exam system where students’ efforts brings success (supposedly an indication of external locus of control). In East Asia, the opposite situation was observed: a belief that individual effort results in academic success, but a lack of belief that peo-ple’s efforts can influence politics. Smith, Trompenaars, and Dugan (1995) called this dimension “personal versus political”: “This dimension links personal inefficacy in task setting with political idealism at the positive pole [Eastern Europe], while at the negative pole [Asia] there are items accepting responsibility for one’s personal fate but discounting political or organiza-tional efficacy” (pp. 386–388).
The second dimension created a fairly clear contrast between the rich Western countries and Japan at the positive pole
of the dimension versus various develop-ing countries, including the United Arab Emirates, at the negative pole. Again, the items that define this dimension do not show consistent associations with Rotter’s concept of locus of control: The Western countries endorsed some items that should indicate internal locus but also some that were expected by Rotter to indicate exter-nal locus. The developing countries at the negative pole of the dimension displayed a mirror image of this situation.
Western and Japanese respondents chose options indicating that they feel they con-trol the good things that happen in their lives (whereas the “unhappy things” were viewed as partly due to bad luck), yet they felt they could not make people like them. This indicates a perception of personal free-dom and a belief that others should also be left free to choose their likes and dislikes. Respondents in developing nations selected the opposite options. Smith, Trompenaars, and Dugan (1995) called this dimension “individual-social” (p. 388).
The study does not show the geo-graphic distribution of countries on the third dimension. We are told that the items that define it are only weakly related to it. One exception is an item that asks about the role of chance or luck in the respondents’ lives.
Unfortunately, dimension indices were not published. Yet, they can be created from Smith, Trompenaars, and Dugan’s Figure 1 (1995, p. 390). Although this method can-not reproduce the authors’ results with absolute precision, it provides a very close estimate. In order to avoid decimals, all scores have been multiplied by 100.
Political-personal Russia 290 East Germany 240 Yugoslavia 210 Bulgaria 180 Romania 170 Czechoslovakia 150 West Germany 90 Hungary 60

Cultural Dimensions Across Modern Nations ◆ 235
Austria, Portugal, Turkey 50 Brazil, Japan, Netherlands 40 Finland, Ireland 30 Norway 25 Italy 15 Greece, Mexico 0 Denmark, Philippines, Sweden, United States –10 Burkina Faso, Nigeria, Spain, Thailand –20 Australia, Ethiopia, United Kingdom –30 Argentina –50 United Arab Emirates –60 Indonesia, Poland –80 Belgium –100 France, Pakistan –130 Hong Kong, South Korea –140 Singapore –160 Indonesia –190 China –230 Individual-social United States 150 Japan 145 Ireland, Mexico 140 Australia 135 West Germany 130 Netherlands, United Kingdom 120 France 110 Argentina 105 Denmark 100 Sweden 75 Norway 70 Philippines 60 Finland 50 Spain 40 Belgium 30 Portugal 20 Italy, Romania 15 Brazil 10 Nigeria –10 Czechoslovakia –30 Ethiopia –35 Austria, East Germany –40 Bulgaria –50 China, Hong Kong –60 Hungary, Pakistan –70 Poland –75 India, South Korea –80
Yugoslavia –90 Thailand –100 Indonesia, Singapore –105 Russia, United Arab Emirates –110 Turkey –160 Burkina Faso –170 Greece –190
The individual-social dimension was found to correlate with Hofstede’s indi-vidualism at .70** and with his power distance at –.47**. It also correlated with Schwartz’s conservatism at –.55* and with his intellectual autonomy at .63**. The dimension’s correlation with national per-centages of Christians was .54**.
The political-personal dimension cor-related with Schwartz’s hierarchy at –.56*, with his mastery at –.62*, and with his harmony at .67**. The dimension’s cor-relation with national percentages of Christians was .34**.
Both dimensions yielded weak to mod-est (lower than .50) correlations with literacy and national income.
◆ Contributions
1. The study showed that the con-cept of locus of control, as Rotter envis-aged it, is inapplicable at the national level. Not only does his scale measure a multidimensional phenomenon, but a single dimension is positively correlated with endorsements of statements that are supposed to indicate internal locus and other endorsements that are conceptual-ized as reflecting external locus.
2. The results indicate that instead of speaking of locus of control as a national dimension of culture, we should consider at least two dimensions of a completely dif-ferent nature. A third dimension may also be plausible but, in the absence of clearer empirical evidence, it should be ignored. Broadly speaking, both of the convinc-ing dimensions that Smith, Trompenaars,

236 ◆ Major Cross-Cultural Studies
and Dugan (1995) proposed address dif-ferent aspects of relationships between people, even if this is not always explicitly reflected in the items. 2
3. The individual-social dimension is a replication of Hofstede’s individualism versus collectivism, reflecting a belief in free individual choice versus a need to take into consideration complex social relationships. This is another significant contribution to our understanding of the cultural dimen-sion that differentiates the economically developed nations from the rest.
4. The personal-political dimension sheds interesting light on the cultural dif-ferences between Asia and Eastern Europe. It is a pity that the cultural variation on this dimension has not been sufficiently explored in the academic literature.
◆ Food for Thought
1. A decision to apply z-score stan-dardization by case is always controver-sial. As explained in 7.2.4.4.10., it results in ipsatized scores that reflect the way the unit of analysis (individual or coun-try) prioritizes the items, but some of the absolute differences between some units of analysis disappear or get distorted. Although we know that the United States scores 150 on individual-social, whereas France scores 110, we do not know if this reflects national differences in the degree of endorsement of some items or differ-ences in the prioritization of items. It is likely that if Smith, Trompenaars, and Dugan (1995) had not applied z-score standardization by case, the dimensions and the country positions that they would have obtained would have been some-what different.
Also, ipsatization may make sense when the researcher’s goal is to find out how values are prioritized by individuals or within a nation. But it is not clear what
is the use of finding out how individuals or nations prioritize beliefs.
2. It is unclear to what extent the per-sonal versus political dimension is stable or volatile, reflecting situational factors. It was measured in the late 1980s, when Eastern Europe was experiencing turbulent political transformation and there was a widespread belief that participation in political life could result in massive social change. This belief may have faded since then.
3. The fact that some nations were less likely to believe in a fair grading sys-tem at their schools (assuming that such difference is indeed revealed by the ipsa-tized scores) may also be attributable to situational elements. I have unpublished research suggesting that in 2010 Bulgarian students were still highly skeptical of the fairness of their school system, but general conclusions about the worldwide situation are impossible without research evidence.
4. The reported correlations between the two dimensions in this study and national percentages of Christians create an impression that religious denomination can be a significant predictor of important national differences in subjective culture. However, it is likely that these correla-tions are spurious: They would disappear if some of Hofstede’s or Schwartz’s dimen-sions were used as control variables.
■ Notes
1. Lange and Tiggeman (1981) adminis-tered Rotter’s scale to Australian respondents and found two distinct factors: mastery over one’s own life and the extent to which people can have a perceived effect on political institu-tions or the course of world affairs. Marsh and Richards (1986) found five distinct facets on Rotter’s scale. Subsequently, the same authors (Marsh & Richards, 1987) found strong evi-dence against the unidimensionality of the

Cultural Dimensions Across Modern Nations ◆ 237
construct. Smith, Trompenaars, and Dugan (1995) refer to studies from Australia, Canada, Colombia, France, Hong Kong, India, Jamaica, Japan, Poland, the United Kingdom, the United States, and Venezuela that have established that the Rotter scale is not unidimensional.
2. Despite the evidence in Smith, Trompenaars, and Dugan (1995) and Smith, Dugan, and Trompenaars (1996), Trompenaars continued to advertise a seven-dimensional model of national culture that does not stand up to empirical scrutiny.

238 ◆
◆ Introduction
The work of Hofstede (1980), the Chinese Culture Connection (1987), and Schwartz (1994) attracted the attention of Peter Smith, who was introduced in 9.4. He teamed up once again with his academic assistant Shaun Dugan to analyze the database collected by Dutch business con-sultant Fons Trompenaars. Their stated goal was to examine the replicability of the conclusions of the three aforementioned publi-cations. Particularly, they were interested in discovering dimen-sions of national culture that may or may not replicate those that had already been discussed in the aca-demic literature. The result of that
new analysis of Trompenaars’s database was Smith, Dugan, and Trompenaars’s (1996) article dis-cussed here.
◆ Samples
The researchers used Trompe-naars’s database described in 9.4., collected among his business cli-ents and seminar participants. In this case, 8,841 returned question-naires could be used. Of these, 54.2% were managerial or pro-fessional workers, 24.2% were employees with lower socioeco-nomic status, and 21.6% could not be categorized because the database did not contain this information.
PETER SMITH, SHAUN DUGAN, AND FONS TROMPENAARS (1996): A STUDY OF THE VALUES AND BELIEFS OF ORGANIZATIONAL EMPLOYEES
9.5

Cultural Dimensions Across Modern Nations ◆ 239
◆ Dimensions
In some of his publications, Fons Trompenaars hypothesized seven dimen-sions of national culture (Trompenaars, 1993; Trompenaars & Hampden-Turner, 1999). They were all either directly bor-rowed from Parsons and Shils (1951/2001) or inspired by Kluckhohn and Strodtbeck (1961). As far as the national level is concerned, all seven dimensions are theo-retical constructs without an empirical demonstration of their robustness and without country scores. Trompenaars and Hampden-Turner (1999) provide only sample scores for particular items that should give an idea of how a particular dimension could be measured. The seven dimensions adopted by Trompenaars are well-known among some business consul-tants and authors of practical handbooks on cultural differences in organizational behavior who are not concerned with aca-demic rigor and the principles of statistical analysis in social science. The names of those dimensions are
universalism versus particularism
achievement versus ascription
individualism versus collectivism
affectivity versus neutrality
specificity versus diffuseness
sequential versus synchronic [time orientation]
internal versus external locus of control
Smith et al. (1996) focused on the first three of these dimensions, indicating that the other dimensions were left out of their analysis because one was treated in a sepa-rate publication (Smith, Trompenaars, & Dugan, 1995), whereas the others did not
lend themselves easily to the type of analy-sis employed in the study.
The distinction between universalism and particularism was hypothesized as a contrast between two types of values. In societies with a universalist orientation, people would disregard personal relation-ships in their treatment of other people. Instead, they would be guided by univer-sal standards. In particularist societies, existing relationships would be taken into account and behavior would be modeled accordingly. Smith et al. (1996) noted that Parsons and Shils (1951/2001) hypoth-esized this dimension as different from individualism-collectivism, which they called “self versus collectivity.” However, Smith, Dugan, and Trompenaars believed it was more plausible to assume that par-ticularist societies would also be collectiv-ist, whereas universalist societies need not be individualist.
Parsons and Shils (1951/2001) used the terms “achievement” and “ascription” in reference to how people achieve status. It can be achieved or ascribed. Achieved status is earned status by means of ability, effort, and competition, resulting in social mobility. Ascribed status is what one receives by virtue of one’s birth: An aris-tocratic title is ascribed to a person, not achieved. Smith et al. (1996) believed that individualism versus collectivism would be correlated also with this dimension because striving for achieved status seems more normal in individualist societies.
On the basis of these theoretical con-cepts, the authors formulated two hypoth-eses. They expected a dimension related to Hofstede’s individualism versus col-lectivism as well as Hofstede’s power distance (since these two dimensions are highly correlated). They also expected another dimension, related to Hofstede’s masculinity versus femininity, the Chinese Culture Connection’s human heartedness or Schwartz’s self-enhancement versus self-transcendence values. Additionally, some more specific hypotheses were made.

240 ◆ Major Cross-Cultural Studies
The collectivism pole should be associ-ated with items that reflect a preference for closer boss-subordinate relationships, higher company involvement in employ-ees’ lives, preference for ascription over achievement, and a particularist orienta-tion. The authors proposed to validate the individualism versus collectivism dimen-sion by showing that it correlates with indices of modernity, such as national wealth, literacy rates, and life expectancy.
◆ Questionnaire Items
To collect his database, Trompenaars had used a questionnaire inspired by Talcott Parsons and Edward Shils (1951/2001) targeting various beliefs and norms. He also borrowed questions from Stouffer and Toby (1951), asking respondents what they would do in a particular situation.
Universalism versus particularism was supposed to be measured by four items. Smith et al. (1996) described the first item as follows:
The first item (Unpa1) describes a situ-ation where the respondent is required to imagine he or she is in a car being driven by a close friend (but not a rela-tive). The friend hits a pedestrian while exceeding the 20-mile-per-hour speed limit, and there are no witnesses. The friend’s lawyer says that if the respon-dent testifies that the friend was within the legal speed limit, it may save the friend from serious consequences. The respondent is required to report what he or she would probably do in this sit-uation in view of his or her obligations to the friend and the obligations of a sworn witness. Would or would not the respondent testify that the friend was exceeding the speed limit? The respondent is also required to state whether the friend in the given situation has a “definite right,” “some right,” or “no right” to expect the respondent to
testify in their favor. Thus the items tap both behavioral intentions and percep-tions of norms. (p. 242)
Another dilemma that should measure the same dimension is about a friend’s restaurant:
The respondent is asked to imagine that he or she is a journalist who reviews restaurants. The food is poor. Should the respondent report the truth of the matter or not? (p. 242)
For the purpose of the third dilemma, the respondents are asked to imagine that they were medical doctors:
The friend in this instance is being examined for eligibility for more insur-ance. The examination reveals some health problems. Should the doctor ignore these for the sake of his or her friend’s needs? (p. 242)
The fourth dilemma assigns to the respondents the role of an insider deal-ing in financial markets. A friend would be financially ruined unless the respon-dent tipped him off about the outcome of a confidential meeting. Should the insider share the privileged information or not?
Achievement versus ascription was sup-posed to be measured by six items, scored on a five-point Likert scale, ranging from “strongly agree” to “strongly disagree.” Below the six items are reproduced as published in Smith et al. (1996, p. 243):
1. The most important thing in life is to think and act in the ways that best suit the way you really are, even if you do not get things done.
2. The respect a person gets is highly dependent on the family out of which they come.
3. When someone is born, the success they are going to have is already

Cultural Dimensions Across Modern Nations ◆ 241
in the cards, so they might as well accept it and not fight against it.
4. A child should be taught from infancy to be more gentle with women than with men.
5. It is important for managers to be older than most of their subordi-nates.
6. Older people should be more respected than younger people.
The items that should measure indi-vidualism versus collectivism covered the following:
The extent of [desirable] company involve-ment in the life of individual employees; for example in providing housing or organizing social functions, the work-ing relationships of subordinates with their superiors, optimal modes of depart-mental organization and job assessment, valued characteristics of managers, ways of dealing with unsatisfactory work of employees, and the nature of contractual obligations. (p. 243)
(Smith, Dugan, and Trompenaars, 1996, pp. 242–243; used by permission)
Altogether, 39 relevant items were analyzed.
◆ Statistical Analysis
Standardization by case (see 7.2.4.4.10.) was not performed because the forced-choice format rendered that operation unnecessary. As a second reason, Smith et al. (1996) state that “the question-naire items spanned a variety of scales constructed on the basis of hypothesized differences grounded in theory. To stan-dardize across scales would be very likely to eliminate variance that is substantive rather than artifactual” (p. 244). Although
the view that what is grounded in an abstract theory is substantive clashes with the philosophy of this book (which pos-tulates that nothing is substantive until shown empirically), this decision against standardization by case seems correct.
The scores for all 39 items were aggre-gated to the national level and trans-formed onto a scale from 0 to 100. The resulting analysis was ecological, as in Hofstede (1980) and the Chinese Culture Connection (1987). The data were ana-lyzed using multidimensional scaling, and the solution was checked through a com-parison with the results of a factor analy-sis. In this respect, Smith et al. (1996) did the opposite of what the Chinese Culture Connection did.
The authors tried four different solu-tions: from a single dimension to four. The single-dimension solution was rejected because of the high stress value. The four-dimension solution was also deemed unacceptable because it was not easily interpretable, intuitively or through correlations with external variables. This suggests a concern for practical utility: Dimensions that do not have convinc-ing predictive properties with respect to external variables should be abandoned.
Finally, there was a choice of two dimensions or three. A three-dimensional solution was adopted although the third dimension accounted for a very small per-centage of the variance.
The authors constructed regression models to estimate associations between their dimensions and the items that define them; however, they did not provide Pearson correlations between dimension scores and the items that define them.
The first dimension created a clear con-trast between rich and poor countries. Smith et al. (1996) decided to borrow a name from Schwartz (1994) for their first dimension: “conservatism versus egalitarian commit-ment.” Conservatism was more pronounced in developing countries whereas egalitarian commitment was more typical of the rich. This dimension was associated with two

242 ◆ Major Cross-Cultural Studies
types of items: those that were expected to measure achievement orientation and universalism versus particularism, show-ing that the two concepts can be merged into a single bipolar dimension. An espe-cially strong association was reported with agreement that a child should be taught from infancy to be more gentle with women than with men. Greater agree-ment with this statement was registered in developing countries.
Strong associations were found between this dimension and items that should measure individualism versus collectivism, especially those that address the degree of desirable involvement of a company in a person’s private life. In the developing countries (high on conservatism) there was stronger agreement that the company should provide housing for their employ-ees, help with the organization of mar-riages, and take into account the size of their families when determining their sala-ries. In the rich countries, the prevalent opinion was that companies should stay out of the private lives of their employees and pay them only on the basis of the work that they have done.
Respondents in developing coun-tries were more likely to agree to work overtime hours without financial com-pensation, expressing the view that the boss’s appreciation is a sufficient reward. Organizational structure was viewed as necessary because it shows who has authority over whom. The ideal manager was described as a kind of good father, guiding his subordinates. He is expected to know the answers to most questions that may crop up. His word is the law. Even if the subordinates think he is wrong in a particular case, they must do as they are told or else there will be trouble.
In the rich countries the consensus was that overtime must be paid in accordance with a written contract. The perceived rea-son for having an organizational structure was to ensure knowledge of the allocation and coordination of functions. The ideal manager is one who gives his subordinates
leeway and intervenes rarely. When he seems to be wrong, it is acceptable to point that out to him.
The second dimension was called “utilitar-ian involvement versus loyal involvement.” It created a clear geographic contrast. The former Soviet bloc (utilitarian involvement) was found at one extreme. The Asian coun-tries, some African countries, and Southeast Europe and the Middle East were at the opposite extreme.
Utilitarian involvement indicates a pref-erence to go it alone rather than work as a team. Respondents in Eastern Europe expressed this tendency quite clearly. They stated that after a father’s death, his busi-ness should be split among his children. In the countries at the loyal involvement pole, respondents expressed the opposite preference: to run the inherited business together. Utilitarian involvement was also associated with a greater agreement that rewards and punishments should be dis-tributed individually rather than shared by the team.
We can leave out the third dimension as Smith et al. (1996) admitted that it was difficult to interpret. There are only a few items that correlate significantly with it, and the associations are weaker than in the case of the two previous dimensions. Besides, most of the variables that load highest on this dimension are said to be associated with the other dimensions, and those associations are stronger in some cases.
The published study does not report national scores but these were kindly pro-vided by Peter Smith for this book. They are reproduced below with his kind per-mission. All scores have been multiplied by 100.
Egalitarian commitment versus conser-vatism
Denmark 217 United States 196 Australia 182 Norway 160 United Kingdom 142

Cultural Dimensions Across Modern Nations ◆ 243
Germany 138 Sweden 129 Netherlands 123 France 111 Finland 109 Ireland 104 Portugal 91 Austria 79 Belgium 84 Mexico 68 Brazil 66 Pakistan 56 Ethiopia 46 Italy 39 Thailand 29 Greece, Philippines 31 Spain 3 Turkey −3 Nigeria −8 Poland −14 India −31 Argentina −38 Singapore −60 Japan −64 Hong Kong −73 Hungary −74 Burkina Faso −93 Czech Republic −103 United Arab Emirates −115 Romania −126 Bulgaria −164 South Korea −171 China −220 Russia −232 Indonesia −241 Yugoslavia −300 Loyal versus utilitarian involvement Singapore 193 Burkina Faso 134 South Korea 109 Thailand 92 Pakistan 90 Indonesia 87 Greece 86 Turkey 75 Hong Kong 70 Ethiopia 67 Philippines 66 United Arab Emirates 57
Spain 53 Mexico 50 Japan 41 Nigeria 40 India 36 Austria 31 Brazil 22 Portugal 18 France 9 Italy 1 Argentina, Australia −4 United Kingdom −5 Ireland −6 Belgium −12 United States −15 Finland −20 Yugoslavia −44 Netherlands −51 Germany −54 Bulgaria, Sweden −94 Norway −96 China −99 Denmark −109 Poland −127 Russia −131 Romania −140 Hungary −159 Czech Republic −214
◆ Contributions
1. This is yet another study that provides valuable information about the salient cultural differences between rich and poor countries. The dimension that reflects these differences is called “egalitarian commitment versus conser-vatism” in this case but it is statistically close to Hofstede’s individualism versus collectivism (9.1.), the Chinese Culture Connection’s integration (9.2.), and Minkov’s exclusionism versus universal-ism (9.24.). It is also very close to those of Schwartz’s dimensions (9.3.) that cre-ate contrasts between rich and developing countries. From the study by Smith et al. (1996), we learn that—in addition to all other differences—the cultures of the rich
244 ◆ Major Cross-Cultural Studies
countries are characterized by a prefer-ence for achieved status, universalism in the sense of treating people in accordance with established universal rules rather than personal relationships, and a sepa-ration of professional and private life. The cultures of the developing countries exhibit the opposite tendencies
2. We have evidence of an interest-ing cultural dimension—utilitarian versus loyal involvement—that creates a country ranking unknown from other sources. The utilitarian involvement of Eastern Europeans and their unwillingness to work in groups is well documented anecdotally by business practitioners and consultants in Eastern Europe and does not come as a surprise to anybody from that region. It is only a pity that this issue has not received all the attention that it deserves in cross-cultural research.
3. The study suggests that dimen-sions that evidence cultural contrasts between the rich and developing world, such as Hofstede’s individualism ver-sus collectivism and the Chinese Culture Connection’s integration, have nothing to do with some abstract popular concepts of what individualism versus collectivism is about. If there is a cultural difference between rich and developing countries, it is not about an unwillingness to do things in groups versus a preference for team-work. If there is such a cultural distinc-tion, it does not carve up the world along national wealth lines. The cultural dimen-sion that best reflects such differences is utilitarian versus loyal involvement. It is unrelated to national differences in wealth and creates a very different geographic contrast: between Eastern Europe and Asia. If individualism is conceptualized as a preference to go it alone than work in a group, the most individualist nations in the world are those of Eastern Europe. However, Hofstede’s individualism, the Chinese Culture Connection’s related dimension, integration, and Minkov’s
universalism are about something entirely different that should not be confused with attitudes toward group work.
Although some authors (for example, Kirkman et al., 2006) have claimed that collectivism, in the sense of Hofstede’s dimension, is associated with an inclina-tion toward teamwork, whereas individu-alism means greater reluctance to work in teams, their evidence comes from individ-ual-level studies (for example, Kirkman & Shapiro, 1997), where individualism is operationalized across individuals in a manner that has nothing to do with Hofstede’s individualism, Smith, Dugan, and Trompenaars’s egalitarian commit-ment, or Minkov’s universalism, all of which are nation-level constructs.
4. Although this is not quite clear from the study discussed here, Trompenaars’s research debunks another myth: the belief that “in countries where individualism dominates, individuals view their relationship with the organization from a calculative perspective, whereas in collectivist societies, the ties between the individual and organization have a moral component” (Boyacigiller & Adler, 1991, referring to Allen, Miller, & Nath, 1988). Trompenaars and Hampden-Turner (1999) show evidence that in the Eastern European countries (which score high on measures of collectivism as defined by Hofstede), there is a strong tendency for employees to view their companies in a strictly utilitarian manner.
5. This is the second large-scale study, after Hofstede’s (1980), showing that answers to questions about norms for organizational behavior can reveal differences between national cultures. It confirms Hofstede’s (1980, 2001) view that people take their national cultures to the organizations they work for.
6. The study demonstrates that stated norms and behavioral intentions are not quite the same thing. One may agree

Cultural Dimensions Across Modern Nations ◆ 245
with a certain behavioral norm but still indicate a different behavioral intention because of situational or other factors.
7. Fons Trompenaars’s seven-dimensional model of national culture (Trompenaars, 1993; Trompenaars & Hampden-Turner, 1999) is often pre-sented uncritically in popular publications on cross-cultural management lacking aca-demic rigor. Hofstede (1996) argued that Trompenaars’s model had no empirical support. Smith et al.’s (1996) publica-tion confirms this conclusion: It presents a convincing analysis of Trompenaars’s data, endorsed by Trompenaars himself, that does not replicate his popular seven-dimensional model.
◆ Food for Thought
1. As indicated by Smith et al. (1996), the three dimensions extracted through multidimensional scaling were not strongly correlated with the three in their factor analysis. The reader is left wondering what those three factors look like and what they predict. Like any other large database, Trompenaars’s can be analyzed in different ways, and different dimensions, as well as different numbers of dimensions, can be extracted depend-ing on the selected data reduction method. Smith, Dugan, and Trompenaars’s choice is well-argued and convincing and is likely to be the optimal solution in a conven-tional sense. Still, one can probably imag-ine other solutions as well.
2. Items that clearly measure individ-ualism versus collectivism and power dis-tance, in the sense that Hofstede attached to these terms, were grouped into a single
dimension: conservatism versus egalitar-ian commitment. Names are unimportant; what is interesting here is that Hofstede (1980, 2001) and Smith et al. (1996) mea-sured identical phenomena: the degree to which a company should get involved in the employees’ private lives and the degree to which employees should obey their superi-ors, no questions asked. Hofstede chose to treat these two domains as separate dimen-sions, despite the fact that they produced a high correlation, whereas in the analysis of Smith, Dugan, and Trompenaars they define a single dimension.
3. There is a very considerable dis-tance between West Germany and East Germany on the multidimensional map defined by the two main dimensions (although Peter Smith provided a single score for the two regions). This situation is very different from what we see on the Inglehart-Welzel map, produced on the basis of an analysis of the World Values Survey and available on the official web-site of that organization. On that map, the two former German states are very close together, suggesting a very small cultural difference. One explanation could be that Trompenaars’s questionnaire addresses many organizational behavior issues, whereas Inglehart’s analysis is based on general values and beliefs. It is possible that Soviet-style socialism affected the way that people think about work to a greater extent than more general values, such as religion or leisure.
4. The fact that the former Soviet bloc, Yugoslavia, and China cluster together in terms of the two dimensions discussed in the study, whereas the other countries form a separate constellation, suggest that Marxist regimes may have had some impact on work-related culture.

246 ◆
Robert Levine is a professor of psychology at California State University, Fresno. He is known for his cross-cultural studies
involving staged experiments or unobtrusive observations. In this study (Levine & Norenzayan, 1999), he and Ara Norenzayan studied national differences in what they called “the pace of life” in 31 countries, extend-ing a previous study of smaller scope (Levine & Bartlett, 1984). They were interested in finding cultural differences in the speed of everyday activities and punctuality and attempted to explain their findings in terms of associations with external variables.
ROBERT LEVINE AND ARA NORENZAYAN (1999): A STUDY OF THE PACE OF LIFE
9.6

Cultural Dimensions Across Modern Nations ◆ 247
◆ Samples
The authors decided to collect their data from large cities in 31 countries. Their first cited reason for choosing large cities is that their work would have been more dif-ficult in small places. Also, they believed that large cities would be more appropri-ate for cross-cultural comparisons. The numbers of cases that were studied in each experiment are reported in the section on the experiment design.
◆ Hypothesized Dimensions
Previous studies cited in the article sug-gested that average walking speed, aver-age work speed among postal clerks, and average accuracy of bank clocks were highly correlated at the ecological level, for example, across 12 cities in six coun-tries where the measures were taken. The authors evidently expected that these three variables would form a single dimension, called “pace of life,” across the countries they studied.
It was hypothesized that the pace of life would be faster in larger cities with more vital economies, colder climates, and more individualist cultures. Economic vitality was measured in terms of national wealth (gross domestic product per person at pur-chasing power parity) as well as average caloric intake. It was also hypothesized that faster places would have higher rates of death from coronary heart disease, higher smoking rates, and greater subjec-tive well-being.
◆ Experiment Design
Nineteen students and cross-cultural psy-chologists collected the data. The descrip-tions of the methods for the measurement of the three variables that defined pace of
life (Levine & Norenzayan, 1999, p. 186) are provided below:
Walking speed . Male and female walk-ing speed over a distance of 60 feet was measured in at least two locations in main downtown areas in each city. Measurements were taken during main business hours on clear summer days.
All locations were flat, unobstructed, had broad sidewalks, and were suffi-ciently uncrowded to allow pedestrians to move at potentially maximum speeds. To control for the effects of socializing, only pedestrians walking alone were used. Children, individuals with obvious physical handicaps, and window-shop-pers were not timed. Thirty-five men and 35 women were timed in most cities.
Postal speed . As a sample of work speed, the time it took postal work-ers to complete a standard request for stamps was measured in each country. Postal clerks at randomly selected post offices in each city were handed a note (to minimize experimenter effects) in the native language, written by a native speaker, requesting one stamp of a commonly used small denomination. Along with this note, the clerk was given a denomination of paper currency that required change in both coins and paper. In the United States, for exam-ple, the clerk was handed a $5 bill with a request for one 32-cent stamp. The experimenter in each city was a neatly dressed native or native-appearing man or woman. The dependent measure was the time elapsed between the passing of the note and completion of the request. A minimum of eight postal clerks were approached in each city.
Clock accuracy . As a sample of con-cern with clock time, the accuracy of 15 clocks, in randomly selected down-town banks, were [ sic ] checked in each country. The criterion for the correct time was that reported by the telephone company.

248 ◆ Major Cross-Cultural Studies
◆ Statistical Analysis
The researchers calculated mean walking speed, postal worker speed, and clock accuracy for the 31 countries in their sam-ples. These indices are presented below.
Walking speed Ireland 11.13 Netherlands 11.45 Switzerland 11.80 England 12.00 Germany 12.01 United States 12.03 Japan 12.11 France 12.34 Kenya 12.58 Italy 12.75 Canada 12.86 Poland 12.90 Sweden 12.92 Greece, Hong Kong 13.10 Costa Rica 13.33 Mexico 13.56 Taiwan 13.58 Hungary 13.75 South Korea 13.76 Czech Republic 13.80 El Salvador 14.04 Austria 14.08 China 14.26 Singapore 14.75 Indonesia 14.82 Bulgaria 15.57 Jordan 15.79 Syria 15.95 Romania 16.72 Brazil 16.76 Postal [worker] speed Germany 13.46 Switzerland 16.91 Ireland 17.49 Japan 18.61 Sweden 19.10 Hong Kong 20.10 Taiwan 20.22 Austria 20.60 England 20.78
Costa Rica 21.13 Singapore 22.42 Italy 23.00 Greece 24.33 Netherlands 24.42 Poland 25.83 El Salvador 25.88 Czech Republic 27.73 France 27.84 Hungary 28.45 South Korea 29.75 Canada 30.50 Bulgaria 33.67 United States 36.99 Brazil 38.17 China 39.63 Indonesia 39.64 Jordan 39.92 Syria 40.02 Romania 42.25 Kenya 42.50 Mexico 70.00 Clock accuracy Switzerland 19.29 Italy 24.17 Austria 25.00 Singapore 32.00 Romania 32.46 Japan 35.00 Sweden 40.20 Germany, Poland 43.00 France 49.00 Ireland 51.42 China 51.82 England 53.72 Hong Kong 54.83 Costa Rica 55.38 South Korea 58.00 Bulgaria 60.00 Hungary 64.17 Jordan 66.16 United States 67.87 Taiwan 68.00 Canada 70.00 Czech Republic 76.07 Kenya 77.14 Netherlands 82.33 Mexico 92.31 Syria 94.52

Cultural Dimensions Across Modern Nations ◆ 249
Brazil 108.00 Greece 117.00 Indonesia 161.50 El Salvador 210.00
The authors reported that the three variables were weakly or moderately cor-related, and in one case (walking speed and clock accuracy) the correlation was statistically insignificant ( p < .09). They acknowledged that such low correlations may not warrant a merger of the three variables into a single dimension, yet they decided to calculate a single pace of life index by converting the reported scores into z-scores and then averaging them.
The authors’ analysis showed that all three variables, as well as the pace of life index that was extracted from them, were significantly correlated with most of the external variables in the study’s hypoth-eses. The highest correlations were with national wealth; thus, richer countries had faster-walking pedestrians, faster-working post office clerks, and more accurate pub-lic clocks. Their average pace of life was also faster. There was only one exception: Clock accuracy was more highly corre-lated with country climate (temperature) ( r = –.53**, n = 31) than with national wealth per person ( r = .48**, n = 30). There were no significant correlations with death rates from coronary heart dis-ease or population size.
◆ Additional Statistical Analysis
The highest correlations with available external variables are between walking speed and Minkov’s (2011) exclusionism index (see 9.24.): .69** ( n = 26), and between postal worker speed and the exclusionism index: .64**.
The walking speed measure (higher values mean slower speeds) is positively correlated with national death rates from
cardiovascular disease (World Health Organization, 2008b): r = .61**, n = 29. The postal worker speed measure is also positively correlated with that variable: r = .52**, n = 29. This means that coun-tries where people walk faster and work faster in post offices have lower, not higher, death rates from cardiovascular disease. This should not come as a sur-prise for two reasons. The rich countries, where walking speed and postal work is faster, have better health care systems that are better equipped to save lives from any disease. Also rich countries have higher subjective well-being. Minkov (2009b, Table 1) shows that measures of subjective well-being are significantly and negatively correlated with national death rates from cardiovascular disease even after control-ling for national wealth.
◆ Contributions
1. This is one of the rare cross-cultural studies that compare a relatively high number of countries on unobtrusively collected data.
2. The results demonstrate beyond any doubt that the speed of some activi-ties is higher in richer countries; also, those countries have more accurate clocks. This correlates with an anecdotally docu-mented observation: Punctuality in busi-ness and other domains is considered very important in Western environments but is often downplayed in developing countries.
◆ Food for Thought
1. The authors believed that large cities would be more appropriate than small towns or villages for the purpose of cross-cultural comparisons without pro-viding evidence that this is so. There is reason to believe that large cities in many

250 ◆ Major Cross-Cultural Studies
Western countries are very inappropriate for the study of national culture. Many of them have large proportions of uninte-grated immigrants who carry strong ele-ments of their original national culture. Also, high percentages of the pedestrians in the large European cities are tourists from other countries, which makes them inappropriate for a study of walking speed.
2. The results of the study are mean-ingfully correlated with external variables, suggesting that they have a degree of reli-ability. Still, it is questionable whether it is possible to measure walking speed in exactly the same way across different circumstances. How does one distinguish between people who are taking a leisurely walk and those who are in a hurry for a meeting?

◆ 251
◆ Introduction
Robert Levine, who was intro-duced previously, has presented another interesting cross-cultural study in association with two coauthors (Levine, Norenzayan, & Philbrick, 2001). This is a study of behaviors associated with help-ing strangers in public places. The behaviors were manipulated; therefore, the study had an element of obtrusive experimentation.
The authors formulated three main goals. Apart from the potential cross-cultural differ-ences in helping behavior that they could find, they were inter-ested in the structure of different helping behaviors. Do they cor-relate across cities or countries? In other words, if the people in a particular city have a tendency to exhibit a helping behavior in
a particular situation, do they also offer a different kind of help in a different situation? The third research question had to do with the determinants of cultural differences in helping. If people in some cultures have a greater tendency to help strangers, why is that so?
◆ Samples
The experiments took place in 23 large cities in 23 different countries. The logic of choos-ing large cities was explained as follows (Levine, Norenzayan, & Philbrick, 2001):
First, for practical reasons, the slow pedestrian flow of most small communities would have made it difficult to carry
ROBERT LEVINE, ARA NORENZAYAN, AND KAREN PHILBRICK (2001): A STUDY OF HELPING STRANGERS
9.7

252 ◆ Major Cross-Cultural Studies
out a wide range of field experiments. Second, although no single city repre-sents the entirety of a country, it was judged that the largest city in each country would be the most comparable for the purposes of making meaningful cross-national comparisons of helping behavior. Third, there is a strong inter-national population movement to large cities. (p. 544)
The subjects were selected randomly among pedestrians who walked alone; however, people who were obviously not in a position to help were excluded. In the first two experiments, the researchers approached approximately 210 to 250 men and a similar number of women. For the blind man experiments, the authors report “281 trials” (p. 548).
◆ Hypothesized Dimensions
No dimensions of national culture were hypothesized before the experiments and their analysis.
◆ Experiment Design
Below, the descriptions of the three experi-ment designs are reproduced from the article (p. 548):
Dropped pen . Walking at a carefully practiced, moderate pace (15 paces/10 seconds), experimenters walked toward a solitary pedestrian passing in the opposite direction. When 10 to 15 feet from the subject, the experi-menter reached into his pocket and accidentally, without appearing to notice, dropped his pen behind him, in full view of the subject, and contin-ued walking past the subject. A total of 214 men and 210 women were approached. Participants were scored as having helped if they called back to
the experimenter that he had dropped the pen and/or picked up the pen and brought it to the experimenter.
Hurt leg . Walking with a heavy limp and wearing a large and clearly visible leg brace, experimenters accidentally dropped and unsuccessfully struggled to reach down for a pile of magazines as they came within 20 feet of a pass-ing pedestrian. A total of 253 men and 240 women were approached. Helping was defined as offering help and/or beginning to help without offering.
Helping a blind person across the street . Experimenters, dressed in dark glasses and carrying white canes, acted the role of a blind person needing help getting across the street. …. Experimenters attempted to locate downtown corners with crosswalks, traffic signals, and moderate, steady pedestrian flow. They stepped up to the corner just before the light turned green, held out their cane, and waited until someone offered help. A trial was terminated after 60 seconds or when the light turned red, whichever occurred first, after which the experi-menter walked away from the corner. A total of 281 trials were conducted. Helping was scored if participants, at a minimum, informed the experimenter that the light was green.
◆ Results of the Experiments Experiments
Levine, Norenzayan, and Philbrick (2001) provide percentages of cases in each city in which helping behavior occurred (p. 551, Table 2). These are reproduced in their rank order:
Blind person Lilongwe (Malawi), Madrid, Prague, Rio de Janeiro, San Jose (Costa Rica) 100

Cultural Dimensions Across Modern Nations ◆ 253
Bucharest, Calcutta, Mexico City, San Salvador 92 Tel Aviv 83 Sofia 80 Rome, New York, Vienna 75 Budapest, Copenhagen 67 Shanghai 63 Amsterdam, Stockholm 58 Kuala Lumpur 54 Singapore, Taipei 50 Bangkok 42
Dropped pen Rio de Janeiro 100 Lilongue (Malawi) 93 Stockholm 92 Copenhagen, San Salvador 89 Vienna 88 San Jose (Costa Rica) 79 Budapest 76 Bangkok, Madrid, Shanghai 75 Sofia 69 Tel Aviv 67 Bucharest 66 Taipei 65 Calcutta 63 Mexico City, Prague 55 Amsterdam 54 Singapore 45 Rome 35 New York 31 Kuala Lumpur 26
Hurt leg San Jose (Costa Rica) 95 Calcutta 93 Shanghai 92 Mexico City, Rio de Janeiro, Rome, Vienna 80 Copenhagen 77 Budapest, Prague 70 Bangkok, Stockholm 66 Lilongue (Malawi) 65 Madrid 63 Taipei 62 Tel Aviv 54 Amsterdam, Singapore 49 Bucharest 48 San Salvador 43 Kuala Lumpur 41
New York 28 Sofia 22
◆ Statistical Analysis
Using conventional criteria, the three types of helping are weakly and insigni-ficantly correlated. Levine, Norenzayan, and Philbrick acknowledge that yet factor analyzed the three items to obtain a single factor that explained 52.4% of the vari-ance. The factor loadings were
Dropped pen .78 Hurt leg .73 Blind person .65
The authors merged the three items into a single dimension, called “helping index,” by adding up the z-scores for the three helping behaviors.
Across 22 cases, gross domestic product per person at purchasing power parity (GDP at PPP) in 1994 produced weak, yet signifi-cant, negative correlations with the helping index, help for the blind person, and help for the person who dropped the pen.
◆ Additional Statistical Analysis
A correlation analysis with GDP per per-son at PPP in 1999 (two years before the publication of the study) and GNI (gross national income) per person at PPP in 1999, using data from the World Bank Group (2009) and the UN Statistics Division (2009), yielded only insignificant and weak correlations (below ±.40) with the three indices.
The helping index is correlated at .65* ( n = 13) with the percentages of World Values Survey respondents who in 2005–2008 described themselves as very much like a person who likes to help people (item v84). Those percentages yield

254 ◆ Major Cross-Cultural Studies
statistically insignificant correlations with the three variables that define the helping index, yet they all exceed .40 and may reach statistical significance if data were available for more countries.
The highest correlation that any of the three helping variables produce is between helping the blind man and Minkov’s (2011) monumentalism index: .85** ( n = 12). Monumentalism (see 9.24.) is conceptual-ized as, among other things, a national mea-sure of self-enhancement and concern for a positive self-image, especially in public.
◆ Contributions
The study reports interesting data: help-ing behavior in public places in 23 cities in 23 countries. Experimental studies are a refreshing change from the tyranny of paper-and-pencil studies in cross-cultural research. It is very likely that the national differences in helping behavior that were found are somehow correlated with other cultural variables. We need more studies of this kind for a better understanding of the matter.
◆ Food for Thought
1. The large cities of some Western countries are the worst place for studying a national culture, not the best. Rome, Amsterdam, and New York have so many tourists and unintegrated immigrants who are not yet part of the local culture that what is observed on their central streets may have nothing to do with main-stream Italian, Dutch, or American cul-ture. In 2004, I asked randomly selected European-looking people in Amsterdam if they were Dutch. The first positive answer came from the seventh person.
2. The authors recognize that there may have been experimenter effects in their studies. Despite the training that the experimenters (usually students) had received, their acting may not have been completely standardized.
3. In the dropped pen experiment, there can never be an absolute guarantee that the targeted pedestrian has seen the pen.
4. Because the correlations between the three types of helping behavior are weakly and insignificantly correlated, they yield a weak alpha: .54. The scale they form and the factor they produce are weak. By conventional criteria, the merg-ing of the three items into a single dimen-sion is not justified.
5. The fact that the helping index correlates positively with the helping item in the World Values Survey shows a clear link between actual behaviors and self-descriptions. However—assuming that the helping index is reliable despite all pre-viously mentioned limitations—this does not answer the question of what is behind the observed national differences in help-ing behavior. Saying that people in some nations help more because they have a self-proclaimed tendency to help is simply tautology.
It is interesting that monumentalism is strongly correlated with helping the blind person, which occurred in the presence of a “moderate, steady pedestrian flow,” whereas the dropped pen experiment (and probably the hurt leg experiment) involved “a solitary pedestrian.” Monumentalism is not correlated with the percentages of people helping the person who dropped the pen or the person with the hurt leg, suggesting that helping in monumentalist cultures may occur primarily for the sake of being publicly admired.

◆ 255
◆ Introduction
Ashleigh Merritt is a business consultant, holding a doctorate in cross-cultural psychology. As the author of this study, she was interested in cross-cultural issues in aviation. Since pilots work in an international environment, an understanding of cross-cultural differences may be essential in the design of training programs for them. The author was famil-iar with Hofstede’s dimensions of national culture but was unsure if they would be replicated across national samples consisting of pilots. By the time of Merritt’s publication, Hofstede’s model had not been fully replicated in a peer-reviewed publication despite reports of such replica-tions in unpublished sources (for instance, Hoppe, 1990). Merritt
suspected that because pilots are “at the technological and modern-ized forefront of their country’s workforce,” often being trained overseas, they might “transcend national influences in favor of a universal standard of behavior” (Merritt, 2000, p. 284). This study is the main attempt at replicating Hofstede’s dimensions reported in a peer-reviewed publication.
◆ Samples
The author used data from nationally pure airlines: each owned, managed, and operated predominantly by people from one nation. She chose the pilots on the basis of the same crite-rion: only those whose nationality at birth matched the nationality of the airline they worked for.
ASHLEIGH MERRITT (2000): AN ATTEMPT TO REPLICATE HOFSTEDE’S FOUR DIMENSIONS
9.8

256 ◆ Major Cross-Cultural Studies
The data were collected mainly in the 1993–1997 period from 9,417 pilots at 26 airlines in 19 countries. The national samples were extremely uneven, ranging from 5,139 pilots (United States) to 39 pilots (Argentina). The pilots from British Hong Kong were Britons. All pilots in all samples were male.
◆ Hypothesized Dimensions
The author expected that, if the outcome of the study were positive, it would repli-cate Hofstede’s original four dimensions of national culture, derived from his study at the IBM corporation.
◆ Questionnaire Items
For the purpose of the study, 16 items were borrowed from Hofstede’s (1982) Values Survey Module. Work value items were scored on a five-point Likert scale, ranging from “of no importance to me” to “of utmost importance to me.” Items that measure beliefs were scored on the same scale, ranging from “strongly agree” to “strongly disagree.” However, as explained in the next section, not all items were used as prescribed by Hofstede.
◆ First Statistical Analysis
As a first step, two average scores were calculated for each item and for each country: (1) captains’ mean scores and (2) first and second officers’ mean scores. Then, these two average national scores were merged into a single one. For coun-tries represented by more than one airline, national means were first calculated on the basis of each airline, and then these
national means were averaged into a single mean for each score and for each country. The author believed that this was the best approximation of Hofstede’s method of equally weighting each occupational group within a country.
Some of the items in the Values Survey Module were deemed inappropriate for a study of pilots. For example, it was esti-mated that uncertainty avoidance could not be measured by asking the pilots how long they intended to work for their company because pilots do not normally switch airlines. To compensate for this and other seemingly irrelevant items, the author resorted to various transformations of Hofstede’s formulas for the calculation of the dimension indices.
Of note, the Values Survey Module formulas for the calculation of indices for Hofstede’s dimensions are not necessar-ily the same as those used in Hofstede’s (1980) classic study. The Values Survey Module was designed for a far broader application of Hofstede’s research para-digm than the original IBM questions would allow. Still, there is no guarantee that the Values Survey Module will work equally well for all samples, regardless of their occupation. Therefore, adaptations, such as those by Merritt, are permissible provided the nature of the dimensions is not compromised. To guarantee that this nature has been preserved, a researcher who adapts the Values Survey Module formulas should demonstrate, first, that each dimension’s index is defined by items that capture the original spirit of that same dimension and, second, that the defining items are strongly correlated with the dimension index. Unfortunately, this preliminary analysis is missing in Merritt’s work.
Merritt’s (2000, pp. 287, 291) indices for Hofstede’s dimensions, which were obtained using Hofstede’s formulas, are reproduced below. Note that there are several confusions in Merritt’s Table 2; the ranks and scores for some dimensions have erroneously switched places.

Cultural Dimensions Across Modern Nations ◆ 257
Power distance, using Hofstede’s formula Brazil 126 South Korea 105 Morocco 103 Mexico 101 Philippines 100 Malaysia 99 Taiwan 90 Argentina 88 Germany 84 Italy 72 Cyprus 63 Japan 61 British Hong Kong, Switzerland 59 United States 58 Ireland 54 South Africa 43 Australia 42 New Zealand 41 Masculinity, using Hofstede’s formula South Africa 4 Philippines –3 Argentina –6 Brazil, New Zealand –8 British Hong Kong –10 Australia, United States –12 Mexico –14 Ireland, Japan –15 Malaysia –17 Cyprus –21 Germany –34 South Korea –38 Morocco –40 Switzerland –41 Italy –45 Taiwan –51 Individualism, using Hofstede’s formula New Zealand 36 Switzerland 35 United States 32 Argentina, British Hong Kong, South Africa 31 Australia, Ireland 27 Japan, Mexico, Philippines 23 Germany, Morocco 21 Italy, Taiwan 18 Brazil 13 Cyprus 8
Malaysia 1 South Korea –5 Uncertainty avoidance, using Hofstede’s
formula South Korea 85 Taiwan 73 Morocco 66 Brazil 56 Cyprus 52 United States 51 Australia 47 Malaysia 43 Germany, Italy 42 Japan, Philippines 40 British Hong Kong 37 Argentina, Mexico 30 New Zealand 29 South Africa 25 Switzerland 22 Ireland 20
(Merritt, 2000, Tables 1 and 2, pp. 287, 291; used by permission)
◆ Second Statistical Analysis
After the application of the calculation formulas as prescribed by Hofstede, Merritt obtained the following correla-tions between Hofstede’s indices and her own: power distance .74**, individualism .67**, uncertainty avoidance .31, and masculinity .23. Obviously, this was not a good replication of Hofstede’s dimen-sions, as only power distance replicated very convincingly. Individualism repli-cated somewhat unconvincingly, whereas the remaining two were very far from Hofstede’s originals.
Merritt decided to try another approach. She looked for items that best predicted Hofstede’s indices, regardless of Hofstede’s prescriptions. In addition, she introduced another criterion: The items should form dimensions that cor-relate with each other more or less like Hofstede’s original ones. For example,

258 ◆ Major Cross-Cultural Studies
individualism and power distance should be negatively correlated (Merritt, 2000, p. 291).
Some of the items that Merritt selected in this way were from the Values Survey Module, whereas others were from a specially designed survey for the pilots. Merritt arrived at the following set of items (reproduced in a slightly paraphrased form from Merritt, 2000):
Individualism Percentage who preferred to work for a
consultative leader (versus an autocratic, directive, or consensus leader)
Importance of having sufficient time for personal and family life
Importance of having challenging tasks that provide a personal sense of satisfaction
Power distance Agreement that the first officer should
never assume command of the aircraft Percentage who preferred to work for a
consultative leader (reversely scored) Agreement that decision-making abil-
ity is as good in emergencies as in routine flights
Importance of having changing work routine with new unfamiliar tasks (reversely scored)
Agreement that personal problems can adversely affect performance (reversely scored)
Masculinity Importance of having challenging
tasks that provide a personal sense of satisfaction
Low frequency of feelings of nervous-ness or tenseness at work
Low frequency of subordinates being afraid to disagree with their superiors
Agreement that the organization’s rules should not be broken, even when the employee thinks it is best (reversely scored)
Agreement that written procedures are required for all in-flight situations (reversely scored)
Uncertainty avoidance Respondent will speak up if he per-
ceives a problem (reversely scored) Agreement that the captain should
encourage crew-member questions (reversely scored)
In abnormal situations, respondent relies on superiors to tell him what to do
Importance of finding the truth, the correct answer, the one solution
(Merritt, 2000, Table 3, p. 293; used by permission)
The exact procedure for the calcula-tion of the indices is not explained in the article, but it seems to involve some averaging technique. Merritt reports the following correlations between her indices after the second analysis and Hofstede’s original ones: individualism .96, power distance .87, masculinity .75, and uncer-tainty avoidance .68.
The dimension indices that Merritt (2000) obtained in the second analysis are reproduced below.
Power distance, after the second analysis Philippines 189 Brazil 104 Malaysia 84 Mexico 62 Taiwan 50 Morocco 48 Cyprus 30 Argentina 1 South Korea −6 Japan −13 Australia, United States −33 South Africa −43 Germany −46 Italy −54 New Zealand −59 Ireland −71 British Hong Kong −102 Switzerland −106 Masculinity, after the second analysis Ireland 108 New Zealand 71 United States 56

Cultural Dimensions Across Modern Nations ◆ 259
Japan 54 Australia 49 Mexico 47 Switzerland 45 South Africa 44 Italy 35 Germany 28 British Hong Kong 19 Argentina 2 Cyprus −24 Philippines −29 Malaysia −46 Brazil −82 Morocco −95 South Korea −132 Taiwan −150 Individualism, after the second analysis British Hong Kong 114 United States 104 Australia, New Zealand 99 Ireland 89 Italy 71 Switzerland 57 South Africa 38 Japan 25 Germany 2 Argentina −24 Cyprus −34 Philippines −54 Malaysia −76 Mexico −79 Taiwan −93 Brazil −98 Morocco −103 South Korea −138 Uncertainty avoidance, after the second analysis Japan 149 South Korea 129 Morocco 68 Brazil 62 Taiwan 56 Argentina 49 Mexico 29 Malaysia 23 Cyprus 13 Italy −8 Philippines −22
Switzerland −37 Germany −48 Australia −51 South Africa −56 United States −78 New Zealand −82 Ireland −90 British Hong Kong −103
(Merritt, 2000, Tables 1 and 2, pp. 287, 291; used by permission)
As we see from Table 4 in Merritt (2002), the second uncertainty avoidance index is more closely associated with Hofstede’s original individualism ( r = –.78**) than with his original uncertainty avoidance ( r = .67**). Also, Merritt’s second masculinity index is slightly more closely associated with Hofstede’s origi-nal individualism index ( r = –.77**) than with his original masculinity ( r = .75**). Further, there are strong correlations between some of Merritt’s second analysis dimensions, which should be independent: Masculinity and individualism correlate at .83** and are obviously the same dimen-sion despite being orthogonal in Hofstede. Uncertainty avoidance and individualism correlate at –.75**; these two measures are nearly the same dimension.
◆ Contributions
1. Attempts at replications of previ-ously reported dimensions, regardless of the results, are an important part of com-parative cultural analysis. Even if Merritt had not succeeded in replicating any of Hofstede’s dimensions, the negative result would have been interesting.
2. Merritt doubtlessly succeeded in replicating one of Hofstede’s dimensions: power distance. Although the face valid-ity of some of the power distance items in her second analysis is questionable (“Personal problems can adversely affect

260 ◆ Major Cross-Cultural Studies
performance”), the other items are clearly associated with the concept of power distance.
◆ Food for Thought
1. Merritt has not provided correla-tions between the items that she used and the dimension indices. Thus, we do not know whether the selected items for the measurement of a particular dimension do in fact form a reliable dimension. In any event, constructing a dimension across only 19 countries is a risky exercise that may not be susceptible to replication.
2. Merritt’s claim that her second analysis replicated masculinity and uncer-tainty avoidance is incorrect. She obvi-ously did not replicate these dimensions but obtained facets of individualism versus collectivism.
3. Merritt’s second analysis involves an interesting approach to the replication of dimensions of national culture: iden-tifying items that are highly correlated with the dimension that is to be replicated despite a partial or complete lack of face validity. In Section 7.5., it is argued that face validity need not be a very strong con-cern when the analysis is at the national level because there are other ways to validate a dimension. However, two of
the items Merritt identified as measures of masculinity (frequency of nervousness and tenseness at work; agreement that rules should not be broken) were actually used by Hofstede to measure uncertainty avoidance, not masculinity. On the other hand, Merritt’s masculinity appears to be a measure of individualism. This raises the question of what is actually measured by the nervousness item and by agreement that rules should not be broken.
4. As with all comparative work-related studies, Merritt’s brings up the question of the extent to which such studies can be used to compare general cultural traits across nations. There is always a possibility that answers to items that address work-related issues will be affected not only by the respondents’ national culture but also by their profes-sion, position, and sector of the economy in which they work. This will also be the case when the samples are nationally representative: A predominantly agrarian nation will produce different answers in comparison to a predominantly indus-trial nation. But when the samples are nationally representative, they will paint only one picture per country. When the samples are matched by profession, and the dimensions of national culture that emerge from the answers of the accoun-tants are not the same as the dimensions that emerge from the answers of the pilots, which dimensions should we adopt?

◆ 261
◆ Introduction
American political scientist Ronald Inglehart, the director of the World Values Survey, has published a number of books and articles, alone or in coauthorship with associates, in which he ana-lyzes data from the World Values Survey. What follows is a discus-sion of one of his key publications, written together with Inglehart’s colleague Wayne Baker.
Inglehart and Baker’s (2000) publication was not intended for cross-cultural psychologists. Unlike some of the previously discussed projects, it was neither inspired by Hofstede’s model nor associated with his work in any way. In fact, that model and the studies that have been presented so far are not even mentioned by Inglehart and Baker. Their interest
was in a domain that is very dif-ferent from that of the cross-cultural psychologists. Inglehart and Baker focused on the relation-ship between economic develop-ment and cultural change that, according to Karl Marx, are in a cause-and-effect relationship. The two authors decided to test this hypothesis by analyzing the nationally representative World Values Survey. By the time of Inglehart and Baker’s analysis, surveys had been carried out in 65 countries. In most of them, the data used were from 1995–1998. The analysis was actually a repli-cation of previous work done by Inglehart and based on 43 societ-ies covered by the World Values Survey in 1990–1991. Although 43 cases is a respectable num-ber for a cross-cultural survey, the countries in the 1990–1991 study were predominantly rich
RONALD INGLEHART AND WAYNE BAKER (2000): AN ANALYSIS OF THE WORLD VALUES SURVEY
9.9

262 ◆ Major Cross-Cultural Studies
or European. Because the world outside Europe was severely underrepresented, it was natural to repeat the analysis with a larger sample that adequately represented all continents.
◆ Samples
The samples were nationally representa-tive, selected by local research agencies. Altogether, data from 65 countries were used.
◆ Hypothesized Dimensions of National Culture
The authors built on Inglehart’s previous work, and their choice of items suggests that they expected to replicate the two dimensions that he had extracted from a smaller sample of countries: traditional versus secular-rational values and survival versus self-expression values.
◆ Questionnaire Items
The World Values Survey is a huge data-base, with items covering many aspects of national culture. Inglehart and Baker selected particular items that were expected to confirm two hypothesized dimensions of national culture. These items are described next.
◆ Statistical Analysis
Inglehart and Baker’s analysis confirmed the two dimensions, previously reported by Inglehart, almost perfectly. They were extracted through a factor analysis of 10 variables aggregated to the national level.
This was an ecological factor analysis, sim-ilar to that employed by Hofstede (1980) and the Chinese Culture Connection (1987).
The first factor was defined by four items and a composite index. The four items, all of which were positively corre-lated with the factor, were importance of God in the respondent’s life, rejection of abortion, national pride, and agreement that there is a need for greater respect for authority in the respondent’s society. The composite index, also positively correlated with the factor, was the importance of obedience and religious faith as values for children versus the importance of inde-pendence and determination/perseverance as values for children. All factor loadings were high, ranging from .91 for impor-tance of God, to .72 for endorsement of greater respect for authority.
Of note, these items have very different scale formats. Instead of plotting them on a single scale, Inglehart and Baker preferred to use the percentages that had chosen the positive extreme of the scale: God is very important (position 10 on a scale of 1 to 10), very proud to be a citizen of one’s country (position 1 on a scale of 1 to 4), and so forth.
This first factor was labeled “tradi-tional values versus secular-rational val-ues.” Although the authors recognized the existence of different traditions across societies, they noticed that a number of common traits of preindustrial societies were captured by this factor and its nomo-logical network. Some of these are a low level of tolerance for abortion, suicide, euthanasia, divorce, and homosexuality. These societies also tend to emphasize male dominance in political life, deference to parental authority, and the importance of family life. It is important to make one’s parents proud and love them regard-less of their potential deficiencies. Parents must do their best for their children rather than have a life of their own. Large fami-lies are the norm. Further, Inglehart and Baker indicate that these societies are

Cultural Dimensions Across Modern Nations ◆ 263
relatively authoritarian and have high lev-els of national pride. They feel that envi-ronment problems can be solved without international agreements and wish to be protected from foreign trade. Politics is not a frequent subject of discussion. Also, most of them are very religious and tend to see a clear line between good and evil. None of these characteristics appear to the same extent in highly industrialized societies.
The second factor was also defined by five items. Four of these were simple items: low subjective well-being (unhap-piness), political inertia (respondent has not signed and would not sign a petition), rejection of homosexuality, and mistrust of people. One item was a composite four-item index, measuring the respondents’ prioritization of economic and physical security over self-expression and quality of life. Four of the items had high factor loadings, ranging between .81 for the composite index and .78 for rejection of homosexuality. Yet, the trust item loaded only .56.
These items also have diverse scale formats. Interestingly, Inglehart and Baker used an inconsistent approach to the scor-ing of those that were answered on a four-point Likert scale. For some of them, they chose to use the percentages of respon-dents who had selected an extreme on the scale, but for the subjective well-being item, they chose one of the two middle positions: percentages who had indicated that they were not very happy.
The second factor was called “survival values versus self-expression values.” It is described by Inglehart and Baker as reflecting national differences in trust, tolerance, subjective well-being, political activism, and various measures of self-expression. All of these are stronger in postindustrial societies with high levels of social security. At the opposite extreme are the developing countries, and par-ticularly those of the former Soviet bloc, where people are far less happy and satisfied with their lives. They wish for
economic and physical security and have low levels of tolerance for people who are different from them, such as foreigners and various minorities. Being interested in political issues, Inglehart and Baker also found that differences in various political outlooks could be predicted on the basis of this dimension. People in societies where self-expression values are important wish for greater participation in economic and political life. Such participation, together with an emphasis on the quality of life, can in fact be viewed as the essence of self-expression.
An important feature of Inglehart and Baker’s work is that they drew a cultural map of the world based on their two dimensions and attempted to explain the country positions on it. One easy obser-vation was that the rich countries were grouped in one of the corners of the map, whereas the poorest ones were in the opposite corner. The clear conclusion from this observation is that as countries get rich their cultures tend to become more secular and more self-expressive.
Another observation made by Inglehart and Baker was that societies with a high percentage of agricultural workers were near the bottom of the map, whereas those with a high percentage of industrial workers were near the top. Thus, the type of subsistence in a particular society was found to predict its position on the map.
Inglehart and Baker identified another factor that determines a country’s posi-tion on their cultural map: its “cultural heritage” (2000, p. 31). This term is not explained but it seems to refer to predomi-nant political and other ideologies: the East Asian societies are called “Confucian” by the two authors, whereas the Eastern European ones are “former Communist.”
Another interesting feature in Inglehart and Baker’s analysis is that they attempted to form cultural clusters of countries on the cultural map of the world, defined by their two dimensions. They deliberately and explicitly preferred to use Samuel Huntington’s impressionistic classification

264 ◆ Major Cross-Cultural Studies
of civilizations rather than statistical clus-tering techniques (Inglehart & Baker, 2000, p. 28, note 6). Addressing the ques-tion of whether the civilization boundaries proposed by Huntington are real, they note that these could have been drawn in a variety of other ways. For instance, East Germany and Japan are very close together on the cultural map and could be classified as having very similar cultures in terms of Inglehart and Baker’s dimensions. Still, the authors were of the opinion that despite such “anomalies,” countries with a shared cultural heritage do fall into the same cluster.
Inglehart and Baker saw another pow-erful source of cultural influence: reli-gious institutions. They noted that coun-tries with a Protestant tradition had more interpersonal trust than countries with a Catholic tradition, even after controlling for national wealth, and ascribed this dif-ference to the legacy of the “once powerful Catholic or Protestant institutions” (2000, p. 36) that still persists.
Inglehart and Baker (2000) did not pro-vide national indices for the two dimen-sions, but such indices are available in Inglehart and Welzel (2005a, 2005b) and other publications. Updated national indi-ces are reproduced below as they appear in Inglehart (2009), published on the offi-cial website of the World Values Survey. Only the latest indices have been selected: those from 2004–2008. They are repro-duced with the kind permission of Ronald Inglehart, their copyright owner. 1 All indi-ces have been multiplied by 100.
Secular-rational versus traditional values Japan 196 Sweden 186 East Germany 146 Norway 139 West Germany 131 Hong Kong 120 Bulgaria 113 Finland 82 Andorra, China 80 Switzerland 74
Slovenia 73 Netherlands 71 France 63 South Korea 61 Russia 49 Moldova 47 Serbia 35 Ukraine 30 Australia 21 Italy 13 Spain 9 United Kingdom 6 New Zealand 0 Canada –26 Vietnam –30 India –36 Uruguay –37 Romania –39 Iraq –40 Indonesia –47 Cyprus –56 Thailand –64 Ethiopia –65 Argentina –66 Malaysia –73 Zambia –77 Poland –78 United States –81 Chile –87 Turkey –89 Brazil –98 South Africa –109 Mali –125 Burkina Faso, Morocco –132 Mexico –147 Rwanda –157 Guatemala –170 Colombia –187 Ghana –194
Self-expression versus survival values Sweden 235 Norway 217 Canada 191 Switzerland 190 New Zealand 186 United States 176 Australia 175 United Kingdom 168 Andorra 162

Cultural Dimensions Across Modern Nations ◆ 265
Netherlands 139 France 113 Finland 112 Mexico 103 Uruguay 99 West Germany 74 Brazil 61 Colombia, Italy 60 Spain 54 Argentina 38 Slovenia 36 East Germany 26 Cyprus 13 Malaysia 9 Thailand 1 Chile 0 Japan –5 Mali –8 South Africa –10 Poland –14 Guatemala –17 India –21 Trinidad, Vietnam –26 Turkey –33 Ethiopia –36 Burkina Faso –49 Rwanda, Serbia, Zambia –62 Indonesia –80 Ukraine –83 Hong Kong –98 Bulgaria –101 Morocco –104 China –116 Taiwan –118 Moldova –128 South Korea –137 Russia –142 Romania –155 Iraq –168
(Inglehart, 2009, Table 1, p. 709; used with the kind permission of Ronald Inglehart)
◆ Additional Statistical Analysis
One of the most interesting questions asso-ciated with Inglehart’s two dimensions is
how they relate to other dimensions of national culture. For that purpose, it is appropriate to use the dimension indices in Inglehart and Welzel (2005a) among the many available. 2 Note that the tradi-tional versus secular-rational dimension is inversely scored in that publication. This means that it should be called “secular-rational versus traditional values” because a higher score indicates stronger secular-ism and lower traditionalism.
Starting with Hofstede’s dimensions, both of Inglehart’s correlate significantly with individualism across 36 common cases. This correlation is .81** for the self-expression dimension and .50** for the secular-rational versus traditional dimen-sion. Similarly, both of Inglehart’s dimen-sions correlate significantly with integra-tion in the Chinese Culture Connection (1987) across 16 common cases: .66** and .72**, respectively.
These correlations suggest that indi-vidualism and integration effectively merge Inglehart’s two dimensions into one. The alternative view is that Inglehart’s method has split the indi-vidualism dimension (or the integration dimension) into two unrelated dimen-sions. The result of that split is one dimension (self-expression values) that is still a close replication of individual-ism and integration, and another one (secular-rational values) that is some-what distinct from individualism despite retaining some communality with it.
Secular-rational values correlate with Confucian work dynamism at .62** ( n = 17, after adding China’s Confucian work dynamism score, provided additionally by Michael Bond to Geert Hofstede). Although the conceptual link is not imme-diately clear, it is possible to establish an association between the two (see 9.24.).
Interestingly, secular-rational values are not significantly correlated with Schwartz’s conservatism ( r = .21, p = .27, n = 20) but produce a moderate correlation with intel-lectual autonomy: .46*. Self-expression values correlate significantly with several
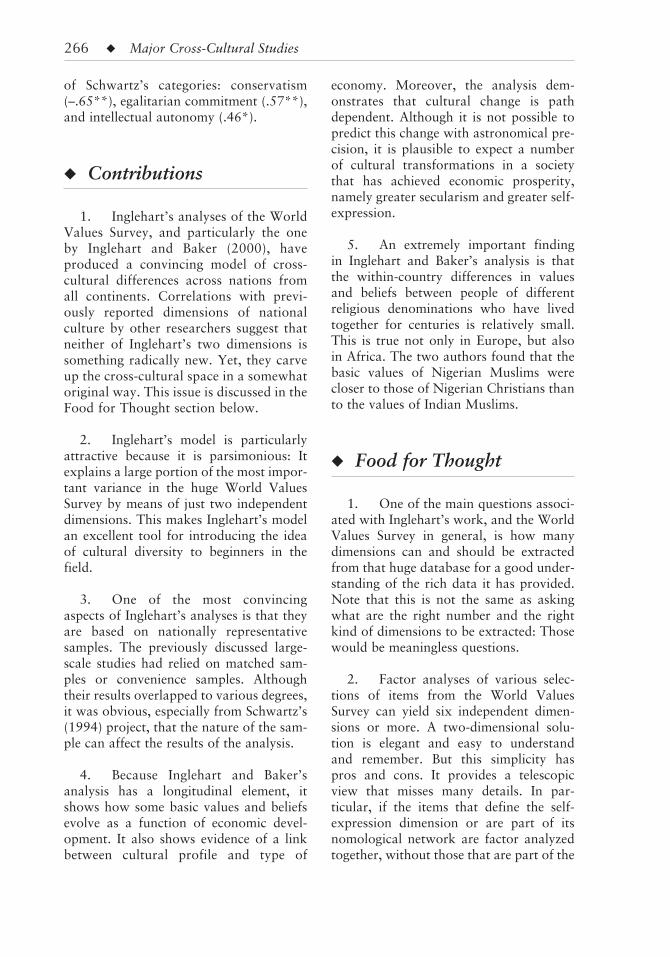
266 ◆ Major Cross-Cultural Studies
of Schwartz’s categories: conservatism (–.65**), egalitarian commitment (.57**), and intellectual autonomy (.46*).
◆ Contributions
1. Inglehart’s analyses of the World Values Survey, and particularly the one by Inglehart and Baker (2000), have produced a convincing model of cross-cultural differences across nations from all continents. Correlations with previ-ously reported dimensions of national culture by other researchers suggest that neither of Inglehart’s two dimensions is something radically new. Yet, they carve up the cross-cultural space in a somewhat original way. This issue is discussed in the Food for Thought section below.
2. Inglehart’s model is particularly attractive because it is parsimonious: It explains a large portion of the most impor-tant variance in the huge World Values Survey by means of just two independent dimensions. This makes Inglehart’s model an excellent tool for introducing the idea of cultural diversity to beginners in the field.
3. One of the most convincing aspects of Inglehart’s analyses is that they are based on nationally representative samples. The previously discussed large-scale studies had relied on matched sam-ples or convenience samples. Although their results overlapped to various degrees, it was obvious, especially from Schwartz’s (1994) project, that the nature of the sam-ple can affect the results of the analysis.
4. Because Inglehart and Baker’s analysis has a longitudinal element, it shows how some basic values and beliefs evolve as a function of economic devel-opment. It also shows evidence of a link between cultural profile and type of
economy. Moreover, the analysis dem-onstrates that cultural change is path dependent. Although it is not possible to predict this change with astronomical pre-cision, it is plausible to expect a number of cultural transformations in a society that has achieved economic prosperity, namely greater secularism and greater self- expression.
5. An extremely important finding in Inglehart and Baker’s analysis is that the within-country differences in values and beliefs between people of different religious denominations who have lived together for centuries is relatively small. This is true not only in Europe, but also in Africa. The two authors found that the basic values of Nigerian Muslims were closer to those of Nigerian Christians than to the values of Indian Muslims.
◆ Food for Thought
1. One of the main questions associ-ated with Inglehart’s work, and the World Values Survey in general, is how many dimensions can and should be extracted from that huge database for a good under-standing of the rich data it has provided. Note that this is not the same as asking what are the right number and the right kind of dimensions to be extracted: Those would be meaningless questions.
2. Factor analyses of various selec-tions of items from the World Values Survey can yield six independent dimen-sions or more. A two-dimensional solu-tion is elegant and easy to understand and remember. But this simplicity has pros and cons. It provides a telescopic view that misses many details. In par-ticular, if the items that define the self-expression dimension or are part of its nomological network are factor analyzed together, without those that are part of the

Cultural Dimensions Across Modern Nations ◆ 267
tradition-secularism continuum, the result would be two independent factors, one of which would group the subjective well-being items and their closest correlates (perceived life control and importance of leisure), whereas the items that have to do with in-group and out-group relationships (views on whether children should grow up in a family with two parents, whether women should have children to be ful-filled, importance of tolerance and respect for others, etc.) would form a different fac-tor. The second factor would be strongly associated with Hofstede’s individualism, the Chinese Culture Connection’s integra-tion, and other similar constructs. It is interesting that Inglehart and Baker have chosen not to extract such a factor, despite knowing that the individualism versus col-lectivism dimension was already viewed as one of the most important yields of cross-cultural research (Smith et al., 1996).
Further, the self-expression dimension is defined by a trust-measuring item with a low loading on the second factor. An item with such a low loading can exhibit vagrancy: In a factor analysis with other items, it may gravitate toward a different factor.
3. Inglehart and Baker believe that religious institutions can influence culture and economic growth: “Protestant reli-gious institutions gave rise to the Protestant Ethic, relatively high interpersonal trust, and a relatively high degree of social pluralism—all of which may have con-tributed to earlier economic development in Protestant countries than in the rest of the world” (2000, pp. 37–38). In this way,
they echo Max Weber’s view expressed in his famous work The Protestant Ethic and the Spirit of Capitalism (Weber, 1930), according to which religion can have a serious impact on other elements of cul-ture, including values. How is this to be reconciled with the observation that peo-ple who have followed different religions in the same country have a very similar cultural profile, and with the finding that peoples who belong to the same religious denomination, but live in different coun-tries, can be culturally distinct?
■ Notes
1. There are some discrepancies between Inglehart (2009) and the World Values Survey website concerning the period in which some countries were studied. As the World Values Survey website provides exact years (whereas Inglehart provides approximate periods), the more precise information in the website was preferred in this book for the reproduction of the scores of the countries that were studied between 2004 and 2008.
2. The indices in Inglehart and Welzel (2005a) are preferable for a validation of Inglehart’s dimensions as they are based on a period from which many other studies are available; this makes comparisons easier to jus-tify. However, the indices for Inglehart’s dimen-sions that are reproduced here are strongly correlated with those in Inglehart and Welzel and yield very similar correlations with all external variables. These latest indices will be more appropriate for comparisons with cross- cultural measures published from now on.

268 ◆
◆ Introduction
Ulrich Schimmack, Shigeiro Oishi, and Ed Diener are renowned experts in emotions and subjective well-being. They were interested in finding out if the frequency of the experience of pleasant emo-tions would be negatively cor-related with the frequency of the experience of unpleasant emo-tions. To put it more simply, if a person has felt a lot of happiness recently, does that mean that the same person has not felt much grief in the same period? The answer to this question is not at all as obvious as it may seem. As
the results of their study showed (Schimmack et al., 2002), such a correlation may or may not mate-rialize, depending on the national or ethnic culture of the partici-pants in the study.
At first glance, the practical utility of this kind of study to the student of cross-cultural differ-ences is not as obvious as that of a study of values and beliefs. In fact, if people in some societies dissociate positive and negative emotions to the extent that they can occur independently of each other, that would be a sign of personal dialecticism: an ability to reconcile seeming contradic-tions, such as being happy and
ULRICH SCHIMMACK, SHIGEIRO OISHI, AND ED DIENER (2002): A STUDY OF PERSONAL EMOTIONAL DIALECTICISM AND FREQUENCIES OF PLEASANT AND UNPLEASANT EMOTIONS
9.10
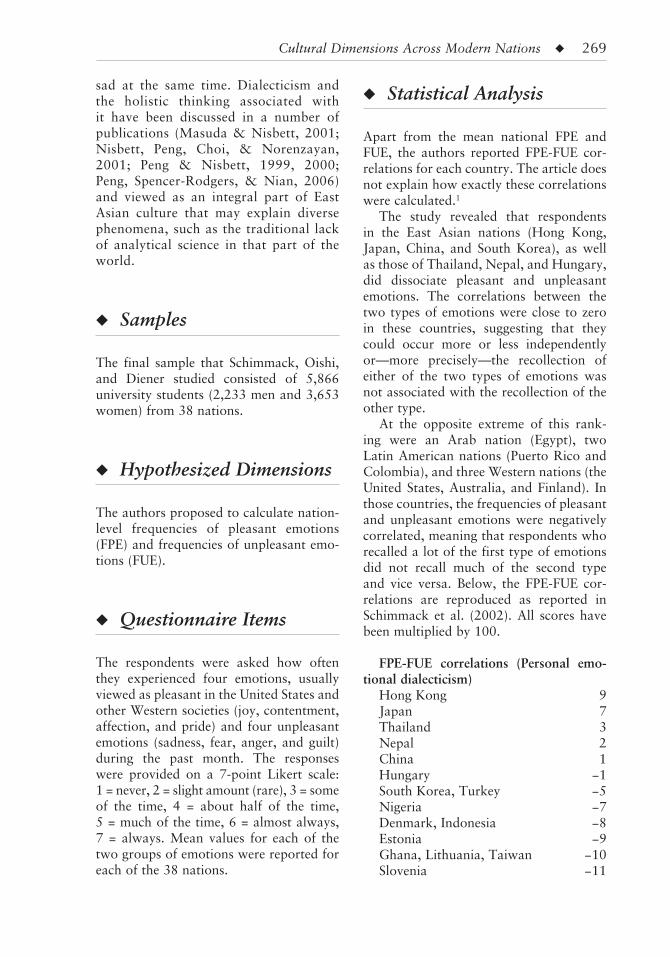
Cultural Dimensions Across Modern Nations ◆ 269
sad at the same time. Dialecticism and the holistic thinking associated with it have been discussed in a number of publications (Masuda & Nisbett, 2001; Nisbett, Peng, Choi, & Norenzayan, 2001; Peng & Nisbett, 1999, 2000; Peng, Spencer-Rodgers, & Nian, 2006) and viewed as an integral part of East Asian culture that may explain diverse phenomena, such as the traditional lack of analytical science in that part of the world.
◆ Samples
The final sample that Schimmack, Oishi, and Diener studied consisted of 5,866 university students (2,233 men and 3,653 women) from 38 nations.
◆ Hypothesized Dimensions
The authors proposed to calculate nation-level frequencies of pleasant emotions (FPE) and frequencies of unpleasant emo-tions (FUE).
◆ Questionnaire Items
The respondents were asked how often they experienced four emotions, usually viewed as pleasant in the United States and other Western societies (joy, contentment, affection, and pride) and four unpleasant emotions (sadness, fear, anger, and guilt) during the past month. The responses were provided on a 7-point Likert scale: 1 = never, 2 = slight amount (rare), 3 = some of the time, 4 = about half of the time, 5 = much of the time, 6 = almost always, 7 = always. Mean values for each of the two groups of emotions were reported for each of the 38 nations.
◆ Statistical Analysis
Apart from the mean national FPE and FUE, the authors reported FPE-FUE cor-relations for each country. The article does not explain how exactly these correlations were calculated. 1
The study revealed that respondents in the East Asian nations (Hong Kong, Japan, China, and South Korea), as well as those of Thailand, Nepal, and Hungary, did dissociate pleasant and unpleasant emotions. The correlations between the two types of emotions were close to zero in these countries, suggesting that they could occur more or less independently or—more precisely—the recollection of either of the two types of emotions was not associated with the recollection of the other type.
At the opposite extreme of this rank-ing were an Arab nation (Egypt), two Latin American nations (Puerto Rico and Colombia), and three Western nations (the United States, Australia, and Finland). In those countries, the frequencies of pleasant and unpleasant emotions were negatively correlated, meaning that respondents who recalled a lot of the first type of emotions did not recall much of the second type and vice versa. Below, the FPE-FUE cor-relations are reproduced as reported in Schimmack et al. (2002). All scores have been multiplied by 100.
FPE-FUE correlations (Personal emo-tional dialecticism)
Hong Kong 9 Japan 7 Thailand 3 Nepal 2 China 1 Hungary −1 South Korea, Turkey −5 Nigeria −7 Denmark, Indonesia −8 Estonia −9 Ghana, Lithuania, Taiwan −10 Slovenia −11

270 ◆ Major Cross-Cultural Studies
Greece, Zimbabwe −12 Italy −16 Brazil, India −17 Austria, Singapore −20 Norway −24 Argentina −28 South Africa, Spain −29 Bahrain −30 Germany, Netherlands, Pakistan −31 Peru −33 Colombia, Finland, United States −36 Australia −37 Puerto Rico −39 Egypt −49
(Schimmack, Oishi, & Diener, 2002, Table 1, p. 709; used by permission)
The authors admitted that different explanations of their findings were pos-sible. It is plausible that Asian dialecti-cism enables individuals to recognize the pleasant and unpleasant aspects of an event, which can result in mixed feelings. Another explanation would be that cul-ture influences emotional memories: “It is possible that a dialectic way of think-ing maintains pleasant and unpleasant aspects of emotional experiences, whereas Western styles of thinking attempt to resolve the conflict one way or the other” (p. 715). Differences in frequency judg-ments were also mentioned as a potential explanation.
The authors found that the national personal dialecticism index that they obtained (FPE-FUE correlations) could not be explained as a function of national differences in individualism versus collec-tivism. In fact, the least dialectical nation was Egypt, which is also highly collectivist in the sense of Hofstede’s collectivism.
◆ Contributions
1. This is the only available study of any form of personal dialecticism across a large number of nations.
2. The fact that national differences in personal dialecticism are not associated with individualism versus collectivism is an important finding.
◆ Food for Thought
1. The national FPE-FUE corre-lations are highly correlated with the Chinese Culture Connection’s (1987) Confucian work dynamism across 16 common cases at .68**. It is not imme-diately clear how this high correlation should be interpreted.
2. The reported alpha values for the scales that the FPE and the FUE form in some countries are very low. The lowest of these is the FPE alpha in Nepal: .28. This means that in quite a few countries, the four pleasant emotions chosen by Schimmack, Oishi, and Diener do not form a reliable scale and calculating a mean value for them is a highly question-able method. The same is true of the scales formed by the FUE.
3. The national means of the FPE and FUE produce modest or weak and insignificant correlations with measures of happiness and life satisfaction in the World Values Survey.
4. Schimmack et al. (2002) believe that the cultural effect that they observed may be related to Buddhism. It is true that the classic Buddhist texts of the Ti Pitaka canon, composed approximately 200–400 BC, abound in dialectical statements, such as the possibility that something may be true and untrue at the same time or neither true nor untrue. But the logical question that this brings up is whether Buddhism created this dialectical thinking or is the result of it. The second possibility is more plausible. In 2.6.3., it is argued that differ-ences in cultural values do not stem from differences in religious or philosophical denomination. There is also no reason to

Cultural Dimensions Across Modern Nations ◆ 271
assume that denominations can create dif-ferences in dialectical thinking and feeling.
■ Note
1. Presumably, mean FPE and mean FUE scores were calculated for each respondent in
each country. Then the in-country correlations between these two means were calculated sepa-rately across the respondents in each country.

272 ◆
◆ Introduction
The main large-scale cross-cultural studies of Peter Smith and Shalom Schwartz are discussed in 9.3., 9.4., and 9.5. In the early 2000s, they teamed up with American cross-cultural management profes-sor and internationally renowned expert Mark Peterson for a study of the sources of guidance that are typical of managers in 61 societies (Peterson & Smith, 2008; Smith, Peterson, & Schwartz, 2002). The researchers were interested in the relationships between cultural values and these sources of guid-ance—an underexplored topic until then. A better understanding of this topic might shed light on the relationship between values and actual behaviors. If values
account for sources of guidance and sources of guidance influence actual behaviors, there is a lot to be learned from a study of these relationships. In particular, the results of this type of study could be used for practical purposes in international management.
◆ Samples
Peterson and Smith (2008) pro-vide data for 61 societies. These were mostly different nations, but some were different racial and cultural groups within a given country, such as White and Black South Africans. The respondents were middle managers. The aver-age size of the samples from each country was 103, ranging from
PETER SMITH, MARK PETERSON, AND SHALOM SCHWARTZ (2002): A STUDY OF MANAGERS’ SOURCES OF GUIDANCE
9.11

Cultural Dimensions Across Modern Nations ◆ 273
38 in the Philippines to 342 in the United States. The respondents came from a variety of organizations, industries, and departments.
◆ Hypothesized Dimensions
The researchers did not expect to find any preconceived dimensions.
◆ Questionnaire Items
The respondents were presented with descriptions of eight events:
(a) a vacancy arises that requires appointment of a new subordinate in your department
(b) one of your subordinates does con-sistently good work
(c) one of your subordinates does con-sistently poor work
(d) some of the equipment or machinery in your department seems to need replacement
(e) another department does not pro-vide the resources or support you require
(f) there are different opinions within your department
(g) you see the need to introduce new work procedures into your department
(h) the time comes to evaluate the suc-cess of new work procedures
(Smith, Peterson, & Schwartz, 2002, p. 194; used by permission)
The respondents were asked to indicate to what extent the action taken in each of these cases would be affected by various sources of guidance. The answers were given on a five-point scale, ranging from
“to a very great extent” to “not at all.” The authors note that they deliberately avoided the active voice, which would amount to “asking how much the manager uses each source” (Smith et al., 2002, p. 194). The use of the passive voice was explained as follows: “This phrasing implies that other sources may be equally as active as the responding manager in determining how events are handled” (p. 194).
The respondents were presented with a choice of eight sources of guidance for each of the eight events:
(a) formal rules and procedures
(b) unwritten rules as to “how things are usually done around here”
(c) my subordinates
(d) specialists outside my department
(e) other people at my level
(f) my superior
(g) opinions based on my own experi-ence and training
(h) beliefs that are widely accepted in my country as to what is right
(Smith, Peterson, & Schwartz, 2002, p. 195; used by permission)
This adds up to 64 items: 8 events x 8 sources of guidance.
◆ Statistical Analysis
Given the complexity of what was mea-sured, the analysis was also complex. As some details are omitted in the publica-tion, a detailed report of that analysis can-not be provided. Briefly, individual-level means for guidance sources were aggre-gated to the country level (p. 198), pro-ducing eight national indices. They reflect the likelihood that a particular source of guidance would be used in a particular nation across the eight events.

274 ◆ Major Cross-Cultural Studies
An analysis of the correlations between the eight nation-level variables indicated that four of them could be merged into a single dimension, called “verticality.” It reflects reliance on formal rules, on one’s superior, on one’s own experience (reversed), and on one’s subordinates (reversed). The remaining four nation-level variables did not warrant any mergers.
Following Mark Peterson’s personal advice, the indices reproduced below are as reported in Peterson and Smith (2008).
The verticality index is not reproduced.
Formal rules Zimbabwe 76 Indonesia 64 Qatar 61 Uganda 60 Taiwan 58 Kenya 56 Malaysia, Nigeria 55 Jamaica 51 Barbados 48 Australia 47 South Africa (Black) 46 Hong Kong 45 Greece 44 Brazil 42 Portugal 41 Tanzania 39 Japan, Saudi Arabia, Sweden 38 Bulgaria, Pakistan, Philippines, Singapore 37 China 36 Chile, Sri Lanka 34 India, Lebanon, Macao 33 Mexico 30 Spain 29 Poland, South Korea 27 New Zealand, United States 26 Romania 24 Canada, Israel 22 South Africa (White) 21 Iran, United Kingdom 18 Russia, Thailand 17 Colombia 15 Norway, Turkey 12 Italy 11 Czech Republic 10 Austria, France 05
Slovakia 01 Germany, Ukraine –04 Netherlands –05 Belarus –07 Argentina –08 Denmark –10 Iceland –27 Hungary –32 Finland –59 Unwritten rules Philippines 33 South Korea 32 Israel 23 Hong Kong, Portugal, Singapore 22 France, Turkey 18 Saudi Arabia 17 Macao 16 Iran 10 Sri Lanka 09 Australia, Canada, Pakistan 07 Finland, Indonesia, Netherlands, New Zealand 06 Argentina, Jamaica 05 Brazil, Mexico, Slovakia 04 Lebanon 03 Greece, United States 02 Iceland 01 India 00 Spain –01 Barbados –02 Austria, South Africa (White) –04 Malaysia –05 United Kingdom –07 Colombia, Denmark –08 Chile –10 Bulgaria, South Africa (Black) –11 Nigeria, Qatar –13 Zimbabwe –18 Belarus –20 Uganda, Ukraine –21 Russia –22 Japan –23 Italy –24 Sweden –27 China –28 Germany, Norway –29 Czech Republic, Hungary, Tanzania –32 Kenya –33

Cultural Dimensions Across Modern Nations ◆ 275
Romania –42 Thailand –44 Poland –54 Taiwan –60 Subordinates Denmark 62 Thailand 37 Germany 36 Finland, Netherlands 34 Hungary 26 Qatar 18 Norway 16 Sweden 13 Italy 12 Saudi Arabia 11 Austria 08 Colombia, France 05 Czech Republic, Japan, Lebanon 01 Canada –03 Sri Lanka –04 Russia –05 Belarus, Ukraine, United Kingdom –06 Argentina, India, Israel –07 Iceland –08 Tanzania –09 United States –10 Macao –11 New Zealand, Nigeria –12 Malaysia, Slovakia –14 Singapore –15 South Korea –18 Hong Kong, South Africa (White), Turkey –21 Australia –23 Pakistan, Philippines, Portugal, South Africa (Black) –24 Spain –26 Brazil –27 Mexico –29 Barbados, Chile, Taiwan –31 Romania –32 Poland –33 China –36 Jamaica –38 Bulgaria –39 Zimbabwe –41 Greece, Uganda –43 Kenya –45
Indonesia –48 Iran –64 Specialists Hungary –05 Tanzania –17 Italy –21 Mexico –23 Germany, Kenya –25 Czech Republic –26 China –28 Austria, Colombia –30 Lebanon, Uganda –31 Belarus –33 Brazil, Nigeria, Slovakia, Taiwan –35 Sweden –37 Romania –38 Ukraine –39 Finland, Saudi Arabia –40 Argentina –43 Barbados, Spain –44 Pakistan, Portugal –45 Poland, South Africa (Black) –46 South Africa (White) –47 Canada, Iran, Jamaica, Sri Lanka –48 Netherlands –49 Thailand –52 Australia, South Korea –53 United Kingdom –54 Indonesia, Philippines, Qatar –55 France, Japan, Malaysia –56 Chile, Denmark, Singapore –57 New Zealand –58 Iceland, India, Norway –60 United States –61 Russia –63 Macao –66 Greece, Zimbabwe –70 Bulgaria, Israel –71 Turkey –78 Hong Kong –83 Coworkers Qatar 49 Hungary 25 Tanzania 06 Saudi Arabia 03 Uganda 02 Iceland –02

276 ◆ Major Cross-Cultural Studies
New Zealand –04 Canada –05 Kenya –06 Argentina –07 Norway –09 Turkey –12 South Africa (White), Ukraine –15 Nigeria, Thailand, United States –16 Colombia, India –17 South Africa (Black) –19 Chile, Iran –20 Finland –21 Italy, Jamaica, Spain –22 Brazil, China, Lebanon –23 Malaysia –25 Barbados, Taiwan –26 Macao, Mexico –27 Sri Lanka –28 Japan, Pakistan –29 France, Israel, United Kingdom –30 Denmark, Russia –34 Australia, Slovakia –36 Belarus, Netherlands –37 South Korea –38 Czech Republic, Hong Kong –41 Germany, Singapore –42 Austria, Greece, Romania –43 Zimbabwe –44 Bulgaria –46 Poland, Sweden –49 Philippines, Portugal –50 Indonesia –53
Superior 1 Ukraine 88 Jamaica, Turkey 84 Hong Kong 72 Poland, Uganda 71 Zimbabwe 69 Belarus 65 Kenya, Portugal 64 United States 58 South Africa (White) 57 China, Spain 56 Philippines 54 Iceland 53 Australia 50
Macao 49 Russia 48 Barbados, Greece, Taiwan 47 South Africa (Black) 46 France, Israel, Mexico, Pakistan 45 Bulgaria, Malaysia 44 Brazil, Canada, Japan, Slovakia 42 Chile 41 Lebanon, Romania, Tanzania, United Kingdom 40 Iran, Sri Lanka 37 South Korea 36 Hungary, Nigeria 35 Indonesia 34 Czech Republic 33 Argentina 32 India 30 Austria 29 Thailand 28 Finland, New Zealand 26 Germany 25 Italy 20 Singapore 18 Norway, Sweden 11 Netherlands –04 Colombia, Denmark –06 Saudi Arabia –15 Own experience Czech Republic 122 Hungary 119 Finland 118 Germany 116 Greece 111 Iceland 104 Austria 103 Israel 102 Portugal 101 United Kingdom 99 Denmark 97 Netherlands, Russia 94 Slovakia 88 Romania 85 France, Italy, Sweden 80 Barbados 77 Norway, Poland 76 Bulgaria 75 Australia 70

Cultural Dimensions Across Modern Nations ◆ 277
New Zealand 69 Brazil, South Africa (White), Zimbabwe 68 Belarus 67 Colombia 66 Chile 65 Argentina, Japan 61 Canada, Ukraine 59 Indonesia 58 Singapore 55 United States 54 Spain 50 Iran, Macao, Turkey 49 Hong Kong 48 Kenya 47 South Africa (Black) 46 Sri Lanka 44 Taiwan, Thailand 43 Pakistan 42 Qatar 40 India 36 Jamaica, Uganda 34 Philippines, Saudi Arabia 31 Mexico 30 Lebanon 29 China 27 South Korea 24 Malaysia, Tanzania 21 Nigeria 19 Widely accepted beliefs Iran 08 Taiwan 04 Bulgaria, Romania 03 China –04 Indonesia –07 South Korea –12 Thailand –13 India –14 Malaysia, Philippines, Singapore –20 Chile –21 Norway –25 Colombia –27 Mexico –29 Belarus –30 Sweden –33 Japan –34 Nigeria –36 South Africa (Black) –38
Netherlands –40 Macao –42 Hong Kong –43 Argentina, Pakistan –44 Denmark, Sri Lanka –47 Greece, Spain, Tanzania –48 Saudi Arabia –50 Turkey –52 Lebanon, New Zealand, Slovakia –53 Italy, United States –56 Poland –58 Kenya, South Africa (White) –61 Australia, Ukraine –62 United Kingdom –63 Finland –66 Zimbabwe –67 Iceland –68 Austria, Brazil, Czech Republic –69 Jamaica, Uganda –72 France –77 Germany, Canada –78 Barbados –82 Israel –84 Russia –93 Qatar –98 Portugal –114 Hungary –137
(Peterson & Smith, 2008, Table 3.1; used by permission)
◆ Contributions
1. The verticality dimension pro-duces high correlations (reported by Smith, Peterson, & Schwartz, 2002) with several of Hofstede and Schwartz’s dimensions, the highest of which is with Hofstede’s power distance: .60**. Managers who come from and operate in societies with higher power distance—typically those in the developing nations—are more likely to rely on vertical sources of guidance. The four first-order dimensions that were used for the construction of the verticality dimension evidence the same geographic

278 ◆ Major Cross-Cultural Studies
pattern. Compared to their peers in the advanced economies, managers in the developing nations have a greater col-lective tendency to rely on formal rules and one’s superiors and a lower tendency to rely on one’s own experience and one’s subordinates. Knowing the essence of Hofstede’s power distance dimension, these findings are logical. They confirm the hierarchical nature of decision mak-ing in developing economies, which leaves relatively little room for initiative below the top layers of a company.
2. The widely accepted beliefs dimension also seems to create a contrast, albeit less sharply, between developing and developed nations. Managers in the former are more likely to rely on widely accepted beliefs, which probably suggests less professional management.
3. The study demonstrated that meaningful dimensions of national culture can be obtained through a novel method: asking managers about likely behaviors that can be observed in particular circum-stances in their companies.
◆ Food for Thought
1. As the authors note, their samples were not well matched. Yet, valid results had already been obtained from other studies of such samples (Smith, Dugan, & Trompenaars, 1996). This study pro-vided additional evidence that imperfectly matched samples can produce valid results.
This is food for thought but probably also a contribution to cross-cultural analysis.
2. It is unclear how exactly three of the four dimensions (reliance on unwritten rules, reliance on specialists, and reliance on coworkers) that remained after the cre-ation of the verticality dimension can be validated and, consequently, how they can be used. Smith, Peterson, and Schwartz did not obtain high correlations with external variables for these dimensions; therefore, their nature is not quite clear. Yet, the authors indicate that they may be useful in the context of international management because they describe specific situations that international managers may have to deal with. These situations may require a more focused approach than the common studies of basic national values and beliefs.
3. Because of the phrasing of the items, one cannot be sure what exactly the respondents reported: how they make deci-sions or how they think that others around them—for instance, their superiors—make decisions.
It is also unclear what distinction—if any—the respondents perceived between some of the sources of guidance. What is the difference between widespread beliefs and unwritten rules?
■ Note
1. Peterson and Smith (2008) have not provided a score for Qatar for the “consulting superiors” dimension.

◆ 279
◆ Introduction
Motivation is one of the key areas of study in organizational behavior. As all of the best-known classic theories of motivation come from the United States (Herzberg, 1966; Herzberg, Mausner, & Snyderman, 1959; Maslow, 1943, 1954; McClelland, 1961; McClelland & Boyatzis, 1982; McClelland & Burnham, 1976; Vroom, 1964; etc.), they may not apply to the same extent in other cultural envi-ronments. Dutch organizational psychologist Evert van de Vliert and Onne Janssen reported a cross-cultural study of self- and other-referenced performance motives (van de Vliert & Janssen, 2002). These constructs are rooted in com-parison theory (Albert, 1977; Suls, Marco, & Tobin, 1991).
Self-referenced performance motivation implies an ambition
to improve one’s own past per-formance. Other-referenced per-formance motivation refers to a desire to outperform others in a similar position. According to van de Vliert and Janssen (2002):
Self-referenced people primar-ily want to demonstrate mas-tery and improvement; they are reinforced by opportunities to engage in learning activities, irrespective of how comparable competitors are doing. Other-referenced people primarily want to demonstrate superior capacity; they are reinforced by competitive goal attainment, irrespective of how they them-selves were or are doing in an absolute sense. (p. 380)
The authors indicated that one of the goals of their study was to determine if self- and other- referenced performance
EVERT VAN DE VLIERT AND ONNE JANSSEN (2002): A STUDY OF PERFORMANCE MOTIVES
9.12

280 ◆ Major Cross-Cultural Studies
motivation patterns could form two independent dimensions at the national level. Another goal was to calculate national positions on these dimensions. Additionally, the authors hypothesized that self-referenced performance motiva-tion would be positively correlated with satisfaction, whereas other-referenced motivation would be negatively correlated with satisfaction. All this knowledge could be useful to cross-cultural researchers as well as to international managers.
◆ Samples
The researchers used secondary data, col-lected by Lynn (1991) from 1986–1989 in 42 countries. The samples consisted of university students, with the sample sizes ranging from 126 in Norway to 898 in South Africa.
◆ Hypothesized Dimensions
Van de Vliert and Janssen (2002) refer to studies showing that, at the individual level, self- and other-referenced perfor-mance motives form two independent dimensions. They hypothesized that this result would be replicated at the national level.
◆ Questionnaire Items
Self-referenced performance motives were operationalized in terms of Lynn’s (1991) aggregated measure of mastery, whereas other-referenced performance motives were operationalized in terms of his mea-sure of competitiveness.
Mastery was measured with eight items on a five-point Likert scale, ranging from
“strongly agree” to “strongly disagree.” Competitiveness was measured on the same scale but with five items.
The following items are given as examples of self-referenced performance motivation (van de Vliert & Janssen, 2002, p. 385):
“If I am not good at something, I would rather keep struggling to master it than move on to something I may be good at.”
“I would rather do something at which I feel confident and relaxed than some-thing which is challenging and diffi-cult” (reversed scoring).
“I more often attempt tasks that I am not sure I can do than tasks that I believe I can do.”
The following items are given as exam-ples of other-referenced performance moti-vation (van de Vliert & Janssen, 2002, p. 385):
“I try harder when I am in competition with other people.”
“It is important to me to perform better than others on a task.”
“I feel that winning is important in both work and games.”
◆ Statistical Analysis
Details about the calculation of the national scores are missing, but van de Vliert and Janssen’s (2002) two national indices are reproduced below. All scores have been multiplied by 100.
Self-referenced performance motives Venezuela 2209 Colombia 2150

Cultural Dimensions Across Modern Nations ◆ 281
Brazil 2129 Portugal 2124 Iceland 2122 Israel 2104 Romania 2064 Mexico 2051 Taiwan 2049 Argentina 2043 Egypt 2010 Greece 2007 Chile 1970 South Africa 1966 Sweden 1964 Canada 1953 United States 1946 Belgium 1913 India 1903 Norway 1901 South Korea 1871 Jordan 1870 Syria 1864 United Arab Emirates 1857 Switzerland 1854 New Zealand 1849 Turkey 1841 France 1832 Yugoslavia 1828 Singapore 1819 Australia 1810 China 1806 Spain 1778 Ireland 1775 Iraq 1762 United Kingdom 1754 Germany 1748 Bangladesh 1733 Poland 1724 Japan 1701 Hong Kong 1695 Bulgaria 1646 Other-referenced performance motives Egypt 1566 Jordan 1477 India 1448 United Arab Emirates 1435 Bangladesh 1425 Iraq 1404
Syria 1403 Greece 1383 Mexico 1382 Romania 1368 South Korea 1366 Taiwan 1339 Iceland 1299 Colombia 1297 Turkey 1278 United States 1276 Hong Kong 1264 South Africa 1250 China 1237 Bulgaria 1233 Japan 1221 Canada 1203 Poland 1200 Portugal 1194 Israel 1159 Chile 1154 Australia 1142 Singapore 1138 Yugoslavia 1123 Brazil 1117 New Zealand 1113 Ireland, Venezuela 1099 Belgium 1075 United Kingdom 1064 Spain 1045 France 1019 Norway 960 Germany 910 Sweden 905 Switzerland 899 Argentina 851
(van de Vliert & Janssen, 2002, Appendix, p. 395; used by permission)
◆ AdditionalStatisticalAnalysis
There are a number of significant correla-tions between van de Vliert and Janssen’s two national indices and relevant external variables:

282 ◆ Major Cross-Cultural Studies
Self-referenced motives
Item Description Item Code Source Correlation
Percentage of students who strongly agree that they would like to be among the best in the class in mathematics
Q37 a OECD PISA (2003) 57** (n = 24)
Life control, latest national means for each country from 1994–2004
A173 World Values Survey
.47* (n = 38)
Self-competence index Schmitt & Allik (2005)
.43* (n = 27)
Positive self-esteem index Schmitt & Allik (2005)
.43* (n = 27)
Determination/perseverance, percentages that chose item, lat-est data for each country from 1994–2004
A039 World Values Survey
–.38* (n = 38)
Other-referenced motives
Item Description Item Code Source Correlation
Competitiveness index Green et al. (2005)
.60** (n = 15)
Life satisfaction, latest national means for each country from 1994–2004
A171 World Values Survey
–.58** (n = 39)
Determination/perseverance, percentages who chose item, latest data for each country from 1994–2004
v18 World Values Survey
–.43* (n = 38)
◆ Contributions
1. Van de Vliert and Janssen’s two national indices create clearly recognizable geographic patterns. This suggests that they have captured two valid national dimen-sions of culture. It is also interesting to note that these two dimensions are independent of each other. At the national level, the phe-nomena that they measured clearly belong to two different domains of motivation.
2. The results of the study confirm previous findings (Green et al., 2005; van de Vliert, Kluwer, & Lynn, 2000) indicating that there is greater endorse-ment of competitiveness in poorer nations than in rich ones. Therefore, competitiveness cannot be positively associated with national individualism. If there is an association between these two constructs (depending on how they are measured), it tends to be negative, not positive.

Cultural Dimensions Across Modern Nations ◆ 283
◆ Food for Thought
1. The authors indicate that “the sur-prisingly weak performance motives” of Germans and Swiss might reflect a taboo about expressing the need to excel in the execution of one’s task. There is a more general question: What exactly do van de Vliert and Janssen’s two national indices measure—culturally acceptable statements or real behavioral intentions? Minkov (2008) found a negative ecologi-cal correlation between reported willing-ness to be among the best in the class in mathematics and actual national per-formance in mathematics. The fact that nations with stronger self-reported self-referenced motivation are more likely to have a high percentage of students who wish to excel in mathematics does not indicate a behavioral intention to study hard but rather the opposite. The negative association between self-referenced moti-vation and importance of perseverance, as measured by the World Values Survey, points in the same direction. The positive
associations between self-referenced moti-vation and the available measures of life control, self-esteem, and self-competence further elucidate what the self-referenced performance motivation index measures: an aspect of self-confidence. The Latin American countries have the highest scores on this measure, whereas some Asian and Eastern European countries have the lowest scores.
3. The authors report that when the performance motivation dimensions are used as controls, national measures of satisfaction (for instance with one’s life, job, etc.) are not correlated with human development indices. According to the authors, these findings qualify the liv-ability theory, according to which aver-age national subjective well-being depends mostly on living conditions (Veenhoven & Ehrhardt, 1995).
4. The negative association between other-referenced motives (competitive-ness) and mean national life satisfaction is interesting and warrants further studies.

284 ◆
◆ Introduction
Robert McCrae is one of the world’s leading experts in per-sonality differences measured in the framework of the Five-Factor Model (FFM) (explained in McCrae & John, 1992, and many other publications), a close variant of which is known as the Big Five personality traits. He pioneered the nomothetic study of FFM differences between nations and ethnic groups. The first study of this kind is discussed here. Its findings show how 36 societ-ies appear to differ on the FFM (McCrae, 2002).
The FFM postulates five per-sonality dimensions, forming the OCEAN acronym: Openness,
Conscientiousness, Extraversion, Agreeableness, and Neuroticism. The items that define these five dimensions can be organized into 30 facets, six per dimension, known from a variety of stud-ies (for instance, McCrae, 2002; McCrae et al., 2007; Schmitt et al., 2007):
Openness: Fantasy, Aesthetics, Feeling, Actions, Ideas, Values
Conscientiousness: Competence, Order, Dutifulness, Achieve-ment Striving, Self-Discipline, Deliberation
Extraversion: Warmth, Gregari-ousness, Assertiveness, Activity, Excitement Seeking, Positive Emotions
ROBERT MCCRAE (2002): A COMPARISON OF MEAN NATIONAL AND ETHNIC PERSONALITY TRAITS (SELF-REPORTS)
9.13

Cultural Dimensions Across Modern Nations ◆ 285
Agreeableness: Trust, Straightforward-ness, Altruism, Compliance, Modesty, Tender-mindedness
Neuroticism: Anxiety, Angry Hostility, Depression, Self-Consciousness, Impul-siveness, Vulnerability
In practice, this model suggests that per-sons adopting a self-description that defines a particular facet are likely to agree with the other self-descriptions that define the same facet. Respondents who describe them-selves as orderly and dutiful also tend to describe themselves as achievement striving and possessing self-discipline. Those who view themselves as gregarious (sociable) and assertive will probably also state that they often seek excitement and have positive emotions. And self-portrayals that report high anxiety also tend to include angry hostility and depression, among other traits.
McCrae (2002) reported that when group means are analyzed instead of individual scores, they produce the same five factors. He interpreted this as an indication that ecological analyses of the FFM are justified.
◆ Samples
McCrae used published or unpublished data from colleagues, gathered from 36 ethnic groups, most of them correspond-ing to nations. 1 The samples consisted of college-age students as well as adults, with a wide range of educational levels. Some of the samples were quite small: 19 male and 46 female Black South Africans. The largest sample was from South Korea: 1,257 men and 1,096 women. McCrae acknowledged that such an amalgama-tion of data is less than optimal but noted that the findings relate meaningfully to external variables that can be used for validation, such as measures of subjective well-being or Hofstede’s dimensions.
◆ Hypothesized Dimensions
McCrae expected the FFM model to repli-cate at the ecological level.
◆ Questionnaire Items
McCrae used studies based on the revised NEO Personality Inventory (NEO-PI-R). Its full version contains 240 items (8 items per facet, or 48 items per dimension), whereas the short version consists of 60 items. Respondents are presented with statements that stand for personality traits and asked to indicate the extent to which these describe them correctly on a five-point Likert scale, ranging from strong agreement to strong disagreement. The items are worded in such a way that pairs of items form semantic opposites. This is supposed to correct for extreme responding.
◆ Statistical Analysis
To increase the number of cases in his data, McCrae did something unusual in cross-cultural research. He had data from 36 societies. Some of these were represented only by students’ samples while others were also represented by samples of adults. Altogether, there were 57 samples. Each sample consisted of a subsample of women and a subsample of men, which added up to 114 subsamples. McCrae treated each subsample as a separate case (that is, a sep-arate society) in a factor analysis. Although McCrae did not state this explicitly in his publication, it appears that the values that he factor analyzed were the reported means for each of the 114 subsamples on each of the 30 facets of the FFM.
Based on conventional criteria (eigenval-ues greater than 1.00), McCrae obtained

286 ◆ Major Cross-Cultural Studies
seven factors. Yet, he decided to disregard the conventional recommendations for fac-tor retention and selected a five-factor solu-tion. The five ecological factors obtained in this way replicated the individual-level structure with some exceptions:
◆ The impulsiveness facet of neuroticism loaded only .28 on neuroticism but .66 on extraversion.
◆ The feelings facet of openness loaded .66 on openness but also .58 on extraversion.
◆ The values facet of openness loaded only .42 on openness but .60 on extraversion.
◆ The altruism facet of agreeableness loaded only .34 on agreeableness but .66 on extraversion.
◆ The deliberation facet of conscientious-ness loaded .54 on conscientiousness but also –.51 on openness.
Additionally, McCrae observed that stan-dard deviations also showed systematic national and ethnic differences.
McCrae calculated national and ethnic indices for each of the five dimensions in the FFM model. The exact procedure of the aggregation of the samples’ scores to the national level is not explained. McCrae’s indices (2002, Table 3, p. 112) are reproduced below. All scores have been multiplied by 10.
Neuroticism Spaniards 571 Italians 556 Portuguese 555 French 554 Japanese 553 Czechs, Malaysians 542 Hungarians 538 Russians, South Koreans 536 Hong Kong Chinese 533 German Swiss 532 PRC Chinese 531 Belgians 530
Austrians 529 Croatians, Germans 528 Telugu Indians 523 South African Whites 519 Taiwan Chinese 515 Serbs 511 Turks, Zimbabweans 509 Peruvians, Filipinos 508 Canadians 505 Americans 500 Estonians 497 Hispanic Americans 495 South African Blacks, Marathi Indians 491 Dutch, Indonesians 486 Norwegians 474 Danes 465 Swedes 463
Extraversion Norwegians 536 Danes 528 Canadians 517 Swedes 506 Turks 503 Americans 500 Estonians 499 German Swiss 485 Austrians 484 Spaniards 483 Belgians 477 Serbs 476 Hispanic Americans 475 Czechs 474 French, Germans 473 South African Whites 472 Hungarians 471 Italians 466 Portuguese 463 Peruvians 455 Russians 452 Croats 451 PRC Chinese 445 Dutch 439 Filipinos 438 Telugu Indians 435 Indonesians 433 Malaysians 425 Zimbabweans 423 Taiwan Chinese 420

Cultural Dimensions Across Modern Nations ◆ 287
Japanese 417 South African Blacks 414 Marathi Indians 407 South Koreans 400 Hong Kong Chinese 376
Openness Austrians 591 German Swiss 589 Germans 567 Serbs 560 Dutch 557 South African Whites 544 French 541 Hungarians 537 Estonians, Italians 526 Czechs 523 Belgians, Filipinos 518 Japanese 517 Canadians 516 Norwegians 515 Marathi Indians, South Koreans 514 Hispanic Americans 512 Turks 508 Taiwan Chinese 502 Americans, Peruvians 500 Indonesians 499 Hong Kong Chinese, Portuguese 492 Russians 491 Croats 490 PRC Chinese 483 Spaniards 480 South African Blacks 477 Zimbabweans 470 Malaysians 466 Danes 465 Swedes 460 Telugu Indians 440
Agreeableness Malaysians 585 Marathi Indians 567 Swedes 565 Telugu Indians 559 Dutch, Hong Kong Chinese 546 Taiwan Chinese 545 Filipinos 529 South Koreans 523
South African Whites 522 French 521 Danes 520 Canadians, Indonesians 519 Portuguese 512 Zimbabweans 510 Estonians 508 Czechs 507 South African Blacks 504 Americans, Belgians 500 Norwegians 499 Spaniards 494 Germans 491 Italians 489 Peruvians 486 Turks 485 Serbs 484 Austrians 482 Hungarians 479 PRC Chinese 478 Japanese 477 Croats 475 Hispanic Americans 471 German Swiss 470 Russians 467
Conscientiousness Marathi Indians 557 Malaysians 542 Telugu Indians 540 Croats 532 Zimbabweans 518 Serbs 517 Hispanic Americans 516 Filipinos 515 Italians, Turks 504 Indonesians, Portuguese, PRC Chinese 503 Americans, Hungarians 500 Estonians, German Swiss 496 Canadians, Hong Kong Chinese 492 Peruvians 490 South Koreans 488 Dutch 486 Spaniards 483 Taiwan Chinese 481 South African Blacks, Whites 479 Czechs, Danes 475 French 474

288 ◆ Major Cross-Cultural Studies
Austrians, Germans 467 Belgians 466 Russians 465 Norwegians, Swedes 457 Japanese 426
(McCrae, 2002, Table 3, p.112; used with kind permission of Springer Science and Business Media)
◆ Additional Statistical Analysis
Hofstede and McCrae (2004) showed that the FFM indices in McCrae (2002) are highly correlated with Hofstede’s dimensions. For the purpose of this book, these correlations were recalculated. The number of countries for which Hofstede indices are available was increased to 69 by assigning Hofstede’s collective scores for West Africa, East Africa, and the Arab world to each respective nation in those regions (provided Hofstede had collected data from it). Correlations that are significant at the .05 level or lower and exceed ±.40 are reported below. All correlations are across 28 common cases.
neuroticism uncertainty avoidance .57** masculinity .52**
extraversion power distance –.65** individualism .62**
agreeableness uncertainty avoidance –.62**
conscientiousness power distance .65**
The highest correlation between openness and any of Hofstede’s dimensions is .38* with masculinity.
Additional external validation for McCrae’s national indices can also be
found. A number of high correlations with World Values Survey (WVS) variables or other national indicators are plausible from a conceptual viewpoint. The WVS data are the latest available for each coun-try from 1994–2004.
◆ Contributions
1. McCrae is the first author to show that instruments designed to measure per-sonality differences between individuals can work in ecological analyses: They can repro-duce the FFM model at the ecological level and create meaningful country clusters. This means that the study of cultural differences and the study of personality differences across nations and ethnic groups need not be two different domains. Something can be learned about nations and ethnic groups by studying them with FFM tools.
After the publication of the article by Hofstede and McCrae (2004), which dis-cusses the interface between culture and personality, the topic generated keen inter-est among cross-cultural researchers. For years after its appearance, it was the most-read article in Cross-Cultural Research . Various attempts have also been made to demonstrate associations between national personality traits and other national indi-cators, for example, subjective well-being (Lynn & Steel, 2006; Steel & Ones, 2002).
2. McCrae’s (2002) data demon-strated that average national standard deviations in studies of personality traits show clear geographic patterns: They are low in Asia and Africa but high in Europe. Various explanations are possible, one of which is that Europeans might feel free to present divergent self-construals, whereas Africans and Asians are guided by social conventions in their self-descriptions.
3. McCrae pointed out that his study suggests that FFM questionnaires can be used for the study of individuals not only

Cultural Dimensions Across Modern Nations ◆ 289
in the United States, from where they originate, but probably across the world. This may sound like a bold assertion that some cross-cultural psychologists will dis-agree with. But if it can be shown that the American FFM structure is recoverable in a particular society outside the United States, and if the results have good predic-tive properties for individuals in that soci-ety, there is no reason why American FFM instruments should not be used there.
◆ Food for Thought
1. Using conventional criteria, McCrae obtained seven ecological fac-tors. Because he did not discuss them, we do not know if they are interpretable,
what nomological networks they create, and whether a seven-factor solution is preferable to a five-factor one for practi-cal purposes.
2. The cases in McCrae’s factor analysis were not nations or ethnic groups but groups of men and groups of women from various nations and ethnic groups. Some nations and ethnic groups were represented only once—by a female and a male sample of college students. Other nations and ethnic groups were repre-sented twice—by a female and a male sam-ple of college students and a female and a male sample of adults. Because personality traits change with age and their means are not the same for the two genders, the results of a factor analysis would have reflected not only cultural differences,
Item Description Item Code Correlation
neuroticism
percentage feeling very healthy (WVS A009) –.52** (n = 32)
percentage very happy (WVS A008) –.45** (n = 32)
cigarettes per person annually (Mackay & Eriksen, 2002) .44** (n = 32)
extraversion
percentage to whom friends are very important
(WVS A002) .47** (n = 32)
openness
IQ scores (Lynn & Vanhanen, 2002) .42* (n = 31)
agreeableness
cigarettes per person annually (Mackay & Eriksen, 2002) –.49** (n = 32)
conscientiousness
percentage who choose responsibility as important for children
(WVS A032) –.59** (n = 32)
percentage to whom religion is very important
(WVS A006) .54** (n = 32)
percentage who choose obedience as important for children
(WVS A042) .54** (n = 32)
percentage who choose hard work as important for children
(WVS A030) .54** (n = 32)
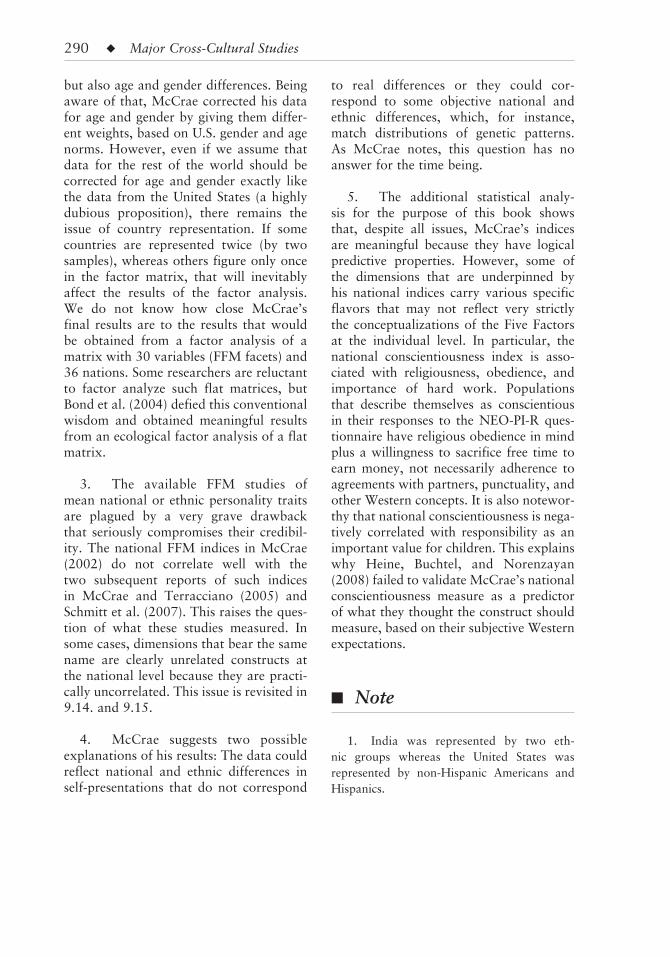
290 ◆ Major Cross-Cultural Studies
but also age and gender differences. Being aware of that, McCrae corrected his data for age and gender by giving them differ-ent weights, based on U.S. gender and age norms. However, even if we assume that data for the rest of the world should be corrected for age and gender exactly like the data from the United States (a highly dubious proposition), there remains the issue of country representation. If some countries are represented twice (by two samples), whereas others figure only once in the factor matrix, that will inevitably affect the results of the factor analysis. We do not know how close McCrae’s final results are to the results that would be obtained from a factor analysis of a matrix with 30 variables (FFM facets) and 36 nations. Some researchers are reluctant to factor analyze such flat matrices, but Bond et al. (2004) defied this conventional wisdom and obtained meaningful results from an ecological factor analysis of a flat matrix.
3. The available FFM studies of mean national or ethnic personality traits are plagued by a very grave drawback that seriously compromises their credibil-ity. The national FFM indices in McCrae (2002) do not correlate well with the two subsequent reports of such indices in McCrae and Terracciano (2005) and Schmitt et al. (2007). This raises the ques-tion of what these studies measured. In some cases, dimensions that bear the same name are clearly unrelated constructs at the national level because they are practi-cally uncorrelated. This issue is revisited in 9.14. and 9.15.
4. McCrae suggests two possible explanations of his results: The data could reflect national and ethnic differences in self-presentations that do not correspond
to real differences or they could cor-respond to some objective national and ethnic differences, which, for instance, match distributions of genetic patterns. As McCrae notes, this question has no answer for the time being.
5. The additional statistical analy-sis for the purpose of this book shows that, despite all issues, McCrae’s indices are meaningful because they have logical predictive properties. However, some of the dimensions that are underpinned by his national indices carry various specific flavors that may not reflect very strictly the conceptualizations of the Five Factors at the individual level. In particular, the national conscientiousness index is asso-ciated with religiousness, obedience, and importance of hard work. Populations that describe themselves as conscientious in their responses to the NEO-PI-R ques-tionnaire have religious obedience in mind plus a willingness to sacrifice free time to earn money, not necessarily adherence to agreements with partners, punctuality, and other Western concepts. It is also notewor-thy that national conscientiousness is nega-tively correlated with responsibility as an important value for children. This explains why Heine, Buchtel, and Norenzayan (2008) failed to validate McCrae’s national conscientiousness measure as a predictor of what they thought the construct should measure, based on their subjective Western expectations.
■ Note
1. India was represented by two eth-nic groups whereas the United States was represented by non-Hispanic Americans and Hispanics.

◆ 291
◆ Introduction
The authors of this study (McCrae & Terracciano, 2005) were inter-ested in finding out if the Five-Factor Model (FFM), described in 9.13., made sense at the level of nations. For example, anxiety, hostility, and depression covary among individuals, especially in the United States, and define a neuroticism factor. But would these correlate if mean national scores were compared? To put it differently, is it fair to say that if a nation has a high average score on anxiety, it can also be expected to have a high aver-age score on hostility? Since the FFM replicates well across indi-viduals within many nations and ethnic groups, it would not be
a great surprise if it replicated at the ecological level as well. Further, McCrae (2002) obtained an ecological factor structure that resembled the FFM. Yet, the sam-ples he analyzed were collected from different studies. Also, his choice of samples for his factor analysis raises the issues that were discussed in 9.13. McCrae and Terracciano (2005) analyzed new data that were expected to pro-vide a clearer image of the FFM structure at the ecological level.
◆ Samples
Collaborators across the world collected data from local partici-pants, mostly college students. A total of 12,156 individuals were
ROBERT MCCRAE AND ANTONIO TERRACCIANO (2005): A STUDY OF MEAN NATIONAL OR ETHNIC PERSONALITY TRAITS (PEER REPORTS)
9.14

292 ◆ Major Cross-Cultural Studies
recruited, forming 202 samples from 51 societies.
◆ Hypothesized Dimensions
McCrae and Terracciano expected the FFM to replicate at the ecological level.
◆ Questionnaire Items
McCrae and Terracciano used the stan-dard NEO-PI-R (NEO Personality Inventory) questionnaire translated into local languages (explained in 9.13.). The questionnaire exists in two forms: S for self-reports and R for observer ratings. In this case, they used the R form: The respondents were asked to think of a per-son of a particular age that they knew well and describe that person in terms of the questionnaire items.
◆ Statistical Analysis
As a first step, McCrae and Terracciano decided to eliminate the effect of culture and ascertain whether the five factors would replicate in an ecological factor analysis in which the cases are not cultural groups but randomly created groups of individuals. They assigned their 12,156 cases to 202 randomly formed groups that did not correspond to nations or ethnicities. Then, they performed a factor analysis in which the cases were these 202 groups and the values were the groups’ mean scores on each of the 30 facets of the FFM (see 9.13.). The factor structure obtained in this way replicated the indi-vidual FFM structure almost perfectly.
Then, McCrae and Terracciano turned to the real task. They did a factor analy-sis in which the cases were the real 202
samples from the 51 nations and the val-ues were their means on the 30 facets of the FFM. They obtained six factors with eigenvalues exceeding 1.00 and a seventh factor whose eigenvalue was 0.98. They decided to drop the seventh factor and examine the six- and five-factor solutions.
In the six-factor solution, “factors resembling E, O, A and C could be roughly identified” (p. 414), and the two remaining factors were related chiefly to N but one also had an element of A (see 9.13., for an explanation of the OCEAN acronym).
After the varimax rotation of the five-factor solution, only O and C were clearly replicated. N was still split into two factors, whereas E and A were fused. Nevertheless, the researchers decided that this failure of the FFM model was a mat-ter of rotation. When a Procrustes rotation was imposed on the five-factor solution, the resulting structure resembled the FFM. Still, some of the factors were scattered. For example, 16 of the 30 facets loaded more than ±.40 on the extraversion factor and of the eight facets that loaded more than ±.50, only three were extraversion facets.
Finally, national indices for each of the five FFM factors were calculated. The calculation procedure was not clearly explained. The indices are reproduced below from McCrae and Terracciano (2005). All scores have been multiplied by 10.
Neuroticism Brazilians 537 French Swiss 536 Burkinabes, Maltese 531 French 527 Italians 526 Kuwaitis 519 Malays 518 Portuguese 516 Czechs, Russians, Turks 514 Argentines 513 Japanese, Poles 507 Slovenes 506

Cultural Dimensions Across Modern Nations ◆ 293
Hong Kong Chinese, Moroccans 505 Danes 503 English, Indians, Northern Irish 501 Chileans, Indonesians, Lebanese 500 Puerto Ricans 499 Spaniards 497 Belgians 496 Canadians 495 Ugandans 494 Croats, Serbs 493 Slovaks 492 Batswanas, Thais 489 Ethiopians 488 Australians, Icelanders 486 Peruvians 485 Iranians, South Koreans 484 Austrians, Filipinos 483 Americans, Germans 481 Estonians, New Zealanders 479 Nigerians 478 German Swiss 475 People’s Republic Chinese 465 Mexicans 462 Extraversion Northern Irish 556 Australians 538 English 537 Turks 530 Kuwaitis 529 Canadians 525 New Zealanders 524 Argentines 523 Americans, Belgians 522 Brazilians, Estonians 521 Danes 518 Chileans 517 Puerto Ricans 516 Icelanders 515 Portuguese 513 Lebanese 512 French Swiss 510 Croats 509 Austrians, South Koreans 507 Maltese 505 Spaniards 504 Peruvians 501
Slovaks 497 Germans, Thais 496 Slovenes 495 Japanese 494 Serbs 493 Poles 492 Filipinos 489 Burkinabes 488 Indians 485 German Swiss, Malays 483 Iranians 482 Czechs 481 French 480 Mexicans 478 Ethiopians 470 Batswanas 467 People’s Republic Chinese 466 Italians, Ugandans 465 Hong Kong Chinese 462 Russians 457 Indonesians 454 Moroccans 448 Nigerians 444
Openness German Swiss 584 Danes 552 Germans 549 English 535 Italians 523 Chileans 518 French Swiss, Serbs 516 French 514 Portuguese 513 Icelanders, Japanese 512 South Koreans 509 Filipinos 508 Australians 507 Austrians 505 Americans, Belgians, Czechs 504 Mexicans 502 Iranians, New Zealanders, People’s Republic Chinese 501 Puerto Ricans, Russians 497 Ugandans 495 Burkinabes 493 Croats, Nigerians 491 Brazilians 490 Indonesians, Peruvians 489 Indians, Slovenes, Spaniards 488

294 ◆ Major Cross-Cultural Studies
Poles 486 Ethiopians, Maltese, Moroccans, Thais 485 Canadians 484 Slovaks, Turks 482 Lebanese 481 Batswanas 477 Kuwaitis 476 Malays, Northern Irish 475 Hong Kong Chinese 473 Estonians 468 Argentines 461 Agreeableness Czechs 542 German Swiss 540 Danes 531 French Swiss 530 Northern Irish 524 Germans 521 Icelanders 520 Indians, Malays 517 Spaniards 514 Burkinabes, French 513 Portuguese 511 Kuwaitis, Turks 510 Chileans 508 Argentines, Austrians, Slovaks 506 Brazilians, Russians, South Koreans 503 English 502 New Zealanders 501 Australians 500 Canadians 499 Belgians 498 Thais 496 Maltese 494 Americans 491 Indonesians, Slovenes 490 Puerto Ricans 489 Japanese 488 Iranians, People’s Republic Chinese 486 Peruvians, Poles 485 Croats, Serbs 484 Ugandans 483 Italians 481 Batswanas 480 Estonians 478 Mexicans 475
Filipinos 474 Ethiopians 473 Hong Kong Chinese 469 Nigerians 466 Lebanese 464 Moroccans 461 Conscientiousness Filipinos, German Swiss 535 Malays 530 Puerto Ricans 529 Kuwaitis 526 Austrians 524 Germans, Indians, Slovenes 523 Chileans 522 Serbs 517 Maltese 516 Brazilians, Czechs 515 Turks 514 Spaniards 513 Mexicans, Portuguese 507 Lebanese 505 Croats 503 Argentines, Estonians 500 Burkinabes, French Swiss 497 Canadians, Hong Kong Chinese, Indonesians 496 Japanese 495 Poles 494 Icelanders 493 Russians 491 Thais 489 Americans 488 Peruvians 487 Slovaks 486 Danes, French 484 Italians, South Koreans 483 Ugandans 482 English 481 People’s Republic Chinese 480 New Zealanders 478 Australians 475 Belgians, Northern Irish 474 Ethiopians 472 Iranians 470 Batswanas 468 Nigerians 458 Moroccans 455
(McCrae & Terracciano, 2005, Table 2, p. 415; used by permission)

Cultural Dimensions Across Modern Nations ◆ 295
◆ Additional Statistical Analysis
As McCrae’s (2002) FFM indices yield correlations with some of Hofstede’s (2001) dimensions, those in McCrae and Terracciano (2005) can be expected to have similar properties. Significant cor-relations between Hofstede’s dimensions and McCrae and Terracciano’s indices are provided below if they exceed +.40. All correlations are across 37 overlapping cases.
extraversion individualism .51** power distance –.41*
openness power distance –.49** individualism .45**
agreeableness power distance –.41*
◆ Contributions
1. The results of this study are a good illustration of the fact that statisti-cal analysis in cross-cultural research is as much an art as it is a science. Different techniques can lead to very different results and, quite often, by choosing dif-ferent statistical tools, one can analyze the data in such a way that one will obtain a desired solution, including a preconceived one. Of course, this ingenuity is not only a contribution, it is also food for thought.
◆ Food for Thought
1. In some cultures, such as those of East Asia, it is customary for people to hide their emotions. It is debatable how
well observers, even if they are friends of the observed, will be able to evaluate other people’s emotional world and cor-rectly rate them on some FFM facets, for example, those that define neuroticism.
2. McCrae and Terracciano showed that, using creativity in the statistical treat-ment of the data, it is possible to obtain a solution that replicates the FFM at the ecological level. However, we must note that ecological does not mean national in this case because their units of analysis were not nations.
3. Procrustes analysis amounts to treating data in such a way that the emerg-ing model resembles a selected target. This book takes a stance against dogma-tism, including the choice of statistical methods. Consequently, its philosophy is not opposed to Procrustes techniques. However, we must be clear about the implications of this permissible creativity in social science and psychology. It makes questions such as “Does the FFM repli-cate at the ecological level?” misleading. The correct question is “Can the FFM be recreated at the ecological level?” McCrae and Terracciano’s study suggests that the answer is positive.
4. The fact that the FMM can be recreated at the ecological level is interest-ing, but the next inevitable question is “So what?” Can the results be used to explain any national differences in a way that eas-ily makes sense? The available evidence is inconclusive at best.
First, the national FFM indices in McCrae (2002) and in McCrae and Terracciano (2005) do not yield the same pattern of correlations with Hofstede’s dimensions. Only extraversion consistently correlates with individualism and power distance. Interestingly, national neuroti-cism in McCrae (2002) is significantly cor-related with two of Hofstede’s dimensions, but national neuroticism in McCrae and Terracciano (2005) is not associated with

296 ◆ Major Cross-Cultural Studies
any of them. National conscientiousness in McCrae and Terracciano (2005) is not related to any Hofstede dimensions either. This does not mean that these FFM indices cannot be validated through correlations with other external variables, but one can only wonder what these might be.
Most confusingly, the national FFM indices from the three available studies, described in this book, correlate poorly among themselves. We will examine this issue in greater detail in 9.15. Suffice it to say here that the highest correlation between any two measures of what is sup-posed to be a single dimension in McCrae (2002) and McCrae and Terracciano (2005) is for extraversion. It is hardly impressive for a correlation between any two variables at the ecological level and quite disappointing for two measures of one ecological construct: r = .58**, n = 27. On the other hand, the correlation between the two agreeableness indices is .12 ( p = .540), suggesting that they mea-sure two entirely different phenomena.
As a result, it is not at all clear what the FFM indices in McCrae and Terracciano (2005) measure. Also, one can hardly explain the country rankings on some of the FFM indices. Why are the highest scorers on conscientiousness South Asians, German speakers, Kuwaitis, and Puerto
Ricans? In what sense are they the most conscientious people and how can that be corroborated by external evidence?
5. McRae and Terracciano’s (2005) analysis raises the same issue as the one by McCrae (2002), described in 9.13. The units of analysis were not nations or eth-nic groups but 202 groups of people from 51 nations. Factor structures obtained in this way may be quite different from the structures that would emerge if the cases in the factor analysis were the 51 nations, not the 202 groups from them. A matrix consisting of 51 cases and 30 variables is perfectly acceptable in an ecological fac-tor analysis. Only this method can reveal how well the FFM can be recreated at the national level.
It is possible that one of the many potential reasons for the poor replicabil-ity of the FFM indices in McCrae (2002) and McCrae and Terracciano (2005) is the method that they used: an ecologi-cal factor analysis in which the cases are different numbers of samples from various countries, not different countries. Another potential reason is that when peo-ple describe themselves and their acquain-tances, the results need not be very similar because different types of biases may be activated in each case.

◆ 297
◆ Introduction
David Schmitt is a well-known American psychologist who has a strong interest in the domain of cross-cultural differences in human sexuality. He launched the International Sexuality Description Project, described in 9.20. As part of that project, the Big Five Inventory (BFI) was admin-istered to respondents from 56 nations. Like the NEO Personality Inventory (NEO-PI-R), the BFI was designed to measure the five main dimensions of human personal-ity described in 9.13 and 9.14. Schmitt, Allik, McCrae, and Benet-Martinez (2007), who authored the study discussed here, noted that this was a unique opportunity to compare the national indices
that the NEO-PI-R and the BFI produce. The comparison, viewed as a “cross-cultural and cross-instrument construct validity tech-nique” (p. 178), should provide an estimate of the reliability and meaningfulness of the emerging practice of calculating national and ethnic indices for the five personal-ity dimensions. Because the NEO-PI-R and the BFI are designed to tap the same dimensions, the study of NEO-PI-R self-reports by McCrae (2002) and the study of BFI self-reports by Schmitt et al. (2007) should yield similar results. For instance, the two national neu-roticism indices obtained in this way should be highly correlated. The same can be expected of the other four dimensions.
Another question that Schmitt et al. (2007) were interested in
DAVID SCHMITT, JURI ALLIK, ROBERT MCCRAE, AND VERONICA BENET-MARTINEZ (2007): A STUDY OF THE GEOGRAPHIC DISTRIBUTION OF THE BIG FIVE PERSONALITY TRAITS (SELF-REPORTS)
9.15

298 ◆ Major Cross-Cultural Studies
was the factor structure of the BFI across the 56 nations of their project.
The McCrae and Terracciano (2005) cross-national FFM study of peer reports is not mentioned in Schmitt et al. (2007). However, because it was supposed to mea-sure the same five dimensions, its results should also be comparable to those in McCrae (2002) and Schmitt et al. (2007). Analyzed together, the results of these three large studies of national and ethnic personality traits should give a clue about the utility of the available national indices.
◆ Samples
The samples consisted primarily of college students, but in some countries they were “community based” (Schmitt et al. 2007, Table 1, p. 180). They were quite uneven, ranging from 999 males and 1,794 females in the United States to 24 males and 36 females in Cyprus. The total number of respondents was 17,408. They came from 56 countries.
◆ Hypothesized Dimensions
The authors apparently expected to recover the five personality traits: extra-version, agreeableness, conscientiousness, neuroticism, and openness. The level of analysis at which this was likely to occur was not specified.
◆ Questionnaire Items
The respondents answered the 44-item BFI. The items elicit self-report ratings made on a scale from 1 = “disagree strongly” to 5 = “agree strongly” (Schmitt et al., 2007, p. 183).
◆ Statistical Analysis
The researchers carried out a pan-cultural individual-level factor analysis (see 8.2.10.): All 17,408 respondents were treated as if they came from a single culture. Principal-axis factoring with varimax rotation yielded a five-factor structure. A Procrustes rotation targeted to the U.S. normative structure produced factor loadings that clearly delin-eated five factors corresponding to extra-version, agreeableness, conscientiousness, neuroticism, and openness.
After this, national indices for the five dimensions were calculated. The exact pro-cedure is not explained in detail. A series of numerical transformations (explained in the study) were performed to make the national indices easier to compare.
Below, the national indices for the five dimensions are reproduced from Schmitt et al. (2007). All scores have been multi-plied by 100.
Extraversion Serbia 5195 Croatia 5170 Turkey 5159 Indonesia 5125 Congo 5119 Austria, New Zealand 5061 Slovenia 5054 Switzerland 5047 Malta 5045 Estonia 5041 Romania 5033 Germany 5031 Mexico 5024 Czech Republic 5022 Malaysia 5003 United States 5000 Finland 4984 Italy 4980 United Kingdom 4979 Netherlands 4975 Lithuania 4971 Fiji 4968 South Africa 4961

Cultural Dimensions Across Modern Nations ◆ 299
Botswana 4956 Latvia 4939 Bolivia 4934 Tanzania 4919 Poland 4912 Argentina, Cyprus 4910 Slovakia 4905 Spain 4900 Australia 4898 Morocco 4881 Zimbabwe 4869 Israel 4865 Greece 4860 Jordan, Peru 4835 Canada, Lebanon 4832 Philippines 4812 Portugal 4806 Taiwan 4775 Chile 4755 India 4742 Estonia 4711 Hong Kong 4691 Japan 4673 Ukraine 4645 Belgium 4599 Brazil 4589 France 4544 Bangladesh 4498 South Korea 4486 Agreeableness Congo 5482 Jordan 5373 Greece 5242 Botswana 5211 Ethiopia 5182 Cyprus 5116 Bangladesh 5049 India 5043 Slovenia 5018 United States 5000 South Africa 4997 Zimbabwe 4977 Bolivia 4962 Estonia 4958 Malta 4956 Portugal 4952 Mexico 4951 Finland 4946
Israel 4944 Fiji 4927 Tanzania 4926 Canada 4914 Morocco 4895 Malaysia 4855 Philippines 4796 Turkey 4789 Switzerland 4769 Serbia 4764 Australia 4751 Slovakia 4738 United Kingdom 4731 Chile 4702 New Zealand 4683 Poland 4674 France 4664 Italy 4652 Indonesia 4638 Lebanon 4610 Netherlands 4608 Austria 4590 Brazil 4586 Romania 4531 Spain 4526 Croatia 4520 Germany 4508 Belgium 4507 Taiwan 4474 South Korea 4411 Czech Republic 4409 Latvia 4379 Peru 4364 Argentina 4275 Hong Kong 4269 Lithuania 4261 Japan 4221 Ukraine 3905 Conscientiousness Congo 5571 Ethiopia 5436 Tanzania 5327 Israel 5240 Zimbabwe 5175 Finland 5160 Botswana 5027 United States 5000 Jordan 4977

300 ◆ Major Cross-Cultural Studies
Chile 4972 South Africa 4961 France 4926 Slovenia 4924 Canada 4905 Turkey 4871 Italy 4862 Cyprus 4849 Argentina 4818 Romania 4810 Portugal 4775 Serbia 4753 Greece 4745 India, Peru 4736 Indonesia 4719 Malaysia 4708 United Kingdom 4689 Spain 4680 Austria 4673 Bangladesh 4671 Germany 4652 Poland 4615 Croatia 4602 Fiji 4600 Malta 4597 Australia 4587 Estonia 4584 Mexico 4572 Brazil 4538 Morocco 4522 Bolivia 4508 Switzerland 4503 Lebanon, Lithuania 4456 Latvia 4421 New Zealand 4418 Netherlands 4391 Ukraine 4389 Philippines 4314 Belgium 4303 Czech Republic 4287 Taiwan 4252 Slovakia 4244 Hong Kong 4153 South Korea 4060 Japan 3782
Neuroticism Japan 5787 Argentina 5505
Spain 5403 South Korea 5399 Belgium 5360 Peru 5339 Lebanon 5335 Greece 5319 Brazil 5314 Taiwan 5313 Hong Kong 5241 Malta 5235 France 5229 Lithuania 5187 Poland 5180 Italy 5166 Slovakia 5157 Cyprus 5144 Philippines 5141 Chile, United Kingdom 5139 Bangladesh 5120 Latvia 5111 Czech Republic 5102 Morocco 5087 Australia 5082 Canada 5058 Bolivia, Germany 5029 Portugal 5021 Serbia 5017 India, United States 5000 Turkey 4988 Jordan 4986 Indonesia 4973 Austria 4969 New Zealand 4959 Israel 4927 South Africa 4901 Switzerland 4872 Botswana, Netherlands 4861 Zimbabwe 4826 Malaysia 4814 Fiji, Romania 4803 Ukraine 4802 Mexico 4800 Finland 4784 Tanzania 4773 Estonia 4699 Croatia 4616 Ethiopia 4612 Slovenia 4528 Congo 4458

Cultural Dimensions Across Modern Nations ◆ 301
Openness Chile 5469 Belgium 5459 Bangladesh 5335 Estonia 5317 Romania 5313 Turkey 5270 Switzerland 5262 Slovakia 5253 Serbia 5244 Mexico 5226 Greece 5153 Peru 5129 Israel 5095 Argentina 5083 Bolivia 5071 Malta 5066 Czech Republic 5059 Slovenia 5050 Finland 5033 Portugal 5029 Australia 5007 Italy, United States 5000 Netherlands 4994 Latvia 4991 Spain 4964 New Zealand 4949 Philippines 4934 Lebanon 4940 Cyprus 4936 Austria 4929 Brazil 4916 Morocco 4910 Poland 4906 Lithuania 4904 South Africa 4901 Canada 4875 Zimbabwe 4852 India 4848 Botswana, Tanzania 4819 France 4809 Indonesia 4801 Croatia 4800 Germany 4780 Malaysia 4761 Fiji 4721 Ethiopia 4715 Jordan 4710 Congo 4623
United Kingdom 4597 Taiwan 4570 South Korea 4430 Ukraine 4206 Hong Kong 4164 Japan 4153
(Schmitt, Allik, McCrae, & Benet-Martinez, 2007, Table 5, pp. 188–189; used by permission)
◆ Additional Statistical Analysis
This section provides the correlations between the national indices for the five personality dimensions in the three large studies available so far and described in this book (9.13., 9.14.). The table below uses the following coding:
E1: extraversion index in McCrae (2002) N1: neuroticism index in McCrae (2002) A1: agreeableness index in McCrae
(2002) O1: openness index in McCrae (2002) C1: conscientiousness index in McCrae
(2002) E2: extraversion index in McCrae and
Terracciano (2005) N2: neuroticism index in McCrae and
Terracciano (2005) A2: agreeableness index in McCrae and
Terracciano (2005) O2: openness index in McCrae and
Terracciano (2005) C2: conscientiousness index in McCrae
and Terracciano (2005) E3: extraversion index in Schmitt et al.
(2007) N3: neuroticism index in Schmitt et al.
(2007) A3: agreeableness index in Schmitt
et al. (2007) O3: openness index in Schmitt et al. (2007) C3: conscientiousness index in Schmitt
et al. (2007)

N1
A1
O1
C1
E2N
2A
2O
2C
2E3
N3
A3
O3
C3
E1−
.31(
35)
−.2
9 (3
5).2
3 (3
5)−
.22
(35)
.58*
* (2
7)−
.10
(27)
.32
(27)
.28
(27)
−.0
1 (2
7).4
2* (2
8)−
.24
(28)
.31
(28)
.73*
* (2
8).4
2* (2
8)N
1−
.25
(35)
.16
(36)
.01
(36)
−.2
4 (2
7).4
1* (2
7).1
7 (2
7).0
3 (2
7).0
4 (2
7)−
.34
(28)
.49*
* (2
8)−
.44*
(28)
−.2
7 (2
8)−
.23
(28)
A1
−.4
4**
(36)
.18
(36)
−.0
8 (2
7).3
4 (2
7).1
2 (2
7)−
.34
(27)
.16
27)
−.3
5 (2
8)−
.03
(28)
.13
(28)
−.3
6 (2
8)−
.08
(28)
O1
−.2
7 (3
5).0
9 (2
7)−
.28
(27)
.08
(27)
.51*
* (2
7).2
4 (2
7).1
7 (2
8).0
2 (2
8)−
.21
(28)
.25
(28)
−.1
7 (2
8)C
1−
.06
(27)
−.1
1 (2
7)−
.19
(27)
−.2
8 (2
7).3
4 (2
7).3
7 (2
8)−
.66*
* (2
8).5
8**
(28)
.26
(28)
.46*
(28)
E2.2
9* (5
1).1
5 (5
1)−
.03
(51)
−.1
2 (5
1).0
5 (3
8)−
.14
(38)
.34*
(38)
−.0
6 (3
8).2
2 (3
8)N
2.2
9* (5
1)−
.16
(51)
.17
(51)
−.2
2 (3
8).3
2* 3
8)−
.14
(38)
− .13
(38)
.06
(38)
A2
.42*
* (5
1).3
5**
(51)
.05
(38)
.06
(38)
−.1
6 (3
8).1
9 (3
8)−
.02
(38)
O2
.14
(51)
.05
(38)
.01
(38)
−.0
9 (3
8).0
6 (3
8)−
.10
(38)
C2
.28
(38)
−.1
4 (3
8)−
.03
(38)
.20
(38)
−.0
4 (3
8)E3
−.4
9**
(56)
.20
(56)
.27*
* (5
6).2
5 (5
6)N
3−
.49*
* (5
6)−
.09
(56)
−.5
7**
(56)
A3
.26
(56)
.65*
* (5
6)O
3.2
0 (5
6)C
3
302 ◆
Not
e: F
or t
he p
urpo
se o
f ca
lcul
atin
g co
rrel
atio
ns,
His
pani
cs i
n M
cCra
e (2
002)
wer
e tr
eate
d as
Mex
ican
s an
d a
sing
le i
ndex
was
use
d fo
r In
dian
s. T
he n
umbe
rs i
n pa
rent
hese
s in
dica
te n
umbe
rs o
f co
mm
on c
ases
.

Cultural Dimensions Across Modern Nations ◆ 303
◆ Contributions
1. The study demonstrated that the internal reliability of the five BFI scales was acceptable within most of the 56 societies. Aggregated to the regional level, these reliability values were acceptable in all regions, except in Africa, where none of the five values exceeded .68 and two were below .60. The average alpha for agreeableness in Southeast Asia was also disappointing: .57.
The study also showed that the five personality dimensions, obtained in stud-ies of American respondents, can be recov-ered from a large international sample of respondents consisting of subsamples from 56 nations.
2. Despite the problems that are discussed in the Food for Thought section, it appears that the neuroticism dimen-sion has an equivalent at the ecological level, particularly at the level of nations. The other dimensions may also have such equivalents, but this can only be verified after further studies, using more refined methods.
◆ Food for Thought
1. Because the factor analysis was conducted at the individual level, we do not know if the five personality dimen-sions, measured with the BFI, could be recovered at the ecological level. A factor analysis with 56 cases (nations) and 44 variables would have been possible.
2. The national indices for the five personality dimensions replicate very poorly across the three available studies. The highest correlation between any two measures of what should be the same dimension is only .58**, between E1 and E2. Its moderate magnitude does not
allow the conclusion that E1 and E2 mea-sure the same thing.
On several occasions, two different measures of what should be the same dimension produce weak and insignificant correlations. In particular, A1, A2, and A3 are totally unrelated, which leads to the conclusion that there is no reliable national index of agreeableness in any of the three studies.
It is also remarkable that, on several occasions, various indices for a particu-lar dimension produce higher correlations with indices for other dimensions and not with the index for their corresponding dimension: C1 and A3 produce a higher correlation than C1 and C3; C1 and N3 yield a higher correlation than any correla-tion between any two neuroticism indices; and so forth.
One likely explanation for these dis-crepancies is that the three studies—McCrae (2002), McCrae and Terracciano (2005), and Schmitt et al. (2007)—relied on very different methods. The question-naires were not the same. Two studies used self-reports, one used peer reports. Factor structures were estimated either at the level of subsamples from each avail-able nation or at the individual level. National indices were also calculated in diverse ways.
Schmitt et al. (2007) recognize that their BFI study and McCrae’s (2002) NEO-PI-R study did not replicate each other’s national indices well. They provide four potential explanations, all of which deserve serious attention:
◆ The two studies used different samples.
◆ The NEO-PI-R study standardized the data to correct for age and gender dif-ferences, whereas the BFI study did not.
◆ The NEO-PI-R questionnaire corrects for acquiescence by administering items that are keyed in opposite directions, whereas the BFI study does not.

304 ◆ Major Cross-Cultural Studies
◆ The two questionnaires do not con-ceptualize the Big Five dimensions in exactly the same way. For example, neuroticism in the NEO-PI-R includes not only anxiety and depression-related items, but also angry hostility, self-consciousness, and impulsiveness.
McCrae (2002) predicted what would happen if the respondents in a particular nation had a tendency to choose the mid-dle of the scale. Compared to the United States, their nations would score high on neuroticism, low in extraversion and openness, and very low in agreeableness and conscientiousness. McCrae (2002) pointed out that although Asians scored low on extraversion in his study, they did not exhibit the other predicted character-istics, which ruled out a peculiar response
style in their answers. However, the pre-dicted characteristics match the East Asian pattern in Schmitt et al. (2007) almost perfectly, suggesting that East Asians pre-ferred neutral answers.
3. An examination of the internal reliability indices in Schmitt et al. (2007, Table 2, p. 185) reveals an interesting phenomenon. Added up, the five indi-ces produce a general reliability index that is highest for North America and Western Europe, lower for all other regions, and lowest in Africa. This sug-gests that although the BFI structure can be recreated with some creativity practi-cally everywhere in the world, it most closely reflects Western personalities and is, after all, a partly subjective cultural product.

◆ 305
◆ Introduction
Michael Bond was introduced in Section 9.2. A decade ago, he teamed up with Hong Kong psychologist Kwok Leung—one of the world’s leading experts in the methodology of cross-cultural psychology—and other associates for a large study of beliefs.
Leung et al. (2002) noted that the dominant construct that guided cross-cultural research was dimen-sions of national culture derived from studies of values. Despite the encouraging results that this approach had yielded, these authors felt that studies of beliefs might provide additional useful information about cross-cultural variation. Leung et al. (2002) iden-tified five individual-level dimen-sions of beliefs that they called “social axioms.” Bond, Leung, and a large team of associates decided
to repeat this exercise at the eco-logical level to extract national dimensions of culture based on social axioms. This resulted in an interesting publication by Bond et al. (2004), discussed here.
The authors’ full definition of social axioms was provided in 3.2.1.4. Here, the reader should be reminded of its most essential part: Social axioms are general beliefs. Also, according to Bond et al. (2004), they are not values that take the form “A is good/desirable/important” (p. 553) or norms for behavior. The examples provided by the authors suggest that what they call social axioms are generally held societal beliefs about what is true or false.
Bond, Leung, and associates believed that the study of social axioms at the national level was justified by the fact that they might reveal new dimensions of culture, different from those that
MICHAEL BOND, KWOK LEUNG, AND ASSOCIATES (2004): A STUDY OF SOCIAL AXIOMS
9.16

306 ◆ Major Cross-Cultural Studies
have emerged from studies of values, such as those by Hofstede (2001) or Schwartz (1994).
◆ Samples
The respondents were 7,672 univer-sity students from 41 cultural groups. The number of men and women in each national sample was balanced. Yet, the sample sizes varied from 64 in Venezuela to 710 in India. Samples of adults were also studied, but the study focused on the students’ results.
◆ Hypothesized Dimensions
Bond et al. (2004) briefly presented the five individual-level dimensions of social axioms reported in Leung et al. (2002) but did not expect that the same structure would be obtained at the ecological level.
◆ Questionnaire Items
The respondents were given 60 items, scored on a five-point Likert scale: “strongly believe,” “believe,” “no opin-ion,” “disbelieve,” and “strongly disbe-lieve” (Bond et al., 2004, p. 555). The relevant items—those that were associated with dimensions of national culture—are presented in the next section.
◆ Statistical Analysis
As a first step, national means were obtained for each item and for each nation. The publication does not report data stan-dardization by case. Thus, the issue of response style was apparently disregarded.
The 60 national means were then factor analyzed. The authors noted that, because
they worked with national means, it was not necessary for the number of cases to exceed by far the number of variables—a condition that is normally imposed on individual-level factor analysis. Two prin-cipal components were extracted because a scree plot suggested that this might be the best solution, even though the two components accounted for only 41.9% of the variance. The factors were varimax rotated. An oblique rotation produced similar factors and was abandoned. The items that define the two factors are repro-duced below with their factor loadings (Bond et al., 2004).
Factor 1 (dynamic externality )Belief in a religion helps one understand the meaning of life .92Good deeds will be rewarded, and bad deeds will be punished .92Religious faith contributes to good mental health .90There is a supreme being controlling the universe .90All things in the universe have been determined .90Belief in a religion makes people good citizens .89The just will eventually defeat the wicked .82Religion makes people escape from reality –.82One will succeed if he/she really tries .81Hard-working people will achieve more in the end .74Every problem has a solution .72Religious people are more likely to maintain moral standards .71Religious beliefs lead to unscientific thinking –.70Knowledge is necessary for success .67Failure is the beginning of success .65There are many ways for people to predict what will happen in the future .62Ghosts or spirits are people’s fantasy –.60
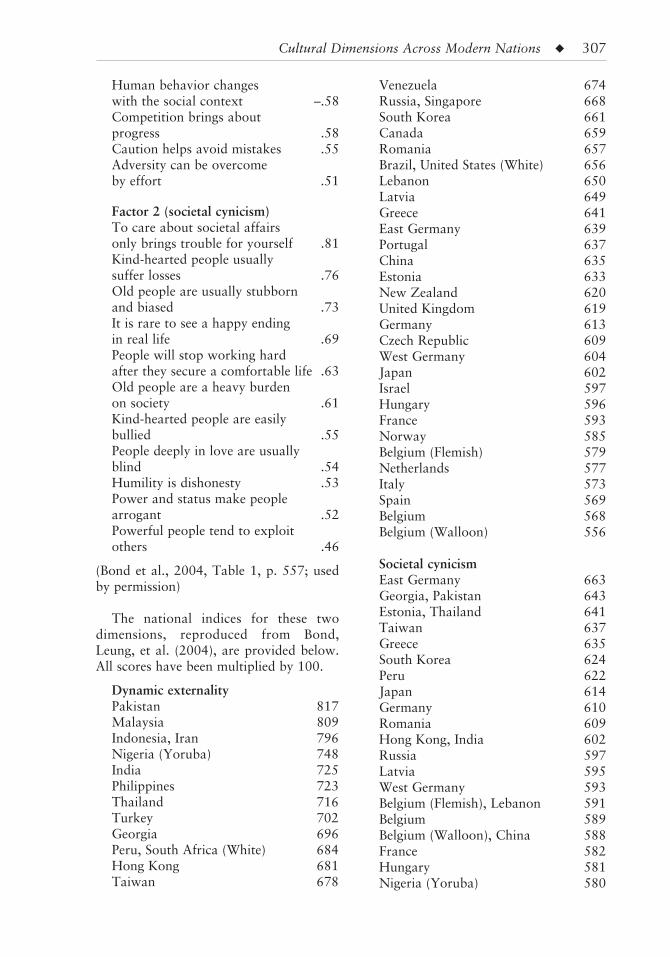
Cultural Dimensions Across Modern Nations ◆ 307
Human behavior changes with the social context –.58Competition brings about progress .58Caution helps avoid mistakes .55Adversity can be overcome by effort .51
Factor 2 (societal cynicism)To care about societal affairs only brings trouble for yourself .81Kind-hearted people usually suffer losses .76Old people are usually stubborn and biased .73It is rare to see a happy ending in real life .69People will stop working hard after they secure a comfortable life .63Old people are a heavy burden on society .61Kind-hearted people are easily bullied .55People deeply in love are usually blind .54Humility is dishonesty .53Power and status make people arrogant .52Powerful people tend to exploit others .46
(Bond et al., 2004, Table 1, p. 557; used by permission)
The national indices for these two dimensions, reproduced from Bond, Leung, et al. (2004), are provided below. All scores have been multiplied by 100.
Dynamic externalityPakistan 817Malaysia 809Indonesia, Iran 796Nigeria (Yoruba) 748India 725Philippines 723Thailand 716Turkey 702Georgia 696Peru, South Africa (White) 684Hong Kong 681Taiwan 678
Venezuela 674Russia, Singapore 668South Korea 661Canada 659Romania 657Brazil, United States (White) 656Lebanon 650Latvia 649Greece 641East Germany 639Portugal 637China 635Estonia 633New Zealand 620United Kingdom 619Germany 613Czech Republic 609West Germany 604Japan 602Israel 597Hungary 596France 593Norway 585Belgium (Flemish) 579Netherlands 577Italy 573Spain 569Belgium 568Belgium (Walloon) 556
Societal cynicismEast Germany 663Georgia, Pakistan 643Estonia, Thailand 641Taiwan 637Greece 635South Korea 624Peru 622Japan 614Germany 610Romania 609Hong Kong, India 602Russia 597Latvia 595West Germany 593Belgium (Flemish), Lebanon 591Belgium 589Belgium (Walloon), China 588France 582Hungary 581Nigeria (Yoruba) 580

308 ◆ Major Cross-Cultural Studies
Iran 567Venezuela 566Singapore 562Malaysia 554Spain 553Czech Republic, Turkey 546South Africa (White) 545Philippines 536New Zealand 533Finland 531United Kingdom 527Brazil 526Israel 524Netherlands 517Italy 513Canada, Indonesia 510United States (White) 507Norway 482
(Bond et al., 2004, Table 4, p. 564; used by permission)
The authors provided extensive nomo-logical networks for their dimensions. Some of these findings are discussed in the next sections.
◆ Contributions
1. This is a unique cross-cultural study, focusing entirely on general beliefs. It has revealed two interesting and con-vincing dimensions of national culture. The items that define them and the nomo-logical networks provided in the study show that dynamic externality is essen-tially about differences in some aspects of religiousness, nonscientific cognition (belief in ghosts), and a belief in a just world (probably including the hereafter), where people eventually get what they deserve. The authors note that, among other things, dynamic externality is related to less-favorable educational develop-ment: a fully plausible conclusion. Societal cynicism essentially reflects differences in pessimism and suspicion of others. Interestingly, it is highly and negatively
associated with preference for charismatic leadership (Bond, Leung, et al., 2004, Table 3, p. 561).
2. According to the authors’ own analysis, dynamic externality is highly cor-related with Inglehart’s traditional versus secular-rational values (.67**), whereas societal cynicism is highly correlated with Inglehart’s survival versus self-expres-sion values (.64**). The cultural model revealed by Bond, Leung, et al. (2004) partly replicates and confirms Inglehart’s model but with very different flavors.
3. Like the Chinese Culture Connection (1987), the study by Bond, Leung, et al. (2004) shows that an ecologi-cal factor analysis with a flat matrix (more variables than cases) does not necessarily cause problems.
4. Despite the fact that the two dimensions were derived by means of fac-tor analysis with varimax rotation and are therefore independent, both dimensions essentially create geographic contrasts between the developing nations and the rich ones. Therefore, the study provides valuable information about these two dif-ferent cultural worlds.
◆ Food for Thought
1. The authors provide vast nomo-logical networks for both dimensions that are often hard to interpret. Although the logic of some associations is clear and enough to validate the two dimensions as meaningful and worthy of attention (as well as future research), not all cor-relations are easy to explain. For example, it is not clear why, after controlling for national wealth, dynamic externality is strongly and negatively correlated with Levine et al.’s (2001) helping index and positively with mean scores for length of emotions. Another puzzle is the strong

Cultural Dimensions Across Modern Nations ◆ 309
positive correlation (.79**), also after controlling for wealth, between societal cynicism and Levine and Norenzayan’s (1999) pace of life index.
2. The authors note that countries that score high on dynamic externality have a stronger faith in scientific prog-ress. This is another bizarre finding, in view of the lower educational status of the high-scoring countries and strong endorsement of religion. A likely expla-nation is that their populations view sci-ence and technological development as an antidote to poverty, whereas Western populations, which score low on that dimension, are wary of the potential dangers that science and technological development create.
3. Many of the items, especially those that load highly on social cyni-cism, contain the word people. In essence, they ask the respondents to pro-vide a generalized description of people, which is likely to be a description of one’s fellow countrymen and women, as these are the ones that the respondents know best. In that sense, some of these items are close to national stereotypes (see 3.2.2.3.). Still, if these items are not taken as genuine descriptions of national character or national culture, they may provide valuable information about the respondents, rather than those they supposedly describe.
4. The authors note that societal cynicism is a new dimension of national culture. The correlations with Inglehart’s survival values is not high enough to sug-gest that the two dimensions are variants of the same construct, but it does show a high degree of similarity. Just as in the case of Inglehart’s survival values, societal cyni-cism is strongest in Eastern Europe and Asia, weakest in Northwestern Europe and the Anglo world. Indonesia and the Philippines also have low scores. This deserves special attention unless it is an artificial side effect of the factor analysis. 1
5. The origins of the reported cul-tural differences in societal cynicism are worth exploring. Wealth versus poverty is certainly not the only factor involved here. A detailed exploration of the nomological network of this dimension is also neces-sary. In particular, it would be interesting to investigate its association with levels of corruption and life satisfaction, to name just two of the various phenomena that could be associated with societal cynicism.
■ Note
1. If one constructs a societal cynicism scale with the items that have the highest loadings on the corresponding factor (and naturally without any dynamic externality items), it is likely to reshuffle the positions of some countries.

310 ◆
◆ Introduction
In the foreword to its main publica-tion, Project GLOBE was defined as “the Manhattan project of the study of the relationship of cul-ture to conceptions of leadership” (Triandis, 2004, p. xv). In terms of its scope, it was the second-largest undertaking in the area of cross-cultural research in the 1990s, after the World Values Survey. Carried out by 170 investigators from many different countries, it collected and presented data from 61 societies, most of which were nations, and produced an impressive book, written by differ-ent authors and edited by Robert House, Paul Hanges, Mansour Javidan, Peter Dorfman, and Vipin Gupta (2004), who are professors and researchers at American busi-ness schools or university depart-ments of management. Some of
the main GLOBE findings (House et al., 2004) are discussed below. These are dimensions of national culture that were extracted from national stereotypes and ideolo-gies. In 9.18., we will discuss GLOBE’s national indices that were extracted from descriptions of culturally endorsed leadership profiles.
The GLOBE researchers were inspired by Hofstede’s work. However, they took a critical approach to it as they believed that some of Hofstede’s dimen-sions did not measure what they were supposed to. Critiques of Hofstede are frequent in various chapters of the GLOBE book (see, for example, Ashkanasy et al., 2004, p. 313; Sully de Luque & Javidan, 2004, pp. 609, 627; etc.). To some extent, GLOBE was intended as an improvement on Hofstede’s work and a correction of his dimensions.
PROJECT GLOBE (2004): A STUDY OF NATIONAL STEREOTYPES AND IDEOLOGIES
9.17
Cultural Dimensions Across Modern Nations ◆ 311
◆ Samples
GLOBE collected its data from 17,370 middle managers in 951 organizations, operating in 59 countries. The organi-zations were companies that operated in three sectors: food processing, finan-cial services, and telecommunication ser-vices. The rationale for the selection of these industries was that they are pres-ent in all countries. The samples from some countries were split along ethnic or racial lines; for example, Black and White South Africans were studied separately as were East and West Germans. Ultimately, GLOBE presented dimensions of national culture with indices for 61 societies despite the fact that the project’s main publication repeatedly states that 62 societies were studied.
◆ Hypothesized Dimensions
GLOBE started out with nine preconceived dimensions, based on existing theories in the cultural and organizational behavior literature, defined in the following way (House et al., 2004, pp. 11–12):
Uncertainty avoidance: the extent to which members of an organization or society strive to avoid uncertainty by relying on established social norms, rituals, and bureaucratic practices
Power distance: the degree to which members of an organization or soci-ety expect and agree that power should be stratified and concentrated at higher levels of an organization or government
Institutional collectivism: the degree to which organizational and societal insti-tutional practices encourage and reward collective distribution of resources and collective action
In-group collectivism: the degree to which individuals express pride, loy-alty, and cohesiveness in their organiza-tions or families
Assertiveness: the degree to which indi-viduals in organizations or societies are assertive, confrontational, and aggres-sive in social relationships
Future orientation: the degree to which individuals in organizations or societ-ies engage in future-oriented behav-iors such as planning, investing in the future, and delaying individual or col-lective gratification
Performance orientation: the degree to which an organization or society encourages and rewards group mem-bers for performance improvement and excellence
Humane orientation: the degree to which individuals in organizations or societies encourage and reward individuals for being fair, altruistic, friendly, generous, caring, and kind to others
Interestingly, each dimension was con-ceptualized as having two versions. One would supposedly reveal societies and their cultures as they are, whereas the other would reflect the respondents’ con-cepts of an ideal society. As it turned out, in some cases the two versions of the dimensions were negatively correlated across nations.
◆ Questionnaire Items
The researchers started out with a high number of items that could hypothetically tap the constructs of interest. A series of tests resulted in the elimination of many items. Finally, scales were constructed for each hypothesized dimension of national culture that consisted of small numbers

312 ◆ Major Cross-Cultural Studies
of items. For instance, performance ori-entation was measured with three items, whereas the scale for in-group collectiv-ism consisted of four items. Each item came in two versions, one for society “as is” and one for society as it “should be.” In many cases, the difference between the two versions was the presence or absence of the modal verb should in the respective item. All items were scored on seven-point Likert scales, ranging, for instance, from “strongly agree” to “strongly
disagree”; in some cases, the respondents had to choose between opposites placed on a Likert scale. The sample items for the two versions of each dimension—“as is” and “should be”—are reproduced below, as provided by GLOBE. Another term for the “as is” versions, used by GLOBE throughout the book, is “prac-tices.” The “should be” versions are also referred to as “values.” Here, these terms are avoided for reasons that are explained in the Food for Thought section below.
GLOBE’s Sample Items for Measuring GLOBE’s Nine Dimensions in Their Two Versions
In-group collectivism
As is:
1. In this society, children take pride in the individual accomplishments of their parents.2. In this society, parents take pride in the individual accomplishments of their children.
Should be:
1. In this society, children should take pride in the individual accomplishments of their parents.
2. In this society, parents should take pride in the individual accomplishments of their children.
(House et al., 2004, Tables 16.4a–d, p. 464; used by permission)
Future orientation
As is:
1. In this society, the accepted norm is to: plan for the future/accept the status quo.2. In this society, people place more emphasis on: solving current problems/planning
for the future.
Should be:
1. I believe that the accepted norm in this society should be to: plan for the future/accept the status quo.
2. I believe that people who are successful should: plan ahead/take life events as they occur.
(House et al., 2004, Tables 13.2a, b, p. 302; used by permission)
Institutional collectivism
As is:
1. In this society, leaders encourage group loyalty even if individual goals suffer.2. The economic system in this society is designed to maximize: individual interests/collec-
tive interests.

Cultural Dimensions Across Modern Nations ◆ 313
Should be:
1. I believe that, in general, leaders should encourage group loyalty even if individual goals suffer.
2. I believe that the economic system in this society should be designed to maximize: individual interests/collective interests.
(House et al., 2004, Tables 16.4a–d, p. 464; used by permission)
Gender egalitarianism
As is:
1. In this society, boys are encouraged more than girls to attain a higher education.2. In this society, who is more likely to serve in a position of high office: men/women?
Should be:
1. I believe that boys should be encouraged to attain a higher education more than girls.2. I believe that opportunities for leadership positions should be: more available for men
than for women/equally distributed for men and for women/more available for women than for men.
(House et al., 2004, Table 14.3, p. 360; used by permission)
Power distance
As is:
1. In this society, followers are expected to: obey their leaders without question/question their leaders when in disagreement.
2. In this society, power is: concentrated at the top/shared throughout the society.
Should be:
1. I believe that followers should: obey their leader without question/question their leader when in disagreement.
2. I believe that power should be: concentrated at the top/shared throughout the society.
(House et al., 2004, Tables 17.3a, b, p. 537; used by permission)
Performance orientation
As is:
In this society, students are encouraged to strive for continuously improved performance.
Should be:
In this society, students should be encouraged to strive for continuously improved perfor-mance.
(House et al., 2004, Tables 12.2, 12.3, pp. 246–247; used by permission)
Humane orientation
As is:
1. In this society, people are generally: very concerned about others/not at all concerned about others.
2. In this society, people are generally: very sensitive toward others/not at all sensitive toward others.

314 ◆ Major Cross-Cultural Studies
Should be:
1. In this society, people should be encouraged to be: very concerned about others/not at all concerned about others.
2. In this society, people should be encouraged to be: very sensitive toward others/not at all sensitive toward others.
(House et al., 2004, Tables 18.2a, b, pp. 571–572; used by permission)
Assertiveness
As is:
1. In this society, people are generally: assertive/nonassertive.2. In this society, people are generally: tough/tender.
Should be:
1. In this society, people should be encouraged to be: assertive/nonassertive.2. In this society, people should be encouraged to be: tough/tender.
(House et al., 2004, Tables 15.2a, b, p. 407; used by permission)
◆ Statistical Analysis
The reliability of each dimension scale was analyzed in a variety of different ways, including factor analysis. The tests confirmed that each scale was reliable and the national scores for each item could be averaged to produce dimension scores. The 18 national indices that GLOBE obtained are reproduced below. All scores have been multiplied by 100.
Performance orientation “as is” Switzerland 494 Singapore 490 Hong Kong 480 Albania 481 New Zealand 472 South Africa (Blacks) 466 Iran 458 Taiwan 456 South Korea 455 Canada, United States 449 Philippines 447 China 445 Austria 444 Indonesia 441 Australia, Ireland 436
Malaysia 434 Netherlands 432 Egypt 427 India, Switzerland (French), West Germany 425 Zimbabwe 424 Denmark, Japan 422 Ecuador 420 Zambia 416 Costa Rica 412 France, South Africa (Whites) 411 Mexico 410 East Germany 409 England, Israel 408 Brazil 404 Spain 401 Morocco 399 Kuwait 395 Colombia 394 Thailand 393 Nigeria 392 Poland 389 Georgia 388 Turkey 383 Finland, Guatemala 381 El Salvador, Sweden 372 Namibia 367 Slovenia 366 Argentina 365

Cultural Dimensions Across Modern Nations ◆ 315
Bolivia 361 Portugal 360 Italy 358 Kazakhstan 357 Qatar 345 Hungary 343 Russia 339 Venezuela 332 Greece 320
(House et al., 2004, Table 12.9, p. 250; used by permission)
Performance orientation “should be” El Salvador 658 Zimbabwe 645 Colombia 642 Slovenia 641 Namibia, Portugal 640 Argentina, Venezuela 635 Ecuador 632 Philippines 631 Nigeria 627 Zambia 624 South Africa (Whites) 623 Mexico 616 Canada 615 Guatemala, United States 614 Brazil 613 Poland 612 Finland 611 Austria 610 East Germany 609 Iran 608 Italy 607 Bolivia, India 605 Malaysia 604 Kuwait 603 West Germany 601 Ireland, Switzerland (French) 598 Hungary, Qatar 596 Cost Rica, Egypt, England, New Zealand 590 Australia 589 Switzerland 582 Greece 581 Spain, Sweden 580 Morocco 576 Israel 575 Taiwan, Thailand 574
Indonesia 573 Singapore 572 Georgia 569 China 567 France 565 Hong Kong 564 Albania 563 Denmark 561 Russia 554 Netherlands 549 Kazakhstan 541 Turkey 539 South Korea 525 Japan 517 South Africa (Blacks) 492
(House et al., 2004, Table 12.10, p. 251; used by permission)
Future orientation “as is” Singapore 507 Switzerland 473 South Africa (Blacks) 464 Netherlands 461 Malaysia 458 Austria 446 Canada, Denmark 444 Sweden 439 Japan 429 England 428 Switzerland (French), West Germany 427 Finland 424 India 419 Philippines, United States 415 South Africa (Whites) 413 Australia, Nigeria 409 Hong Kong 403 Ireland 398 South Korea 397 Taiwan 396 East Germany 395 Mexico 387 Albania, Egypt, Indonesia 386 Israel 385 Brazil 381 El Salvador 380 Qatar 378 Zimbabwe 377 China 375 Ecuador, Turkey 374

316 ◆ Major Cross-Cultural Studies
Portugal 371 Iran 370 Zambia 362 Bolivia 361 Costa Rica 360 Slovenia 359 Kazakhstan 357 Spain 351 Namibia 349 France 348 New Zealand 347 Thailand 343 Georgia 341 Greece 340 Venezuela 335 Colombia 327 Kuwait, Morocco 326 Italy 325 Guatemala 324 Hungary 321 Poland 311 Argentina 308 Russia 288
(House et al., 2004, Table 13.5, p. 304; used by permission)
Future orientation “should be” Thailand 620 Namibia 612 Zimbabwe 607 Nigeria 604 El Salvador 598 Ecuador 594 Philippines 593 Qatar 592 Guatemala, Italy 591 Zambia 590 Malaysia 589 Mexico 586 Morocco 585 Iran 584 Turkey 583 Egypt 580 Venezuela 579 Argentina 578 Kuwait 574 Hungary, Indonesia 570 Brazil, South Korea 569 Colombia 568
South Africa (Whites) 566 Bolivia, Spain 563 India 560 Georgia 555 New Zealand 554 Singapore 551 Hong Kong 550 Russia 548 Portugal 543 Albania, Slovenia 542 Canada 535 United States 531 Israel, Japan 525 East Germany 523 Ireland 522 Costa Rica, Poland, South Africa (Blacks), Taiwan 520 Greece 519 Australia 515 Austria 511 Finland, Netherlands 507 England 506 Kazakhstan 505 France 496 Sweden 489 West Germany 485 Switzerland (French) 480 Switzerland 479 China 473 Denmark 433
(House et al., 2004, Table 13.6, p. 306; used by permission)
Gender egalitarianism “as is” Hungary 408 Russia 407 Poland 402 Slovenia 396 Denmark 393 Namibia 388 Kazakhstan, Sweden 384 Albania 371 Canada, Singapore 370 Colombia, England 367 Portugal, South Africa (Blacks) 366 France, Mexico, Philippines 364 Qatar 363

Cultural Dimensions Across Modern Nations ◆ 317
Venezuela 362 Costa Rica 356 Bolivia, Georgia 355 Malaysia 351 Netherlands 350 Argentina 349 Greece 348 Hong Kong 347 Switzerland (French) 342 Australia 340 Finland, Thailand 335 United States 334 Brazil 331 South Africa (Whites) 327 Indonesia 326 Italy 325 New Zealand 322 Ireland 321 Israel, Japan 319 Taiwan 318 El Salvador 316 West Germany 310 Austria 309 Ecuador 307 East Germany 306 China 305 Zimbabwe 304 Guatemala 302 Nigeria, Spain 301 Iran 299 Switzerland 297 India 290 Turkey 289 Zambia 286 Morocco 284 Egypt 281 Kuwait 258 South Korea 250
(House et al., 2004, Table 14.10a, p. 365; used by permission)
Gender egalitarianism “should be” England 517 Sweden 515 Ireland 514 Portugal 513 Canada 511 Denmark 508 United States 506
Australia 502 Colombia 500 Brazil, Netherlands 499 Argentina 498 Switzerland 492 East Germany 490 Greece, West Germany 489 Italy 488 Austria, Slovenia 483 Israel, Spain 482 Bolivia, Kazakhstan 475 Mexico 473 Israel 471 Switzerland (French) 469 El Salvador 466 Costa Rica 464 Hungary 463 South Africa (Whites) 460 Ecuador 459 Philippines 458 Guatemala 453 Poland 452 India, Singapore 451 Turkey 450 Zimbabwe 446 France 440 Hong Kong 435 Japan 433 Zambia 431 South Africa (Blacks) 426 Namibia 425 Finland, Nigeria 424 New Zealand 423 South Korea 422 Albania 419 Russia 418 Thailand 416 Taiwan 406 Indonesia 389 Malaysia 378 Iran 375 Morocco 374 Georgia 373 China 368 Kuwait 345 Qatar 338 Egypt 318
(House et al., 2004, Table 14.10b, p. 366; used by permission)

318 ◆ Major Cross-Cultural Studies
Assertiveness “as is” Albania 489 Hungary, Nigeria 479 East Germany 473 Hong Kong 467 Austria, El Salvador 462 South Africa (Whites) 460 Greece 458 United States, West Germany 455 Turkey 453 Morocco 452 Switzerland 451 Kazakhstan 446 Mexico 445 Spain 442 South Korea 440 South Africa (Blacks) 436 Venezuela 433 Netherlands 432 Australia 428 Israel 423 Argentina 422 Brazil, Colombia 420 Georgia 418 Singapore 417 England 415 France 413 Qatar 411 Ecuador 409 Italy, Zambia 407 Poland, Zimbabwe 406 Canada 405 Iran 404 Philippines 401 Slovenia 400 Ireland, Taiwan 392 Egypt, Namibia 391 Guatemala 389 Malaysia 387 Indonesia 386 Finland 381 Denmark 380 Bolivia 379 China 376 Costa Rica 375 India 373 Russia 368 Portugal 365 Thailand 364 Kuwait 363
Japan 359 Switzerland (French) 347 New Zealand 342 Sweden 338
(House et al., 2004, Table 15.6, p. 410; used by permission)
Assertiveness “should be” Japan 556 China 544 Philippines 514 Iran 499 Hong Kong, Malaysia 481 India 476 Indonesia 472 Zimbabwe 460 Slovenia 459 Albania, Singapore 441 Zambia 438 Georgia 435 United States 432 Canada 415 Costa Rica 405 Spain 400 Ireland 399 Namibia 391 Poland 390 Kazakhstan 384 Italy, South Africa (Blacks) 382 Australia 381 Qatar 380 Mexico 379 Switzerland (French) 378 Israel, Kuwait 376 South Korea 375 Bolivia 373 England 370 South Africa (Whites) 369 Finland 368 Ecuador 365 Guatemala 364 El Salvador 362 Sweden 361 Portugal 358 New Zealand 354 Thailand 348 Morocco 344 Colombia 343 Denmark 339 France 338

Cultural Dimensions Across Modern Nations ◆ 319
Hungary 335 Venezuela 333 Egypt, Taiwan 328 Argentina 325 East Germany, Nigeria 323 Switzerland 321 West Germany 309 Netherlands 302 Greece 296 Brazil 291 Russia 283 Austria 281 Turkey 266
(House et al., 2004, Table 15.7, p. 411; used by permission)
Societal institutional collectivism “as is”
Sweden 522 South Korea 520 Japan 519 Singapore 490 New Zealand 481 Denmark 480 China 477 Philippines 465 Finland, Ireland 463 South Africa (Whites) 462 Malaysia, Zambia 461 Taiwan 459 Albania, Indonesia 454 Poland 453 Ecuador, Qatar, Russia 450 Kuwait 449 Israel, Netherlands 446 South Africa (Blacks) 439 Canada, India 438 Austria 430 Australia, Kazakhstan 429 England 427 Switzerland (French) 422 United States 420 Nigeria 414 Hong Kong, Namibia, Slovenia 413 Zimbabwe 412 Mexico, Switzerland 406 Bolivia 404 Georgia, Thailand, Turkey 403 Venezuela 396 Costa Rica, France 393 Portugal 392
Ecuador 390 Iran 388 Morocco 387 Spain 385 Brazil 383 Colombia 381 West Germany 379 El Salvador 371 Guatemala 370 Italy 368 Argentina 366 East Germany 356 Hungary 353 Greece 325
(House et al., 2004, Table 16.7a, p. 468; used by permission)
Societal institutional collectivism “should be”
El Salvador 565 Brazil 562 Iran 554 Ecuador 541 Greece 540 Venezuela 539 Colombia 538 Argentina 532 Portugal 530 Turkey 526 Guatemala 523 Spain 520 Costa Rica, Indonesia 518 Kuwait, Taiwan 515 Italy 513 Bolivia, Thailand 510 Nigeria 503 Morocco 500 Mexico 492 Zimbabwe 487 France 486 Egypt 485 West Germany 482 Philippines 478 Zambia 474 Austria 473 India 471 Switzerland 469 Germany 468 Ireland 459

320 ◆ Major Cross-Cultural Studies
China 456 Netherlands, Singapore 455 Hungary 450 Albania 444 Hong Kong 443 Australia 440 Namibia, Slovenia, South Africa (Whites) 438 England, Switzerland (French) 431 South Africa (Blacks) 430 Israel 427 Poland 422 New Zealand 420 Denmark 419 Canada, United States 417 Finland 411 Kazakhstan 404 Japan 399 Sweden 394 Korea 390 Russia 389 Georgia 383
(House et al., 2004, Table 16.7c, p. 470; used by permission)
Societal in-group collectivism “as is” Philippines 636 Georgia 619 Iran 603 India 592 Turkey 588 Morocco 587 Zambia 584 Ecuador 581 China, Kuwait 580 Albania 574 Colombia 573 Mexico 571 Thailand 570 Indonesia 568 Egypt, Singapore 564 Guatemala, Russia 563 Taiwan 559 Zimbabwe 557 Nigeria 555 South Korea 554 Venezuela 553 Poland 552 Argentina, Malaysia, Portugal 551
Bolivia 547 Spain 545 Slovenia 543 El Salvador 535 Costa Rica, Hong Kong 532 Greece 527 Kazakhstan 526 Hungary 525 Brazil 518 Ireland 514 South Africa (Blacks) 509 Italy 494 Austria 485 Qatar 471 Israel 470 Japan 463 East Germany, Namibia 452 South Africa (Whites) 450 France 437 Canada 426 United States 425 Australia 417 England 408 Finland 407 West Germany 402 Switzerland 397 Switzerland (French) 385 Netherlands 370 New Zealand 367 Sweden 366 Denmark 353
(House et al., 2004, Table 16.7b, p. 469; used by permission)
Societal in-group collectivism “should
be” El Salvador 652 Colombia 625 New Zealand 621 Philippines 618 Ecuador, Venezuela 617 Argentina 615 Guatemala 614 Costa Rica 608 Namibia 607 Sweden 604 Bolivia 600 Canada 597 Mexico 595 Portugal 594
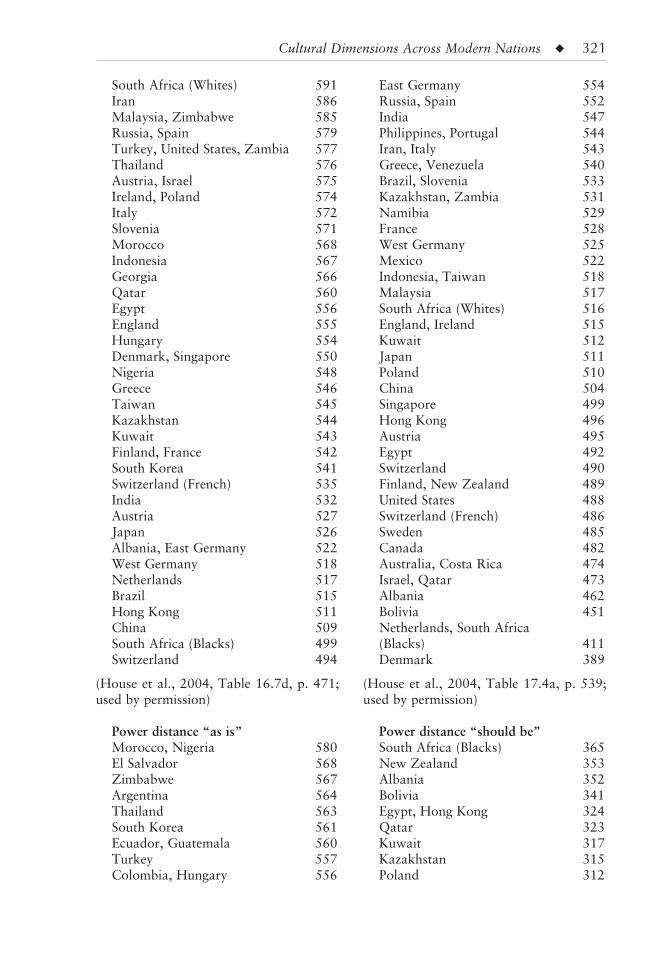
Cultural Dimensions Across Modern Nations ◆ 321
South Africa (Whites) 591 Iran 586 Malaysia, Zimbabwe 585 Russia, Spain 579 Turkey, United States, Zambia 577 Thailand 576 Austria, Israel 575 Ireland, Poland 574 Italy 572 Slovenia 571 Morocco 568 Indonesia 567 Georgia 566 Qatar 560 Egypt 556 England 555 Hungary 554 Denmark, Singapore 550 Nigeria 548 Greece 546 Taiwan 545 Kazakhstan 544 Kuwait 543 Finland, France 542 South Korea 541 Switzerland (French) 535 India 532 Austria 527 Japan 526 Albania, East Germany 522 West Germany 518 Netherlands 517 Brazil 515 Hong Kong 511 China 509 South Africa (Blacks) 499 Switzerland 494
(House et al., 2004, Table 16.7d, p. 471; used by permission)
Power distance “as is” Morocco, Nigeria 580 El Salvador 568 Zimbabwe 567 Argentina 564 Thailand 563 South Korea 561 Ecuador, Guatemala 560 Turkey 557 Colombia, Hungary 556
East Germany 554 Russia, Spain 552 India 547 Philippines, Portugal 544 Iran, Italy 543 Greece, Venezuela 540 Brazil, Slovenia 533 Kazakhstan, Zambia 531 Namibia 529 France 528 West Germany 525 Mexico 522 Indonesia, Taiwan 518 Malaysia 517 South Africa (Whites) 516 England, Ireland 515 Kuwait 512 Japan 511 Poland 510 China 504 Singapore 499 Hong Kong 496 Austria 495 Egypt 492 Switzerland 490 Finland, New Zealand 489 United States 488 Switzerland (French) 486 Sweden 485 Canada 482 Australia, Costa Rica 474 Israel, Qatar 473 Albania 462 Bolivia 451 Netherlands, South Africa (Blacks) 411 Denmark 389
(House et al., 2004, Table 17.4a, p. 539; used by permission)
Power distance “should be” South Africa (Blacks) 365 New Zealand 353 Albania 352 Bolivia 341 Egypt, Hong Kong 324 Qatar 323 Kuwait 317 Kazakhstan 315 Poland 312

322 ◆ Major Cross-Cultural Studies
Morocco 311 China 310 Taiwan 309 Singapore 304 Malaysia 297 Japan, Namibia, Thailand 286 Mexico, United States 285 Georgia 284 England, Iran, Switzerland 280 Australia 278 Denmark, France 276 Israel, Philippines 272 Ireland 271 Canada, Sweden 270 East Germany, Indonesia, Nigeria 269 El Salvador 268 Zimbabwe 267 India, South Africa (Whites) 264 Russia 262 Costa Rica 258 Slovenia 257 South Korea 255 West Germany 254 Hungary 249 Italy 247 Netherlands 245 Austria, Switzerland 244 Zambia 243 Turkey 241 Greece 239 Portugal 238 Brazil, Guatemala 235 Argentina 233 Ecuador 230 Venezuela 229 Spain 226 Finland 219 Colombia 204
(House et al., 2004, Table 17.4b, p. 540; used by permission)
Humane orientation “as is” Zambia 523 Philippines 512 Ireland 496 Malaysia 487 Thailand 481 Ecuador 473
Indonesia 469 Ecuador 465 Albania 464 India 457 Kuwait 452 Canada 449 Zimbabwe 445 Denmark 444 Qatar 442 Costa Rica 439 China 436 South Africa (Blacks) 434 New Zealand 432 Japan 430 Australia 428 Venezuela 425 Iran 423 Morocco 419 Georgia 418 United States 417 Taiwan 411 Israel, Nigeria, Sweden 410 Bolivia 405 Argentina, Kazakhstan 399 Mexico 398 Finland, Namibia 396 Russia, Turkey 394 Switzerland (French) 393 Portugal 391 Hong Kong 390 Guatemala 389 Netherlands 386 South Korea 381 Slovenia 379 Austria, Colombia, England 372 El Salvador 371 Brazil 366 Italy 363 Poland 361 Switzerland 360 Singapore, South Africa (Whites) 349 East Germany, France 340 Hungary 335 Greece 334 Spain 332 West Germany 318
(House et al., 2004, Table 18.4b, p. 573; used by permission)

Cultural Dimensions Across Modern Nations ◆ 323
Humane orientation “should be” Nigeria 608 Finland 581 Singapore 579 Austria 576 Spain 569 Brazil 568 France 567 South Africa (Whites), Sweden 565 Canada 564 Israel, Kazakhstan, Switzerland 562 Colombia, Iran 561 Georgia, South Korea 560 Russia 559 Argentina, Australia, Italy 558 Switzerland 554 United States, Zambia 553 Turkey 552 Malaysia, Morocco 551 Hungary 548 Ireland 547 El Salvador, West Germany 546 Denmark 545 East Germany 544 England 543 Japan 541 Namibia 540 Philippines 536 Albania 534 China, Hong Kong 532 Portugal, Venezuela 531 Poland, Qatar 530 India 528 Ecuador, Guatemala, Taiwan 526 Slovenia 525 Greece 523 Netherlands 520 Zimbabwe 519 Egypt 517 Indonesia 516 Mexico 510 Bolivia, South Africa (Blacks) 507 Kuwait 506 Thailand 501 Costa Rica 499 New Zealand 449
(House et al., 2004, Table 18.4c, p. 574; used by permission)
Uncertainty avoidance “as is” Switzerland 537 Sweden 532 Singapore 531 Denmark, West Germany 522 Austria, East Germany 516 Finland 502 Switzerland (French) 498 China 494 Malaysia 478 New Zealand 475 Netherlands 470 England 465 South Africa (Blacks) 459 Canada 458 Albania 457 France 443 Australia 439 Taiwan 434 Hong Kong 432 Ireland 430 Nigeria 429 Kuwait 421 Namibia 420 Mexico 418 Indonesia 417 India, United States, Zimbabwe 415 Zambia 410 South Africa (Whites) 409 Japan 407 Ecuador 406 Israel 401 Qatar 399 Spain 397 Thailand 393 Portugal 391 Philippines 389 Costa Rica 382 Italy 379 Slovenia 378 Ecuador 368 Iran 367 Kazakhstan 366 Argentina, Morocco 365 Turkey 363 El Salvador, Poland 362 Brazil 360 Colombia 357 South Korea 355 Georgia 350

324 ◆ Major Cross-Cultural Studies
Venezuela 344 Greece 339 Bolivia 335 Guatemala 330 Hungary 312 Russia 288
(House et al., 2004, Table 19.7, p. 622; used by permission)
Uncertainty avoidance “should be” Thailand 561 Nigeria 560 Albania 537 Egypt, Iran 536 El Salvador, Morocco 532 Taiwan 531 China 528 Mexico, Venezuela 526 Georgia 524 Indonesia 523 Ecuador 516 Philippines 514 Namibia 513 Greece 509 Russia 507 Brazil, Slovenia 499 Colombia 498 Guatemala, Malaysia 488 Qatar 482 South Africa (Blacks) 479 Kuwait 477 Spain 476 India, Zimbabwe 473 Poland 471 Bolivia 470 South Africa (Whites), South Korea, Turkey, Zambia 467 Argentina, Hungary 466 Hong Kong 463 Costa Rica 458 Italy 447 Portugal 443 Kazakhstan 442 Israel 438 Japan 433 France 426 Singapore 422 England 411 New Zealand 410
Ireland 402 United States 400 Australia 398 East Germany 394 Finland 385 Switzerland (French) 383 Denmark 382 Canada 375 Austria 366 Sweden 360 West Germany 332 Netherlands 324 Switzerland 316
(House et al., 2004, Table 19.8, p. 623; used by permission)
◆ Contributions
1. Commenting on Project GLOBE, Fischer (2009) noted that it triggered “one of the most heated and controversial debates in contemporary cross-cultural manage-ment research” (p. 26). Paradoxically, this debate helped elucidate issues that researchers in the field of culture had pre-viously neglected. For example, analyzing GLOBE’s “should be” scales, Smith (2006) realized that these measure what this book calls norms or ideologies (3.2.1.2.), not personal values. Smith explained why the two might have nothing to do with each other in some cases. Personal values are measured by asking respondents what is important to them. Questions about what should be important to people (generally speaking) are often interpreted as referring to norms that others should respect. The answers may not provide any indication of whether the respondents approve of these norms as guiding principles in their own lives. Thus, the GLOBE debate helped the cross-cultural academic community realize the difference between personal values and norms or ideologies for others.
2. After the analysis of GLOBE’s “as is” scales, McCrae, Terracciano, Realo,
Cultural Dimensions Across Modern Nations ◆ 325
and Allik (2008) concluded that some of them measure unfounded national ste-reotypes. The reason for that is that the items for those scales ask the respondents to summarize the cultures or predominant personalities in their societies. As noted in 3.2.2.3., this is a task on which even cultural experts can fail miserably unless they have access to statistical data from properly organized research. Better than any other research project before, GLOBE illustrated the perils of asking people to provide stereotypical descriptions of cul-tures and prevalent personality types.
Harzing et al. (2009) noted that some GLOBE dimensions are highly correlated with other dimensions, whereas other GLOBE dimensions—such as humane orientation and assertiveness—are not. These authors believe that this is due to differences in the item format that GLOBE used: agree/disagree questions versus scale anchors. But McCrae et al.’s (2008) interpretation is more plausible: Humane orientation and assertiveness “as is” reflect unfounded national stereotypes. As a result, these measures do not have convincing predictive properties.
3. Although many stereotypes often cannot be validated, some can. GLOBE’s in-group collectivism practices (“as is”) dimension is defined by stereotypical descriptions of cultures as seen by their members, but its national index can be val-idated through correlations with external variables. The reason for this is explained in 3.2.2.3. Apparently, GLOBE’s items for this dimension tapped very salient and very simple cultural features that the respon-dents were well aware of. As a result, GLOBE’s measure of in-group collectivism practices provides a valid national index of collectivism versus individualism that has strong face validity and yields high correlations with previous measures of that dimension by other scholars, such as Hofstede (2001). GLOBE’s in-group col-lectivism practices index can be used as a benchmark for any further measurement
of collectivism versus individualism at the national level.
4. Minkov and Blagoev (2012) con-cluded that GLOBE’s assertiveness “should be” is a new valid dimension of culture. It appears that their conclusion is acceptable. High-scoring societies are characterized by a belief in a just and equitable world where people get what they deserve and should not be given much help in case of failure. The dimension creates a convinc-ing nomological network that supports this conclusion: The index is positively correlated with a World Values Survey item that measures agreement that poor people are lazy, and negatively with a Pew Research Center item measuring agree-ment that the government should take care of the poor. GLOBE’s assertiveness “should be” warrants further research, as it is likely to reveal additional interesting information about cross-cultural differ-ences, some of which may be relevant in international management.
◆ Food for Thought
1. Being management experts, the GLOBE researchers believed that they could study national cultures by means of an approach designed for the study of organizations: asking the respondents to summarize what they perceive as typical of their organization. Section 3.2.2.3. of this book explains why this approach results in stereotypes that may or may not be subsequently validated. They are more likely to be validated when the object of study is a small organization (which the respondents may be well familiar with) than a nation (which is far more complex than any organization and the respondents quite often cannot be expected to be able to summarize its characteristics adequately). GLOBE’s transfer of this approach from the study of organizations to the study of national

326 ◆ Major Cross-Cultural Studies
cultures appears to be partly a success, partly a failure: Some “as is” dimensions are more meaningful and have better pre-dictive properties than others.
2. What GLOBE measured was a question that was first asked by Hofstede (2006). Minkov and Blagoev (2012) took a closer look at this issue by examining the nomological networks of GLOBE’s dimensions. Following the logic of the present book, Minkov and Blagoev were primarily interested in what GLOBE’s measures predicted and, to a lesser extent, how these predictions related to GLOBE’s conceptualizations. They concluded that some of GLOBE’s indices generated con-vincing networks and geographic distri-butions of countries. In that sense, they are meaningful and valid measures of national culture. Other indices were more controversial. A summary of Minkov and Blagoev’s (2012) findings is provided below plus some additional thoughts.
IN-GROUP COLLECTIVISM, UNCERTAINTY AVOIDANCE, AND FUTURE ORIENTATION “AS IS”
These three dimensions are highly inter-correlated and measure cultural differ-ences between rich and poor societies as they also correlate with measures of national wealth per person. GLOBE’s uncertainty avoidance has nothing to do with Hofstede’s homonym as it reflects something entirely different: the degree of Western order in society. 1
The in-group collectivism “as is” index yields strong correlations with other simi-lar constructs: Hofstede’s individualism ( r = –.81**, n = 47) and the Chinese Culture Connection’s (1987) integration ( r = –.75, n = 20). It also correlates with raw GDP per capita in 1998 (UN Statistics Division, 2009) at –.76** ( n = 57) and creates a clear-cut division between the richest and poorest countries. The index is under-pinned by a valid and meaningful dimen-sion of national culture.
Uncertainty avoidance “as is” yields somewhat lower correlations with these variables and the geographic distribution that it creates is similar, yet somewhat con-fusing. If the dimension measures orderli-ness and consistency, and if the ranking is topped by Switzerland, Sweden, Singapore, Denmark, Germany, and Austria, it reflects order as understood in the rich world. If this is so, it is confusing to find out from the country ranking that Chinese see more of this order in their society than New Zealanders, Dutch, and Canadians or that Nigeria is more orderly, in a Western sense, than the United States, Japan, or Spain. The fact that Black South Africans describe their society as far more orderly than White South Africans do clearly sug-gests that the answers provided by some samples are contaminated with ethnic or national stereotypes and strongly subjec-tive views of the reality in their countries. It is also evident that some samples have their own ideas of order and consistency that do not match the ideas of other countries. Only this can explain why Hungary and Russia have the most disorderly societies of all 61 studied by GLOBE, according to their respondents, whereas Black South Africa and Zimbabwe are ahead of the United States.
Future orientation “as is” exhibits the same characteristics. The ranking is also dominated by more or less the same rich countries as in the case of uncertainty avoidance “as is.” This time, Black South Africa is in the third position. Again, Nigeria is ahead of countries with Western cultures, such as Australia, Ireland, Italy, and New Zealand. One can only wonder what the respondents of the different countries had in mind when they created these rankings.
INSTITUTIONAL COLLECTIVISM “AS IS”
Minkov and Blagoev (2012) note that the nomological network of this dimen-sion provided by GLOBE consists

Cultural Dimensions Across Modern Nations ◆ 327
overwhelmingly of weak or insignificant correlations. This is hardly surprising if one considers some of the items that were used to measure the dimensions: “The economic system in this society is designed to maximize: individual interests/collective interests” (Gelfand, Bhawuk, Nishii, & Bechtold, 2004, p. 464). This is a question for experts in economics or political sci-ence, and even their answers are likely to be discordant and tinted by their political convictions. This may explain the poor predictive properties of GLOBE’s institu-tional collectivism “as is.”
GENDER EGALITARIANISM “AS IS”
Although people can be expected to be knowledgeable about gender relationships in their countries, GLOBE’s experience demonstrates that their gender stereotypes are not supported by external evidence. According to GLOBE’s own data, gender egalitarianism “as is” is uncorrelated with measures of gender role ideologies and yields weak correlations with statistics such as women’s economic activity, wom-en’s purchasing power, and percentage of women in government. A quick look at the country rankings reveals immediately that it is affected by unsupported national ste-reotypes of unclear origin: Qatari respon-dents report greater gender egalitarianism than Dutch and Finnish ones, Iranians perceive genders in their country as slightly more equal than Swiss. In fact, it is the “should be” ranking for this dimension that more correctly reflects the real situa-tion across the world: The highest scorers on that dimension are all Western coun-tries where gender egalitarianism is taken very seriously, whereas the lowest scorers are all Islamic countries, plus China and Georgia.
POWER DISTANCE “AS IS”
Carl, Gupta, and Javidan (2004) report high correlations between this dimension
and three other measures of the same construct, including Hofstede’s. Evidently, GLOBE’s power distance “as is” is a meaningful dimension of national culture. It would be strange if it were not. Middle managers are normally knowledgeable about power distributions in their com-panies and these distributions apparently reflect the situation in society at large. This is an example of a situation in which stereotypical summaries, provided by knowledgeable individuals, can contain valid information.
PERFORMANCE ORIENTATION “AS IS”
Minkov and Blagoev’s (2012) conclu-sion is that this dimension reflects mostly unfounded national stereotypes as it fails to predict what it apparently should. Contrary to GLOBE’s expectations, it is not a predictor of any measures of eco-nomic success, such as GDP or GNI per person growth in the period after GLOBE’s measurement. It does not predict average national school success, either. The coun-try ranking also creates many puzzles: It is unclear, for instance, why there should be greater performance orientation “as is” in Albania and Iran than in South Korea and China, or in Zimbabwe and Zambia than in Germany, Sweden, Slovenia, Italy, and Hungary. McCrae et al. (2008) found a positive correlation between this dimen-sion and conscientiousness as a national character stereotype, but it is weak (.40*) and explains a small part of the variance in GLOBE’s performance orientation “as is.” What the dimension measures will remain an open question until further research.
HUMANE ORIENTATION “AS IS”
Minkov and Blagoev (2012) found that, contrary to GLOBE’s assertions, this dimension is positively correlated with racism, for instance, as measured by the World Values Survey. Also, data from

328 ◆ Major Cross-Cultural Studies
Amnesty International suggest that coun-tries where people profess a more humane orientation “as is” are more likely to have and apply capital punishment. McCrae et al. (2008) found that the dimension is positively correlated with agreeableness as a national character stereotype (.50**), which is likely a partial explanation for the variance in it. Schloesser and Frese (2008) arrived at the same conclusion: Stereotypes may affect culture-level mea-sures of humane orientation.
ASSERTIVENESS “AS IS”
GLOBE (Hartog, 2004) provides only weak or insignificant correlations between this dimension and external variables. Minkov and Blagoev (2012) found that it is negatively correlated with agreement that poor people are lazy (item E131, World Values Survey, 2006; r = –.42*, n = 28). More assertive cultures (in the “as is” sense) show more sympathy for poor people, not less, as the GLOBE researchers believed. The GLOBE authors also failed to find support for many other hypotheses about what the dimension should be associated with. However, they found that people in assertive cultures are less likely to believe that others treat them fairly (item E131, World Values Survey; r = –.58**, n = 21).
McCrae et al. (2008) found that asser-tiveness “as is” correlates with agreeable-ness as a national character stereotype at –.59**. Despite the fact that GLOBE’s dimension obviously measures stereotypi-cal views of others, it raises an interest-ing question: Why do people in different countries have different views of their fellow citizens? The extremely scrambled country configuration that the assertive-ness country ranking creates suggests it will be hard to find a common cross-cultural factor. Instead, many different answers would probably transpire from idiographic studies in many societies.
GLOBE’S “SHOULD BE” DIMENSIONS
Unlike the study of national stereotypes, asking people to describe what others should or should not do, or what traits they should possess, is a common research method in culturology. GLOBE’s use of it has revealed some interesting informa-tion and raised various questions. In many cases, the correlation between the “as is” indices and their “should be” counterparts are negative. This could mean that people in many countries are not quite satisfied with the impressions that they have of their own societies: They believe they see too much of a particular phenomenon (for instance, in-group collectivism) and wish for a reduction of it, or the other way around. Explaining the differences between people’s impressions of their soci-eties and the corrections that they would like to take place can be a rich topic for further research (see Maseland & van Hoorn, 2009).
This sort of research is not likely to be an easy task. There already exist con-flicting explanations of the discrepancies between GLOBE’s “as is” and “should be” scores. The debate is not made easier by the fact that some “should be” country rankings produce incomprehensible con-figurations. Minkov and Blagoev (2012) note that the highest scorers on power distance “should be” are South Africa, New Zealand, Albania, Bolivia, Hong Kong, and Egypt. What do these countries have in common in addition to the fact that their middle managers express the greatest desire for an unequal distribu-tion of power? The same question can be asked about performance orientation and humane orientation “should be.”
In summary, the controversies that Project GLOBE has generated are a posi-tive phenomenon. They have not only elu-cidated important aspects of cross-cultural analysis but also created abundant food for thought and material for future research.

Cultural Dimensions Across Modern Nations ◆ 329
3. Because some of GLOBE’s dimensions are highly correlated, various authors (for example, Peterson & Castro, 2006) noted that they are not independent, meaning that they measure basically the same con-struct. GLOBE does not provide a good explanation of this phenomenon.
4. Peterson and Castro (2006) provided evidence of potential confusion of levels of analysis (see 8.2.10.) in GLOBE’s mea-sures. Although the GLOBE researchers consistently state that they worked at the societal level, they have not provided any details, such as correlations between item scores and dimension indices. As a result, we do not know how well the GLOBE items define the constructs into which they
have been merged, and whether it would not have been empirically more appropri-ate to merge them into different constructs.
■ Note
1. For a different opinion, see Venaik and Brewer (2010), who believed that Hofstede’s and GLOBE’s measures capture different com-ponents of the same construct and proposed a two-component model of uncertainty avoid-ance (UA): UA-stress and UA-rule orientation. This position exemplifies an attachment to a theoretical position despite the existence of empirical evidence to the contrary, a situation described in 5.1.

330 ◆
◆ Introduction
Project GLOBE (House Hanges, Javidan, Dorfman, & Gupta, 2004) was introduced in 9.17. In addition to the study of national stereotypes and ideologies, this monumental project collected descriptions of what its authors called “culturally endorsed leader-ship profiles” (Dorfman, Hanges, & Brodbeck, 2004): descriptions of the ideal leader as seen by middle managers.
The GLOBE researchers started from the hypothesis that organi-zational and societal cultures are associated with culturally endorsed leadership belief systems and that important differences in this respect would be found across various cul-tures (House et al., 2004, p. 671). In other words, middle managers in different cultures would have different ideas about the traits and
behaviors of the ideal leader. The researchers believed that discover-ing what those different ideas were would be useful in a very practical sense (p. 712).
◆ Samples
GLOBE’s samples are discussed in 9.17.
◆ Hypothesized Dimensions
According to Hanges and Dickson (2004, p. 124), the GLOBE researchers first specified the nature of their constructs before writing any items or developing any scales. This must apply to the leadership dimensions as well since the same authors note that
PROJECT GLOBE (2004): A STUDY OF CULTURALLY ENDORSED LEADERSHIP PROFILES
9.18

Cultural Dimensions Across Modern Nations ◆ 331
the initial pool of items for the leadership dimensions were “partially” based on extant leadership theories.
◆ Questionnaire Items
Originally, the researchers wrote 382 items (Hanges & Dickson, 2004, p. 126), consisting of behavioral and trait descrip-tions, potentially relevant to leadership. The items were scored on a seven-point Likert scale, asking the respondents to assess the degree to which a particular behavior or characteristic inhibits a person from being an outstanding leader or con-tributes to a person being an outstanding leader (Hanges & Dickson, 2004, p. 127).
◆ Statistical Analysis
The statistical analysis is explained in Hanges and Dickson (2004) and in Dorfman et al. (2004). The analysis was quite complex but its presentation is cur-sory, leaving out various details, such as factor loadings and correlations between items—either at the individual level or at the national—that underpin the proposed dimensions.
Ultimately, the analysis resulted in the extraction of 21 first-order factors that were later consolidated into six second-order dimensions (Dorfman et al., 2004, p. 674). The consolidation was apparently performed on the basis of a correlation analysis, not by means of a factor analysis with orthogonal rotation, because some of the six national indices are highly cor-related.
The six leadership dimensions are explained in the following way (Dorfman et al., 2004, p. 675):
Charismatic/Value based: A broadly defined leadership dimension that reflects the ability to inspire, to motivate, and
to expect high performance outcomes from others on the basis of firmly held core values.
Team oriented: A leadership dimension that emphasizes effective team build-ing and implementation of a common purpose or goal among team members.
Participative: A leadership dimension that reflects the degree to which manag-ers involve others in making and imple-menting decisions.
Humane oriented: A leadership dimen-sion that reflects supportive and con-siderate leadership but also includes compassion and generosity.
Autonomous: This dimension refers to independent and individualistic leader-ship.
Self-protective: From a Western per-spective, this newly defined leadership dimension focuses on ensuring the safety and security of the individual or group member.
The 21 primary leadership scales that were consolidated into these six dimen-sions are labeled as follows (Dorfman et al., 2004, p. 675):
Charismatic/Value based: (a) visionary, (b) inspirational, (c) self-sacrifice, (d) integrity, (e) decisive, and (f) perfor-mance oriented
Team oriented: (a) collaborative team orientation, (b) team integrator, (c) dip-lomatic, (d) malevolent (reverse scored), and (e) administratively competent
Participative: (a) autocratic (reverse scored) and (b) nonparticipative (reverse scored)
Humane oriented: (a) modesty and (b) humane oriented

332 ◆ Major Cross-Cultural Studies
Autonomous: autonomous
Self-protective: (a) self-centered, (b) sta-tus conscious, (c) conflict inducer, (d) face saver, and (e) procedural
The national indices for the six lead-ership dimensions from Dorfman et al. (2004) are reproduced below. All scores have been multiplied by 100.
Charismatic/value based Ecuador 646 Philippines 633 Israel 623 Canada, Indonesia 615 United States 612 Zimbabwe 611 Australia 609 El Salvador, Ireland 608 Colombia 604 Austria 602 Bolivia, Greece, United Kingdom 601 Brazil, Denmark, Guatemala 600 Namibia, South Africa (Whites) 599 Argentina, Italy, Netherlands 598 Costa Rica, Singapore, Turkey 595 Finland 594 Switzerland 593 Zambia 592 Hungary 591 Kuwait, Spain, Switzerland (French) 590 Malaysia 589 New Zealand, West Germany 587 India 585 East Germany, Sweden 584 Iran 581 Albania 579 Thailand 578 Nigeria 576 Portugal 575 Venezuela 572 Slovenia 569 Poland 567 Hong Kong, Mexico, Russia 566 Georgia 565 Taiwan 558 Egypt 557 China 556
Kazakhstan 554 South Korea 553 Japan 549 South Africa (Blacks) 516 France 493 Morocco 481 Qatar 451 Team oriented Ecuador 621 Brazil 617 Greece 612 Bolivia 610 Colombia 607 Philippines 606 Turkey 601 Argentina 599 Poland 598 Zimbabwe 597 El Salvador 595 Albania, Guatemala 594 Spain 593 Indonesia, Portugal 592 Hungary, Israel, Slovenia 591 Iran 590 Kuwait 589 Italy 587 Zambia 586 Finland, Georgia 585 Canada 584 Australia, Costa Rica, Ireland, Namibia 581 Malaysia, South Africa (Whites), United States 580 Singapore, Thailand 576 Netherlands, Sweden 575 Austria, Mexico 574 Kazakhstan 573 India 572 United Kingdom 571 Denmark 570 Taiwan 569 Nigeria 565 Russia 563 Switzerland (French), Venezuela 562 Switzerland 561 Hong Kong 558 China 557 Japan 556 Egypt 555

Cultural Dimensions Across Modern Nations ◆ 333
South Korea 552 West Germany 551 East Germany 549 New Zealand 544 South Africa (Blacks) 523 Morocco 515 France 511 Qatar 474 Participative Canada 609 Brazil 606 Austria 600 Switzerland 594 United States 593 Finland 591 France 590 Argentina 589 East Germany 588 Greece 581 Denmark 580 Netherlands 575 Australia 571 West Germany 570 Ireland 564 South Africa (Whites) 562 United Kingdom, Zimbabwe 557 Costa Rica, Sweden 554 Colombia, Ecuador 551 New Zealand 550 Namibia, Portugal 548 Italy 547 Guatemala 545 Slovenia 542 El Salvador, Philippines 540 Morocco 532 Singapore, Switzerland (French) 530 Bolivia, Thailand, Zambia 529 Hungary 522 Nigeria 518 Malaysia 512 Spain 511 Kazakhstan 510 Turkey 509 Japan 507 China, Poland, South Africa (Blacks) 504 Kuwait 503 India 499 Iran 497
Israel 496 South Korea 492 Georgia, Venezuela 488 Hong Kong 486 Qatar 475 Taiwan 473 Egypt 469 Russia 467 Mexico 464 Indonesia 460 Albania 450 Humane oriented Iran 575 Georgia 561 Philippines 553 Nigeria 549 Indonesia 543 Taiwan 535 South Africa (Whites) 533 Zambia 527 India 526 Albania, Malaysia, Singapore 524 Kuwait, United States 521 Canada 520 China 519 Zimbabwe 518 Greece 516 Egypt 515 Ecuador 513 Australia, Namibia 510 Thailand 509 Ireland 506 Colombia 505 Guatemala 500 Costa Rica 499 Austria 493 Turkey, United Kingdom 490 Hong Kong 489 South Korea 487 Venezuela 485 Brazil 484 Netherlands 482 South Africa (Blacks) 479 New Zealand 478 Switzerland 476 Finland, Hungary, Sweden 473 Mexico 472 Argentina 470 El Salvador 469

334 ◆ Major Cross-Cultural Studies
Israel, Japan 468 Qatar, Spain 466 Portugal 462 West Germany 460 Bolivia, Poland 456 Switzerland (French) 455 East Germany, Slovenia 444 Italy 438 Finland 430 Kazakhstan 426 Denmark 423 Morocco 410 Russia 408 France 382 Autonomous Russia 463 Kazakhstan 458 Georgia 457 Argentina 455 Egypt 449 Austria 447 Hong Kong 438 West Germany 435 Poland 434 East Germany 430 Slovenia, Thailand 428 Israel 426 South Korea 421 Indonesia 419 Switzerland 413 Finland 408 China 407 Malaysia 403 Switzerland (French) 402 Taiwan 401 Albania, Greece 398 Sweden 397 Australia, Ireland 395 South Africa (Blacks) 394 Bolivia, United Kingdom 392 Singapore 387 Mexico 386 India, Iran 385 Turkey 383 Denmark 379 Namibia, New Zealand 377 Philippines, United States 375 South Africa (Whites) 374 Japan 367
Canada 365 Italy, Nigeria 362 Spain 354 Ecuador, Netherlands 353 El Salvador 347 Costa Rica 346 Zambia 343 Kuwait, Venezuela 339 Qatar 338 Guatemala, Zimbabwe 337 Colombia, Morocco 334 France 332 Hungary 323 Portugal 319 Brazil 227 Self-protective Albania 462 Iran 434 Taiwan 428 Egypt 421 Indonesia 412 Kuwait 402 Qatar, Thailand 391 Georgia, Nigeria 389 Mexico 386 Bolivia 383 Venezuela 381 China 380 Guatemala, India 377 Russia 369 Hong Kong, South Korea 367 Zambia 366 Israel 364 Ecuador, South Africa (Blacks) 362 Slovenia 361 Japan 360 Turkey 357 Costa Rica 355 Poland 352 Brazil, Greece, Malaysia 349 Argentina 345 El Salvador 343 Spain 338 Colombia 337 Namibia 336 Kazakhstan 335 Philippines, West Germany 332 Singapore 331 Morocco 326

Cultural Dimensions Across Modern Nations ◆ 335
Italy 325 Hungary 324 Zimbabwe 320 New Zealand, South Africa (Whites) 319 United States 315 Portugal 310 Austria 307 Australia 305 United Kingdom 304 Ireland 300 Canada, East Germany 296 Switzerland (French) 294 Switzerland 292 Netherlands 287 Denmark, France, Sweden 281 Finland 255
(Dorfman et al., 2004, Appendix 21.1, p. 713; used by permission)
◆ Contributions
1. Project GLOBE provided the first large-scale cross-cultural study of cultur-ally endorsed leadership profiles. It is likely to inspire much-needed additional research in that field that can be of great practical significance to international managers.
2. Despite some issues concerning GLOBE’s leadership dimensions raised in the Food for Thought section below, one of the dimensions doubtlessly can be viewed as a national dimension of culture because it is highly correlated with other reported cultural dimensions extracted from studies of general societal values or behaviors. GLOBE’s self-protective leader-ship dimension correlates with Hofstede’s (2001) individualism at –.68** ( n = 46) and Minkov’s (2011) exclusionism at .79** ( n = 47). Self-protective leadership also correlates highly with competitiveness (Green et al., 2005) at .66** ( n = 16). How self-protective leadership can be con-ceptually associated with these dimensions of national culture is an open question.
◆ Food for Thought
1. GLOBE did not provide corre-lations between the six national indi-ces and the items used in the research. Consequently, we do not know exactly what GLOBE’s six national indices actu-ally measure.
2. It is not clear what GLOBE’s respondents had in mind when they answered the questions. It is possible that some referred to the ideal supervisor that they would like to have. But, being manag-ers (who are not above thinking that they are ideal leaders), it is also possible that some described themselves.
3. The six national indices were obtained after the 21 initial factors were collapsed into six dimensions. As a result, some of those six dimensions are highly correlated. For example, charismatic and team-oriented leadership correlate at .69** ( n = 61), sharing almost 50% of their vari-ance. Participative and self-protective are even more closely correlated: –.74**. This suggests that these two measures can be viewed as two facets of a single dimension.
4. GLOBE’s leadership dimensions are potentially interesting and deserve fur-ther studies. At present, it is not clear if they would be closely replicated across dif-ferent samples: if, for example, the samples consisted of respondents from sectors of the economy that were not represented in GLOBE’s study or if they were nation-ally representative samples. Some of my research into Bulgarian companies suggests that Bulgarian employees in different occu-pations have very different ideas of the ideal leader’s traits and behaviors. Middle-aged middle managers in manufacturing com-panies attach the highest importance to an ability to create order and instill discipline, whereas employees in creative knowledge-based companies give lower ratings to such traits and expect a charismatic leader.

336 ◆ Major Cross-Cultural Studies
5. In view of the first and second points raised above, we do not know if researchers who replicate GLOBE’s raw data would choose to construct the same dimensions. Because other approaches to the analysis of GLOBE’s data are possible, some of them may actually seem prefer-able. If those approaches are adopted, other dimensions may emerge.
6. We can agree with GLOBE’s assertion that an international manager may benefit from having some knowledge of the existing cross-cultural differences in endorsed leadership profiles. Yet, it is premature to endorse GLOBE’s leadership dimensions for any training purposes until they have been replicated or validated in another way.
7. Even if GLOBE’s dimensions are replicated and validated in the future, the optimism of the GLOBE authors concerning the practical utility of their dimensions may be somewhat unfounded. For instance, it remains to be proven that “leaders who are aware of a culture’s values and practices can make conscious,
educated decisions regarding their leader-ship practices and likely effects on the day-to-day operations and crisis management within an organization” (Dorfman et al., 2004, p. 712). Leaders who are capable of consciously changing their leadership style to satisfy the cultural expectations of a foreign country may be desirable, but it is unclear how far they can go in their adaptation to the new cultural envi-ronment. If the local employees expect a charismatic leader, how exactly does one acquire charisma?
8. Apart from the self-protective leadership dimension, GLOBE’s indices do not produce clear geographic configura-tions. This does not necessarily invalidate their measures but it raises an important question: Can they be viewed as dimen-sions of national culture? Normally, dimen-sions of national culture based on questions about organizational issues—such as those by Hofstede (1980), Smith et al. (1996), van de Vliert and Janssen (2002), and so on—produce a fairly clear geographic con-figuration. Why is this not the case with GLOBE’s leadership dimensions?

◆ 337
◆ Introduction
Eva Green, Jean-Claude Deschamps, and Dario Paez are three European social psycholo-gists interested in what is pop-ularly known as “individualism versus collectivism.” Starting from theoretical concepts of this con-struct at the individual level, they conducted a cross-cultural study (Green, Deschamps, & Paez, 2005) that has important methodological and practical implications.
◆ Samples
The samples consisted of 2,546 undergraduate university students of social science or psychology in 20 countries. The country samples
varied in size from 79 to 150 respondents. The mean age of respondents was 22 years. After a screening procedure, the final sam-ple consisted of 2,533 respondents.
◆ Hypothesized
Dimensions
The researchers’ stated goal was to study patterns of individual-ism and collectivism, expressed in terms of three preconceived dimensions: self-reliance, group-based interdependence, and com-petitiveness. Although these were conceptualized as individual-level constructs, the research-ers presented aggregate national indices that seem to represent interesting dimensions of national culture.
EVA GREEN, JEAN-CLAUDE DESCHAMPS, AND DARIO PAEZ (2005): A STUDY OF BELIEFS AND VALUES
9.19

338 ◆ Major Cross-Cultural Studies
◆ Questionnaire Items
The items were scored on a four-point Likert scale ranging from 1 = “totally disagree” to 4 = “totally agree.” Competitiveness was measured with four items borrowed from Triandis, Bontempo, Villareal, Asai, and Lucca (1988). The sample item provided by Green et al. (2005) is “Winning is everything.” The other items from Triandis et al. that are supposed to measure competitiveness are worded similarly, asking in various forms whether it is important to win and be suc-cessful. Self-reliance was measured with six items also from Triandis and associ-ates. The sample item is “Only those who depend on themselves get ahead in life.” The other Triandis items that are sup-posed to measure self-reliance are worded similarly, asking in various forms if one can count on others. Interdependence was measured with six items borrowed from Singelis (1994). The sample item is “It is important for me to maintain harmony within my group.”
◆ Statistical Analysis
The authors report a pan-cultural factor analysis (see 8.2.10.) across all partici-pants, as well as in-country factor analyses with varimax and oblimin rotations. The within-country factor analyses separated the items that were expected to measure competitiveness, self-reliance, and inter-dependence into three distinct factors. Internal reliabilities were also calculated for the items that defined each of the three dimensions. The alpha value for com-petitiveness was equal to, or exceeded, .70 in 13 countries and was lower than .60 in only one country. As for the other two dimensions, their alphas were mostly
between .60 and .70. This was deemed acceptable and national dimension indi-ces were calculated. The article does not explain how exactly this was done.
The national indices for each of the three dimensions from Green et al. (2005) are reproduced below. All scores have been multiplied by 100.
Competitiveness Mexico 301 Lebanon 295 Peru 288 El Salvador 284 Russia, Venezuela 283 Turkey 279 China 265 Colombia 249 France 228 Portugal 221 Greece 219 Italy 212 United States 208 Singapore 204 Chile 199 Switzerland 190 Belgium, Spain 185 Argentina 180 Self-reliance China 279 Lebanon 256 Russia 246 Singapore 235 Turkey 233 Peru 230 France 228 Greece 225 Mexico, Switzerland 222 Italy 221 Colombia 218 Belgium 217 United States 207 Portugal, Venezuela 202 El Salvador 201 Spain 191 Chile 188 Argentina 184

Cultural Dimensions Across Modern Nations ◆ 339
Interdependence El Salvador 340 Argentina, Peru, Portugal 314 Singapore 313 Lebanon, Venezuela 311 Spain 306 Greece 303 Chile, Colombia 302 United States 301 Russia 299 Switzerland 297 China 295 Belgium 294 Italy 292 France 291 Mexico 286 Turkey 281
(Green et al., 2005, Table 1, p. 326; used by permission)
◆ Additional Statistical Analysis
The three national indices yield the follow-ing correlations with Hofstede’s (2001) individualism index across 18 cases:
competitiveness –.53*
self-reliance .03
interdependence –.46 ( p = .06)
Correlations with other constructs that are similar to Hofstede’s individualism versus collectivism (exclusionism versus universalism in Minkov, 2011; familial-ism in Minkov & Hofstede, 2012b) yield similar correlations with competitiveness, self-reliance, and interdependence.
Various World Values Survey items (latest scores for each country from 1994–2004) reflect concepts related to self-reliance and are correlated with it:
strong importance of family (A001) –.66** ( n = 19)
strong importance of service to others (A007) –.60** ( n = 9)
agreement that parents should have a life of their own (A026) .63** ( n = 19)
◆ Contributions
1. The results of this study can help demystify the nature of the individual-ism versus collectivism dimension at the national level. Regardless of what hom-onymous dimensions might measure at the individual level in one country or another, if individualism versus collectiv-ism is a national dimension of culture that contrasts rich and developing societies, it is not associated with self-reliance and is negatively (not positively) associated with competitiveness as measured by Green et al. (2005). It is less clear how it relates to independence or interdependence; differ-ent associations can be expected depend-ing on what exactly is measured.
2. The fact that the within-country principal components analyses separated the competitiveness, self-reliance, and independence items into three distinct fac-tors is noteworthy. It suggests that there is no basis for keeping these three unrelated constructs under a single heading, such as individualism versus collectivism or any other—a point discussed in 5.1.
3. The self-reliance construct seems to be an interesting new dimension of culture. If it could be operationalized for a higher number of countries, it would rep-resent a significant contribution to cross-cultural research. The same may be true of the competitiveness construct.

340 ◆ Major Cross-Cultural Studies
◆ Food for Thought
1. Self-reliance as measured by Green et al. (2005) is a significant and robust predictor of economic growth in the decade when it was measured (Minkov, 2011). The dimension may also have other predictive properties that could be useful and interesting, especially if self-reliance measures could be obtained for a higher number of countries. This is an interesting con-tribution as well as food for thought: Assuming that the correlation between
self-reliance and economic growth is not spurious, what exactly is the mechanism behind it?
2. The interdependence dimension creates an unclear geographic pattern. Its predictive properties are unknown.
3. The three dimensions were opera-tionalized at the level of individuals whose scores were apparently aggregated to the national level. It would be interesting to ascertain whether the same dimensions would emerge in an ecological analysis across countries.

◆ 341
◆ Introduction
American psychologist David Schmitt founded the International Sexuality Description Project (ISDP) to study mating strategies across the world. One of the pub-lications that ensued from that project focused on sociosexuality (Schmitt, 2005). This construct is described by Schmitt as a sin-gle strategic dimension of human mating and defined as follows (p. 247):
Those who score relatively low on this dimension are said to possess a restricted sexual ori-entation—they tend toward monogamy, prolonged court-ship, and heavy emotional investment in long-term rela-tionships. Those residing at the high end of sociosexuality are considered more unrestricted in mating orientation, they tend
toward promiscuity, are quick to have sex, and experience lower levels of romantic rela-tionship closeness.
Schmitt (2005) and his asso-ciates attempted to measure sociosexuality in 48 countries. A description of that study is pro-vided below.
◆ Samples
The nature of the samples was mixed. In most countries, they consisted of college students, but in some the researchers used gen-eral community members who volunteered for the study. There were countries that were repre-sented by both types. Altogether, 48 countries were sampled. The sizes of the samples were unequal, ranging from 28 for the Finnish men to 1,707 for the American
DAVID SCHMITT (2005): A STUDY OF SOCIOSEXUALITY
9.20

342 ◆ Major Cross-Cultural Studies
women. Nevertheless, most countries were represented by 200–300 individuals. Altogether, 5,853 men and 8,206 women were studied.
◆ Hypothesized Dimensions
It was hypothesized that sociosexuality would prove to be a single dimension across individuals.
◆ Questionnaire Items
The researchers used the Sociosexual Orientation Inventory (SOI) borrowed from Simpson and Gangestad (1991). It consists of seven questionnaire items that ask the respondents to provide self-descrip-tions. The items address practices (number of sexual partners in the past year, number of sexual partners with whom the respon-dent has had sex only once), behavioral intentions (foreseen number of partners in the next five years), sexual ideation (frequency of fantasizing about having sex with a person different from one’s part-ner), and sexual attitudes (acceptance of sex without love, acceptance of casual sex, need for attachment in order to have sex). The first three questions were open-ended. The other ones were scored on scales from 1 to 8 or 1 to 9.
◆ Statistical Analysis
The analysis confirmed that within most countries and across the whole sample of individual respondents, the seven question-naire items yielded a single factor based on eigenvalues over 1.00 and Cattell’s scree criterion. Across the entire sample of indi-viduals, that factor accounted for 44.5% of the variance, whereas the alpha reliabil-
ity of the scale formed by the seven items was .77. Completely unreliable alphas (below .50) were obtained in Slovakia, the Democratic Republic of Congo, and Mexico.
The psychometric validity of the SOI within cultures was estimated by com-paring the results with those from other paper-and-pencil studies, using other research instruments. The conclusion was that the results from the SOI were valid.
The individual data were aggregated to the national level and national sociosexu-ality indices for men and for women were reported (Schmitt, 2005). These indices are reproduced below. All scores have been multiplied by 100.
Sociosexuality index: men Morocco 6558 Finland 6403 Bolivia 6147 Lithuania 6044 New Zealand 6042 Slovenia 5945 United Kingdom 5738 Croatia 5735 Austria 5589 Argentina 5552 Fiji 5430 Turkey 5416 Israel 5399 Brazil 5396 Italy 5173 Peru 5168 Estonia 5151 Philippines 5124 Netherlands 5051 Ukraine 5079 Latvia 4942 Mexico 4904 Serbia 4899 Czech Republic 4896 Romania 4864 United Kingdom 4803 Australia 4652 Germany 4636 Spain 4608 France 4588 Switzerland 4525

Cultural Dimensions Across Modern Nations ◆ 343
Canada 4433 Poland 4429 Slovakia 4427 Lebanon 4390 Greece 4343 Portugal 4127 Congo (DR) 4116 Malta 4056 Belgium 3968 Ethiopia 3788 Zimbabwe 3480 Botswana 3356 Japan 3247 Bangladesh 3110 South Korea 3052 Hong Kong 2988 Taiwan 2842 Sociosexuality index: women Latvia 4168 Finland 4160 New Zealand 3879 Austria 3866 Slovenia 3645 Lithuania 3525 Germany 3444 Switzerland 3426 Croatia 3215 Serbia 3189 Estonia 3183 Israel 3171 Netherlands 3156 Australia 3073 France 3066 Argentina 3010 United Kingdom 2960 Congo (DR) 2955 Czech Republic 2949 United States 2924 Slovakia 2852 Canada 2730 Brazil 2713 Poland 2690 Belgium 2680 Mexico 2599 Fiji 2526 Malta, Spain 2517 Greece 2432 Botswana 2306 Bolivia 2192
Turkey 2171 Italy 2139 Portugal 2132 Peru 2123 Japan 2072 Morocco 2006 Romania 1948 Hong Kong 1921 Ethiopia 1889 Philippines 1795 Ukraine 1736 Lebanon 1721 South Korea 1622 Taiwan 1424 Zimbabwe 1398 Bangladesh 1180
(Schmitt, 2005, Table 6, p. 263; used by permission)
The validity of these national indices was established through comparisons with other measures from the ISDP or from external cross-cultural paper-and-pencil studies, such as the World Values Survey. Schmitt was satisfied that the national indices were significantly correlated with various relevant variables.
The national sociosexuality indices were also compared with national statistics on early reproduction, such as adolescent fertil-ity, total fertility, and women’s mean age at marriage. Contrary to Schmitt’s theoretical expectations, these variables were signifi-cantly correlated with his national socio-sexuality indices but in the opposite way: Higher reported sociosexuality was associ-ated with lower fertility and later marriage.
◆ Contributions
1. The study demonstrated that large sex differences in self-reports of sociosexu-ality exist all over the world: Men report greater sociosexuality than women. These differences were found to be especially large in demanding environments and smaller in societies with political and eco-nomic equality between the sexes.

344 ◆ Major Cross-Cultural Studies
2. Another interesting finding is that both men and women in richer countries report greater sociosexuality than men and women in poor countries. This may be due to various factors mentioned by Schmitt (2005), such as gender equality and avail-ability of birth control. But it is also pos-sible that people in developing countries are more inhibited when discussing their own sexuality, even in anonymous studies.
3. A third finding that deserves spe-cial attention is that female-to-male ratios are positively (albeit weakly) correlated with female sociosexuality: When women outnumber men, women tend to be more promiscuous. One possible explanation for this phenomenon is that the women are forced to compete for scarce men.
◆ Food for Thought
1. In the view of Fuentes (2005), Schmitt’s study could have been entitled, “The Sociosexuality of College Students: A 48-Nation Study of the SOI Measure of Sexuality” (p. 285). And, commenting on the same study, Schachner, Scheib, Gillath, and Shaver (2005) indicate that in coun-tries with difficult environments, college students would be least representative of the general population. In the discussion part of his publication, Schmitt (2005) explicitly admits that the results of the study should not be used for any general-izations beyond college-aged populations. For some countries, they should prob-ably not be generalized beyond college students. Minkov (2011) quotes various studies (Caldwell, 2000, 2002; Orubuloye et al., 1992, 1997) showing evidence that the AIDS pandemic in sub-Saharan Africa
is the result of extensive sexual networking. Zimbabwe and Botswana have some of the highest HIV infection rates in the world. According to data from the World Health Organization (2010), approximately 30% of the population of those countries are HIV-positive. This fact is hard to reconcile with the extremely low level of reported sociosexuality for those two countries. It is plausible that the respondents from Zimbabwe and Botswana either underre-ported their sociosexuality or belonged to a socioeconomic or demographic segment that is not at all representative of the gen-eral population.
Morocco’s top position in the men’s sociosexuality ranking is most likely an example of the opposite: strong over-reporting. In a very traditional society of Arabs and Berbers, it is quite difficult to have sex out of wedlock, let alone behave promiscuously.
Minkov (2011) points out that across the developing countries in Schmitt’s sample, sociosexuality is negatively, not positively, correlated with HIV rates: the higher the prevalence of HIV, the lower the national sociosexuality score. This is prob-ably enough to conclude that Schmitt’s sociosexuality scores may be valid in some countries, particularly in the rich world, but are hardly an objective reflection of numbers of sexual partners in African and Asian countries.
2. According to Barash (2005), the finding that men all over the world report greater sociosexuality may be the final nail in the coffin of the doctrine of male-female sexual indistinguishability. Yet, Bond (2005) refers to studies showing that men tend to overreport the number of sex-ual partners that they have had, whereas women are likely to underreport them.

◆ 345
◆ Introduction
This is an important cross-cultural study of emotions by five experts in the field: Peter Kuppens, Eva Ceulemans, Marieke Timmerman, Ed Diener, and Chu Kim-Prieto. They were interested in individual- and culture-level differences in self-reported frequencies of posi-tive and negative experiences. The authors of the study (Kuppens, Ceulemans, Timmerman, Diener, & Kim-Prieto, 2006) also pro-posed to examine the relationship between individualism versus col-lectivism as a cultural dimension and the dimensions of recalled emotional experience that they
expected to find in their data: “We aim to assess the extent to which intracultural and intercultural dimensions determine recalled emotional experience” (p. 495). Phrasing of this kind is problem-atic, as dimensions are subjective human creations. As such, strictly speaking, they cannot determine anything. It is more appropri-ate to say that this study was an attempt at finding cross-cultural differences in recalled emotional experience. Considering that it was executed by experienced researchers in the field, as well as the large sample of respondents and countries involved, it repre-sents another landmark in cross-cultural analysis.
PETER KUPPENS, EVA CEULEMANS, MARIEKE TIMMERMAN, ED DIENER, AND CHU KIM-PRIETO (2006): A STUDY OF POSITIVE AND NEGATIVE EMOTIONS
9.21

346 ◆ Major Cross-Cultural Studies
◆ Samples
The authors used data from over 9,000 college students (5,611 women and 3,680 men) from 48 nations, collected by 69 researchers.
◆ Hypothesized Dimensions
The authors discuss individual-level dimensions related to emotional experi-ence, such as positive affect and negative affect, as well as ecological variables and dimensions, such as life satisfaction and individualism versus collectivism, but do not specify that they expect to find exact equivalents of these in their data. They state that they intend to “identify the dimensions that underlie intercultural dif-ferences in recalled emotional experience” (Kuppens et al., 2006, p. 495). This gives the study a strongly empirical character.
◆ Questionnaire Items
The respondents were asked to indicate how often they had felt each of 14 emo-tions in the past week. The emotions were “pleasant, happy, cheerful, pride, gratitude, love, unpleasant, sad, anger, guilt, shame, worry, stress, and jealousy” (Kuppens et al., 2006, p. 498). Answers were provided on a nine-point Likert scale, ranging from 1 (not at all) to 9 (all the time).
◆ Statistical Analysis
The study discusses a complex novel approach for analyzing and comparing intra- and intercultural factor structures. As far as the intercultural factors are con-cerned, the text suggests that they were obtained through an ecological factor
analysis. It produced two factors. The loadings of the items were as follows (Kuppens et al., 2006):
Factor 1 Factor 2 gratitude .34 .19 pride .30 .08 happy .26 .02 cheerful .27 .02 love .22 .02 pleasant .21 –.06
shame .06 .28 guilt .03 .23 jealousy .06 .19 anger –.02 .17 sad –.05 .16
worry .05 .16 unpleasant –.10 .15 stress –.06 .10
(Kuppens et al., 2006, Table 5, p. 507; used by permission)
The researchers also asked the participants to indicate how appropriate and valued each of the 14 emotions are in their societies and whether people approve of those emotions: a study of national stereotypes. Correlations were reported between the two factors and the national stereotypes for 13 of those emo-tions (Kuppens et al., 2006):
Factor 1 Factor 2 love .57** –.48** happy .53** –.19 cheerful .52** –.15 gratitude . 48** .22 pride .39** –.02 contentment .38** –.14
shame –.01 .42** jealousy –.07 .40** anger –.14 .38**
sad –.20 .27 guilt .06 .24 worry .17 .09 stress –.09 .07
(Kuppens et al., 2006, Table 6, p. 509; used by permission)

Cultural Dimensions Across Modern Nations ◆ 347
The reported correlations suggest that factor 1 is defined by reports of positive emotions but is even more closely associ-ated with national stereotypes of perceived appropriateness of positive emotions. Factor 2 is defined by reports of negative emotions and is even more closely associ-ated with national stereotypes of perceived appropriateness of negative emotions.
National scores for the two factors were also reported (Kuppens et al., 2006). All scores have been multiplied by 100.
Factor 1 (positive emotions) Mexico 217 South Africa 174 Chile, Venezuela 143 Canada 127 Nigeria 108 Brazil, Philippines 106 Indonesia 105 Colombia 93 Kuwait 91 Spain 60 Malaysia 56 Australia 50 Slovenia 46 United States 39 Belgium 36 Zimbabwe 23 Ghana 20 India –1 Thailand –4 Switzerland –5 Austria –8 Netherlands –10 Cameroon –13 Portugal –14 Germany –29 Georgia, South Korea –34 Egypt –45 Nepal –47 Croatia –53 Hungary –55 Uganda –66 Russia –76 Poland –81 Cyprus –95 Bulgaria –96 Italy –101 Slovakia –105
Bangladesh –106 Greece –108 Hong Kong –116 Singapore –119 Japan –134 Turkey –140 Iran –159 China –204 Factor 2 (negative emotions) Kuwait 281 Iran 214 Egypt 199 Turkey 191 Bangladesh 190 Japan 169 Thailand 153 Hong Kong 127 Malaysia 116 Singapore 102 Philippines 89 Italy 76 Cyprus 74 Brazil, Indonesia 71 Zimbabwe 60 Cameroon 58 Nepal 43 Slovakia 26 Colombia 25 Mexico 9 Uganda 7 Spain 6 United States 1 South Africa –3 South Korea –4 Chile –7 Venezuela –19 Croatia –24 Nigeria –25 Georgia –30 Austria, Russia –52 Bulgaria –54 Greece –61 Australia –64 Germany –66 India –68 Ghana –72 Portugal –80 Poland –89 Belgium –111 China –120

348 ◆ Major Cross-Cultural Studies
Hungary –126 Netherlands –140 Slovenia –154 Switzerland –185 Canada –206
(Kuppens et al., 2006, Table 1, p. 499; used by permission)
◆ Additional Statistical Analysis
Factor 1 is significantly correlated with the following items in the World Values Survey:
A008 (percentage very happy, lat-est data for each country from 1994–2004) .66** ( n = 40)
v10 (percentage very happy, 2005–2008) .54** ( n = 30)
Factor 1 yields weak negative cor-relations (between –.40 and 0) with all other positions on these items, that is, percentages that have indicated that they are quite happy, not very happy, or not at all happy.
Factor 1 is positively associated with World Values Survey measures of life satisfaction, but the correlations are lower than those with the happiness items.
Factor 1 is negatively correlated with the national neuroticism index in McCrae (2002): –.49** ( n = 25). It is not signifi-cantly correlated with extraversion in that study or with any national Big Five indices in McCrae and Terracciano (2005) and Schmitt et al. (2007).
Factor 1 is highly correlated with Confucian work dynamism (Chinese Culture Connection, 1987): –.69** ( n = 18). This is certainly a spurious correla-tion, created by the lack of representation of Middle Eastern countries in the Chinese Culture Connection study. Iran, Turkey, and Egypt would not have had high scores
on Confucian work dynamism, although they have low scores on factor 1.
Factor 1 is not associated with any mea-sures of individualism versus collectivism, such as Hofstede’s (2001), or any other similar dimensions of national culture.
Factor 2 is not significantly correlated with any World Values Survey measures of happiness. It yields a weak correlation with item A171 (average life satisfaction, latest data for each country from 1994–2004): –.32* ( n = 40).
Factor 2 is not significantly corre-lated with either national neuroticism or national extraversion in any of the three publications that provide national Big Five indices (McCrae, 2002; McCrae & Terracciano, 2005; Schmitt et al., 2007). It correlates with openness in McCrae (2002): –.41* ( n = 25), and with openness in McCrae and Terracciano (2005): –.37* ( n = 32).
Factor 2 is positively associated with Project GLOBE’s in-group collectivism practices (Gelfand et al., 2004): r = .45** ( n = 37), as well as Minkov’s (2011) exclu-sionism: r = .52** ( n = 44). The correla-tion with Hofstede’s (2001) individualism is weak: –.36* ( n = 35).
Both factors are significantly correlated with relevant national character stereo-types (NCS) as reported by McCrae et al. (2007). All correlations are across 29 over-lapping nations.
Factor 1 NCS positive emotions .47** Factor 2 NCS impulsivity .47** NCS angry hostility .45**
◆ Contributions
1. Apart from the World Values Survey, this is the largest cross-cultural study containing data about positive and

Cultural Dimensions Across Modern Nations ◆ 349
negative emotions at the national level. Since the factor 1 scores are positively correlated with World Values Survey measures of happiness, especially with percentages of respondents who are very happy, it appears to be a valid measure of positive emotions at the national level.
2. The two factors were calculated in such a way that the first one is uncor-related with any measures of national individualism versus collectivism or other related dimensions (such as Minkov’s exclusionism), whereas the second fac-tor is moderately associated with them. External evidence supports this method. Measures of happiness in the World Values Survey (percentages of respondents feel-ing very happy) are not associated with measures of national individualism versus collectivism, but measures of unhappiness (percentages of respondents feeling not very happy) are negatively associated with national individualism and positively with Minkov’s exclusionism, with correlations of about ±.46**. This suggests that posi-tive and negative affect (as well as happi-ness and unhappiness) can be construed as two different dimensions at the national level, which would have different associa-tions with external variables. One conclu-sion that could follow from this model is that it does not take high individualism or universalism (in Minkov’s sense of the term) for a nation to score high on happiness, but high collectivism or exclu-sionism could be associated with higher unhappiness.
3. The study ignored the reference group effect, discussed by Heine et al. (2002) (see 7.2.4.1.). Respondents were asked to describe how often they felt vari-ous emotions, although different societies may have different concepts of “often.” Nevertheless, the reported index for fac-tor 1 correlates convincingly with external data. This is one of the many examples of validation of the use of Likert scales in cross-cultural analysis even when the positions of the scale are defined in terms of quantifiers that may be perceived dif-ferently in different societies.
◆ Food for Thought
The factor loadings of all items are unusu-ally low for a nation-level analysis. This suggests very weak correlations between the items at the national level. On the other hand, correlations with national ste-reotypes of perceived appropriateness of emotions are considerably higher. The two national factors reported in the study are closer to such stereotypes than to self-reported emotional experiences aggre-gated to the national level. However—as indicated in 3.2.2.3.—when national ste-reotypes are formulated about very salient and simple national characteristics, they can be accurate in the sense that they can be validated through correlations with relevant variables. This brings up the ques-tion of the national salience of the various emotions that were addressed in this study.

350 ◆
◆ Introduction
Christian Welzel is a professor of political science and vice presi-dent of the World Values Survey Association. He has coauthored a number of articles together with Ronald Inglehart based on data from the World Values Survey. Welzel (2010) has also proposed his own analysis of selected parts of the World Values Survey that have resulted in dimensions of national culture.
Welzel was interested in what he and Inglehart call “self-expres-sion values,” defined as “free-dom of expression and equality of opportunities” (p. 152). His inter-est stemmed from the fact that many scholars see these values as individualistic in nature. Welzel reported interpretations of indi-vidualism as egoism, self-serving,
erosion of the willingness to make sacrifices for other individuals, and decline of social capital (defined as trust and norms and networks that facilitate collective action). These interpretations clash with Inglehart and Welzel’s (2005b), who view self-expression values as conducive to “a universal form of altruism” (Welzel, 2010, p. 153). To determine which view is more convincing, Welzel pro-posed to measure self-expression values and ascertain how they are associated with measures of social capital.
◆ Samples
Welzel used the 2005–2008 stud-ies of the nationally representa-tive World Values Survey and obtained data for 52 countries,
CHRISTIAN WELZEL (2010): AN ANALYSIS OF THE WORLD VALUES SURVEY
9.22

Cultural Dimensions Across Modern Nations ◆ 351
although some of them were not repre-sented on all his measures.
◆ Hypothesized Dimensions
Welzel reported national indices for five national dimensions of culture that he called “self-expression values,” “collec-tivism/individualism,” “egoism/altruism,” “generalized trust,” and “collective action tendency.” All these dimensions were pre-conceived theoretically before the empir-ical study. For instance, according to Welzel (2010) the self-expression values in the World Values Survey that were chosen for the extraction of the corresponding dimensions were selected to “represent the spirit of self-expression values in empha-sizing freedom of expression and equality of opportunities” (p. 157).
◆ Questionnaire Items for the Self-Expression Values Dimension
Welzel chose 11 World Values Survey items in three areas that he labeled “sexual freedom,” “equal opportunity in gender equality,” and “personal autonomy in educating children.”
1. Sexual freedom. Respondents are asked how justifiable some behav-iors are on a scale from 1 (never justifiable) to 10 (always justifiable). Welzel (2010) chose three items with this format: v202 (homosexuality), v204 (abortion), and v205 (divorce). In his view, “leaning to the justifiable side on these three issues represents a pro-choice position that emphasizes self-determination in reproductive and sexual matters” (p. 157).
2. Equal opportunity in gender equal-ity. Welzel chose the following items:
v44: “When jobs are scarce, men should have more right to a job than women.” Respondents choose from three answers: agree, disagree, or neither.
v59: “If a woman wants to have a child as a single parent but she does not want to have a stable relation-ship with a man, do you approve or disapprove?” Respondents choose from three answers: approve, disap-prove, it depends.
v61: “On the whole men make bet-ter political leaders than women do.” Respondents choose from four answers: strongly agree, agree, dis-agree, strongly disagree.
v62: “A university education is more important for a boy than for a girl.” The response format is the same as it is in the previous case.
3. Personal autonomy in educating chil-dren. Here, Welzel chose items from a list of values that children should learn. The World Values Survey respondents are asked to read this list and choose up to five items. For his analysis, Welzel selected v11 (inde-pendence) and v15 (imagination) as indicators of personal autonomy ver-sus v19 (faith) and v21 (obedience) as indicators of the opposite.
◆ Statistical Analysis of the
Items for the Self-Expression Values Dimension
Welzel expected his 11 items to form three distinct dimensions in the first step. He pooled all individual responses in the World Values Survey (59,132 valid cases after listwise deletion of missing values on

352 ◆ Major Cross-Cultural Studiess
some items) and performed a pan-cultural analysis (see 8.2.10.). He obtained three oblique factors with the following load-ings (item labels as in Welzel, 2010):
Factor 1 accepting abortion .85 accepting divorce .84 accepting homosexuality .83
Factor 2 gender equality in politics .81 gender equality in education .79 gender equality in labor participation .72 gender equality in lifestyle choice .55
Factor 3 obedience –.70 independence .69 imagination .47 faith –.47
Despite the fact that Welzel obtained three factors (albeit oblique), he consid-ered it justifiable to merge them into a sin-gle second-order factor because he viewed a conceptual link between them. He then composed a self-expression index. Welzel provided some information about the cal-culation of the index, but since details about the level of analysis are missing, this information is irrelevant.
Welzel’s (2010) country self-expression index is reproduced below. All scores have been multiplied by 100.
Self-expression Sweden 79 Norway 75 Andorra 73 Switzerland 67 East and West Germany, Finland, Netherlands 65 France 64 Spain 63 Australia 61 Uruguay 60 Canada, United Kingdom 59 Japan, Slovenia 58
Argentina, Bulgaria 55 Serbia, United States 54 Chile, Italy 50 South Korea, Taiwan 49 Ethiopia, Mexico 48 Cyprus 47 Russia 46 Brazil, Ukraine 45 Moldova 44 Colombia, Poland 43 China, Romania, South Africa 41 Thailand, Vietnam 40 India, Malaysia, Zambia 38 Trinidad 36 Turkey 34 Mali, Morocco 33 Rwanda 32 Indonesia, Iran 29 Egypt 28 Burkina Faso 27 Ghana 25 Jordan 19
(Welzel, 2010, Table 1, p. 156; used by permission)
◆ Questionnaire Items for the Collectivism/Individualism and Egoism/Altruism Dimensions
Welzel also analyzed the 10 values that were borrowed from the work of Shalom Schwartz for the purpose of the 2005–2008 version of the World Values Survey. Each of the 10 items asks the respondents how much they resemble a hypothetical person described by the items. The answers are given on a six-point scale, ranging from “very much like me” to “not at all like me.” The 10 items are reproduced from Welzel (2010):
v80: [Self-Direction] It is important to this person to think up new ideas and be creative; do things one’s own way.

Cultural Dimensions Across Modern Nations ◆ 353
v81: [Power] It is important to this per-son to be rich: to have a lot of money and expensive things.
v82: [Security] Living in secure sur-roundings is important to this person: to avoid anything that might be dangerous.
v83: [Hedonism] It is important to this person to have a good time; to “spoil” oneself.
v84: [Benevolence] It is important to this person to help the people nearby; to care for their well-being.
v85: [Achievement] Being very success-ful is important to this person; to have people recognize one’s achievements.
v86: [Stimulation] Adventure and tak-ing risks are important to this person; to have an exciting life.
v87: [Conformity] It is important to this person to always behave properly; to avoid doing anything people would say is wrong.
v88: [Universalism] Looking after the environment is important to this per-son; to care for nature.
v89: [Tradition] Tradition is important to this person; to follow the customs handed down by one’s religion or family.
(Welzel, 2010, pp. 159–160; used by per-mission)
◆ Statistical Analysis of the Items for the Collectivism/ Individualism and Egoism/ Altruism Dimensions
Welzel (2010) standardized the 10 chosen items by case (see 7.2.4.4.10.) for each
individual: He subtracted the respondents’ 10-item means from their item scores. Welzel performed a pan-cultural factor analysis across 52,404 respondents from 48 countries for which data were avail-able. He did not specify if he factor ana-lyzed all 10 items or a selection of 8, but his further analysis mentions only 8 items (tradition and hedonism are missing).
Welzel reports two factor analyses. In the first one, the data had been standard-ized only once, as explained above. For the purpose of the second factor analy-sis, Welzel applied an additional stan-dardization technique: For each item, he subtracted the country means from each respondent’s item score (score standard-ization by variable). Apparently, Welzel was interested in individual-level variation and followed the approach proposed by Leung and Bond (1989), which was criti-cized in 7.2.4.4.10 and 8.2.10. Welzel pro-vided visual representations of the results of the two factor analyses separately in two figures. The exact loadings of the items were not provided and can only be deduced from the items’ positions on the two axes in the figures.
In both factor analyses, Welzel obtained two factors. One opposed achievement and power to universalism and benevo-lence. Welzel called this factor “egoism versus altruism” (or vice versa). The other factor opposed conformity and security to self-direction and stimulation. Welzel called this factor “collectivism versus indi-vidualism” (or vice versa). Welzel (2010) provided national indices for these two dimensions. These are factor scores, repro-duced below, that were multiplied by 100.
Individualism versus collectivism Norway 67 Sweden 59 Switzerland 53 Netherlands 48 India 43 Andorra 39 Ethiopia 31 Finland 30

354 ◆ Major Cross-Cultural Studiess
Argentina 28 Zambia 26 Thailand 25 Canada 22 United States 16 Japan 14 Australia 13 Uruguay 12 West Germany 10 Indonesia 9 Spain 8 Serbia 7 Cyprus 5 Slovenia 3 Mexico, South Korea 1 Burkina Faso, Malaysia, Moldova, Russia, Turkey 0 Bulgaria, Poland, United Kingdom –1 Chile, East Germany, Ghana –2 Jordan, Morocco –3 South Africa –4 France –10 Mali –12 Trinidad –16 Brazil –20 Iran –21 Vietnam –22 Ukraine –23 Rwanda –24 China, Romania –25 Taiwan –52 Egypt –94
Altruism versus egoism Brazil 75 Switzerland 67 Andorra 65 Sweden 63 Norway 62 Canada 59 Uruguay 55 Argentina 53 Finland 47 Netherlands 45 Mexico 44 Taiwan, United Kingdom 37 France 36 Slovenia 32 Australia 31 Spain 22
United States 21 Indonesia 19 Cyprus 18 Trinidad 15 Chile 12 Japan 8 East Germany 6 China 4 Poland 3 Bulgaria, Russia –2 Moldova –6 Egypt, Turkey –9 Romania –14 Iran –18 Vietnam, West Germany –25 Burkina Faso –30 India, Serbia, Ukraine –31 Mali, Rwanda –37 Jordan, Thailand –42 Malaysia, Zambia –55 Morocco –56 South Korea –57 Ghana –60 Ethiopia, South Africa –62
(Welzel, 2010, Table 1, pp. 156–157; used by permission)
◆ Questionnaire Items for the Generalized Trust Dimension
Welzel calculated a generalized trust index, using World Value Survey items v128, v129, and v130, which ask respondents how much they trust people that they meet for the first time, people of another reli-gion, and people of another nationality.
◆ Statistical Analysis of the Items for the Generalized Trust Dimension
After plotting individual answers on a scale from 0 to 1, Welzel (2010) averaged these three items for each nation. The

Cultural Dimensions Across Modern Nations ◆ 355
generalized trust index is presented below, with scores multiplied by 100.
Generalized trust Sweden 64 Norway 61 France 59 Finland, United Kingdom 56 Canada, United States 55 Australia, Switzerland 54 Mali 53 Andorra 49 Argentina 48 South Africa, Rwanda, Uruguay 46 Burkina Faso 44 Serbia, Spain, Trinidad 43 Netherlands, Poland, West Germany 42 Bulgaria, India 41 Ethiopia, Taiwan 40 Ghana, Indonesia, Italy, Ukraine 39 East Germany 38 South Korea 37 Vietnam 36 Egypt, Russia, Thailand 34 Chile, Jordan, Slovenia, Zambia 33 Brazil, Cyprus, Malaysia, Romania 32 Colombia, Moldova, Turkey 31 Morocco 30 China 29 Mexico 28
(Welzel, 2010, Table 1, pp. 156–157; used by permission)
◆ Questionnaire Items for the Collective Action Tendency Dimension
Finally, Welzel calculated a national col-lective action tendency index. He used three World Values Survey items: v96, v97, and v98, asking whether the respon-dents had participated in various politi-cal activities, might participate, or would never participate. The three activities were signing a petition, joining in boycotts, and attending peaceful demonstrations. Welzel
gave a value of 1.00 to the first answer, 0.30 to the second, and 0.00 to the third, arguing that “would” and “might” partic-ipate are qualitatively weaker indications of participation in collective action than active participation.
◆ Statistical Analysis of the Items for the Collective Action Tendency Dimension
Welzel averaged the answers to the chosen items at the individual level and calculated country scores. Welzel’s collective action tendency index is provided below, with scores multiplied by 100.
Collective action tendency Sweden 57 Norway, Switzerland 52 Australia 51 United States 50 Canada, France 49 Italy 48 Andorra 47 United Kingdom 44 West Germany 40 East Germany 39 Finland, Japan, Netherlands 37 Brazil 36 Serbia, Spain 34 Burkina Faso 33 Cyprus, Ethiopia, South Korea 32 India, Slovenia, Trinidad 30 Mali 29 Zambia 28 Argentina 27 South Africa 24 Mexico, Uruguay 23 Morocco, Poland 22 Colombia 21 Moldova 20 Chile 19 China 18 Bulgaria, Turkey 17 Ghana, Indonesia, Russia, Ukraine 16 Rwanda 14

356 ◆ Major Cross-Cultural Studiess
Taiwan 13 Romania 12 Malaysia 11 Vietnam 8 Thailand 7 Egypt, Jordan 6
(Welzel, 2010, Table 1, pp. 156–157; used by permission)
◆ Additional Statistical Analysis
If Welzel had not performed a pan-cultural analysis but an ecological one, his results would probably have been somewhat simi-lar, yet not identical. For example, if he had factor analyzed his four items that measure the importance of various values for children, he would have obtained a single factor with the following factor loadings:
faith .79 obedience .79 independence –.72 imagination –.77
How would these four items corre-late with Welzel’s self-expression index? Correlations across 50 common cases are provided below:
faith –.77** obedience –.58** imagination .58** independence .37**
◆ Contributions
All of Welzel’s dimensions are significantly correlated with Hofstede’s (2001) individ-ualism versus collectivism index, Project GLOBE’s in-group collectivism practices index (Gelfand et al., 2004), and Minkov’s (2011) exclusionism versus universalism
index. With the exception of Welzel’s col-lectivism versus individualism, each of his dimensions correlates with at least one of these at more than ±.70.
Additionally, all of Welzel’s dimensions, except collectivism versus individualism, are highly correlated with measures of national wealth and obviously divide the world into developing and rich nations, as well as intermediate cases. Clearly, Welzel’s dimensions tap cultural differ-ences associated with national wealth. Whatever these differences are called—collectivism versus individualism, exclu-sionism versus universalism, or something else—Welzel shows that people in richer societies are more concerned about the affairs of those who are not their immedi-ate kin, are more active politically, and are more likely to trust out-group mem-bers. This is a very important contribution to our understanding of the cultural dif-ferences between the rich and poor world.
◆ Food for Thought
1. Welzel justifies the standardiza-tion procedure for the 10 Schwartz items by saying that “people have different base levels on which they differentiate their value properties.” But as noted in 7.2.4.4.10., various scholars have warned that there is no reason to assume that a person uses the same base level for all items.
2. The logic of the so-called pan-cultural analysis is flawed (see 8.2.10.). It treats the available pool of individuals as if they were representative of mankind, without appropriate weights for large and small countries, and thus distorts the picture that one would obtain if the populations of all countries of the world were proportionally represented. Further, believing that the effect of culture can be eliminated by subtracting the national mean from the answers of all respondents

Cultural Dimensions Across Modern Nations ◆ 357
from a particular nation is a simplistic assumption.
3. Welzel’s self-expression dimen-sion is a merger of three oblique dimen-sions. This obscures the relationship between the final dimension and the items that define it (see 8.2.10.). The additional statistical analysis reported here suggests that Welzel’s conceptualization of self-expression and the actual results (the dimension index) that he obtained do not match well. Evidently, the dimension is strongly defined by a low importance of faith, has a moderate association with a high importance of imagination and a low importance of obedience, but is very weakly related to independence: The two share only about 15% of their variance. These results are normal considering that Welzel built a dimension from items that produce three factors at the individual level and would not form a strong single factor at the ecological level.
A simple check of what Welzel’s self-expression index stands for can be per-formed by correlating it with the two orthogonal dimensions of national culture in Inglehart and Welzel (2005a). 1 The resulting correlation across 33 common cases is .66** with self-expression values and .71** with secular-rational values. If Welzel’s self-expression index is closer to Inglehart and Welzel’s secular-rational values dimension than to their self-expres-sion values dimension, one can only won-der why Welzel (2010) ignored this fact.
4. The high positions of a number of developing countries (India, Ethiopia, Zambia, Thailand) on the individualism
versus collectivism dimension require an explanation. Other measures of indi-vidualism versus collectivism or closely associated dimensions produce a more clear association with national wealth. Of course, the names of the dimensions are not important; it is possible that Welzel has measured something that is somewhat different from Hofstede’s individualism or Project GLOBE’s indi-vidualism versus collectivism practices. But whatever it is, the country rankings need clarification.
5. It is unclear how well respondents in all countries understand the Schwartz values in the World Values Survey. Some of these, such as tradition, helping others, and being rich, probably do not cause a comprehension problem in any national culture. But new ideas, adventure, risk, and the environment are relatively mod-ern Western concepts. Item v230 in the 2005–2008 study of the World Values Survey asks how often the respondents use computers. The answers show that 29% of the Indian respondents and 17% of the Chinese admit that they do not know what a computer is. One can only wonder how well such people understand notions such as creativity (even if some of them are naïve artists of sorts) or protection of the environment.
■ Note
1. The indices for these dimensions were deliberately chosen from a publication of which Welzel is a coauthor.

358 ◆
◆ Introduction
This is a study by the author of this book. Minkov (2009a) started from the observation that a number of analyses (Choi & Choi, 2002; Hamamura, Heine, & Paulhus, 2008; Hofstede, 2001; Nisbett, 2003; Nisbett et al., 2001; Peng & Nisbett, 1999; Peng, Spencer-Rodgers, & Nian, 2006) describe East Asian think-ing as more dialectical than the thinking of some other nations, for example, North America. Dialectical thinking can be defined as tolerance for holding apparently contradictory beliefs or producing self-descriptions such as “outgoing” and “shy” (Hamamura et al., 2008; Peng & Nisbett, 1999). Americans may
perceive such self-descriptions as mutually exclusive, but in the view of many East Asians one can be somewhat outgoing and somewhat shy, depending on the circumstances.
Individual-level dialecticism can also be expressed as a ten-dency to reconcile positive and negative emotions or experience them within relatively short time intervals (see Schimmack, Oishi, et al., 2002, and 9.10.). Thus, dia-lecticism can be defined as a ten-dency to reconcile concepts and feelings that are seemingly con-tradictory, at least to a Western mind.
Heine (2001) indicates another interesting aspect of dialecti-cism that served as the basis for Minkov’s study. According to Heine, Chinese appear to accept
MICHAEL MINKOV (2009A): A STUDY OF SOCIAL POLARIZATION IN SOCIAL OPINIONS AND LIFE-QUALITY JUDGMENTS
9.23
358 ◆

Cultural Dimensions Across Modern Nations ◆ 359
contradictions as a natural part of life, and, when presented with two contradic-tory arguments, they tend to accept both. If this is so, societies whose members tend to have dialectical selves, such as those of China and other East Asian countries, should be characterized by an avoidance of strongly expressed opinions, especially on matters that may cause social conflict. The reason for this is that if two parties formulate their opinions in strong terms, and the opinions turn out to contradict one another, it is less easy to reconcile them in a dialectical way than if they were moderately expressed. The way in which people word their opinions is espe-cially important in the public and political sphere. For example, if one has described a national government as very good, this position cannot be easily reconciled with somebody else’s view that the same gov-ernment is very bad. Dialectical mind-sets can be expected to avoid such polarized statements. Instead, they would probably prefer more moderate descriptions, such as “somewhat good” versus “somewhat bad,” because if a public argument starts from these two platforms, it is easier to achieve some sort of reconciliation.
The goal of Minkov’s study was to compose a national index of social polar-ization, reflecting the degree to which soci-eties are socially polarized in the way that they express judgments. A highly polarized society is one where high percentages of people make strong statements, such as “Our current government is very good” and high percentages make the opposite strong statement: “Our government is very bad.” In a society with low social polariza-tion, people would either tend to refrain from such strong statements or there would be some consensus that the government is either very bad or very good.
Minkov hypothesized that his social polarization index would reflect some-thing similar to a measure of response style, contrasting countries where extreme responses are typically avoided and coun-tries where many respondents tend to
choose extremes on Likert scales. If this hypothesis were confirmed, it would, among other things, provide an explana-tion for some of the observed national differences in response style. The explana-tion would be substantive: Some response styles may have specific social functions and should not be viewed as meaningless research artifacts. If East Asian commu-nication is characterized by vagueness, this may reflect an unwillingness to make strong statements (including strong and unequivocal agreement or disagreement) that is deeply rooted in the East Asian dialectical self.
◆ Samples
Minkov used data from the Pew Research Center (PRC)—a U.S. research agency that studies political moods in the United States. In 2002 and 2007, the PRC car-ried out cross-cultural studies in 44 and 47 nations, respectively, on all continents. It used mostly nationally representative samples, especially in the second case (Pew Research Center, 2007). Minkov’s data were from the 2007 study.
◆ Hypothesized Dimensions
Minkov believed that he would obtain a dimension similar to his monumentalism (see 9.24.). It would contrast the Arab world, where strongly expressed categori-cal statements are common, and East Asia, where dialecticism prevails and statements tend to be moderate.
◆ Questionnaire Items
Among other things, the PRC asks respon-dents to make quality judgments. Quality

360 ◆ Major Cross-Cultural Studies
judgments are similar to attitudes: They can be defined as expressions of opinions about the quality of situations, phenom-ena, individuals, or groups of people. They may be presented in different formats, such as
X is good/bad.
I am satisfied/dissatisfied with X.
I agree/disagree that X is good/bad.
It is also possible to make quality judgments about hypothetical situations, such as
X would be good.
It would be good if X did Y.
Regardless of the different formats and wordings, all judgments are statements in which something—real or hypothetical—is evaluated as positive or negative.
The Pew Research Center (2007) con-tains a high number of quality judgment items. Minkov’s study used a selection of these items. Those that were left out were either not asked in all PRC countries or were not scored on Likert scales, which made them unusable.
Examples of items used by Minkov are
Please tell me whether you completely agree, mostly agree, mostly disagree, or completely disagree with the following statements:
q. 18a: Most people are better off in a free market economy even though some people are rich and some are poor.
q. 22a: The (state or government) con-trols too much of our daily lives.
q. 22c: Religion is a matter of personal faith and should be kept separate from government policy.
q. 22e: Our way of life needs to be pro-tected against foreign influence.
q. 22f: We should restrict and control entry of people into our country more than we do now.
q. 22g: It is sometimes necessary to use military force to maintain order in the world.
Other examples:
Is the influence of (read name) very good, somewhat good, somewhat bad, or very bad in (survey country):
q. 21a: our national government
q. 21d: news organizations/the media such as television, the radio, newspa-pers and magazines
q. 21f: immigrants
q. 21g: large companies from other countries
Altogether, 17 items were selected as appropriate for the analysis. Some of the items raise the question of how well the respondents understand the issues being addressed. Minkov, however, was not interested in the substance of the answers but in the form in which they were expressed. Strong social opinions and social polarization are possible even when large segments of the population do not understand properly what they are talking about; one can even fight a war without understanding its true meaning and consequences.
◆ Statistical Analysis
In Minkov’s (2009a) view , polarization in the expression of quality judgments

Cultural Dimensions Across Modern Nations ◆ 361
could be measured starting from the fol-lowing logic. The highest possible degree of polarization in a particular country is when 50% of all respondents in it have chosen the positive extreme position on a Likert scale, such as “very good,” and 50% have chosen the negative extreme, such as “very bad.” A society that exhibits this pattern is more polarized than one where the pattern is, for instance, 70% “very bad” versus 30% “very good.” This means that to measure the degree of polar-ization for each country and for each item, one should multiply the percentages of respondents who have chosen the positive extreme of each item by the percentages of respondents who have chosen the negative extreme. 1
In a very few countries, the percent-ages of respondents who had chosen an extreme answer was 0. Because multipli-cation by 0 results in a value of 0 regard-less of the number that is multiplied by 0, those few 0 values were replaced by a value of 1.
Before the multiplication of the per-centages of respondents who have chosen extreme positions, Minkov verified how many factors the 34 extremes of the 17 items would form. A small number of factors—one or two—would mean that there is not much real diversity across the selected items and the answers do not reflect broad cultural patterns of expres-sion of quality judgments on diverse mat-ters but are a reaction to a set of correlated stimuli.
The factor analysis of the 34 extremes yielded three factors with eigenvalues exceeding 1.00, each of them explain-ing at least 10% of the total variance. Cumulatively, these three factors explained 49.78% of the total variance. There were also six weaker factors with eigenvalues exceeding 1.00 but explaining less than 10% of the variance each. Nevertheless, cumulatively they explained another 31% of the total variance. Thus, the diversity captured by the 34 extremes of the 17
items appeared to be vast and acceptable for general conclusions about national dif-ferences in social polarization in quality judgments.
After the multiplication products (posi-tive extreme x negative extreme) for the 17 pairs of items were obtained, they were added up for each nation. This resulted in an index of quality judgment polarization (versus moderation) for 47 countries and provinces.
Below, Minkov’s (2009a) social polar-ization index is reproduced with a few updates.
Social polarization Kuwait 6264 Palestine territory 5558 Tanzania 4785 Egypt 4475 Jordan 4402 Pakistan 4222 South Africa 4198 United States 3923 Mali 3921 Nigeria 3845 France 3754 Lebanon 3600 Sweden 3579 Uganda 3576 Ivory Coast 3525 Germany 3262 Senegal 3201 Turkey 3140 India 3045 Kenya 2990 Ethiopia 2980 Canada 2953 Bangladesh 2940 Venezuela 2888 Argentina 2716 Morocco 2707 United Kingdom 2685 Ukraine 2668 Ghana 2663 Israel 2631 Peru 2487 Slovakia 2330 Russia 2278

362 ◆ Major Cross-Cultural Studies
Czech Republic 2185 Bulgaria 2126 Chile 2121 Bolivia 2061 Brazil 1947 Malaysia 1798 Mexico 1664 Spain 1551 Poland 1495 Italy 1258 Indonesia 1232 Japan 1069 China 768 South Korea 461
To validate his social polarization index, Minkov reported correlations with external variables: –.66** ( n = 18) with Schimmack, Oishi, et al.’s (2002) personal dialecticism index. Thus, nations with more dialectical selves are more likely to have cultures that avoid polarized quality judgments. The social polarization index also correlates significantly with Minkov’s (2011) monumentalism: .53** ( n = 26).
◆ Contributions
1. This is the first study of social polarization in quality judgments across many nations. It revealed a clear geo-graphic pattern, showing that the most polarized societies are those of the Middle East and Pakistan, some African countries, and the United States. The least polarized societies are those of East and Southeast Asia.
2. The negative association between social polarization and personal dialecti-cism suggests a link between societal and psychological phenomena.
3. The study suggests that some types of response style are not simply a peculiarity that the members of some nations tend to exhibit when they answer
questionnaire items scored on a Likert scale. Response style may serve a social function. Some response styles are insepa-rable elements of some cultures. Attempts to remove those styles (for instance, by item standardization by case) may in some cases amount to a disfiguration of a given culture.
◆ Food for Thought
1. Minkov’s study needs to be appro-priately replicated. Some World Values Survey items suggest that a similar social polarization index could be extracted from that database, but the number of suitable items is small.
2. The association between national prevalence of personal dialecticism and social polarization is not explained in depth. Although the statistical associa-tion is doubtlessly high, psychologists would wish to have a more detailed account of the mechanism that creates this association.
3. Minkov attributed the East and Southeast Asian tendency to avoid polar-ization in judgments to the legacy of wet, rice cultivation, which requires coopera-tion with and adaptation to others. He viewed the Middle Eastern inclination toward categorical expression of judg-ments, even at the risk of causing social polarization, as a legacy of pastoralism: a way of subsistence that often results in clashes among those who practice it, as well as between them and farmers. These theories require further research.
■ Note
1. Adding up the two values would not create the desired effect because a 50–50 split

Cultural Dimensions Across Modern Nations ◆ 363
would yield the same sum as a 70–30 split or a 90–10 split, although these do not reflect the same degree of polarization. If the extremes are multiplied, the maximum possible score
for each item is 50 x 50 = 250. This maximum score can be obtained only if the split is 50–50; that is when the highest polarization is observed.

364 ◆
◆ Introduction
The determinants of economic development and the observed differences in national wealth have attracted the attention of many analysts, at least since Montesquieu (1748) and Smith (1777). Subsequently, there have been countless publications on this question (see Fukuyama, 2001). They belong to two main schools of thought. The authors of those in the first group are primarily prominent development economists who propose various economic, political, or geographic factors but reject, or at least disre-gard, culture as a potential expla-nation (e.g., Dornbusch et al., 2004; Gallup & Sachs, 1998; Solow, 1956; etc.). The analysts in
the second group are sociologists, political scientists, or anthro-pologists (e.g., Harrison, 1992; Harrison & Huntington, 2000; Hofstede, 2001; McClelland, 1961; Weber, 1930; etc.). They believe that elements of culture, such as values, can account at least to some extent for differ-ences in economic development.
According to Minkov and Blagoev (2009), there is no real contradiction between these two schools of thought. These authors show that some of the economic variables that predict economic growth according to the devel-opment economists have equiva-lents in cultural values. Measured around 1998–1999 by the World Values Survey, these values form a cultural dimension that is a reliable predictor of speed
MICHAEL MINKOV (2011): A STUDY OF VALUES RELATED TO NATIONAL ECONOMIC GROWTH AND EDUCATIONAL ACHIEVEMENT
9.24
Cultural Dimensions Across Modern Nations ◆ 365
of economic growth in the subsequent decade across developing nations, explain-ing about one-third of the variance across the available sample. Minkov (2011) took this analysis further. His analysis and the cultural dimensions that emerged from it are presented below.
As in Minkov and Blagoev (2009), Minkov’s (2011) analysis started from the work of Dornbusch et al. (2004). Discussing the so-called East Asian eco-nomic miracle, these economists express their skepticism of the idea that there is anything miraculous or special in it. They explain it as “old-fashioned hard work and sacrifice” (p. 87). They also indicate that the East Asian countries did not experience remarkable increases in total factor productivity A. Instead, they saved and invested, put more people to work, and concentrated on education in order to raise human capital. Dornbusch et al. (2004) refer to studies showing that savings rates are a strong and positive predictor of fast economic growth across poor countries; however, this effect of saving seems to wear off once a country has achieved some economic prosperity. The effect of education and female par-ticipation in the labor force on economic growth may be harder to prove, but it is intuitively clear that very poorly educated populations and societies that prevent most women from working cannot sustain fast growth over a long period.
Minkov (2011) supposed that a finer-grained analysis than the one in Minkov and Blagoev (2009) would result in one or more dimensions of culture that explain more than one-third of the variance in national differences in economic growth.
◆ Samples
Minkov (2011) used the nationally rep-resentative World Values Survey. Noting that the national measures of some vari-ables show fluctuations across different
surveys, he decided to analyze only coun-tries that are represented in the World Values Survey at least twice: once in the latest available survey (2005–2008) and once in an least one earlier survey, but no farther back than 1994. Thirty-three countries fully satisfied this criterion: They had been surveyed at least twice and were represented on all items of interest. Another 10 countries were represented on nearly all items, and it seemed reasonable to include them in the analysis to increase the sample.
◆ Hypothesized Dimensions
As Minkov’s (2011) analysis started from the work of Dornbusch et al. (2004), it was based on the assumption that the cultural dimensions that would emerge would be related to values and beliefs concerning work and leisure, as well as education. Minkov believed that his analy-sis of World Values Survey items would reveal a dimension similar to indulgence versus restraint, 1 first proposed by Minkov (2007), subsequently adopted as a sixth dimension of culture in Hofstede’s model (Hofstede, Hofstede, & Minkov, 2010). It would reflect a high importance of work and thrift at one of the two poles, plus a low importance of leisure. At the opposite pole, this tendency would be reversed: Hard work and thrift would be valued far less than leisure. Based on Minkov (2009b), the first pole would also be asso-ciated with lower happiness and lower life control, whereas the other pole would stand for the opposite. In accordance with the theories and findings of the develop-ment economists, this dimension would predict speed of economic growth because societies that value thrift and hard work while sacrificing leisure would have an economic advantage over those that do not have such tendencies.
Dornbusch et al. (2004) predict that better-educated societies will have faster

366 ◆ Major Cross-Cultural Studies
economic growth. Yet, measuring cultural values and attitudes that are associated with educational achievement, and hence with economic growth, is not an easy endeavor. In an analysis by Noorderhaven and Tidjani (2001), a number of African countries had higher scores than East Asian countries on a dimension that revealed an emphasis on traditional wis-dom at the expense of modern education (see 9.2.). However, Minkov (2008) found that countries with higher percentages of secondary school students who state that they strive to be among the best in mathematics because they want to surpass their peers do considerably less well in that subject than countries whose students make more humble self-presentations. He explained this paradox in terms of Steven Heine’s self-enhancement and self-stability theory and Carol Dweck’s findings (dis-cussed in endnote 3).
Heine and his associates (Heine, 2003a; Heine et al., 2001) proposed a nega-tive correlation between two psychologi-cal constructs: self-enhancement and self-improvement. This is an interesting hypothesis because, if validated, it could explain differences in one particular type of self-improvement—educational achieve-ment. Heine (2003a) provides the follow-ing definitions of self-enhancement: “the tendency to overly dwell on, elaborate, and exaggerate positive aspects of the self, rela-tive to one’s weaknesses” (p. 101). 2 Thus, a central element of self-enhancement is maintenance of a positive self-opinion.
Heine (2003a) defines self-improvement as “the tendency to overly dwell on, elabo-rate, and exaggerate negative aspects of the self relative to one’s strengths in an effort to correct the perceived shortcom-ings” (p. 101). He adds that this defini-tion is consistent with research conducted with East Asian populations, although it is a rather novel motivation within North American psychological research. Heine’s definition implies that personal change in a desirable direction is a key element of self-improvement.
Elaborating on his hypothesis, Heine (2003a) suggests that self-enhancement correlates with, and can be boosted by, self-stability—the tendency to ascribe immutable traits to the human self and value the existence of such traits. According to him, if one subscribes to a theory that abilities are a result of stable personal factors, it becomes beneficial to view the self in the most positive light. Discoveries of weaknesses in the stable self would have a psychologically devas-tating effect because they would be seen as irremediable. In this case, possessing a more positive evaluation of one’s self should be a more central concern than making futile efforts to change what appears to be immutable. Inversely, if one views the self as fluid and malleable, there is no imperative for self-enhancement. Instead, efforts to correct one’s defi-ciencies could be viewed as potentially productive. Heine’s definition of self-improvement is quite broad, but he does indicate that educational success could relate to that construct. 3
Some small-scale studies have evi-denced cross-cultural differences in self-enhancement: North Americans are more likely to exhibit that characteristic than East Asians (Heine, 2001, 2003a; Heine & Lehman, 1997; Heine, Lehman, Markus, & Kitayama, 1999; Heine, Takata, & Lehman, 2000). 4 In other words, East Asians are, generally speaking, more hum-ble than Americans.
There is also a considerable literature that describes North Americans and East Asians as exhibiting differences in terms of self-stability or self-consistency versus self-flexibility (Bond & Cheung, 1983; Choi & Choi, 2002; Heine, 2001; Kanagawa, Cross, & Markus, 2001; Markus & Kitayama, 1991; Peng et al., 2006; Suh, 2002). North Americans normally believe that they possess, and describe themselves in terms of, stable personal characteris-tics that change little across situations. East Asians are more likely to exhibit the opposite tendency: They view and portray

Cultural Dimensions Across Modern Nations ◆ 367
themselves as flexible individuals whose characteristics can mutate to adapt to situations. Also, they are not bothered by apparent personal inconsistencies as much as North Americans are. The available evidence suggests that the East Asian self is characterized by lower self-stability and self-consistency than the North American one. The East Asian self is defined by what North Americans might consider a paradoxical combination of opposites, as well as shifting characteristics and incon-sistencies.
There is also one small-scale study that confirms the correlation between self-consistency and self-enhancement across five ethnic groups. Spencer-Rodgers, Peng, Wang, and Hou (2004) found that Chinese and Asian Americans presented more ambivalent (inconsistent) self-evaluations than European Americans. U.S. Latinos and African Americans presented even less ambivalent self-evaluations than European Americans. Similarly, Chinese presented the lowest positive self-evaluations, fol-lowed by Asian Americans (who had somewhat higher self-evaluations), then by European Americans, then by Latinos and African Americans. The negative self-eval-uations ranking was exactly the opposite.
The study by the Chinese Culture Connection (1987) also addressed some aspects of self-enhancement and self-sta-bility, albeit under different names. The Confucian work dynamism dimension, called “long-term orientation” (LTO) by Hofstede (2001), grouped an item that mea-sures the importance of personal stability and another one that measures the impor-tance of protecting one’s face at the same pole of a single dimension. Obviously, the first of these items refers to the importance of possessing a self with stable traits, values, and beliefs. Protecting one’s face denotes a high concern for positive information about one’s self. Hofstede (2001, p. 354) explained face as “dignity, self-respect, and prestige.” An item that measures the importance of respect for tradition was also found on the same pole. A high importance of stable
social customs and norms is what one could expect in a society that encourages stable values and selves. On the other hand, the Chinese Culture Connection found that an item that measured the importance of having a sense of shame had the opposite valence. Endorsement of this item suggests humility—the opposite of self-enhancement.
Minkov (2008) reinterpreted the Confucian work dynamism/long-term orientation dimension as a measure of national differences in self-stability and self-enhancement. In accordance with Heine’s predictions, this dimension is asso-ciated with national differences in educa-tional achievement (Hofstede, 2001). Yet, Minkov believed that the World Values Survey offered an opportunity for the extraction of a more focused dimension of culture that would reflect national dif-ferences in some aspects of self-stability and self-enhancement while being closely associated with national differences in educational achievement. He surmised that items that measure religiousness and pride would be suitable for the extraction of that dimension. It is evident that pride is a form of self-enhancement. 5
The World Values Survey does not address self-stability or self-consistency directly. However, the items that measure various aspects of religiousness are close proxies. A principal element of religious-ness is the view that one must maintain a stable and consistent self that adheres to an immutable set of nonnegotiable values, norms, and behaviors regardless of shifting circumstances. Also, this stable self is supposed to possess at least some unchangeable traits that give it an eternal individual identity by which it can be recognized not only in this life but also in the hereafter. This view is not pro-moted by some Eastern religions, but their philosophical systems do not foster great religiousness either. The World Values Survey data demonstrate that the East Asian nations have some of the lowest percentages of respondents who attach a great importance to religion.
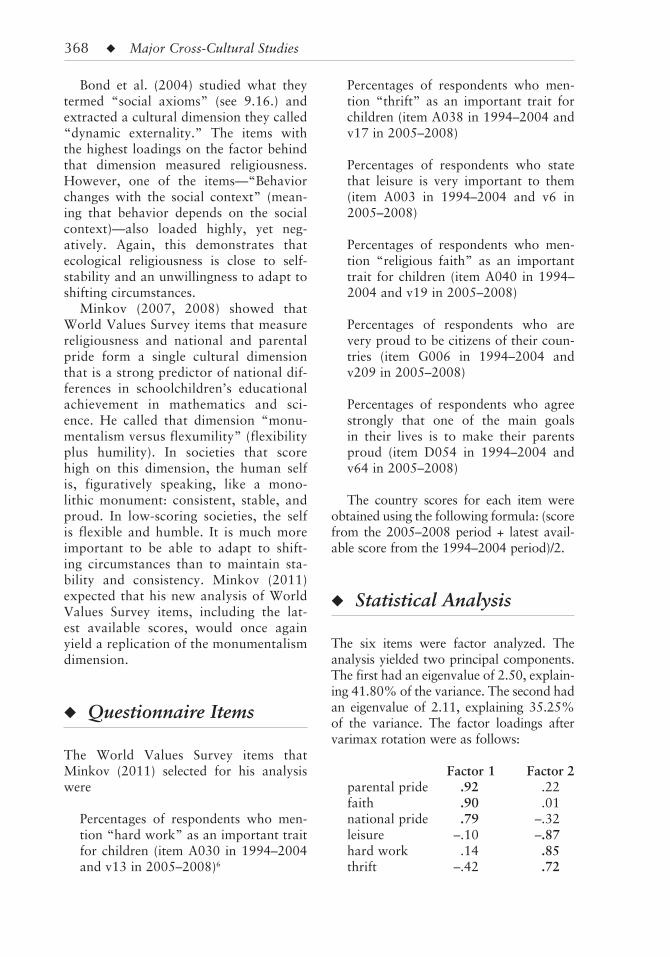
368 ◆ Major Cross-Cultural Studies
Bond et al. (2004) studied what they termed “social axioms” (see 9.16.) and extracted a cultural dimension they called “dynamic externality.” The items with the highest loadings on the factor behind that dimension measured religiousness. However, one of the items—“Behavior changes with the social context” (mean-ing that behavior depends on the social context)—also loaded highly, yet neg-atively. Again, this demonstrates that ecological religiousness is close to self-stability and an unwillingness to adapt to shifting circumstances.
Minkov (2007, 2008) showed that World Values Survey items that measure religiousness and national and parental pride form a single cultural dimension that is a strong predictor of national dif-ferences in schoolchildren’s educational achievement in mathematics and sci-ence. He called that dimension “monu-mentalism versus flexumility” (flexibility plus humility). In societies that score high on this dimension, the human self is, figuratively speaking, like a mono-lithic monument: consistent, stable, and proud. In low-scoring societies, the self is flexible and humble. It is much more important to be able to adapt to shift-ing circumstances than to maintain sta-bility and consistency. Minkov (2011) expected that his new analysis of World Values Survey items, including the lat-est available scores, would once again yield a replication of the monumentalism dimension.
◆ Questionnaire Items
The World Values Survey items that Minkov (2011) selected for his analysis were
Percentages of respondents who men-tion “hard work” as an important trait for children (item A030 in 1994–2004 and v13 in 2005–2008) 6
Percentages of respondents who men-tion “thrift” as an important trait for children (item A038 in 1994–2004 and v17 in 2005–2008)
Percentages of respondents who state that leisure is very important to them (item A003 in 1994–2004 and v6 in 2005–2008)
Percentages of respondents who men-tion “religious faith” as an important trait for children (item A040 in 1994–2004 and v19 in 2005–2008)
Percentages of respondents who are very proud to be citizens of their coun-tries (item G006 in 1994–2004 and v209 in 2005–2008)
Percentages of respondents who agree strongly that one of the main goals in their lives is to make their parents proud (item D054 in 1994–2004 and v64 in 2005–2008)
The country scores for each item were obtained using the following formula: (score from the 2005–2008 period + latest avail-able score from the 1994–2004 period)/2.
◆ Statistical Analysis
The six items were factor analyzed. The analysis yielded two principal components. The first had an eigenvalue of 2.50, explain-ing 41.80% of the variance. The second had an eigenvalue of 2.11, explaining 35.25% of the variance. The factor loadings after varimax rotation were as follows:
Factor 1 Factor 2 parental pride .92 .22faith .90 .01national pride .79 –.32leisure –.10 –.87 hard work .14 .85 thrift –.42 .72

Cultural Dimensions Across Modern Nations ◆ 369
The first factor was called “monumental-ism versus flexumility” in keeping with the terminology in Minkov’s previous work. The second factor was similar to Minkov’s (2007) indulgence versus restraint dimen-sion. Yet, it was a measure of work ori-entation and this needed to be reflected in its name. Minkov (2011) chose to call the dimension “industry versus indulgence.”
After the national indices for the two dimensions were expanded with predicted scores, 7 the two indices (43 countries each) yielded the following correlations with the items that define them: 8
monumentalism industryparental pride .89** .36faith .88** .30national pride .84** –.14leisure –.03 –.88** hard work .04 .85** thrift –.50** .64** Both indices were plotted on a scale
from 0 (lowest score) to 1000 (highest score). They are reproduced below from Minkov (2011) with the kind permission of Emerald Publishing.
Monumentalism Egypt 1000 Iraq 997 Jordan 995 Nigeria 908 Morocco 890 Zimbabwe 811 Iran 747 South Africa 736 Turkey 668 Colombia 667 Georgia 662 Mexico 659 Indonesia 623 Brazil 614 United States 572 Argentina 571 Chile 564 India 527 Romania 521 Poland 505
Uruguay 492 Australia 436 Spain 427 Vietnam 423 New Zealand 388 Serbia 359 United Kingdom 354 Italy 352 Slovenia 340 Finland 312 Moldova 276 Bulgaria 265 Switzerland 242 Russia 191 Sweden 184 Ukraine 175 France 165 Netherlands 119 Germany 99 South Korea 43 Japan 40 Taiwan 16 China 0
Industry China 1000 Vietnam 968 South Korea 900 India 883 Indonesia 869 Moldova 864 Romania 827 Russia 826 Bulgaria 744 Ukraine 739 Morocco 705 Egypt 700 Iraq 653 Zimbabwe 636 Taiwan 627 Poland, South Africa 625 Georgia 609 Iran 600 Jordan 563 Turkey 548 Serbia 527 Brazil 489 Italy 463 France 455 Nigeria 402

370 ◆ Major Cross-Cultural Studies
United States 399 Germany 395 Spain 372 Japan 343 Slovenia 321 Argentina 316 Colombia 251 Switzerland 250 Mexico 228 Chile, United Kingdom 213 Australia 196 New Zealand 167 Uruguay 124 Finland 84 Netherlands 71 Sweden 0
◆ Validation of the Monumentalism Dimension
Minkov (2008) showed that a measure of monumentalism based on World Values Survey data from 1994 to 2004 was a strong predictor of national differences in school achievement as measured by the nationally representative interna-tional projects TIMSS and OECD PISA (Trends in International Mathematics and Science Study, and Organisation for Economic Co-operation and Development Programme for International Student Assessment, respectively). More monumen-talist countries had lower school achieve-ment in mathematics and science, but also in reading. The predictive power of monu-mentalism remained high even after con-trolling for national differences in wealth.
Minkov (2011) reported that the new monumentalism index was also strongly and negatively correlated with TIMSS mea-sures of average national school achieve-ment in mathematics and science. The correlation between monumentalism and a mathematics achievement index composed from the three latest TIMSS studies was –.81** ( n = 29), reduced to –.70** after controlling for national wealth.
According to Minkov’s (2011) analysis, in a zero-order correlation monumental-ism is insignificantly correlated with GNI per person at PPP (gross national income per person at purchasing power parity) growth from 1998 to 2008 but after controlling for GNI per person at PPP in 1998, the correlation becomes –.68** ( n = 38). Across the developing countries, mon-umentalism yields a zero-order correlation with GNI per person at PPP growth from 1998 to 2008 of –.67** ( n = 25), which becomes –.79** ( n = 23) after controlling for GNI.
To validate the monumentalism dimen-sion as a measure of self-stability and self-consistency, Minkov reported a number of correlations between its index and items in the 2005–2008 wave of the World Values Survey:
v89: percentages of respondents who state that a person to whom tradition is important is very much like them: r = .82** ( n = 35)
v217: percentages of respondents who agree strongly that having ancestors from their country is a very important requirement for citizenship: r = .69** ( n = 31)
v87: percentages of respondents who state that a person who always behaves properly is very much like them: .67** ( n = 35)
v66: percentages of respondents who strongly agree that they always try to live up to friends’ expectations: .65** ( n = 37)
Two other items in earlier versions of the World Values Survey (latest data for each country from 1994–2004) also validate monumentalism as a measure of self-stability and self-consistency:
A026: percentages of respondents who agree that parents must do their best for

Cultural Dimensions Across Modern Nations ◆ 371
their children rather than have a life of their own: .74** ( n = 42)
F121: average acceptance of divorce: –.60** ( n = 43)
Minkov also reported an interesting correlation that validates monumentalism as a measure of self-enhancement:
E050: percentages of people who view themselves as a model for other peo-ple (latest data for each country from 1990–1993): .54** ( n = 22)
Minkov (2011) provided further cor-relates of monumentalism that can help shed light on what this dimension of national culture stands for. Some of the most important of these are
Confucian work dynamism/long-term orientation (Chinese Culture Connection, 1987; Hofstede, 2001): –.62** ( n = 16, China’s LTO score from Hofstede, 2001)
Percentages of people who state that service to others (helping other people) is very important to them (item A007 in the World Values Survey, latest data for each country from 1994–2004): .90** ( n = 21)
Occurrence of help for a seemingly blind man (Levine et al., 2001): .85** ( n = 12)
National suicide rates (average rates for men and women, calculated on the basis of data from the World Health Organization, 2009b): –.73** ( n = 35)
Number of professions in the country in which tipping is prevalent (data obtained by M. Minkov through per-sonal communication with M. Lynn, May 27, 2006. See also Lynn, 1997, 2000): .67** ( n = 19)
Help for the blind man in the presence of others was interpreted as a concern for maintaining one’s public image as a good person. Suicide rates are low in societies where people experience various forms of pride and have stable values and identities. Tipping is a form of self-enhancement—a demonstration of personal success and magnanimity.
After his analysis, Minkov (2011) provided this definition of monumental-ism versus flexumility as a dimension of national culture:
Monumentalism is a cultural syndrome that stands for pride and an invariant self: a conviction that one must have an unchangeable identity and hold on to some strong values, beliefs, and norms. It also reflects avoidance of personal duality and inconsistency.
Flexumility is the opposite of the same syndrome. It reflects humility and a changeable self: an ability to assume multiple identities and adapt one’s val-ues, beliefs, and norms in accordance with practical considerations. (Adapted from p. 129)
◆ Validation of the Industry Dimension
Minkov (2011) found that the indus-try index correlated with national wealth growth (GNI per person at PPP in 2008 divided by the same variable in 1998) at .74** ( n = 40). Controlling for national wealth in 2008 (since wealthier countries by definition cannot grow as quickly as poorer ones) reduced this correlation to .58**.
A sample of 40 countries is relatively small. But if an industry index were cal-culated solely on the basis of World Values Survey data from around 1998–1999, it would cover about 80 countries.

372 ◆ Major Cross-Cultural Studies
The correlation between that index and national wealth growth per person from 1998 to 2008 would be about .60**.
Further, Minkov reported the following correlations between the industry index and external variables:
Self-reliance (Green et al., 2005): .82** ( n = 12)
Moral discipline (Chinese Culture Connection, 1987): 60** ( n = 15)
Confucian work dynamism/long-term ori-entation (Chinese Culture Connection, 1987; Hofstede, 2001): .62** ( n = 16; China’s LTO score from Hofstede, 2001)
Percentages of people who work more than 40 hours a week (Organisation for Economic Co-operation and Development, 2009): .64** ( n = 18); .41** after controlling for national wealth
Percentages of people who choose toler-ance and respect for others as a value for children, item v16 in the 2005–2008 World Values Survey: –.73** ( n = 41)
Four-point death penalty index, ranging from regular use of the death penalty to full abolition (Amnesty International, 2009): .50** ( n = 43)
Percentages of people who choose “protecting freedom of speech” as a top national priority (rather than “maintain order in the nation,” “give people more say,” or “fighting rising prices”), item E003 in the World Values Survey, latest data for each country from 1994–2004: –.67** ( n = 43)
Percentages of people who choose “maintain order in the nation” as a top national priority (rather than “pro-tecting freedom of speech,” “give peo-ple more say,” and “fighting rising prices”), item E003 in the World Values
Survey, latest data for each country from 1994–2004: .59** ( n = 43)
Average national life satisfaction, item A171 in the World Values Survey, latest data for each country from 1994–2004: –.72** ( n = 43)
Average national life satisfaction, item v22 in the World Values Survey, 2005–2008: –.69** ( n = 39)
Frequency of positive feelings (Schimmack, Oishi, et al., 2002): –.66** ( n = 22).
National wealth in 1999 (GNI per per-son at PPP, World Bank Group, 2009): –.65** ( n = 42)
On the basis of these findings, Minkov (2011) gave the following definition of industry versus indulgence as a dimension of national culture:
Industry is a cultural syndrome that stands for a specific personal and soci-etal discipline necessary nowadays for the achievement of economic prosperity in poor countries. It consists mainly of a high prioritization of hard work and thrift, low tolerance of deviations from established cultural norms, and a low prioritization of leisure for one’s self and individual freedoms for others.
Indulgence stands for the opposite of industry: a relaxed attitude toward hard work, thrift and deviations from cultural norms as well as a prioritiza-tion of leisure and individual freedoms for everybody. (Adapted from p. 86)
◆ Additional Statistical Analysis
A linear regression analysis was performed with national wealth change from 1998 to 2008 (GNI per person at PPP in 2008

Cultural Dimensions Across Modern Nations ◆ 373
divided by the same measure in 1998) as the dependent variable and monumental-ism, industry, and GNI per person at PPP in 1998 as independent variables. The following results were obtained with the enter method across 40 countries:
R Square = .72 F change = 31.47; p = 3.65 -10 df 1 = 3; df 2 = 36
monumentalism: beta = –.493, t = –4.53, p = 6.18 -5 , VIF = 1.54 industry: beta = .385, t = 3.07, p = .004, VIF = 2.05 GNI: beta = –.577, t = –4.04, p = 2.68 -4 , VIF = 2.67
The stepwise method yielded identi-cal results (R Square = .72). Industry explained 54.5% of the variance. The other two variables together explained another 18.0% of variance.
The sample of countries in this model is modest in number, yet it is rich cultur-ally and geographically. It is reasonable to assume that monumentalism, industry, and initial national wealth would explain at least one-half of the variance in speed of economic development from 1998 to 2008 across any balanced sample of nations. Although this analysis suggests that indus-try is by far the strongest contributor, it may be that the other two factors are actu-ally equally important.
◆ Contributions
1. Minkov’s measures of industry and monumentalism predict speed of sub-sequent national economic development with national wealth controlled for. After Hofstede and Bond (1988), this is the second successful attempt to show a sta-tistical correlation between measures of national culture and economic growth. As Minkov’s industry dimension is based on a perspective suggested by leading develop-ment economists, it is quite convincing as
a cultural predictor of economic growth across developing countries, conceptually as well as statistically. Because monumen-talism is strongly and negatively associated with average national success in math-ematics and science, it is also a plausible predictor of economic development.
2. Minkov’s analysis of World Values Survey items is reminiscent of that of Ronald Inglehart (Inglehart & Baker, 2000). Still, Minkov’s dimensions do not create the same geographic patterns. The industry pole of the industry versus indulgence dimension corresponds to the survival values pole in Inglehart’s sur-vival versus self-expression values, yet the highest-scoring countries are all Asian, not Eastern European, as in Inglehart’s analy-ses. Despite the close association between monumentalism and traditional values, these dimensions produce different coun-try rankings, too. Monumentalism creates a contrast between Arab and East Asian countries, whereas the two extremes on Inglehart’s traditional versus secular val-ues often show a contrast between Latin American countries and Scandinavian countries, as well as Japan.
3. Notwithstanding the statisti-cal and conceptual differences between Minkov’s monumentalism, the Chinese Culture Connection’s (1987) and Hofstede’s (2001) Confucian work dynamism/long-term orientation, and Inglehart’s traditional versus secular val-ues, Minkov (2007, 2011) believed that monumentalism could be seen as a bridge between the other two dimensions, built on a radically new psychological inter-pretation that he borrowed from Steven Heine.
4. Minkov’s monumentalism and its interpretation can explain some of the striking differences between Arab and East Asian cultures in an unprecedented way: as a function of very old differences in pride versus humility as well as a focus on an immutable identity versus flexibility

374 ◆ Major Cross-Cultural Studies
and adaptability. For instance, the lack of theatrical performances in the other-wise highly sophisticated traditional Arab culture could be explained as an unwill-ingness to assume a different or double identity. Minkov (2011) offered the same explanation for the lack of masks in Arab culture, the traditional ban on alcohol, and the avoidance of human likenesses in visual art.
5. In the same vein, Minkov (2011) explains some essential differences between the main tenets of the three great Middle Eastern religions and those of Asia. The former assume the existence of a stable, even eternal, identity encapsulated in the human soul. Buddhism explicitly chal-lenges the assumption that the self or soul can have any nonchangeable elements that can give a person an eternal identity. It rejects the idea of the transmigration of the soul from one body to another and posits that rebirth can only mean the con-tinuation of some of the traits of a particu-lar individual in another individual, not a complete preservation of identity.
6. The theory associated with the monumentalism dimension accounts for the observed cross-cultural variation in a number of important social phenom-ena, especially educational achievement and suicide rates. Minkov (2011) refers to a study by Li (2002), who found that Chinese respondents view humility and a readiness to learn from others as an essential ingredient of educational success. The opposite of humility—pride and self-complacency—seems to have a depressive effect on educational motiva-tion, although, as Minkov (2011) points out, this is certainly not the only factor in the educational equation. On the bright side, pride may act as a suicide deterrent.
7. According to Minkov’s theory, a cultural tendency to spend rather than save can simply be viewed as indulgence: a lack of a self-discipline that is needed to
suppress gratification of desire for con-sumption. But ostentatious spending can also be associated with monumentalism. It can be encouraged in societies where people are expected to come across as financially successful individuals whose generosity is worthy of admiration. This can be achieved by giving large tips on multiple occasions. Minkov (2007, 2011) explains the prevalence of service to oth-ers and conspicuous helping behavior in monumentalist cultures in the same way: It is an act of maintaining face in public and boosting one’s image.
8. Minkov (2009b, 2011) offers a new perspective on the cross-cultural variation in subjective well-being (SWB). Recognizing the well-known fact that the best ecological predictor of SWB is a per-ception of personal life control, Minkov asks why people in some societies tend to perceive greater life control and SWB than those in other societies. He offers a plausi-ble explanation: A culture that focuses on hard work and curbs the natural human desire for leisure, fun-related activities, and spending depresses SWB.
◆ Food for Thought
1. The power of cultural dimensions to predict national economic growth may be exaggerated by the results of the regres-sion analysis reported by Minkov. It is possible that if the country sample were expanded, the R Square value of the model would fall.
2. As the industry dimension is based on mainstream economic theories about the determinants of economic development in poor countries, it may be conceptually convincing as a predictor of growth, yet it is not the best possible predictor; World Values Survey measures of life satisfac-tion yield an even higher correlation. This does not invalidate the industry dimension

Cultural Dimensions Across Modern Nations ◆ 375
because life satisfaction is highly and nega-tively correlated with it (Minkov, 2011) and can be considered a facet of it. Yet it raises an interesting question: What exactly is the cultural root of economic growth? One possible view is that dissatis-faction with life creates a desire to improve one’s material condition in the hope that this would lead to a better life. It may be precisely this dissatisfaction that results in a willingness to work hard, sacrifice lei-sure, and save.
3. The industry dimension predicts economic development across all of the countries in the sample (taken together) and across developing countries (taken as a separate subsample) but not across rich countries (taken as another separate sub-sample). So far, no cultural determinants have been found that can explain differ-ences in speed of economic growth in the rich world.
4. Despite all the correlates of monu-mentalism, some reviewers of Minkov (2008) and of Minkov and Hofstede (2012a) were unconvinced that Heine’s self-enhancement and self-stability theory could be used to explain ecological con-structs.
5. Minkov (2011) admitted that monumentalism could be viewed as a cause of poor educational success but it may also be the result of it. The cause-and-effect relationship between the two is an issue that has not been addressed suf-ficiently.
6. One of the most intriguing ques-tions that Minkov (2011) discussed, admitting the speculative element in his analysis, is the historical origins of his two dimensions. He believes that strong industry is associated with a long history of intensive agriculture because this type of subsistence requires harder physical work than tropical horticulture or the modern service-based economies of the
Western world. Intensive agriculturalists in unstable climates need to save food for the cold months and plan the next sowing season. This teaches thrift, which is not needed to the same extent for the practice of horticulture in tropical climates or in a rich service economy. This is an interesting hypothesis that requires further research.
7. Minkov (2011) believes that although high monumentalism can be viewed as a result of poor education (as well as its cause), it may also have another important antecedent: a long traditional practice of pastoralism. He referred to a number of studies that support this view, yet further research in that field is cer-tainly necessary.
■ Notes
1. Previous work by Minkov (2007) showed that it is possible to extract an ecologi-cal dimension from the World Values Survey that is defined by happiness, importance of leisure, and a perception of life control versus importance of thrift. This dimension is statisti-cally associated with Ronald Inglehart’s self-expression versus survival values (see 9.9.), yet it has a much narrower conceptual focus. Also, it does not create the same geographic pat-terns as Inglehart’s. Minkov (2007) called his dimension “indulgence versus restraint.” He explained it as a contrast between two types of cultures. In indulgent ones, there is a tendency to allow relatively free gratification of some desires and feelings, especially those that have to do with leisure, merrymaking with friends, and spending money. Those societies also have greater happiness and a perception of personal freedom and life control. Restrictive societies have the opposite tendency. They restrain the gratification of the above-mentioned desires and feelings. As a result, people in such societ-ies have lower happiness and a stronger percep-tion that life events cannot be controlled.
2. Other authors provide slightly different definitions of self-enhancement. According to
376 ◆ Major Cross-Cultural Studies
Brown (2003), this is “a tendency to process information in ways that cast the self in a posi-tive light” (p. 604). The exaggeration element is absent in this definition, but the tendency to view one’s self positively is part of it, just like in Heine’s.
3. Heine (2003a) acknowledges that his hypothesis is an extension or variant of Carol Dweck’s theory concerning the link between some types of self-enhancement, self-stability, and poor school performance. Dweck (2007a, 2007b) found that, contrary to common beliefs held by many educators and parents, prais-ing students’ intelligence is not necessarily a motivator. On the contrary, enhancing their self-esteem in that way can have a demotivat-ing effect because some students assume that intellectual ability is a stable trait that cannot be developed. As a consequence, they will seek easy tasks in order to confirm their intelligence rather than struggle with novel and difficult tasks.
4. Concerns about some of the conclu-sions in these studies were raised by Sedikides, Gaertner, and Toguchi (2003); Sedikides, Gaertner, and Vevea (2005); and Kobayashi and Brown (2003), countered by Heine (2003b, 2005) and Heine, Kitayama, and Hamamura (2007).
5. One of the arguments that Heine and Hamamura (2007) use to support their claim that self-enhancement is far more prevalent in North America than in East Asia is that studies of national pride find that Americans are more proud of their country than East Asians are of theirs.
6. It is important to note that the World Values Survey item that measures the impor-tance of work in the respondents’ lives is not associated with the importance of leisure in the
respondents’ lives or the importance of hard work for children (see 7.5.). Minkov (2007) had demonstrated that this item was an indirect measure of an aspect of self-enhancement: the degree to which it is important to have a source of income so as not to feel humiliated by living on welfare or relying on relatives. Therefore, the importance of work item was not included in the analysis.
7. The factor analysis produced scores for 33 countries: Argentina, Australia, Brazil, Bulgaria, Chile, China, Egypt, Finland, Germany, India, Indonesia, Iran, Japan, Jordan, South Korea, Mexico, Moldova, Morocco, New Zealand, Poland, Romania, Russia, South Africa, Serbia, Slovenia, Spain, Sweden, Switzerland, Taiwan, Turkey, Ukraine, United States, and Vietnam. Using linear regression, scores for another seven countries were cal-culated: Colombia, France, Georgia, Italy, Netherlands, the United Kingdom, and Uruguay. The R Square values for the two regression models were .97 for monumentalism and .99 for industry.
8. The thrift item had gravitated slightly toward the monumentalism factor. This was reminiscent of the long-term orientation dimen-sion (Hofstede, 2001). However, when hard work, thrift, and leisure are factor analyzed separately, thrift has a higher loading on the single factor. Its exact value depends on the country sample, but it usually exceeds .70. Thrift and hard work are not significantly cor-related in the 2005–2008 wave of the World Values Survey, but the average scores for the two items from 1994–2004 and 2005–2008 correlate at .45** ( n = 43). The average scores for thrift and leisure correlate at –.45** ( n = 44). The average scores for hard work and leisure correlate at –.62** ( n = 43).

◆ 377
◆ Introduction
National homicide rates fluctuate, usually slightly, because of vari-ous nation-specific factors. The relative stability in the country rankings and the country rates, as well as the fairly clear geographic patterns in the prevalence of mur-der, mean that this phenomenon has a strong cultural component. If some countries consistently have higher homicide rates than others, there is something in their cultures that contributes to the existence of this difference. Here, Minkov’s (2011) work on homicide and its ecological correlates is dis-cussed, including the dimensions of national culture that they form. Part of this work was also pub-lished earlier (Minkov, 2009c).
The most popular explana-tion in the academic literature on
national differences in homicide rates is that they are a function of socioeconomic inequality (Avison & Loring, 1986; Barber, 2007; Braithwaite & Braithwaite, 1980; Fajnzylber, Lederman, & Loayza, 1998, 2002; Krohn, 1976; Lim, Bond, & Bond, 2005; Messner, Raffalovich, & Shrok, 2002; Wilkinson, Kawachi, & Kennedy, 1998; Wilson et al., 2002). In light of this theory, Latin America and parts of sub-Saharan Africa have the highest homicide rates in the world because they have the highest socioeconomic inequal-ity, measured in terms of Gini coefficients (the most commonly used measure) or other similar indicators.
The mechanism through which socioeconomic inequal-ity supposedly generates violence is explained in terms of strain theory (Agnew, 1999; Lim et al.,
MICHAEL MINKOV (2011): A STUDY OF NATIONAL HOMICIDE RATES AND THEIR CORRELATES
9.25

378 ◆ Major Cross-Cultural Studies
2005). Strain theory was first proposed by Merton (1938) and developed by Agnew (1992, 1999), Agnew and White (1992), and other authors. According to this the-ory, individuals whose aspirations and opportunities are not properly balanced experience psychological strain, and that pushes some of them toward criminal behavior. From this theoretical perspec-tive, socioeconomic inequality generates anger, frustration, bitterness, and envy among members of the less privileged social classes. Consequently, some of those individuals will seek to correct the situation and obtain what they consider social justice by resorting to violent crime, including homicide.
This theory has been criticized by vari-ous authors. Neumayer (2003) believed that the positive effect of inequality on homicide rates found in many studies may be spurious, whereas Butchart and Engstrom (2002) argued that redistribut-ing wealth in societies with high economic inequality, without increasing per capita GDP, would reduce homicide rates less than redistributions linked with over-all economic development. Besides, the socioeconomic interpretation of homicide rates does not consider the possibility of a reverse causation. If criminal violence can be a result of socioeconomic inequality, it is equally conceivable that it contributes to it. The cause-and-effect relationship from violence to affluence and status is easy to discern in some societies that have not reached statehood, for instance, those of foragers (Wilson et al., 2002).
Minkov points out that there are seri-ous problems with the strain-from-socio-economic-inequality theory as a universal explanation for group differences in homi-cide. Some of the most crucial evidence against it comes from studies of preliter-ate societies, characterized by extremely egalitarian cultures. Despite their egali-tarianism, some of them have exorbitant murder rates. As Wilson et al. (2002) put it, homicide rates in hunter-gatherers’ societies generally dwarf those of modern nation-states (p. 395). 1
Minkov (2011) presented additional evidence that compromises the strain-from-socioeconomic-inequality theory. National homicide rates correlate posi-tively with other variables that cannot be explained in terms of socioeconomic frus-tration. Using data from the UN Office on Drugs and Crime (2010), including official police records and estimates by public health organizations (which some-times seem more reliable than the police records), Minkov (2011) compiled a national murder index for 173 countries and showed that it is positively correlated with national rape rates from the same source, expanded with data from the UN Office on Drugs and Crime (2004; r = 46**, n = 109), adolescent fertility rates (data from the UN Statistics Division, 2008; r = .55** Pearson, .77** Spearman, n = 168), and HIV rates (data from the World Health Organization, 2010; r = .43** Pearson, .72** Spearman, n = 164). If homicide rates correlate with rape, adolescent fertility, 2 and HIV prevalence, there is a common factor behind these phenomena, and it is hard to see what it has to do with psychological strain from socioeconomic inequality.
Even more intriguingly, the murder index correlates negatively with Lynn and Vanhanen’s (2002) national IQs. 3 The correlation between that variable (exclud-ing Lynn and Vanhanen’s estimates that are not based on real studies) and the national murder index is –.63** Pearson and –.70** Spearman ( n = 68).
Minkov found that homicide, rape, HIV, and adolescent fertility rates are all significantly and positively intercorrelated, except for rape rates with adolescent fer-tility rates. National IQs are significantly and negatively correlated with all these indicators except with rape rates.
The associations between these vari-ables are not intuitively clear. Minkov (2011) adopted a theory proposed by some evolutionary psychologists. From the viewpoint of evolution, violence—and particularly murder—is not necessarily a social pathology. Reprehensible as it may

Cultural Dimensions Across Modern Nations ◆ 379
seem, it is viewed by some authors as a normal by-product of reproductive or mating competition (Barber, 2006, 2007; Buss & Duntley, 2003; Duntley & Buss, 2004). These authors admit that evolu-tion can breed adaptive mechanisms such as altruism. But evolution is also a com-petitive process, and, from an evolution-ary viewpoint, violence can represent a “fitness contest” (Duntley & Buss, 2004, p. 106), despite all the potential costs that the violent party may incur. Greater fitness results in better mating and repro-ductive opportunities. 4 Murder can occur for the purpose of the elimination of a sexual rival. But it can also be motivated by a desire for power and higher social and economic status. In turn, power and status will increase a man’s reproductive opportunities.
Minkov pointed out that reproductive competition theory as an explanation for murder is supported by the studies of various anthropologists. 5 He believed that from the viewpoint of reproductive com-petition theory, socioeconomic inequality could also be viewed as a result of a fit-ness contest (Minkov, 2009c, 2011). More affluent men have better mating oppor-tunities in most societies (Fisher, 1992; White, 1988) and better chances of sur-vival. Women prefer men of high status, dominance, and genetic quality (Schmitt, 2005). Even in strictly egalitarian societ-ies, women have a preference for men who are capable of providing more resources (Marlowe, 2004). In a Darwinian sense, men who have the potential to generate wealth are winners in a survival contest. Stronger competition inevitably results in a greater distance between the win-ners and the losers; hence the greater socioeconomic polarization of societies where such competition is more preva-lent, especially in modernizing societies. According to Minkov, instead of posit-ing a cause-and-effect relationship from socioeconomic inequality to high murder rates, it is more logical to view both as having the same determinant: strong competition for resources, which—from
an evolutionary viewpoint—amounts to reproductive competition. Also, if mat-ing competition explains murder, it also explains rape, adolescent fertility, and the occurrence of HIV. From an evolutionary viewpoint, rape is a forceful attempt to spread one’s genes. Mating competition depresses the age at which it is socially acceptable for women to have sex and bear children. High HIV rates also indi-cate mating competition. Minkov refers to studies of the HIV pandemic in Africa (Caldwell, 2000, 2002) that have attrib-uted this phenomenon to extensive hetero-sexual networking, documented in various parts of sub-Saharan Africa (Orubuloye et al., 1992, 1997).
An essential element of mating competi-tion is risk acceptance because competitive situations lead to risk taking, especially by males (Wilson & Daly, 1997; Wilson et al., 2002). Murder, rape, and adolescent fertility are associated with indifference to risk. People in societies with fiercer competition are more likely to be pushed toward dangerous behaviors despite the odds that they or their relatives might lose their lives. From an evolutionary view-point, it is preferable to spread one’s genes and die young than live to an old age with-out having any offspring. A number of large-scale studies across various African countries show that the knowledge that AIDS is an incurable sexually transmitted disease resulting in slow death does not always act as a deterrent as many males consciously accept the risk associated with contracting AIDS or transmitting it to their partners (Awusabo-Asare, Abane, Badasu, & Anarfi, 1999; Amuyunzu-Nyamongo et al., 1999; Caldwell, 2002; Moore & Oppong, 2006).
According to Minkov, preindustrial societies with strong mating competition can be viewed as having a short-term vision in matters associated with reproduction. In such societies, there is no need for high mathematical intelligence and academic knowledge (which is what IQs measure at the societal level). Even when such societ-ies begin to industrialize and modernize,

380 ◆ Major Cross-Cultural Studies
some sections of the population will con-tinue to carry the old culture in which an ability for long-term planning is less important than abundant and competitive procreation, despite its potential associa-tion with violence or exposure to deadly sexually transmitted diseases.
The theory that associates violence with having a “here-and now orientation,” as opposed to a tendency to defer gratifica-tion, was elaborated at the individual level by Gottfredson and Hirschi (1990, pp. xv, 89). These authors explained that the cognitive requirements for most crimes are minimal and people lacking self-control need not possess or value academic skills such as mathematical intelligence. Minkov believed that this theory could be com-bined with mating competition theory and transferred to the ecological level to account for the high negative association among national mathematical intelligence (IQs), homicide rates, adolescent fertility, and HIV rates. His goal was to examine the factor structure of the ecological cor-relates of murder, analyze the underly-ing dimensions of national culture, and attempt to provide an explanation in the light of existing theories.
◆ Variables Used in the Analysis
Minkov observed that his murder index was significantly correlated not only with variables that suggest mating competition or reflect mathematical intelligence but also with national measures of transpar-ency versus corruption, road death tolls, and percentages of people who live with their parents. There were also other signif-icant correlations—for example, with the national percentages of married adoles-cent women—but these variables tended to duplicate some of those already in the selection. Additionally, each new variable reduced the size of the country sample because it contained missing values.
Minkov decided to disregard the avail-able national rape rates as their reliability could be questioned; there may exist great cultural diversity in rape-reporting pat-terns, far greater than in murder reporting. The variables he selected for his analysis were
National murder index (compiled by Minkov, 2011, on the basis of data for 2003–2008 from the UN Office on Drugs and Crime, 2010)
National adolescent fertility rates (UN Statistics Division, 2008)
National HIV rates, high estimates for all countries (World Health Organization, 2010)
Average national IQs (Lynn & Vanhanen, 2002); dropping all coun-tries for which no study-based scores are available
The national transparency versus cor-ruption perception index for 2006 (Transparency International, 2006)
National road death tolls: numbers of people per 100,000 inhabitants who die annually in road accidents, either as drivers or as pedestrians (latest data from the World Health Organization, 2009a)
Percentages of World Values Survey adult respondents who live with their parents, average scores from the 2005–2008 study (item v240) and latest data for each country from 1994–2004 (item X026)
Hypothesized Dimensions ◆
Minkov expected that the analysis would reveal two factors. One would reflect what he called “hypometropia versus prudence”:

Cultural Dimensions Across Modern Nations ◆ 381
a short-term vision and acceptance of risk and violence in reproductive mat-ters versus a more prudent approach. Hypometropia would be associated with high murder rates, high HIV rates, high adolescent fertility rates, and low math-ematical intelligence. It might also be asso-ciated with high road death tolls, as they indicate risk acceptance.
Minkov (2011) expected to obtain another factor, strongly associated with measures of national wealth and defined by differences in transparency, road death tolls, and percentages of adults who live with parents. This factor would be similar to Minkov’s (2007) previously reported exclusionism versus universalism dimen-sion, which captures some of the most salient distinctions between the cultures of the developing countries versus those of the rich world. Exclusionism was defined as a high importance of in-group cohe-sion and privileged treatment of in-group members, including nepotism, coupled with a discriminatory attitude toward out-group members and involving their exclusion from the circle of those who deserve privileged treatment. Universalism was defined as following some universal principles in the treatment of people and rejecting group-based discrimination and nepotism. 6 Minkov (2011) saw high road death tolls as a measure of negligence for the interests of out-group members on the part of drivers as well as government offi-cials who do not bother to enforce safety regulations. He viewed low transparency and high corruption in the same way: a
lack of universal rules for all members of society. A high percentage of adults who live with their parents might simply be an expression of poverty, yet it could also measure in-group cohesion. 7 In many middle-income countries, young adults often choose to live with their parents not because of financial constraints but because they see no point in leaving home if they do not have families of their own.
◆ Statistical Analysis
A factor analysis produced two factors with eigenvalues over 1.00. The first factor had an eigenvalue of 4.27 and explained 61.05% of the variance. The second factor had an eigenvalue of 1.18 and explained 16.81% of the variance. A varimax rota-tion showed that some items loaded highly on both factors. Minkov believed that a solution with strictly orthogonal factors would amount to an artificial separation of two entities that share some commu-nalities (also visible from the MDS map in Graph 8.10 in this book) and decided to adopt a solution with weakly correlated factors. In his view, another strength of a model with oblique factors would be the fact that their item loadings were higher than those after varimax rotation. The higher loadings create a sharper image of what the factors are about.
Thus, a promax rotation with kappa 2 was performed, resulting in the following structure matrix:
Factor 1 Factor 2 (exclusionism versus universalism) (hypometropia versus prudence)transparency –.90 –.40road death tolls .85 .49 percentage living with parents .85 .17IQ –.79 –.74 adolescent fertility .62 .77 murder .37 .87 HIV .20 .87
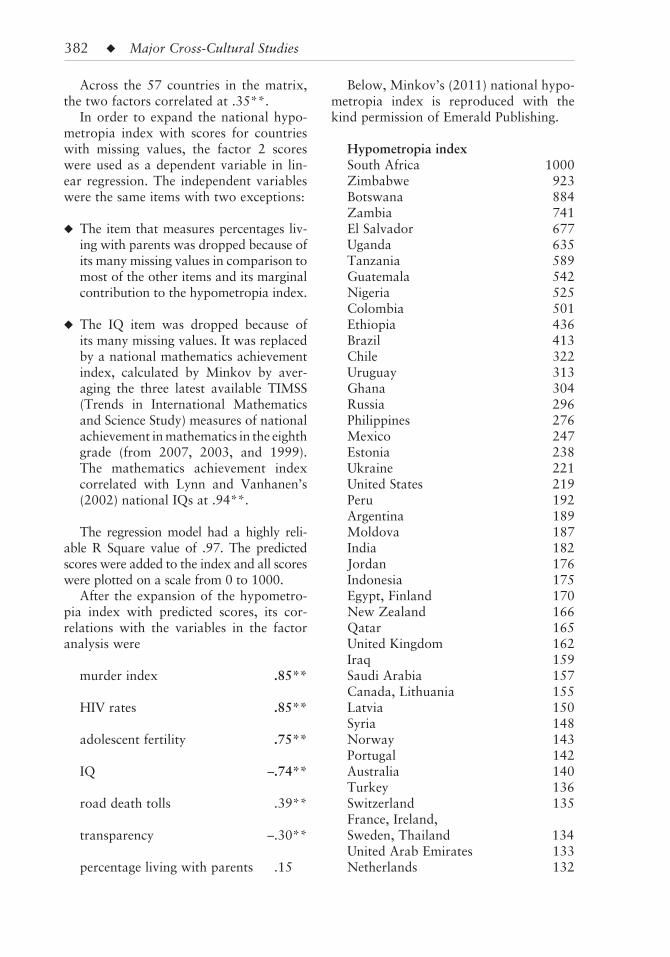
382 ◆ Major Cross-Cultural Studies
Across the 57 countries in the matrix, the two factors correlated at .35**.
In order to expand the national hypo-metropia index with scores for countries with missing values, the factor 2 scores were used as a dependent variable in lin-ear regression. The independent variables were the same items with two exceptions:
◆ The item that measures percentages liv-ing with parents was dropped because of its many missing values in comparison to most of the other items and its marginal contribution to the hypometropia index.
◆ The IQ item was dropped because of its many missing values. It was replaced by a national mathematics achievement index, calculated by Minkov by aver-aging the three latest available TIMSS (Trends in International Mathematics and Science Study) measures of national achievement in mathematics in the eighth grade (from 2007, 2003, and 1999). The mathematics achievement index correlated with Lynn and Vanhanen’s (2002) national IQs at .94**.
The regression model had a highly reli-able R Square value of .97. The predicted scores were added to the index and all scores were plotted on a scale from 0 to 1000.
After the expansion of the hypometro-pia index with predicted scores, its cor-relations with the variables in the factor analysis were
murder index .85**
HIV rates .85**
adolescent fertility .75**
IQ –.74**
road death tolls .39**
transparency –.30**
percentage living with parents .15
Below, Minkov’s (2011) national hypo-metropia index is reproduced with the kind permission of Emerald Publishing.
Hypometropia index South Africa 1000 Zimbabwe 923 Botswana 884 Zambia 741 El Salvador 677 Uganda 635 Tanzania 589 Guatemala 542 Nigeria 525 Colombia 501 Ethiopia 436 Brazil 413 Chile 322 Uruguay 313 Ghana 304 Russia 296 Philippines 276 Mexico 247 Estonia 238 Ukraine 221 United States 219 Peru 192 Argentina 189 Moldova 187 India 182 Jordan 176 Indonesia 175 Egypt, Finland 170 New Zealand 166 Qatar 165 United Kingdom 162 Iraq 159 Saudi Arabia 157 Canada, Lithuania 155 Latvia 150 Syria 148 Norway 143 Portugal 142 Australia 140 Turkey 136 Switzerland 135 France, Ireland, Sweden, Thailand 134 United Arab Emirates 133 Netherlands 132

Cultural Dimensions Across Modern Nations ◆ 383
Romania 128 Bahrain 127 Kuwait 125 Bulgaria 120 Israel, Lebanon 118 Malaysia 115 Belgium 113 Germany 112 Tunisia 111 Slovakia, Spain 110 Czech Republic 109 Hungary 108 Austria 107 Croatia 100 Malta 97 Serbia 95 Armenia, Iran 93 Bosnia, Cyprus 90 Slovenia 86 Morocco 80 Poland 73 Italy 67 Greece 60 China 49 South Korea 35 Japan 18 Singapore 0
Minkov also calculated an exclusionism versus universalism index. Factor scores were available for only 57 countries, and it did not seem reasonable to predict scores by means of linear regression as the model was not highly reliable. Therefore, Minkov selected the three variables—transparency, road death tolls, percentage living with parents—that satisfied three conditions at the same time:
◆ Had loadings exceeding ±.80 on factor 1 (exclusionism)
◆ Captured the conceptual essence of the exclusionism dimension
◆ Did not load highly on factor 2 (hypo-metropia)
Factor analyzed together, the three items yielded a single factor, with an
eigenvalue of 2.20, explaining 73.33% of the variance. The three items had the fol-lowing loadings:
transparency –.91
percentage living with parents .84
road death tolls .82
The factor scores were plotted on a scale from 0 to 1000. They correlate with the exclusionism factor scores obtained from the factor analysis of the seven-item matrix at .98** ( n = 57). Below, Minkov’s national exclusionism index is reproduced with the kind permission of Emerald Publishing.
Exclusionism index Ethiopia 1000 Iran 977 Iraq 949 Nigeria 873 Morocco 872 Mali 871 Egypt 858 Pakistan 851 Saudi Arabia 849 Tanzania 836 Kyrgyzstan 815 Ghana 811 India 803 Burkina Faso 796 Zambia 791 Dominican Republic 782 Venezuela 773 Malaysia 758 South Africa 756 Rwanda 736 Uganda 733 Peru 732 Jordan 727 Thailand 725 Bangladesh 724 Zimbabwe 723 Azerbaijan 718 Guatemala 710 Georgia 700 Armenia 705

384 ◆ Major Cross-Cultural Studies
Albania 701 Mexico 681 Philippines 664 Indonesia 656 Vietnam 640 Ukraine 635 Russia 631 Trinidad and Tobago 619 Brazil, China 615 Greece 611 Turkey 585 Serbia 580 Colombia 579 Belarus 574 Bosnia 557 Argentina 555 Croatia 554 Romania 548 El Salvador 542 Poland 539 Moldova 529 Lithuania 522 Bulgaria 507 Slovakia 484 South Korea 476 Latvia 469 Slovenia 433 Italy 425 Cyprus 400 Singapore 397 Hungary 395 Czech Republic 383 Chile 382 Japan 333 Estonia 316 Spain 311 Malta 279 Portugal 274 Ireland 262 Uruguay 261 Belgium 249 United States 237 France 170 Austria 160 Germany 120 Australia 119 Iceland 114 Canada 107 United Kingdom 57 New Zealand 46
Norway 34 Netherlands 28 Switzerland 27 Sweden 7 Finland 0
◆ Validation of the Hypometropia Dimension
The highest correlation that Minkov found between his hypometropia index and an external variable was with life expectancy at birth (UN Statistics Division, 2007, data for 2005–2010): r = –.79** for men and –.78** for women ( n = 80). He concluded that a short life expectancy is probably a major determinant of hypome-tropia: Societies where people know that they are very likely to die young do not encourage a long-term vision and do not see prudence as a top priority.
Minkov compiled a national rape index using data mostly from the UN Office on Drugs and Crime (2010), supplementing them with data from an earlier publication (UN Office on Drugs and Crime, 2004). That index correlated with the hypome-tropia index at .57** ( n = 67). Despite the potential unreliability of the reported rape rates, it is highly unlikely that this high correlation is spurious. Rather, it validates the hypometropia index as a measure of risk-taking mating competition and sex-related violence. Further, Minkov found that across 261 U.S. cities whose popula-tion exceeds 100,000, reported murder rates and rape rates (Federal Bureau of Investigation, 2010) correlate at .81**. The fact that murder and rape are cor-related not only across countries but also across U.S. cities suggests that the cor-relation cannot be spuriously created by reporting patterns: There is a real factor behind it.
Minkov (2011) also provided cor-relations between hypometropia and sociosexuality (Schmitt, 2005; see 9.20.),

Cultural Dimensions Across Modern Nations ◆ 385
separating the rich countries from the developing ones:
Rich countries men: .53**; women: .54** ( n = 21)
Developing countries men: –.55*; women: –.43 ( n = 23)
Besides, Minkov found a significant neg-ative correlation between men’s reported sociosexuality and HIV rates across poor countries: r = –.43*. He concluded that the observed differences in these correla-tions across rich and developing countries probably stem from differences in self-reports that do not reflect behaviors in the same way. In the rich world, self-reports in this case seem to match behaviors, whereas in some developing countries what the respondents report is the oppo-site of what the reality is. The reason for this may be that sex is a taboo topic in the strongly religious developing countries and Christianity and Islam vehemently denounce sociosexuality.
Hypometropia correlates significantly with the age difference that men prefer to have between themselves and their spouses (data from Buss, 1989): r = –.59** ( n = 32). This correlation suggests that men in hypo-metropic cultures prefer to have wives who are considerably younger than them.
The hypometropia index was found to correlate with the Gini index for 2007 (UN Development Program, 2007/2008) at .66** ( n = 67).
After this analysis, Minkov (2011) pro-vided a definition of hypometropia ver-sus prudence as a dimension of national culture:
Hypometropia is the tendency to fol-low a short-term vision in reproduc-tion and associated matters. It involves mating competition, risk acceptance, and violence as a means of spreading one’s genes and ensuring the survival of the group at the expense of individual longevity.
Prudence is the opposite of hypometro-pia. It involves careful management of reproductive instincts: prudent behav-iors in the name of individual longevity without an emphasis on mating compe-tition. (p. 165)
◆ Validation of the Exclusionism Dimension
Minkov (2011) found a strong correlation between his exclusionism index and raw GDP per capita in 1999: r = –.84** ( n = 86). National wealth measures from later years yielded practically the same correla-tion. This confirmed that exclusionism versus universalism is a dimension that distinguishes the cultures of the rich coun-tries from those of the developing ones, whereas middle-income countries are cul-turally in between these two extremes.
Minkov reported correlations between his exclusionism index and various World Values Survey items (latest data from 1994–2004, n = 74 in all cases):
A025: strong agreement that children must always love their parents .79**
F121: divorce seen as justifiable, mean values –.74**
D018: agreement that a child needs to grow up with two parents .70**
These correlations validated exclusion-ism as a measure of the importance of in-group cohesiveness. Another correla-tion, with World Values Survey item A125 (respondent does not want to have people of another race as neighbors, latest data from the 1994–2004 period) validates it as a measure of acceptance of discrimination: r = .51** ( n = 73).
Minkov also provided correlations between exclusionism and other dimen-sions of national culture that are strongly

386 ◆ Major Cross-Cultural Studies
associated with national wealth and are conceptually similar to exclusionism ver-sus universalism:
integration (Chinese Culture Con-nection, 1987) –.79** ( n = 20)
individualism (Hofstede, 2001) –.75** ( n = 52)
moral inclusiveness (Schwartz, 2007) –.56** Spearman ( n = 55)
Another interesting finding was the very strong correlation with Project GLOBE’s uncertainty avoidance “as it should be” (Sully de Luque & Javidan, 2004): r = 88** ( n = 47). As GLOBE’s dimension measures middle managers’ preference for some aspects of Western order, this cor-relation suggests that middle managers in exclusionist societies have a stronger desire to see more Western order in their environments. Similarly, exclusionism cor-relates highly with GLOBE’s future ori-entation “as it should be” (Ashkanasy et al., 2004): r = .70** ( n = 47). Middle managers in exclusionist societies are more likely than those in universalist societ-ies to wish for better planning. Minkov (2011) interpreted these correlations as a confirmation of his view that exclusion-ism stands for a relative lack of empathy and interest in what happens to out-group members; hence a widespread perception among educated members of exclusion-ist cultures that the situation in business, political life, and society at large is the same as on the road: a chaos in which many act as they please without taking into account the interests of out-group members. This is viewed as an undesirable situation, accounting for the low life sat-isfaction of people in developing nations, yet it is not easily remediable. In Minkov’s view, when people in exclusionist cultures state that they wish to see more Western order in their countries, what they mean is that they want others to follow such order while they should be personally exempted
from that obligation. This double standard makes Western order, real democracy, transparency, and the rule of law impos-sible in a poor country.
After his analysis, Minkov (2011) pro-vided a definition of exclusionism versus universalism as a dimension of national culture:
Exclusionism is the cultural tendency to treat people on the basis of their group affiliation and reserve favors, privi-leges, and sacrifices for friends, rela-tives or other groups that one identifies with, while excluding outsiders from the circle of those who deserve such privileged treatment. While members of exclusionist cultures often strive to achieve harmony and good relation-ships within their own group, they may be quite indifferent, inconsider-ate, rude, and sometimes even hostile, toward members of other groups.
Universalism is the opposite cultural tendency: treating people primarily on the basis of who they are as individuals and disregarding their group affiliation. (adapted from p. 221)
It is also interesting that Minkov pointed out that despite the general norm in exclusionist societies for people to be considerate toward in-group members, they sometimes fail miserably at this task. He provided evidence from international nongovernmental organizations reporting frequent and severe wife abuse in vari-ous developing countries that can range from battering to permanent mutilation or death.
◆ Contributions
1. Minkov’s work provides a sta-tistical replication of collectivism versus individualism as a dimension of national culture that distinguishes the cultures of the

Cultural Dimensions Across Modern Nations ◆ 387
poorest nations from those of the richest. This time, the replication is not based on a paper-and-pencil study but on national statistics reflecting real behaviors. This operationalization of collectivism versus individualism, called “exclusionism versus universalism,” does not depict the richest societies as consisting of people who are more likely to prefer individual action, more self-reliant, more selfish, more inde-pendent, or more competitive, because the available national measures of these con-cepts are not highly correlated with mea-sures of national wealth. Rather, the main and most important cultural difference between very poor and very rich nations that emerges from the exclusionism versus universalism dimension reflects differences in the way that people tend to treat other people: as group members or as individuals. Minkov argued that this is how Hofstede’s (2001) collectivism versus individualism measure should be interpreted as well.
2. Minkov proposed an entirely new dimension of culture: hypometropia versus prudence. It explains national and ethnic differences in crucially important social phenomena related to mating competition, risk acceptance, intracommunal violence, and mathematical intelligence.
3. Minkov (2009c, 2011) showed that ecological differences in homicide rates need not be viewed simply as a function of socioeconomic inequality because this theory cannot account for the extremely frequent occurrence of mur-der in many egalitarian societies. Also, it cannot explain why homicide rates are highly correlated with measures of sexual behaviors. Minkov (2011) demonstrated that across developed nations there is no significant correlation between homicide rates and Gini, yet homicide rates are still highly and positively correlated with mea-sures of mating competition such as ado-lescent fertility: r = 70** ( n = 36). They are also significantly and positively correlated with rape rates: r = .39* ( n = 33).
4. After explaining differences in national educational achievement as a function of monumentalism differences (see 9.24.), Minkov suggested a factor that may also account for the observed national and ethnic differences in mathematical intelligence. He believed that a focus on short-term mating competition renders mathematical skills largely unnecessary as these are not an asset in a culture that pri-oritizes early and abundant reproduction over long-term individual survival.
◆ Food for Thought
1 . The hypometropia index was derived from a factor analysis that pro-duced two factors. The high-scoring countries have high scores on all of the variables that define the hypometropia factor, whereas the low-scoring coun-tries have low scores. Yet, the scores of the countries in the middle of the hypometropia ranking cannot be used to predict well how those countries score on murder, HIV, adolescent fertility and IQ. To do that, it would be necessary to examine their scores on the other fac-tor (exclusionism) as well. This is one of the issues associated with dimensions extracted through multidimensional scal-ing or factor analysis described in 8.2.8.
2. The association between math-ematical intelligence and the ecological variables that indicate mating competition needs a much more profound study than Minkov’s cursory analysis.
3. Minkov discussed some putative associations between group-level differ-ences in hypometropia and biological group-level differences but left the issue without a final answer. He believed that despite the strong opposition in some quar-ters of the Western world to studies that relate culture to biology, more research may be needed in that controversial

388 ◆ Major Cross-Cultural Studies
domain as the controversies will not solve themselves if such research is suppressed.
4. Consistent with Project GLOBE’s approach to the measurement of individu-alism versus collectivism, Minkov relied on estimated percentages (based on self-reports) of adults who live with their par-ents as an indicator of exclusionism. This approach is controversial. It is not clear to what extent this indicator reflects cul-tural values, norms, and beliefs or simply wealth versus poverty differences.
5. Minkov used Transparency International’s transparency versus corrup-tion index, yet—as he admits—corruption is popularly viewed as a political phenom-enon rather than a cultural one. Some authors (Hooker, 2009) consider it a sys-temic flaw, not a component of culture. Yet, Minkov believed that this perspective reflects a Western cultural bias. While it is true that corruption is also denounced by non-Western publics, Minkov argued that this denouncement is merely a norm for others; if it reflected widespread personal values, there would be little corruption in the poor world. 8 Further, corruption should not be viewed as always being socially dis-ruptive. If that were the case, China, India, and many other developing countries would have disintegrating societies rather than being the world’s economic powerhouses.
■ Notes
1. Lee (1979) carried out a meticulous lon-gitudinal study of intentional homicide among 1,500 !Kung tribesmen at a time when they had had very few contacts with outsiders and no social hierarchy or inequality at all. Lee reported an annual rate of 29.3 homicides per 100,000 people (p. 398), which is similar to the high rates of the northern Latin American countries these days (data from the UN Office on Drugs and Crime, 2010). Faurie and Raymond (2005) reported exorbitant murder rates—hundreds per
100,000 people—for several preliterate societ-ies, such as the Yanomamo of the Amazon basin and some tribes in Papua New Guinea, which are also characterized by very insignificant social hierarchy and inequality.
2. An association between adolescent fertil-ity and homicide rates across rich countries, and across U.S. states, was discussed by Picket, Mookherjee, and Wilkinson (2005).
3. Excluding countries for which no studies are available (and their IQs are consequently based on estimates), Lynn and Vanhanen’s national IQ index is extremely strongly corre-lated with measures of average national school achievement in mathematics and science pro-vided by the TIMSS project (see Mullis et al., 2005, 2007; Mullis et al., 2000). These cor-relations exceed .90 (Lynn & Vanhanen, 2002; Minkov, 2011). This validates national IQs as a reliable measure of national differences in edu-cational achievement, especially in mathematics and science (but also in reading and other sub-jects; see Minkov, 2011). Notwithstanding the controversy as to what exactly IQ tests measure at the individual level, it is clear that average national IQs reflect what Minkov (2011) calls “mathematical intelligence.”
4. Thus, evolution seems to have followed two opposite paths simultaneously: “coopera-tive and benefit-bestowing adaptations” and “adaptations in humans whose proper func-tion is to inflict costs on competitors” (Buss & Duntley, 2003, p. 119).
5. Haviland (1990) and Oswalt (1986) dis-cussed a link between polygyny and aggression: Polygynous men compete for women and tend to fight. Marlowe (2003) presented evidence that internal warfare (violence within a society) and assault frequency are positively correlated with polygyny rates. Barber (2006) also found evidence that the high violent crime rates in the Americas today can be attributed to mating competition. He pointed out that, compared to other world regions, the Americas have not only higher murder rates but also higher rape rates.
Schmitt et al. (2004b) carried out a 53-nation study of “mate-poaching”: romantically attract-ing someone who is already in a relationship. They presented their results after aggregating them to the regional level, not as national

Cultural Dimensions Across Modern Nations ◆ 389
scores. Still, the aggregated results are inter-esting. In all regions, men were more likely than women to report poaching attempts. The highest percentages of men who reported such attempts were in Latin America. The lowest percentages were in East and Southeast Asia and in the Middle East. This suggests a posi-tive region-level association between male matepoaching and Minkov’s murder index.
6. This dimension was statistically close to Hofstede’s (2001) individualism versus collec-tivism. Hence, Minkov interpreted ecological individualism primarily as treatment of people on the basis of who they are as individuals. The opposite pole of the same ecological dimension—collectivism—was seen first of all
as treatment of people on the basis of their group affiliation.
7. Project GLOBE made the same assump-tion and used estimates of the same indicator—albeit based on stereotypes, not self-reports—to measure in-group collectivism (Gelfand et al., 2004).
8. Also, Minkov presented evidence that, contrary to a widespread myth, there is no evidence that corruption suppresses macro-economic growth. The relationship between these two variables is actually weakly positive. Some very corrupt economies (such as China, India, Indonesia, Vietnam, and Russia) are growing much faster than the most transparent economies.

◆ Introduction
The Confucian work dynamism dimension of national culture (Chinese Culture Connection, 1987; see also 9.2.) was renamed long-term orientation (LTO) by Hofstede (2001). He adopted it as a fifth dimension in his model and validated it by showing that it is a significant predictor of average national achievement in educa-tion and economic development. Despite the evidence that LTO is a valid and meaningful dimension of national culture, two widely read publications expressed criticisms of it: Fang (2003) and Ashkanasy et al. (2004). As Fang (2003) indi-cated, many other authors found
the dimension confusing and pre-ferred not to discuss it.
Michael Minkov and Geert Hofstede felt that LTO needed an expanded interpretation and an index with scores for many more countries than those in the Chinese Culture Connection’s (1987) pub-lication. Hofstede, Hofstede, and Minkov (2010) expressed a belief that, in addition to the interpreta-tion of the LTO dimension as time orientation, it could be viewed as an ecological reflection of Steven Heine’s individual-level theory of self-enhancement and self-stability, used by Minkov (2011) as a theo-retical underpinning of his monu-mentalism dimension. With this interpretation, monumentalism and LTO become facets of a single
MICHAEL MINKOV AND GEERT HOFSTEDE (2012a): AN ANALYSIS OF THE WORLD VALUES SURVEY REPLICATING TWO DIMENSIONS OF THE CHINESE VALUES SURVEY
9.26
390 ◆

Cultural Dimensions Across Modern Nations ◆ 391
cultural syndrome reflecting national dif-ferences in the importance of maintaining a stable, consistent, and invariant self that is proud and seeks public admira-tion. Using Minkov’s new method for the calculation of LTO scores on the basis of World Values Survey items, a new LTO index with scores for 93 countries was provided (Hofstede, Hofstede, & Minkov, 2010).
Nevertheless, Michael Minkov and Geert Hofstede felt that the use of the World Values Survey for the replication of the original LTO also needed to pass the peer review of a reputed academic jour-nal. A new method, more complex than the one described in Hofstede, Hofstede, and Minkov (2010) is presented below. This presentation is based on Minkov and Hofstede (2012a).
◆ Samples
The nationally representative World Values Survey samples were used.
◆ Hypothesized Dimensions
The selection of World Values Survey items was expected to result in a sin-gle dimension of national culture that would replicate LTO. The LTO replica-tion should be highly correlated with the original LTO, that is, the Confucian work dynamism dimension (Chinese Culture Connection, 1987). The selected crite-rion was at least 50% of shared variance ( r > +.70).
Additionally, the LTO replication was expected to predict national differences in subsequent economic growth as pro-posed by Hofstede and Bond (1988) and Hofstede (1991, 2001). In accordance with Hofstede (2001), the LTO replica-tion should predict national differences
in school success in mathematics. Because the original LTO is positively associated with the national dialecticism index in Schimmack et al. (2002), the new LTO measure was expected to be associated with it in a similar way.
◆ Questionnaire Items
The World Values Survey database was scoured for items that are conceptually similar to the LTO items in the Chinese Values Survey. Unfortunately, the latest studies (2005–2008) had far fewer coun-tries than the previous most recent surveys (1995–2004). Therefore, the most recent studies were excluded from the data col-lection. 1
Using the latest available data for each country in the World Values Survey in the 1994–2004 period (World Values Survey, 2006), but mostly from 1998–1999, vari-ous items were selected as potential mea-sures of LTO:
For the concept of thrift:
A038: percentages of respondents who selected thrift as a desirable trait for children from a list of items
For the concept of perseverance:
A039: percentages of respondents who selected determination/perseverance as a desirable trait for children from a list of items
For the concepts of personal stability, con-sistency, and avoidance of duality:
A040: percentages of respondents who selected religious faith as a desirable trait for children from a list of items
D055: percentages of respondents who strongly agree that they make efforts to live up to their friends’ expectations

392 ◆ Major Cross-Cultural Studies
A025: percentages of respondents who agree that children must always love their parents, regardless of any parental deficiencies
A026: percentages of respondents who agree that parents must always do their best for their children rather than have a parallel life of their own
F121: average agreement with the state-ment that divorce is never justified
For the concept of concern for face (inter-preted as similar to a sense of dignity and pride):
G006: percentages of respondents who are very proud to be citizens of their countries
D054: percentages of respondents who strongly agree that making their parents proud is a major goal in their lives
For the concept of reciprocation of favors:
A007: percentages of respondents who indicate that “service to others” is a very important value to them
None of the available World Values Survey items in 1994–2004 directly addresses the concept of tradition, but many of those listed above do so indi-rectly. Religion, parental pride, and national pride can be seen as traditional values (Inglehart & Baker, 2000). 2
◆ Statistical Analysis
Unlike the Chinese Culture Connection (1987), Minkov and Hofstede did not cor-rect for response style. Several key items in the World Values Survey (importance of thrift, perseverance, and faith) are not scored on a Likert scale but involve a free choice from a list of items (item
chosen or not chosen); therefore, tradi-tional z-score standardization by case is unnecessary and inapplicable. Some of the other World Values Survey items are forced-choice items (the respondents must choose between two options or “neither”), whereas those that do use Likert scales do not have the same number of points: scales vary between 4 and 10 points. This makes z-score standardization by case impossible.
Like the Chinese Culture Connection (1987), Minkov and Hofstede performed an ecological factor analysis of the selected items. This means that the scores for each variable were national scores and the factor structure reflected correlations between items at the national level.
The factor analysis (principal compo-nents) yielded two factors with eigen-values over 1.00. The first factor had an eigenvalue of 5.07, explaining 50.7% of the variance. The second factor had an eigenvalue of 1.71, explaining 17.1% of the variance. After varimax rotation, the loadings of the items on the two factors were
Factor 1 service to others .84 thrift –.82 perseverance –.77 national pride .68 religious faith .65 parental pride .63 parents should do their best .62 live up to friends’ expectations .57 always love parents .10 divorce justifiable –.04
Factor 2 divorce justifiable –.89 always love parents .83 parental pride .67 religious faith .57 national pride .42 live up to friends’ expectations .41 thrift .31 service to others .22 perseverance .07

Cultural Dimensions Across Modern Nations ◆ 393
The items with the three highest load-ings on factor 1 (service to others, thrift, and perseverance) yielded a Cronbach alpha of .76. After adding the next four items (national pride, religious faith, par-ents do their best, and parental pride), the alpha increased to .88.
The first factor was strongly reminis-cent of the original LTO, yet with reversed poles. It is defined by a high importance of service (favors) to others, a low importance of thrift and perseverance, high pride, and high self-stability expressed as religious faith and avoidance of duality (parents must only be parents and cannot have a parallel life; one must live up to friends’ expectations). The high importance of faith can also be interpreted as a high importance of tradition, whereas the high importance of parental pride and strong national pride suggests a concern for face.
The items that define the second fac-tor do not measure personal stability but reflect a focus on a cohesive family, which suggests collectivism as described by Hofstede (2001) as well as traditionalism or conservatism. The relatively high load-ing of religious faith on this factor implies that strong religion may function as the glue that ensures family cohesiveness. No name for this factor was provided in the journal article. Yet, Minkov and Hofstede believed it could be called “familialism.”
Below, factor scores are provided for both factors. Those for the second fac-tor (familialism) have not been published before. The scores for the first factor (long-term orientation) were multiplied by –1 to align them with those of the original LTO measure. Then, both sets of factor scores were multiplied by 100.
Factor 1 (long-term orientation) South Korea 210 Japan 205 China 174 Singapore, Vietnam 105 Kyrgyzstan 104 Albania 92 Montenegro 76
Bosnia 74 Indonesia 72 India 69 Bangladesh 66 Republic of Macedonia 65 Moldova 60 Tanzania 37 Pakistan 18 Serbia 15 South Africa –4 Chile –12 Spain –13 Canada –16 Philippines –29 Mexico –38 United States –42 Sweden –49 Saudi Arabia –51 Peru –52 Iran, Zimbabwe –54 Venezuela –59 Uganda –69 Argentina –95 Algeria –125 Morocco –134 Puerto Rico –142 Nigeria –145 Jordan –161 Egypt –203 Factor 2 (familialism) Pakistan 164 Bangladesh 138 Vietnam 103 Morocco 102 Indonesia 96 Philippines 87 Tanzania 84 India 80 Jordan, Zimbabwe 69 Kyrgyzstan 65 Nigeria 63 Saudi Arabia, Venezuela 47 Iran 43 South Africa 36 Puerto Rico 23 South Korea 21 Mexico, Singapore 14 Albania 10 Republic of Macedonia 0

394 ◆ Major Cross-Cultural Studies
Uganda –7 Egypt –10 Algeria –15 Moldova –17 China –20 Peru –21 Bosnia, Chile –42 Montenegro –71 Serbia –92 Spain –112 Argentina –125 United States –134 Canada –145 Japan –153 Sweden –370
◆ Validation of the New Long-Term Orientation Index
Minkov and Hofstede (2012a) reported high correlations between the new LTO measure and relevant dimensions of national culture:
Confucian work dynamism/long-term orientation (Chinese Culture Connection, 1987; Hofstede, 2001) .81** ( n = 13)
self-reliance (Green et al., 2005) .81** ( n = 9)
personal dialecticism (Schimmack et al., 2002) .73** ( n = 16)
secular values (Inglehart & Welzel, 2005a) .69** ( n = 32)
Correlations with Minkov’s measures of monumentalism were not reported, as some of the items that were used to mea-sure the new LTO and monumentalism were the same; it was therefore obvious that the two dimensions would overlap to a very large extent.
Additionally, a number of significant correlations were found between the new
LTO index and World Values Survey items from the 2005–2008 studies that were not included in the factor analysis:
item 84: percentage of respondents who are very much like a person who likes to help –.76** ( n = 20)
item v65: percentage of respondents who strongly agree that they prefer to be themselves rather than follow others –.73** ( n = 20)
item v87: percentage of respondents who are very much like a person to whom tradition is very important .69** ( n = 20)
The new LTO was validated as a predic-tor of achievement in mathematics and IQ tests through three significant correlations:
average national achievement in math, 8th grade, in 2007 (Mullis et al., 2007) .76** ( n = 13)
average national achievement in math, 8th grade, in 2003 (Mullis et al., 2005) .58** ( n = 18)
average national IQ (Lynn & Vanhanen, 2002, Table 6.5) .55** ( n = 36)
Finally, the new LTO was validated as a predictor of economic growth, using data from the World Bank Group:
GNI/capita at PPP growth from 1998 to 2008 .46** ( n = 35)
same, after controlling for GDP/capita in 1998 .58** ( n = 35)
◆ Validation of Familialism
Close associations were found among familialism as a dimension of national cul-ture and previously reported dimensions.

Cultural Dimensions Across Modern Nations ◆ 395
They are all highly correlated with national wealth and therefore resemble Hofstede’s individualism versus collectivism:
exclusionism (Minkov, 2011) .81** ( n = 34)
integration (Chinese Culture Connection, 1987) –.73** ( n = 12)
individualism (Hofstede, 2001) –.67** ( n = 24)
self-expression values (Inglehart & Welzel, 2005a) –.66** ( n = 32)
secular values (Inglehart & Welzel, 2005a) –.64** ( n = 32)
◆ Contributions
1. Minkov and Hofstede (2012a) showed that the LTO dimension can be extracted from databases that employed two very different types of question-naires (Chinese and West European/North American) and two types of respondents (matched samples of students in the Chinese Values Survey and nationally representa-tive samples in the World Values Survey). Considering these very different circum-stances, the correlation between the old and new LTO measures is strikingly high. It shows that LTO is neither a Chinese nor a Western research artifact but can serve as a universal dimension of national culture, underpinned by concepts that are meaning-ful across the whole world.
2. The new LTO measure, like the old one, is a valid predictor of national educa-tional achievement in mathematics and of economic growth. This confirms Hofstede and Bond’s (1988) thesis that economic development is partly dependent on cultural values by providing evidence from a far larger sample than the one that the Chinese Culture Connection (1987) worked with.
3. The familialism dimension rep-resents another replication, albeit with a different flavor, of the extremely popular dimension of national culture known as “individualism versus collectivism.” In view of the debates about the nature of this dimension, it is important that this replication reveals one of the dimen-sion’s most important facets: in-group cohesiveness.
◆ Food for Thought
1. Some reviewers of Minkov and Hofstede (2012a) were not convinced that the service-to-others item in the World Values Survey was a good equiva-lent of the reciprocation-of-favors items in the Chinese Values Survey item. Also, they expressed doubts about the inter-pretation of the long-term orientation dimension in the light of Steve Heine’s theory of self-enhancement and self- stability. Whether religiousness is a good proxy of self-stability was also a disputed point. This is a question that needs seri-ous attention. There is no doubt that at the ecological level importance of thrift correlates negatively with importance of service to others and various measures of pride. If Heine’s theory does not explain these associations convincingly (see 9.24.), what else does?
2. Some reviewers of Minkov and Hofstede (2012a) were not convinced that if a dimension is mostly defined by a low importance of service to others and a high importance of perseverance and thrift, it should be called long-term orientation. The time orientation facet of this dimen-sion has been debated for a long time and the controversy is likely to continue.
3. Minkov and Hofstede (2012a) noted the high correlation between LTO and self-reliance (Green et al., 2005) and indicated that LTO reflects self-reliance

396 ◆ Major Cross-Cultural Studies
through the low importance of service to others and the low agreement that par-ents should always do their best for their children rather than have a life of their own. This facet of LTO may be one of the important determinants of economic dynamism. The association between self-reliance and economic or educational suc-cess merits further study.
■ Notes
1. This choice has a practical advantage. If the new LTO measure, based mostly on data
from 1998–1999, predicted subsequent eco-nomic growth, it would be less likely affected by the result of such growth and more likely to be its determinant.
2. Some reviewers were not convinced of the face validity of some of these items, expressing a concern that they might not mea-sure exactly the same concepts as those in the Chinese Values Survey. Minkov and Hofstede defended the view that the meaning of an item can be derived from its intercorrelations with other items (Schwartz & Sagiv, 1995) and that what an item measures is often revealed by its nomological network or the adjacent items in multidimensional scaling, not necessarily by its wording.

◆ 397
◆ Introduction
After having published his study on national cultures, Culture’s Consequences in 1980, Hofstede wanted to complement it with a study on organizational (or corporate) cultures, a subject that was just becoming popu-lar in the management literature (Deal & Kennedy, 1982; Peters & Waterman, 1982). If national
cultures describe the collective mental programming of otherwise similar persons from different nations, organizational cultures should describe the collective mental programming of other-wise similar persons from dif-ferent organizations. “Otherwise similar” in this case also means being from within the same nation(s). Paradoxically, in spite of its huge database Hofstede’s cross-national IBM study did not
GEERT HOFSTEDE, BRAM NEUIJEN, DENISE DAVAL OHAYV, AND GEERT SANDERS (1990): A STUDY OF ORGANIZATIONAL CULTURES ACROSS 20 DANISH AND DUTCH ORGANIZATION UNITS
9.27
◆ Geert Hofstede

398 ◆ Major Cross-Cultural Studies
supply any explicit information on IBM’s corporate culture, as there had been no comparisons with other corporations.
Serious research on organizational cul-tures until that time had been almost nonexistent. The pioneering study was organized by Hofstede’s new research institute IRIC (Institute for Research on Intercultural Cooperation). Acquiring access to a sufficient number of suit-able organizations that, moreover, were prepared to share the costs, took several years. The project finally took place in 1985 and 1986 across 20 units from five organizations in Denmark and five in the Netherlands. On the IBM dimensions (see 9.1.), these two countries belonged to the same cluster of low PDI, UAI, and MAS and high IDV. The research results were reported to the scientific community in an article in Administrative Science Quarterly (Hofstede, Neuijen, Ohayv, & Sanders, 1990). A PhD dissertation by Neuijen (1992) described the impact of the research project and its results on the participating organizations.
The 20 units were from three types of organizations:
1. Private companies manufacturing electronics, chemicals, or consumer goods (six total divisions or produc-tion units, three head offices or mar-keting units, and two research and development units)
2. Five units from private service com-panies (banking, transport, trade)
3. Four units from public institutions (telecommunications, police)
Unit sizes varied from 60 to 2,500 persons. The number of units, at 20, was small enough to allow an in-depth qualitative case study of each unit; at the same time, it was large enough to permit a statistical analysis of comparative quan-titative data.
Data were collected in three phases. The first phase consisted of in-depth open
interviews of two to three hours duration each with nine informants per unit—a total of 180 interviews. These interviews gave a qualitative feel for the gestalt of the unit’s culture and collected issues to be included in the questionnaire for the subsequent survey. Informants were selected nonrandomly in a discussion with the contact person(s) in the unit. They included, in all cases, the unit’s top man-ager and his (never her) secretary, and a selection of men and women in differ-ent jobs from all levels, an old-timer, a newcomer, sometimes a gatekeeper or doorman, and—if available—an employee representative. The interview team con-sisted of 18 members (Danish or Dutch), most of them with recent social science training but deliberately naïve about the type of activity going on in the unit studied. Each unit was covered by two interviewers, one woman and one man, as the researchers believed they might make different observations. All interviewers received the same project training, and all used the same broad checklist of open-ended questions (Hofstede, 2001, p. 395). The list was based on a survey of the organizational culture literature, comple-mented with the researchers’ own ideas. Interviewers were free to probe for more and other information if they considered it relevant. Manifestations of culture were divided into values and practices: the lat-ter classified as symbols, heroes, or rituals. Interviews were taped and reports were written in a prescribed sequence, using respondents’ actual words.
The second phase consisted of a paper-and-pencil survey administered to every-body in the smaller units, and to random samples in the larger ones. The results of the interviews and of the surveys were discussed with the management of the units and fed back to larger groups of unit personnel where the management allowed the researchers to do so.
The third phase collected “structural” data at the level of the unit as a whole on such factors as its total employee strength,
Cultural Dimensions Across Modern Nations ◆ 399
budget composition, key historical facts, and the demographics of its key managers. This phase was carried out by Hofstede personally in all 20 cases, since finding out what comparable data could meaningfully be collected from such a varied set of orga-nizations was a heuristic process difficult to share across researchers. The informants for the unit-level data were the top man-ager, the chief personnel officer, and the chief budget officer. The purpose of this phase was finding out what part of the cul-ture scores could be related to unique fea-tures of the organizational unit in question, such as its history or the personality of its founder; to what extent the scores reflected other characteristics of the organization, like its structure and control systems; and to what extent they were predetermined by given factors like nationality, industry, and primary process. This phase represented for the cross-organizational study what the correlations with data from other sources had done for the cross-national study: validating internal survey results against external, independent measures.
◆ Samples and Questionnaire for the Survey Phase
In the larger units, the random sam-ples surveyed consisted where possible of about 25 managers, 25 college-level nonmanagers (“professionals”), and 25 noncollege-level nonmanagers (“others”). Altogether, 1,295 usable questionnaires were completed, an average of 65 per unit.
The questionnaire tried to collect infor-mation on the four types of manifesta-tions of culture covered in the interview checklist: values and practices, the latter divided into symbols, heroes, and rituals. Values items described what the respon-dents considered important in their lives, practices items how they perceived aspects of their work situation. The distinction between the two was not only present in
the conception of the researchers but also in the minds of the respondents. In a fac-tor analysis of all 135 survey items for all 1,295 respondents, values items and prac-tices items loaded consistently on different factors, with very little overlap (Hofstede, 1998). The questionnaire contained the following items:
Values . 1 The values section consisted of 57 questions: 22 work goals, 28 general beliefs, and 7 other items that in the IBM studies had correlated with these. Work goals represented “values as the desired,” while general beliefs represented “values as the desirable” (Hofstede, 2001, pp. 6–7). Most were taken from the IBM ques-tionnaire (see 9.1.), some from Laurent (1983), while 5 new items were added on the basis of the interviews.
Practices: symbols and rituals . This section consisted of 54 questions about percep-tions of one’s work situation. From these, 15 were inspired by Reynolds’s (1986) scan of the anecdotal U.S. literature on corporate cultures. The remaining 39 were based on the interviews. All questions were cast into a bipolar format under the general heading “Where I work . . .” and used five-point scales, for example: 1 = “meeting times are kept very punctually” and 5 = “meeting times are only kept approximately.”
Practices: heroes . This section included 7 questions about the “behavior of a typi-cal member of the organization,” using bipolar five-point “semantic differential” scales, for example, 1 = “slow” and 5 = “fast.” The remaining 13 questions asked about reasons for promotion and dis-missal, rated on five-point scales of impor-tance or frequency. All 20 questions in this section were inspired by the interviews.
Demographics . Four questions asked about the respondent’s gender, age group, seniority with the employer, and education level. Finally, there was an open question, asking the respondent for any additions or remarks.

400 ◆ Major Cross-Cultural Studies
◆ Analysis of the Survey Results
Unit mean scores on each question were derived from a stratified sample of approxi-mately equal numbers of managers, pro-fessionals, and nonprofessionals. For all 131 values and practices questions, with-out exception, unit mean scores differed significantly across the 20 organizational units. However, the 57 questions dealing with values tended to produce smaller dif-ferences between units than the 74 ques-tions dealing with perceived practices. Analyses of variance (ANOVAs) showed that reported values varied less across orga-nizational units than they had done across countries in the IBM study; also, in the organizational culture study, the answers to practices questions explained much more variance than answers to values questions (Hofstede, 2001, p. 396). The ANOVAs also studied the effects of occupation level, gender, and age; these did not differ sys-tematically between the cross-national and the cross-organizational study, nor between values and practices questions in the latter.
◆ Dimensions of Organizational Cultures
The cross-organizational study followed the ecological dimensions paradigm intro-duced in the cross-national IBM study. Dimensions of organizational cultures were derived from an ecological multivari-ate analysis of the 20 units x 131 survey questions data matrix.
Cross-unit correlations for the 131 questions showed that (1) values correlated with other values but rarely with practices (just like in an earlier factor analysis of individual scores); (2) perceived symbols, rituals, and typical-member scores cor-related among each other; and (3) reasons for promotion and dismissal correlated among each other but rarely with other
items at all. For analytic purposes, the matrix was therefore split into three parts: 57 values questions; 61 perceived symbols, rituals, and typical member scores; and 13 reasons for promotion and dismissal, and each of these was subjected to a factor analysis with varimax rotation.
The 54 symbols and rituals questions in the “Where I work . . .” format plus the 7 “typical member” questions pro-vided by far the clearest ecological factor structure. Six factors could be extracted, together explaining 73% of the variance. They referred to issues well known from organizational sociology and management theory. The labels for the corresponding dimensions were partly based on interpre-tations by survey participants during the feedback discussions. These labels avoided as much as possible suggesting that one pole of the dimension was “good” and the other “bad.”
Scores for each unit on each of the six dimensions were computed by adding or subtracting the unit mean scores on three key “Where I work . . .” items with high loadings (over .60) on the corresponding factor; they were expanded to 0–100 scales from the lowest- to the highest-scoring unit. The key items were chosen because they best represented the essence of the dimension as the researchers interpreted it; moreover, they had face validity for conveying this essence to the management and members of the units in the feedback sessions. In an ecological factor analysis of only these 6 x 3 = 18 questions across the 20 units, they accounted for 86% of the variance. The items are listed below.
◆ The 18 Questions About Organizational Practices Used to Compute Six Dimensions of Organizational Cultures
These questions were part of a 54-item section; for the full list, see Hofstede

Cultural Dimensions Across Modern Nations ◆ 401
(2001, p. 398). The 18 items did not appear in the order below but were spread over the section. The position of the poles for the 54 items—left or right—had been randomly chosen. In the table below, items loading positively and negatively on each dimension are shown as they appeared in the questionnaire, with their poles mixed.
The following list contains two oppo-site descriptions on each line. For example:
Where I work everybody always smokes 1 2 3 4 5 Where I work nobody ever smokes.
If it is true that everybody always smokes where you work, please circle 1. If nobody ever smokes, please circle 5. If the truth is in-between, choose 2, 4, or 3, depending on whether the truth is closer to 1, to 5, or just in-between. (Please, always circle one answer for each line across).
Where I work . . .
Dimension P1
1-1 People are uncomfortable in unfamiliar situations; they try to avoid taking risks
1 2 3 4 5 People are comfortable in unfamil-iar situations; they do not mind taking risks
1-2 People spend the least effort possible
1 2 3 4 5 Everybody always puts in a maxi-mal effort
1-3 (reversed) Each day brings new challenges
1 2 3 4 5 Each day is pretty much the same
Dimension P2
2-1 (reversed) There is strong pres-sure for getting the job done; there is little concern for per-sonal problems of employees
1 2 3 4 5 Personal problems of employees are always taken into account; get-ting the job done comes second
2-2 Our company/organization takes a major responsibility for the welfare of its employees and their families
1 2 3 4 5 Our company/organization is only interested in the work our employ-ees do
2-3 (reversed) All important deci-sions are taken by individuals
1 2 3 4 5 All important decisions are taken by groups or committees
Dimension P3
3-1 (reversed) People’s private lives are considered their own busi-ness
1 2 3 4 5 The norms of our organization cover people’s behavior both on the job and at home
3-2 (reversed) Job competence is the only criterion used for hiring people; their background does not influence the decision
1 2 3 4 5 People from the right family, social class, or school background have a better chance of being hired
3-3 We do not think more than a day ahead
1 2 3 4 5 We think three years ahead or more
(Continued)

402 ◆ Major Cross-Cultural Studies
Dimension P4
4-1 Our organization and people are open and transparent to newcomers and outsiders
1 2 3 4 5 Our organization and people are closed and secretive, even among insiders
4-2 Almost anyone would fit into our organization
1 2 3 4 5 Only very special people fit into our organization
4-3 (reversed) New employees usu-ally need more than a year before they feel at home
1 2 3 4 5 New employees usually need only a few days to feel at home
Dimension P5
5-1 (reversed) Everybody is highly conscious of the cost of time and/or materials
1 2 3 4 5 Nobody ever thinks of the cost of time and/or materials
5-2 (reversed) Meeting times are kept very punctually
1 2 3 4 5 Meeting times are only kept approximately
5-3 We make a lot of jokes about the company/organization and our job
1 2 3 4 5 We always speak seriously of the company/organization and our job
Dimension P6
6-1 (reversed) The major emphasis is on meeting the needs of the customer
1 2 3 4 5 The major emphasis is on correctly following organizational proce-dures
6-2 Correct procedures are more important than results
1 2 3 4 5 Results are more important than following correct procedures
6-3 We have high standards of busi-ness ethics and honesty, even at the expense of short-term results
1 2 3 4 5 In matters of business ethics, we are pragmatic, not dogmatic
Dimension P1—process oriented versus results oriented— opposed a concern with means to a concern with goals. The three key items show that in the process-ori-ented cultures people perceived themselves as avoiding risks and spending only a limited effort in their jobs, while each day was pretty much the same. In the results-oriented cultures, people perceived themselves as comfortable in unfamiliar situations and putting in a maximal effort, while each day was felt to bring new challenges. This contrast is known from organizational sociology, for example, in Burns and Stalker’s (1961, p. 120) dis-tinction between mechanistic and organic
management systems. For this dimension, it is difficult not to attach a “good” label to the results-oriented pole and a “bad” label to the other side. Nevertheless, there are operations for which a single-minded focus on the process is desirable. The most process-oriented unit among the 20 (score 00) was a production plant of a pharma-ceutical firm. Drug manufacturing is an example of a risk-avoiding, routine-based process for which it is doubtful whether one would want its culture to be results oriented. Departments with similar con-cerns exist in many other organizations. So even a results orientation is not always “good” and its opposite “bad.”
(Continued)

Cultural Dimensions Across Modern Nations ◆ 403
Dimension P2—employee oriented ver-sus job oriented— opposed a concern for people to a concern for getting the job done. The key items selected show that in the employee-oriented cultures, people felt that their personal problems were taken into account, that the organization took a responsibility for employee welfare, and that important decisions were made by groups or committees. In the job-oriented units, people experienced strong pres-sure to get the job done; they perceived the organization as only interested in the work employees did, not in their personal and family welfare; and they reported that important decisions were made by indi-viduals. This dimension corresponds to the two axes of Blake and Mouton’s (1964) Managerial Grid. These authors presented employee orientation and job orientation as two independent dimensions rather than opposite poles of a single dimension. However, their model applied to individu-als, while Hofstede’s analysis was made at the level of social systems.
Dimension P3—parochial versus profes-sional— opposed units whose employees derived their identity largely from the organization to units in which people identified with their type of job. The key questions show that members of parochial cultures felt that the organization’s norms covered their behavior at home as well as on the job; they felt that in hiring employ-ees the company took their social and family background into account as much as their job competence; and they did not look far into the future (they probably assumed the organization would do this for them). On the other side, members of professional cultures considered their private lives their own business, they felt the organization hired on the basis of job competence only, and they did think far ahead. Sociology has long known this distinction as “local” versus “cosmopoli-tan,” the contrast between an internal and an external frame of reference (Merton, 1968, p. 447ff.).
Dimension P4—open versus closed— described the communication climate (Poole, 1985), a focus of attention for both human resources and public relations experts. The key items show that in the open system units, members considered both the organization and its people open to newcomers and outsiders; almost any-one would fit into the organization; and new employees needed only a few days to feel at home. In the closed system units, the organization and its people were felt to be closed and secretive, even among insid-ers; only very special people fitted into the organization; and new employees needed more than a year to feel at home.
Dimension P5—loose versus tight— referred to the amount of internal structur-ing in the organization. According to the key questions, people in loosely controlled units felt that no one thought of cost, meeting times were only kept approxi-mately, and jokes about the company and the job were frequent. People in tightly controlled units described their work envi-ronment as cost conscious, meeting times were kept punctually, and jokes about the company and/or the job were rare. A tight culture was correlated with other ques-tions describing strict unwritten codes in terms of dress and dignified behavior.
Dimension P6—normative versus prag-matic— dealt with the amount of struc-turing in the unit’s external contacts. It corresponds to the popular notion of cus-tomer orientation. Pragmatic units were market driven; normative units perceived their task toward the outside world as the implementation of inviolable rules. The key items show that in the normative units the major emphasis was on correctly fol-lowing organizational procedures, which were more important than results; in mat-ters of business ethics and honesty, the unit’s standards were felt to be high. In the pragmatic units there was a major emphasis on meeting the customer’s needs, results were more important than correct procedures, and in matters of business

404 ◆ Major Cross-Cultural Studies
ethics a pragmatic rather than a dogmatic attitude prevailed. An organization can be results oriented but not customer oriented (example: one of the two police corps in the study). The opposite combination can be found in service businesses: Trying to serve the customer does not necessarily imply a results orientation.
The factor analyses of the questions about values and about reasons for pro-motion and dismissal added little to the six dimensions of practices (Hofstede, 2001, pp. 400–401; Hofstede et al., 1990).
◆ Validating the Practices Dimensions
Organizational cultures are partly prede-termined by nationality, industry, task, and market, partly related to organiza-tional variables like structure and control systems, and partly unique products of idiosyncratic features like the organiza-tion’s history or the personality of its founder. The organizational culture study covered only two nationalities with rather similar national cultures; from the orga-nizational culture dimensions, only P4 (open versus closed) differed significantly between the Danish and the Dutch units: An open communication climate was more characteristic of the Danes. However, one Danish unit scored as extremely closed, which corresponded to its history and to its internal and external image.
For the organization’s industry, task, and market, the scoring profiles of the 20 units on the six practice dimensions showed that dimensions P1 (process ver-sus results), P3 (parochial versus profes-sional), P5 (loose versus tight), and P6 (normative versus pragmatic) varied at least partly according to the type of work the organization did and to the type of market in which it operated. In fact, these four dimensions reflected “industry cultures.” The two remaining dimensions,
P2 (employee versus job) and P4 (open versus closed), were independent of the industry and reflected the philosophy of founders and top leaders.
The structural data collection produced a large number of quantified data; 40 variables across the 20 organizational units showed significant correlations with one or more dimensions (Hofstede, 2001, p. 403).
On dimension P1, process versus results orientation, manufacturing and office units tended to score on the process-oriented side and research and development and service units on the results-oriented side. This dimension was most strongly cor-related with the split between labor and material cost in the operating budget. Any operation can be characterized as laborintensive, material intensive, or capitalintensive, depending on which of the three categories of cost takes the largest share of its operating budget. Labor-intensive units, holding number of employees constant, scored as more results oriented, while mate-rial-intensive units, again holding number of employees constant, scored as more process oriented. If an operation is laborintensive, people’s efforts, by definition, play an important role in its results. This supports a results-oriented culture. The yield of material-intensive units depends more on technical processes, which stimu-lates a process-oriented culture.
Scores on dimension P2 (employee versus job orientation) clearly reflected the philosophy of the unit or company’s founder(s) and top leaders as described and demonstrated during the interviews and feedback sessions. They also showed the possible scars left by past events: Units that had recently been in economic trouble, especially if this was accompanied by collective layoffs, tended to score as job oriented, even if, according to infor-mants, the past had been different. The strongest correlations with dimension P2 were with the way the unit was controlled by the organization to which it belonged. Where the top manager of the unit stated that his superiors evaluated him on profits

Cultural Dimensions Across Modern Nations ◆ 405
and other financial performance measures, the members scored the unit culture to be more job oriented. Where the top man-ager’s performance was evaluated by his superiors against a budget, the opposite was the case: Members scored the unit culture to be more employee oriented. It seems that operating against external stan-dards (profits in a market) breeds a less benevolent culture than operating against internal standards (a budget).
On dimension P3 (parochial versus pro-fessional), units with a traditional technol-ogy tended to score as parochial, high-tech units as professional. The strongest corre-lations of this dimension were with various measures of size: The larger organizations fostered the more professional cultures.
In dimension P4 (open versus closed), the philosophy of the organization’s founder(s) and top leaders played a strong role, just like in dimension P2. Communication cli-mates in the units studied seemed to have been formed historically without much outside rationale; some organizations had developed a tradition of secrecy, others of remarkable openness. The open-closed dimension was responsible for the stron-gest correlation with an external measure, r = .78 with the percentage of women employees. As already mentioned, P4 was the only one of the six practice dimensions significantly associated with nationality: Danish rather than Dutch.
On dimension P5 (loose versus tight control), units delivering precision or risky products or services (such as pharmaceu-ticals or money transactions) tended to score tight on control, those with inno-vative or unpredictable activities tended to score loose. The two municipal police corps scored on the loose control side (16 and 41 on the 0–100 scale): Police work is unpredictable, and police personnel have considerable discretion in the way they want to carry out their tasks. The stron-gest correlation of the loose versus tight control dimension was with an item in the self-reported time budget of the unit top manager: Where the top manager claimed to spend a relatively large part of his time
reading and writing reports and memos from inside the organization, control was seen as tighter.
On dimension P6 (normative versus pragmatic), service units and those oper-ating in competitive markets tended to score as pragmatic, while units involved in the implementation of laws and oper-ating under a monopoly tended to score as normative. The strongest of the two external correlations with this dimension was with private versus public ownership: Privately owned units were more prag-matic, public units (like the police corps) more normative.
Conspicuously missing from the valida-tion results were correlations with perfor-mance measures. The study did not identify measures of performance applicable to so varied a set of organizational units. Also, the relationship between culture and performance is contingent upon organiza-tional strategy, so even from a theoretical point of view, across-the-board correla-tions between culture dimensions and per-formance measures should not be expected.
◆ Follow-Up Studies
Following the 20-unit study, IRIC surveyed employee attitudes and classified organiza-tional subcultures within a Danish insur-ance company with some 3,000 employees (Hofstede, 2001, pp. 405–408).
At the initiative of Michael Bond and with the expert help of Bond’s student assistant Chung-Leung Luk, Hofstede also re-analyzed the 1,295 organizational culture questionnaires at the individual respondent level. For this purpose, the between-organizational unit variance was separated from the within-organizational unit variance, after which the latter was factor analyzed across the 1,295 individu-als. The resulting six factors, again entirely different from the cross-national and cross-organizational factors, reflected personal-ity differences closely corresponding to the Big Five personality dimensions (Hofstede,

406 ◆ Major Cross-Cultural Studies
1995; Hofstede, 2007; Hofstede, Bond, & Luk, 1993; McCrae & John, 1992).
◆ Contributions
1. The finding that answers to values questions varied less across organizations than they did across countries and that answers to practices questions produced much wider ranges across organizations than those to values questions had not been predicted. It led to the most impor-tant conclusion from the organizational cultures study: that organizational culture differences are mainly a matter of prac-tices, while national culture differences are mainly a matter of values.
Organizational cultures are therefore of a different nature than national or societal cultures. Hofstede explained this from the fact that we acquire our societal culture with its unconscious values in childhood, while organizational cultures with their conscious practices are learned when peo-ple join the organization as adults.
The six organizational culture dimen-sions have been applied by management consultants in a number of Western coun-tries as a framework for describing, mea-suring, and comparing organizational cultures and for monitoring planned cul-ture change processes. A methodology for analyzing and monitoring organizational cultures based on the Hofstede research has been developed by Bob Waisfisz of the Netherlands and is available on the Web through FeedbackDialog Oy of Helsinki, Finland.
◆ Food for Thought
1. Dimensions of national or societal cultures, founded mostly in values, belong to comparative anthropology. Dimensions of organizational or corporate cultures,
founded mostly in practices, belong to comparative organizational sociology. The use of the common term “culture” for the mental programming at the soci-etal and at the organizational level is, in fact, misleading and continues to create misunderstandings in the management literature.
2. The six-dimensional model of organizational cultures based on 20 organizational units in two Northwest European countries, a very limited sample, cannot be considered universal. For exam-ple, organizations in the health and wel-fare area, government offices, and armed forces were not included, and in other national environments additional practice dimensions may very well be relevant. What should be universal is that differ-ences among organizational cultures are partly quantifiable along a limited number of dimensions of practices, including or resembling those described above.
3. The limitations of the six-dimen-sional model imply that answers collected in other organizations, in other environ-ments, and at other times cannot be mean-ingfully compared with those from the 20 units in the IRIC study. New studies should choose their own relevant units for comparison. They should at least repeat phases one and two of the project, that is, start with interviews to get a feel for the unit’s gestalts and compose their own questionnaires, including all crucial prac-tice differences.
■ Note (by Michael Minkov)
1. Readers should note that Hofstede and his associates used the term “values” in a broad sense that is inconsistent with the more restric-tive terminology adopted in this book. By “val-ues” they meant not only what is personally important to people but also various beliefs.

PART IV
A SUMMARY OF THE OBSERVED CULTURAL DIFFERENCES ACROSS THE GLOBE


◆ 409
10
This part of the book briefly summarizes the main findings of the studies in Part III and some other research projects, outlining major
cultural differences across the modern world. The reader will also find suggestions concerning the potential origins of these differences. The analysis is deliberately brief and cursory: Its goal is to provide a con-densed description of the most salient and well-documented cultural differences across the globe’s main economic and geographic regions.
We start with the best-documented cultural differences: those between rich and developing countries. Most of the studies in Part III of this book produced dimensions of national culture that are highly correlated with national wealth. This means that many features of any country’s culture can be predicted, at least approximately, from its level of economic development.
Because the cultural characteristics of the rich countries—collectively known as individualism (Hofstede, 2001), universalism (Minkov, 2011), egalitarian commitment (Schwartz, 1994; Smith et al., 1996), autonomy (Schwartz, 1994), or self-expression (Inglehart & Baker, 2000)—are not positive predictors of subsequent economic growth, they cannot be a determinant of such growth. Rather, these characteristics are a direct or indirect result of economic development. This view was proposed by various authors, including Hofstede (2001). Subsequently, Ronald Inglehart and his associates carried out longitudinal analyses of World Values Survey data spanning several decades and showed beyond any doubt that economic development is typically (though not inevitably) accompanied by massive cultural change in a fairly predictable direction (Inglehart, 1997, 2008; Inglehart & Baker, 2000; Inglehart & Welzel, 2005b). Minkov (2011) notes the existence of historical evidence that
CULTURAL DIFFERENCES BETWEEN RICH AND DEVELOPING COUNTRIES

410 ◆ Cultural Differences Across the Globe
the medieval Scandinavian societies shared many cultural features with today’s poorest countries: in-group favoritism, racism, and a high-context communication style in the sense of Hall’s (1959) terminology and theory.
A summary of the main cultural differences between rich and poor countries is pro-vided below. It focuses on measurable characteristics that correlate with indicators of national wealth (GDP per person or GNI per person at PPP) at ±.60 or higher. These characteristics also tend to intercorrelate; therefore, many of them would probably form a single dimension of national culture. Unfortunately, this hypothesis cannot be tested easily because of the missing values problem that occurs almost inevitably when data are collected from a wide range of sources.
Inglehart and Baker (2000) proposed that “economic development gives rise to not just one but two main dimensions of cross-cultural differentiation” (p. 21). As indicated in 8.2.5., dimensions do not exist; they are invented by researchers. One can construct one or two or several dimensions that correlate with national wealth. The fact that Inglehart and Baker have preferred to create two dimensions does not mean that one cannot extract only one that is in between the two and is more closely correlated with national wealth than either of the two. Hofstede’s measure of individualism versus collectivism and Minkov’s measures of universalism versus exclusionism have precisely this property.
Hofstede (1980, 2001) called the cultural dimension associated with national wealth individualism versus collectivism. The term “universalism versus exclusionism” may be preferable for practical reasons: In some countries, the terms “individualism” and “collec-tivism” have acquired popular meanings that do not reflect Hofstede’s concept (Minkov, 2007, 2011). Further, there is significant confusion in the academic literature concerning the meaning of these terms and what they reflect. This issue is discussed again at the end of this chapter.
◆ In-Groups and Out-Groups
While cohesive in-groups (circles of trusted relatives, friends, and partners) are very important in poor societies, economic growth erodes their importance and leads to their partial disintegration. People in richer nations are more likely to believe that children do not owe unconditional love to their parents, that children do not necessarily need to grow up with two parents, or that women do not need to have children to be fulfilled. Rich societies also have a less negative attitude toward divorce. Adults do not normally live with their parents (Minkov, 2011, using World Values Survey data). The evidence in Project GLOBE’s analysis (Gelfand et al., 2004) demonstrates that some of these cultural characteristics are so salient that people are usually aware of them and are capable of providing a reliable assessment
of the degree of in-group cohesiveness of their societies.
Further, people in rich countries are less likely to view the ideal company as an extension of their immediate in-groups. One’s private life is none of the com-pany’s business and no involvement in it is expected even in difficult times (Hofstede, 2001; Smith et al., 1996). The ideal man-ager is not viewed as the father figure that he is in much of the developing world, and the relationships between managers and subordinates are expected to be strictly professional, excluding any personal ele-ment (Hofstede, 2001).
All this suggests that as a society gets richer, its members do not perceive a need to form cohesive and stable in-groups, characterized by strong and unquestion-able loyalty. In a rich country, adult individuals are normally capable of taking care of themselves without relying much on their relatives and friends (Hofstede,

Cultural Differences Between Rich and Developing Countries ◆ 411
2001; Minkov, 2011). Those who are incapable of looking after themselves can expect various welfare organizations to step in and provide help.
◆ Group-Based Discrimination
While poor societies are characterized by nepotism, various degrees of racism, sex-ism, xenophobia, and neglect of disabled people, those in the rich world have more universalist and altruist attitudes (Inglehart & Baker, 2000; Minkov, 2011; Schwartz, 2007; Welzel, 2010). The rich countries have higher scores on integration—a cul-tural dimension defined by tolerance of others, harmony, and solidarity (Chinese Culture Connection, 1987). 1
Discriminatory practices in Western cultures are normally allowed only on an individual basis, for instance, when one person must be recruited out of many job applicants. In such cases, it is considered unacceptable to select the candidate on the basis of group membership, as it would be in the developing world.
The quality of public and business services is also more consistent in the rich countries, where it is not normally a func-tion of personal relationships or group membership (Minkov, 2011). This means that as the importance of in-groups dimin-ishes, a compensatory process takes place: Out-groups become more important than before. Also, the boundaries between in-groups and out-groups become blurred in the rich world.
If the disintegration of in-groups is a relatively logical phenomenon in a rich society, it is not so intuitively clear why it should be accompanied by a more uni-versalist and altruistic attitude toward out-groups. If people in Western nations do not need much help from relatives and friends to get by in life, why do they also denounce racism and nepotism so
vigorously and set up aid and relief orga-nizations that operate across the world? Various explanations are possible, but the answer could probably be sought in what made the West rich: the development of business. Evidence presented in Minkov (2011) shows that as business relation-ships in a developing country expand and become more sophisticated, those who are involved in them become increasingly aware of the fact that they need to develop strong empathy and considerateness for their clients and adopt the philosophy that the customer is king. They also realize that discriminatory attitudes toward custom-ers and business partners based on race, ethnic, or tribe membership; gender; age; religious affiliation; or other group affili-ation can mean suicide for the business. After several generations, this new uni-versalist attitude can spread throughout a rich population and become part of the national culture. Seen from this perspec-tive, the universalist element of Western culture is ultimately generated by business interests. A service economy, which is the dominant type in the West today, is par-ticularly propitious for the development of a universalist culture.
◆ Transparency and the Rule of Law
Rich countries have less corruption and greater transparency, as well as what is commonly known as “the rule of law”—a Western concept that refers to the appli-cation and enforcement of the existing laws in the same way, regardless of the group membership of those involved. The fact that richer countries have lower road death tolls (Minkov, 2011) is of particular interest. 2 It suggests lower considerate-ness toward out-group members in the developing world in two ways: more care-less driving and poorer law enforcement. The latter bespeaks greater neglect on the

412 ◆ Cultural Differences Across the Globe
part of the government of what happens to citizens, who are viewed as distant out-group members.
As the results of Project GLOBE dem-onstrate, poorer nations are more likely to have some segments of their popula-tions (middle managers in the case of GLOBE) that wish to see more Western order and predictability in their societ-ies. 3 Evidently, the middle managers in poorer countries wish to have others in their society show more respect for some aspects of order that have originated in the West. Yet this does not mean that middle managers and other citizens of developing countries are able or willing to adopt the norms that they would like to impose on others as their own personal values (Minkov, 2011). So while many respondents in developing nations profess a desire for various aspects of Western order, their countries cannot achieve such order before they have achieved substan-tial economic growth.
◆ Satisfaction With Life
Richer populations report greater subjec-tive well-being (Diener & Oishi, 2000). 4 It is unlikely that differences in wealth are a direct cause, or the only cause, of group differences in life satisfaction; research among Inuit and Maasai popu-lations revealed that they had approxi-mately the same level of subjective well-being as the richest Americans (Diener & Tov, 2007). A major reason for the relative dissatisfaction with life in poorer nations may be the discomfort that peo-ple experience as modern nations bring together various in-groups that treat each other with disrespect and neglect and practice nepotism, discrimination, corruption, and arbitrary application of rules, regulations, and laws. As a result, there is a general feeling among mem-bers of poor nations that things in their countries are not functioning well, and a
desire, at least among educated segments of the population such as middle manag-ers, to see more Western order (Minkov, 2011).
Although this may provide a somewhat satisfying explanation of national differ-ences in life satisfaction, it does not tell the whole story. Some poor nations in Latin America report far greater life satisfaction than one can predict from their national wealth or measures of the rule of law. We will explore other factors explaining differences in life satisfaction further in Chapter 12.
◆ Personal Freedom
On average, people in rich countries per-ceive greater personal freedom and life control over the good things that happen to them. This is indirectly evident from Smith et al.’s (1995) study. Although it does not provide national scores for indi-vidual items, it is plausible to make such a conclusion on the basis of the country positions on their individual-social dimen-sion, defined by items that, among other things, measure life control over positive events.
However, this should not be inter-preted as greater locus of control in the sense of Rotter’s (1966) purely abstract and empirically problematic construct. Generally speaking, rich societies (as well as some countries in Latin America) have higher percentages of people who report strong life control—a feeling that they can live their lives as they please (Minkov, 2011, based on evidence from the World Values Survey). They also appear more confident that they can make their plans work (Smith et al., 1995). This is natural, given the greater availability of resources in the rich world but also the presence of the rule of law and Western order that makes many social aspects of life more predictable. Yet, Smith et al.’s (1995) study suggests

Cultural Differences Between Rich and Developing Countries ◆ 413
that rich societies are characterized by a weaker conviction that people can make others like them. This probably reveals a greater respect for the freedom and per-sonal choice of others, which is typical of a universalist society. Also, according to the same study, poor societies appear to endorse the belief that most misfortunes are the result of personal mistakes, lack of personal ability, laziness, or all three, whereas rich ones tend to ascribe mis-fortunes to bad luck. An interpretation of this finding in the light of something related to Rotter’s (1966) ideas would probably be inappropriate. Rather, we seem to have evidence that people in poor societies have less empathy for their unfortunate fellow citizens. According to Minkov (2011), strong empathy is indica-tive of a universalist culture.
◆ Societal Cynicism
The study by Bond et al. (2004) evidences a fairly clear contrast between develop-ing and developed nations on the dimen-sion that these authors called “societal cynicism” (9.16.). Although this con-trast cannot be fully accounted for by differences in wealth, it is clear that richer societies have a less cynical social outlook in the sense described by Bond et al. (2004). They are more likely to view the existing social system as fair even when no direct reference is made to the political system.
◆ Dynamic Externality
As the richest nations are better educated than the poorest nations, the former score lower on Bond et al.’s (2004) dynamic externality dimension, which essentially stands for naïve worldviews and supersti-tious beliefs.
◆ Pace of Life
People in richer countries tend to walk faster, and clerks provide faster service. 5 One interpretation of these findings can be that people in richer and more com-plex economies simply have more things to do and have busier lives. But a cultural interpretation is also possible. The cul-tures of the rich countries require a per-son to show more empathy for customers and business partners, which requires greater punctuality as well as more effi-cient service. In the universalist Western world, keeping people waiting and wast-ing their time is viewed as unforgivable lack of considerateness, whereas in the developing countries it is widespread behavior.
◆ Competitiveness
Contrary to some popular myths, richer societies (which have universalist cul-tures) score lower than poorer societies, not higher, on measures of competitive-ness. 6 The Chinese Culture Connection’s (1987) integration dimension reflects dif-ferences in “noncompetitiveness,” among other things. Richer countries appear more likely to endorse the value of non-competitiveness. The same conclusion is to be drawn from the studies by van de Vliert and Janssen (2002) and van de Vliert, Kluwer, and Lynn (2000).
As in the case of pace-of-life differ-ences, two interpretations are possible. One is that people in richer countries have relatively easy access to abun-dant resources and do not perceive a strong need to compete for them. The cultural interpretation would be that the cultures of richer societies are more likely to teach empathy and considerate-ness for others, which precludes ruthless competition.

414 ◆ Cultural Differences Across the Globe
◆ Collective Action Tendency
Welzel (2010) demonstrated that people in richer countries are more likely to get organized for the purpose of collective action. In poor societies, collective action occurs mostly within in-groups and may be even avoided when people have to associate with out-group members who are often mistrusted. Such associations may occur under extraordinary circum-stances, however; for instance, when a political regime is perceived as unbear-ably oppressive. Welzel’s analysis con-firms a well-known trend: Under normal conditions, people in rich countries are more likely to form voluntary associa-tions with out-group members for politi-cal, professional, social, or recreational purposes.
◆ Power Distance
Hofstede’s power distance dimension is highly correlated with the other dimen-sions of national culture that place societies on a rich-poor continuum. Nevertheless, Hofstede (1980, 2001) pre-ferred to view power distance as distinct from individualism-collectivism, mainly for conceptual reasons. In fact, it is possi-ble to see a remote conceptual connection between power distance and Minkov’s (2011) exclusionism dimension: Generally speaking, power distance is about treat-ing people differently, depending on their group membership.
Power distance has another peculiarity. Whereas individualism versus collectivism and universalism versus exclusionism are meaningful concepts in all human societ-ies, there is no power distance in societies of hunter-gatherers, as they are strictly egalitarian. Power distance appears with the advent of agriculture and production
surpluses that are claimed by group lead-ers. These leaders acquire a superior socio-economic position and strive to perpetuate their privileges, presenting them as a nor-mal and eternal state of affairs.
The development of trade usually reduces power distance. Ancient, medi-eval, and post-medieval societies in which trade was a key sector of the economy, such as Greece, the northern Italian republics, and the Netherlands, had more or less egalitarian societies. Power distance was relatively low also in medieval northern Europe, where agri-cultural yields were modest and the aris-tocracy was not particularly wealthy; therefore, it could not maintain a strong coercive regime. The medieval Icelandic sagas suggest that the Scandinavian kings were often approached and treated by their subjects in a way that would sound shockingly disrespectful in a high power distance region such as Asia.
The development of industry and the service sector has done much to reduce power distance as it has created oppor-tunities for greater social mobility. As a result, rich countries today have lower power distance than poor ones.
◆ Self-Protective Leadership
We learn from Dorfman et al. (2004) that rich countries are less likely than developing countries to endorse self-protective leadership, defined by a ten-dency for a leader to be self-centered, status-conscious, and procedural, as well as a conflict inducer and a face saver. Employees in developing countries may not endorse this type of leadership either, but it is apparently easier for their leaders to get away with it, whereas employees in rich economies are strongly averse to having a leader who exhibits such traits.

Cultural Differences Between Rich and Developing Countries ◆ 415
◆ Sources of Guidance for Managerial Decisions
The study by Smith et al. (2002) shows that the managers of the rich nations are more likely than their peers in develop-ing nations to consult their subordinates and rely on their own experience. They are less likely than their peers in devel-oping nations to rely on formal rules and on their superiors. Similar conclu-sions were reached by van de Vliert and Smith (2004), who found that leaders in developed nations were more likely than those in developing countries to rely on subordinates. In summary, organizations in wealthier nations are characterized by greater managerial freedom and some blurring of the boundaries between man-agers and subordinates, which parallels the blurring of boundaries between in-groups and out-groups in society at large.
◆ Sexuality
Despite the controversies surrounding Schmitt’s (2005) study (9.20.), it seems that people in richer societies are less inhibited when they discuss their own sex-uality, and the self-reports of their sexual behaviors may be more reliable than in many developing countries. The general sense of freedom that pervades the rich countries may be one of the explanations of this phenomenon.
It also appears from Schmitt’s study that as a society gets richer, its sociosexu-ality index is likely to increase. However, this does not mean that all preindustrial societies are characterized by low socio-sexuality. The degree of sexual permis-siveness that a society allows is a function of many factors, not just poverty versus wealth, and can be studied from various angles: the predominant type of econ-omy, female participation in the economy,
female status, availability of contracep-tives, and so forth.
◆ Other Statistical Associations
Many national indicators in the databases of the UN Statistics Division, the UN Development Program, the World Health Organization, and other organizations are statistically associated with national wealth, producing weak to moderate correlations. Of interest, greater national wealth predicts a higher IQ score on Lynn and Vanhanen’s (2002) national index of general intelligence (also called “math-ematical intelligence” by Minkov, 2011), as well as higher educational achievement in mathematics and science, as measured by the international projects TIMSS and PISA. Contrary to the assertions of Lynn and Vanhanen (2002), who view national IQ as a strong factor in economic growth, their national intelligence index (based on studies from the second half of the 20th century) does not predict subsequent economic growth in the first decade of the 21st century. Although this does not prove that national differences in IQ and education cannot account for differences in speed of economic development dur-ing any historical period and across any type of societies, it suggests that higher national IQ and better education today are at least partly a product of national wealth, rather than the other way around.
Further, national wealth is associated with a number of other important societal indicators. Richer countries have lower fertility and adolescent fertility rates, lower murder and HIV rates, and lower socioeco-nomic inequality. Also, they have higher suicide rates and a higher consumption of tobacco and alcohol. Yet, all these correla-tions are typically modest; differences in national wealth explain only a small part of them. Consequently, they may be better

416 ◆ Cultural Differences Across the Globe
explained by cultural dimensions that are not closely associated with national wealth and individualism versus collectivism or universalism versus exclusionism.
■ Notes
1. The national integration index cor-relates with GDP per person in 1990 (UN Statistics Division, 2009) at .69** Pearson and .78** Spearman ( n = 21).
2. Across 148 countries, the correla-tion between road death tolls (World Health Organization, 2009a) and GNI per person at PPP in 2008 (World Bank Group, 2009) is –.59** Pearson and –.65** Spearman.
3. The correlation between what GLOBE (Sully de Luque & Javidan, 2004) calls “uncer-tainty avoidance values” (according to this book: norms or ideologies for others associated with Western order) and GDP per person in
1990 (UN Statistics Division, 2009) is –.84** ( n = 57).
4. The correlation between average national life satisfaction (item A172 in the World Values Survey, latest data for each country from 1994–2004) and GDP per person in 1998 (UN Statistics Division, 2009) is .67** Pearson and .75** Spearman ( n = 82).
5. The national walking speed and postal clerk speed measured by Levine and Norenzayan (1999) (9.6.) correlate with GDP per person in 1998 (UN Statistics Division, 2009) at –.68** and –.62**, respectively ( n = 30).
6. Using World Values Survey data, Hayward and Kemmelmeier (2007) report that they have found only weak support for the hypothesis that individualism is associated with greater competitiveness. In fact, there is no support for it at all. Richer, and more individu-alist, countries are less likely to endorse com-petitiveness. The correlation between Green et al.’s (2005) national competitiveness index and GDP per person in 2005 (UN Statistics Division, 2009) is –.68** ( n = 20).

◆ 417
11
The previous chapter described aspects of culture that are dependent on national wealth. Further, Inglehart’s (2008) analysis demon-
strates that wealthy countries can experience partial cultural conver-gence, probably as a result, among other things, of continuing economic development. A comparison of various social indicators allows the same conclusion. The cultures of the developing countries have enormous differences in murder rates, HIV rates, adolescent fertility rates, and educational achievement, whereas those of the rich countries show only minor differences.
But are there any remaining important cultural differences between some rich countries? The answer is certainly positive. Below are exam-ples of some of the most striking differences revealed in the studies in Part III.
CULTURAL DIFFERENCES ACROSS RICH COUNTRIES

418 ◆ Cultural Differences Across the Globe
◆ Educational Achievement
The available educational achievement indicators suggest an enormous differ-ence between the rich Gulf emirates and kingdoms on the one hand and Japan and Western Europe on the other. According to the nationally representative TIMSS data, some Gulf states, such as Kuwait, Saudi Arabia, and Qatar, have dismal average school performance in mathemat-ics and science that is not matched by any other very rich country. Bahrain also has a low score, whereas the United Arab Emirates is in the middle of the world ranking (Minkov, 2011, based on TIMSS data).
There are important differences in educational achievement among the other rich countries, too. Singapore, Japan, Hong Kong, Taiwan, and Korea regularly top the TIMSS ranking in mathematics, followed by Belgium and the Netherlands. Sweden is about one standard deviation below East Asia, whereas Norway is even lower—at the level of the United Arab Emirates, which is 2 standard deviations below Singapore.
◆ Self-Enhancement and Self-Stability
Various comparisons of Japanese and Americans have revealed considerable psychological differences. Many of these are associated with self-enhancement and self-stability (see 9.24.). American culture encourages a personal sense of superiority and pride in domains that are important to the individual and a feeling that failures in other domains can be discounted. Japanese culture teaches more or less the opposite: a self-critical focus (Heine et al., 1999).
◆ Religiousness
Some of the most striking cultural dif-ferences in the rich world are those that distinguish the United States from Northwest Europe and Japan. The United States is far more religious: At the turn of the millennium, nearly 60% of the American respondents in the World Values Survey indicated that religion was very important in their lives, versus approximately 10% in Northwest Europe and Japan. A 2002 survey of religious-ness by the Pew Research Center evi-denced similar differences and resulted in a report concluding that among wealthy nations, the United States stood alone in its embrace of religion . Yet, the per-centage of Americans who view religion as very important has been decreasing steadily in the past few decades. In the 2005–2008 study of the World Values Survey, it had fallen slightly below 50% for the first time in history. It seems that the evolution of this part of American culture is following the European pat-tern, yet it is not quite clear why the United States is still considerably behind other rich countries in terms of secular-ism. Differences in education are the first explanation that comes to mind, yet they beg the question of what is behind them. Minkov (2008, 2011) argued that government policies are not a sufficient explanation because the next question in that case would be what makes the policies of some rich nations consistently conducive to good education whereas other rich nations consistently have defi-cient policies. It appears that culture is involved in this equation, explaining at least to some extent why some rich soci-eties place a stronger emphasis on educa-tion and attain greater secularism. The cultural dimension of monumentalism seems to be relevant in this case (Minkov, 2008, 2011).

Cultural Differences Across Rich Countries ◆ 419
◆ Subjective Well-Being
The rich East Asian countries (Japan, Hong Kong, Singapore) and the German-speaking and Latin countries of Europe have significantly lower subjective well-being than the Scandinavian and Anglo countries. For instance, the World Values Survey consistently reports far lower percentages of Japanese and Germans than Swedes and Americans who say they are very happy and feel in good health. Consistent with this, people in the first group of countries are less likely than those in the second to report a strong sense of control of personal life events. This sug-gests that the average Japanese does not perceive as much personal freedom as the average Swede.
Personal life satisfaction or happiness and a perception of life control and free-dom to act as one pleases correlate at the national level and explain each other satisfactorily in statistical and conceptual terms. But this raises the question of why there are such discrepancies between rich countries on the single dimension of national culture that these variables form. Various historical explanations are prob-ably possible. Comparisons of average national personality traits may also reveal some of the roots of these differences.
◆ Big Five Personality Traits
Although the three available studies of the geographic distribution of Big Five personality traits (McCrae, 2002; McCrae & Terracciano, 2005; Schmitt et al., 2007) are inconclusive, at the very least they sug-gest some differences in aggregate national personality traits between some rich coun-tries. For instance, in all three studies Japan has a high neuroticism score and ranks consistently higher than the United States.
This difference is consistent with these two countries’ positions on Hofstede’s (2001) uncertainty avoidance, which is, among other things, a measure of work-related stress and anxiety. One can therefore safely conclude that Japan’s culture is character-ized by higher stress and anxiety (which are facets of the neuroticism dimension) than that of the United States.
The evidence concerning the other developed countries is more controversial, but it seems reasonable to conclude that the Latin countries of Europe have a more neurotic average personality than those of the Anglo world and Scandinavia.
◆ Adolescent Fertility Rates
There is a large difference in adolescent fertility rates between the Anglo coun-tries and the rich East Asian countries: Japan, Singapore, Hong Kong. As across other samples of countries, this difference may be attributable to national differences in education or hypometropia (Minkov, 2011).
◆ Suicide Rates
Suicide rates across developed countries show a clear pattern. Japan, Finland, and the French- and German-speaking countries have higher suicide rates than Southwest Europe, Germanic Scandinavia, and the Anglo world. Although world-wide differences in suicide rates can be explained as a function of monumental-ism versus flexumility (Minkov, 2011), this explanation cannot be applied con-vincingly to all subsamples of countries. Within the rich world, factors such as neuroticism, subjective well-being, and individualism may also operate, creating a somewhat blurred cultural picture.

This chapter outlines some of the most striking differences between two groups of countries in the developing world. The most extreme
representative of the first group are the northern Latin American coun-tries that have been studied by the World Values Survey: Colombia, El Salvador, Guatemala, Mexico, Puerto Rico, and Venezuela. The southern part of Latin America—Argentina, Chile, Brazil, and Peru—also gravi-tates in the same direction in terms of its cultural characteristics but has less extreme scores on the indicators that are discussed in this chapter.
At the other extreme are the Eastern European countries, including the European and Caucasian part of the former Soviet Union. Most of developing Asia, especially China, can also be classified together with Eastern Europe for the purpose of this analysis. On many measures of national culture, there is a sharp contrast between Latin America and this Eurasian conglomerate.
The Arab countries, excluding the Gulf states, occupy a somewhat intermediate position between Latin America and developing Eurasia on the indicators that are analyzed here. The same can be said of some sub-Saharan countries, although the picture there seems more varied and less clear.
12 CULTURAL DIFFERENCES BETWEEN EASTERN EUROPE AND LATIN AMERICA
420 ◆

Cultural Differences Between Eastern Europe and Latin America ◆ 421
◆ Subjective Well-Being
The northern Latin American countries regularly achieve some of the highest posi-tions in the world on measures of happi-ness. Mexico is the champion among all the countries in the World Values Survey that have been studied at least twice rela-tively recently. The average percentage of Mexican respondents who stated that they were very happy in the two most recent surveys is 58. This is a world record for all countries—poor and rich. Eastern Europe typically has the lowest scores on this mea-sure, in many cases just below 10%. Some parts of the Arab world, especially Egypt and Iraq, have equally low scores, whereas China and South Korea (despite its relative wealth) score only slightly higher.
The situation in sub-Saharan Africa is hard to describe, partly because many countries in that region have been studied only once by the World Values Survey. South Africa was studied twice relatively recently. On average, 43% of its popula-tion describe themselves as very happy. In surveys done a decade ago, Nigeria and Tanzania recorded even higher levels of happiness, but these results need to be rep-licated to be considered fully trustworthy. African countries that experienced politi-cal and economic turmoil in recent times, such as Rwanda and Zimbabwe, reported very low happiness levels.
World Values Survey measures of aver-age life satisfaction create very similar geographic contrasts with one important exception. Some African countries seem to score high on happiness but low on life satisfaction. One way to explain this finding is to surmise that it is created by the World Values Survey items for-mat. 1 Alternatively, although measures of national happiness and life satisfaction are highly correlated in all World Values Survey studies (typically about .60**), they may not measure exactly the same phenomenon. The best-known definition of subjective well-being suggests that it
can be viewed as having two facets. 2 It is possible that the World Values Survey item that asks the respondents how satis-fied they are with their lives taps the cog-nitive facet, whereas the happiness items corresponds to the hedonic balance facet. 3
The World Values Survey has another item that measures subjective well-being. It asks the respondents to describe how healthy they feel. Across the developing countries, the lowest percentages of people who describe their health as very good are in the European part of the former Soviet Union: typically between 5 and 10%. The other Eastern Europeans score between 10 and 20%. Interestingly, there is no coun-try in Latin America with high percentages of people reporting excellent health. The typical scores in that part of the world are between 20 and 30%. It is also interesting that China consistently scores about 30%, which gives it a relatively good position in the world ranking, especially among the developing countries. The Arab countries appear to be in a similar position, but, unlike China, they show large fluctuations across studies. South Africa is the only African country whose subjective health was studied twice in two relatively recent studies of the World Values Survey. With its average score of about 45% of respon-dents reporting very good health, it is the champion of the whole world, excluding those countries that have been studied only once in the past decade. This is a remarkable result, in view of the fact that probably about 20% of the South African population carries the HIV virus (World Health Organization, 2010). 4
◆ Personal Life Control
Eastern Europe and the European part of the former Soviet Union have the low-est average levels of reported personal life control in the World Values Survey. Among the countries that were studied twice recently, Mexico and Colombia hold

422 ◆ Cultural Differences Across the Globe
the first and second places in the world ranking. The average perception of per-sonal life control, or freedom to live one’s life as one wishes, is higher in those nations than even in the United States, Australia, and Sweden. 5
◆ Self-Confidence
Some national measures, interpretable as self-confidence, create a clear contrast between Latin America on the one hand and parts of Eastern Europe and Asia on the other. The best example is van de Vliert and Janssen’s (2002) self-referenced performance motivation index (9.12.). Compared to Eastern Europeans and Asians, Latin Americans report a greater inclination to take on difficult tasks than tasks they know they can execute easily.
◆ Importance of Leisure
Among the developing countries in the World Values Survey that were studied twice recently, those of Latin America have the highest average percentages of respondents who say that leisure is very important to them. There is no clear dif-ference between the different parts of Latin America in this case. The highest-scoring countries are Mexico and Chile, with about 50% of respondents who value leisure very much. In most of the countries of the European parts of the former Soviet Union and Eastern Europe, this percentage is typi-cally between 20 and 25%. In China and Vietnam it is even lower: just below 10%.
Do statements about the importance of leisure reflect anything real? Developing countries whose citizens attach a lower importance to leisure have longer work-ing hours (Minkov, 2011). Barring unusual circumstances, such as world financial crises or political regimes that
do not allow at least relatively free mar-kets, such countries achieve faster eco-nomic growth.
◆ Thrift
The World Values Survey regularly mea-sures the importance of thrift as a value for children as a free-choice item. It is most often chosen in East Asia and India, followed by Vietnam, Russia, and Eastern Europe. In Latin America and the Arab world, thrift has a lower importance. This seems to be the case in sub-Saharan Africa as well, but the situation there is less clear because of the scarcity of replicated data.
As national savings rates are a strong predictor of economic growth in the devel-oping world (Dornbusch et al., 2004), one can expect that a cultural dimension that is defined among other things by national differences in thrift as a value for chil-dren would also predict economic growth. This is indeed so. The thrift item in the World Values Survey single-handedly pre-dicts speed of economic growth across developing countries (Minkov, 2011). The national dimensions of culture that are partly defined by the thrift item—indus-try versus indulgence (Minkov, 2011, see 9.24.), long-term orientation (Hofstede, 2001; Minkov & Hofstede, 2012b, see 9.26.), and egoism versus altruism (8.2.9.)—also predict speed of economic growth.
◆ Origins of the Cultural Differences in Subjective Well-Being, Life Control, Leisure Orientation, and Thrift
Inglehart’s analyses show beyond any doubt that rising national wealth is

Cultural Differences Between Eastern Europe and Latin America ◆ 423
accompanied by a shift toward what he calls “self-expression,” which includes a greater focus on the quality of life and greater life satisfaction (Inglehart, 2008; Inglehart & Baker, 2000). However, this change is slow. Moreover, the six West European countries that Inglehart (2008) tracked from 1970 to 2006 registered substantial changes only until about 1990. Between then and 2006, there were fluctu-ations but no clear upward trend across the whole period (Inglehart, 2008, Figure 2, p. 135). This suggests factors at work that are not associated with national dif-ferences in wealth. Besides, differences in national wealth cannot explain the large cultural distance between Eastern Europe and Latin America, as the two regions are more or less equally poor.
One can speculate that the fall of the totalitarian regime and the political and economic chaos that ensued in much of Eastern Europe in the 1990s is responsible for its low subjective well-being. But at the end of the 1990s, East and West Germany had nearly the same percentages of very happy people. The relatively low happiness in German culture cannot be explained as a function of the political regime.
Similarly, it is hard to see how the totali-tarian regime could have managed to instill thrift and indifference to leisure through political indoctrination, especially in coun-tries like East Germany, Czechoslovakia, Hungary, and Poland, where people were overwhelmingly opposed to the commu-nist ideology. It is plausible to assume that the totalitarian past of Eastern Europe contributed to its culture of thrift and hard work in only one way: It kept the region poor. But there must also be something else that explains at least to some extent the observed differences between Latin America and Eurasia on the indicators that are discussed in this chapter.
One possible explanation is provided in Minkov (2009b, 2011) and Hofstede, Hofstede, and Minkov (2010): Countries with a very long history of intensive
agriculture developed a culture of hard work and thrift. This, as well as the oppressive political regimes that inten-sive agriculture fostered in some parts of the world, may explain the low subjec-tive well-being and perception of a lack of life control in Eastern Europe and much of Asia: Populations that must work hard, forgo leisure and pleasure, and strictly follow the orders of their leaders, cannot feel much happiness or life control. Latin America does not seem to have gone through quite the same experience.
■ Notes
1. In the World Values Survey, happi-ness is measured on a Likert scale from 1 to 4, whereas life satisfaction is on a scale from 1 to 10. Scales with more points seem to reduce extreme responding (Harzing et al., 2009; Hui & Triandis, 1989).
2. Subjective well-being has been defined as “a person’s evaluative reaction to his or her life—either in terms of life satisfaction (cogni-tive evaluations) or affect (ongoing emotional reactions)” (Diener & Diener, 1995, p. 653). The two facets have been defined as “cognitive” (or “evaluations of one’s life according to sub-jectively determined standards”) and “hedonic balance” (or “the balance between pleasant affect and unpleasant affect”) (Schimmack, Radhakrishnan, Oishi, Dzokoto, & Ahadi, 2002, p. 582). The cognitive component is also known as “contentment” (Veenhoven, 2007).
3. I was once told by some Nigerian students of management who had never stud-ied psychology or cultural anthropology that happiness and life satisfaction are not neces-sarily the same thing. The students described happiness as having a positive disposition and usually being in a good mood, which is fully compatible with being very displeased with the way things are developing in one’s country; hence, a low life satisfaction. It is quite possible that such a combination of high happiness and

424 ◆ Cultural Differences Across the Globe
low life satisfaction is sometimes found in some African countries.
4. At the national level, World Values Survey measures of happiness and subjective health are highly correlated ( r = .60** to .70**). However, subjective health and life satisfaction produce far lower correlations ( r = .30** to .40**).
5. As noted in 9.4., personal life control should not be confused with Julian Rotter’s
conceptually and statistically scattered and confusing concept of locus of control. In the World Values Survey, a single item measures life control by capturing differences in the degree to which societies give their members personal freedom to act as they please, and especially to indulge in entertainment and leisurely activities. This interpretation of what the life control item measures stems from an analysis of its nomological network.

◆ 425
This section is devoted to some important cultural differences between two major regions of the world. The first is represented
by East Asia: the Chinese speaking countries, South Korea, and Japan. Some European nations, especially those in Eastern Europe, gravitate in the same direction.
The most salient representatives of the second region are the Arab countries. Some other Islamic societies, from Iran to Pakistan, as well as many sub-Saharan African countries and northern Latin America, are also close to them on the cultural characteristics discussed below.
13 CULTURAL DIFFERENCES BETWEEN EAST ASIA AND THE ARAB WORLD

426 ◆ Cultural Differences Across the Globe
◆ Religiousness
The Arab countries typically have the highest scores on measures of religious-ness in the World Values Survey, on items such as the importance of religion or God in one’s life, importance of religious faith as a desirable quality for children, or self-descriptions as “religious persons.” Pakistan and some sub-Saharan African countries often score almost as high as the Arab world, followed by Latin America and parts of Southeast Asia (Indonesia, Philippines). For instance, the percentages of respondents who state that religion is very important to them exceed 90% in most Arab and African countries, as well as Pakistan. These results cannot be explained in terms of extreme response style. Similarly high percentages choose religious faith from a list of values that children should learn.
The lowest scores on measures of reli-giousness are regularly obtained in East Asia, particularly in China and Japan, and in Northern and Eastern Europe, as well as France. In some of these countries, the percentages of people who state that religion is very important to them and the percentages of those who choose religious faith as an important trait for children are about 10% or even lower.
◆ Self-Stability and Self-Consistency
Because the Middle Eastern religions teach the existence of an immutable individual identity and advocate adherence to a wide range of nonnegotiable personal values and beliefs, strong endorsement of any of those religions and their tenets can be viewed as an aspect of self-stability and self- consistency. Thus, nations with higher scores on the importance of religion can be seen as being characterized by greater self-stability and self-consistency (Minkov, 2011).
A number of World Values Survey items are highly correlated with measures of reli-giousness. Many of these items are indica-tive of self-stability and self- consistency as a personal value or as a desirable norm for others: They include a professed inclina-tion to always behave properly, a similar inclination to always try to live up to friends’ expectations, the high importance of tradition as a personal value, the high importance of having ancestors from a country to qualify for citizenship, agree-ment that parents must always do their best for their children rather than have a parallel life of their own, and rejection of divorce. All of these are more strongly endorsed in religious than in secular nations—the highest scores are typically seen in the Arab world and Pakistan. The East Asian and European nations have the lowest scores on these items.
◆ Pride
The World Values Survey measures vari-ous types of pride: national pride as well as the importance of making one’s parents proud. They are strongly correlated; both are associated with the available measures of religiousness as well. Although the Arab countries score very high on these mea-sures of pride, some Latin American coun-tries sometimes outscore them. The lowest scores on pride are regularly obtained in East Asia, where pride is almost a sin, as well as in Northern and Eastern Europe. An explanation of the relation-ship between national measures of pride, religiousness, and self-stability and self-consistency is provided in 9.24.
◆ Demonstration of Personal Superiority
Van de Vliert and Janssen’s (2002) (see 9.12.) study shows that Arab nations have

Cultural Differences Between East Asia and the Arab World ◆ 427
the highest scores in the world on other-referenced performance motivation, that is, the desire to surpass others and dem-onstrate personal superiority. The find-ings of that study are validated by the Organisation for Economic Co-operation and Development Programme for Inter-national Student Assessment (2003), which asked national representative samples of school students if they wished to be among the best in mathematics in their class. Generally, Arabs (as well as Latin Americans) are more likely than East Asians (and East and North Europeans) to make statements that suggest a willingness to demonstrate personal superiority.
◆ Suicide
The Arab countries have the lowest sui-cide rates in the world, whereas Eastern Europe, Japan, and Korea have the high-est. The strong statistical association between suicide rates and measures of religiousness and pride, which define the monumentalism dimension (9.24.; see also Minkov, 2011), suggests that this syn-drome can be seen as a social deterrent of suicide. Suicide rates are highest in secular societies where people tend to lack the social support that religious communities provide, while personal pride and a strong sense of self are suppressed, probably resulting in a feeling of worthlessness and despair in some people.
◆ Personal Dialecticism
The only available large-scale study of personal dialecticism (Schimmack, Oishi, & Diener, 2002, see 9.10.) found that people in the Arab nations, the Anglo countries, and Latin America tend to dis-sociate pleasant and unpleasant emotions, whereas East Asians, and to some extent some Eastern Europeans, do not dissociate them to the same extent.
◆ Social Polarization in Judgments of Political Issues
As we saw in 9.23., East and Southeast Asian nations are least likely to exhibit high social polarization in their statements about current social issues, whereas the Middle Eastern Arab countries are most likely to be highly polarized (Minkov, 2009c). Although current political moods need not be viewed as part of a nation’s culture, the clear geographic contrast that is created by the social polarization index suggests a cultural component, associated with differences in dialecticism.
Thus, communication styles are a cul-tural characteristic. The East Asian nations prefer somewhat ambiguous statements about socially sensitive issues, avoiding a direct clash of opinions. This facilitates reconciliation of opposites. In the Arab world, especially in the Middle East, and in Pakistan, the opposite tendency pre-vails: Strong statements about socially sensitive issues are common even when there is a danger that they will clash with somebody else’s strong statement. The political implications of these cultural differences remain to be explored, but it appears that cultures that do not suppress the expression of a strong stance in the face of somebody else’s strong stance are at a greater risk of internal confrontation.
◆ Educational Achievement
According to the nationally representative TIMSS studies, the East Asian countries consistently have the highest school achieve-ment in mathematics, followed by some Eastern European countries, Belgium, and the Netherlands. Unsurprisingly, the low-est achievement is in sub-Saharan Africa, where school conditions are often dismal and many children are undernourished. But the rich Arab nations, such as Saudi

428 ◆ Cultural Differences Across the Globe
Arabia, Kuwait, and Qatar, score almost like sub-Saharan countries. National dif-ferences in science achievement evidence a similar geographic pattern.
There is a strong negative correlation between a national monumentalism index (indicative of high religiousness and pride) and educational achievement as measured by TIMSS (9.24.). The determination ver-sus stability measure (8.2.9.) has a similar predictive property.
◆ Service to Others
Prior to 2005, the World Values Survey had an item that asked the respondents about the personal importance of service to others (A007). The highest scores on that item are in the Arab world and Latin America, whereas the lowest are in East Asia and parts of Europe. The item is highly and positively correlated with the World Values Survey measures of pride. These correlations suggest that service to others is perceived as an opportunity to boost one’s self-image, pride, and social standing by coming across as an admirable individual. In societies where pride is suppressed, there is a lower perceived need to render services to others. The same transpires from the latest wave of the World Values Survey (2005–2008) in which an item (v84) asks the respondents if they resemble a hypo-thetical person who likes to help others. Helping appears to be most important in the proud and religious nations, such as those of the Arab world and sub-Saharan Africa, least of all in East Asia, Germany, and other European countries.
◆ Origins of the Cultural Differences Between East Asia and the Arab World
There is hardly a single cause of the cul-tural differences between East Asia and the
Arab world. Inglehart and Baker (2000) found that traditional values, including religiousness, are more common in societ-ies where high percentages are employed in agriculture rather than industry. National differences in education are also obvi-ously involved: They are both a result and a cause of cultural differences. Although monumentalism may depress interest in some types of modern education, it is most probably also caused by poor education.
However, these explanations are not sufficient. East Asia and the Arab world were culturally distinct in the Middle Ages and even earlier, when there was no indus-try and no modern education (Minkov, 2011). Still, the Middle East generated absolutist religions, whereas India and East Asia shared a tradition that blurred the boundaries between religion and athe-ist philosophy and often sought dialectical reconciliation of conflicting views.
Medieval Arab culture strongly empha-sized self-stability and self-consistency. It did not allow the production of likenesses, the use of masks, the staging of theatri-cal performances, and the consumption of alcohol. All of these activities were viewed as harmful as they encouraged personal duality or behavioral inconsistency. In the same vein, the Qur’an explicitly condemns the Christian idea of a God with three faces—Father, Son, and Holy Spirit—and states that there is only one Allah who is a single entity. Conversely, East Asia always allowed some forms of personal duality. The medieval East Asian languages had, and some still maintain, different forms of self-reference, depending on the social situation. There is no one single “I”; how one presents oneself depends on who one is talking to.
It is possible that at least some of the old cultural differences between the Arab world and East Asia stem from the prac-tice of pastoralism, traditionally common in North Africa and the Middle East, ver-sus wet rice cultivation (Minkov, 2009c, 2011). Pastoralists’ clans often clash with each other or with agriculturalists because they compete for pastures or cross arable land. For that reason, pastoralists need to

Cultural Differences Between East Asia and the Arab World ◆ 429
be ready to stand their ground, verbally and physically, and maintain a culture of honor (Nisbett & Cohen, 1996). They are more likely than farmers to be outspoken and use insults (Edgerton, 1974; Nisbett & Cohen, 1996). Further, Uskul et al. (2008) found that farmers tend to have holistic cognition, whereas herders prefer absolutist categorizations.
On the other hand, wet rice cultiva-tion is a collective activity. It involves the maintenance of a complex irrigation system that is often jointly managed by several villages. This teamwork requires the ability to adapt to others, a tendency to refrain from strong statements on sensitive issues, and the skill to reconcile differences.

Although many of the Arab nations geographically share the African continent with the peoples of sub-Saharan Africa, their cultures are
markedly different in terms of a number of interrelated characteristics. Other regions of the world also exhibit somewhat similar contrast: The northern Latin American countries resemble those of sub-Saharan Africa on some of the cultural traits discussed here, whereas East Asia and many of the European nations gravitate toward the Arab world. Yet, a focus on the cultural contrast between Arab and sub-Saharan countries is appropriate for a number of reasons. These two regions of the world evi-dence some of the starkest differences in the way in which human soci-eties regulate sexual relationships. The consequences of these different systems of regulation are extremely important. They make North Africa and the sub-Saharan region two very different cultural realms. These cul-tural differences do not stem from differences in economic development, which is all the more remarkable. This is an illustration of the fact that not all prominent cultural contrasts are attributable to unequal societal wealth. A comparison between the Arab world and sub-Saharan Africa may be the best example of how the cultures of some modern developing nations may still carry the marks of the traditional subsistence patterns that have prevailed in them for thousands of years.
14 CULTURAL DIFFERENCES BETWEEN THE ARAB WORLD AND SUB-SAHARAN AFRICA
430 ◆

Cultural Differences Between the Arab World and Sub-Saharan Africa ◆ 431
◆ Sexual Networking and HIV Rates
A number of studies by Australian demog-rapher John Caldwell and by African scholars from various countries attribute the sub-Saharan HIV pandemic to exten-sive heterosexual networking, sometimes coupled with a conscious disregard for the danger it involves (for a review, see Minkov, 2011). The fact that polygyny is still widespread in sub-Saharan Africa, and the practice of maintaining parallel extramarital relationships, are important factors, in the spreading of the HIV virus throughout the subcontinent. 1
Poor education has also contributed to the HIV situation in sub-Saharan Africa, yet it is not a sufficient factor. The exam-ple of the Arab countries, the Middle East, and Pakistan show that a low average national education does not guarantee an HIV pandemic. From North Africa to Pakistan, and even beyond, sexual net-working is rare. This has helped contain the spread of the virus, resulting in HIV rates that are similar to those of the richest nations with the best modern education.
◆ Adolescent Fertility Rates
Adolescent fertility rates—defined as the annual number of live births to women ages 15 to 19 years per 1,000 women—are very low in all developed nations, although the rates are not quite the same in all of them. Across the developing world, the observed differences are enor-mous. Some Arab countries, for instance, Tunisia and Algeria, have rates that are as low as those of the average West European countries: 6 or 7. Yemen has the highest expected rate for 2010–2015 among the Arab countries: 58. In many sub-Saharan African countries, adolescent fertility rates for the same period exceed 100 (UN Statistics Division, 2010).
◆ Mating Competition
Mating competition theory is explained in 9.25. HIV and adolescent fertility rates can be considered indicators of mating compe-tition: high in sub-Saharan Africa and to some extent in northern Latin America, low in the Arab world, the Middle East, and Pakistan. Mating competition reduces the age at which it is socially acceptable to have sex and children; hence, it boosts adolescent fertility.
Dress codes for women in the Arab world, and the usual segregation of men and women in public places, also suggest attempts to curb free mating competition, as opposed to the situation in preindustrial sub-Saharan Africa and the Americas: greater nudity and mixing of the sexes in public.
◆ Murder Rates
The sub-Saharan African countries and northern Latin America have the high-est murder rates in the world, whereas the Arab countries have some of the lowest (Fajnzylber et al., 1998; Minkov, 2011, based on data from the UN Office on Drugs and Crime, 2010). The high correlations that this social indicator yields with measures of mating competi-tion (Minkov, 2011), and the findings of numerous scholars who have studied this association across various societies, dem-onstrate that intracommunal violence can indeed be related to mating competition.
◆ Socioeconomic Inequality
Some sub-Saharan and Latin American countries have the highest socioeconomic inequality in the world, whereas the Arab world and Pakistan are considerably more egalitarian (UN Development Programme,

432 ◆ Cultural Differences Across the Globe
2007/2008). As noted in 9.25., socio-economic inequality has been linked to intrasocietal violence. Yet although Gini coefficients and murder rates are positively correlated across modern nations, the strain theory that attempts to explain the mechanism of this association has encoun-tered some serious problems. Although the matter will certainly continue to generate controversies, the fact that the highest murder rates occur in preindustrial societ-ies with very little socioeconomic inequal-ity, or none at all, is a serious challenge to the theory that attempts to explain dif-ferences in murder rates as a function of psychological strain from socioeconomic inequality.
◆ Origins of the Cultural Differences Between the Arab Countries and Sub-Saharan Africa
The origins of the currently observed national differences on the hypometropia dimension, reflecting societal differences in mating competition (9.25., Minkov, 2011) can be tentatively explained in different ways. I refer to evidence show-ing that the dimension’s index is closely associated with societal differences in lon-gevity: Societies with shorter average life spans are more likely to have intense mat-ing competition and accept the risks that it is associated with. Under specific circum-stances, this is a winning survival strategy for a community, even if it is detrimental to some or most of its individual members. In a physical environment with many communicable diseases, malnutrition, and frequent accidents, it may be functional to compete for early and abundant procre-ation than adopt a seemingly more pru-dent strategy: curb mating competition, postpone birth giving, and run the risk of having too few children who may not reach adulthood. In an environment where
life spans are very short, a seemingly short-term vision is more functional for the society as a whole because it ensures its long-term survival.
Additionally, as explained in 9.25. and Minkov (2011), strong mating competi-tion and the violence with which it is associated can be viewed as a fitness contest from an evolutionary viewpoint. In an environment where lethal com-municable diseases are common, mating competition can be beneficial because it results in genetic variety (Barber, 2008a; Read, 1991). Yet, mating competition may not bestow the same benefits in the habitat where Arab culture originated. Historically, the prevalence of commu-nicable diseases in the Middle East was much lower than in sub-Saharan Africa (data from Murray & Schaller, 2010). Consequently, Arab culture could afford to curtail mating competition.
It would be too simplistic to attribute differences in hypometropia and mating competition solely to the physical environ-ment. A clue to the origin of these differ-ences may also be provided by the type of economy that traditionally prevailed in the Middle East and North Africa (as well as most of Eurasia) versus sub-Saharan Africa (and in most parts of the Americas). The first of these two regions relied on a combination of intensive agriculture and pastoralism, less on horticulture, and very little on hunting-gathering. Sub-Saharan Africa relied heavily on horticulture, some hunting-gathering and pastoralism, and not at all on intensive agriculture. The link between mating systems and type of economy is well established in the anthro-pology literature (Fisher, 1992; Marlow, 2000, 2003). Horticulture has been asso-ciated with greater female provisioning. This makes females economically valuable and encourages mating competition that often turns violent: Men fight to eliminate other men and acquire more women. A greater number of spouses or concubines means better reproductive opportunities as well as a higher socioeconomic status.

Cultural Differences Between the Arab World and Sub-Saharan Africa ◆ 433
Intensive agriculture has been associ-ated with the opposite trend. Plowing and building irrigation systems requires greater physical strength than horticulture. As a result, women are less likely to participate in provisioning activities. They lose their economic freedom, and men can control their sexuality more easily by keeping them away from other men. Also, intensive agriculture consumes more time and effort than horticulture (Ember & Ember, 1992), leaving less time for activities related to mating competition. Paternal provision-ing becomes essential for the survival of the family and the whole community. As women provide less food than men, the latter can ill afford to maintain several wives or concubines.
The observed modern differences in hypometropia and mating competition pro-vide fairly clear testimony to the cultural legacy of the prevalent type of economy in
a particular society. Other dimensions of culture can also be hypothetically associ-ated with various types of economy; for instance, universalism may be boosted by the rise of the service sector. Yet, it is hard to think of a dimension of culture, other than hypometropia, whose roots—although reaching far back in history—have been largely unearthed by the collec-tive efforts of many anthropologists.
■ Note
1. Helleringer and Kohler (2007) disputed the claim made by some authors that sexual networks in rural sub-Saharan Africa are too sparse to sustain an HIV epidemic. Their study of Likoma Island, Malawi, revealed widespread sexual networking among village populations.

◆ Exhibit 1: The 10 Values for Children in the World Values Survey
The World Values Survey respondents are presented with a list of 10 items (or more in some survey rounds) describing values that might be important for children. The respondents are asked to choose up to five of those items.
In the 2005–2008 survey, the codes of the variables start with a “v,” whereas those from the previous surveys start with an “A.”
1. v12 and A029: independence
2. v13 and A030: hard work
3. v14 and A032: feeling of responsibility
4. v15 and A034: imagination
5. v16 and A035: tolerance and respect for other people
6. v17 and A038: thrift: saving money and things
7. v18 and A039: determination/perseverance
8. v19 and A040: religious faith
9. v20 and A041: unselfishness
10. v21 and A042: obedience
For each country, each item score is the percentage of respondents that have chosen that item.
The table below presents country scores on these items (numbered from 1 to 10) for each of the 43 World Values Survey countries that were
APPENDIX
434 ◆

studied in 2005–2008 and at least once between 1994 and 2004. Each country score for each item is an average of the 2005–2008 country score on that item and the country score from the latest available study in the same country from the 1994–2004 period. The data are from the Online Analysis section of the official World Values Survey website: www.worldvaluessurvey.com.
For expansions of the abbreviated country names, see Exhibit 6 below.
1 2 3 4 5 6 7 8 9 10
ARGN 40.25 56.10 74.50 48.90 70.45 15.35 23.65 34.00 10.70 39.65
AUST 58.45 41.90 69.40 69.70 86.10 26.20 43.60 21.10 46.80 32.95
BRAZ 24.25 54.05 71.40 34.50 62.05 33.65 33.00 56.45 36.35 57.65
BULG 44.50 86.50 75.10 36.80 56.10 40.50 55.95 16.40 32.40 20.05
CANA 60.20 53.45 74.40 66.70 81.60 26.90 48.35 30.60 46.10 29.85
CHIL 46.50 25.85 83.40 61.40 77.55 35.95 44.90 38.95 33.00 53.35
CHIN 74.75 88.00 67.15 58.50 66.80 59.95 30.60 2.75 35.95 14.70
COLO 40.25 56.10 74.50 48.90 70.45 15.35 23.65 34.00 10.70 39.65
EGPT 58.45 41.90 69.40 69.70 86.10 26.20 43.60 21.10 46.80 32.95
FINL 63.55 13.65 88.30 66.10 84.35 24.65 57.40 13.90 25.50 31.65
FRAN 33.25 56.35 76.30 43.30 86.10 40.25 46.35 8.45 37.35 38.55
GEOR 52.40 86.00 74.65 20.10 63.35 30.60 31.65 49.40 18.40 22.45
GERM 74.25 25.80 85.20 69.90 71.10 38.80 53.20 13.70 6.50 12.55
INDI 61.70 83.10 68.00 53.70 59.50 58.65 43.55 43.95 35.50 55.80
INDN 79.60 63.05 83.35 47.30 61.00 49.75 42.60 91.85 40.05 53.30
IRAN 58.45 65.45 76.95 28.80 62.05 34.40 29.35 71.15 30.85 36.90
ITAL 50.00 37.70 84.65 27.20 74.45 37.05 39.20 32.90 42.80 26.95
JAPN 81.25 29.75 91.05 65.80 72.85 50.20 68.10 6.05 51.95 4.70
JORD 31.90 43.25 62.60 23.20 70.90 21.35 24.10 84.20 44.70 55.40
KORE 72.80 72.35 91.70 49.00 60.35 70.15 43.70 18.90 13.20 11.85
MEXC 41.85 27.20 77.60 49.20 74.35 39.35 34.60 45.95 48.70 58.90
MOLD 50.30 83.35 76.10 47.20 72.20 47.65 29.25 42.10 21.90 29.00
MORC 44.15 57.85 65.40 37.90 66.45 40.30 21.65 78.70 22.75 54.15
NETH 60.30 21.95 88.90 59.70 78.55 31.60 35.85 9.75 26.60 33.45
NEWZ 54.50 39.10 62.20 64.30 80.20 29.20 44.00 15.25 36.40 23.15
NORW 89.90 11.80 91.30 92.00 79.30 13.65 39.15 10.20 15.65 27.50
PERU 33.10 56.75 76.30 35.70 69.40 17.35 25.45 50.45 55.20 57.55
POLN 31.65 53.45 77.00 33.10 82.20 45.90 30.25 44.45 15.15 40.55
(Continued)
Appendix ◆ 435

436 ◆ Cross-Cultural Analysis
ROMN 29.70 82.60 66.05 32.00 58.45 41.85 24.50 60.90 15.20 18.15
RUSS 36.15 89.25 78.10 21.20 67.35 51.70 46.80 9.55 20.10 35.15
SAFR 60.65 73.30 57.00 35.50 75.70 37.00 37.70 58.30 29.90 49.10
SERB 62.55 71.10 69.50 32.20 64.20 32.80 44.80 22.80 33.75 38.20
SLVN 77.80 31.50 75.35 28.90 72.55 37.90 58.55 17.15 38.00 28.20
SPAI 38.05 65.75 75.15 45.70 74.30 25.15 30.15 15.80 17.90 42.85
SWED 73.10 7.05 89.15 97.50 93.05 34.60 39.15 5.35 33.80 14.45
SWIT 60.15 33.10 85.50 71.50 85.00 28.65 57.60 16.70 22.10 22.30
TAIW 73.30 48.25 86.60 32.70 69.60 58.20 34.60 8.70 25.80 24.40
TURK 27.45 76.50 68.95 45.40 63.35 34.25 29.50 48.05 28.70 46.10
BRIT 56.05 41.60 58.45 75.80 84.45 28.95 39.40 17.95 57.50 47.60
UKRN 30.30 82.20 71.15 39.60 61.10 45.45 47.40 16.60 14.45 42.20
URUG 49.25 25.50 80.55 63.20 75.85 24.85 40.50 17.85 58.05 33.75
USA 57.60 61.20 72.20 61.90 79.25 26.55 42.20 51.35 38.40 30.35
VIET 57.95 82.20 72.90 36.60 59.15 54.00 56.00 7.15 36.35 44.15
◆ Exhibit 2: Self-Descriptions in the World Values Survey
As some of the relevant self-description items were asked only in 2005–2008, only World Values Survey data from that period were used. The items in the following section seem to target stable personal characteristics:
v10: Respondents describe personal happiness on a four-point scale: (1) Very happy; (2) Quite happy; (3) Not very happy; (4) Not at all happy.
v46: Respondents describe a perception of free choice and control over personal life on a 10-point scale, ranging from (1) None at all, to (10) A great deal.
v65: Respondents express agreement or disagreement with the statement “I seek to be myself rather than follow others” on a four-point scale: (1) Agree strongly; (2) Agree; (3) Disagree; (4) Strongly disagree.
v66: Respondents express agreement or disagreement with the statement “I make a lot of efforts to live up to what my friends expect” on a four-point scale: (1) Agree strongly; (2) Agree; (3) Disagree; (4) Strongly disagree.
v127: Respondents describe how much they trust people that they know on a four-point scale: (1) Trust completely; (2) Trust a little; (3) Not trust very much; (4) Not trust at all.
(Continued)

v187: Respondents describe themselves through a forced choice as “a religious person,” “not a religious person,” or “a convinced atheist.”
v209: Respondents describe how proud they are of their nationality on a four-point scale: (1) Very proud; (2) Quite proud; (3) Not very proud; (4) Not at all proud.
Each variable was split into two variables, using the following scoring principles (see 7.2.4.3.):
v10: percentages “very happy,” coded HAPPY; percentages “not very happy,” coded UNHAPPY
v46: sum of percentages who chose positions 9 and 10 coded FREE; sum of percent-ages who chose positions 1, 2, 3, and 4, coded CONSTRAINED
v65: percentages that “agree strongly,” coded INVARIANT; percentages who “dis-agree,” coded ADAPTABLE
v66: percentages that “agree strongly,” coded CONSISTENT; percentages who “dis-agree,” coded FLEXIBLE
v127: percentages that “trust completely,” coded TRUSTING; percentages who do “not trust very much,” coded DISTRUSTFUL
v187: percentages “religious person,” coded RELIGIOUS; percentages “convinced atheist,” coded ATHEIST
v209: percentages “very proud,” coded PROUD; percentages “not very proud,” coded HUMBLE.
The data can be downloaded free of charge from the World Values Survey official website: www.worldvaluessurvey.com.
◆ Exhibit 3: The Six Personal Values in theWorld Values Survey
The World Values Survey respondents are presented with six values and asked to indicate on a four-point Likert scale how important they are in their lives: (1) Very important; (2) Rather important; (3) Not very important; (4) Not at all important. The six values are provided with the codes from their source—the 2005–2008 survey:
v4: family
v5: friends
v6: leisure time
v7: politics
v8: work
v9: religion
Appendix ◆ 437

438 ◆ Cross-Cultural Analysis
◆ Exhibit 4: The 10 SchwartzValues in the World Values Survey
In the 2005–2008 World Values Survey, the respondents were presented with 10 descrip-tions of hypothetical individuals and asked to describe how much that person resembles them on a six-point Likert scale: (1) Very much like me; (2) Like me; (3) Somewhat like me; (4) A little like me; (5) Not like me; (6) Not at all like me. The 10 descriptions are provided in a slightly paraphrased form with their item codes in the World Values Survey:
1. v80: It is important to this person to think up new ideas and be creative
2. v81: It is important to this person to be rich
3. v82: It is important to this person to be living in secure surroundings
4. v83: It is important to this person to have a good time
5. v84: It is important to this person to help the people nearby
6. v85: It is important to this person to be very successful
7. v86: It is important to this person to be adventurous and take risks
8. v87: It is important to this person to always behave properly
9. v88: It is important to this person to look after the environment
10. v89: It is important to this person to respect tradition
◆ Exhibit 5: GNI per Person at PPP in 1998 and GNI per Person at PPP Growth From 1998 to 2008 for 43 Countries
For expansions of the abbreviated country names, see Exhibit 6 below.
GNI per Person at PPP in 1998, U.S.
Dollars
GNI per Person at PPP Growth
1998–2008
ARGN 9140 1.53
AUST 22820 1.46
BRAZ 6510 1.55
BULG 5210 2.29
CANA 24630 1.47
CHIL 8630 1.54
CHIN 1950 3.09

COLO 5650 1.51
EGPT 3200 1.71
FINL 22140 1.61
FRAN 23620 1.46
GEOR 1960 2.47
GERM 24000 1.50
INDI 1350 2.19
INDN 2120 1.81
IRAN 6320 1.72
ITAL 23570 1.28
JAPN 24310 1.45
JORD 2950 1.87
KORE 13420 2.10
MEXC 7880 1.81
MOLD 1260 2.55
MORC 2500 1.73
NETH 25230 1.65
NEWZ 17790 1.41
NORW 27110 2.16
PERU 4580 1.74
POLN 9310 1.86
ROMN 5290 2.55
RUSS 5990 2.61
SAFR 6160 1.59
SERB 6720 1.66
SLVN 15620 1.72
SPAI 18710 1.66
SWED 23920 1.60
SWIT 31210 1.49
TAIW NA NA
TURK 8220 1.68
BRIT 23190 1.56
UKRN 2870 2.51
URUG 8260 1.52
USA 31650 1.48
VIET 1210 2.23
Appendix ◆ 439

440 ◆ Cross-Cultural Analysis
◆ Exhibit 6: Abbreviations of Country Names Used in Graphs and Tables
ARGN ArgentinaAUST AustraliaBRAZ Brazil BULG BulgariaBURK Burkina Faso CANA Canada CHIL Chile CHIN China COLO Colombia EGPT EgyptETHI EthiopiaFINL FinlandFRAN FranceGEOR GeorgiaGERM GermanyGHAN GhanaGUAT GuatemalaINDI IndiaINDN IndonesiaIRAN IranITAL ItalyJAPN JapanJORD Jordan KORE South KoreaMALI Mali MEXC Mexico MOLD Moldova MORC Morocco NETH Netherlands NEWZ New Zealand NORW NorwayPERU Peru POLN Poland ROMN Romania RUSS RussiaRWAN Rwanda SAFR South Africa SERB Serbia SLVN Slovenia SPAI Spain SWED Sweden SWIT Switzerland TAIW Taiwan TURK Turkey BRIT United Kingdom

Appendix ◆ 441
UKRN UkraineURUG UruguayUSA United StatesVIET VietnamZAMB Zambia

442 ◆
Aaker, J. (1997). Dimensions of brand personality. Journal of Marketing Research, 34(3), 347–356.
Aaker, J. L., Benet-Martinez, V., & Garolera, J. (2001). Consumption sym-bols as carriers of culture: A study of Japanese and Spanish brand per-sonality constructs. Journal of Personality and Social Psychology, 81(3), 492–508.
Adler, N. J. (1983). A typology of management studies involving culture. Journal of International Business Studies, 14(2), 29–47.
Agnew, R. (1992). Foundation for a general strain theory. Criminology, 30(1), 47–87.
Agnew, R. (1999). A general strain theory of community differences in crime rates. Journal of Research in Crime and Delinquency, 36(2), 123–155.
Agnew, R., & White, H. R. (1992). An empirical test of general strain theory. Criminology, 30(4), 475–499.
Ailon, G. (2008). Mirror, mirror on the wall: Culture’s consequences in a value test of its own design. Academy of Management Review, 33, 885–904.
Albert, S. (1977). Temporal comparison theory. Psychological Review, 84(6), 485–503.
Albores-Gallo, L., Fernandez-Guasti, A., Hernandez-Guzman, L., & List-Hilton, C. (2009). 2D:4D finger ratios and language development. Revista de Neurologia, 48(11), 577–581.
Alexander, A. C., & Welzel, C. (2011). Islam and patriarchy: How robust is Muslim support for patriarchal values? World Values Research, 4(2), 40–70.
Allen, D. B., Miller, E. D., & Nath, R. (1988). North America. In R. Nath (Ed.), Comparative management (pp. 23–54). Cambridge, MA: Ballinger.
Allik, J., & McCrae, R. R. (2004). Towards a geography of personality traits: Patterns of profiles across 36 cultures. Journal of Cross-Cultural Psychology, 35(1), 13–28.
REFERENCES

REFERENCES ◆ 443
Allik, J., Realo, A., Mottus, R., Pullmann, H., Trifonova, A., McCrae, R. R., et al. (2011). Personality profiles and the “Russian soul”: Literary and scholarly views evaluated. Journal of Cross-Cultural Psychology, 42(3), 372–389.
Alonso-Arbiol, I., van de Vijver, F. J. R., Fernandez, I., Paez, D., Campos, M., & Carrera, P. (2011). Implicit theories about interrelations of anger components in 25 countries. Emotion, 11(1), 1–11.
Amnesty International. (2009). Abolitionist and retentionist countries. Retrieved April 1, 2010, from http://www.amnesty.org/en/death-penalty/abolitionist-and-retentionist-countries.
Amponsah, B., & Krekling, S. (1997). Sex differences in visual-spatial performance among Ghanaian and Norwegian adults. Journal of Cross-Cultural Psychology, 29(1), 81–92.
Amuyunzu-Nyamongo, M., Tendo-Wambua, L., Babishangire, B., Nyagero, J., Yitbarek, N., Matasha, M., et al. (1999). Barriers to behaviour change as a response to STD including HIV/AIDS: The East African experience. In J. C. Caldwell et al. (Eds.), Resistances to behavioural change to reduce HIV/AIDS infection in predominantly heterosexual epidemics in Third World countries (pp. 1–11). Canberra: Australian National University.
Arvey, R., et al. (1994). Mainstream science on intelligence. Wall Street Journal, December 13, 1994, p. A18.
Ashkanasy, N. M., Gupta, V., Mayfield, M. S., & Trevor-Roberts, E. (2004). Future orientation. In R. J. House, P. J. Hanges, M. Javidan, P. W. Dorfman, & V. Gupta (Eds.), Culture, leader-ship, and organizations: The GLOBE study of 62 societies (pp. 282–342). Thousand Oaks, CA: Sage.
Ashkanasy, N. M., Wilderom, C. P. M., & Peterson, M. F. (Eds.). (2000). Handbook of organiza-tional culture and climate. Thousand Oaks, CA: Sage.
Au, K. Y. (2000). Intra-cultural variation as another construct of international management: A study based on secondary data of 42 countries. Journal of International Management, 6(3), 217–238.
Avison, W. R., & Loring, P. L. (1986). Population diversity and cross-national homicide: The effects of inequality and heterogeneity. Criminology, 24(4), 733–749.
Awusabo-Asare, K., Abane, A. M., Badasu, D. M., & Anarfi, J. (1999). “All die be die”: Obstacles to change in the face of HIV infection in Ghana. In J. C. Caldwell et al. (Eds.), Resistances to behavioural change to reduce HIV/AIDS infection in predominantly heterosexual epidemics in Third World countries (pp. 125–132). Canberra: Australian National University.
Bang, A. K., Carlsen, E., Holm, M., Petersen, J. H., Skakkebæk, N. E., & Jørgensen, N. (2005). A study of finger lengths, semen quality and sex hormones in 360 young men from the general Danish population. Human Reproduction, 20(11), 3109–3113.
Barash, D. P. (2005). Sex differences: Empiricism, hypothesis testing, and other virtues. Behavioral and Brain Sciences, 28(2), 276–277. (Open peer commentary to Schmitt, 2005)
Barber, N. (2006). Why is violent crime so common in the Americas? Aggressive Behavior, 32(5), 442–450.
Barber, N. (2007). Evolutionary explanations for societal differences and historical change in vio-lent crime and single parenthood. Cross-Cultural Research, 41(2), 123–148.
Barber, N. (2008a). Explaining cross-national differences in polygyny intensity: Resource-defense, sex ratio, and infectious diseases. Cross-Cultural Research, 42(2), 103–117.
Barber, N. (2008b). The myth of culture: Why we need a genuine natural science of societies. Cambridge, UK: Cambridge Scholars Publishing.
Baskerville, R. F. (2003). Hofstede never studied culture. Accounting, Organizations and Society, 28(1), 1–14.
Bastos-Rodriguez, L., Pimenta, J. R., & Pena, S. D. (2006). The genetic structure of human popu-lations studied through short insertion-deletion polymorphisms. Annals of Human Genetics, 70, 658–665.

444 ◆ Cross-Cultural Analysis
Batzer, M. A., Arcot, S. S., Phinney, J. W., Alegria-Hartman, M., Kass, D. H., Milligan, S. M., et al. (1996). Genetic variation of recent Alu insertions in human populations. Journal of Molecular Evolution, 42(1), 22–29.
Benedict, R. (1959). Patterns of culture. New York: New American Library.Berry, H., Guillen, M. F., & Zhou, N. (2010). An institutional approach to cross-national distance.
Journal of International Business Studies, 41(9), 1460–1480.Berry, J. W. (1969). On cross-cultural comparability. International Journal of Psychology, 4, 119–128.Berry, J. W. (1990). Imposed etics, emics, derived etics: Their conceptual and operational status in
cross-cultural psychology. In T. N. Headland, K. L. Pike, & M. Harris (Eds.), Emics and etics: The insider/outsider debate (pp. 28–47). Newbury Park, CA: Sage.
Berry, J. W. (1997). An ecocultural approach to the study of cross-cultural industrial/organizational psychology. In P. C. Early & M. Erez (Eds.), New perspectives on international industrial/organizational psychology (pp. 130–147). San Francisco: New Lexington Press.
Bhattacharyya, S. (2004). Deep determinants of economic growth. Applied Economic Letters, 11, 587–590.
Bigoness, W. J., & Blakely, G. L. (1996). A cross-national study of managerial values. Journal of International Business Studies, 27(4), 739–752.
Blake, R. R., & Mouton, J. S. (1964). The managerial grid. Houston, TX: Gulf.Bleichrodt, N., Hoksbergen, R. A. C., & Khire, U. (1999). Cross-cultural testing of intelligence.
Cross-Cultural Research, 33(1), 3–25.Boas, F. (1896). The limitations of the comparative method of anthropology. Science, 18(4),
901–908.Bond, M. H. (2002). Reclaiming the individual from Hofstede’s ecological analysis—A 20-year
odyssey: Comment on Oyserman et al. (2002). Psychological Bulletin, 128(1), 73–77.Bond, M. H., & Cheung, T. S. (1983). College students’ spontaneous self-concept: The effect of
culture among respondents in Hong Kong, Japan, and the United States. Journal of Cross-Cultural Psychology, 14(2), 153–171.
Bond, M. H., Leung, K., Au, A., Tong, K.-K., Reimel de Carrasquel, S., Murakami, F., et al. (2004). Culture-level dimensions of social axioms and their correlates across 41 cultures. Journal of Cross-Cultural Psychology, 35(5), 548–570.
Bond, N. W. (2005). Who’s zooming who? Behavioral and Brain Sciences, 28(2), 278. (Open peer commentary to Schmitt, 2005)
Borg, I., & Groenen, P. J. F. (2005). Modern multidimensional scaling: Theory and applications. New York: Springer.
Boring, E. G. (1923). Intelligence as the tests test it. New Republic, 36(June), 35–37.Born, M. P., Bleichrodt, N., & van der Flier, H. (1987). Cross-cultural comparison of sex-related
differences on intelligence tests: A meta-analysis. Journal of Cross-Cultural Psychology, 18(3), 283–314.
Boster, J. S., & Maltseva, K. (2006). A crystal seen from each of its vertices: European views of European national characters. Cross-Cultural Research, 40(1), 47–64.
Bovenkerk, F., & Brunt, L. (1976). Binnenstebuiten en ondersteboven: De antropologie van de industriele samenleving [Inside out and upside down: The anthropology of industrial society]. Assen, Netherlands: Van Gorcum.
Boyacigiller, N. A., & Adler, N. J. (1991). The parochial dinosaur: Organizational science in a global context. Academy of Management Review, 16(2), 262–290.
Boyacigiller, N. A., Kleinberg, M. J., Phillips, M. E., & Sackman, S. A. (2007). Conceptualizing culture: Elucidating the streams of research in international cross-cultural management. In B. J. Punnett & O. Shenkar (Eds.), Handbook for international management research (2nd ed., pp. 99–167). Ann Arbor: University of Michigan Press.

References ◆ 445
Braithwaite, J., & Braithwaite, V. (1980). The effect of income inequality and social democracy on homicide: A cross-national comparison. British Journal of Criminology, 20(1), 45–53.
Brown, D. E. (1991). Human universals. New York: McGraw-Hill.Brown, J. D. (2003). The self-enhancement motive in collectivist cultures: The rumors of my death
have been greatly exaggerated. Journal of Cross-Cultural Psychology, 34(5), 603–605.Brown, T. (2006). Confirmatory factor analysis for applied research. New York: Guilford.Bryman, A., & Bell, E. (2007). Business research methods. New York: Oxford University Press.Burns, T., & Stalker, G. M. (1961). The management of innovation. London: Tavistock.Buss, D. M. (1989). Sex differences in human mate preferences: Evolutionary hypotheses tested in
37 cultures. Behavioral and Brain Sciences, 12, 1–49.Buss, D. M., & Duntley, J. D. (2003). Homicide: An evolutionary psychological perspective and
implications for public policy. In R. W. Bloom & N. Dess (Eds.), Evolutionary psychology and violence: A primer for policy makers and public policy advocates (pp. 115–128). Westport, CT: Praeger.
Butchart, A., & Engstrom, K. (2002). Sex- and age-specific relations between economic develop-ment, economic inequality and homicide rates in people aged 0–24 years: A cross-sectional analysis. Bulletin of the World Health Organization, 80(10), 797–805.
Caldwell, J. C. (2000). Rethinking the African AIDS epidemic. Population and Development Review, 26(1), 117–135.
Caldwell, J. C. (2002). The African AIDS epidemic: Reflections on a research program. Journal of Population Research, 19(2), 173–190.
Carl, D., Gupta. V., & Javidan, M. (2004). Power distance. In R. J. House, P. J. Hanges, M. Javidan, P. W. Dorfman, & V. Gupta (Eds.), Culture, leadership, and organizations: The GLOBE study of 62 societies (pp. 513–563). Thousand Oaks, CA: Sage.
Carneiro, R. L. (1962). Scale analysis as an instrument for the study of cultural evolution. Southwestern Journal of Anthropology, 18(2), 149–169.
Carneiro, R. L., & Brown, B. J. (2007). Foreword. In L. A. White (Ed.), The evolution of culture: The development of civilization to the fall of Rome (pp. ix–xviii). Walnut Creek, CA: Left Coast Press.
Cattell, R. B. (1949). The dimensions of culture patterns by factorization of national character. Journal of Abnormal and Social Psychology, 44(4), 443–469.
Cattell, R. B., Breul, H., & Hartman, H. P. (1952). An attempt at a more refined definition of the cultural dimensions of syntality in modern nations. American Sociological Review, 17(4), 408–421.
Cattell, R. B., & Gorsuch, R. L. (1965). The definition and measurement of national morale and morality. Journal of Social Psychology, 67(1), 77–96.
Ceci, S. J. (1996). On intelligence: A bioecological treatise on intellectual development. Cambridge, MA: Harvard University Press.
Chambers, R. (2008). Revolutions in development inquiry. London: Earthscan.Chang, F. M., Kidd, J. R., Livak, K. J., Pakstis, A. J., & Kidd, K. K. (1996). The world-wide dis-
tribution of allele frequencies at the human dopamine D4 receptor locus. Human Genetics, 98(1), 91–101.
Chang, H. (2009). Operationalism. In E. N. Zalta (Principal Ed.), Stanford encyclopedia of philoso-phy. Retrieved November 28, 2010, from http://plato.stanford.edu/entries/operationalism/.
Chang, S. J., van Witteloostuijn, A., & Eden, L. (2010). From the editors: Common method variance in international business research. Journal of International Business Studies, 41(2), 178–184.
Chasiotis, A. (2011). Evolution and culture. On-line Readings in Psychology and Culture. Retrieved October 28, 2012, from http://scholarworks.gvsu.edu/orpc/v019/iss1/1.

446 ◆ Cross-Cultural Analysis
Cherlin, A., & Brookover-Bourque, L. (1974). Dimensionality and reliability of the Rotter I-E scale. Sociometry, 37(4), 565–582.
Cheung, F. M., & Leung, K. (1998). Indigenous personality measures: Chinese examples. Journal of Cross-Cultural Psychology, 29(1), 233–248.
Cheung, F. M., Leung, K., Fan, R. M., Song, W. Z., Zhang, J. X., & Zhang, J. P. (1996). Development of the Chinese Personality Assessment Inventory. Journal of Cross-Cultural Psychology, 27(2), 181–199.
Ch eung, F. M., Leung, K., Zhang, J. X., Sun, H. F., Gan, Y. Q., Song, W. Z., & Xie, D. (2001). Indigenous Chinese personality constructs: Is the Five-Factor Model complete? Journal of Cross-Cultural Psychology, 32(4), 407–433.
Cheung, G. W., & Rensvold, R. B. (2000). Assessing extreme and acquiescence response sets in cross-cultural research using structural equations models. Journal of Cross-Cultural Psychology, 31(2), 187–212.
Chiao, J. Y., & Ambady, N. (2007). Cultural neuroscience: Parsing universality and diversity across levels of analysis. In S. Kitayama & D. Cohen (Eds.), Handbook of cultural psychology (pp. 237–254). New York: Guildford.
Chiao, J. Y., & Blizinsky, K. D. (2010). Culture–gene coevolution of individualism–collectivism and the serotonin transporter gene. Proceedings of the Royal Society B, 277(1681), 529–537.
Child, J. (1981). Culture, contingency and capitalism in the cross-national study of organizations. Research in Organizational Behavior, 3(1), 303–356.
Chinese Culture Connection. (1987). Chinese values and the search for culture-free dimensions of culture. Journal of Cross-Cultural Psychology, 18(2), 143–164.
Choi, I., & Choi, Y. (2002). Culture and self-concept flexibility. Personality and Social Psychology Bulletin, 28(11), 1508–1517.
Chomsky, N. (1981). Lectures on government and binding. Dordrecht: Foris.Chrisomalis, S. (2006). Comparing cultures and comparing processes: Diachronic methods in cross-
cultural anthropology. Cross-Cultural Research, 40(4), 377–404.Church, A. T., & Katigbak, M. (1988). Imposed-etic and emic measures of intelligence as predictors
of early school performance of rural Philippine children. Journal of Cross-Cultural Psychology, 19(2), 164–177.
Cl ark, A., & Daly, M. (2005). What is the significance of cross-national variability in sociosexual-ity? Behavioral and Brain Sciences, 28(2), 280. (Open peer commentary to Schmitt, 2005)
Clegg, C. W., Jackson, P. R., & Wall, T. D. (1977). The potential of cross-lagged correlation analy-sis in field research. Journal of Occupational Psychology, 50(3), 177–196.
Cochran, G., & Harpending, H. (2009). The 10,000 year explosion: How civilization accelerated human evolution. New York: Basic Books.
Cohen, A. (1974). Two-dimensional man: An essay on the anthropology of power and symbolism in complex society. London: Routledge & Kegan Paul.
Cooper, C. L., Cartwright, S., & Early, P. C. (2001). International handbook of organizational culture and climate. New York: John Wiley.
Costa, P. T., & McCrae, R. R. (1985). The NEO Personality Inventory manual. Odessa, FL: Psychological Assessment Resources.
Costello, A. B., & Osborne, J. W. (2005). Best practices in exploratory factor analyses: Four recommendations for getting the most from your analysis. Practical Assessment, Research & Evaluation, 10, 1–9.
Cyert, R. M., & March, J. G. (1963). A behavioral theory of the firm. Englewood Cliffs, NJ: Prentice Hall.
Deary, I. J., Batty, D., & Gottfredson, L. S. (2005). Human hierarchies, health, and IQ [Letter]. Science, 309, 703.
Deal, T. E., & Kennedy, A. A. (1982). Corporate cultures: The rites and rituals of corporate life. Reading, MA: Addison-Wesley.

De Munck, V. C., & Korotayev, A. V. (2007). Wife-husband intimacy and female status in cross-cultural perspective. Cross-Cultural Research, 41(4), 307–335.
Deutscher, E. (1973). What we say/what we do: Sentiments and acts. Glenview, IL: Scott, Foresman.Di Blas, L., & Forzi, M. (1998). An alternative taxonomic study of personality-descriptive adjec-
tives in the Italian language. European Journal of Personality, 12(2), 75–101.Diener, E., & Diener, M. (1995). Cross-cultural correlates of life-satisfaction and self-esteem.
Journal of Personality and Social Psychology, 68(4), 653–663.Diener, E., & Oishi, S. (2000). Money and happiness: Income and subjective well-being across
nations. In E. Diener & E. M. Suh. (Eds.), Culture and subjective well-being (pp. 185–218). Cambridge. MA: MIT Press.
Diener, E., & Tov, W. (2007). Culture and subjective well-being. In S. Kitayama & D. Cohen (Eds.), Handbook of cultural psychology (pp. 691–713). New York: Guilford.
Diener, M. L., & Lucas, R. E. (2004). Adults’ desires for children’s emotions across 48 coun-tries: Associations with individual and national characteristics. Journal of Cross-Cultural Psychology, 35(5), 525–547.
Dorfman, P. W., Hanges, P. J., & Brodbeck, F. C. (2004). Leadership and cultural variation: The identification of culturally endorsed leadership profiles. In R. J. House, P. J. Hanges, M. Javidan, P. W. Dorfman, & V. Gupta (Eds.), Culture, leadership, and organizations: The GLOBE study of 62 societies (pp. 669–719). Thousand Oaks, CA: Sage.
Dorfman, P. W., & House, R. J. (2004). Cultural influences on organizational leadership: Literature review, theoretical rationale, and GLOBE Project goals. In R. J. House, P. J. Hanges, M. Javidan, P. W. Dorfman, & V. Gupta (Eds.), Culture, leadership, and organizations. The GLOBE study of 62 societies (pp. 51–73). Thousand Oaks, CA: Sage.
Do rnbusch, R., Fischer, S., & Startz, R. (2004). Macroeconomics (9th ed.). New York: McGraw-Hill Irwin.
Dow, M. M., Burton, M., L., White, D. R., & Reitz, K. P. (1984). Galton’s problem as network autocorrelation. American Ethnologist, 11(4), 754–770.
Dow, M. M., & Eff, E. A. (2009). Cultural trait transmission and missing data as sources of bias in cross-cultural survey research: Explanation of polygyny re-examined. Cross-Cultural Research, 43(2), 134–151.
Doyle, A. C. (1993). The adventures of Sherlock Holmes. Oxford: Oxford University Press. (Original work published 1892)
Drewnowski, A., & Specter, S. E. (2004). Poverty and obesity: The role of energy density and energy costs. American Journal of Clinical Nutrition, 79(1), 6–16.
Duijker, H. C., & Frijda, N. H. (1960). National character and national stereotypes. Amsterdam: North-Holland.
Duntley, J. D., & Buss, D. M. (2004). The evolution of evil. In A. G. Miller (Ed.), The social psy-chology of good and evil (pp. 102–123). New York: Guildford.
Durkheim, E. (1930). Le suicide: etude de sociologie [Suicide: A sociological study]. Paris: Presses Universitaires de France. (Original work published in 1897)
Dweck, C. S. (2007a). Boosting achievement with messages that motivate. Education Canada, 47(2), 6–10.
Dweck, C. S. (2007b). The perils and promises of praise. Educational Leadership, 65(2), 34–39.Edgerton, R. B. (1974). Pastoral-farming comparisons. In R. A. Levine (Ed.), Culture and personal-
ity: Contemporary readings (pp. 345–368). Chicago: Aldine Transaction.Ember, C. R., & Ember, M. (1992). Anthropology. Englewood Cliffs, NJ: Prentice Hall.Ember, M., Ember, C. R., & Low, B. S. (2007). Comparing explanations of polygyny.
Cross-Cultural Research, 41(4), 428–440.Esmer, Y. (2002). Is there an Islamic civilization? Comparative Sociology, 1(3–4), 265–298.Everett, D. (2005). Cultural constraints on grammar and cognition in Piraha: Another look at the
design features of human language. Current Anthropology, 46(4), 621–646.
References ◆ 447

448 ◆ Cross-Cultural Analysis
Eysenck, H. J. (2007). The structure and measurement of intelligence. New Brunswick, NJ: Transaction. (Original work published 1979)
Fajnzylber, P., Lederman, D., & Loayza, N. (1998). Determinants of crime rates in Latin America and the world: An empirical assessment. Washington, DC: The International Bank for Reconstruction and Development/The World Bank.
Fajnzylber, P., Lederman, D., & Loayza, N. (2002). Inequality and violent crime. Journal of Law and Economics, 45(1), 1–40.
Fang, T. (2003). A critique of Hofstede’s fifth national culture dimension. International Journal of Cross-Cultural Management, 3(3), 347–368.
Faurie, C., & Raymond, M. (2005). Handedness, homicide and negative frequency-dependent selection. Proceedings of the Royal Society B: Biological Sciences, 272(1558), 25–28.
Federal Bureau of Investigation. (2010). Uniform crime reports: Preliminary semiannual uniform crime report, January–June 2010: Table 4. January to June 2010: Offenses reported to law enforcement by state by city 100,000 and over in population. Retrieved February 12, 2011, from http://www.fbi.gov/about-us/cjis/ucr/crime-in-the-u.s/2010/preliminary-crime-in-the-us-2009/prelimiucrjan-jun_10_excels/table-4.
Fiedler, F. E. (1967). A theory of leadership effectiveness. New York: McGraw-Hill.Finc her, C. L., Thornhill, R., Murray, D. R., & Schaller, M. (2008). Pathogen prevalence predicts
human cross-cultural variability in individualism/collectivism. Proceedings of the Royal Society B, 275(1640), 1279–1285.
Fink, B., Thanzami, V., Seydel, H., & Manning, J. T. (2006). Digit ratio and hand-grip strength in German and Mizos men: Cross-cultural evidence for an organizing effect of prenatal testoster-one on strength. American Journal of Human Biology, 18(6), 776–782.
Fischer, R. (2004). Standardization to account for cross-cultural response bias: A classification of score adjustment procedures and review of research in JCCP. Journal of Cross-Cultural Psychology, 35(3), 263–282.
Fischer, R. (2009). Where is culture in cross-cultural research? An outline of a multilevel research process for measuring culture as a shared meaning system. International Journal of Cross-Cultural Management, 9(1), 25–49.
Fischer, R., Ferreira, M. C., Assmar, E., Redford, P., Harb, C., Glazer, S., et al. (2009). Individualism-collectivism as descriptive norms: Development of a subjective norm approach to culture measurement. Journal of Cross-Cultural Psychology, 40(2), 187–213.
Fischer, R., & Schwartz, S. (2011). Whence differences in value priorities? Individual, cultural, or artifactual sources. Journal of Cross-Cultural Psychology, 42(7), 1127–1144.
Fischer, R., Vauclair, M. C., Fontaine, J. R. J., & Schwartz, S. H. (2010). Are individual-level and country-level value structures different? Testing Hofstede’s legacy with the Schwartz Value Survey. Journal of Cross-Cultural Psychology, 41(2), 135–151.
Fisher, H. (1992). Anatomy of love. London: Simon & Schuster.Fletcher, R., & Fang, T. (2006). Assessing the impact of culture on relationship creation and net-
work formation in emerging Asian markets. European Journal of Marketing, 40(3/4), 430–446.Form, W. (1979). Comparative industrial sociology and the convergence hypothesis. Annual
Review of Sociology, 5, 1–25.Franklin, A., Clifford, A., Williamson, E., & Davies. I. (2005). Color term knowledge does not
affect categorical perception of color in toddlers. Journal of Experimental Child Psychology, 90(2), 114–141.
Fuentes, A. (2005). Ethnography, cultural context, and assessment of reproductive success matter when discussing human mating strategies. Behavioral and Brain Sciences, 28(2), 284–285. (Open peer commentary to Schmitt, 2005)
Fukuyama, F. (2001). Culture and economic development: Cultural concerns. In N. J. Smelser & P. B. Baltes (Eds.), International encyclopedia of the social and behavioral sciences

(pp. 3130–3134). Retrieved January 8, 2008, from http://www.sais-jhu.edu/faculty/fukuyama/articles/isb505010.pdf.
Gabrielidis, C., Stephan, W. G., Ybarra, O., Dos Santos Pearson, V. M., & Villareal, L. (1997). Preferred styles of conflict resolution: Mexico and the United States. Journal of Cross-Cultural Psychology, 28(6), 661–677.
Gallup, J. L., & Sachs, J. (1998). Geography and economic growth. Paper prepared for the annual World Bank conference on development economics, Washington DC, April 20–21, 1998. Retrieved September 18, 2005, from www.worldbank.org/html/rad/abcde/sachs.pdf.
Gardner, H. (1983). Frames of mind: The theory of multiple intelligences. New York: Basic Books.Geertz, C. (1973). The interpretation of cultures. New York: Basic Books.Gelf and, M., Bhawuk, D., Nishii, L. H., & Bechtold, D. (2004). Individualism and collectivism. In
R. J. House, P. J. Hanges, M. Javidan, P. W. Dorfman, & V. Gupta (Eds.), Culture, leader-ship, and organizations: The GLOBE study of 62 societies (pp. 437–512). Thousand Oaks, CA: Sage.
Gelfand, M. J., Nishii, L. H., & Raver, J. L. (2006). On the nature and importance of cultural tightness-looseness. Journal of Applied Psychology, 91(6), 1225–1244.
Gerhart, B. (2008). How much does national culture constrain organizational culture? Management and Organization Review, 5(2), 241–259.
Geuens, M., Weijters, B., & De Wulf, K. (2009). A new measure of brand personality. International Journal of Research in Marketing, 26(2), 97–107.
Gibson, S., & Noret, N. (2010). Historical experiences, collective memory, and willingness to fight for one’s country: Comment on Paez et al. (2008). Journal of Cross-Cultural Psychology, 41(3), 445–450.
Goody, J., & Watt, I. (1963). The consequences of literacy. In J. Goody (Ed.), Literacy in tradi-tional societies (pp. 27–68). Cambridge, UK: Cambridge University Press.
Gorsuch, R. L. (1983). Factor analysis. Hillsdale, NJ: Lawrence Erlbaum.Gottfredson, L. S., & Deary, I. J. (2004). Intelligence predicts health and longevity, but why?
Current Directions in Psychological Science, 13(1), 1–4.Gottfredson, M. R., & Hirschi, T. (1990). A general theory of crime. Stanford, CA: Stanford
University Press.Green, E. G. T., Deschamps, J.-C., & Paez, D. (2005). Variation of individualism and collec-
tivism within and between 20 countries: A typological analysis. Journal of Cross-Cultural Psychology, 36(3), 321–339.
Griswold, W. (1994). Cultures and societies in a changing world. Thousand Oaks, CA: Pine Forge.Guanzon-Lapena, M. A., Church, A. T., Carlota, A. J., & Katigbak, M. S. (1998). Indigenous
personality measures: Philippine examples. Journal of Cross-Cultural Psychology, 29(1), 249–270.
Gupta, V., Hanges, P. J., & Dorfman, P. (2002). Cultural clusters: Methodology and findings. Journal of World Business, 37, 11–15.
Haire, M., Ghiselli, E. E., & Porter, L. W. (1966). Managerial thinking: An international study. New York: John Wiley.
Hall, E. T. (1959). The silent language. New York: Anchor Books.Hamamura, T., Heine, S. J., & Paulhus, D. L. (2008). Cultural differences in response styles: The
role of dialectical thinking. Personality and Individual Differences, 44, 932–942.Hanges, P. J. (2004). Appendix B: Response bias correction procedure used in GLOBE. In R. J.
House, P. J. Hanges, M. Javidan, P. W. Dorfman, & V. Gupta (Eds.), Culture, leadership, and organizations: The GLOBE study of 62 societies (pp. 282–342). Thousand Oaks, CA: Sage.
Hanges, P. J., & Dickson, M. W. (2004). The development and validation of the GLOBE culture and leadership scales. In R. J. House, P. J. Hanges, M. Javidan, P. W. Dorfman, & V. Gupta
References ◆ 449

450 ◆ Cross-Cultural Analysis
(Eds.), Culture, leadership, and organizations: The GLOBE study of 62 societies (pp. 122–151). Thousand Oaks, CA: Sage.
Hanges, P. J., Dickson, M. W., & Sipe, M. T. (2004). Rationale for GLOBE statistical analyses: Societal rankings and test of hypotheses. In R. J. House, P. J. Hanges, M. Javidan, P. W. Dorfman, & V. Gupta (Eds.), Culture, leadership, and organizations: The GLOBE study of 62 societies (pp. 219–233). Thousand Oaks, CA: Sage.
Harris, M. (1981). America now: The anthropology of a changing culture. New York: Simon & Schuster.
Harris, M. (1992). Explaining the pig taboo. In J. J. Macionis & N. V. Benokraitis (Eds.), Seeing our-selves: Classic, contemporary, and cross-cultural reading in sociology (pp. 47–51). Englewood Cliffs, NJ: Prentice Hall.
Harrison, L. E. (1992). Who prospers? How cultural values shape economic and political success. New York: Basic Books.
Harr ison, L. E., & Huntington, S. P. (Eds.). (2000). Culture matters: How values shape human progress. New York: Basic Books.
Hartog, D. (2004). Assertiveness. In R. J. House, P. J. Hanges, M. Javidan, P. W. Dorfman, & V. Gupta. (Eds.), Culture, leadership, and organizations: The GLOBE study of 62 societies (pp. 395–436). Thousand Oaks, CA: Sage.
Harzing, A. W. (2006). Response styles in cross-national survey research: A 26-country study. International Journal of Cross-Cultural Management, 6(2), 243–266.
Harzing, A. W., et al. (2009). Rating versus ranking: What is the best way to reduce response and language bias in cross-national research? International Business Review, 18(4), 417–432.
Haviland, W. A. (1990). Cultural anthropology. Orlando, FL: Holt, Rinehart & Winston.Hayward, R. D., & Kemmelmeier, M. (2007). How competition is viewed across cultures: A test of
four theories. Cross-Cultural Research, 41(4), 364–395.Hein e, S. J. (2001). Self as cultural product: An examination of East Asian and North American
selves. Journal of Personality, 69(6), 881–906.Heine, S. J. (2003a). An exploration of cultural variation in self-enhancing and self-improving moti-
vations. In V. Murphy-Berman & J. J. Berman (Eds.), Nebraska Symposium on Motivation (Vol. 49). Cross-cultural differences in perspectives on the self (pp. 101–128). Lincoln: University of Nebraska Press.
Heine, S. J. (2003b). Self-enhancement in Japan? A reply to Brown & Kobayashi. Asian Journal of Social Psychology, 6(1), 75–84.
Heine, S. J. (2005). Where is the evidence for pancultural self-enhancement? A reply to Sedikides, Gaertner, and Toguchi, 2003. Journal of Personality and Social Psychology, 89(4), 539–551.
Heine, S. J., Buchtel, E. E., & Norenzayan, A. (2008). What do cross-national comparisons of self-reported personality traits tell us? The case of conscientiousness. Psychological Science, 19(4), 309–313.
Heine, S. J., & Hamamura, T. (2007). In search of East Asian self-enhancement. Personality and Social Psychology Review, 11(1), 4–27.
Heine, S. J., Kitayama, S., & Hamamura, T. (2007). Which studies test whether self-enhancement is pancultural? Reply to Sedikides, Gaertner, and Vevea, 2007. Asian Journal of Social Psychology, 10(3), 198–200.
Heine S. J., Kitayama, S., Lehman, D. R., Takata, T., Ide, E., Leung, C. et al. (2001). Divergent co nsequences of success and failure in Japan and North America: An investigation of self-improving motivations and malleable selves. Journal of Personality and Social Psychology, 81(4), 599–615.
Heine, S. J., & Lehman, D. R. (1997). The cultural construction of self-enhancement: An examina-tion of group-serving biases. Journal of Personality and Social Psychology, 72(6), 1268–1283.
Heine, S. J., Lehman, D. R., Markus, H. R., & Kitayama, S. (1999). Is there a universal need for positive self-regard? Psychological Review, 106(4), 766–794.

Heine, S. J., Lehman, D. R., Peng, K., & Greenholtz, J. (2002). What is wrong with cross-cultural comparisons of subjective Likert scales: The reference-group effect. Journal of Personality and Social Psychology, 82,(6), 903–918.
Heine, S. J., Takata, T., & Lehman, D. R. (2000). Beyond self-presentation: Evidence for self-criticism among Japanese. Personality and Social Psychology Bulletin, 26(1), 71–78.
Helle, S., & Laaksonen, T. (2009). Latitudinal gradient in 2D:4D. Archives of Sexual Behavior, 38(1), 1–3.
Helleringer, S., & Kohler, H. P. (2007). Sexual network structure and the spread of HIV in Africa: Evidence from Likoma Island, Malawi. AIDS, 21(17), 2323–2332.
Henrich, J., Heine, S. J., & Norenzayan, A. (2010a). Most people are not WEIRD. Nature, 466, 29.Henrich, J., Heine, S. J., & Norenzayan, A. (2010b). The weirdest people in the world? Behavioral
and Brain Sciences, 32, 531–532.Herzberg, F. (1966). Work and the nature of man. Cleveland: Work Press.Herzberg, F., Mausner, B., & Snyderman, B. B. (1959). The motivations to work. New York: John
Wiley.Ho, C. C., & MacDorman, K. F. (2010). Revisiting the uncanny valley theory: Developing and
validating an alternative to the Godspeed indices. Computers in Human Behavior, 26(6), 1508–1518.
Ho, D. Y. F. (1998). Indigenous psychologies: Asian perspectives. Journal of Cross-Cultural Psychology, 29(1), 88–103.
Hofs tede, G. (1980). Culture’s consequences: International differences in work-related values. Beverly Hills, CA: Sage.
Hofstede, G. (1991). Cultures and organizations: Software of the mind. New York: McGraw-Hill.Hofstede, G. (1995). Multilevel research of human systems: Flowers, bouquets, and gardens.
Human Systems Research, 14, 207–217.Hofstede, G. (1996). Riding the waves of commerce: A test of Trompenaars’ “model” of national
differences. International Journal of Intercultural Relations, 20(2), 189–198.Hofstede, G. (1998a). Attitudes, values and organizational culture: Disentangling the concepts.
Organization Studies, 19, 477–493.Hofstede, G. (Ed.). (1998b). Masculinity and femininity: The taboo dimension of national cultures.
Thousand Oaks, CA: Sage.Hofs tede, G. (2001). Culture’s consequences: Comparing values, behaviors, institutions, and
organizations across nations (2nd ed.).Thousand Oaks, CA: Sage.Hofstede, G. (2002). Dimensions do not exist: A reply to Brendan McSweeney. Human Relations,
55(11), 1355–1360.Hofstede, G. (2003). What is culture? A reply to Baskerville. Accounting, Organizations and
Society, 28, 811–813.Hofstede, G. (2006). What did GLOBE really measure? Researchers minds versus respondents’
minds. Journal of International Business Studies, 37(6), 882–896.Hofstede, G. (2007). A European in Asia. Asian Journal of Social Psychology, 10(1), 16–21.Hofstede, G. (2009). Who is the fairest of them all? Galit Ailon’s Mirror. Academy of Management
Review, 34, 570.Hofstede, G. (2010). The GLOBE debate: Back to relevance. Journal of International Business
Studies, 41(8), 1339–1346.Hofstede, G., & Bond, M. H. (1988). The Confucian connection: From cultural roots to economic
growth. Organizational Dynamics, 16(4), 5–21.Hofstede, G., Bond, M. H., & Luk, C. L. (1993). Individual perceptions of organizational cultures:
A methodological treatise on levels of analysis. Organization Studies, 14(4), 483–503.Hofstede, G., Garibaldi de Hilal, A. V., Malvezzi, S., Tanure, B., & Vinken, H. (2010). Comparing
regional cultures within a country: Lessons from Brazil. Journal of Cross-Cultural Psychology, 41(3), 336–352.
References ◆ 451

452 ◆ Cross-Cultural Analysis
Hofs tede, G., Hofstede, G. J., & Minkov, M. (2010). Cultures and organizations: Software of the mind (3rd ed.). New York: McGraw-Hill.
Hofstede, G., & McCrae, R. R. (2004). Personality and culture revisited: Linking traits and dimen-sions of culture. Cross-Cultural Research, 38(1), 52–88.
Hofstede, G., Neuijen, B., Ohayv, D. D., & Sanders, G. (1990). Measuring organizational cultures: A qualitative and quantitative study across twenty cases. Administrative Science Quarterly, 35(2), 286–316.
Hofstede, G. J., Pedersen, P. B., & Hofstede, G. (2002). Exploring culture: Exercises, stories and synthetic cultures. Yarmouth, ME: Intercultural Press.
Honekopp, J., Voracek, M., & Manning, J. T. (2006). 2nd to 4th digit ratio (2D:4D) and number of sex partners: Evidence for effects of prenatal testosterone in men. Psychoneuroendocrinology, 31(1), 30–37.
Hooker, J. (2009). Corruption from a cross-cultural perspective. Cross-Cultural Management, 16(3), 251–267.
Hoppe, M. H. (1990). A comparative study of country elites: International differences in work-related values and learning and their implications for management training and development. Unpublished doctoral dissertation, University of North Carolina at Chapel Hill.
House, R. J., & Hanges, P. J. (2004). Research design. In R. J. House, P. J. Hanges, M. Javidan, P. W. Dorfman, & V. Gupta (Eds.), Culture, leadership, and organizations: The GLOBE study of 62 societies (pp. 95–101). Thousand Oaks, CA: Sage.
House, R. J., Hanges, P. J., Javidan, M., Dorfman, P. W., & Gupta, V. (Eds.). (2004). Culture, leadership, and organizations: The GLOBE study of 62 societies. Thousand Oaks, CA: Sage.
House, R. J., & Javidan, M. (2004). Overview of GLOBE. In R. J. House, P. J. Hanges, M. Javidan, P. W. Dorfman, & V. Gupta (Eds.), Culture, leadership, and organizations: The GLOBE study of 62 societies (pp. 9–28). Thousand Oaks, CA: Sage.
Huang, J. C. T. (1984). On the distribution and reference of empty pronouns. Linguistic Inquiry, 15(4), 531–574.
Huang, J. C. T. (1989). Pronoun drop in Chinese: A generalized control theory. In O. Jaeggli & K. S. Safir (Eds.), The null subject parameter: Studies in natural language and linguistic theory (pp. 185–214). Dordrecht: Kluwer.
Hui, C. H., & Triandis, H. C. (1986). Individualism-collectivism: A study of cross-cultural researchers. Journal of Cross-Cultural Psychology, 17(2), 225–248.
Hui, C. H., & Triandis, H. C. (1989). Effects of culture and response format on extreme response style. Journal of Cross-Cultural Psychology, 20(3), 296–309.
Hume, D. (1964). Of national character. In T. H. Green & T. H. Grose (Eds.), The philosophical works of David Hume (Vol. 3, pp. 224–258). Aalen, Germany: Scientia Verlag. (Original work published 1742)
Inglehart, R. (1997). Modernization and postmodernization: Cultural, economic, and political change in 43 societies. Princeton, NJ: Princeton University Press.
Inglehart, R. (2005). The worldviews of Islamic publics in global perspective. Retrieved February 18, 2010, from http://www.worldvaluessurvey.org/wvs/articles/folder_published/publication_487.
Inglehart, R. (2008). Changing values among Western publics from 1970 to 2006. West European Politics, 31(1–2), 130–146.
Inglehart, R. (2009). National-level value scores by country. Retrieved August 9, 2010, from http://www.worldvaluessurvey.org/wvs/articles/folder_published/article_base_111.
Inglehart, R., & Baker, W. E. (2000). Modernization, cultural change, and the persistence of tradi-tional values. American Sociological Review, 65(1), 19–51.
Inglehart, R., & Welzel, C. (2005a). Exploring the unknown: Predicting the responses of publics not yet surveyed. International Review of Sociology, 15(1), 173–201.

Inglehart, R., & Welzel, C. (2005b). Modernization, cultural change, and democracy: The human development sequence. New York: Cambridge University Press.
Inkeles, A. (1981). Convergence and divergence in industrial societies. In M. O. Attir, B. H. Holzner, & Z. Suda (Eds.), Directions of change: Modernization theory, research, and realities (pp. 3–38). Boulder, CO: Westview.
Inkeles, A., & Levinson, D. J. (1969). National character: The study of modal personality and sociocultural systems. In G. Lindzey & E. Aronson (Eds.), The handbook of social psychol-ogy (2nd ed., Vol. 4., pp. 418–506). Reading, MA: Addison-Wesley. (Original work pub-lished in 1954)
Jahoda, G. (1984). Do we need a concept of culture? Journal of Cross-Cultural Psychology, 15(2), 139–151.
Jahoda, G. (2011). Past and present of cross-cultural psychology. In F. J. R. van de Vijver, A. Chasiotis, & S. M. Breugelmans (Eds.), Fundamental questions in cross-cultural psychology (pp. 37–63). New York: Cambridge University Press.
Javidan, M. (2004). Performance orientation. In R. J. House, P. J. Hanges, M. Javidan, P. W. Dorfman, & V. Gupta (Eds.), Culture, leadership, and organizations: The GLOBE study of 62 societies (pp. 239–281). Thousand Oaks, CA: Sage.
Javidan, M., House, R. J., Dorfman, P. W., & Sully de Luque, M. (2006). Conceptualizing and measuring cultures and their consequences: A comparative review of GLOBE’s approach and Hofstede’s approaches. Journal of International Business Studies, 37(6), 897–914.
Javidan, M., & Houser, M. (2004). The linkage between GLOBE findings and other cross-cultural information. In R. J. House, P. J. Hanges, M. Javidan, P. W. Dorfman, & V. Gupta (Eds.), Culture, leadership, and organizations: The GLOBE study of 62 societies (pp. 102–121). Thousand Oaks, CA: Sage.
Johnson, T., Kulesa, P., Lic, I., Cho, Y. I., & Shavitt, S. (2005). The relation between culture and response styles: Evidence from 19 countries. Jo urnal of Cross-Cultural Psychology, 36(2), 264–277.
Kabasakal, H., & Bodur, M. (2004). Humane orientation. In R. J. House, P. J. Hanges, M. Javidan, P. W. Dorfman, & V. Gupta (Eds.), Culture, leadership, and organizations: The GLOBE study of 62 societies (pp. 564–601). Thousand Oaks, CA: Sage.
Kanagawa, C., Cross, S. E., & Markus, H. R. (2001). “Who am I?”: The cultural psychology of the conceptual self. Personality and Social Psychology Bulletin, 27(1), 90–103.
Karasz, A., & Singelis, T. M. (2009). Qualitative and mixed methods research in cross-cultural psychology. Journal of Cross-Cultural Psychology, 40(6), 909–916.
Kashima, E. S., & Kashima, Y. (1998). Culture and language: The case of cultural dimensions and personal pronoun use. Journal of Cross-Cultural Psychology, 29(3), 461–486.
Kashima, Y., & Kashima, E. S. (2003). Individualism, GNP, climate, and pronoun drop: Is indi-vidualism determined by affluence and climate or does language use play a role? Journal of Cross-Cultural Psychology, 34(1), 125–134.
Kay, J. (2007). Why Rorty’s search for what works has lessons for business. Financial Times, June 19, 2007. Retrieved July 21, 2008, from http://www.johnkay.com/in_action/502.
Kemmelmeier, M., Burnstein, E., Krumov, K., Genkova, P., Kanagawa, C., Hirshberg, M. S., et al. (2003). Individualism, collectivism, and authoritarianism in seven societies. Journal of Cross-Cultural Psychology, 34(3), 304–322.
Kerr, C., Dunlop, J. T., Harbison, F. H., & Myers, C. A. (1960). Industrialism and industrial man: The problems of labor and management in economic growth. London: Heineman.
King, J. E., & Figueredo, A. J. (1997). The five-factor model plus dominance in chimpanzee per-sonality. Journal of Research in Personality, 31(2), 257–271.
Kirkman, B. L., Lowe, K. B., & Gibson, C. B. (2006). A quarter century of Culture’s Consequences: A review of empirical research incorporating Hofstede’s cultural values framework. Journal of International Business Studies, 37(3), 285–320.
References ◆ 453

454 ◆ Cross-Cultural Analysis
Kirkman, B. L., & Shapiro, D. L. (1997). The impact of cultural values on employee resistance to teams: Toward a model of globalized self-management work-team effectiveness. Academy of Management Review, 22(2), 730–757.
Kitayama, S., Duffy, S., Kawamura, T., & Larsen, J. T. (2003). Perceiving an object and its context in different cultures: A cultural look at new look. Psychological Science, 14(3), 201–206.
Klippel, M. D. (1975). Measurement of intelligence among three New Zealand ethnic groups: Product versus process approaches. Journal of Cross-Cultural Psychology, 6(3), 365–376.
Kluckhohn, C. (1951). The study of culture. In D. Lerner & H. D. Lasswell (Eds.), The policy sci-ences (pp. 86–101). Stanford, CA: Stanford University Press.
Kluckhohn, C. (1967). Values and value-orientations in the theory of action: An exploration in definition and classification. In T. Parsons & E. A. Shils (Eds.), Toward a general theory of action (pp. 388–433). Cambridge, MA: Harvard University Press.
Kluckhohn, F., & Strodtbeck, F. L. (1961). Variations in value orientations. Evanston, IL: Row, Peterson.
Knafo, A., Roccas, S., & Sagiv, L. (2011). The value of values in cross cultural research: A special issue in honor of Shalom Schwartz. Journal of Cross-Cultural Psychology, 42, 178–185.
Kobayashi, C., & Brown, J. D. (2003). Self-esteem and self-enhancement in Japan and America. Journal of Cross-Cultural Psychology, 34(5), 567–580.
Kogut, B., & Singh, H. (1988). The effect of national culture on the choice of entry mode. Journal of International Business Studies, 19(3), 411–432.
Kostova, T., & Roth, K. (2002). Adoption of an organizational practice by subsidiaries of multi-national corporations: Institutional and relational effects. Academy of Management Journal, 45(1), 215–233.
Kroeber, A. L., & Parsons, T. (1958). The concepts of culture and of social system. American Sociological Review, 23, 582–583.
Krohn, M. D. (1976). Inequality, unemployment and crime: A cross-national analysis. Sociological Quarterly, 17(3), 303–313.
Kruskal, J. B. (1964). Nonmetric multidimensional scaling: A numerical method. Psychometrika, 29(2), 115–129.
Kruskal, J. B., & Wish, M. (1977). Multidimensional scaling. Beverly Hills, CA: Sage.Kuepper, Y., & Henni g, J. (2007). Behavioral aggression is associated with the 2D:4D ratio in men
but not in women. Journal of Individual Differences, 28(2), 67–72.Kuhn, T. S. (1962). The structure of the scientific revolution. Chicago: University of Chicago Press.Kuhn, T. S. (1970). The structure of scientific revolutions (2nd enl. ed.) Chicago: University of
Chicago Press.Kuppens, P., Ceulemans, E., Timmerman, M. E., Diener, E., & Kim-Prieto, C. (2006). Universal
intracultural and intercultural dimensions of the recalled frequency of emotional experience. Journal of Cross-Cultural Psychology, 37(5), 491–515.
Kuznetsov, V. I. (2003). Iz istoricheskogo opyta nauki II. Vestnik RAN, 73(9), 812–821. Kwantes, K. T., & Dickson, M. W. (2011). Organizational culture in a societal context: Lessons from
GLOBE and beyond. In N. M. Ashkanasy, C. P. M. Wilderom, & M. F. Peterson (Eds.), The hand-book of organizational culture and climate (2nd ed., pp. 494–514). Thousand Oaks, CA: Sage.
Lafferty, K. D. (2006). Can the common brain parasite, Toxoplasma gondii, influence human cul-ture? Proceedings of the Royal Society B, 273, 2749–2755.
Laland, K. N., Odling-Smee, J., & Myles, S. (2010). How culture shaped the human genome: Bringing genetics and the human sciences together. Nature Reviews Genetics, 11, 137–148.
Lammers, A. (1976). Towards the internationalization of the organization sciences. In G. Hofstede & M. S. Kassem (Eds.), European contributions to organization theory (pp. 25–42). Assen, Netherlands: Van Gorcum.

Lange, R. V., & Tiggeman, M. (1981). Dimensionality and reliability of the Rotter I-E locus of control scale. Journal of Personality Assessment, 45(4), 398–406.
Laurent, A. (1983). The cultural diversity of Western conceptions of management. International Studies of Management and Organization, 13(1–2), 75–96.
Leamer, E. E. (1983). Let’s take the con out of econometrics. American Economic Review, 73(1), 31–43.Lee, R. B. (1979). The !Kung San: Men, women, and work in a foraging society. Cambridge, UK:
Cambridge University Press.Lenartowicz, T., Johnson, J. P., & White, C. T. (2003). The neglect of intracountry cultural varia-
tion in international management research. Journal of Business Research, 56(12), 999–1008.Lenartowicz, T., & Roth, K. (2001). Does subculture within a country matter? A cross-cultural
study of motivational domains and business performance in Brazil. Journal of International Business Studies, 32(2), 305–325.
Leung, K. (2008). Methods and measurements in cross-cultural management. In P. B. Smith, M. F. Peterson, & D. C. Thomas (Eds.), The handbook of cross-cultural management research (pp. 59–73). Thousand Oaks, CA: Sage.
Leung, K., & Bond, M. H. (1989). On the empirical identification of dimensions for cross-cultural comparisons. Journal of Cross-Cultural Psychology, 20(2), 133–151.
Leung, K., & Bond, M. H. (2008). Psycho-logic and eco-logic: Insights from social axiom dimen-sions. In F. J. R. van de Vijver, D. A. van Hemert, & Y. H. Poortinga (Eds.), Multilevel analysis of individuals and cultures (pp. 199–221). New York: Lawrence Erlbaum/Taylor and Francis.
Leung, K., Bond, M. H., Reimel de Carrasquel, S., Muñoz, C., Hernández, M., Murakami, F., et al. (2002). Social axioms: The search for universal dimensions of general beliefs about how the world functions. Journal of Cross-Cultural Psychology, 33(3), 286–302.
Leung, K., & van de Vijver, F. J. R. (2008). Strategies for strengthening causal inferences in cross-cultural research: The consilience approach. International Journal of Cross-Cultural Management, 8(2), 145–169.
Levine, R. V., & Bartlett, K. (1984). Pace of life, punctuality, and coronary heart disease in six countries. Journal of Cross-Cultural Psychology, 15(2), 233–255.
Levine, R. V., & Norenzayan, A. (1999). The pace of life in 31 countries. Journal of Cross-Cultural Psychology, 30(2), 178–205.
Levine, R. V., Norenzayan, A., & Philbrick, K. (2001). Cross-cultural differences in helping stran-gers. Journal of Cross-Cultural Psychology, 32(5), 543–560.
Levitin, T. (1973). Values. In J. P. Robinson & P. R. Shaver (Eds.), Measures of social psychologi-cal attitudes (pp. 489–502). Ann Arbor: University of Michigan, Institute for Social Research, Survey Research Center.
Lewis, J. R., & Ozaki, R. (2009). Amae and mardy: A comparison of two emotion terms. Journal of Cross-Cultural Psychology, 40(6), 917–934.
Li, J. (2002). A cultural model of learning: Chinese “heart and mind for wanting to learn.” Journal of Cross-Cultural Psychology, 33(3), 248–269.
Lim, F., Bond, M. H., & Bond, M. K. (2005). Linking societal and psychological factors to homi-cide rates across nations. Journal of Cross-Cultural Psychology, 36(5), 515–536.
Liu, J. H., Paez, D., Techio, E., Slawuta, P., Zlobina, A., & Cabecinhas, R. (2010). From gist of a wink to structural equivalence of meaning: Towards a cross-cultural psychology of the col-lective remembering of world history. Journal of Cross-Cultural Psychology, 41(3), 451–456.
Locascio, J. J. (1982). The cross-lagged correlation technique: Reconsideration in terms of exploratory utility, assumption specification and robustness. Educational and Psychological Measurement, 42(4), 1023–1036.
Loehlin, J. C., McFadden, D., Medland, S. E., & Martin, N. G. (2006). Population differences in finger-length ratios: Ethnicity or latitude? Archives of Sexual Behavior, 35(6), 739–742.
References ◆ 455

456 ◆ Cross-Cultural Analysis
Lonner, W. J., Thorndike, R. M., Forbes, N. E., & Ashworth, C. (1985). The influence of televi-sion on measured cognitive abilities: A study with native Alaskan children. Journal of Cross-Cultural Psychology, 16(3), 355–380.
Lynn, M. (1997). Tipping customs and status seeking: A cross-country study. International Journal of Hospitality Management, 16(2), 221–224.
Lynn, M. (2000). National character and tipping customs: The needs for achievement, affiliation and power as predictors of the prevalence of tipping. International Journal of Hospitality Management, 19(2), 205–210.
Lynn, M., & Steel, P. (2006). National differences in subjective well-being: The interactive effects of extraversion and neuroticism. Journal of Happiness Studies, 7, 155–165.
Lynn, R. (1991). The secret of the miracle economy: Different national attitudes to competitiveness and money. London: The Social Affairs Unit.
Lynn, R., & Vanhanen, T. (2002). IQ and the wealth of nations. Westport, CT: Praeger.Lynn, R., & Vanhanen, T. (2006). IQ and global inequality. Atlanta, GA: Washington Summit
Publishers.Mace, R., & Pagel, M. (1994). The comparative method in anthropology. Current Anthropology,
35(5), 549–564.Mackay, J., & Eriksen, M. (2002). The tobacco atlas. Geneva: World Heath Organization.Magala, S. (2005). Cross-cultural competence. New York: Routledge.Manning, J. T. (2002). Digit ratio: A pointer to fertility, behavior, and health. Piscataway, NJ:
Rutgers University Press.Manning, J. T. (2007). The androgen receptor gene: A major modifier of speed of neuronal trans-
mission and intelligence? Medical Hypotheses, 68, 802–804.Manning, J. T., Barley, L., Walton, J., Lewis-Jones, D. I., Trivers, R. L., Singh, D., et al. (2000).
The 2nd:4th digit ratio, sexual dimorphism, population differences, and reproductive success. Evidence for sexually antagonistic genes? Evolution and Human Behavior, 21(3), 163–183.
Manning, J. T., Bundred, P. E., & Mather, F. M. (2004). Second to fourth digit ratio, sexual selec-tion, and skin colour. Evolution and Human Behavior, 25(1), 38–50.
Manning, J. T., Bundred, P. E, Newton, D., J., & Flanagan, B. F. (2003). The second to fourth digit ratios and variation in the androgen receptor gene. Evolution and Human Behavior, 24(6), 399–405.
Manning, J. T., Henzi, P., Venkatramana, P., Martin, S., & Singh, D. (2003). Second to fourth digit ratio: Ethnic differences and family size in English, Indian and South African populations. Annals of Human Biology, 30(5), 579–588.
Manning, J. T., Scutt, D., Wilson, J., & Lewis-Jones, D. I. (1998). The ratio of 2nd to 4th digit length: A predictor of sperm numbers and concentrations of testosterone, luteinizing hormone, and oestrogen. Human Reproduction, 13(11), 3000–3004.
Manning, J. T., Stewart, A., Bundred, P. E., & Trivers, R. L. (2004). Sex and ethnic differences in 2nd to 4th digit ratio of children. Early Human Development, 80(2), 161–168.
Marin, G., Gamba, R. J., & Marin, B. V. (1992). Extreme response style and acquiescence among Hispanics: The role of a cculturation and education. Journal of Cross-Cultural Psychology, 23(4), 498–509.
Marin, G., & Salazar, J. M. (1985). Determinants of hetero- and autostereotypes: Distance, level of contact, and socioeconomic development in seven nations. Journal of Cross-Cultural Psychology, 16(4), 403–422.
Markus, H. R., & Kitayama, S. (1991). Culture and the self: Implications for cognition, emotion, and motivation. Psychological Review, 98(2), 224–253.
Marlowe, F. W. (2000). Paternal investment and the human mating system. Behavioral Processes, 51(1–3), 45–61.
Marlowe, F. W. (2003). The mating system of foragers in the standard cross-cultural sample. Cross-Cultural Research, 37(3), 282–306.

Marlowe, F. W. (2004). Mate preferences among Hadza hunter-gatherers. Human Nature, 15(4), 365–376.
Marsh, H. W., & Richards, G. E. (1986). The Rotter locus of control scale: The comparison of alternative response formats and implications for reliability, validity, and dimensionality. Journal of Research in Personality, 20(4), 509–528.
Marsh, H. W., & Richards, G. E. (1987). The multidimensionality of the Rotter I-E scale and its higher-order structure: An application of confirmatory factor analysis. Multivariate Behavioral Research, 22(1), 39–69.
Martin, J. (2002). Organizational culture: Mapping the terrain. Thousand Oaks, CA: Sage.Maseland, R., & van Hoorn, A. (2009). Explaining the negative correlation between values and
practices: A note on the Hofstede-GLOBE debate. Journal of International Business Studies, 40(3), 527–532.
Maseland, R., & van Hoorn, A. (2011). Why Muslims like democracy, yet have so little of it. Public Choice, 147, 481–496.
Maslow, A. H. (1943). A theory of human motivation. Psychological Review, 50, 370–396.Maslow, A. H. (1954). Motivation and personality. New York: Harper.Masuda, T., Ellsworth, P. C., Mesquita, B., Leu, J., Tanida, S., & van de Veerdonk, E. (2008).
Placing the face in context: Cultural differences in the perception of facial emotion. Journal of Personality and Social Psychology, 94(3), 365–381.
Masuda, T., & Nisbett, R. E. (2001). Attending holistically versus analytically: Comparing the context sensitivity of Japanese and Americans. Journal of Personality and Social Psychology, 81(5), 922–934.
Matsumoto, D., Grissom, R. J., & Dinnel, D. L. (2001). Do between-culture differences really mean that people are different? A look at some measures of cultural effect size. Journal of Cross-Cultural Psychology, 32(4), 478–490.
Maurice, M. (1976). Theoretical and ideological aspects of the universalistic approach to the study of organizations. International Studies of Management and Organization, 6(3), 3–10.
Maznevski, M. L., Gomez, C. B., Di Stefano, J. J., Noorderhaven, N. G., & Wu, P. C. (2002). Cultural dimensions at the individual level of analysis: The cultural orientations framework. International Journal of Cross-Cultural Management, 2(3), 275–295.
McClelland, D. C. (1961). The achieving society. New York: Free Press.McClelland, D. C., & Boyatzis, R. E. (1982). Leadership motive pattern and long-term success in
management. Journal of Applied Psychology, 67(6), 737–743.McClelland, D. C., & Burnham, D. H. (1976). Power is the great motivator. Harvard Business
Review, 54(2), 100–110.McCrae, R. R. (2002). NEO-PI-R data from 36 cultures: Further inte rcultural comparisons.
In R. R. McCrae & J. Allik (Eds.), The five-factor model of personality across cultures (pp. 105–126). New York: Kluwer Academic/Plenum.
McCrae, R. R. (2009). Cross-cultural research on the five-factor model of personality (Version 2). In Online readings in psychology and culture (Unit 6, Chap. 1/V2). Retrieved July 24, 2010, from http://orpc.iaccp.org.
McCrae, R. R., & Costa, P. T. (1989). More reasons to adopt the five-factor model. American Psychologist, 44, 451–452.
McCrae, R. R., & John, O. P. (1992). An introduction to the five-factor model and its applications. Journal of Personality, 60(2), 175–215.
McCrae, R. R., & Terracciano, A. (2005). Personality profiles of cultures: Aggregate personality traits. Journal of Personality and Social Psychology, 89(3), 407–425.
McCrae, R. R., Terracciano, A., Realo, A., & Allik, J. (2007). Climatic warmth and national wealth: Some culture-level determinants of national character stereotypes. European Journal of Personality, 21(8), 953–976.
References ◆ 457

458 ◆ Cross-Cultural Analysis
McCrae, R. R., Terracciano, A., Realo, A., & Allik, J. (2008). Interpreting GLOBE societal prac-tices scales. Journal of Cross-Cultural Psychology, 39(6), 805–810.
McGrogan, C., Hutchison, M. D., & King, J. E. (2008). Dimensions of horse personality based on owner and trainer supplied personality traits. Applied Animal Behavior Science, 113(1–3), 206–214.
McSweeney, B. (2002). Hofstede’s model of national cultural differences and their consequences: A triumph of faith—a failure of analysis. Human Relations, 55(1), 89–118.
Meltzer, L. (1963). Comparing relationships of individual and average variables to individual response. American Sociological Review, 28(1), 117–123.
Merriam-Webster Dictionary. (2010). Dichotomy. Retrieved December 14, 2010, from http://www.merriam-webster.com/dictionary/dichotomy.
Merritt, A. (2000). Culture in the cockpit: Do Hofstede’s dimensions replicate? Journal of Cross-Cultural Psychology, 31(3), 283–301.
Merton, R. K. (1938). Social structure and anomie. American Sociological Review, 3(5), 672–682.Merton, R. K. (1968). Social theory and social structure. New York: Free Press. (Original work
published in 1949)Messner, S. F., Raffalovich, L. E., & Shrok, P. (2002). Reassessing the cross-national relation-
ship between income inequality and homicide rates: Implications of data quality control in the measurement of income distribution. Journal of Quantitative Criminology, 18(4), 377–395.
Migliore, L. A. (2011). Relation between Big Five personality traits and Hofstede’s cultural dimen-sions: Samples from the USA and India. Cross-Cultural Management, 18(1), 38–54.
Minkov, M. (2006). Otrazhenia na culturata vyrhu srednovekovnia skandinavski i angliiski ezik i tehnite syvremennit varianti [Cultural influences on medieval Scandinavian and English language and their modern variants]. Unpublished doctoral dissertation, University of Sofia, Bulgaria.
Minkov, M. (2007). What makes us different and similar: A new interpretation of the World Values Survey and other cross-cultural data. Sofia, Bulgaria: Klasika i Stil.
Minkov, M. (2008). Self-enhancement and self-stability predict school achievement at the national level. Cross-Cultural Research, 42(2), 172–196.
Minkov, M. (2009a). Nations with more dialectical selves exhibit lower polarization in life quality judgments and social opinions. Cross-Cultural Research, 43(3), 230–250.
Minkov, M. (2009b). Predictors of differences in subjective well-being across 97 nations. Cross-Cultural Research, 43(2), 152–179.
Minkov, M. (2009c). Risk-taking reproductive competition explains national murder rates better than socioeconomic inequality. Cross-Cultural Research, 43(1), 3–29.
Minkov, M. (2010). Predictors of national suicide rates: A reply to Voracek (2004, 2006, 2009). Psychological Reports, 106(3), 718–720.
Minkov, M. (2011). Cultural differences in a globalizing world. Bingley, UK: Emerald.Minkov, M., & Blagoev, V. (2009). Cultural values predict subsequent economic growth.
International Journal of Cross-Cultural Management, 9(1), 5–24.Minkov, M., & Blagoev, V. (2012). What do Project GLOBE’s cultural dimensions reflect? An
empirical perspective. Asia Pacific Business Review, 18(1), 27–43.Minkov, M., & Hofstede, G. (2012a). Hofstede’s fifth dimension: New evidence from the World
Values Survey. Journal of Cross-Cultural Psychology, 43(1), 3–14.Minkov, M., & Hofstede, G. (2012b). Is national culture a meaningful concept? Cultural values
delineate clear national clusters of in-country regions. Cross-Cultural Research 46(2), 133–159.Miyamoto, Y., Nisbett, R. E., & Masuda, T. (2006). Culture and the physical environment:
Holistic versus analytic perceptual affordances. Psychological Science, 17(2), 113–119.Montesquieu, C. L. S. (1748). De l’esprit des lois [The spirit of laws]. Geneva: Barillot.

Moor, N., Ultee, W ., & Need, A. (2009). Analogical reasoning and the content of creation sto-ries: Quantitative comparisons of preindustrial societies. Cross-Cultural Research, 43(2), 91–122.
Moore, A. R., & Oppong, J. (2006). Sexual risk behavior among people living with HIV/AIDS in Togo. Social Science and Medicine, 64(5), 1057–1066.
Morris, M. W., Leung, K., Ames, D., & Lickel, B. (1999). Views from inside and outside: Integrating emic and etic insights about culture and justice judgment. Academy of Management Review, 24(4), 781–796.
Mulder, M. (1971). Power equalization through participation? Administrative Science Quarterly, 16, 31–38.
Mullis, I. V. S., Martin, M. O., & Foy, P. (2005). IEA’s TIMSS 2003 international report on achievement in the mathematics cognitive domains: Findings from a developmental project. Chestnut Hill, MA: TIMSS and PIRLS International Study Center.
Mullis, I. V. S., Martin, M. O., & Foy, P. (2007). TIMSS 2007 international mathematics report: Findings from IEA’s Trends in International Mathematics and Science Study at the fourth and eighth grades. Chestnut Hill, MA: TIMSS and PIRLS International Study Center.
Mullis, I. V. S., Martin, M. O., Gonzalez, E. J., Gregory, K. D., Garden, R. A., O’Connor, K. M., et al. (2000). TIMSS 1999: International mathematics report: Findings from IEA’s repeat of the Third International Mathematics and Science Study at the eighth grade. Chestnut Hill, MA: Boston College, Lynch School of Education, International Study Center.
Murdock, G. P. (1940). The cross-cultural survey. American Sociological Review, 5, 361–370.Murdock, G. P., & White, D. R. (1969). Standard cross-cultural sample. Ethnology, 9, 329–369.Murray, D. R., & Schaller, M. (2010). Historical prevalence of infectious diseases within 230
geopolitical regions: A tool for investigating origins of culture. Journal of Cross-Cultural Psychology, 41(1), 99–108.
Na, J., Grossman, I., Varnum, M. E. W., Kitayama, S., Gonzalez, R., & Nisbett, R. (2010). Cultural differences are not always reducible to individual differences. Proceedings of the National Academy of Sciences, USA, 107(14), 6192–6197.
Nakata, C. (Ed.). (2009). Beyond Hofstede: Culture frameworks for global marketing and manage-ment. London: Palgrave Macmillan.
Neeleman, A., & Szendroi, K. (2005). Pro drop and pronouns. In J. Alderete et al. (Eds.), Proceedings of the 24th West Coast Conference on Formal Linguistics (pp. 229–307). Somerville, MA: Cascadilla Proceedings Project.
Neisser, U., Boodoo, G., Bouchard, T. J., Jr., Boykin, A. W., Brody, N., Ceci, S. J., et al. (1996). Intelligence: Knowns and unknowns. American Psychologist, 51(2), 77–101.
Neuijen, B. (1992). Diagnosing organizational cultures: Patterns of continuance and change. Groningen, Netherlands: Wolters-Noordhoff.
Neumayer, E. (2003). Good policy can lower violent crime: Evidence from a cross-national panel of homicide rates, 1980–97. Journal of Peace Research, 40(6), 619–640. Retrieved March 27, 2008, from http://eprints.lse.ac.uk/618/1/JPR_(Homicide).pdf.
Newson, L., Richerson, P. J., & Boyd, R. (2007). Cultural evolution and the shaping of cultural diversity. In S. Kitayama & D. Cohen (Eds.), Handbook of cultural psychology (pp. 454–476). New York: Guildford.
Nisbett, R. E. (2003). The geography of thought. How Asians and Westerners think differently . . . and why. New York: Free Press.
Nisbett, R. E. (2005). Heredity, environment and race differences in IQ: A commentary on Rushton and Jensen, 2005. Psychology, Public Policy, and Law, 11(2), 302–310.
Nisbett, R. E., & Cohen, D. (1996). Culture of honor: The psychology of violence in the South. Boulder, CO: Westview.
References ◆ 459

460 ◆ Cross-Cultural Analysis
Nisbett, R. E., & Miyamoto, Y. (2005). The influence of culture: Holistic versus analytic percep-tion. Trends in Cognitive Science, 9(10), 467–473.
Nisbett, R. E., Peng, K., Choi, I., & Norenzayan, A. (2001). Culture and systems of thought: Holistic vs. analytic cognition. Psychological Review, 108(2), 291–310.
Noorderhaven, N. G., & Tidjani, B. (2001). Culture, governance, and economic performance: An explorative study with a special focus on Africa. International Journal of Cross-Cultural Management, 1(1), 31–52.
Nunez, R., Corti, D., & Retschitzki, J. (1998). Mental rotation in children from Ivory Coast and Switzerland. Journal of Cross-Cultural Psychology, 29(4), 577–589.
Oladipo, G. S., Fawehinmi, H. B., Edibamode, E.-E., Osunwoke, E. A., & Ordu, K. S. (2009). Second to fourth digit ratio in Nigerian Igbos and Yorubas. Scientific Research and Essay, 4(10), 1146–1148.
Organisation for Economic Co-operation and Development (OECD). (2009). Usual working hours per week by gender, 2007 (LMF7.1). In OECD family database. Retrieved November 20, 2009, from www.oecd.org/els/social/family/database.
Organisation for Economic Co-operation and Development Project for International Student Assessment (OECD PISA). (2003). PISA 2003 [Database]. Retrieved November, 2, 2007, from http://pisaweb.acer.edu.au/oecd_2003/oecd_pisa_data_s2.php.
Orubuloye, I. O., Caldwell, J. C., & Caldwell, P. (1992). Diffusion and focus in sexual networking: Identifying partners and partners’ partners. Studies in Family Planning, 23(6, Pt. 1), 343–351.
Orubuloye, I. O., Caldwell, J. C., & Caldwell, P. (1997). Perceived male sexual needs and male sexual behaviour in southwest Nigeria. Social Science and Medicine, 44(8), 1195–1207.
Oswalt, W. H. (1986). Life cycles and lifeways: An introduction to cultural anthropology. Palo Alto, CA: Mayfield.
Ouchi, W. G., & Wilkins, A. L. (1985). Organizational culture. Annual Review of Sociology, 11, 475–483.
Oyserman, D., Coon, H. M., & Kemmelmeier, M. (2002). Rethinking individualism and collectiv-ism: Evaluation of theoretical assumptions and meta-analyses. Psychological Bulletin, 128(1), 3–72.
Padilla, A. (2002). Hispanic psychology: A 25-year retrospective look. In W. J. Lonner, D. L. Dinnel, S. A. Hayes, & D. N. Sattler (Eds.), Online readings in psychology and culture. Retrieved November 26, 2005, from http://www.wwu.edu/culture/readings.htm.
Paez, D., Liu, J. H., Techio, E., Slawuta, P., Zlobina, A., & Cabecinhas, R. (2008). “Remembering” World War II and willingness to fight: Socio-cultural factors in the social representation of historical warfare across 22 societies. Journal of Cross-Cultural Psychology, 39(4), 373–380.
Parker, P. M. (1997). National cultures of the world: A statistical reference. Westport, CT: Greenwood.
Parsons, T., et al. (2001). Some fundamental categories of the theory of action: A general statement. In T. Parsons & E. A. Shils (Eds.), Toward a general theory of action: Theoretical foundations for the social sciences (pp. 3–29). New Brunswick, NJ: Transaction. (Original work published 1951)
Parsons, T., & Shils, E. A. (Eds.). (2001). Toward a general theory of action: Theoretical founda-tions for the social sciences. New Brunswick, NJ: Transaction. (Original work published 1951)
Paunonen, S. V., & Ashton, M. C. (1998). The structured assessment of personality across cultures. Journal of Cross-Cultural Psychology, 29(1), 150–170.
Paunonen, S. V., Keinonen, M., Trzebinski, J., Fosterling, F., Grishenkoroze, N., Kouznetsova, L., & Chan, D. W. (1996). The structure of personality in six cultures. Journal of Cross-Cultural Psychology, 27(3), 339–353.
Peabody, D. (1985). National characteristics. Cambridge, UK: Cambridge University Press.

Peng, K., & Nisbett, R. E. (1999). Culture, dialectics, and reasoning about contradiction. American Psychologist, 54(9), 741–754.
Peng, K., & Nisbett, R. E. (2000). Dialectical responses to questions about dialectical thinking. American Psychologist, 55(9), 1067–1068.
Peng, K., Spencer-Rodgers, J., & Nian, Z. (2006). Naive dialecticism and the Tao of Chinese thought. In U. Kim, K. S. Yang, & K. K. Hwang (Eds.), Indigenous and cultural psychology: Understanding people in context (Chap. 11, pp. 247–262). New York: Springer.
Peng, T. K., Peterson, M. F., & Shyi, Y.-P. (1991). Quantitative methods in cross-national man-agement research: Trends and equivalence issues. Journal of Organizational Behavior, 12(2), 87–107.
Pepitone, A., & Triandis, H. C. (1987). On the universality of social psychological theories. Journal of Cross-Cultural Psychology, 18(4), 471–498.
Peregrine, P. N., Ember, C. R., & Ember, M. (2004). Universal patterns in cultural evolution: An empirical analysis using Guttman scaling. American Anthropologist, 106(1), 145–149.
Peters, T. J., & Waterman, R. H. (1982). In search of excellence: Lessons from America’s best-run companies. New York: Harper & Row.
Peterson, M. F. (2003). Review of the book Culture’s consequences: Comparing values, behaviors, institutions, and organizations across nations (2nd ed.). Administrative Science Quarterly, 48(1), 127–131.
Peterson, M. F. (2011). Organizational culture and organization theory. In N. M. Ashkanasy, C. P. M. Wilderom, & M. F. Peterson (Eds.), Handbook of organizational culture and climate (2nd ed., pp. 415–422). Thousand Oaks, CA: Sage.
Peterson, M. F., & Castro, S. L. (2006). Measurement metrics at aggregate levels of analysis: Implications for organization culture research and the GLOBE project. Leadership Quarterly, 17(5), 506–521.
Peterson, M. F., & Fanimokun, A. (2008, July). National subculture differences in use of social structures for four Nigerian ethnic groups. Paper presented at the International Congress of Cross-Cultural Psychology, Bremen, Germany.
Peterson, M. F., Fanimokun, A., Mogaji, A., & Smith, P. B. (2006, August). National subcul-ture differences in use of social structures: A comparison of Nigerian Hausa, Yoruba and Ibo managers. Paper presented at the annual meeting of the Academy of Management, Atlanta, GA.
Peterson, M. F., & Pike, K. L. (2002). Emics and etics for organizational studies: A lesson in con-trast from linguistics. International Journal of Cross-Cultural Management, 21(1), 5–19.
Peterson, M. F., & Smith, P. B. (2008). Social structures and processes in cross-cultural manage-ment. In P. B. Smith, M. F. Peterson, & D. C. Thomas (Eds.). The handbook of cross-cultural management research (pp. 35–58). Thousand Oaks, CA: Sage.
Peterson, M. F., & Wood, R. E. (2008). Cognitive structures and processes in cross-cultural management. In P. B. Smith, M. F. Peterson, & D. C. Thomas (Eds.), The handbook of cross-cultural management research (pp. 15–33). Thousand Oaks, CA: Sage.
Pew Research Center. (2002). What the world thinks in 2002: How global publics view their lives, their countries, the world, America. Retrieved November 8, 2005, from http://people-press.org. (Survey results at http://people-press.org/reports/pdf/165topline.pdf)
Pew Research Center. (2003). Views of a changing world 2003. Retrieved November 8, 2005, from http://people-press.org. (Survey results at http://people-press.org/reports/pdf/185topline.pdf)
Pew Research Center. (2006). Spirit and power: A 10-country survey of Pentecostals. (2006). Retrieved May 20, 2011, from http://pewforum.org/Christian/Evangelical-Protestant-Churches/Spirit-and-Power.aspx. (Survey results in ttp://pewforum.org/uploadedfiles/Orphan_Migrated_Content/pentecostals-topline-06.pdf)
References ◆ 461

462 ◆ Cross-Cultural Analysis
Pew Research Center. (2007). Global opinion trends 2002–2007. Retrieved February 20, 2008, from http://pewglobal.org/reports/pdf/257.pdf and http://pewglobal.org/reports/pdf/257topline-trend.pdf.
Pew Research Center. (2010a). Gender equality universally embraced, but inequalities acknowl-edged. Retrieved June 2, 2011, from http://pewglobal.org/2010/07/01/gender-equality.
Pew Research Center. (2010b). Muslim publics divided on Hamas and Hezbollah. Retrieved June 2, 2011, from http://pewglobal.org/2010/12/02/muslims-around-the-world-divided-on-hamas-and-hezbollah.
Picket, K. E., Mookherjee, J., & Wilkinson, R. G. (2005). Adolescent birth rates, total homicides and income inequality in rich countries. American Journal of Public Health, 95(7), 1181–1183.
Pike, K. L. (1967). Language in relation to a unified theory of the structure of human behavior. The Hague: De Gruyter Mouton.
Plomin, R., Asbury, K., & Dunn, J. (2001). Why are children in the same family so different? Nonshared environment a decade later. Canadian Journal of Psychiatry, 46(3), 225–233.
Poole, M. S. (1985). Communication and organizational climates: Review, critique, and a new perspective. In R. D. McPhee and P. K. Tompkins (Eds.), Organizational communication: Traditional themes and new direction (pp. 79–108). Beverly Hills, CA: Sage.
Poortinga, Y. H., & van de Vijver, F. J. R. (1987). Explaining cross-cultural differences: Bias analy-sis and beyond. Journal of Cross-Cultural Psychology, 18(3), 259–282.
Raghunathan, T., Lepkowski, J. M., van Hoewyk, J., & Solenberger, P. (2001). A multivariate technique for multiply imputing missing values using a sequence of regression models. Survey Methodology, 27(1), 85–95.
Ralston, D. A., Egri, C. P., De la Garza Carranza, M. T., Ramburuth, P., et al. (2009). Ethical preferences for influencing superiors: A 41-society study. Journal of International Business Studies, 40(6), 1022–1045.
Ralston, D. A., Holt, D. H., Terpstra, R. H., & Kai-Cheng, Y. (2008). The impact of national cul-ture and economic ideology on managerial work values: A study of the United States, Russia, Japan, and China. Journal of International Business Studies, 39(1), 8–26.
Read, A. F. (1991). Passerine polygyny: A role for parasites? American Naturalist, 138(2), 434–459.Reynolds, P. D. (1986). Organizational culture as related to industry, position and performance: A
preliminary report. Journal of Management Studies, 23(3), 333–345.Richardson, K. (2002). What IQ tests test. Theory and Psychology, 12(3), 283–314.Robbins, S. P. (1998). Organizational behavior: Concepts, controversies, applications (8th ed.).
Upper Saddle River, NJ: Prentice Hall.Robinson, W. S. (1950). Ecological correlations and the behavior of individuals. American
Sociological Review, 15(3), 351–357.Roccas, S., Sagiv, L., Schwartz, S., & Knafo, A. (2002). The Big Five personality factors and per-
sonal values. Personality and Social Psychology Bulletin, 28(6), 789–801.Rogosa, D. (1980). A critique of cross-lagged correlation. Psychological Bulletin, 88(2), 245–258.Rohner, R. P. (1984). Toward a conception of culture for cross-cultural psychology. Journal of
Cross-Cultural Psychology, 15(2), 111–138.Rokeach, M. (1968). A theory of organization and change within value-attitude systems. Journal
of Social Issues, 24(1), 13–33.Rokkan, S., Verba, S., Viet, J., & Almasy, E. (1969). Comparative survey analysis. The Hague: Mouton.Ronen, S., & Shenkar, O. (1985). Clustering countries on attitudinal dimensions: A review and
synthesis. Academy of Management Review, 10(3), 435–454.Rostow, W. W. (1990). Theorists of economic growth from David Hume to the present: With a
perspective on the next century. Oxford, UK: Oxford University Press.Rotter, J. B. (1966). Generalized expectancies for internal versus external control of reinforcement.
Psychological Monographs, 80(1), 1–28.

Rushton, J. P. (2000). Race, evolution, and behavior: A life history perspective (2nd special abr. ed.). Port Huron, MI: Charles Darwin Research Institute.
Rushton, J. P., & Jensen, A. R. (2005). Thirty years of research on race differences in cognitive ability. Psychology, Public Policy, and Law, 11(2), 235–294.
Rushton, J. P., & Jensen, A. R. (2006). The totality of available evidence shows the race-IQ gap still remains. Psychological Science, 17(10), 921–922.
Rushton, J. P., & Jensen, A. R. (2008). James Watson’s most inconvenient truth: Race realism and the moralistic fallacy. Medical Hypotheses, 71(5), 629–640.
Rushton, J. P., & Jensen, A. R. (2010). Race and IQ: A theory-based review of the research in Richard Nisbett’s Intelligence and How to Get It. The Open Psychology Journal, 3(1), 9–35.
Sagiv, L., Schwartz, S. H., & Arieli, S. (2011). Personal values, national culture and organizations: Insights applying the Schwartz value framework. In N. M. Ashkanasy, C. P. M. Wilderom, & M. F. Peterson (Eds.), Handbook of organizational culture and climate (2nd ed., pp. 515–537). Thousand Oaks, CA: Sage.
Schachner, D. A., Scheib, J. A., Gillath, O., & Shaver, P. R. (2005). Worldwide economic develop-ment and gender equality correlate with liberal sexual attitudes and behavior: What does this tell us about evolutionary psychology? Behavioral and Brain Sciences, 28(2), 293–294. (Open peer commentary to Schmitt, 2005)
Schimmack, U., Oishi, S., & Diener, E. (2002). Cultural influences on the relation between pleasant emotions and unpleasant emotions: Asian dialectic philosophies or individualism-collectivism? Cognition and Emotion, 16(6), 705–719.
Schimmack, U., Oishi, S., & Diener, E. (2005). Individualism: A valid and important dimension of cultural differences between nations. Personality and Social Psychology Review, 9(1), 17–31.
Schimmack, U., Radhakrishnan, P., Oishi, S., Dzokoto, V., & Ahadi, S. (2002). Culture, per-sonality, and subjective well-being: Integrating process models of life satisfaction. Journal of Personality and Social Psychology, 82(4), 582–593.
Schloesser, O., & Frese, M. (2008, July 27–31). Humane orientation and agreeableness as cul-tural dimensions: Individual-level measures vs. culture-level measures. In F. Deutsch, L. Tadesse, N. Schnelle, J. Price, & K. Boehnke (Eds.), Crossing borders: (Cross)-cultural psychology as an inter-disciplinary multi-method endeavor (p. 555). Book of abstracts of the 19th International Congress of the International Association for Cross-Cultural Psychology, Jacobs University, Bremen, Germany.
Schmitt, D. P. (2005). Sociosexuality from Argentina to Zimbabwe: A 48-nation study of sex, cul-ture, and strategies of human mating. Behavioral and Brain Sciences, 28, 247–275.
Schmitt, D. P., et al. (2004a). Patterns and universals of adult romantic attachment across 62 cul-tural regions: Are models of self and of other pancultural constructs? Journal of Cross-Cultural Psychology, 35(4), 367–402.
Schmitt, D. P., et al. (2004b). Patterns and universals of mate poaching across 53 nations: The effect of sex, culture, and personality on romantically attracting another person’s partner. Journal of Personality and Social Psychology, 86(4), 560–584.
Schmitt, D. P., & Allik, J. (2005). Simultaneous administration of the Rosenberg self-esteem scale in 53 nations: Exploring the universal and culture-specific features of global self-esteem. Journal of Personality and Social Psychology, 89(4), 623–642.
Schmitt, D. P., Allik, J., McCrae, R. R., & Benet-Martinez, V. (2007). The geographic distribution of Big Five personality traits: Patterns and profiles of human self-description across 56 nations. Journal of Cross-Cultural Psychology, 38(2), 173–212.
Schumpeter, J. A. (2003). Capitalism, socialism and democracy. London: Routledge. (Original work published 1942)
Schwartz, S. H. (1994). Beyond individualism/collectivism: New cultural dimensions of values. In U. Kim, C. Kagitcibasi, H. C. Triandis, S. C. Choi, & G. Yoon (Eds.), Individualism and col-lectivism: Theory, method, and application (pp. 85–119). Thousand Oaks, CA: Sage.
References ◆ 463

464 ◆ Cross-Cultural Analysis
Schwartz, S. H. (2007). Universalism values and the inclusiveness of our moral universe. Journal of Cross-Cultural Psychology, 38(6), 711–728.
Schwartz, S. H. (2011). Studying values: Personal adventure, future directions. Journal of Cross-Cultural Psychology, 42(2), 307–319.
Schwartz, S. H., & Bardi, A. (2001). Value hierarchies across cultures: Taking a similarities per-spective. Journal of Cross-Cultural Psychology, 32(3), 268–290.
Schwartz, S. H., Melech, G., Lehman, A., Burgess, S., Harris, M., & Owens, V. (2001). Extending the cross-cultural validity of the theory of basic human values with a different method of mea-surement. Journal of Cross-Cultural Psychology, 32(5), 519–542.
Schwartz, S. H., & Sagiv, L. (1995). Identifying culture-specifics in the content and structure of values. Journal of Cross-Cultural Psychology, 26(1), 92–116.
Schweder, R. A. (1973). The between and within of cross-cultural research. Ethos, 1(4), 531–545.Sedikides, C., Gaertner, L., & Toguchi, Y. (2003). Pan-cultural self-enhancement. Journal of
Personality and Social Psychology, 84(1), 60–79.Sedikides, C., Gaertner, L., & Vevea, J. L. (2005). Pancultural self-enhancement reloaded: A meta-
analytic reply to Heine, 2005. Journal of Personality and Social Psychology, 89(4), 539–551.Segall, M. H. (1984). More than we need to know about culture but are afraid not to ask. Journal
of Cross-Cultural Psychology, 15(2), 153–162.Segall, M. H., Campbell, D. T., & Herskovits, M. J. (1963). Cultural differences in the perception
of geometric illusions. Science, 139(3556), 769–771.Shenkar, O. (2001). Cultural distance revisited: Toward a more rigorous conceptualization and
measurement of cultural differences. Journal of International Business Studies, 32(3), 519–535.Simpson, J. A., & Gangestad, S. W. (1991). Individual differences in sociosexuality: Evidence for
convergent and discriminant validity. Journal of Personality and Social Psychology, 60(6), 870–883.
Singelis, T. M. (1994). The measurement of independent and interdependent self-construals. Personality and Social Psychology Bulletin, 20(5), 580–591.
Singelis, T. M., Bond, M. H., Sharkey, W. F., & Lai, C. S. Y. (1999). Unpackaging culture’s influ-ence on self-esteem and embarassability: The role of self-construals. Journal of Cross-Cultural Psychology, 30(3), 315–341.
Smith, A. (1777). An inquiry into the nature of causes of the wealth of nations. London: Strahan & Cadell.
Smith, P. B. (2004a). Acquiescence response bias as an aspect of cultural communication style. Journal of Cross-Cultural Psychology, 35(1), 50–61.
Smith, P. B. (2004b). Nations, cultures, and individuals: New perspectives and old dilemmas. Journal of Cross-Cultural Psychology, 35(1), 6–12.
Smith, P. B. (2006). When elephants fight, the grass gets trampled: The GLOBE and Hofstede proj-ects. Journal of International Business Studies, 37(6), 915–921.
Smith, P. B. (2011). Communication styles as dimensions of national culture. Journal of Cross-Cultural Psychology, 42(2), 216–233.
Smith, P. B., & Bond, M. H. (1993). Social psychology across cultures: Analysis and perspectives. New York: Harvester Wheatsheaf.
Smith, P. B., Dugan, S., & Trompenaars, F. (1996). National culture and the values of organi-zational employees: A dimensional analysis across 43 nations. Journal of Cross-Cultural Psychology, 27(2), 231–264.
Smith, P. B., Peterson, M., & Schwartz, S. H. (2002). Cultural values, sources of guidance, and their relevance to managerial behavior: A 47-nation study. Journal of Cross-Cultural Psychology, 33(2), 188–208.
Smith, P. B., Trompenaars, F., & Dugan, S. (1995). The Rotter locus of control scale in 43 coun-tries: A test of cultural relativity. International Journal of Psychology, 30(3), 377–400.

Smith, T. B. (2003). Developing comparable questions in cross-national surveys. In J. Harkness, F. J. R. van de Vijver, & P. Ph. Mohler (Eds.), Cross-cultural survey methods (pp. 69–92). Hoboken, NJ: Wiley.
Solow, R. (1956). A contribution to economic growth. Quarterly Journal of Economics, 70(1), 65–94.
Spearman, C. (1904). “General intelligence” objectively determined and measured. American Journal of Psychology, 15, 201–293.
Spencer-Rodgers, J., Peng, K., Wang, L., & Hou, Y. (2004). Dialectical self-esteem and East-West differences in psychological well-being. Personality and Social Psychology Bulletin, 30(11), 1416–1432.
Stahl, G. K. (2008). Cultural dynamics and impact of cultural distance within mergers and acquisi-tions. In P. B. Smith, M. F. Peterson, & D. C. Thomas (Eds.), The handbook of cross-cultural management research (pp. 431–448). Thousand Oaks, CA: Sage.
StatSoft. (1984–2004). STATISTICA [Electronic statistics textbook]. Retrieved from http://www.statsoft.com/textbook/.
Steel, P., & Ones, D. S. (2002). Personality and happiness: A national-level analysis. Journal of Personality and Social Psychology (3), 767–781.
Sternberg, R. (2002). Cultural explorations of human intelligence around the world. In W. J. Lonner, D. L. Dinnel, S. A. Hayes, & D. N. Sattler (Eds.), Online readings in psychology and culture (Unit 5, Chap. 1). Retrieved November 18, 2008, from http://www.wwu.edu/culture/readings.htm.
Sternberg, R. J. (2005). There are no public-policy implications: A reply to Rushton and Jensen, 2005. Psychology, Public Policy, and Law, 11(2), 295–301.
Sternberg, R. J. (2007). Intelligence and culture. In S. Kitayama & D. Cohen (Eds.), Handbook of cultural psychology (pp. 547–568). New York: Guildford.
Stipek, D. (1998). Differences between Americans and Chinese in the circumstances evoking pride, shame and guilt. Journal of Cross-Cultural Psychology, 29(5), 616–629.
Stouffer, S. A., & Toby, J. (1951). Role conflict and personality. The American Journal of Sociology, 56(5), 395–406.
Straus, M. A. (2009). The national context effect: An empirical test of the validity of cross-national research using unrepresentative samples. Cross-Cultural Research, 43(3), 183–205.
Suh, E. M. (2002). Culture, identity consistency, and subjective well-being. Journal of Personality and Social Psychology, 83(6), 1378–1391.
Sully de Luque, M., & Javidan, M. (2004). Uncertainty avoidance. In R. J. House, P. J. Hanges, M. Javidan, P. W. Dorfman, & V. Gupta (Eds.), Culture, leadership, and organizations: The GLOBE study of 62 societies (pp. 602–653). Thousand Oaks, CA: Sage.
Suls, J., Marco, C. A., & Tobin, S. (1991). The role of temporal comparison, social comparison, and direct appraisal in the elderly’s self-evaluations of health. Journal of Applied Social Psychology, 21, 1125–1144.
Svartberg, K., & Forkman, B. (2002). Personality traits in the domestic dog (Canis familiaris). Applied Animal Behavior Science, 79(2), 133–155.
Svensson, J. (2005). Eight questions about corruption. Journal of Economic Perspectives, 19(3), 19–42.
Szirmak, Z., & De Raad, B. (1994). Taxonomy and structure of Hungarian personality traits. European Journal of Personality, 8(2), 95–117.
Taft, R. (1976). Cross-cultural psychology as a social science: Comments on Facheux’s paper. European Journal of Social Psychology, 6, 323–330.
Tang, H., Quertermous, T., Rodriguez, B., Kardia, S. L. R., Zhu, X., Brown, A., et al. (2005). Genetic structure, self-identified race/ethnicity, and confounding in case-control association studies. American Journal of Human Genetics, 76(2), 268–275.
References ◆ 465

466 ◆ Cross-Cultural Analysis
Tannenbaum, R., & Schmidt, W. H. (1958). How to choose a leadership pattern. Harvard Business Review, 36(4), 95–101.
Taras, V., Kirkman, B. L., & Steel, P. (2010). Examining the impact of Culture’s Consequences: A three-decade, multilevel, meta-analytic review of Hofstede’s cultural value dimensions. Journal of Applied Psychology, 95(3), 405–439.
Terracciano, A., et al. (2005). National character does not reflect mean personality trait levels in 49 cultures. Science, 310(5745), 96–100.
Thorndike, E. L. (1939). On the fallacy of imputing the correlations found for groups to the indi-viduals or smaller groups composing them. American Journal of Psychology, 52, 122–124.
Todd, E. (1983). La troisieme planete: Structures familiales et systemes ideologiques [The third planet: Family structures and ideological systems]. Paris: Seuil.
Tönnies, F. (1963). Community and society. New York: Harper & Row. (Original work published 1887)
Torgerson, W. (1952). Multidimensional scaling I: Theory and method. Psychometrika, 17(4), 401–419.
Transparency International. (2006). Corruption perceptions index 2006. Retrieved November 20, 2006, from http://www.transparency.org/policy_research/surveys_indices/cpi/2006.
Triandis, H. C. (1972). The analysis of subjective culture. New York: John Wiley.Triandis, H. C. (2004). Foreword. In R. J. House, P. J. Hanges, M. Javidan, P. W. Dorfman, &
V. Gupta (Eds.), Culture, leadership, and organizations: The GLOBE study of 62 societies (pp. xv–xix). Thousand Oaks, CA: Sage.
Triandis, H. C., Bontempo, R., Villareal, M. J., Asai, M., & Lucca, N. (1988). Individualism and collectivism: Cross-cultural perspectives on self-ingroup relationships. Journal of Personality and Social Psychology, 54(2), 323–338.
Triandis, H. C., Chen, X. P., & Chan, D. K. S. (1998). Scenarios for the measurement of collectiv-ism and individualism. Journal of Cross-Cultural Psychology, 29(2), 275–289.
Triandis, H. C., Leung, K., Villareal, M. J., & Clack, F. L. (1985). Allocentric versus idiocentric tendencies: Convergent and discriminant validation. Journal of Research in Personality, 19(4), 395–415.
Triandis, H. C., McCusker, C., Betancourt, H., Iwao, S., Leung, K., Salazar, J. M., et al. (1993). An etic-emic analysis of individualism and collectivism. Journal of Cross-Cultural Psychology, 24(3), 366–383.
Trice, H. M., & Beyer, J. M. (1993). The culture of work organizations. Englewood Cliffs, NJ: Prentice Hall.
Trompenaars, F. (1993). Riding the waves of culture. London: Economist Books.Trompenaars, F., & Hampden-Turner, C. (1999). Riding the waves of culture. London: Nicholas
Brealy.Tucker, T. G. (1931). Etymological dictionary of Latin. Chicago: Ares Publishers.Tung, R. L., & Verbeke, A. (2010). Beyond Hofstede and GLOBE: Improving the quality of cross-
cultural research. Journal of International Business Studies, 41(8), 1259–1274.Tylor, E. B. (1871). Primitive culture. London: John Murray.UN Development Programme. (2007/2008). Human development reports. Retrieved March, 14,
2008, from http://hdrstats.undp.org/indicators/147.html.UN Office on Drugs and Crime. (2004). Seventh United Nations survey of crime trends and opera-
tions of criminal justice systems, covering the period 1998–2000. Retrieved January 20, 2006, from http://www.unodc.org/pdf/crime/seventh_survey/7sv.pdf.
UN Office on Drugs and Crime. (2010). UNODC crime and criminal justice statistics [Database]. Retrieved August 20, 2010, from http://www.unodc.org/unodc/en/data-and-analysis/ crimedata.html.

UN Statistics Division. (2008). UN statistical databases: Social indicators. Statistics and indicators on women and men. Retrieved October 12, 2008, from http://unstats.un.org.
UN Statistics Division. (2009). National accounts main aggregates database. Retrieved September 5, 2009, from http://unstats.un.org/unsd/snaama/Introduction.asp.
UN Statistics Division. (2010). Statistics and indicators on women and men. Retrieved November 15, 2010, from http://unstats.un.org/unsd/demographic/products/indwm/statistics.htmhttp://unstats.un.org/unsd/demographic/products/indwm/statistics.htm.
Uskul, A. K., Kitayama, S., & Nisbett, R. E. (2008). Ecocultural basis of cognition: Farmers and fishermen are more holistic than herders. Proceedings of the National Academy of Sciences, USA, 105(25), 8552–8556.
van de Vijver, F. J. R. (2011). Bias and real differences in cross-cultural differences: Neither friends nor foes. In F. J. R. van de Vijver, A. Chasiotis, & S. M. Breugelmans (Eds.), Fundamental questions in cross-cultural psychology (pp. 235–257). New York: Cambridge University Press.
van de Vijver, F. J. R., Chasiotis, A., & Breugelmans, S. M. (2011). Fundamental questions in cross-cultural psychology. In F. J. R. van de Vijver, A. Chasiotis, & S. M. Breugelmans (Eds.), Fundamental questions in cross-cultural psychology (pp. 9–35). New York: Cambridge University Press.
van de Vijver, F. J. R., & Leung, K. (1997a). Methods and data analysis for cross-cultural research. Thousand Oaks, CA: Sage.
van de Vijver, F. J. R., & Leung, K. (1997b). Methods and data analysis of comparative research. In J. W. Berry, Y. H. Poortinga, & J. Pandey (Eds.), Handbook of cross-cultural psychology: Vol. 1. Theory and method (pp. 257–300). Needham Heights, MA: Allyn & Bacon.
van de Vijver, F. J. R., & Leung, K. (2000). Methodological issues in psychological research on culture. Journal of Cross-Cultural Psychology, 31(1), 33–51.
van de Vijver, F. J. R., & Poortinga, Y. H. (1982). Cross-cultural generalization and universality. Journal of Cross-Cultural Psychology, 13(4), 387–408.
van de Vliert, E. (2009). Climate, affluence, and culture. New York: Cambridge University Press.van de Vliert, E., & Janssen, O. (2002). “Better than” performance motives as roots of satisfac-
tion across more and less developed countries. Journal of Cross-Cultural Psychology, 33(4), 380–397.
van de Vliert, E., Kluwer, E. S., & Lynn, R. (2000). Citizens of warmer countries are more competi-tive and poorer: Culture or chance? Journal of Economic Psychology, 21(2), 143–165.
van de Vliert, E., & Smith, P. B. (2004). Leader reliance on subordinates across nations that differ in development and climate. Leadership Quarterly, 15(3), 381–403.
van Herk, H., Poortinga, Y. H., & Verhallen, T. M. M. (2004). Response styles in rating scales: Evidence of method bias in data from six EU countries. Journal of Cross-Cultural Psychology, 35(3), 346–360.
Varga, K. (2009). Desirable versus desired: Different insulations from observability: An evolution-ary step in value theory? Journal of Human Values, 14(2), 129–140.
Veenhoven, R. (2007). Measures of gross national happiness. In Statistics, knowledge, and policy: Measuring and fostering the progress of societies (pp. 231–253). Paris: Organisation for Economic Co-operation and Development. Retrieved November 10, 2008, from http://mpra.ub.uni-muenchen.de/11280/.
Veenhoven, R., & Ehrhardt, J. (1995). The cross-national pattern of happiness: Test of predictions implied in three theories of happiness. Social Indicators Research, 34(1), 33–68.
Venaik, S., & Brewer, P. (2010). Avoiding uncertainty in Hofstede and GLOBE. Journal of International Business Studies, 41(8), 1294–1315.
Von Horn, A., Backman, L., Davidsson, T., & Hansen, S. (2010). Empathizing, systemizing and finger length ratio in a Swedish sample. Scandinavian Journal of Psychology, 51(1), 31–37.
References ◆ 467

468 ◆ Cross-Cultural Analysis
Voracek, M. (2004). National intelligence and suicide rates: An ecological study of 85 countries. Personality and Individual Differences, 37(3), 543–553.
Voracek, M. (2006a). Exponential fitting of suicide rate and national intelligence estimates. Perceptual and Motor Skills, 102(3), 896–898.
Voracek, M. (2006b). Smart and suicidal? The social ecology of intelligence and suicide in Austria. Death Studies, 30(5), 471–485.
Voracek, M. (2009). National intelligence, suicide rate, and subjective well-being. Perceptual and Motor Skills, 109(3), 718–720.
Voracek, M., Bagdonas, A., & Dressler, S. G. (2007). Digit ratio (2D:4D) in Lithuania once and now: Testing for sex differences, relations with eye and hair color, and a possible secular change. Collegium Antropologicum, 31(3), 863–868.
Voracek, M., Manning, J. T., & Ponocny, I. (2005). Digit ratio (2D:4D) in homosexual and het-erosexual men from Austria. Archives of Sexual Behavior, 34(3), 335–340.
Vroom, V. H. (1964). Work and motivation. New York: John Wiley.Wang, E., Ding, Y.-C., Flodman, P., Kidd, J. R., Kidd, K. K., Grady, D. L., et al. (2004). The genetic
architecture of selection at the human dopamine receptor D4 (DRD4) gene locus. American Journal of Human Genetics, 74(5), 931–944.
Wasti, S. A., Lee, K., Ashton, M. C., & Somer, O. (2008). Six Turkish personality factors and the HEXACO model of personality structure. Journal of Cross-Cultural Psychology, 39(6), 665–684.
Way, B. M., & Lieberman, M. D. (2010). Is there a genetic contribution to cultural differences? Collectivism, individualism and genetic markers of social sensitivity. Social Cognitive and Affective Neuroscience, 5(2–3), 203–211.
Weber, M. (1930). The Protestant ethic and the spirit of capitalism (T. Parsons & A. Giddens, Trans.). London: Unwin Hyman. Retrieved October 10, 2004, from http://xroads.virginia.edu/~HYPER/WEBER/toc.html.
Weiss, A., King, J. E., & Figueredo, A. J. (2000). The heritability of personality factors in chimpan-zees (Pan troglodytes). Behavior Genetics, 30(3), 213–221.
Welkenhuysen-Gybels, J., Billiet, J., & Cambre, B. (2003). Adjustment for acquiescence in the assessment of the construct equivalence of Likert-type score items. Journal of Cross-Cultural Psychology, 34(6), 702–722.
Welzel, C. (2010). How selfish are self-expression values? A civicness test. Journal of Cross-Cultural Psychology, 41(2), 152–174.
White, D. R. (1988). Rethinking polygyny: Co-wives, codes and cultural systems. Current Anthropology, 29(4), 529–572.
White, L. A. (2007). The evolution of culture: The development of civilization to the fall of Rome. Walnut Creek, CA: Left Coast Press. (Original work published 1959)
Wilkinson, R. G., Kawachi, I., & Kennedy, B. P. (1998). Mortality, the social environment, crime and violence. Sociology of Health and Illness, 20(5), 578–597.
Williams, D., & Ispa, J. M. (1999). A comparison of the child-rearing goals of Russian and US university students. Journal of Cross-Cultural Psychology, 30(4), 540–546.
Wilson, M., & Daly, M. (1997). Life expectancy, economic inequality, homicide, and reproductive timing in Chicago neighbourhoods. British Medical Journal, 314(7089), 1271–1274.
Wilson, M., Daly, M. , & Pound, N. (2002). An evolutionary psychological perspective on the modulation of competitive confrontation and risk-taking. In D. W. Pfaff, A. P. Arnold, A. M. Etgen, S. E. Fahrbach, & R. T. Rubin (Eds.), Hormones, brain and behavior (Vol. 5, pp. 381–408). San Diego, CA: Academic Press.
Wilterdink, N. (1992). Images of national character in an international organization: Five European nations compared. Netherlands’ Journal of Social Sciences, 28(1), 31–49.

World Bank Group. (2009). World development indicators database. Retrieved March 10, 2009, from http://web.worldbank.org.
World Bank Research Advisory Staff. (1999). Why do savings rates vary across countries? World Bank Policy and Research Bulletin, 10(1). Retrieved November 1, 2006, from http://www.worldbank.org/html/dec/Publications/Bulletins/prb10,1.html.
World Health Organization. (2008b). World health statistics 2008. Geneva: WHO Press.World Health Organization. (2009a). Global status report on road safety: Time for action. Geneva:
WHO Press.World Health Organization. (2009b). Suicide rates per 100,000 by country, year and sex: Most
recent year available; as of 2009. Retrieved January 11, 2010, from http://www.who.int/mental_health/prevention/suicide_rates/en/index.html.
World Health Organization. (2010). HIV and AIDS estimates and data, 2005 and 2003. Retrieved April 16, 2010, from http://data.unaids.org/pub/GlobalReport/2006/2006_gr_ann2_en.pdf.
World Values Survey. (2006). On-line data analysis. Retrieved in June–November 2006 from www.worldvaluessurvey.com.
Zumbo, B. (2007). Three generations of DIF analyses: Considering where it has been, where it is now, and where it is going. Language Assessment Quarterly, 4(2), 223–233.
References ◆ 469

470 ◆
Achievement versus ascription, 239–240
Acquiescence, 100–101, 103–104, 117n9, 208
Adjusted R square, 179, 196n70Adolescent fertility, 23, 26–27, 132,
162, 172–173, 378–380, 415, 419, 431
Affective autonomy, 57, 226–227, 230
Agreeableness, 284–286, 288, 298Agricultura, 10Albritton, Frankie P., 5Allik, Juri, 297Allocentrism versus idiocentrism, 134Althingi, 39Amae, 68–69Amok, 90Analysis of the World Values Survey,
An (Inglehart and Baker), 261–267
discussion, 266–267national culture, hypothesized
dimensions of, 262questionnaire items, 262samples, 262statistical analysis, 262–266study’s contributions, 266
Analysis of the World Values Survey, An (Welzel), 350–357
collective action tendency dimension, 355–356
collectivism/individualism and egoism/altruism dimensions, 352–354
dimensions, hypothesized, 351discussion, 356–357generalized trust dimension,
354–355samples, 350–351self-expression values dimension,
351–352statistical analysis, 356study’s contributions, 356
Analysis of the World Values Survey Replicating Two Dimensions of the Chinese Values Survey, An (Minkov and Hofstede), 390–396
long-term orientation index, validation of, 394
questionnaire items, 391–392samples dimensions, hypothesized,
391discussion, 395–396familialism, validation of,
394–395, 391statistical analysis, 392–394study’s contributions, 395
Anthropology, 3Apollonian (cultures), 68Arab world. See Cultural differences,
between East Asia and the Arab world; Cultural differences, between the Arab world and sub-Saharan Africa
Artifacts, 14Assertiveness, 284, 311, 314, 325,
328
INDEX

Index ◆ 471
Attempt to Replicate Hofstede’s Four Dimensions, An (Merritt), 255–260
dimensions, hypothesized, 256discussion, 260individualism, 258masculinity, 258power distance index, 258questionnaire items, 256samples, 255–256statistical analysis, 256–259study’s contributions, 259–260uncertainty avoidance index, 258
Attitudes, 15, 20, 23, 34, 38n7, 42, 45, 47, 56n8, 116n5, 360
Autocorrelation, 126–127Autocorrelation problem. See Galton’s problemAutonomous, 331–332Autonomy versus conformism, 157, 179–180Auto-stereotypes, 47–48Average linkage, 163, 193n54
Baker, Wayne, 261Behavioral intentions, 45Behaviors
observable, 52–53self-reported, 45
Beliefs, 44–45, 50, 337–340Benedict, Ruth, 68n1Benet-Martinez, Veronica, 297Beta (multiple regression), 179, 195n68Big Five (personality traits), 12, 41, 54, 78,
92n13, 132, 156, 284, 297–304, 419Big Five Inventory, 297Block distances. See Manhattan distancesBond, Michael, 214, 217, 305
CAG gene, 30Caldwell, John, 431Cattell, Raymond, 79, 191n46Cause-and-effect relationships, 171–181
consilience approach, 172contextual consilience, 172exclusive consilience, 173methodological consilience, 172–173multiple regression analysis and, 174–181noncultural variables as potential
determinants of culture, 173–174predictive consilience, 173time sequence and, 173
Ceci, Stephen J., 164Ceulemans, Eva, 345Chambers, Robert, 89, 109Changeability, 23–24Charismatic, 308, 331, 335Chebyshev distance, 188n26, 189n34Children, values for, 44Chinese Culture Connection, 217–223Circumplex, 140–142, 146–147, 162Citizens’ scores, 191n47Clock accuracy, 247–249
Clustering, 166–171Cluster memberships, 167Cognitive ability, 121Cognitive patterns, 52Collective action tendency, 351, 355, 414Collectivism, 18n5, 21, 31, 70n8, 73–74,
81n2, 82n4, 83n7, 85, 96, 103, 113, 117n9, 134–136, 157, 184n15, 208–210, 221, 230, 236, 239–241, 244, 270, 311–312, 325–327, 337, 339, 349, 352–353, 356–357, 386–387, 389n6, 393
Communicable diseases, and cultural phenomena, 174
Comparability, cross-cultural. See Cross-cultural comparability
Comparison of Mean National and Ethnic Personality Traits, A (Self-Reports) (McCrae), 284–290
dimensions, hypothesized, 285, 289–290
questionnaire items, 285samples, 285statistical analysis, 285–288study’s contributions, 288–289
Competition theory, 379Competitiveness, 280, 282, 335, 338–339,
413, 416n6Complexity, 24–29Conceptual equivalence, 87Confucian work dynamism, 158, 164, 219,
221–223, 265, 270, 367, 390–391Conscientiousness, 82n5, 284, 290, 296, 298Conservatism, 121–122, 122n29, 225–227,
241, 393Consilience
approach, 172contextual, 172exclusive, 173methodological, 172–173predictive, 173
Constructs, defining empirically, 79–80Construct validity, 75, 297Contextual consilience, 172Control, locus of, 232–237Corporate values, 28Correlation, 23, 30, 34n6, 36n13, 41, 53, 67,
88, 97–98, 118n15, 126, 135, 137–139, 164–165, 172, 185n18, 268, 308, 331
Correlation matrix, World Values Survey, 138 (table)
Corruption, 22, 24, 44, 87, 112, 166–167, 182n11, 309, 380, 388, 389n8
Country names, abbreviations for, 440–441Cronbach’s alpha, 139, 156, 187n21Cross-cultural comparability, 84–92
criteria for etic approaches, 89etic individual-level constructs and, 87–89etic versus emic approaches, 85–87etic versus emic tests, 90incomparable phenomena, 87

472 ◆ Cross-Cultural Analysis
Cross-cultural comparisons, and use of nations as units in, 25–27
Cross-cultural psychology, 3Cross-cultural research
issues affecting data for, 109–112utility of dimension paradigm in,
128–129Cross-cultural studies, types of, 61–71
across individuals first versus directly across societies, 68
comparing variables versus comparing cases, 64–65
deductive versus inductive, 66idiographic versus nomothetic, 62–63insiders’ versus outsiders,’ 63–64of culture versus of something else, 62paper-and pencil versus observational,
66–67qualitative versus quantitative, 62structure-oriented versus level-oriented, 65synchronic versus diachronic, 65–66using primary data versus using secondary
data, 67–68Cross-cultural transferability, and necessary
criteria, 88Cross-lagged correlation, 194n61Cultura, 10Cultural anthropologist, 10Cultural Anthropology (Haviland), 49Cultural artifacts, 39Cultural differences, between East Asia and the
Arab world, 425–429educational achievement, 427–428origins of cultural differences, 428–429personal dialecticism, 427personal superiority, demonstration of,
426–427pride, 426religiousness, 426self-stability and self-consistency, 426service to others, 428social polarization, in judgments of political
issues, 427suicide, 427
Cultural differences, between Eastern Europe and Latin America, 420–424
economic growth, differences in speed of, 422
leisure, importance of, 422origins of cultural differences, 422–423personal life control, 421–422self-confidence, 422subjective well-being, 421thrift, 422
Cultural differences, between rich and developing countries, 409–416
collective action tendency, 414competitiveness, 413dynamic externality, 413group-based discrimination, 411
in-groups and out-groups, 410–411life, pace of, 413life, satisfaction with, 412managerial decisions, sources of guidance
for, 415personal freedom, 412–413self-protective leadership, 414sexuality, 415societal cynicism, 413statistical associations, 415–416transparency and the rule of law,
411–412Cultural differences, between rich countries,
417–419adolescent fertility rates, 419Big Five personality traits, 419educational achievement, 418religiousness, 418self-enhancement and self-stability, 418subjective well-being, 419suicide rates, 419
Cultural differences, between the Arab world and sub-Saharan Africa, 430–433
adolescent fertility rates, 431mating competition, 431murder rates, 431origins of cultural differences, 432–433sexual networking and HIV rates, 431socioeconomic inequality, 431–432
Cultural distance, 129, 166, 181n2, 181n7Cultural variables, and climatic factors, 174Culture
causal approach to, 12communicable diseases and, 174criticisms of empirically derived dimensions
of, 75–76definitions of, 9–12, 14, 16–17, 20, 23–24,
33n1holistic and causal approaches, 12objective, 14subjective, 13–14See also Culture, characteristics of; Culture,
concept of; Culture, dimensions of; Culture, elements of; National culture; Organizational culture
Culture, characteristics of, 19–37changeability, 23–24complexity, 24–29diffuseness, 29–31functionality, 22–23integration, 22–23logic, 22–23normalcy, 22predictability, 32–33rationality, 22–23sharedness, 20–22stability, 23–24transmittability, 24uncontrollability, 31–32
Culture, concept of, 9–18

Index ◆ 473
as an independently existing phenomenon, 15–16
as a set of meanings, 14–15as a subjective human construct, 16as a system of behavior, 14“as is” versus “as it would be,” 12–13classifications of, 13–16definitions, 10–12conclusions about, 16–17meaning of, 10–12objective, 10, 14subjective, 10, 13–14, 16, 39unpackaging of, 10, 38
Culture, dimensions of, 127–166appropriate, construction of, 157–164as subjective human constructs, 131–132cross-cultural research and, 128–129data reduction, 136–156ecological, different versions of, 135–136individual and ecological, 132–134,
164–166nature of, 129–132polarity, 134–135polythetic classes and, 136
Culture, elements of, 38–58particular, 39–40universal, 40–54
Cultures and Organizations (Hofstede, Hofstede, and Minkov), xiii, 214
Culture’s Consequences (Hofstede), xii–xiii, 1, 5, 202, 397
Culturologia, 5nCulturology, xiii, 2
goal of (theory versus empiricism), 78–79operationalism as a method for defining
constructs in, 79–80See also Hologeistic culturology
Cyert, Richard M., 207
Data, missing, 127Data analysis, 123–196
cause-and-effect relationships, 171–181clustering, 166–171dimensions of culture, 127–166samples issues, 124–127
Data reduction, 136–156agreement and aggregation, 136–137correlations and scales, 137–139factor analysis, 149–156multidimensional scaling (MDS), 139–149scale reliability, 139
Deductive approach, 73Deductive studies, versus inductive studies, 66Delta (oblimin rotation), 156, 190–191Dendrograms, 167, 170Deschamps. Jean-Claude, 337Determination versus stability, 160, 162, 428Developing countries. See Cultural differences,
between rich and developing countriesDewey, John, 80
Diachronic studies, versus synchronic studies, 65–66
Dialectical thinking, 358Diener, Ed, 268, 345Differential item functioning, 88, 91n8Diffuseness, 29–31Digit ratios, 30, 37, 37n15Dimensions approach, 205Dimensions of national culture (Hofstede’s
IBM study), 206–211country scores on four indices, 211–214individualism versus collectivism, 208–210masculinity versus femininity, 210–211power distance index, 206uncertainty avoidance index, 206–208
Dionysian culture, 68n1Distance matrices, 167Dorfman, Peter, 310Dugan, Shaun, 232, 238Dweck, Carol, 376n3Dynamic externality, 76, 306–309, 368, 413
East Asia. See Cultural differences, between East Asia and the Arab world
Eastern Europe. See Cultural differences, between Eastern Europe and Latin America
Ecological fallacy, 133, 182n10, 183, 183n11Economic growth, national, 364–376Educational attainment, 364–376Egalitarian commitment, 226–230, 241,
243, 409Egoism versus altruism, 158–159, 162,
179, 353Eigenvalue, 154–155, 190n40, 285, 381Emic approaches, to cross-cultural
comparability, 84–92Emotions
frequencies of pleasant and unpleasant, 268–271
positive and negative, 345–349Empirical perspectives. See Perspectives,
theoretical versus empiricalEmpiricism, before theory, 75–78Employees (organizational), values of,
238–245Encyclopedia of World Cultures, 35n9Enter method, in multiple regression analysis,
175, 177–180, 195n68, 373Essentialism, 90n2Ethnic culture, 27Ethnocentrism, 17, 89Etic approaches, to cross-cultural
comparability, 84–92Euclidian distances, 120n21, 147, 150, 167,
188n26, 188n27Exclusionism, 157, 162, 222, 249, 349, 381,
383, 385–386, 410Exclusive consilience, 173Exploring Culture (Hofstede and Hofstede), 214
474 ◆ Cross-Cultural Analysis
Exploring Cultures (Hofstede, Pedersen, and Hofstede), xiv
Extraversion, 284, 295, 298, 304Extreme response style, 99–100, 102–103,
106, 117n9, 426Eysenck, Hans, 79
F (multiple regression), 179, 196n70Face validity, 112–114Factor analysis, 149–156
as a data reduction method, 154–156as a scale reliability test, 156factor scores, calculation of, 153–154
Factor loadings, 150, 152, 156, 190n42, 191n43, 219, 331, 349
Femininity, 209–212, 215Five-Factor Model (FFM), 284, 291Forced-choice items, 96–97, 108Free-choice items, 96, 108–109Functional equivalence, 87, 90n3, 91n7Functionalism, 90n3Functionality, 22–23Furthest neighbor, 193n54Future orientation, 74, 311–312, 326
Galilei, Galileo, 4Galton, Francis, 126Galton’s problem, 126–127Gardner, Howard, 78Geertz, Clifford, 11, 14, 83nGeneral intelligence, and related domains,
51–52Generalized trust, 351, 354–355g factor, 51, 78, 82n3, 85GLOBE. See Project GLOBEGreen, Eva, 337Gross national income growth (1998–2008),
438–439Gross national income per person (1998),
438–439Gupta, Vipin, 310Guttman scaling, 194n62
Hanges, Paul, 310Hardship versus tolerance, 161–162Harmony, 221, 225–226, 233, 411Hawthorne effect, 67Heine, Steven, 373, 395Heroes, 39, 398–399Hierarchical clustering, 167, 168 (graph), 170
(dendrogram), 188n26Hierarchy, 18n4, 207 (table), 226–227, 388n1HIV, 25–26, 52, 54, 125, 162, 166, 188n30,
344, 379–382, 417, 421, 431Hofstede, Geert, xii–xiv, 1, 5, 13, 44, 201,
217, 225, 255–260, 390–391, 397Hologeistic, 2–5, 33n5, 38–40, 78, 95, 124,
128, 137, 158Hologeistic culturology, 4–5Homicide rates, national, 377–389
House, Robert, 310Humane orientation, 47, 311, 313, 322–323,
325, 327–328Humane oriented, 331, 333Human heartedness, 219–220, 239Hume, David, 56n10Hypometropia, 162, 380–382, 384–385, 387,
432–433
IBM Corporation, 201–216Idealistic reports, 46Ideologies, 42–44, 55n5, 310–329Idiocentrism versus allocentrism, 134Idiographic studies, versus nomothetic
studies, 62–63ILSA, 164Impressions of others, reports of, 46–50
idealistic, 46peer, 46stereotypes, 46–50
Incomparable phenomena, 87Individualism, 16, 31–32, 37, 49, 70n8,
73–74, 80, 81n2, 82n4, 82n5, 83n7, 85, 113, 117n9, 134–135, 157, 174, 184n13, 208–210, 221, 230, 240, 244, 258, 260, 265, 267, 270, 337, 339, 350, 386–387, 395, 409, 416n6
Individualism index, 204–205Individual-social, 234–236, 412Inductive approach, 75–77Inductive studies, versus deductive studies, 66Indulgence, 372Industry, 129, 218, 369, 372–375Inglehart, Ronald, 24, 83n6, 160, 261, 264,
373, 375n1, 409In-group collectivism, 18n5, 157, 222,
311–312, 320, 325–326, 389n7Inkeles, Alex, 203Insiders’ studies, versus outsiders’ studies, 63–64Institutional collectivism, 311–312, 319,
326–327Institutions, 13–14, 25, 29, 39, 63, 86, 90n3,
264, 267Instrumental values, 42Integration, 22–23, 219–222, 223n1, 244, 411,
416n1Intelligence, 16, 24, 30, 48, 51–52, 73–74, 78,
79, 83n8, 91n11, 131. See also g factor; IQIntelligibility problems, in cross-cultural
research, 110–111Interdependence, 337–340Internal consistency, 91n11, 142Internal reliability, 76, 303–304International Sexuality Description Project,
297, 341Interpretivism, 63, 68, 85, 103Ipsative, 97, 107, 119n19Ipsatization, 107, 236IQ, 24, 29–30, 51–52, 57n17, 64, 66, 78, 80,
89–90, 91n11, 92n13, 118n11, 162–165,

Index ◆ 475
180, 195n65, 196n71, 196n72, 378–380, 388n3, 415. See also Intelligence
Isomorphism, 111, 133–134, 165, 183n12Item bias, 88, 91n8, 91n9
James, William, 80Janssen, Onne, 279Javidan, Mansour, 310Jensen, Arthur, 79Johnson, Timothy P., 5
Kappa, 156, 190–191n42, 381Kim-Prieto, Chu, 345Kitaigorodskii, Alexander, 75, 77Kuppens, Peter, 345
Latin America. See Cultural differences, between Eastern Europe and Latin America
Leach, Edmund, 64Leadership profiles, 330–336Leung, Kwok, 305Level-oriented studies, versus structure-oriented
studies, 65Levine, Robert, 246, 251Levinson, Daniel, 203Life-quality judgments, 358–363Life satisfaction, 54, 58n19, 160–162, 191n48,
270, 283, 309, 348, 374–375, 386, 412, 419, 421
Likert scale(s), 96issues associated with, 97–108positions on, 98reference group effect and, 97–98response styles, 99–108societal information, extracting, 98–99
Linear regression, 175, 189n35, 372, 376n7, 383
Listwise deletion, 175, 182n4, 194n63, 351Locus of control, 76, 232–237, 412, 424n5Logic, 22–23Longitudinal studies. See Diachronic studiesLong-term orientation, 74, 113, 134, 158–160,
162, 221, 223, 367, 373, 376n8, 390, 394–395
Looseness. See Tightness-loosenessLoyal versus utilitarian involvement, 243
Malinovskian (Malinowskian) dilemma, 90n3Malinowski, Bronislaw, 68, 90n3Managers, and sources of guidance, 272–278Manhattan distances, 188n26, 189n34Manning, James, 30, 37n15March, James G., 207Mardy, 68–69n2Marginal preferences, 54n1Martenitsas, 39Marx, Karl, 33, 261Masculinity, 209, 220, 226, 257–260
index, 204–205versus femininity, 210–211, 212 (table)
Masculinity and Femininity (Hofstede), 211Maslow, Abraham, 40Mastery, 226–228, 233, 236n1, 279–280Mating competition, 43, 162, 379–380,
384–385, 387, 388n5, 431–433McCrae, Robert, 284, 291, 297MDS. See Multidimensional scalingMeanings, 3, 5, 13–16, 21, 33n1, 39, 63,
70n6, 74, 80, 85–86, 111, 226Measurement methods, 4, 140, 189n31,
189n34Mental skills and knowledge, 51–52Mental software, 13–14Merritt, Ashleigh, 255Methodological consilience, 172–173Minkov, Michael, xiii, 5, 205, 358, 364, 377,
390–391Moderate response style, 99Monothetic, 136, 185n17Monumentalism, 117n9, 147, 160, 162, 254,
359, 368–371, 373–375, 375n7, 418, 427–428
Moral discipline, 158, 219–220, 372MRA. See Multiple regression analysisMulticollinearity, 176–177Multidimensional scaling (MDS), 139–149,
163 (graph)classes, positioning into, 147 (graph),
148 (graph)data reduction and, 149map, 140–146methodology, 140–149solution from World Values Survey data,
141 (graph)typologies, using to identify, 146–148
Multiple imputation by chained equations (MICE), 182n4
Multiple intelligences, theory of, 78Multiple regression analysis (MRA), 174–181
divergent results from different types of, 175
enter method, 177–178example, 177–181excluded variables, 175independent variables, 176–177key points, 180–181samples, 175–176stepwise method, 178t, 179, 195n68
Murder, 20, 22, 25, 27, 30, 53, 110, 132, 162, 163 (graph), 171–173, 176, 188n30, 377–380, 384, 388n1, 431–432
National culture, 25–27dimensions of, 206–211hypothesized dimensions of, 262organizational culture versus, 27–28religious denomination culture versus, 28–29
National religiousness, 36n13National social polarization index, 53

476 ◆ Cross-Cultural Analysis
National statistics, 53Nations, critiques of as units of cross-cultural
comparisons, 25–27Nearest neighbor, 167, 193n54Neuijen, Bram, 397Neuroticism, 16, 79, 135, 174, 208 (table),
284–286, 288–289, 291–292, 295, 298, 303–304, 419
Nomological network, 76, 91n7, 113–114, 142, 203, 205–207, 210–211, 226, 262, 308–309, 325–326, 396n2, 424n5
Nomothetic studies, versus idiographic studies, 62–63
Noncognitive paper-and-pencil studies, 95–109. See also Paper-and-pencil studies
Norenzayan, Ara, 246Normalcy, 22Norms, 42–44, 55n5, 103, 127, 137Null subject parameter, 36–37n14
Objective culture, 14Oblimin, 156, 190–191n42, 338Observable behaviors, 52–53Observational studies, versus paper-and-pencil
studies, 66–67Obtrusive studies, 66, 71n14, 251OCEAN, 284–285OECD PISA (Organisation for Economic
Co-operation and Development Programme for International Student Assessment), 52, 68, 122n
Oedipus complex, 68n1Ohayv, Denise Daval, 397Oishi, Shigeiro, 268Openness, 92n13, 284, 287–289, 304Operationalism, 5, 16, 79–80, 83n9Organizational culture(s)
Danish, 397–406dimensions of, 400, 402–404national culture versus, 27–28
Other-referenced performance motives, 280–281Outsiders’ studies, versus insiders’ studies,
63–64
P. See Statistical significance (p)Pace of life, 246–250Paez, Dario, 337Pairwise deletion, 194n63Pan-cultural analysis, 165, 192n50, 352, 356Paper-and-pencil studies, 93–122
face validity and, 112–114noncognitive, 95–109observational studies versus, 66–67samples of respondents, 94–95test-retest reliability of, 112variance and validation, 114
Paradigm, 216n4Paranoid cultures, 68n1Participative, 331, 333, 335Particular elements of culture, 39–40
institutions, 39meanings, 39proverbs, 39–40symbols, 39taboos, 39
Particularism, 239–240, 242Pedersen, Paul B., xivPeer reports, 46Pentecostals, 36n13Perception characteristics, 52Performance orientation, 311–315, 327–328Performance motives, 279–283Personal emotional dialecticism, 268–271Personality dimensions, national indices
correlations, 302 (table)Personality traits, 12, 42–42, 46–49, 54n2,
56n9, 58n19, 71n13, 80, 114, 118n11, 146, 194n60, 284–290, 291–296, 297–304, 419
Personal pride, 64, 427Personal values, 40Perspectives, theoretical versus empirical,
72–83Peterson, Mark F., 5, 214, 272Phenomena, incomparable, 87Polarity, 134–135Political-personal, 234–235Polygyny, 22, 30, 39, 174, 388n5, 431Polythetic, 136, 185Poortinga, Ype, 112Positioning effect, 108Positivist science, 3Postal speed, 247Poverty, 109Power distance, 35n10, 103, 117n9, 118n11,
203–207, 210, 215n5, 229–230, 257–260, 311, 313, 327, 414
Predictive consilience, 173Predictability, 32–33Primary data, studies using, 67–68Principal components, 151 (graph), 153
(graph)Principal components analysis, 189–190n37Procrustes rotation, 156, 292, 295, 298Project GLOBE, 16, 18n5, 27, 33n1, 43–44,
47–48, 50, 57n16, 73–74, 94, 166, 184n13, 200, 310–329, 330–336, 388, 389n7, 410, 412
Promax, 156, 190n42, 381Protestant Ethic and the Spirit of Capitalism,
The (Weber), 267Proverbs, 39–40Psychic distance, 47, 182n7
Qualitative studies, versus quantitative studies, 62
Racial culture, and genetics, 30Rape, 378–380, 384, 388n5Rationality, 22–23

Index ◆ 477
Reference group effect, 97–98Regional culture, 27Reification, 73–74, 98Religious denomination culture, versus
national culture, 28–29Reproductive competition, 379Researcher, distance from, 109Respondents, selecting samples of, 94–95Response style, 53, 99–109, 116n4, 116n5,
116n6, 116n7, 117n9, 117n10, 118n11, 118n12, 118n14, 122n30, 304, 359, 362, 426
Rich countries. See Cultural differences, between rich countries; Cultural differences, between rich and developing countries
Rituals, 14, 28, 39, 311, 398–400Road death tolls, 26, 28, 53, 132–133, 162,
380–383, 411, 416n2Rokeach, Milton, 18n5Rokeach Values Survey, 224Rorty, Richard, 80Rosenberg’s self-esteem scale, 117n11Rotated factors, 153 (graph)Rotated factor solution, 152 (graph)Rotated solution, 151Rotter, Julian, 232Rotter’s locus of control scale, 232–233R square, 178–180, 196n70, 373–374Rushton, John Philippe, 30Russian soul, 56n11
Samplesissues with, 124–127nationally representative versus matched,
94–95Sanders, Geert, 397Scalar equivalence, 92n12Scale reliability, 139, 142, 156, 188n29Scales, 137–139Scalogram, 194n62Schimmack, Ulrich, 268Schmitt, David, 297, 341Schoolteachers, values of, 224–231Schwartz, Shalom, 146, 224, 272Schwartz Values Survey, 224Scree test, 190n40Secondary data, studies using, 67–68Secular-rational values, versus traditional
values, 264Self-consistency, 147, 366–367, 370, 426, 428Self-descriptions, 45–46Self-enhancement, 147, 162, 239, 254, 366–367,
371, 375–376, 390, 395, 418Self-expression values, versus survival values,
264–265Self-protective, 331–332, 334–336, 414Self-referenced performance motives, 280–281Self-reliance, 57n13, 158, 337–340Self-reports, 40–46
attitudes, 45behavioral intentions, 45behaviors, 45beliefs, 44–45children, values for, 44norms and ideologies, 42–44self-descriptions, 45–46values, 40–42
Self-stability, 147, 162, 366–367, 370, 375, 376n3, 390, 395, 418, 426, 428
Self-stereotypes, 47Semantic differences, 111–112Semantic differential scale item, 115n2Sex and Repression in Savage Society
(Malinowski), 68n1Sharedness, 20–22, 33n5Significance of F change, 196n70Skinner, B. F., 16Smallest space analysis, 187n23, 226Small space analysis, 226Smith, Peter, xiii, 82n6, 232, 238, 242, 272Social axioms, 45, 50, 75, 305–309, 368Social desirability, 109–110Social polarization, 53, 358–363, 427Social sciences, goal of (theory versus
empiricism), 78–79Societal cynicism, 76, 307–309, 413Socioeconomic inequality, 25, 133, 171,
377–379, 387, 415, 431–432Sociosexuality, 341–344, 384–385, 415Sociosexual Orientation Inventory (SOI), 342Spearmen, Charles, 79Squared Euclidean distance, 188n26Stability, 23–24Standard Cross-Cultural Sample, 181n1Standard error of the estimate, 179, 196n70Standardization, 105–108. See also Z-score
standardizationStatistical analysis (Hofstede’s IBM study),
205–214Statistical products, 53–54Statistical significance (p), 33n5, 185–187,
195n68, 196n70Statistics, national, 53Stepwise multiple regression, 175, 178–180, 373Stereotypes, 46–50, 310–329Strain theory, 377–378, 432Strangers, helping, 251–254Stress value, 143, 188n25, 189n34, 233, 241Structure-oriented studies, versus level-oriented
studies, 65Studies. See Cross-cultural studies;
Paper-and-pencil studiesStudy of Beliefs and Values, A (Green,
Deschamps, and Paez), 337–340dimensions, hypothesized, 337discussion, 340questionnaire items, 338samples, 337statistical analysis, 338–339

478 ◆ Cross-Cultural Analysis
statistical analysis, additional, 339study’s contributions, 339
Study of Culturally Endorsed Leadership Profiles, A (Project GLOBE), 330–336
dimensions, hypothesized, 330–331discussion, 335–336questionnaire items, 331samples, 330statistical analysis, 331–335study’s contributions, 335
Study of Helping Strangers, A (Levine, Norenzayan, and Philbrick), 251–254
dimensions, hypothesized, 252discussion, 254experimental design, 252results, 252–253samples, 251–252statistical analysis, 253statistical analysis, additional, 253–254study’s contributions, 254
Study of Locus of Control, A (Smith, Trompenaars, Dugan), 232–237
dimensions, hypothesized, 233discussion, 236questionnaire items, 233samples, 233statistical analysis, 233–235study’s contributions, 235–236
Study of Managers’ Sources of Guidance, A (Smith, Peterson, and Schwartz), 272–278
dimensions, hypothesized, 273discussion, 278questionnaire items, 273samples, 272–273statistical analysis, 273–277study’s contributions, 277–278
Study of Mean National or Ethnic Personality Traits, A (Peer Reports) (McCrae and Terracciano), 291–296
dimensions, hypothesized, 292discussion, 295–296questionnaire items, 292samples, 291–292statistical analysis, 292–294statistical analysis, additional, 295study’s contributions, 295
Study of National Homicide Rates and Their Correlates, A (Minkov), 377–389
discussion, 387–388exclusionism dimension, validation of,
385–386hypometropia dimension, validation of,
384–385hypothesized dimensions of, 380–381statistical analysis, 381–384study’s contributions, 386–387variables used in the analysis, 380
Study of National Stereotypes and Ideologies, A (Project GLOBE), 310–329
dimensions, hypothesized, 311
discussion, 325–329questionnaire items, 311–314samples, 311statistical analysis, 314–324study’s contributions, 324–325
Study of National Values Based on a Chinese Questionnaire, A (Chinese Culture Connection), 217–223
country factor scores, 219–220dimensions, hypothesized, 217–218factor analysis, 219questionnaire items, 218statistical analysis, 218–220study’s contributions, 221
Study of Organizational Cultures Across 20 Danish and Dutch Organization Units, A (Hofstede, Neuijen, Ohayv, and Sanders), 397–406
dimensions of organizational cultures, 400discussion, 406follow-up studies, 405–406practices dimension, validating, 404–405questions about organizational practices
used to compute dimensions of organizational culture, 400–404
study’s contributions, 406survey phase, samples and questionnaire for,
399survey results, analysis of, 400
Study of Performance Motives, A (van de Vliert and Janssen), 279–283
dimensions, hypothesized, 280discussion, 283questionnaire items, 280samples, 280statistical analysis, 280–281statistical analysis, additional, 281–282study’s contributions, 282
Study of Personal Emotional Dialecticism and Frequencies of Pleasant and Unpleasant Emotions, A (Schimmack, Oishi, and Diener), 268–271
dimensions, hypothesized, 269discussion, 270–271questionnaire items, 269samples, 269statistical analysis, 269–270study’s contributions, 270
Study of Positive and Negative Emotions, A (Kuppens, Ceulemans, Timmerman, Diener, and Kim-Prieto), 345–349
dimensions, hypothesized, 346discussion, 349questionnaire items, 346samples, 346statistical analysis, 346–348statistical analysis, additional, 348study’s contributions, 348–349
Study of Social Axioms, A (Bond, Leung, and Associates), 305–309

Index ◆ 479
dimensions, hypothesized, 306discussion, 308–309questionnaire items, 306samples, 306statistical analysis, 306–308study’s contributions, 308
Study of Social Polarization in Social Opinions and Life-Quality Judgments, A (Minkov), 358–363
dimensions, hypothesized, 359discussion, 362questionnaire items, 359–360samples, 359statistical analysis, 360–362study’s contributions, 362
Study of Sociosexuality, A (Schmitt), 341–344
dimensions, hypothesized, 342discussion, 344questionnaire items, 342samples, 341–342statistical analysis, 342–343study’s contributions, 343–344
Study of the Geographic Distribution of the Big Five Personality Traits (Self-Reports) (Schmitt, Allik, McCrae, Benet-Martinez), 297–304
dimensions, hypothesized, 298discussion, 303–304questionnaire items, 298samples, 298statistical analysis, 298–301statistical analysis, additional, 301–302study’s contributions, 303
Study of the Pace of Life, A (Levine and Norenzayan), 246–254
dimensions, hypothesized, 247discussion, 249–250experimental design, 247samples, 247statistical analysis, 247statistical analysis, additional, 249study’s contributions, 249
Study of the Values and Beliefs of Organizational Employees, A (Smith, Dugan, and Trompenaars), 238–245
dimensions, 239–240discussion, 245questionnaire items, 240–241statistical analysis, 241–243study’s contributions, 243–245
Study of the Values of Schoolteachers ad University Students, A (Schwartz), 224–231
dimensions, hypothesized, 225–226discussion, 230–231questionnaire items, 226samples, 225statistical analysis, 226–230statistical analysis, additional, 230
study’s contributions, 230Study of Values, Beliefs, and Norms Across
the IBM Corporation, A (Hofstede), 201–216
dimensions, hypothesized, 203questionnaire items, 203–205samples, 202–203statistical analysis, 205–214
Study of Values Related to National Economic Growth and Educational Achievement, A (Minkov), 364–376
dimensions, hypothesized, 365–368discussion, 374–375industry dimension, validation of,
371–372monumentalism dimension, validation of,
370–371questionnaire items, 368samples, 365statistical analysis, 368statistical analysis, additional, 372–373study’s contributions, 373–374
Subjective culture, 13–14Sub-Saharan Africa. See Cultural differences,
between the Arab world and sub-Saharan Africa
Suicide rates, 15, 20, 25–26, 30, 52, 54n1, 64, 87, 98, 116n4, 120n24, 125, 160, 166, 195n65, 371, 415, 419, 427
Supra-national culture, 27Survival values, versus self-expression values,
264–265Symbols, 10, 14, 28, 39, 398–400Synchronic studies, versus diachronic studies,
65–66
t (multiple regression), 179, 195n68Taboos, 16, 28, 39, 110, 211Team oriented, 331–332, 335Terminal values, 42Terracciano, Antonio, 291Test banding, 184n13Testosterone, 30Test-retest reliability, 112Theoretical perspectives. See Perspectives,
theoretical versus empiricalTheory, before empiricism, 73–75Theory-driven approach, 73Tightness-looseness, 83n7Time sequence, issue of, 173Timmerman, Marieke, 345TIMSS (Trends in International Mathematics
and Science Study), 52, 112Tönnies, Ferdinand, 209Traditional values, versus secular-rational
values, 264Traits, 41Transmittability, 24Transparency, 26, 87, 162–163, 176, 380–381,
386, 388, 411–412

480 ◆ Cross-Cultural Analysis
Triandis, Harry, 135–136Trompenaars, Fons, 94, 232, 238–239, 245Truth, search for, versus search for what
works, 80–812D:4D ratios. See Digit ratiosTylor, Edward, 126
Uncertainty avoidance, 16, 44, 55–56, 74, 77, 83n7, 113, 129, 174, 204–208, 215, 216n6, 256–260, 311, 326, 329, 386, 416n2, 419
Uncontrollability, 31–32Universal elements of culture, 40–54
cognitive patterns, 52impressions of others, reports of,
46–50mental skills and knowledge, 51–52observable behaviors, 52–53self-reports, 40–46statistical products, 53–54
Universalism, 81n2, 157, 162, 176, 239–240, 244, 349, 353, 356, 381, 386–387, 410, 433
University students, values of, 224–231Unpackaging of culture, 10, 38Unrotated factors, 151 (graph)Unrotated factor solution, 150 (graph)Utilitarian versus loyal involvement, 243
Values, 40–42, 44, 55n5, 337–340Values, as the desired/desirable, 41Values Survey Module, 134, 216n3, 256
Value structure theory, 18n5van de Vliert, Evert, 279Variables
cultural, and climatic factors, 174excluded, 175independent, 176–177
Variance inflation factor, 179, 195n66Varimax, 155, 190–191n42, 209, 219,
298, 381Verticality, 274, 277–278
Walking speed, 247–250, 416n5Watson, Thomas J., 216n2Welzel, Christian, 350What Makes Us Different (Minkov), xiiiWhite, Leslie, 2Windelband, Wilhelm, 69n4Within-subject standardization, 106Wolkenstein, Mikhail, 77World Values Survey, 21, 23, 26, 32,
33n3, 34, 43–46, 54, 54n2, 99, 135, 162, 261–267, 325, 350–357, 362, 364, 367–368, 390–396, 419, 422
correlation matrix, 138 (table)personal values in, 437Schwartz values in, 438self-descriptions in, 436–437values for children in, 434–436
z-score standardization, 106–107, 119n16, 120n20, 120n21

◆ 481
ABOUT THE AUTHOR
Michael Minkov spent his childhood years in Bulgaria and his adoles-cence at the French Lyceum of La Marsa, Tunisia. Later he lived, stud-ied, and worked in Norway, the Faroe Islands (Denmark), the United Kingdom, the United States, and Slovenia. Having spent nearly 10 years in diverse foreign countries, he has acquired and nurtured a strong inter-est in languages and cultures.
In his early academic career, Minkov specialized in early Old English and Old Norse and did translations from those languages into French and Bulgarian, published in Belgium and Bulgaria. Later, he wrote the first grammar of Bulgarian Romani (the Indic language of the Bulgarian Roma or Gypsies), published by the Journal of the Gypsy Lore Society in the United States.
In the 1990s, Minkov became interested in cross-cultural anthropol-ogy, focusing on national differences. He has authored four books in that field, the latest of which is Cultural Differences in a Globalizing World (Emerald, 2011), and a number of academic articles in SAGE journals and other publications, as well as book chapters and encyclopedia entries.
Minkov is an academic disciple and associate of Geert Hofstede, following his paradigm of analyzing large databases for the purpose of discovering cultural dimensions and other patterns. Some of Minkov’s findings have been accepted by Hofstede as an enrichment and update of his classic model. They have recently published several coauthored articles in academic journals as well as the third edition of Cultures and Organizations: Software of the Mind (McGraw-Hill, 2010, also coauthored by Gert Jan Hofstede). Geert Hofstede was also an official external reviewer of Minkov’s PhD dissertation in social anthropology, which he obtained from the University of Sofia, Bulgaria.
Currently, Minkov is an associate professor of cross-cultural studies at International University, Sofia. He is a frequent guest lecturer at uni-versities in Europe and North Africa.


“I have never really seen anything like this
product before, and I think it is really valuable.”
John Creswell, University of Nebraska–Lincoln
Find exactly what you are looking for,
from basic explanations to
advanced discussion
More content and new
features added this year!
Watch video interviews with leading
methodologists
Discover Methods Lists — methods readings
suggested by other users
Search a custom-designed
taxonomy with more than
1,400 qualitative, quantitative, and mixed methods
terms
Uncover more than 120,000
pages of book, journal, and reference
content to support your learning
Explore the Methods Map
to discover links between
methods
Find out more atwww.sageresearchmethods.com
The essential online tool for researchers from the world’s leading methods publisher