Bladder cancer index: cross-cultural adaptation into Spanish and psychometric evaluation
Upload
khangminh22Category
view
3download
0
DEVELOPMENT OF AN ORAL HEALTH-RELATED QUALITY OF LIFE MEASURE
FOR THE MALAYSIAN ADULTS POPULATION: CROSS-CULTURAL
ADAPTATION OF THE ORAL HEALTH IMPACT PROFILE
By
Roslan Saub
A thesis submitted in conformity with the requirements for
the degree of Doctor of Philosophy
Graduate Department of Dentistry
University of Toronto
© Copyright by Roslan Saub 2004

ivi National Library of Canada du Canada
Acquisitions and Bibliographic Services
395 Wellington Street Ottawa ON K1A ON4 Canada Canada
The author has granted a non- exclusive licence allowing the
National Library of Canada to reproduce, loan, distribute or sell
copies of this thesis in microform,
paper or electronic formats.
The author retains ownership of the
copyright in this thesis. Neither the thesis nor substantial extracts from it
may be printed or otherwise reproduced without the author's
permission.
Bibliotheque nationale
Acquisisitons et services bibliographiques
395, rue Wellington Ottawa ON K1A ON4
Your file Votre référence
ISBN: 0-612-91729-0
Our file Notre référence
ISBN: 0-612-91729-0
L'auteur a accordé une licence non exclusive permettant a la
Bibliotheque nationale du Canada de reproduire, préter, distribuer ou
vendre des copies de cette these sous
la forme de microfiche/film, de
reproduction sur papier ou sur format
électronique.
L'auteur conserve la propriete du droit d'auteur qui protege cette thése. Ni la these ni des extraits substantiels
de celle-ci ne doivent étre imprimés
ou aturement reproduits sans son autorisation.
In compliance with the Canadian Privacy Act some supporting
forms may have been removed from this dissertation.
While these forms may be included in the document page count,
their removal does not represent any loss of content from the
dissertation.
i+i
Canada
Conformément a la loi canadienne sur la protection de la vie privée,
quelques formulaires secondaires ont été enlevés de ce manuscrit.
Bien que ces formulaires aient inclus dans la pagination,
il n'y aura aucun contenu manquant.

ABSTRACT
Development of an oral health-related quality of life measure for the Malaysian adults
population: cross-cultural adaptation of the Oral Health Impact Profile
Roslan Saub Doctor of Philosophy
Graduate Department of Dentistry
University of Toronto 2004
The main aim of this project was to develop an OHRQoL measure for the Malaysian
adult population aged 18 and above by adapting the Oral Health Impact Profile (OHIP). It also
aimed to compare two methods (frequency and regression) of developing a short form of the
measure, to provide preliminary data on the impact of oral conditions on the quality of life of the
adult population in Malaysia, and to compare these impacts between Malaysian and Canadian
population aged 50 and above.
The adaptation of this measure was based on the framework proposed by Herdman et al
(1998). The OHIP was translated into the Malay language using a forward-backward translation
technique. Thirty-six patients were interviewed to assess the conceptual equivalence and
relevancy of each item. The adapted OHIP — L-OHIP(M) — contains 45 items. This
questionnaire was pre-tested on 20 patients. A total of 171 respondents completed the short form
[S-OHIP(M)] to assess the response format. The five-point frequency Likert scale could be used
for Malaysian population.
Field-testing was conducted in order to assess the suitability of two modes of
administration (mail and interview) and to establish the psychometric properties of both the L-
OHIP(M) and the S-OHIP(M).
Both versions [L-OHIP(M) and S-OHIP(M)] were found to be valid and reliable.
However, this study only provides initial evidence for the reliability and validity of these
measures. Further study is recommended to collect more evidence to support the validity and
reliability of these measures.
Both short forms (frequency and regression) performed equally well when tested for
discriminative validity. However, the responsiveness of these measures was not tested in this
i

present study. This could be one of the future research areas to determine which version will be
superior in terms of detecting change.
The preliminary results revealed that a substantial proportion of the sample included in
this study experienced frequent psychological impacts associated with their oral conditions. The
Malaysian population aged 50 and above had slightly higher impacts than Canadian population.
However, the pattern of impacts was similar, where physical consequences were most affected
and social aspects were the least affected.
ill

ACKNOWLEDGEMENT
First and foremost, I would like to thank God the almighty for giving me the strength to pursue this
study.
I would like to extend my gratitude to the following people:
@ Dr. David Locker, my supervisor, for his guidance and advice through out my study.
e Dr. Paul Allison and Dr. Milada Disman, members of my advisory committee, for their criticism
and comments.
e The University Malaya, for sponsoring my study.
T also would like to thanks:
® Dr. Gary Slade for his permission and assistance to adapt his measure.
e The Oral Health Division, Ministry of Health for allowing me to use their database.
® Mr. Rahim Mat Yassim, Ms. Norlie Zolkapli, Ms. Roshidah Hassan, Ms. Sheena Kaur, Ms.
Cecilia Joseph and Ms. Azlina Zainal for their help in translating the questionnaire.
e Mr. Monaj Kumar, Mr. Mahadzar Dayarobi and Mr. Huzaiman Jamil for their hard work locating
and interviewing the respondents.
e The staff of the Department of Community, University Malaya - especially Ms. Pauline Yeo - for
their help conducting the research.
e The respondents who participated in this study.
e Gillete (M) Sdn. Bhd. and Southern Lion Sdn. Bhd. for sponsoring the oral health products.
e@ Ms. Susan Deshmukh for her help in editing this thesis.
Most importantly, my deep gratitude goes to my loving wife, Dr. Norashikin Abdul Fuad, who has
sacrificed herself for my career, providing emotional support, and has lavished me with love and care
thoughout my study. You are an angel to my heart. To my adorable sons, Harith Iskandar and Haziq
Dzulkarnain, I appreciate your understanding and patience while I struggled to complete my thesis. Last,
but not least, to my beloved parents and parents-in-law and my entire family for their support and
encouragement. To all of them I owe a debt that may never be repaid.
This study was supported by the Vot F: Grant no: F0369/2001c, University Malaya, and partial
fellowship award, University of Toronto.
iv

CONTENTS
Page
ABSTRACT ii-iii
ACKNOWLEDGEMENT iv
TABLE OF CONTENT V-ix
LIST OF TABLES X-xil
LIST OF FIGURES xill
CHAPTER 1 - INTRODUCTION l
1.1) Thesis Topic........... ccc ccecece eee ce eee e cee ee eee eee ene ee eee eneetesereeeeenes 1
1.2) Malaysia at Glance...........ccccc cece cee ee eect ee eect eee ee eee e eens enee ena aes 4
1.3) Malaysian Oral Health Care..............cccccc cece eee e eee e eee eaee neces eee 7
CHAPTER 2 - LITERATURE REVIEW 10
2.1) Oral Health Related Quality of Life (OHRQoL) Measures................ 10
2.1.1) The application of HRQoL measures. .......... 0... cece cece eee eee 10
2.1.2) Conceptual bases of health measurement....................0e eee es 12
2.1.3) The properties of the OHRQoL measures.................ce eee ees 17
2.1.3.1) Reliability........... occ cece cece cece eee ee eee eee e ne eee eee 18
2.1.3.2) Validity... cecccece sete eeeeee ee ne essere eee ee eee eas 21
2.1.3.3) RESPONSIVENESS............ cee ee eee ee eee e cence sens ensensenees 24
2.1.3.4) Property for different purpose of the measurements..... 24
2.1.4) Review of existing OHRQoL measures................c cece cece eee 26
2.1.4.1) General (Geriatric) Oral Health Assessment (GOHAI). 30
2.1.4.2) Oral Health Impact Profile (OHIP).................0.0000 39
2.1.4.3) Subjective Oral Health Status Indicators (SOHS))...... 55
2.1.4.4) Oral Impacts on Daily Performances (OIDP)............ 61
2.1.5) Measure chosen to be adapted. ....... 0.0... ccceee ccc e nce ee eee eee ee eens 68
2.2) Cross-Cultural Adaptation of OHRQOL........... eee cece cece cece eee en ees 69
2.2.1) Culture and health... 0... cece cece eee eee renee en eeeereeenanes 69

2.2.2) Approach in HRQoL cross-cultural research...........2......00800
2.2.3) The concept of equivalence. ...............cceccseeenceneeeeeeneeane ees
2.2.4) Technical process in cross-cultural adaptation...................088
2.2.4.1) Translation. 2.0.0.0... cece cece eee e ne ee eee eee ee eeeeenenenan
2.2.4.2) Cultural adaptation. ...............cccececeec een eee snes eee
CHAPTER 3 - AIM AND OBJECTIVE
CHAPTER 4 - METHODOLOGY
4.1) Phase 1: Instrument development and adaptation.......................2e8
4.1.1) Stage 1: Translation and back-translation.....................e eee
Translators Process of translation
4.1.2) Stage 2: Qualitative interviewS..............cceeceee eee eee eeeeeneeens
Respondents
Procedure
Analysis
Committee review
Questionnaire formatting
4.2) Phase 2: Evaluation of the instrument..................ccccccenee eee eeceeeees
4.2.1) Stage 1: Pre-testing. ......... 0... c cece cae e ce ene eee eeeeen eee eeeeneeene Subject
Procedure
Analysis
4.2.2) Stage 2: Testing of response OptionS................cceeeeeeneeneeees Subject Procedure
Analysis
4.2.3) Stage 3: Field Testing. 0.0.0.0... ccc eeceecee eee ee eens eee vecenennes
Study design
Subject Sample size
Procedure
Data entry
Data cleaning Missing data
Scoring
Analysis
4.3 Privacy and confidentiality.......... 0.0... cc cece ee eee eee ene eee enneteeeeeners
4.4 Scientific and ethical approval............ cece cee eee eee reneee eee eeneees
Vi
70
71
78
78
81
36
88
88
88
91
96
96
97
98

CHAPTER 5 - RESULT
5.1)
5.2)
5.3)
5.4)
5.5)
5.6)
5.7)
5.8)
Translation SOO eRe OO REE H RHEE DEH H ERE DE eH OE REED REDE HE DRA HEHE OH ERE E OR EDT ORME HEE TES
Qualitative interview Ce)
Translated and adapted questionnaire ee ee ee ee re ey
Pre-Testing
Test of Response Options i ee ee ee ery
Oe ee ee ee ee
5.6.1) Total Response Rate
Field Testing
ee ee ey
ace mentees enes 5.6.2) Characteristics of respondents and non-respondents
5.6.3) Quality of data
5.6.4) Comparison of mode of Administration-Mail verses Interview...
Cr ee ere
5.6.4.1) Response rate... 0... cee ee ee ee ee ec eee eeeceneneneeenenes
5.6.4.2) Percentage of incomplete data
5.6.4.3) OHIP score
5.6.5) Reliability
eee eee eee ee ee ere ry
OO e oD awe Dae eRe Boda ee HSE reo RHE OEE EHH ree HE HOES EEE OED
5.6.5.1) Internal consistency.............ccecceceeeeceeeeeeeaeeneeees
5.6.5.2) Test-retest
5.6.6) Validity
5.6.6.1) Convergent construct validity............c:ccceeeeeeeeeeeees
i ee ee ee ee i ee ras
i ee ee
5.6.6.2) Discriminative construct validity...................ccee eee
5.6.7) Comparison of the technical properties of the L-OHIP(M) with
the Australian OHIP(A) and the Canadian OHIP(C) data.........
5.6.8) Establishing functional equivalence...............cccceceeens ere ee eee
Comparison of the regression S-OHIP(M) with the frequency S-
OHIP(M). .... 0... ccc cece ec ec nce e ere enenenseeneeeseeeeeeeeeestseaeneeneneeres
5.7.1) Content of the two S-OHIP(M)............0.ccceceeceaeneeecneeeneees
5.7.2) Score for both types of the S-OHIP(M) forms.....................
5.7.3) Technical properties for the two S-OHIP(M) forms...............
The impact of oral conditions on the quality of life of a Malaysian
adult population.......... ccc ccc sce e cen ceceene eee eeee eee eeneeteeseeeeeeeeee nes
vil
11i
11]
116
122
125
127
129
129
130
131
133
134
134
135
136
136
137
140
140
142
145
147
149
149
150
151
133

5.9) Comparison of the oral health-related quality of life between the
Malaysian population and the Canadian population aged 50 and
CHAPTER 6 —- DISCUSSION AND CONCLUSION
6.1) Study limitations............ ccc ccccc ccc cc ccc e cence ee ne eas ee eee eee seen enaenaeenes
6.2) Translation... 0.0... cece cece cece nce e eee ee cece neta en eee ene ee eens eee neenseeee eens
6.3) Cultural adaptation................ cece cece ee ee eee ec ene eeeeeenaeeneeeeeeenas
6.4) Reliability and validity of the S-OHIP(M)................ccceceeeeneeeeeeees
6.5) Comparison frequency S-OHIP(M) with regression S-OHIP(M).........
6.6) The impact of oral health to quality of life of an adult population........
6.7) | Variation in the oral health impact between Malaysian and Canadian
POPULATIONS. ..... 2... cece eee e cence eee eee e teen seen e eee ea eee sesaeeee eee eneeenaenee
6.8) Conclusion....... 0... cece ccece cece e cee ne eee eee cent cette eeeeencenseeenseeeneeeas
6.9) Future research. ......... 0... ccc ence ccc ec eee e eee ene nee reeeeeeeneeneeaeenaeenenes
REFERENCES
APPENDIX
Appendix A Oral Health Impact Profile questionnaire — Original
Appendix B Qualitative interview statement
Appendix C Consent form — qualitative interview
Appendix D Guidelines - qualitative interview
Appendix E Malaysian Oral Health Impact Profile questionnaire —- Long
form - L-OHIP(M)
Appendix F Malaysian Oral Health Impact Profile questionnaire —- Short
form - S-OHIP(M)
Appendix G Introductory letter - Mail respondents
Appendix H Reminder postcard — Mail respondents
Appendix 1 Second reminder letter — Mail respondents
Appendix J Identification letters — The interviewers
Appendix K Appointment card — Interview respondents
Appendix L_ Letter to the police
Vill
158
162
163
164
166
174
175
177
180
181
182
184
195
195
196
197
198
199
200
201
202
203
204
205
206

Appendix M Introductory letter from the dean — Interview respondents 207
Appendix N Impact of oral disorders on daily lives according to the 208
domains
1X

LIST OF TABLES
Table 1.1
Table 2.1
Table 2.2
Table 2.3
Table 2.4
Table 2.5
Table 2.6
Table 2.7
Table 2.8
Table 2.9
Table 2.10
Table 2.11
Table 2.12
Table 2.13
Table 2.14
Table 2.15
Table 2.16
Table 2.17
Table 2.18
Table 2.19
Table 4.1
Table 4.2
Table 4.3
Table 4.4
Table 4.5
Table 5.1
Table 5.2
Table 5.3
Table 5.4
Oral healthcare strategies
Definition of key concepts of the Locker’s oral health model ~
Properties for different type of measures
Summary of an existing OHRQoL instruments
Standard method for reviewing OHRQoL measures
Summary of papers published using GOHAI
Translation and adaptation of GOHAI to other cultures and languages
Summary of papers published using OHIP
Translation and adaptation of OHIP to other cultures and languages
OHIP short form
Scoring method for SOHSI
Summary of papers published using SOHSI
Example of the questions in OIDP
Criteria for frequency score
Summary of papers published using OIDP
Translation and adaptation of OIDP to other cultures and languages
Different concepts of equivalence
Definition of equivalence (Herdman et al, 1998)
Method of translations and its advantages and disadvantages
Method of assessing equivalence
Phase and stage of the study
Example of combined file
Codes for Oral Health Impact Profile domains
Questions asked to assess the questionnaire
Assigned groups and sample size required
Level of translation difficulty
Difficult to translate questions
Sample distribution for qualitative interview.
Impacts of oral disease and oral disorder
Page
13
25
27-28
29
33-36
37-38
43-5]
52-53
54
56
58-60
63
63
65-66
67
73
74
81
82
88
90
94
97
100
112
112
117
118

Table 5.5
Table 5.6
Table 5.7
Table 5.8
Table 5.9
Table 5.10
Table 5.11
Table 5.12
Table 5.13
Table 5.14
Table 5.15
Table 5.16
Table 5.17
Table 5.18
Table 5.19
Table 5.20
Table 5.21
Table 5.22
Table 5.23
Table 5.24
Table 5.25
Table 5.26
Table 5.27
Table 5.28
Relevancy of items
Problem questions
Deleted, reworded and new items
Format of questionnaire
Characteristics of the respondents for pretesting
Summary of pretesting finding
Characteristics of the respondents for test of response options study
Response rate for field testing stage.
Characteristics of respondents and non-respondents
Percentage of missing items for the S-OHIP(M)
Percentage of missing items for the L-OHIP(M)
Characteristics of the eligible sample for mail and interview group
Response rate of mail and interview for the L-OHIP(M) and the S-
OHIP(M)
Percentage of the incomplete data.
Mean ADD-Score and SC-Score
Internal consistency for the L-OHIP(M) and the S-OHIP(M) by mode
of adminstration
Internal consistency for the L-OHIP(M) and the S-OHIP(M) by age
group
Number of respondents who completed the questionnaire for the
second time
Respondents’ characteristics — Test- Retest.
Intraclass correlation coefficient by mode of administration
Intraclass correlation coefficient by age group
Mean ADD-score and Sperman’s rank correlation coefficients for the
L-OHIP(M)
Mean ADD-score and Sperman’s rank correlation coefficients for the
S-OHIP(M)
L-OHIP(M) mean score by perceived dental treatment need and
satisfaction with oral health
Xi
119
121
123
124
125
126
127
129
130
131
132
133
134
135
135
136
137
138
138
139
140
141
141
142

Table 5.29
Table 5.30
Table 5.31
Table 5.32
Tabie 5.33
Table 5.34
Table 5.35
Table 5.36
Table 5.37
Table 5.38
Table 5.39
Table 5.40
Table 5.41
S-OHIP(M) mean score by perceived dental treatment need and
satisfaction with oral health
Mean score of the L-OHIP(M) and the S-OHIP(M) by dental status
Comparison of the reliability of the L-OHIP(M) with the OHIP(A)
and the OHIP(C)
Comparison of the validity of the OHIPCM) with the OHIP(C)
Item content and percent reported “very often’, “often” or
“sometimes”
Mean, median and range of ADD-score and SC score
Comparison of the technical properties of the two forms of the S-
OHIP(M)
Percent responding “very often”, or “often” to one or more items in
each subcales
Response to OHIP(M)
Percent responding “very often” or “often” to one or more items in
each subcales by sociodemograhics and dental status
Background of the Malaysian and Canadian data
Comparison of the percent responding “very often” or “often” to one
or more items in each subscale between the Malaysian sample and the
Canadian sample by gender
Comparison of the percent responding “very often” or “often” to one
or more items in each subscale between the Malaysian sample and the
Canadian sample by dental status
xii
143
144
146
147
150
151
152
153
154
157
158
160
161

LIST OF FIGURES
Figure 1.1
Figure 2.1
Figure 2.2
Figure 2.3
Figure 2.4
Figure 2.5
Figure 2.6
Figure 2.7
Figure 5.1
Figure 5.2
Malaysia map
Potential application of the “patient based outcome measures”
The conceptual model (Locker, 1988)
Simplified model of oral disorders, oral health and quality of life
Measuring oral health and quality of life
Interpretation of a Kappa value by different authors
Conceptual model used for the development of OIDP
Type of cross-cultural research
Distribution of response options
Comparison of the percent responding “very often” or “often” to one or
more items in each subscale between the Malaysian sample and the
Canadian sample
Xiil
Page
1]
13
14
15
19
62
72
128
159

CHAPTER 1
INTRODUCTION
1.1) THESIS TOPIC
Traditionally oral health is measured based on the biomedical model, which focuses on the
presence or absence of disease. However, such measures fail to take into account the burden of
illnesses and disabilities imposed by oral diseases (Gift and Redford, 1992; Locker, 1988;
Cohen and Jago, 1976; Morigama, 1968). In line with the World Health Organization’s (1948)
definition of health, which is defined as “‘a complete state of physical, mental and social well
being and not just the absence of illness”, measuring health should also incorporate
functioning, well being and quality of life. Using this, together with disease measurement, a
comprehensive picture of oral disorders can be captured.
There are a growing number of investigators who are developing ways of measuring the
impact of oral diseases on the well being of communities and individuals. As a result, several
instruments have been developed to evaluate oral health related quality of life. Most of the
instruments have been developed in English speaking countries and in the English language.
Recently, some of the instruments have been translated into other languages.
Health and quality of life are subjective phenomena. The perception of health and the
ways in which health problems are conceptualized and expressed vary from culture to culture
(Guillemin et al, 1993). They are shaped by and embedded in culture so that their measurement
cannot be culturally free (Guarnaccia, 1996). Since most of the instruments have been
developed in the English language and are intended for use in English speaking countries,
particularly in the United States of America, United Kingdom, Australia and Canada, they

cannot be used in other countries, such as Malaysia, with a different language and cultural
background without some form of adaptation.
In general, there are two ways to develop a health-related quality of life instrument for a
different culture (Guillemin et al, 1993): to develop a totally new measure or modify a previous
measure through a cross-cultural adaptation process. The first option is a time consuming
process in which the bulk of the effort is devoted to the conceptualization of the measure and
the selection and reduction of items. In the second option, a transposition of a measure from its
original context to the target population through translation and adaptation is undertaken. This
option is rather cheaper and less time-consuming as compared to the first. Cross-cultural
adaptation not only allows us to describe or evaluate the health status of the target population,
but also allows us to make comparisons between cultures or nations and the differences and
similarities resulting from the various health care systems, the differing attitudes of health
professionals and patients’ health care behaviors (Touw-Otten and Meadows, 1996).
Malaysia is a developing country. As in developed countries, oral health care costs are
increasing each year. In the National Household Health Expenditure Survey 1996 (NHHES’96)
it was reported that the total household expenditure for dental care in Peninsular Malaysia was
four percent of the total household expenditure on health (NHHES-team, 1999). About 96% of
the estimated household expenditures for dental care were on treatment costs. The question is
does this high spending on dental treatment lead to substantial oral health gain?
The focus of the Ministry of Health of Malaysia has shifted from being disease oriented
to emphasizing wellness and the maintenance of the quality of life of the population (Jui-meng,
1998). Recognizing that oral health is part of general health, and that it has been shown to
contribute to the quality of life (Locker et al, 2000), more attention should be given to oral
health. However, data on the impact of oral diseases on the well-being and quality of life of the

Malaysian population is not available. Therefore, it is essential to develop an instrument that
enables us to measure this impact and provide such information. This measure can then be used
to justify resources for an oral health program, to reallocate resources or to evaluate dental care
programs.
Since it is advocated to adapt an existing valid instrument, a measure of the oral health-
related quality of life for the Malaysian population will be developed by adapting a measure
that has been developed elsewhere. There are two important issues that should be taken into
consideration in the process of adapting any health related quality of life instrument (Behling
and Law, 2000). First, it must be valid and reliable and second it must meet requirements for
equivalence relative to the source language measure. To ensure these requirements are met, the
model of equivalence proposed by Herdman et al (1998) was used in this study.
The Oral Health Impact Profile (OHIP) (Slade and Spencer, 1994) was chosen to be
adapted since it meets the aim of this project, to develop a generic oral health related quality of
life measure, which is able to describe oral health and also to discriminate across groups in the
population. This measure was based on a coherent theoretical framework and its validity and
reliability have been tested in different countries (Wong et al, 2002a; John et al, 2002; Allison
et al, 1999; Hunt et al, 1995; Locker and Slade, 1993). Moreover, the OHIP is the most
sophisticated and comprehensive of the measures currently available, covering a wide range of
quality of life dimensions.

1.2) MALAYSIA AT GLANCE
Malaysia is located in South East Asia covering 0.3 million square kilometers with a tropical
climate. It comprises 13 states and 3 Federal Territories (Kuala Lumpur, Labuan and Putrajaya).
Sabah, the Federal Territories of Labuan and Sarawak are located on Borneo Island, known as
East Malaysia, while all the other states are in the Peninsular, separated by the South China Sea
(Figure 1.1). Kuala Lumpur is the capital city of Malaysia with a population of approximately 3
million (Department of Statistics Malaysia, 2001)
Tee
Sergiy & soe
HTS we
KUALA *Kuertet > - gi tNPUR
Figure 1.1. Malaysia map Source: hitp://www.ca.gov/cia/publications/factbook/geos/my. html.
The total population of Malaysia is 23.27 million (Department of Statistics Malaysia,
2001). The average annual population growth rate was 2.6% over the 1991-2000 period.
Malaysia has a rather young population, where the proportion of people age 65 and above was
only 3.9%. The median age of the Malaysian population was 23.6 years. The ratio of males to
females was 104:100. This shows that men outnumber women.

Over the years Malaysia has grown from an agro-based economy to a manufacturing
economy, where the manufacturing sector attained the highest growth rate and is expected to
grow by 5.0 percent in 2003 (Central Bank of Malaysia, 2003). Malaysia’s real Gross Domestic
Product (GDP) growth over the past years has been on average eight percent. However, with the
global economy crisis, the growth rate was 4.2 percent in 2002 and it is projected to grow by 4.5
percent in 2003 after taking into account the current situation (Bumiputra Commerce, 2003).
Meanwhile, the inflation rate, as measured by the consumer price index (CPI), is expected to
remain subdued, rising by 1.5 percent in 2003 (Bumiputra Commerce, 2003). The
unemployment rate is lower than four percent.
Malaysia is a multiethnic, multicultural and multi-religious nation, where Malays,
Chinese, Indian and indigenous peoples live in caring cultural harmony. Malays being the
majority ethnic group, constitute slightly more than 50% of the total Malaysian citizen
population (Department of Statistics Malaysia, 2001). However, the composition of ethnicity
between Peninsular Malaysia and East Malaysia are different. In Peninsular Malaysia, the main
ethnic groups are the Malay, Chinese and Indian, while in East Malaysia, the Indigenous of
Sabah and Sarawak are the main ethnic groups respectively.
Malaysians have strong ties with their family and relatives. In general, family life is
valued more highly than individual accomplishment (Tewolde, 1999). Seniority is greatly
respected within Malaysian households. Politeness and courtesy are very important social values
among Malaysians. Malaysia has been identified as a high power/distance society (MacLachlan,
1997), where less powerful members respect the more powerful members of the institutions or
organizations. For example, students must respect their teachers in every way and the students
are expected to follow their teachers’ instructions.

Each ethnic group practices its own religion and ritual. Islam is the most widely
practiced in Malaysia, with slightly more than sixty percent of the population being Islamic
(Department of Statistics Malaysia, 2001). Although Islam is the most widely practiced, other
religions, such as Buddhism (19.2%), Christianity (9.1), Hinduism (6.3%) and
Confucianism/Taoism/other traditional Chinese religions (2.6%) are also practiced freely in
Malaysia. Religion is closely related with ethnicity, where all Malays are Muslims, most Indian
are Hindus and most Chinese are Buddhist.
Although there are many languages spoken in Malaysia, the Malay language has been
deemed to be the National language under Article 152 of the constitution. However, this
constitution does not prohibit or prevent people from using, from teaching or learning in other
languages. Nevertheless, the Malay language must be used for official purposes, which includes
its use by federal and state governments. Other main languages widely spoken in Malaysia are
English, Chinese and Tamil.
The literacy rate among the Malaysian population has improved over the years. In 2000,
the literacy rate among Malaysians aged 10 to 64 years was 93.5% (Department of Statistics
Malaysia, 2002). Education starts at the age of four or five years old under the preschool
education. Children enter primary school at six years. Malaysia provides eleven years of free
public schooling, with six years in primary school, three years in lower secondary school and
two years in upper secondary school (Ministry of Education, 2003). The education system
places a strong emphasis on literacy skills, mathematics and basic sciences. About one in six of
Malaysians aged 20 and above attained higher education (post secondary, college or university).

1.3) MALAYSIAN ORAL HEALTH CARE
The government of Malaysia realizes that in nation building, it is important to have a healthy
population. Hence, the government has placed great importance on the development of the
health care sector and this had led to the formation of the Ministry of Health (MOH). This
ministry is set up to formulate, administer and manage health care policy and programs in
Malaysia. Recently, the ministry has set a strong vision for health, which stated (Oral Health
Division, Ministry of Health Malaysia, 2001a):
By the year 2020, Malaysia is to be a nation of healthy individuals,
families and communities, through a health system that is equitable,
affordable, efficient, technologically-appropriate, | environmentally- adaptable and consumer-friendly, with emphasis on quality, innovation, health promotion and respect for human dignity and which promotes
individual responsibility and community participation towards an enhanced quality of life.
The ministry has pursued various programs in ensuring that the vision of having a
healthy nation will be achieved. One such program is oral health care. Realizing that oral health
has a significant contribution to the quality of life of the population, the Oral Health Division of
the Ministry of Health was formed, as a main agency for the dental profession and also for the
provision of oral health care to the nation (Oral Health Division, Ministry of Health Malaysia,
2001). Besides the MOH, the Ministry of Defence, the Department of Aboriginal Affair (within
the Ministry of National Unity and Community Development), and the Ministry of Education
(through their dental faculty) also make substantial contributions to the provision of oral health
care to the population. In addition, the private sector has also made a significant contribution to
oral health care, mainly to the urban population.
Currently, oral health care in the public sector is largely subsidized by the government
(Oral Health Division, Ministry of Health Malaysia, 2001a). Pre-school children, school

children up to age 17 years, ante-natal mothers and civil servants, their spouses and school-
going dependents below the age of 21 years, are entitled to free basic oral health care at public
health care facilities. Other groups who are entitled to free care include; those who are
physically, mentally or economically disadvantaged. Nevertheless, all members of the public,
regardless of income may also access public sector facilities at highly subsidized rates, while in
the private sector, oral health care is largely on a fee-for-service basis (out of pocket). To date,
there are few third party payment schemes and there is no national insurance scheme in place.
In Malaysia, oral healthcare is provided mainly by qualified dentists. In the year 2000,
there were 2,144 dentists actively practicing in this country; 65 percent were in private practice
with the majority concentrated in urban areas (Oral Health Division, Ministry of Health
Malaysia, 2001a). Unlike the private dental care facilities, public dental facilities are widely
distributed through out Malaysia in order to ensure that each Malaysian has access to oral health
care. However, because dentists prefer to practice in the private sector, causing a shortage of
dentist in the public sector, this has led to a major equity issue in terms of access to oral health
services in rural areas. Recently, the government has enforced a compulsory three years of
service in the public sector for all newly graduated dentists in order to cope with the shortage of
dentists in the public service.
The Oral Health Division of the MOH, as a leading organization in oral healthcare, has
planned several strategies to ensure that the goal of improving or maintaining the oral health of
the population is achieved. The focus of these strategies is on prevention and oral health
promotion. The strategies are listed in Table 1.1.

Table 1.1. Oral healthcare strategies
1. Increasing oral health awareness of the community through oral health promotion and education.
Fluoridating public water supplies at an optimum level of 0.7ppm. Providing clinical preventive oral healthcare services to all school children in need. improving inter-agency and inter-sectoral collaboration and co-operation.
Providing quality oral healthcare services, which are easily accessed, suitably utilized and technologically appropriate.
Providing maximum coverage to identified priority groups. Rendering the maximum number of school children orally-fit. Providing specialist oral healthcare services to those in need of these services Collecting and analysing data, as well as undertaking research aimed at improving the quality of the oral healthcare services provided.
a Pwh
OOND
Source: Oral Health Division, Ministry of Health Malaysia. Oral healthcare in Malaysia. Malaysia: Oral Health Division,
Ministry of Health Malaysia. 2001. page 20
The constraints on public health resources has led to the setting of priorities by
identifying target groups. The target groups include school children, preschool children,
antenatal mothers and disadvantaged groups (Ramli, 2001). Dental nurses deliver oral
healthcare to schoolchildren below the age of 17 years, mainly under the school oral health
program. The dental nurse is the only operating dental auxiliary available in Malaysia,
introduced in 1948 based on the New Zealand dental nurse model (Oral Health Division,
Ministry of Health Malaysia, 2001a). However, they can only operate in government facilities
under the supervision of a public dentist.
Specialist care is also provided by the public dental service. Currently there is no
specialist register in Malaysia. However, the MOH recognizes five dental specialists; oral
surgery, orthodontics, periodontology, paediatric dentistry and oral medicine/oral pathology
(Oral Health Division, Ministry of Health Malaysia, 2001a).

CHAPTER 2
LITERATURE REVIEW
2.1) ORAL HEALTH RELATED QUALITY OF LIFE (OHRQoL) MEASURES
Oral health status and oral health related quality of life measures, which are collectively known
as “patient based health outcome measures”, were developed to assess the subjective
experiences of people with oral disease or disorders. Because health and quality of life are
subjective phenomena, the development of these measures must be based on a specific
conceptual approach, and in order to be validly used in research, the instruments must possess
adequate psychometric properties. Thus, this section reviews current concepts in health
measurement and the properties that are essential for such measurement. It also reviews some
of the existing OHRQoL measures.
2.1.1) The application of HRQoL measures
Patient based outcome measures have several applications. Locker (1996) identified these
potential applications and classified them into three broad areas (Figure 2.1): 1) political
applications — advocating for resources for dental research and services, 2) theoretical
applications — such as in exploring models of health and illness, and 3) practical applications —
such as in estimating the need for health care, assessing the quality of services, evaluating the
effectiveness of interventions and in cost utility analysis. For example, Srisilapanan and
Sheiham (2001b) integrated a patient based outcome measure into the assessment of treatment
needs in a dentate older population in Thailand. This approach to estimating need is known as
the sociodental approach. They concluded that this approach may better represent those dentate
older subjects’ who will gain more health benefit from a partial denture. OHRQoL measures
10

11
can also be used to assess the effectiveness of oral health interventions, as for example, the
study done by Awad et al (2000), which compared two types of treatment (implant versus
conventional denture) in replacing missing teeth.
Application
¥ ‘ 7 Political Practical |
Public Health |
‘
Need assessment Program evaluation
y
Cost utility analysis
v Theoretical |
Clinical
Figure 2.1. Potential applications of the “patient based outcome measures”
Another potential application of HRQoL measures is in clinical practice. According to
Higginson and Carr (2001), there are eight potential areas in clinical practice where a measure
can be used - to prioritize problems, facilitate communication, screen for potential problems,
identify preferences, monitor changes or response to treatment, train new staff, clinical audit
and clinical governance. However, for a measure to be clinically useful ‘it must not only be
valid, appropriate, reliable, responsive, and able to be interpreted, but it must also be simple,
quick to complete, easy to score and provide useful clinical data.’ (Higginson and Carr, 2001)

12
2.1.2) Conceptual bases of health measurement
It is well accepted now that the measurement of disease alone is not sufficient to describe the
oral health status of the individual or population or when comparing the efficacy and
effectiveness of interventions, since the thinking about health and oral health has changed over
the years. Health is no longer seen as the absence of disease but rather in terms of obtaining or
maintaining optimal functioning and social and psychological well-being (Locker, 1997a).
Such thinking has led to several implications. Firstly, it moves from a concern with disease to a
concern with health. Secondly, it has moved from an emphasis on curing disease to an
emphasis on prevention and health promotion. Thirdly, it has changed the emphasis from health
services to an emphasis on the physical and social environments in which people live and
finally, to see a patient as a person rather than as a body part. This change has also led to a
change in how oral health should be measured.
Because health and quality of life are subjective phenomena, their measurement must be
based on a coherent conceptual model. One such model that has been widely utilized in the
development of oral health measures, is the one proposed by Locker (1988). This model was
derived from the World Health Organization’s disease and its consequences model, which
consists of the following concepts: impairment, functional limitations, pain and discomfort,
disability, and handicap. The definitions of these concepts are shown in Table 2.1. This model
linked the concepts in a linear fashion, which moves from biological to behavioral and
psychosocial concerns (Figure 2.2). However, this model does not link to the quality of life.

Table 2.1. Definition of key concepts of the Locker’s oral health model
impairment:
Functional
limitation:
Pain and
discomfort:
Disability:
Handicap:
Anatomical loss, structural abnormality or disturbance in biochemical or physiological processes, which arises as a result of disease or injury or is present at birth.
Restrictions in the functions customarily expected of the body or its component organs or systems.
Self-reported pain and discomfort, physical and psychological symptoms and other not directly observable feeling states or manifestations which impinge on the individual or others.
Any limitation in or lack of ability to perform the activities of daily living.
The disadvantage and deprivation experienced by people with
impairments, functional limitation, pain and discomfort or disabilities because they cannot or do not conform to the expectations of the groups to which they belong.
a Impairment
Functional limitation Pain
y Disability
Se ‘s Handicap
Figure 2.2. The conceptual model (Locker, 1988) Adapted: Slade GD, Spencer AJ. Development and evaluation of the Oral Health Impact Profile. Community Dental Health 1994; [1:3-1]
13

14
More recently, the term “health related quality of life” is being widely used in the
literature. The measures that were developed to assess the extent to which oral diseases and
disorders affect functioning and psychosocial well-being are now referred to as measures of
“oral health related quality of life” (Slade, 1997a). Whether these measures assess oral health
related quality of life or oral health status remains equivocal.
It is recognized that health status and health-related quality of life represent two distinct
concepts. Although both measures assess subjective experiences of people related to disease or
disorders, health-related quality of life measures, however, incorporate the values placed on
these experiences. Wilson and Cleary (1995) have provided a conceptual framework that
reflects this thinking. This model links, in a linear fashion, biological variables at one end and
quality of life at the other. Linking these two dimensions of human experience are symptoms,
functional status and health perceptions. Locker et al (2002a) then adapted and simplified this
model for oral-health related quality of life, as shown in Figure 2.3. This model suggests that
oral diseases and disorders may compromise the physical and psychosocial functioning of the
individual and subsequently compromise overall quality of life
Oral diseases /disorders
v Functional and psychosocial impacts
Quality of Life
Figure 2.3. Simplified model of oral disorders, oral health and
quality of life. Source: Locker D, Matear D, Stephens M, Jokovic A. Oral health-related quality of life of a population of medically compromised elderly people. Community Dental Health 2002; 19: 90-97.

15
It is clear that thinking about health has evolved from equating health to the absence of
disease to inclusion of subjective experiences and recently incorporates the extent to which
health compromises the individual’s life. This in turn affects the way in which measures should
be developed.
Figure 2.4 depicts the changes that have occurred in measuring oral health. The
contemporary concept of oral health has led to the development of two types of measurement:
oral health status and oral health-related quality of life. The difference between these two
measures lies in the content of the measure. The items comprising a measure of oral health
status capture those aspects of life that are affected by oral disorders or diseases. Oral health-
related quality of life measures, on the other hand, contain items that capture aspects of life that
patient’s value (Gill and Feinstein, 1994).
Concept Measurement type
we Presence or ence of Clinical indices | Traditional J disease. abs —_> ca
3 Aspects of life affected by oral ——p> Oral health status Contemporary disease/disorders.
Aspecis of life that people —-» Oral health-related quality of life value
Figure 2.4. Measuring oral health and quality of life.

16
Therefore, a measure of oral health-related quality of life must not only capture aspects
of life that have been affected by the oral conditions but also the values attached to these
aspects. This can be done in two ways: the indirect and direct method (Locker et al, 2002a).
The indirect method involves establishing an association between the measure and quality of
life measures such as life satisfaction or morale. There are two types of direct method: 1)
weighting — by giving weight to each item; for example Slade and Spencer developed a severity
weight to the 49 items of the OHIP using a panel of dental patients to judge the importance of
each item in relation to other items in the measure, and 2) using the item impact method when
selecting items for the scale. This method begins with pooling items that affect people’s daily
activities. This can be done in many ways — literature reviews, expert opinion, or patient
interviews. The set of relevant items is then shown to the patient to indicate whether they
experience it, if so how important it is to them (Guyatt et al, 1986; Juniper et al, 1996; Locker
et al, 2002a). This method ensures that each item addresses aspects of life that are important to
people.
The question is what does the OHIP-49 assess? Because items were selected from a
pool of items derived from patient interviews, it could be an indirect indication that those items
are, to a certain extent, important to them. In addition, each item was given a weight of
importance. Thus, based on these aspects, OHIP could be considered as a measure of oral
health-related quality of life. Locker et al (2002a) carried out a study to see whether the aspects
of daily life addressed by the OHIP-14 and the GOHAI were in fact important to the study
population. This was done by correlating the score of the OHIP-14 and GOHAI with a set of
broader measures of psychological well-being and life satisfaction, which can be interpreted as
indicators of life quality. Three measures of life quality were used in their study, i.e, morale,
perceived life stress and overall life satisfaction. Their data provide some evidence that the
17
items in both of these measures were measuring aspects of life that were important to the study
population. In other words, these measures can be regarded as oral health-related quality of life
measures.
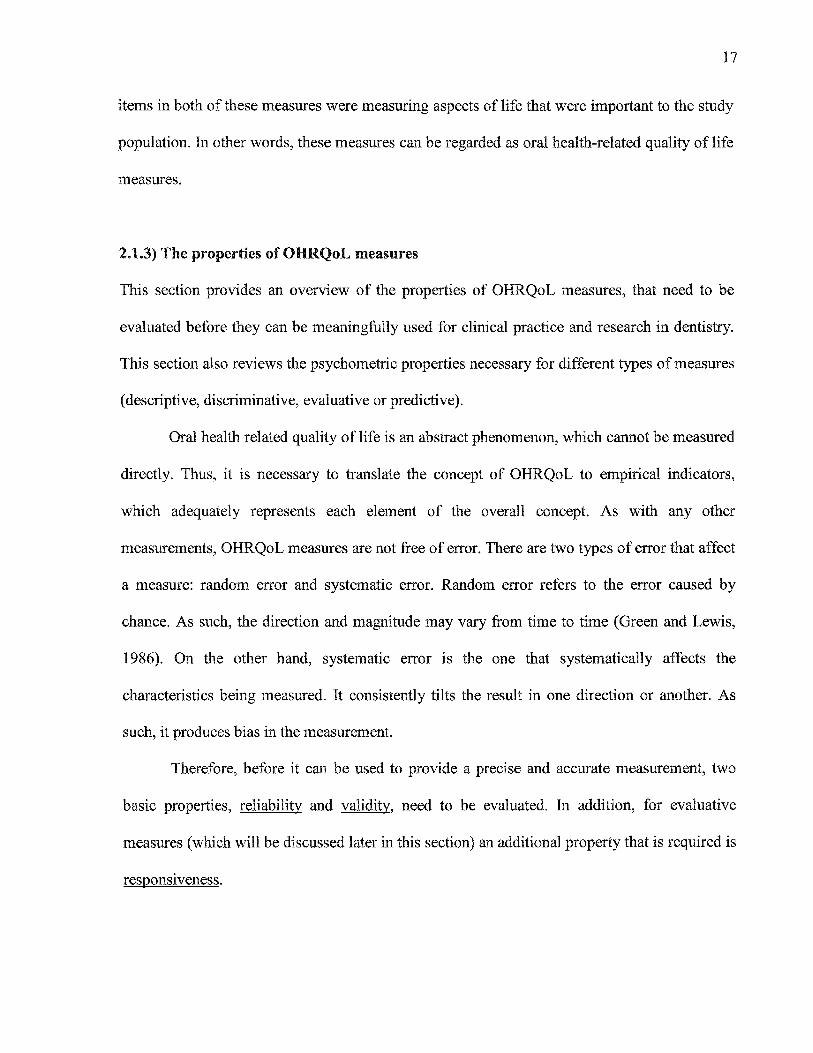
2.1.3) The properties of OHRQoL measures
This section provides an overview of the properties of OHRQoL measures, that need to be
evaluated before they can be meaningfully used for clinical practice and research in dentistry.
This section also reviews the psychometric properties necessary for different types of measures
(descriptive, discriminative, evaluative or predictive).
Oral health related quality of life is an abstract phenomenon, which cannot be measured
directly. Thus, it is necessary to translate the concept of OHRQoL to empirical indicators,
which adequately represents each element of the overall concept. As with any other
measurements, OHRQoL measures are not free of error. There are two types of error that affect
a measure: random error and systematic error. Random error refers to the error caused by
chance. As such, the direction and magnitude may vary from time to time (Green and Lewis,
1986). On the other hand, systematic error is the one that systematically affects the
characteristics being measured. It consistently tilts the result in one direction or another. As
such, it produces bias in the measurement.
Therefore, before it can be used to provide a precise and accurate measurement, two
basic properties, reliability and validity, need to be evaluated. In addition, for evaluative
measures (which will be discussed later in this section) an additional property that is required is
responsiveness.

18
2.1.3.1) Reliability
The measurement of any phenomenon always contains a certain amount of random error. Thus,
repeated measurements of the same phenomena never precisely duplicate each other. However,
they do tend to be consistent (Carmines and Zeller, 1979). This tendency towards consistency
found in repeated measurements of the same phenomenon is referred to as reliability. In other
words, reliability is concerned with minimizing random measurement error (Green and Lewis,
1986).
There are four different methods of assessing reliability: test-retest reliability, internal
consistency reliability, inter-rater reliability and equivalent-form reliability. However, in this
review only those types which are relevant and frequently used in assessing OHRQoL
measures, are reviewed, These are test-retest and internal consistency reliability.
Test-Retest Reliability.
Test-retest reliability is one of the most widely used methods for assessing the reliability of a
self-report measure, such as OHRQoL measures (Streiner and Norman, 1995). It is a measure
of how reproducible the measurement is. In this method, the same test is given to the same
individuals separated by a sufficient time interval. The correlation coefficient is then calculated
to compare scores from the two sets of responses.
In test-retest reliability, when the scale is continuous, the intraclass correlation
coefficient (ICC) is the more appropriate test to be used (Fayers and Machin, 2000; McDowell
and Newell, 1996; Streiner and Norman, 1995; Deyo et al, 1991). Unlike the pearson
correlation coefficient, which only measures linear association, the ICC measures the strength
of the association and the strength of agreement between repeated measurements. It assesses
the proportion of total variance arising from between-subject variability, using formula 2.1.

ICC = ~~ o..t~<“‘~smtC © subject + O” error
2 O™ subject
19
Whereby O subject 18 between-subject variance and Oo” enor 18 Within-subject variance. Analysis
of variance (ANOVA) is commonly used to estimate these components. If the ICC is close to 1,
then the random error variability is low and a high proportion of the variance in the
observations is attributable to variation between patients. Thus, the measure is regarded as
having high reliability. Conversely, if the ICC is close to zero, then random error variability
dominates and that the measure has low reliability.
In the case where the scale of the measurement is not continuous, Kappa and weighted
Kappa coefficients can be calculated for test-retest reliability. Figure 2.5 shows the
interpretation of Kappa values by several authors.
1.0 —
0.8 -—-
04—-
0.2 —-
0.0 —
Landis and Koch (1977)
Altman (1991)
1.0-—
Almost perfect Very good
Substantial Good
Moderate Moderate
Fair Fair
Slight
Poor
Poor
Fleiss (1981)
Excellent
Fair to good
Poor
0.75
Byrt (1996)
Excellent Very good
Good
Fair
Slight
Poor
No agreement
0.92
Figure 2.5. Interpretation of a Kappa value by different authors Source: Szklo M, Nieto FJ. Epidemiology: beyond the basics. Maryland: An Aspen Publication, 2000.
page 377.

20
Internal Consistency
Internal consistency is an indication of how well the different items in a measure capture the
same underlying concept. This means that the items should be at least moderately correlated to
both the total scale score and to each other (Streiner and Norman, 1995). This method requires
only a single test administration. Internal consistency reliability is estimated by a statistic
known as Cronbach’s coefficient alpha. It is a statistic that reflects the homogineity of the
scale. The formula for estimating Cronbach’s coefficient alpha is shown in 2.2.
a= NO a ceccecececenteeeeceeeeeeseaeaeeeaeesaeaeaeeeneenes (2.2) 1+ p(N—- 1)
N= Number of items
p = Mean inter-item correlation
The basis of Cronbach’s alpha is that if the items are uncorrelated, the mean of the
inter-item correlation will be zero, implying that Cronbach’s coefficient alpha will be zero. On
the other hand, if the items are identical, the mean inter-item correlation will be equal to 1 and
this indicates that Cronbach’s coefficient alpha will be one. This shows that alpha varies
between 0 and 1. The higher the a value, the more internally consistent the measure is. For
psychometric measurements, a Cronbach’s coefficient alpha above 0.7 is generally regarded as
acceptable (Fayer and Machin, 2000).
Based on formula 2.2, the alpha value is influenced by the average inter-item
correlation and the number of items in the scale. Therefore, adding items to a scale that do not
result in a reduction in the average inter-item correlation will increase the reliability of the
measure. However, at some point, adding more items will yield less impact.
For dichotomous items, the KR-20 coefficient is used to establish internal consistency
reliability (Green and Lewis, 1986).

21
2.1.3.2) Validity
Another property of a measure that needs to be evaluated is validity. Validity is an estimation
of the extent to which an instrument measures what it is intended to measure (Kline, 2000;
Fayers and Machin, 2000; Streiner and Norman, 1995; Hays et.al, 1995; Green and Lewis,
1986). A measure is regarded as valid if there is sufficient evidence to support that the
measurement measures what it claims to measure. Basically, validation is a process of
hypothesis testing (Streiner and Norman, 1995).
In general there are four types of validity: content validity, face validity, criterion
validity and construct validity.
Content Validity
Content validity is concerned with whether or not items in the measure adequately represent all
relevant constructs under investigation (Fayers and Machin, 2000; Striener and Norman, 1995).
Thus, content coverage and content relevance are two important aspects of content validity.
Content validity is seldom tested formally. It depends largely upon ensuring that the
instrument has been developed based on wide coverage of items, which could be generated
through consultation with experts in the area of interest, literature or from interviews with the
target population. At the same time, the relevancy of each item is also assessed. Any irrelevant
items should be excluded. This is commonly determined by an expert panel in the area of
interest, or by asking the target population for their opinion as to the relevancy of the items.

22
Face Validity
Face validity involves checking whether items in the measurement appear “on the face of it” to
cover the intended topics clearly and unambiguously (Fayers and Machin, 2000) and it is
assessed after the measure has been constructed.
Criterion Validity
Criterion validity is assessed by correlating the measurement with some other measures, which
have been accepted as a measurement of the phenomenon, which can be treated as a criterion or
a “gold standard” (Fayers and Machin, 2000; Kline, 2000; McDowell and Newell 1996;
Streiner and Norman, 1995; DeVellis 1991; Carmines and Zeller, 1979). In this respect, if the
new measurement does not correlate significantly with the criterion, then it will not be useful.
The higher the correlation, the more valid is this measurement for this particular criterion.
However, then, a question arises, if there already exists a valid and reliable measure,
why would one develop a new one? Streiner and Norman (1995) provide two valid reasons: 1)
when the existing test is expensive, invasive, dangerous, or time consuming; or 2) the outcome
may not be known until it is too late.
Criterion validity is divided into two types: concurrent validity and predictive validity.
If the criterion exists in the present, for example in the case where the existing instrument is
time consuming or too long, thus a shortened version is needed, then the concurrent validity is
to be assessed, by correlating a measure and the criterion, in this case the long version, at the
same point of time. On the other hand, if one wants to develop an instrument that can be used
to predict the future, whereby the criterion will be only available at a different time (future),
then predictive validity is to be assessed.

23
Construct Validity
Construct validity is evaluated by hypothesizing how measures should ‘behave’ and confirming
or refuting these hypotheses (Hays et al, 1995). Therefore, in this validation process,
hypotheses arising from a theoretical framework need to be tested using different procedures
and statistical techniques, depending on the hypotheses that have been generated. Construct
validity is supported when the results are consistent with the hypotheses. However, this does
not mean that the validity is proven rather it is just an indication of the degree of validity.
Therefore, it needs to be continuously evaluated so that there is more evidence of the validity.
In the case where the results are not consistent with the hypothesis, one could suspect that it
could be due to either the theory being wrong, or the instrument being flawed or both (Striener
and Norman, 1995).
Basically, there are three types of construct validity: discriminative, convergent and
divergent validity. Discriminative validity is related to how well the scale is able to distinguish
between groups with known differences (Herdman et al, 1998). For example, among dentate
and edentate patients. Convergent validity describes how closely a measure is related to other
measures of the same construct and to which it should be related. Conversely, divergent
validity recognizes that some dimensions of QoL are anticipated to be relatively unrelated and
that their correlation should be low.
There are different methods available in establishing construct validity, such as known
groups method, correlational method, factorial analysis, and multitrait-multimethod analysis.
However, it is beyond the scope of this review to provide the detail of these methods.

24
2.1.3.3) Responsiveness
Responsiveness concerns the ability of an instrument to detect change within subjects or
treatment effects (Stretner and Norman, 1995; Guyatt et al, 1992; Wilkin et al, 1992; Kirshner
and Guyatt, 1985). There are four ways to assess change in health status (Locker, 1998): 1)
Before and after comparison, 2) Change score, 3) Global transition judgement and 4) Global
transition scale. However, a detailed description of these methods is beyond this review.
2.1.3.4) Properties for different purposes of the measurements.
In general, HRQoL measures can be divided into four broad applications: descriptive (Locker
and Allen, 2002b), discriminative, predictive and evaluative measures (Guyatt et al, 1992;
Kirshner and Guyatt, 1985). Different purpose of measurement requires different properties.
Table 2.2 summarizes the properties for each of the measures.

25
Table 2.2. Properties for different types of measures
PURPOSE OF MEASURES PROPERTY Reliability Validity Responsiveness
DESCRIPTIVE MEASURE: Large and stable inter- Face Not relevant Descriptive measures are used to patient variation Content
measure current status of the Construct
population. (Cross- sectional)
DISCRIMINATIVE MEASURES: Large and stable inter- Face Not relevant Discriminative measures are used to patient variation Content
distinguish between groups or Construct
individuals on some underlying oral (Cross- health related dimension at one point sectional) of time.
PREDICTVE MEASURES: Large and stable inter- Face Not relevant Predictive measures are commonly patient variation Content used in medicine as a mean to identify Criterion
groups or individuals who will develop (Predictive) some target condition or outcome.
EVALUATIVE MEASURES: Small variation Face Applicable Evaluative measures are used to between replicate Content measure the magnitude of longitudinal measure Construct
change in an individual or group on (Longitudinal)
the oral health related quality of life.
Adapted: Kirshner B, Guyatt G. A methodological framework for assessing health indices. Journal of Chronic
Disease 1985; 38: 27-36.

26
2.1.4) Review of existing OHRQoL measures.
Generally, there are two approaches in developing patient-based health outcome measures:
generic and disease-specific. Generic measures are designed to be broadly applicable across
types and severity of disease, different medical treatments or health interventions (Patrick and
Deyo, 1989). On the other hand, disease-specific measures are those designed to assess specific
diseases (e.g. joint disease), or specific conditions (e.g. back pain) or special population (e.g.
older adults) (Patrick and Deyo, 1989). This section reviews some of the OHRQoL measures.
Since 1976 when Cohen and Jago (1976) advocated the development of what they
called at that time “sociodental indicators”, a number of investigators have taken steps to
develop ways of measuring the impact of oral diseases on the well being of communities and
individuals. As a result, twelve instruments have been developed, as summarized in Table 2.3.
They are all self-reported measures, where the development was based on the contemporary
concept of health. However, they are different in terms of the number of items, which range
from 3 to 73, content, the domains, response format and the scoring methods.

Le
“ayy Jo
Ayipenb e800
G66} “Ie
je sigpunes
ysibua/yvsn ‘Uyesy
eso payel-yes
‘uonLnu ‘(swe}!
GL) yyTeey
je10 9S
Aioyusay| ast]
JO AWENH UYeeH
[210
eV66L ‘JONI
pue 194907]
*SUOHElAI [eIOOS
(ISHOS) sso}eo1puy
ysi|Susepeuep
‘uoneoiuntuwoo
‘Bulee ‘swojdwhs
‘Buljeeds ‘Buimayo
ev snjyejs
yyeoH
jeiO eanosiqns
‘deoipuey ‘Ayiqesip
jeioos BY66|
‘leoueds pue
apes
ysyGuzyeyeysny —‘Ayjiqesip
jeojGojoyoAsd ‘Ajyiiqesip
jeoisAyd ‘ured
‘uojoun4 6Y
(dIHO) SYUd
joeduy yyeeH
[10
‘sdiysuonejas ‘asl
C66
‘UNH pue
ssneys ysBusyysn
=‘ jeloos ‘ssourddey
‘souapyuoo
‘yoseds ‘Buljese
‘soueieaddy
GZ (did)
ayole
Joeduy] jejueq
O66} ‘UejOg
puke UOSsIYyo} 7
"SS@USNOIOUOO-}1as ‘AIOM
‘uled (IWHOD)
Xepu] ysibuay/yvsn
‘gouBseedde ‘sjoeju0o
jeio0s ‘yoaeds
‘Burnes ‘BuimeyD
ZL jUSUSSASsSY
YYESH [eIC
D}eUeD
QINSIO} ‘YIOM
686L ‘12
Je SuIsioy
ysibua/yvsn ‘yenjoayjaju!
‘yooeds ‘uoNoeJe}UI
;e1I00s ‘syse]
SwOY sey
el aOld
oediuyj sSauyoIs
686} ‘Te
8 yoo
ysi6us/vSn
UOHESIBAUOD
‘ALIOM ‘ule
¢ xepul
je}ueq GNVY
Q86L ‘12
Je Bulysno
ysi6us/yn
eoueieaedde ‘ured
‘Buiy6ne ‘Buijs
‘Hurye} ‘Buimeyd
PL gjeos
jejuspois0s
abenbue7
suo}! siouny
jpedojaasp Aujuno9
uoIsuBwIGg jO
‘ON yUSWUNI}SU!
BU} JO
oWeN
SJUSLUNIJSU! JOONHO
Suysixe ue
yo Auewiuung
"¢'z ajqey

8C
"yjyeaiq ‘oywod
‘Ajyeuosied ‘eoueul
LoOg ‘peg
8 YEID9/\I
‘WOM ‘pool
‘saujeseo ‘eouapyUOd
‘YBnel/ajiws ‘eouewos
TCM) 1TOOMHO])
ysy6usayyn ‘qe100s
‘deajs/xeja ‘uyeey
‘yooeds ‘aouesesdde ‘Bujey
OL ‘alr
Jo Apenyd
payejoy uyeeH [BO
‘uojowe ‘esougieadde
Q66L ‘WweYlsuS
9g UOUeAiNpY
ysi6uz/-yn ‘Buideays
‘auaiBAy jeio
‘Buryeeds ‘Buea
ui SOURBLUIOLIag
6 SOUBUUOLe,
Ajleq Uo
yoRduy jeIO
9661 “Ie
Je ulssely
ysii6ua/vsn ‘UOHESJOAUOD
‘saHiAyoe jel00s
‘sanianoe Ajleq
€ apr
Jo Aen
payejes-yyeoy] |e1O
G66) ‘weyleys
pue cee)
ys bulyyn
Buijee ‘senanoe
Ajlep ‘ured
‘eoueseadde ‘ojwog
9¢ Buia]
Apeq uo
yoeduuy} jeyueq
abenbue}
swe}! sioujny
jpadojaaep Anunog
UOISUSWIG
JO ‘ON
JUSUINIISU! BU]
jo swe
‘(penuljuod) syusWNAySU!
JOOYHO
Buljsixe ue
jo Asewiuing
*¢°Z ajqeL

29
However, only four measures, which are the most widely tested and used, are reviewed
in this section. They are the Oral Health Impact Profile (OHIP), the General (Geriatric) Oral
Health Assessment Index (GOHAN), the Subjective Oral Health Status Indicators (SOHSI) and
the Oral Impacts on Daily Performance (OIDP). These measures have been used in countries
other than the one in which they were developed. Moreover, these measures have also been
translated into other languages and tested for their psychometric properties. A review of each of
the measures follows the headings as listed in Table 2.4.
Table 2.4. Standard method for reviewing OHRGoL. measures.
Purpose: Brief statement of the purpose of the instrument.
Developmental process Description of the development processes, which includes the conceptual framework used.
Description Description of the content, Domains measured
Response option Time reference
Method of scoring Administration
Time taken to complete
Property tested Brief summary of property tested.
Population/setting Original group/setting Other subsequent group/setting
Comments General comments.

30
2.1.4.1) General (Geriatric) Oral Health Assessment Index (GOHAD
Purpose:
The General, (formerly known as Geriatric), Oral Health Assessment Index (GOHAI) was
developed in the United States of America by Atchison and Dolan (1990). Its aim was to
measure oral functional problems and to estimate the degree of psychosocial impacts associated
with oral diseases in the elderly population.
Development Process:
Conceptual framework: The GOHAI was based on the definition of oral health as a freedom
from pain and infection and consisting of a comfortable and functional dentition (natural or
prosthesis) that allows the individual to continue in his or her desired role. Based on this
definition, three hypothetical dimensions were derived: 1) physical function, including eating,
speech and swallowing, 2) psychosocial functions, including worry or concern about oral health,
self image, self-consciousness about oral health, and avoidance of social contacts because of
oral problems, and 3) pain or discomfort.
Item generation: The items were generated using three methods: 1) literature reviews around the
area of oral health and disease impacts, oral functional status, patient satisfaction, oral
symptoms and self-esteem and socialization, 2) consultation with health care providers, and 3)
interviewing people attending a senior center in Los Angeles and a Veterans Administration
hospital dental clinic. A total of 36 items were generated to reflect the three dimensions.
Item reduction: Item reduction was based on the internal consistency and frequency distribution
of the response options. A final instrument containing 12 items, which exhibited the best

31
distribution of responses and maximized the Cronbach’s alpha for the instrument, were chosen
to represent the three dimensions. The items chosen were worded both positively and negatively
to discourage respondent acquiescence.
Description:
The GOHAI contains 12 items with a six-point frequency Likert scale response option (always
[5], very often [4], often [3], sometimes [2], seldom [1], never [0]). The time reference used is
three months. The GOHAI score is obtained by adding the response code for each of the 12
items after reversing the coding of the three positively worded items. The GOHAI score ranges
from 0 to 60.
Properties tested:
Reliability, in terms of internal consistency, was assessed in the original development with a
Cronsbach’s alpha of 0.79. Component principal factor analysis showed that the instrument was
measuring a single construct. Two types of validity were assessed: criterion validity and
construct validity. It was found to be valid. An Initial study on the responsiveness of the
GOHAI, found that the instrument was sensitive to the provision of dental care among the
elderly population (Dolan, 1997)
Population/setting:
Table 2.5 shows a summary of papers published using the GOHAI and Table 2.6 gives a
summary of papers describing its translation and adaptation to other languages and cultures. The
GOHAI was originally developed for use with older adult populations. However, recently it has

32
been used with population of younger adults (Atchison et al, 1998). It has also been translated
into Chinese (Wong et al, 2002b) and French (Tubert-Jeannin et al., 2003)
Comments.
Because it is a short instrument (12 items) the administration of this instrument is rather easy
and cheap. Since this instrument is an index, it gives a net impact of oral health, thus it may not
be possible to disaggregate the contribution of different domains of health to the overall score.

ee
"9409S XSPU!
||2IBAO xa]dwoo
OU} SB
[JOM SB
'|VWHOO yuswpede
BU} JO
SUS} [ENPIAIPUl
JOIUaS 9]
UO SBOlAJas
je}USp
poayene
SNOLIPA Jo
joed UI
Sy} ~younyo
pue}sJepun
O}] pepssu
‘pezipisqns
S| YOJBOSOl
|BUO!IPpe Ajjesepel
e
yBnouye ‘aueo
JO sjuapisey
|e}Uap Jo
UOIS|AOJd au]
(Buydwes ‘aBueyo
Joe}ep
0} SAISUAS
SI [YHOO
anss! |@9
MO|AJO}U} (sueah
Z) DHEWUSISAS) |
0} AyIge IWHOO
2661 ou}
yeu} siseH6ng |
ibojopoujeyy 90BJ-0}-9084
ysn j2uIpNyGHuo0 7
‘+69 OOZ=N
ssesse O}
uelog
"s9jdwes JudlayIp
OM} BU}
Ul IWHOOD
‘saidues jo
uoHeysiujwpe
Jo Ajauea
e ul
Bulag WO, seledod
-|}aM pue
Bujuo youn ol4jowoyoAsd
pue
uO SUOI}IPUdS
JEUOTNGLISIP SU}
jeJO JO
Joedu! G4}
Jo asedwos
0] (Z
Joyeolpul ue
se |VWHOD
‘suemisAud
jo asn
penuijuco Ajtunuiwos
Buisn
jsoebins sijnsey
- sjusijed
aueoipey\
‘USUI JEpjo
jo sejdwes
(2 jo
ajdwes
om] UsEMjeq
pue Alyejueseidas
e pue
seo
Buowe
saouasejjip Aywesu)
yyeey WA
Buisn
o1ydesHowuapojoos
ZPG=N
sjuaned ojew
O}] SAIPSUAS
S$] }|
- :ejdwes
WA -
Jepjo jo
ajdwes
‘sejdues (ajdwes
3 B
Ul WHOO
yjlog ul
seliedoid eu
OUa!IUaAUCD) 4}
UO S8l00S
oyeuuOYyoAsd
:ajdues VA
- 66Z=2N
UUM peyeloosse
Z66L
Asopoejsiyes A8ains
auoyds|a} jeuoyjoas
+9
‘ojdlues SJO}JOR}
‘yey
SUGIUXS |[VWHOD
- UyeoH
| ‘aseo
aueolpey -
ysn -SS0l9
Udi aJBOIPS
- euiuexs
Of (LP |
ulssely
vol elslu|WwipYy uoIsnjoueD
uonesjddy
IVWHOS
uolje007 | ublsep
Apnis
aby
ajdwues wu
souny
IWHO®O Suisn
peysijqnd sueded
yo Arewuung
‘¢°Z ejqe

ve
Qu} JO
uoHeys|uWupe s,uelisAyd
pue S,jsHUep
UsEeMjeq juaeweeibe
pooh
Buyesipul 19°70
40 JUSIOIJ9OD
UOEfOI09
SSPJOBU! OY!
- ‘peyedionue
aie peou
Jo sjena]
yBiy WOUM
ul uoneyndod
e ul
joo} Bulugeios
jnjesn
@ JOU
SI WHOS
SUL -
‘pooB Jo
poo6 AJaA
‘Uua||eoxe
se yyeoy
[eso JI@Y}
payes sjuedioyed
Bu} JO
%OZ ‘speeu
pue eseesip
ybiy aydseq
‘speou
-uou Aq
pasn
8q PINOD
IWHOO
Ou} JOUJOUM
suiuexa of
(¢ ‘uoyejndod
Aepya [ej
Qu] Ui
JUSUeSI}
je}Uep jo
pseu ul
suosied
BuiAyquep! Ul
[YHOS
94} jo
ssaujnjesn ay}
SUIUeXe OL
(Z “2018S
JBdIPaiAy SOY
s,uo}sog Aq
peases sjusned
punoqetwoy au}
Jo snye}s
Yyjeoy
jUSLUJeel)
BAl}Oe[qo (Buydwes |
jeio pepodel-jes
pue saiieo
‘sso| wopued
pue peulwajep
6661
JOO} JO
|eAg} UBIY
Asains j2ualoas
onewe}sAs)
Aypeoruyjo yejeo
pey ajdwes
siyt -
UyeoH MAlAJO]U}
yen -ssain
| Apeply
OS=N |
au} ssesse
Oo] (1 |
saiqereg
‘UBILOWY
“sjeuolssajoid -UBDLIY
pue
yyeoy jejuep
sojuedsi
JO} ajGenjea
ose jeu}
suojeyndod
uyeey [eso
Jo sjoedse
p
juepodui
ssiw Aew
oousoquBbiau
UyJeey JO
sesnseow SWOSU!
peyiodal-}es -MO}
OM ‘UBOLIOLUY
gueUueb Jo
asn su}
pue (6uyjdwes
-UBOLIY
yyeay jessueb
wo
@nisodind) pue
soiuedsip
JOUNSIP SI
UBESy [es
- 9c=N
jo ajdwes
ynpe
"sojdues ‘ueoWeuy | e6e-\je
ue ul
pesn
asenip Ajjeojuyje
pue UBOHY
USYM IWHOOD
8661
4e6unod ul
pesn usum
anssi jeo
AASIAIOIUL j2UOI}OeS
O8SZ=N 8uj
JO ATIpHeA
ye je
DHEA SI WHOS
eUL - |
Gojopoyjew 908}-0}-998
4 vsn
“SSOlD wnpy
‘soq1uedsiy |
oy} ayeHyseAu!
OL | UOSIYOIY

St
uyjeay jeso
ajeiidoidde
0} sseo0y
- “AyuNUUWOo
“SJENPIAIPUul ou}
Auyapje pesiwoidwoo
wow} sjueed
Ajjesipaw Wve
- 9sSsu]
jo UOHOBysies
"Sonoel
aj} pue
Buleq-|jom ouy
e1e9 UO
JOOS JuBOWIUBIS
eB W9}-Buo0]
| “aujUueo
OJe9-UW9}
BABY SJSPJOSIP
jEIO -
ysouoAeg Huo]
& Uy}
"SJOPJOSIP [BJO
JO MLE
- Peal]
WOUM
Jo
ynsel e
se swaqold
‘aqUueg |
jsow sjenplAipul
yeioosoyoAsd pue
ysqunheg pesiwosdiuod
jeuoHjouns paouaiedxe
au} ul
A Ayyeorpewu
uole;ndod
jjuepusdepul Jo
uoeyndod
Ayepje pesiwoid
woo PaAl|
%6rv -
e jO
oy
Aljeoipau GZZ=N |
jo Ayjenb pajeja.
27002 B
jo uoWodoid
Agains MAIAJOIUI
jeuoyoes ajdues
-yyeey jes
eyo
jeyjueysqns -
UYeoH e@0eJ-0}-80e~4
epeuey -SSOID
|
OOL-ZG | saUaIUeAUOD
eu} ssesse
O] JEyO0"]
98=N (aue9
[e}UNp
"aleo Bulyoes
Huryjees jou
asou} pue
Ayaayor)
eseo Buryeas
Ajaaqgoe sjuened
JENpIAIpUl UBEMJOq
jeyuaq -
ales Bulyees
S}CNUSIALIP O}
ZG=N
JOU BSOU}
YM
age st |VWHO
Su -
:(aue9 jejUep
peiedwioo aeo
‘WHOS
pue uyeoy
Buryees jeyuep
Burjysas
Jeo peyel-jjas
jeqoj6 S8-SG9
AJaayoe AJ@AOe
BSOU}
au} Buisn
painseow ueHed |
jou) ejdwes
Ul Sa9UeJEYIP
se aseo
jejuep Bulyaes
jeyueq eawoy
jo uoyenjeas
asou} UeU}
YyeeY jeso0
G6-EL Bulsuny
- 24}
Ul [YHOO
6661
JayJeg pey
ose
jeyuep Aaains
feuoljoes “OLUOU
‘ajdwes ay}
Jo Ayiqe
seyu
Bupjees jou
esoyu -
uyeeH POUOHUSLU
JON ysn
-ssoij |
Bulsuny | eouaUsAUOD
au} ssesse
Oj |
aueosey|
‘WHOS
“uo}eyNsUoS
jejuep Buysenbe.
JO} poeou
QU} SUILUJE}Op
0} sjeudissajoud
uyjeey jejuep

9¢
"JUBLOC
UI
Buleq se
psebol
SIENPIAIPU! BSeu}
yeu} apy
jo sjoodse
Buynseew oe
bi-dIHO PUB
|VWHOD -
“OHl] JO
Ayyenb |JesaA0
sAosduut
0} Ajeyl|
St eed

Le
— OPO
:uaITejasJ0O gjBOS-tWs]]
- 98'0
:eudje s,yoequolg
-
JUSIO1jj809 UONEIaU09
$,UOSIed¢ :UOI]e|esJ09
8109S "Yous
sem abenbue|
jsiiJ @SOUM
‘IWHOS 284}
‘Aiqeljes pue
Appiyea -LUd}|
PUB WA}-O]U]
=e | syenpialpul
fenBuljiq eouy
| JO
UODISJOA BOURL-
€00Z
ajqej;deo0e payeujsuowep
"eydje S.yoequolg
oe ‘WoVe|SuelT P
leMIO4
au} Jo
AypyeA |
‘jeje ujuUeer
UOISIOA [WHOS eouel4
out AWIqeney
youeiy 0}
ys Bug
pSuoHUSU
JON OU}
}SO} OL
-Hoqn,
‘ajdues BOUSIUBAUOD
- ALAPJOe OZ
‘BUSS Old
“s}sq}Uuep juspusdapul om
"ysi{6uz 0}
eseulyd ‘Uohejsuey piemyoeg
sioy}ne ‘peeu
jueWUjeol} peAlsoled
auy Aq
auop —
uorejsued}
(syoefqns pue
einseaw pJEMJO}
OU} UI
pasn sem
YYEOY Jes
Psjes-jjos We}!
uoissnosip dnos6
snoo} -9[Guls
@ pue
81098 |YHOD |
ay)
wow UOeWWOJUI
aU, useMmjeq
UOEOssy
oe ‘asaulu9
0} Ysi6uy
28'0 {JUuaIdIye0o
sisjeue J0}Oe|
/UOe|suely Premios
UOHe{909 SSBjejul
oe jUSUOdWOD
jedioUd =
"21098 [WHOOD
€93'0 JUSINIJe0o
Aypijea yonsysuog
“senss! uyeoy
au} soueN|jul
uonejauo0o suewuesdS
8 jeso
jnoqe suJeoUoS
Aewi Ajqissod
}SO}O/-]S9 | ‘(9am
Wey} sseidxa
ALLapje Jey}
Su0}OR}
190 auo)
eddey payyhiem
au} MOY
pue}suepuUNn a}eBI|SOAul
O| -
-97'0 1UOI}e}a1U09
a}eos-tuay} - |
PUB JUS!D1JJoO9
UOHEje1109 0}
— Apepja
JO} azyue0
‘Buoy
L3°O ‘Bude
s,yoequoly
- yues
suewueeds
jeioos suo
pue swoy
Buoy
ui Ayapyle
jSo}eljsol
Ayseple om)
ul peyonpuos
30} IWHOD
JO
“Ayyiqeryjes pue
Aypyea UOHEaOD
BJeos WY
=e | | auam
sdnoi6 snoo}
eauy tL
UOISI@A BSeUlyy
giqejdeooe payesjsuowep
"eydje s.yoequoig
BU} BJEPIeA
GZ00¢
UOISISA [YHOD 8seulyD
Syl AWUPIGEHOY
asouly
o} ysy/6ug
pauojuew
JON | pue
ajejsues Of -
‘je Jo
Buona
yYiOMOWes |
uoisnjoUueD pessessy ealy
uoljesuel] uoneydepy
wy
soupy
afenbue] pue
sein}jnd 48430
0} [WHO
24} Jo
UoHeIdepe puke
uONelsuel] 9°Z
B1q2L

Be
28'0
0} LG'Q
:eddey peyybley,e
28'0 :JUa101Jje09
UOI]TEJG1IOO S,UOSIES
=e
‘JSO}Ol-]SO]
82'0
“snjejs feyuap
jeoiusjo
BY} UM
84098 |VWHOD
ay} pue
‘sesuodsal wal}
syuedioed
oy) Buiedwoo
‘AJIPIJEA JUBUILULOSIQ)
“UHeESY eso
UM
UOHORJsHes pue
peau JUSLU;eeL}
PeAleoied spolqns ‘aunseow
uyeay Jeo
peyel-jjes we}!
-ajGuls e
pue 91098
WHO
usemjeq ucielossy
‘AUPIJEA JUALINDUDD-—®
Aypljea yonysuog
‘(syaam ¢)
eddey
PUB JUSIDIJJO09
UOHE|e109 $,UOSIedd
JSO}Or-]SO] ¢
‘9jdlues s}Npe
O6
‘BURSS} JO}ld
"ysi6uz sem
obenbue] si aSOUM
sjenpiaipul yenBuiliq
suoHe|Suel) puemyoeg

39
2.1.4.2) Oral Health Impact Profile (OHIP)
Purpose:
This instrument was developed in Australia by Slade and Spencer (1994a). The aim of this
instrument was to provide a comprehensive measure of self-reported dysfunction, discomfort
and disability attributed to oral conditions, which can provide information about the burden of
illness within the population and the effectiveness of health services in reducing that burden of
illness (Slade, 1997b).
Development Process:
Conceptual framework: The conceptual model proposed by Locker (1988) was used to identify
conceptual domains (see page 12 for the description of this model). Seven hypothetical
dimensions, namely functional limitation (e.g. difficulty chewing), physical pain (e.g.
toothache), psychological discomfort (e.g. self consciousness), physical disability (e.g. changes
in diet), psychological disability (e.g. reduced ability to concentrate), social disability (e.g.
avoiding social interaction), and handicap (e.g. being unable to work productively) were
created.
Item generation: The items were generated from open-ended interviews with a convenience
sample of 64 adult dental patients in Adelaide, Australia. A total of 535 statements regarding
the adverse impacts of oral conditions were identified.
Item_reduction: A content analysis was conducted and resulted in identifying 46 unique
statements. These 46 statements were categorized into those seven conceptual dimensions.

40
Three additional statements from an existing inventory were adapted for use in the handicap
dimension and gave rise to a total of 49 items.
Description:
OHIP contains 49 items grouped into seven subscales. The number of items in each
domain varies. A five-point frequency Likert scale is used as the response option and treated
both as ordinal and interval data. The time reference used is one year. Each item is given a
weight indicative of the severity of the problem it describes. Unweighted and weighted scores
can be computed for each domain and the OHIP overall. The design of the OHIP permits it to
be administered both by interview and self-completed questionnaire.
Properties tested:
Test-retest and internal consistency were assessed in its original development. The Intraclass
correlation coefficient for test-retest reliability ranged form 0.42 to 0.77 for six subscales, but
only 0.08 for social disability. Cronbach’s alpha values for internal consistency ranged from
0.70 to 0.83 for six subscales, but only 0.37 for handicap. Construct validity was evaluated.
They concluded that this measure was valid and reliable for use in the target population, that is,
Australian elderly population. A study done by Allen et al (2001a) demonstrated that OHIP has
good ability to detect change (responsiveness).
Population/Setting:
Table 2.7 summarizes papers published using the OHIP and Table 2.8 shows a summary of
papers describing its translation and adaptation to other languages and cultures. Originally, the
OHIP was developed for the Australian elderly population. Subsequently, other countries, such

41
as Canada (Locker and Slade, 1993) and America (Hunt et al, 1995) have used it for their
elderly populations. Recently, it was used in an adolescent population in the U.S (Broder et al,
2000). It has also been translated into German (John et al, 2002), Chinese (Wong et al, 2002a)
and Canadian French (Allison et al, 1999).
Although the OHIP was developed for descriptive studies, it has been used as an
outcome measure for evaluating clinical interventions such as osseointegated implants (Awad et
al, 2000) and in resource allocation by identifying patients who are most likely to benefit from
dental treatment (Locker and Jokovic, 1996).
Alternate form:
The OHIP has a short form - OHIP14. This short form was developed using a controlled
regression method in which the OHIP score was the dependent variable (Slade, 1997c). Two
items from each domain were selected based on their contribution to the R-square. Locker and
Allen (2002b) produced an OHIP short form using the item impact method. Table 2.9
summarizes papers describing the OHIP short form.
Comments:
OHIP is considered to be the most sophisticated measure of oral health, since it covers a broad
range of quality of life dimensions. It was based on a coherent conceptual framework. Although
the way in which items were selected is not clearly explained, they were selected from a wide
pool of items, generated from interviews with the target population. This ensures, to some extent
that the content coverage is satisfactory.
The OHIP can be administered both by interview and self-completed questionnaire.
However, a randomized cross-over study of Australian adults by Slade et al (1992) found that

42
the OHIP-49 underestimated oral health impacts when administered as an interview. One of the
limitations of the OHIP is the length, increasing the cost of data collection.

ev
"sosoujsold
peziiqeys -jue|cduut
SU} WO}
HJeUaq 0} Ajayi]
s}uaed
BulAyuep} uj
(nyasn sieedde
diHO -
“@W0d}NO yuowjeo}
Jo s0}01PaAId
poob e
aq 0}
jou Jeedde
suojeypedxe
SPUBHE
- "jueWea.}
paJisep St=N
MOY) PSAl@dal
‘(jueuaoRdas
sjuayed I
aunjuap "9WU09}NO
BIOLU SEM
Aji] JO
J2UOIJUBSAUOD uo
uoHe}edxe
Ayyjenb poyeje.
pajsonbei aaneiadoaid
~Uyeay au}
JO GUM
9@sou}) jo
aouenyut
JUSLU9A0JC LU]
- Z ainjuap
au} ssesse
Of (Z
“sjuaed jeuo|jusAUOD
‘sounseau snjejs
snojnjuepe OZ=N
:(uejduyt |
yyesy oyjoads-jes0
jo af)
Jo Ayyenb
aAlo0eL ‘paseq-jueyed
psyeyes-yyeoy you
pip jueydul
Buisn siaieam
ayy uo
yoR du} paysenbel
ainjuaep 9}8;dWOs
e@anisod @ eAeu
OUuM 2souy})
jo smjejs
uyeoy
ueo sesoyjsoid
|. aunjuap
Sy} UO
siseujsoid
peziiqe}s JEUOHUBAUOD
PSZiiqeys
~juejduu! Jo
wopBbuly peuipny6uo}
O¢=N ~juejduu
joedu! qL00é
JBUOIJUSAUOD - |
jel} [BOIUD
pauoljUSw JON
perun aanoadsold
ynpy | :dnos6
jueyduy au}
ssesse OF
(1 ‘je
yo UdTIY
diHO 4°
uoisnjaue4
uoeoyddy | uoyesjsiujwpy |
uojeso7 | uBlsep
Apnig
aby
ajdwes
wy
soyuny
diHo Sursn
peysyjqnd sueded
jo Arewuwings
“2°Z e1qeL

vv
Buowe
peyJeuu
Ayeinoyied sem
yoeduul slut
-
"SUOITIPUOD Je10
HOU} UM peyeosse
SOAl Ajtep
HEY} UO
~eCdUI
eneBeu
saey 0}
peyoda
ajdoad Jepjo
jo uonodoid
JEHUBYSqNS -
:eyep AJBUIUUIOl
“AUDIEA (SHNPY
JEPIC | “S}INpe
Japjo jo
ayy
yonsjsuoo poob
jo uyjeaH
Jo Ayyenb
peyejes
eyeajsuOWwag -
{240 8u}
jo ujeey
jes0 uO
“06'0 Apmg oejuo)
eyep Aseutwuyoud
0970 ‘eydje
(8ve=N) apiaoid
of (Z
S,YORqUOold -
Ayunwwoeo
soiedod
:sansedoid Asains
(jew) epeuey
j2uol}oes ueyjodojew
juguainseaw |
SE6L epeIS
DLUJ@WUOYOAS uiesH
pajadwico-jjas Ol12JUO
-SSOlD +05
-UON eu)
ssesse of
(, |
pue 194907]
“diHO au}
UJIM peunseow
yl Jo
Ayyenb
“Bjl| JO
payejel-yyJesy
Ayyjenb payejes
uo ‘sjuejdui
-Uyeay fes0
omy Aq
payioddns
ul JUQWJEOL]
sesouysoid
jEUO|JUBAUOD (pauBbisse
‘SA SOINJUSP
JOA0 Ajwopuey)
JEUOIJUBAUOD
JUSLUSAOICUI Jejngipuew
WWt8}-OUS Sb=N
‘wuslnjuepe
jueowubls (S9-Se)
dB
aunjuap JO)
SJUSWWES]
saplaold (dIHO
40 JEL
PEOUND ynpe
JEUDIJUBSAUOD jo
sodA}
JUSUW}BO} UOISJOA
YOUS!4) epeued
payosju0g sno
pr=N OM}
JO sjaye
0002
queiduy |
jeu} jeouyo
pajajdwoo-}}3S ‘Teeqjuoyy
pezimopuey |
jnjuepy :d6
yuejduy] ay]
eredwoo Of] |
je je
pemy

Sv
“sueaA snolaed
ey Pepusye pey
OuM pue
saspuaye onewoydwAs
9J8M OUM
@SOU} Aq
payiode,
yoeduul sayBiy
YM
‘susJeyed
uoiyeZziyn J2}Uap
JOU} 0}
5ulpsoooe
suosied
ayejuap Buowe
SUOIELIBA 4e6se7-
‘yoedull Jayeoi6
Ajueowubis
UM
pejeloosse Sem
abe JApPIO
- ‘snojnjuepa ayes}
Ue} yoediui
alow
Ajueoyiubis
peyode
ajew
snojnjuepe asaum ‘Buree
pue Burmaya
0} pejejei
seaue ui Aeynoned
‘joeduul jeioos
p SZHEUOHMNYSU!
*sdnos6-qns Aq
paousiiedxe
yoeduul
[BI00S Jo
}U9}XE Qu}
Ul SUOI}BUA
ssesse O01
(Z
ALepye
pezyeuolynyysut -UOU
BU} JO
UOHIPUOS jeJO
YJIAA peyeloosse
jyoedu
juenba aol
-UOU (J
LZ-=N) ye1o0s
peyode!
Gr661
peyodai uosied
Aaains eljeuysny
jeuoioes ajdwes
jo Aduenbea.y
ay) Jaoueds
snojnjueps -
uU]eoH P9}9/dW09-}jeS
yjnos -SSOlD
+09 wopuey
yuauunsop Of
(1 pUe
SpE|S
"“gued jejuap
JO} S}ISIA
sejnBed
yew
JOU pip
oym sjenpiaiput
snojnjuep pue
snojnjuepe UjoqG
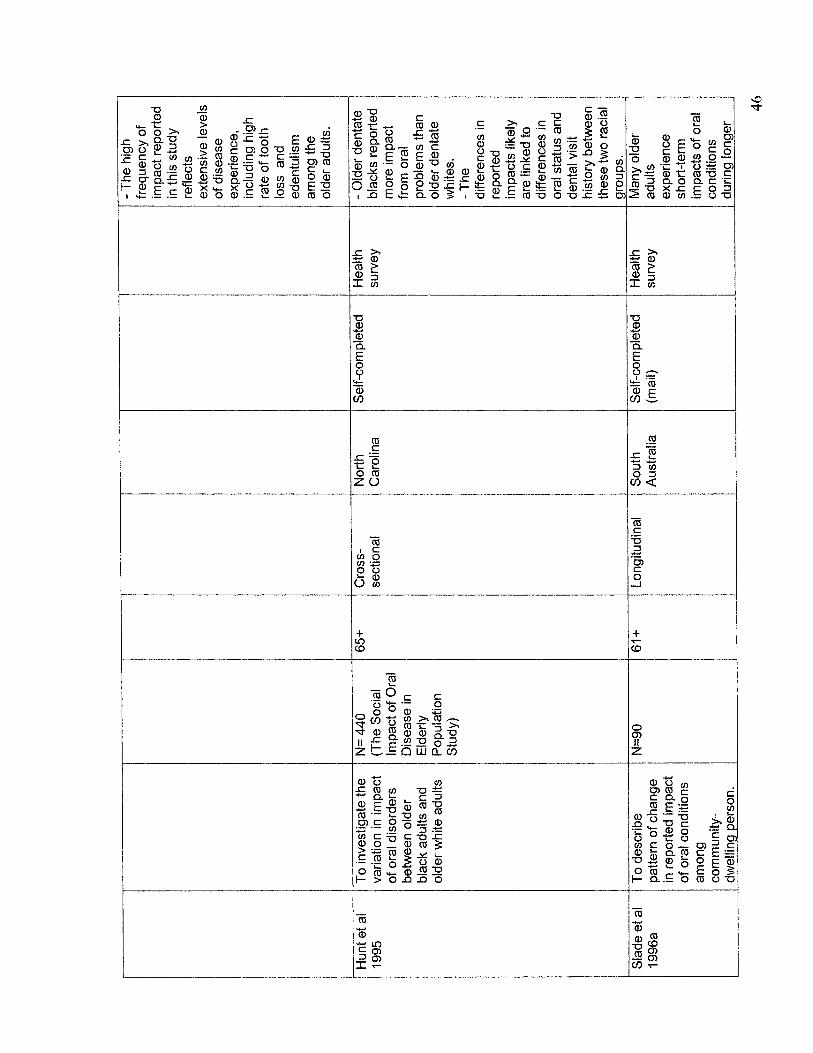
ov
Jebuo; Buynp
“uosiad Bulljeap
SUOI}puco -AyUNUIWUOO
jeio jo
syoeduut Buowe
UU9}-}4OYsS SUOHPUCD
JBJO Jo
eousuedxa
yoedul peyodey
ul
synpe AdAins
(re) eyjeasny
e6ueyo jo
wepjed eO66/
Jepjo Aueyy
YESH
pajejdwuos-jag YInNOS
jeuipny6u07 +19
O6=N aquoseap
Of | |e
je 8peis
“sdnol6 j2joes
OA} BSA}
uaemjaq Aioj}siy
HSIA jeyuEp
DUP SNye}s
jes0 Uf
SSOUBIALIP 0}
pexul ae
Ajayi} syoeduui
peyodal
Ul SSOUSJO}IP
aul -
"SOUYM (Apms
a}e]Uep Japjo
uoyeindog |
siinpe epym
Jepjo
uey} suuayqoud
Ayeapyy pue
sjinpe yorq
jEJO WO’
ul oseasiq
JEplo Usemjeq
yoedui asow
j2IO Jo
yoRduy| SJOPJOSIP
jeJO JO
peyiode. syoesq
Aaains euyjoles
Jeuc}oeS feloos
ay1) |
yoedui ul UoeWeA
S66L
BIEJUSP JBP/O
~ Yee
pe}a}dwiod-Jas ULON
“Ssol) +99
Ory =N |
24} aeHyseAu!
OL j@
}@ UNH
“s]inpe Jepjo
ay} Buowe
wisiinjuepe pue
ssoj JOO}
JO ayeJ
yBiy Buipnjou
‘g0uUa|Jedxo
eSeasip jo
SAAR] SAISUBIXO
$}OeJel
Apnjs sitj
ut peyoda. joedu
jo Aouenbey
yBiy aul
-

LV
B pey
pl-dlHO PUB
6PdiHO
- "seunjuap
feuouUeAUcd Bulyjees
asou}
UB] SSO}
Y}OO} Aq
peddeolipuey “dIHO
$0 SWA}!
7}
jo
spoued
pue pajqesip
pue 6
Jo Ayipifea
‘pasreduuit ei0w
eu} sledwos
O| (Z
Ayueoubis
“‘SJOIBOM aJNjUSp
aJOM jEUdIISS
Qr=N
‘Jueldwy Q}9|]GWO9
Ul S$so}
R661
sdnoui6 yuejdui
Asains wopbuly
-SSOJO GE=N
(}04}U0D YjJoo}
Jo oe dul
UBINAOIN
ul syoalqnes
- UNeeH
POUO!}USL
JON perun
jo.jUOo-asey) ynpy
‘sdnoi6 om
ay} ssasse
of (1
pue udjiv
eplejepy ul
ued
pepunj-oijqnd
GHulaleoe, sjuaied
jeJuap jeraueb
yy UOSsedu0s
‘sjuened Ul
UOHOSsu!
jesouoh ue}
Al UM
sjueyed
yoeduii jeloos
GrL=N
jejuep Buowe
Jo sjengy
soyeoub :sjuaned
SUOI}IPUOS |eJ0
Ayueoyiubis jeluap
jesoues Jo
yoeduu jeioos
payoda,s ASAINS
eljeasny jeuoyoes
PS =N
pue snjejys
uyeou 9661
sjuaned AIH
UJeoH
pejajdwoo-}jaS ujnos
-SSO0ID Wwpy
juaned AIH
jeso ssesse
O| | je
je sayeod
BONO
JO
S}E}S payun
pue eeisny ‘epeueo
‘joedul jetoos
uj uolejndod
Ss} pue
yyeey Z¢@y=N
‘VSN Ayapje
Buowe
jeso Bulouenyul
9¢6 SUOHIPUGD
JeJO
SJO}OR peinyjno
vsn
=N ‘eleasny
jo yoeduyi
jej90s
pue |elo0s
ASAJNS eieusny
jeuoyoes 612
QU} Ul
SUOITEEA
qo661
ase aay t
yee
peje|dwi09-jjaS epeuey
-SSOID +9
= N
:epeuey
ssasse oO]
je 38
epR|S
“UYEoY j240
jo yoedtuui
peajeoiod
ut Ayyiqeys jesodtue}

8V
Jo dnoib-qns
e peeu
OYM siinpe
Ayquap! 0}
9/qe (SHNpY
J8PIO Japjo
Ayjuap! eze
Agu} ing
jo yyeoH
0} suoyeo1pul
*s}00} Buluselos
{JO 94}
JO yyeey
|elo 9661
se ||JOaM
Asains epeued
jeuojoes Apnyg
ouejyuc) | eagoolqns
jo Ayyige
oIAOyOr
pewuopied JON
yjeoH paje|dwioo-jjes
OWeIUO ~SSOlD
+0S €67=N
ey} ssesse
o| | pue
s94907]
‘aides Apnys
siyj Buowe
9E-AS Ou;
UBY} SUOIPUOd
yyeay [eso
jo sjoeduj
ou}
UIIM pajeloosse
AjuBiy BJO
8G 0}
sueedde qIHO
-
“snyejs UYeoy
jeso peoruyo
100d Jey}
“sjusosajope Ayo
UIIM payeloosse
~Jauul ay}
Buowe
sjoedu UjJeay
felo jo
yealBojouoAsd slojeaipul
jeoluijo
pue 0}
‘diIHO eu}
pue
jel90s ‘jeajsAyd
9E4S GNVY
84} a|qesopisuod
‘gwioojno payiode,
psoueledxy -
-}J9S jO
Sounseew
‘aidwes Apnjs
om) jo
diysuoiyejei
ay} Buowe
8} pue
SUOITpUCd
spseu jawun
sjuo ajdwes
yyesy jeso
jo
pue saves
Asains jeuoloes |
osajope
BOUdIUSAUOD yoeduul
panisaied 000z
Jo j9A9]
YBIH -
uylesH PSUOIJUSW
JON yvsn
-SSOln | Ayoul)
S6=N au}
ssasse Oo} |
‘Je }e
sapolg
“Bunes
jeaiusjo @
Ul ple
jnjesn e
aq
Aew ¢L-diHO
- ‘sdnou6
ay] USeAjeq
@}EUIWWLOSIp
0} Ayjiqe
Jey wus

6P
JSOLU SU}
WJyeUaq Ajqeqoid
pjnom
OUM aj}
Ajtep uo
Agueoyiubis
poyoedu!
SUOI}INUOD Jeoruyo
asouM
S/ENPIAIpU!
jugu}ee) f2]UEp
SOINSBOU O41]
JO ajdwes
Ayyenb payejas
anssi je
eyesjsny jeurpny6uo|
WOPUeY
“aBueyo
-yyeey |e1E |
Hojopoujey| Pe}o/dWiod-jeS
yInoS |
jeuoyeAlesqO +09
86v=N fOJUBUUSSESSY |
8661
SPEIS “sdnob
usemjeq SSQUAIALD jueoiubis
BulAyjuep! Jo
Sw9} Ul
Spoyyow Buyoos
49yjo Oo}
pesedwoo
dIHO St}
“dlHO Jo
souewuoped
(sIINPY 4EP|O |
aU}
jo eoUeWOLed
ey} sAoiduut
jo yyesH
@U] O}
a}Nqu}UOS
Ajyeueysqns EIQ
OY} JO
S}yH}am We}!
L661 you
enssi jeo
epeueg jeuonoes
Apnjyg ove)
OU JO
JaYJOYM 194907]
pip BunyGien, |
Gojopoujeyy pa}a|duo0d-jaS
OWe}UQ “Ss0l1D
+0S ooG=N
SUIUNO}OP OL
pue ually
(sHINPY JepIO
JO UIESH
JEIQ St}
jo Apnyg
oveyug) (8pe=N)
"g0}eoipul Aytunwiwos
jeoruyo uepjodosjew
SJoJeoipul
pue ainseew
-UON jeoluyo
pue
payioda 9 |
eunseew peyiode
“9S UBEMjOqG
(6G9=N) “Hes
Usemjeq v66L
uoyejes09 enssi
eo epeueg
jeudOeS Ayiunuiwos
diysuonjeje: |
apes pue
yea |
Bojopoujay| paj}eiduw0o-3aS
OuRIUO -SSOlQ
+05 ueyjodojey\
QUIWEXE OL
489907]
Juewyes} jeJuep
Woy

Os
JEUOIUSALO)
OZ=N ‘(juejdu
“S}UBIOM @AI900)
jugwigjejs Buisn
jou pip
juejduui
Aq paaoiduul
peysenbal
jou sem
ouM esou})
Aysedoid siul
- | ainjuep
*poo6 sem
jBUOHUSAUOD “dIHO
jo eBueyo
dIHO 40
eBueys anssi
jeo wop6uly
OZ=N 0}
AVAIISUaS 21002
0} AyAnISUas
- | IBojopouUey\
psa}edwoo-jjes payun
ynpy |
:dnos6 juejduy
Su] ssesse
OL ‘Je
JO UST
“‘sounseaw o148ue6
Uuey} Saseasip
(e10 Jo
S@wi0o}nNo Buunseaw
ul esn
sayees6
JO @q
[IM auieuuonsenb
oloads je1O ‘you
seo0p 9E4S
au) ayum
‘sdnoib ‘9¢4S
eyeiedsip LZ=N
[J04}U09 ay}
‘eINSeSW }I]
Aypearuryo e}ejueq
jo Ayyenb
payejes
usamjaq GE
=N :J]O4}U00
-yyeoy oeueb
@}EUILUOSIP JUaWU}eaL}
JBUOI}OSS snoinjuep3
2 uM diHO
ued dIHO
eu} anssi
jeo BuAIeoel
JOU wopBuly
-SSOID Zo=N
ay} Jo
AyipHea 6661
yeu) saBGng |
ibojopoujeyy pa}ajdweo-}jaS
poyun
jOsjU0d-aseg ynpy |
:dnos6 jueyduy}
ay} aedwos
Oo] "ye
jo USTIV
“soipnys
peulpny6uo| ul
eGueyo
HuizAjeue pue
Buizyenjdeouca
JO} Sajyixedui0s
Mau Buyeeio
‘snjeys Uyeay
ul UOReJOWa}Ep
pue jusWeAd/duI
yjog aunjdeo

Ig
Se=N (JuaWecRdel
eainqusp
jeudl}JUBSAUOD
pejsenbel
OUM 8Sou})
Z aunjuep

cs
‘VL O<
reudyje s.yoequalg
-
c6'0 -€9'0
:}Se}el-]SE| -
‘saipnys jeurpnyBuo|
pue jeuoiyoes
-SS0J0 JO)
9jqeyns $1
}I ‘snuL
‘saljiedoid oujeuOYyoAsd
eayenjeas puke
SAITEUILWHOSID JUSIOLYNS
SEY D-diIHO
UL
-
Jeak-| ‘aousuedxe
SlUues!| spored
jeoay -
“Ss}UBIOM
Wa}! Jo
UOHJONIsUCD
‘UBLUINY 8
PUelg ‘eyde
s,yoequorg
‘(SY9OM ZOO!
}S9}01-]S9} ‘AWIQeNOY
- SSOUdAIsUOdSsAY
- (sdnoi6
pue jug6sJeauos)
Apyea yonsysuog
- *(,OAOU
@p,) SUOIPUOD
je10
JUdJEJID YM
sjualed OZ
UUM MaIAs9}U|
“AYPIEA JUBJUOD
-
JO JUeuedap Ou}
Ul! Payse} jOji¢f
jeuoissajoid pue
s}sijUap UBLUAS JuSpUSdepUl
OM ysi|Guy
0} ueWes) ‘UORe|suey-yoeg
yvsn au]
WO. Jeyeeds
aalyeu Aq
pesiAay
UOISIOA PasiAas
psonpoid s]sijUuap
UBWIIAg Ag
payenjeag
‘ys!|6uz jo
aBpeaymouy Jua|jeoxe
YIM Jayeads
ueuas
aaneu jenBulliq
auO UeWJED
oO} Ysbuy :‘WoRe[suey
PleMIO-
‘ueULas 0}
ys!|/6uq Ppajejs
}ON
eaoge pue
9g) :aby
“diIHO JO
UOISIOA UBLUIAS)
9} jo
Hul}s9} oLewoUoAsd
pue uonejsued
| 2006
‘je Je
UUOr
‘saipnys Bunjes
jesnyjno seu}
ou} ssouoe
Adua}sisu0o
jo sai6ap
sjqeuosesi
2 SEM
Jou} ‘AJOUM
9uU} UO
‘seyeosqns
UIUTAA SHUI
494} pue
}YBIaM Swe}!
jo apnyuBew
ay} ul
yO
‘peAJesqo 338M
SeodualayIp seljue}sqns
awos yBbnouyy
‘suosyedwoo paued
JO poyjew
auojsuny ‘uBipeueg
Burjeeds-youds4
pue
ueyeajsny Bupyeeds
ysi6uzy ‘ueipeueg
Buryeeds ysbuq
usemjeg uosedwog
:s]UBIem Wed}
ajdues Bupjeads-youss4
:Pd}Se] JO
‘yeziueBio yoofoid
ay} pue
siojejsues} XIS
eu] ‘jUStISsEessy
[eu
“abenbue
ysuly
sem ysiGuz
-sjen6Buljig jJuUspuedepul
¢
ys6uy
0} youel4
‘uoTeisuely yoeg
‘eBenbue
jsuy
sem youes
-sjenBuljiq juspuedapul
¢
youel., o}
ys6uq
:doyejsuen premio [
‘juauUSsesse joued
pue enbiuyoe}
uonelsuey yoeq-pjemo4
"youel4 uejpeueg
o} ysi|bug
jenjdaouos -
jenuayedxe
-
OE WOIP!
- OUBWAS
-
(e661) ‘|e
38 UWaTINg)
14Hiam Swe}
aseu}
auedwios O|
(Z ‘uoyeindod
veqent) Buryeads
youel4
e pue
uoljejndod
oWe}UO Bupjeeds
-ysi/6usy ue
LUO) S}YBIOM
We}!
diHO ule}qo
O1 (1
6661 ‘Je
9 UOSIIIV
uoIsn}sUuey
pessessy Boly
uonejsuesy ylOMOUIEI
4
uoye\depy
wy
AOUuINY
sobenBue] pue
seinjnd 18430
0} gIHO
eu} Jo
UOIje}depe pue
uoNelsues) ‘eZ
a1qeL

es
260-220
JUDIOIYSOO UOL}E[al09
$,UOSJES¢)) JSOJOI-]SO |
78°0-69'0 ‘eyde
s.yoequoig
“AUIGEN 4
pue Aypyea
poob Pa}esSUOWAP
UOISJOA
dIHO eseulyd
eyt
Aypijea yonuysuoey
"eydje s,yoequolg
‘(OAM
BUC) JUSIDIYJEOO
UOHe|a109 $,UOSIdq
ysojol-}s9 1 ‘AW/IGENOY
“awoy Ayepye
Su] Ul
S}USPISEl JO
syuaHed saya Aepla
0Z jO
ajdwes aoua|UaAUOD
— Pd}s9}
IOI
dIHO ys!j6uz
ey) ym esedu0g
‘yen6Buljiq aie
OyM s}sijUuap
yuepuedapu! om,
‘UoResuey-yoeg
‘“gsaulyy jeinbojjoo
0} 9}2]SUeJ}
0} dnos6
snoo} woy
uonetusoju! Buisn
:UoHe|SUe] PIeEMIO{
payonpuos sdnoi6
sno) sesy
‘asoulyy 03 ysi6uy
peuolusl JON
‘dIHO WJOJ-JOUS
SSOUlYyD e aAuep
o| (¢
+09 :oby
Buoy Buopy
ul Ayepjea
ay} Buowe
asn JO}
JU@uNysu! payejsuely
ay} ayeplje
oO} (Z "UOISIOA
aSBUlYy oyu!
cIHO JO
UOISIaA ysj6uq
jeurby0
ay) ayeisuey
OL (,
22002 "ye
yo BUOAA
‘yJeoos UJUOWW-|
‘|eoeJ “s]s1}Uep
UeLUJES OM)
Aq POMIIANY
AUBLLIAS
‘SOHUOPOU]SOs¢e

Table 2.9. OHIP short-form
54
Author Method used Country Note
Slade,
1997c
Controlled regression method.
Stepwise regression
Dependent variable: Total OHIP score
Independent variable: All 49 individual
items.
1) Find item that makes the least
contribution to R-squared and which
is in a dimension that already has
more than two items in the model 2) Delete it and refit the model 3) Goto step 1
Repeat until it ends up with only 14 individual items.
Australia sample Contained low
prevalence items.
Locker and
Allen.2002b
item impact method.
Step 1: in calculating item impact scores
(IMS): iMS=frequency rate X importance rate.
Frequency raie= was obtained by summing
the response codes for subjects responding
‘hardly ever’ to ‘very often’ and dividing this sum by number of subject with those responses. Importance rate = item weight
Step 2: Selection of items: 1) Rank the IMS within the subscales.
2) Select two top score from each subscale.
Canada sample - Only two items were identical
with Slade’s short
form.
Wong et al. 2002a
Controlled regression method. Same as Slade (1997)
Hong Kong
Chinese
- Only 5 items
were identical
with Slade’s
short-form.
~ accounted for
94% of the
variation in the
long form OHIP score.
~- Cronbach's
alpha: 0.86
Test-retest
(Pearson correlation
coefficient): 0.94 - demonstrated
good construct
validity.

55
2.1.4.3) Subjective Oral Health Status Indicators (SOHSD
Purpose:
SOHSI was developed in Canada by Locker and Miller (1994a). The aim was to describe the
functional, social and psychological outcomes of oral disorders and conditions. It was intended
to be used as a descriptive measure in an oral health surveys (Locker, 1997b).
Development Process:
Conceptual framework: The development of this measure was based on the conceptual model
proposed by Locker (1988) amended from the WHO’s International Classification of
Impairments, Disabilities and Handicap (see page 12 for the description of this model).
Item_generation/ Item reduction: This measure was developed in an ac hoc fashion, whereby the
items were derived from a series of studies of older adult populations. In its initial development,
the instrument consisted of an index of chewing ability, derived from the work of Leake (1990),
an oral and facial pain index, an index of other oral symptoms used by Locker and Grushka
(1988) and a psychosocial impact scale partially based on the questions used in the RAND
Health Insurance Experiment (Locker, 1997b). The items were expanded in its final version.
Description:
This instrument consists of eight subscales that measure the impact of oral disease or condition
in three areas identified by the model; functional limitation, pain and discomfort and
psychosocial impacts. Functional limitations are measured by a six-item index of chewing
capacity, and a three-item index of ability to speak clearly. Chewing capacity was measured
based on the ability of the respondents to chew or bite six-indicator foods varying in texture and

56
consistency. Respondents are considered as having limitation in chewing capacity if they are
unable to chew or bite at least one of these foods.
Pain and discomfort were measured by means of a nine-item index of oral and facial
pain symptoms and a ten-item oral symptom index. Respondents were asked to indicate whether
or not they had experienced pain or other oral symptoms in the last four weeks.
Psychosocial impacts were measured by means of a three-item scale of problems with
eating, a four-item scale concerned with communication/social relations, a six-item scale
measuring other limitations of activities of daily living and a two-item scale concerned with the
degree of worry and concern about the health or appearance of the oral cavity. All items referred
to last year. They were scored on a five-point frequency Likert scale with the following
categories: never, sometimes, fairly often, very often and all the time.
Since this instrument constitutes a battery of indices, an overall health status score
cannot be obtained. Thus different scoring methods were employed for each of the subscales as
shown in Table 2.10. It was designed in a way that it can be administered by mail or other self-
completed survey questionnaire.
Table 2.10. Scoring method for SOHSI
e Chewing capacity index } Count number of ‘no’ responses.
e Ability to speak e Oral and facial pain Count number of ‘yes’ responses
e Other oral symptoms
e Eating impact scale 2 methods:
e Communication/social relation scale 1) Count number of ‘all the time’, e Activities of daily living scale ‘very often’, ‘fairly often’, e Worry/concern impact scale ‘sometime’ responses.
2) Sum the response coded.

57
Properties tested:
Reliability in terms of internal consistency and test-retest was evaluated and it was found to be
satisfactory. Concurrent and construct validity assessments were performed. All hypotheses
postulated were confirmed (Locker and Miller, 1994a).
Population/Setting:
Table 2.11 shows a summary of papers published using the SOHSL Initially, it was developed to
be used in older adults in Canada. Subsequent a study by Locker and Miller (1994b) suggested
that this instrument is useful for descriptive oral health surveys of general populations of
Canadians. The performance of this instrument was evaluated in the United Kingdom in an
elderly population aged 60 to 65 years-old and was found to be reliable in terms of internal
consistency and test-retest reliability and demonstrated satisfactory construct and concurrent
validity (Tickle et al, 1997a).
Comments:
One of the advantages of this instrument is that it allows for the exploration of the links between
distinct dimensions of health. Because it is a battery, an overall score cannot be computed;
hence, it cannot relate different outcomes to a common measurement scale.

8S
SWIed pue
jeioUab +0 p
abe
ul UyJBey
j20 sood
sueipeuey
pey payesolajep
OUM Buyjemp
asouy
‘ued Bursneo
~AWUNWWWOS
auljeseq ye
SUON!PUOD Jo
jes0 O1L00ds
uolejndod
e
e@aey 0}
peseodde
ul poliad
1e0A
PeAoJduui OUM
SSOU |] -
-38JU} OU}
‘pouad seeA-901u}
@y} JOAO
PSAOIC UI
J@AO Pes1iINIDO
yeui snes
pey %G’°O]
pue awes
uyeey jelo
8} paurewies
pey pealeoiod
%G'89 ‘payeioejep
(Buyjeip y61p
~}98 UI
2661 pey
Uyeey eso
W98uy AeAins
wopuey) |
sabueyo ey}
“O1AO yor
yeu} peyodai
%G'0Z -
U}TeeH MOIAJO}U]
epeued jeulpnyibu07y
+0S LL9=N
aulwexes O| |
pue Ja@x4907]
"JSOj YOO}
OY} Jo
uoIpuoD ay}
uodn “yyeay
je1o
Bulpusdep eanebou
Jo uoydeaoied
JO aAiisod
oq Aew
ayy
snjejs yyeey
UO Sso|
jo aBueyo
ou}
YjOo} jo
yoRdiui ay
~ 0}
Sajqeiien
"snjeys yjjeay
jeso (Guyjelp
yOip jeoiuyjo
ul eBueYo
paajeosed wopuey)
pajyogjes jo
-}]8S YM
payeloosse sjoelqns
uoHNgijUuoCS
Se|qeueA jearuljo
AjuO Aegains
aye]u9q eu}
9/661
GU} SI
SSO] YIOO|
- uyeeH
MBIAJO}U] epeuen
jeulpny6uo07 +0S
669=N ayewijse
OL "19990"]
“JOAO pue
JA g|
pebe
uoyeindod
ype
ue jo
"SJOPJOSIP snyejs
yey
jeso Aq
pasiwojdiuoo (Buyjdwes
| jeso
peyode
a190M (+91)
sebe {je
Wwopues Ajeanoelqns
qr6sl
jo syjnpe
jo Buleg
jem A@Ains
(yew) jeuoyoes
abejs om)
au} “JOININ
pue yyjeay
[eio SUL
uHesH payejduo0o-}}aS
epeuey -SSOID
+8L €SS=N
aquosep of |
pue
1984907
ISHOS
jo uoIsnjaUueD
uoneojddy | uoljeisiuiupy
uOHeI07} uBisep
Apnis aby
ejdwues uly
souny
ISHOS
Buisn paysiqnd sisded
jo Arewiung
"LL'Z aiqey

6S
"SUOITIPUOD [BJO
JO spaye
feloosoyoAsd ay}
BuluiWeyep
ul SWU9|qOJd
jeuoiouny pue
uyed 0}
eoueLodtul Alepuooes
Jo ae
saouejsuinodio OIWOUODe
-O100S ,S|@NPIAIpU!
- ‘uoyeindod
paaudep
ay} Wo jOedu
sayeos6 Ajueopubis
Jo 9q
0} payode.
SeM ojeosqns
jeloosyoAsd Quo
puke
ejeosqns jeuojyoun)
QUO AjUO
‘JOA@MO} -
YN
*SUOINPUGD Je10
Aq ul
uojejndod
Aem awos
ul peweduil
juenye
Sem 9jij
Jo Ayjenb
pue peaudap
JU} Jey]
peyode. jo
snjeys
juenyye pue
peaudep uyeey
jeso
yoee woud}
SJeNplAIpul (ej\dwes
| aajoelqns
eu}
Jo suojjodoud
ASAins (EIN)
wop6uly jeuoljoes
wopuey) |
eledwoo pue
a/66L
feyueysqns -
UESH
pa}9)dwod-JaS peyiun
~ssolD 9-09
CVE=N | Sinseew
oO] - |
Je je
[SHoIL
“AyIpiea [email protected]
pue yonujsuoo
Asojoejsies payesjsuowadq
-
06°0-08'0 wopBbuly
reudje s,yoequoly
- peyup
ou}
8'0- 70
:eddey Ul
ISHOS §0
66'0-8G'0 ‘}Ua!OLjeoo
(ajdwes |
sauewojed
UONE{AU09 S,UOSIea|
anssl Jeo
(ew) wopBuly
WeUOIOaS wopuey)
ou} 2/66)
‘Jsajer-]S9 | - |
[Hojopouje| peya|dwioo-}aS
powun “SsOlD
9-09 CVSEN
ayenyjeas OL |
“j@
Je jexolL
‘punoibyoeq
pebejueapesip JOU WO.

09
“swojdwAs
yons
jo yoedult
ay} pue
swojdwis
|e10 pessesse-}jas
jo Bunodes
say} Ui
pue|Guz \seo
-UINOS ul
JUSPISes
(a4 M
pue UBSQqHed
xoeI1q ‘ asouiyy
‘uelpul) sdnoi6
ojuyye ino
WO} SJENPIAIpUI
Buowe
swioj}dwAs
yons jo
joedull
ay] pue
swoydwAs
YN ey}
ul sdnoi6
(Buydwes je1o
passesse
oluyje sno}
Guowe
Agains wop6ury
jeuoljoes YJOMION)
“J[9S JO
[OAR] £002
JSIXO SSOUSIOYIC)
- u}eeH
paje|dwi0a-jjas peyun
-SSO1D +GP
99e=N QU}
SUILUIA]EP O] |
‘Je je
UOMEN

61
2.1.4.4) Oral Impacts on Daily Performances (OIDP)
Purpose:
The OIDP was developed in the United Kingdom by Adulyonan and Shieham (1997). The
purpose of this measure was to assess serious oral impacts on a person’s ability to perform daily
activities.
Development Process.
Conceptual framework: This measure was developed based on the WHO model of disease and
its consequences amended by Locker (1988) for use in dentistry. However, a modification was
made by dividing the consequences into three levels (Figure 2.6): Level 1 refers to oral status,
including oral impairments, which are measured by clinical indices. The second level is called
“the intermediate impacts”; these include pain, discomfort, functional limitation and
dissatisfaction with appearance. The third level, “the ultimate impacts”, represent impacts on the
ability to perform daily activities, which consists of physical, psychological and social
performances. According to this model, any of the dimensions on the second level may impact
on the performance ability. The OIDP measures the third level of the consequences of disease.
Item generation: The items were generated from a literature review. Nine items were derived,
which covers the physical, psychological and social performances.

62
Level 1
Level 2 - »| Functional p»| Dissatisfaction with Intermediate impacts limitation P appearance
Level 3 Impacts on daily performance
Ultimate impacts Physical Psychological Social
Figure 2.6. Conceptual model used for the development of OIDP Source: Adulyanon S, Shieham A. Oral impacts on daily performances. In: Slade GD (Ed). Measuring oral
health and quality of life. Chapel Hill: University of North Carolina, Dental Ecology 1997. page 153
Item reduction: Analyses of internal consistency and item-total score correlations were
conducted. Based on these analyses one item was found to be redundant and was then excluded
from the final instrument. The final version of the OIDP contains eight items.
Description:
The OIDP contains eight items with a multilevel question (example shown in Table 2.12).
Respondents are asked to report on experiences over a six-month reference period by recording
the frequency or duration and severity of impact. The score for the frequency is shown in Table
2.13. For severity, the respondents are asked to indicate the level of severity on a Likert scale
from 0 to 5, where 0 indicates no effect and 5 indicates a very severe effect.
The final score for the OIDP is calculated using the formula in 2.3. The OIDP was designed for
administration by interview.

63
Table 2.12. Example of the questions in OIDP.
1) In the past six months, have problems with your mouth, teeth or denture caused you any of difficulty in ....(performance’)....?
0 No (Go to next activity) Yes (Go to 2a)
Performance* a) Eating and enjoying food
b) Speaking and pronouncing clearly c) Cleaning teeth d) Sleeping and relaxing e) Smiling, laughing and showing teeth without embarrassment f) Maintain usual emotional state without being irritable g) Carrying out major work or social role
h) Enjoying contact with people
2a) If yes, how often? ~ Less than once a month (Go to 2b) 2 Once or twice a month
3 Once or twice a week 4 3—4 times a week
5 Every or nearly everyday (5+ times/week) 2b) If less than once a month, around how many days in total?
1 Up to 5 days in total 2 Up to 15 days in total
3 Up to 30 days in total 4 Up to 3 months in total
5 More than 3 months in total
3) Using a scale from 0 to 5, where 0 is no effect and 5 is a very severe effect, which number would you say reflects what the difficulty in ...(9erformance).....nad on your daily life?
Table 2.13. Criteria for frequency score.
Category Score Never affected in past 6 months
Less than once a month, or a spell of up to 5 days in total
Once or twice a month, or a spell of up to 5 days in total
Once or twice a week, or spell of up to 30 days in total 3-4 times a week, or a spell of up to 3 months in total
Every or nearly every day, or a spell of over 3 months in total ObwWN-A
OIDP score = > (Frequency score [x Severity score |) X 100.0... eee eee (2.3) 200
| = performance
# = Maximum possible score.

64
Properties tested:
This instrument was initially tested among a 35-44 year-old adult population in Thailand. Test-
retest reliability, using Kappa, of the items ranged form 0.91 to 1.0. Cronbach‘s alpha was 0.69.
The construct validity and criterion test validity studies showed satisfactory results.
Population/Setting:
Table 2.14 shows a summary of papers published using the OIDP. It was developed in the
United Kingdom and was initially tested in Thailand among middle age adults for the Thai
version. It has also been used to measure the oral health status and to estimate treatment needs
among the elderly population in Thailand (Srisilapanan and Sheiham, 2001a; Srisilapanan and
Sheiham, 2001b). Subsequently, the OIDP was tested in Great Britain (English version) and
Greece (Greek version) among elderly populations (Tsakos et al, 2001a).
Comments:
The OIDP was developed to measure the most serious oral health impacts. This results in a
severe “floor effect”. As such, the use of this measure as an evaluative measure is impossible.
The design of the questionnaire only allows the OIDP to be administered through interviews,
and this will increase the cost of administration. Robinson et al (2001) recommended that one
way of reducing the cost and time is to conduct interviews over the telephone. However,
telephone interviews will not be appropriate in countries where a telephone is not owned by all
the households.

$9
( Buowe
Bujee uo
Buljdwes Jejnoyed
ul pue
*spooj jo
sodA} wopuel |
ot Ajlep
Jo Ayyenb
UOLULWWOD jBJOARS
Jes 26
eu} UO
peYy Adu}
0} Ayyiqe
ouy ‘sejnoned
ys (NW)
S}OBYS OU}
PUE ul
pue ‘ejdoed
Japjo jo
Aue
spedull poyeja.
yl Jo
Ayyenb ay}
sjoaye puadepul
yyeey jeio
Ayuenbe.y Ajsiey
a}doad wop6uly
jeuoloes BulAry
Jo aougjeaaid |
100Z 12
18
Japlo jo
snyejs jeso
ayy | Aesuns
yyeoH MAIAJ8}U|
pe1un -SSOID
+69 |
€G/=N-
au} ssasse
O] WeUleUS
‘aidoad
JapjO sJe]USpP
Jo
‘ajdoed jeu]
Jepjo Jo
Spaeu JUusU}e9l)
sp9au JUSWIeS]
je}Uuep oeujsoid
ssesse
oneujsoid ssesse
0} o]
sayoeoidde
yoeosdde sajpewsou
pue jeyUapoloo0s
pue
jejJuspolsos eB UseMjeq
Ajue (ajdwes
eAanewou
Bursn qLo00z
punoj iam
peau puadepu!
jue pseu
pessesse |
‘weuleyus
jUSW}eeL] peyewise
jeuUOH}oeS Burary
| jweauog)
Ul SSOUSIOLIP
pue ue
Jo saousiayip
oBe7] |
Aeains yyeoH
MOIAJOU] pueyeul
-SSOlD 2-09
67S=N ayessnyioj
| uedeysus
*sleyl
"SJ8AS JOU
Japjo ul
ayy} Apiep
jg UoWWOD
AaAI}e/eJ Aju
(ajdwes 9}
uO sjoRedul
aJsam ajdoed
Japjo pusedapul
jue peyejei
jes0 BLOOZ
Jo op
go Ayyenb
pejooye jeuaijoes
BulAl] |
jUeAUdD) jo
aouajeaaid ‘je
jo ue
yeu} sjoeduu!
je10 | AeAins
yyeeH MA@IAIB}U]
pueyeu |
-Sssoln Z-09
ZOZ=N au}
ssasse oj
| uedelisus
‘uoeindod
jo spsou
jeyuep ajewlse
0} sjuewuebpn!
‘uoyeindod
SAIEWOU
Jesiaaiun AjUO
aseesip jejuep
Bursn jo
Bulwoo}oys MO}
& Ul
Seinjeay
Ou} SESSONS
SI] -
(| peyejes
trey} pue
‘uorye(ndod Buydwes
seoUeWJOLed
SaLI2@O MO|
UL UBAS
wopuels |
Ajfep uo
syoedul
uBiy sem
joedui yyeey
jeuoyoes Jaysnjg)
| eso
yo BouepIOU!
| 9G6)
‘1212
jelo Jo
soUEpIoUl SY L- |
AeAINS UYyeSs}
MBIAJO}U] pueyeuL
-SsOl9 pr-Se
LOS=N einseaw
of} | uouesnpy
uoHensiulupy
uBisop
uoisnjauce5 uojeonddy
dao
uoHeI07
Apnig aby
ejdwes
wy
souny
daio Suisn
peysijqnd sueded
jo Arewwng
‘pL'z eqeL

99
“ule
pue @98015
Ul GUAT
snye}s jeso
yeotuyo Je}Wis
Jo ajdoed
Japjo usemjeq
peou JusWjee}
‘ajdoed ‘Ayapye
panleoied Japjo
ul sjoedtuy
20
jo Buialy
que |
= pue ayy
jo Ayyjenb
uoydaosed ul
souenyu! puedepuj
poayejal-yyeoy
jeunyjno juspuedepuy-
j2JO Ul
SBOUBIOJIP
‘sjuedojyed ysnug
LS9=N jesnyno
QU] UeY}
YeeIH ou}
1908015) |
-SSOJO JUROIUBIS
Jo} sayBiy
sem syoeduui
9080!9 jeudljoes
€G/=N |
sue eeu,
JeuloyM |
= gLOOZw ‘Ie
je10 Jo
gougjeaeid oys-
| Aeauns
yyeeH pue
ulejug -SSOID
+69 iuleyg
suiex9
oj | ja
soyes]
“‘sjuayed ‘saunjuep
ainjuap JBUOHUSAUOS
ajejdwos
ueu} ayy}
Ajlep uo
yoedui jJEUOHUSAUOD
$so| peouaiedxe
pue UJI
uosedwioo
AYNOLWJEP SSB}
U}IAA SLE}!
Ul SAun}USPsOAO
pooy Jo
eBues apm
OvV=N Jejngqipuew
2 jee
pjnoo ‘seinjuap
‘eunjuap | peziigqe}s-jue|duui
HOU} JO
YO}WOO peuo
jeyuep wo}
ay} YIM
peysyes alow
nusAUOD |
uleB yyeey
e sem
OJOM SBINJUSPJBAO
wop6uly jeuoyjoes
€p=N JOY)
JOUJOUM £00z
‘je
juesdul uM
syuened |
Aesains yyesH
MOIALO}U] peyun
-SSOID +9
juejduy ssesse
O| je
sejoyy
(ajdwes wopue.)
pezije UONNPSU]
“uone;ndod
cOc=N
- Ajs@p19
YN OU}

L9
“AUpyeA JONYSUOD
pooh pej}eujsuoweg
0'L 0}
09'0=eddey-
28°0=0U s u
ewleeds-
wuBees
so
JSOJOI-]S9 | seq
jo Ayissanun
L9 Q=U0/}2I}SIUIWUPe ay}
Buipuaye
puc” Ayipyjea
yonujsuos :AyIpyeA
synpe uejuezue |
£002
€9 O=uOHeySIUlUpe
‘yede sAep
Gj, -jse}e.-]se | -
0} dco
"WUOJSY
1S|- AQUS}SISUOD
feUJS}UI- jo
Ayqeaydde
pue
seydye $,yoequolg
AUPGeNOY uonejsues}
ON |
peucyUeW
JON OU}
QUILUEXO OL
nyeseyy
“Aupiien ul
Bulay soyenpeibisod
808019) PUE
poo6 payesjsuowep
oa “pue
solwepeoe Uleyg
Jealgd jo
SUOISIOA UO
YeosD Jo
joued e
Aq eo
spon
69'o=usnua- -Aypen
pessesse pue
uoljeysuey @
J0 salyedoud
LL Q=824-
| JONISUOD
PU UOEPID
‘JUa}UOO ‘soe
:AUIPIIEA, PUeM}eQ-PAeMIO3
ajeawoysAsd 21002
seydje s,yoequolg
AQuUalsISUOd jeUIE} Uj
:AWGetey yesig
oj ys!|Bug
| pauonusw
jON au}
eulMexe Of |
[2 }e
OVeS]
yIomoues{
pessessy eoly
uo}esuel |
uojejdepy
wiy iouny
uoisnjouc9
sebenbue] pue
sainjyjno Jeyjo
0} gqiO
94} JO
UOHe}depe pue
uoHejsuell “GL'z
a1qe 1

68
2.1.5) Measure chosen to be adapted
After extensive review of these four measures, we decided to adapt the Oral Health Impact
Profile (OHIP) since it meets the aim of this project, that is, to develop a generic oral health
related-quality of life measure, which is able to describe OHRQoL and also to discriminate
across groups in the population. OHIP has been used in both health surveys and clinical trials.
The psychometric properties were the most widely tested including responsiveness. Moreover,
the OHIP was developed based on a coherent theoretical framework and the items were selected
from qualitative interviews with the target population. As such, it increases the likelihood that
the OHIP is a measure of oral health-related quality of life rather than oral health status. The
OHIP is the most comprehensive measure currently available that covers a wide range of quality
of life outcomes. In addition, the format of OHIP enables it to be administered both by interview
and self-completed questionnaire.

69
2.2) CROSS-CULTURAL ADAPTATION OF OHRQoL
The demand for developing cross-cultural health-related quality of life measurement is
increasing. This rising demand is due in part to the development of global perspectives on
health and health care (Herdman et al, 1997; Phillips et al, 1994) and the necessity to include
minority groups in clinical research (Guarnaccia, 1996; Cella et al 1996). Since culture has a
significant impact on an individual’s life, the measurement of health cannot be culturally free
(Guarnaccia, 1996). Therefore, instruments that have been developed in one culture cannot be
used in another culture without adaptation. Thus, an appropriate methodology is needed so that
the results will be valid. This section reviews the issues surrounding the process of cross-
cultural adaptation of health status questionnaires.
2.2.1) Culture and health
It has long been recognized that how people lead their life is very much influenced by the
culture to which they belong and the social environment in which they live. Culture is “a set of
values, assumptions, perceptions and conventions, based on a shared history and language,
which enable members of group or community to function together.” (Henley and Schott, 1999).
Thus, culture affects every aspect of life, how we think and behave, and the judgements and
decisions we make. In other words, culture will influence how we look at the world, define and
interpret it (Henley and Schott, 1999; Helman, 1990). However, cultures are not static. They
change in response to new situations and pressures. For example, with the effect of urbanization
in Malaysia, Malaysian society has become more individualistic.
Culture influences how people perceive health and illness and also the ways health
problems are expressed. Within every culture there is a range of norms, values and assumptions
relative to health. Thus, what people in one culture consider as healthy may not be considered

70
healthy in another culture. For example, obesity is viewed as unhealthy in some, predominantly
western cultures, but healthy in others. A cross-cultural comparison study by Buck et al (1999)
on the impact of epilepsy on the quality of life among the European countries found that those
living in Spain and the Netherlands were less likely to experience an impact on their lives and
less likely to report feeling stigmatized due to epilepsy. In fact, they had higher levels of
physical and mental well-being. One of the explanations for this observation is how people view
epilepsy in different countries. Perhaps, epilepsy is viewed less negatively by the public in Spain
and the Netherlands than in some other countries, which in turn means that those who have
epilepsy are less likely to feel “socially different” and hence perceive low levels of impact from
their condition.
The way in which health problems are verbally expressed also differs from culture to
culture, pain expression for instance. In some cultures or families people are brought up not to
make a fuss, to be stoical and to show strength and fortitude and to be “good patient”. In other
families or cultures, people are more vocal and demonstrative. As such, it may be normal for
them to moan and cry out when in pain (Henley and Schott, 1999). Thus, it is wrong to assume
that all cultures conceptualize and express health and quality of life in the same ways.
2.2.2) Approach in HRQoL cross-cultural research.
Cross-cultural adaptation is oriented towards measuring a similar phenomenon in different
cultures. Basically, it is a process of producing an equivalent measurement developed in one
setting/culture to be used in another setting/culture (Beaton, 2000; Guillemin et al, 1993). Thus,
the notion of equivalence becomes an important aspect of the cross-cultural adaptation process.
An extensive review on the matter of equivalence in health-related quality of life cross-cultural
adaptation by Herdman et al (1997) found that there is a considerable amount of confusion

71
surrounding the ways in which equivalency is defined and established. In order to resolve these
confusions, Herdman et al, (1997) adopted a cross-cultural psychology orientation to health-
related quality of life research.
Basically, there are three approaches to the issue of culture and health: absolutism,
universalism and relativism. Absolutism assumes that “culture” has only a minimal impact on
the construct being measured and how it is operationalized. Thus, there will be only small
variations across cultures. Therefore, standard instruments can be used to measure the same
construct in different cultures. However, this can result in what is known as an “imposed etic”
whereby a construct is designed and operationalized in one culture is imposed directly onto
another culture. On the other extreme is relativism, where it is assumed that the role of culture in
behavioural variation is substantial and therefore standard measures across cultures cannot be
used. It requires the development of measures specific to each culture. In between these two
extremes lies the universalist approach. This approach is more open to the suggestion that
culture will have a significant impact on the way concepts are expressed across cultures. It does
not make any prior assumption that the construct will be the same across cultures. As such, it
allows a measure to be adapted. Thus, Herdman et al recommended that researchers adopt such
approach.
2.2.3) The concept of equivalence
There are two related concepts in cross-cultural research: equivalence and bias (van de Vijver
and Leung, 1997). Although they are related, they refer to different aspects of cross-cultural
research: cross-cultural adaptation and cross-cultural comparison (Figure 2.7). Cross-cultural
adaptation is referred to as the process of producing an equivalent instrument for measuring a
similar phenomenon in different cultures. On the other hand, cross-cultural comparison refers

72
to the comparative study of a phenomenon across cultures. Thus, the concept of equivalence is
associated at the cross-cultural adaptation in which scores are obtained in different cultural
groups. Bias indicates the presence of factors that challenge the validity of cross-cultural
comparisons. Hence, cross-cultural adaptation is a prerequisite for cross-cultural comparison.
Since the present study is concerned with the cross-cultural adaptation process, the concept of
equivalence will be the focus of this review.
Cross-cultural research |
WV
Cross-cultural adaptation Cross-cultural comparison
Prerequisite
equivalence Bias
Figure 2.7. Type of cross-cultural research
There are a number of guidelines for the cross-cultural adaptation of health status
questionnaires (Beaton et al, 2000; Herdman et al, 1998; Touw-Otten et al, 1996; Phillips et al,
1994; Flaherty et al, 1988). However, there has been little standardization in terms of the
definitions of different types of equivalence and how they should be tested (Herdman et al,
1998). For example, Table 2.16 indicates types of equivalence and their definitions as specified
by Hui and Triandis (1985), Flaherty et al (1988) and Guillemin et al (1993). Recognizing that
there is a need to develop a standardized framework, Herdman et al (1998) developed a model
known as the “model of equivalence” on which the discussion of the concept of equivalence
will be based. We have chosen Herman’s model as a framework for the present study because

73
this model addresses every aspect of the questionnaire and provides a clear framework on how
to achieve equivalence.
Table 2.16. Different concepts of equivalence
Hui and Triandis, 1985*
1) Functional equivalence: Pertains to whether or not the items ina
translated version of a
scale have a meaning similar to the source version.
2) Operational equivalence: Pertains to the comparability of procedures (e.g self versus interview) used in obtaining the information needed, including comparison of
psychometric
performance. 3) Scale equivalence:
Pertains to the extent to which individuals in different cultural groups respond to similar items
in similar ways. 4) Scalar/Metric equivalence:
Concerns whether or not
a measure orders
individuals along a continuum in a
comparable way across language and cultural groups.
Flaherty et al. 1988
1) Content equivalence: Pertains to whether or not the items of the
instrument are relevant
to the phenomena being studied in each culture.
2) Semantic equivalence: Concerned with whether
the meaning of each item is the same in each culture after translation
into the language and
idiom of each culture.
3) Technical equivalence: Pertains to the method
of obtaining information (e.g self-versus interview).
4) Criterion equivalence: Concerned with the
normative interpretation of the variable between
the two cultures.
5) Conceptual equivalence: Concerned with whether
or not the instrument is
measuring the same
construct in each culture.
Guiliemin et al. 1993
1) Semantic equivalence: Concerned with achieving the same meaning of the words comprising eacn
item. 2) Idiomatic equivalence:
Concerned with finding an equivalent expression of
idioms or colloquial expressions.
3) Experiential equivalence: Concerned with the relevancy of the items to the target culture.
4) Conceptual equivalence: refers to the validity of the concept expiored and the events experienced by
people in the target culture, since items might be equivalent in semantic meaning but not conceptually equivalent.
* cited in Bullinger et al. 1993
This model was developed based on the universalist approach. It includes six types of
equivalence; that is conceptual, item, semantic, operational, measurement and functional
equivalence. Herdman et al (1998) believe that this model provides a sufficiently complete

74
framework for the examination and achievement of equivalence. The definitions of each type of
equivalence are shown in Table 2.17 and each of them will be discussed in turn.
Tabie 2.17. Definition of equivalence (Herdman et ai, 1998)
Type of Definition equivalence
Conceptual Ways in which different populations conceptualize health and quality of life (QoL) and the values they place on different domains of health and QoL.
item Concerns the way in which domains are sampled. Item equivalence exists
when items estimate the same parameters on the latent trait being measured and when they are equally relevant and acceptable in both cultures.
Semantic Concerned with the transfer of meaning across languages.
Operational Refers to the possibility of using a similar questionnaire format, instructions, mode of administration, and measurement method (response
format).
Measurement Ensuring that different language versions of the same instrument achieve acceptable levels in terms of their psychometric properties — reliability, responsiveness, and validity.
Functional The extent to which an instrument does what it is supposed to do equally well in two or more cultures.
Conceptual equivalence:
According to the Herdman et al (1998) model, the most important aspect of equivalence is
conceptual equivalence. Conceptual equivalence refers to ways in which different populations
conceptualize health and quality of life (QoL) and the values that they place on different
domains of health and QoL. Because no prior assumption is made on how people from different
cultures conceptualize health and quality of life, this must be established before one could think
of adapting the instrument. If conceptual equivalence is not established, the result would be
biased. For example, Aracena et al, (1994) conducted focus group to determine if the meaning

75
of child abuse was similar between the American and the Spanish population. She found that
behaviors, which would be considered abusive in North America, were seen as part of the
continuum of normal child rearing practices in Chile. Although the child abuse scale can be
translated from a linguistic point of view, the results would be biased.
Item equivalence:
Item equivalence concerns the way in which domains are sampled. It exists when items
estimate the same parameters on the latent trait being measured and when they are equally
relevant and acceptable in both cultures. Frequently, these items were selected based on the
source culture and may not be relevant to the target culture. Therefore, the relevancy of each
item in the instrument needs to be examined to ensure that it is “culturally appropriate” and
“culturally sensitive” to the target population. “Culturally appropriate” means that the items
have to be relevant in the target culture. If the behavior is not practiced in the population or it
has become a norm to the target culture, the items could be considered as not relevant to the
target culture. For example, Hunt et al (1986) in their work in adapting the Nottingham Health
Profile (NHP) to be used in Egypt found that the item “I find it hard to stand for long” was
inappropriate since most tasks are carried out sitting on the ground and very little actual
standing is done in the rural Arabic world. ‘Cultural sensitivity” is concerned with items that
may be offensive or taboo to the members of the target culture. For example, Hunt et al (1986)
observed that words relating to what are perceived as “intimate issues” caused offence to the
people of middle-eastern cultures.

76
Semantic equivalence:
Semantic equivalence is concerned with the transfer of meaning across languages. This means
that the words from the target language have to be denotatively and connotatively the same as
with the source language. Therefore, items should not be translated literally; rather they should
be translated in a dynamic way so that the conceptual meaning of items is retained. In addition,
one has to ensure that the level of language used is appropriate to the language skills of the
target population. Wong et al (2002b), in the process of adapting the GOHAI to the Chinese
elderly population in Hong Kong, found that several items could not be translated directly due
to a lack of understanding among the elderly population. For example, the question “How often
did you limit contacts with people because of the condition of your teeth or dentures?” The
meaning of “limit contacts with people” was not understood by the elderly. In such cases there
was a need to modify the item without losing its general meaning.
Operational equivalence:
Operational equivalence refers to the possibility of using a similar questionnaire format,
instructions, mode of administration and response format in the target culture. How a
questionnaire is operationalized can affect the results obtained. For example, a study by Gilmer
et al (1995), which compared the functional characteristics of older adults, using the Iowa Self-
Assessment Inventory (SAD, of White rural elderly and elderly rural African Americans from
South Carolina and Louisiana, found that there was a significant difference between South
Carolina and Louisiana, which was not expected. This prompted the authors to investigate
further and found that there was a high illiteracy rate among the Louisiana sample, so that
many of the inventories were being read to the elderly rather than self-administered or sent by
mail, as was the case with the rural South Carolina sample (Gilmer et al, 1995). Slade et al

77
(1992) found that the OHIP score was lower when it was administered by interview compared
to a mail questionnaire. These examples illustrate that without uniformity in data collection
procedures, the validity of the data comparisons can be suspect.
Another important aspect, which many researchers ignore, is the suitability of the
response format used. For example, French et al (1998) found that younger children in
Australia had difficulty in using the response options of the Childhood Asthma Questionnaire
that had been developed in the United Kingdom. They concluded that the UK children were
more cognitively advanced than Australia children of the same age and may even be more
advanced in their reading skills since they had earlier formal education than the Australian
children. This demonstrates that the suitability of the response options cannot be assumed but
must be established.
Measurement equivalence:
Measurement equivalence aims to ensure that different language versions of the same
instrument achieve acceptable levels in terms of their psychometric properties — reliability,
responsiveness, and validity. Many researchers agreed that once the instrument has been
adapted, there is little assurance that the psychometric properties of the instrument remain
constant (Badia et al, 2000; Atchison et al, 1998; Streiner and Norman, 1995, Flaherty, 1988).
Therefore, the psychometric properties of the adapted instrument need to be re-evaluated using
data collected from members of the target culture.
Functional equivalence:
Functional equivalence is concerned with the extent to which an instrument does what it is
supposed to do equally well in two or more cultures. Since the Herdman et al (1998) model was

78
based on the universalist approach, this depends on two fundamental issues. Firstly, how health
and quality of life are defined and conceptualized in the target culture. Secondly, how
successful the adapted instrument is in measuring the trait which it is supposed to measure.
Therefore, according to this model, an instrument has achieved functional equivalence when all
other types of equivalence, which deal with these two fundamental questions, have been
achieved.
2.2.4) Technical process in cross-cultural adaptation.
The cross-cultural adaptation of an existing instrument involves two processes: translation and
cultural adaptation. Translation is a process of transferring individual words or sentences from
one language to another language, while cultural adaptation is a process of ensuring that the
measure is appropriate to the cultural context and lifestyle of the target population. However, in
some instances, cultural adaptation is needed even when the language remains the same,
because the culture or life experiences of populations speaking a given language can differ
(Geisinger, 1994; Guillemin et al, 1993). Both processes will be discussed in the following
section.
2.2.4.1) Translation:
To date, all of OHRQoL measures were developed in English speaking countries and in the
English language. Hence, in most instances, these measures need to be translated to other
languages. However, the translation of a HRQoL questionnaire is not a straightforward task.
Thus, several techniques have been developed over the years to ensure the quality of the
translation. Three methods are commonly used in translating existing HRQoL instruments: One-
way translation, translation by committee and forward and backward translations (a summary of

79
each method is shown in Table 2.18). Since the forward-backward translation technique is the
preferred method and strongly recommended (Kim and Lim, 1999), a detailed description of this
method will be described here.
Forward-Backward translation is an iterative process and it requires a minimum of two
bilingual independent translators. It is recommended that the translators should be linguistically
competent and they must be fully conversant with both languages as well as familiar with both
cultures (Carlson, 2000; Leplége and Verdier, 1995; Geisinger, 1994). It is also suggested that
the translators translate into their mother tongue (Beaton et al, 2000; Guillemin et al, 1993). The
forward-backward translation method involves four steps (Behling and Law, 2000):
1) A bilingual individual translates the source language instrument into the target
language.
2) A second bilingual individual translates this target language version into the original
language.
3) The original and back-translated versions are compared.
4) If there are substantial discrepancies between the two versions, then another target
language draft is prepared and modified to resolve the discrepancies.
This process continues until the two versions are identical or contain only minor differences.
The ability to compare the back-translated version to the original source language
version of the questionnaire is a major contributor in providing the researchers with an
objective indication of the semantic equivalence of the target version and pinpoints the nature
of specific problems with it (Behling and Law, 2000; Sechrest et al, 1972). For example when a
statement in English such as “I get tense before an examination.” was translated into Urdu and
back translated into English, it came out as “I get excited before an examination” (Sechrest et
al, 1972). This raised a question whether the words “tense” and “excited” are in fact the same.

80
Thus, this gave the researcher an indication that this translation needed some further
translation.
One of the drawbacks of this method, as identified by Geisinger (1994), is that when
translators knew that their work was going to be subjected to back translation, they would use
wording that ensured that a second translation would reproduce the original version rather than
a translation using optimal wording in the target language. However, Geisinger acknowledged
that:
“If used as an iterative procedure in the sequential process of translation, test
review and test retranslation, the method may indeed help guarantee similarity of meaning across languages.”
Leplége and Verdier, (1995) recommended three steps in order to obtain a high quality
forward translation. Firstly, the face validity of the translated questionnaire should always be
checked by a layperson because the bilingual translators tend to have higher educational status
than the average respondent and could potentially produce wording unsuited to the general
public. Secondly, the translators should be fully briefed on what they need to do. Finally, they
recommended that the translators should be fully involved in the task by asking them to
comment on their own translations; for example, to identify any difficulties encountered or how
satisfied they were with their translation.
According to Herdman (1998), there are three possibilities of the translation: 1) easy, 2)
difficult and 3) impossible to translate. The problematic items need to be given special attention
when the instrument is assessed by a sample of the target population. It may be also possible to
replace items, which have proven to be impossible to translate.

[8
Bulwuinsuos atu
"$10}}SuUed} OM]
JO asn
— ANsoD
‘UOISJAA [EUIBLIO
au} soNnpoida
pinom yeu}
Guipsom esn
pjnopy
“Bulyjos eayIWUW09
Ul JOUJOUL
QUO BZIOUS
O} yuRysey
aq Aew
10 spunos6yoeq
JOU] Ul
SAIPIE|!LUIS OF
ONP MAIAP|JOM
UOLWLUOD B aJeUs
Aeu Siaquaw seyww0y
"JUDLUNSUL Meu
By} Jo
ALIpIeA
pue Ajiqeljas
Mo} Ul
s}iNnsey ‘peulBo
au} jo
BujueaW aAlye}OUUOD
UB] JOYE
SAIJE}OUSP Su}
0} Spuodsa09
yeu} UO}e|sued}
e ui
synseu Ayensn
enbiuyos} siq yp
sebeyueapesiq/suoyeywry
"JUSLUNISU! OU}
JO JUdLUdO|eAep
OU} Ul
ajo Jofew
e Aejd
oO} sieyoleesa
jenBuljouow swe,
‘ssed AjIpee
JOU |[IM
SWI2} yuajeainba-uou
Aqajeym Jaq}
2 Se
soyesodo ‘aquaYy
PUB SUOISIOA
OM} 9}
UBAaMjaq UOSIEdLOD
SsMOTY
“uole|suel -yoeq
uey} Buiwinsuod
ou}
sse7q
ealsuedxaul pue
ajdwis
sobejueapy
"SOOUSIOIIP Joulw
ule}Uuod AjUO
JO jeoQUEp!
ae SUOISIOA
OM} AU}
[JUN SeNUUOD
ssedold SIU]
"sajouedasosip OU}
SJEUILUI[a O] SUOHeapou
Bululeyu0S pasedaid
sj yeip
aBenbue] ye6e}
JOYOUS U8]
‘SUOISJ9A OM]
BY} UBemjag
sslouedaJosip jeyueysqns
ae
alieau} |
(p “‘paredwioo
ase SUOISJOA
pejyejsuel-yoeq pue
jeulsuo oy,
(¢ ‘abenbue]
jeul6i0 ayy
oyu! uoIsJoA
aBenBug| jabie}
siuj seyejsuey
lenplaipu fenBurjiq
puosas y
(Z ‘abenBue|
je6ue} 9U}
OJU! JUSLUNI}sUI
OBenBue] soinos
dy} Saye[suey
jenpiaipul jenBuijig
V7 (1
:Sda]s INOL
S@AJOAU! YdIUM
SSB00id SAesa}]
UB Si]
“Suo}ejsuey juapusdepul
om} Jo
WNuUiW
e Seuinbay
‘UOHJE;SUBI] OY}
UO YOOUS
oO} SJuedxe
jo jaued
e Aq
majadl juspusdepuy
=e
‘UOdI}eIOqe|]O9 Ul
Jo Ajayesedes
Joupe Bupom
‘eyesue.) 0}
sjenplAlpul yenBurjiq
aso
JO Om)
SouInbayy =e
‘aBenbury| jaGse}
OU} OJU!
UOISISA [eUIBLIO
OU} 9}e|SUBJ]
0} yenplaipul
yen6uyig e
Buryse Ajuo
speyusy
SS390/d
uoHe|suew)-piemyoeg pue
puemio4
O}}!LULUOD Aq
uonejsues |
uoHejsuel AeM-euCO
poujoy sebejueapesip
pue sebejyueape
s}i pue
uoie|sues) Jo
poujopy *91'Z
eIGeL

82
2.2.4.2) Cultural adaptation:
It is recognized that if measures are to be used across cultures, their content must not only be
translated well linguistically, but also they must be adapted to the cultural context and lifestyle
of each culture. Therefore the ultimate aim is to achieve equivalency as discussed in the
previous section. Since the cultural equivalence of HRQoL measure cannot be assumed but must
be assessed, Herdman et al (1998) recommended a method of assessing each type of
equivalence as summarized in Table 2.19.
Table 2.19. Method of assessing equivalence
Type of equivalence Method of assessment
Conceptual e Locai Literature
e Consultation with expert interview the target population
item e Review literature
e Expert judgments
e Interview with target population
Semantic e Forward-backward translation
Check by lay panel
Operational e Pretest the questionnaire
Measurement e Reliability test e Validity test
e Test of responsiveness
® Factor analysis
Functional e Examine other equivalence
Methods for establishing conceptual equivalence. There are three ways to establish conceptual
equivalence as suggested by Herdman et al (1998): 1) Review of local literature, 2)
Consultations with experts, and 3) Interviews with members of the target population. The first
resort is to review related or similar literatures that have been conducted on the target

83
population, such as topics related to perceptions of health, well-being, illness and disease or
perhaps topics related to emotion. This may provide an initial overview of convergent or
divergent with the conceptual structure of existing instruments. Secondly, it is possible to
consult experts in the target culture. Herdman recommended that the experts consulted should
be broad, including for example anthropologists, medical sociologists, linguists, as well as
health professionals.
The third approach recommended is to involve the target population themselves, through
various techniques such as focus group discussion, participant observation or open-ended
unstructured interviews. The advantage of this approach is that the concepts can be gleaned
from the target population perspective, thus increasing the likelihood that their views are
captured. In most instances, the assessment of conceptual equivalence needs to apply all three
approaches.
The investigations of conceptual equivalence have four possible outcomes (Herdman et
al.,1998): 1) the domains in the original instrument are equally relevant and important to the
construct being measured in the target culture and the emphasis placed on different domains is
also appropriate in both cultures, 2) the domains in the original instrument are equally relevant
to the construct being measured in the target culture but the emphasis placed on the domains
varies between the two cultures, 3) some of the domains in the original instrument are not
relevant to the concept being measured in the target culture or domains which are relevant to the
target culture are not included in the original instrument and 4) the domains are totally different
to the construct being measured between the two cultures. In the case of outcome (2) it may be
possible to weight the domains in order to reflect their differing importance in the target culture.
For outcome (3), it might be possible to use the same domain but it only allows a partial
comparison of the construct across cultures. Adaptation cannot be done for the outcome (4). In

84
this case, perhaps adaptation of another instrument should be considered or a culture-specific
questionnaire should be developed.
Methods of assessing item equivalence. The assessment of item equivalence involves examining
the relevancy of the items to the target population and this can be done in different ways. Firstly,
one can review available documents on lifestyle patterns and habits, which can suggest that
certain items would be irrelevant. For example, the item “Do household chores (e.g., taking out
trash ect)” in the Childhood Health Assessment Questionnaire, the example given “take out
trash”, was not relevant in Argentina because trash is removed late each night by adults
(Moroldo et al, 1998). In the case where literature on the target culture is scant, consultations
with experts can be conducted to elicit their “expert judgments’ regarding the potential
relevance of items. However, in many instances, the most appropriate source of information is
members of the target population, who can be assessed through different methods.
There are four possible outcomes of investigating item equivalence (Herdman et al,
1998): 1) Items can be used in target population without modification (other than translation), 2)
items require minor modification, but may be used more or less in their original form, 3)
Replacement items must be used, 4) Neither existing nor replacement items can be used because
they deal with subjects which are considered offensive or taboo.
In the case of outcome (3), the substitution of the item will be largely based on the
researcher’s judgment. Replacement items can be derived from literature reviews, expert
opinions and most importantly from the target population themselves. In the case of the outcome
(4) it may be possible to omit the items.

85
Methods of achieving semantic equivalence. The possible methods of achieving semantic
equivalence have been discussed earlier in this section (see Translation, page 77).
Methods of investigating operational equivalence. The most common method used to
investigate operational equivalence is to test the instrument on a sample of the target population.
Other sources of information, such as statistics on literacy rates, can provide a good indication
of the possibility of successfully using written questionnaires.
There are three possible outcomes of assessing operational equivalence: 1) The same
methods of data collection can be used, 2) Some aspects of operationalization need to change
and 3) it is impossible to achieve operational equivalence.
Methods of establishing measurement equivalence. The psychometric properties of the adapted
instrument need to be established. These include reliability, validity, and responsiveness using
the methods described in a previous section (see the properties of HRQoL, page 25).
It is desirable to achieve very similar or equivalent results in some of these areas, notably
in terms of reliability, however in other cases it might be unrealistic to expect similar results.
For example, effect size and item weights.
Methods of establishing functional equivalence. According Herdman et al (1998), the functional
equivalence can be established by assessing the degree to which each type of equivalence
included in the model has been achieved.
CHAPTER 3
AIM AND OBJECTIVE
GOAL:
The main goal of this study was to develop an Oral Health-Related Quality of Life measure for
the Malaysian adult population (those who aged 18 and above) through the cross-cultural
adaptation of the Oral Health Impact Profile (Appendix A). In order to achieve these goals, a
two-phase study was designed. The aim and objectives for each phase are stated below.
PHASE 1:INSTRUMENT DEVELOPMENT AND ADAPTATION
AIM:
The aim of this phase was to translate the OHIP questionnaire into the Malay language and to
assess conceptual and item equivalence.
Objectives:
1. To translate the OHIP questionnaire into the Malay language.
2. To examine how two populations, Australia and Malaysia, conceptualize health and
quality of life in terms of how oral diseases/disorders affect individual daily life.
3. To examine whether items in the original questionnaire were relevant to the people in
Malaysia.
86

87
PHASE 2: EVALUATION OF THE INSTRUMENT
AIM
The aim of this phase was to establish the operational (format, instruction, response format, and
mode of administration), measurement and functional equivalence of the adapted instrument
[OHIP(M)].
Objectives:
1. To assess the comprehensibility and clarity of the OHIP(M), including format and
instructions.
2. To test the response format.
3. To assess two modes of administration (mail and interviews)
4. To examine the reliability of the OHIP(M).
5. To examine the validity of the OHIP(M).
6. To compare the psychometric properties of the OHIP(M) with the original questionnaire.
In addition to the above mentioned, this study also aimed:
1) To compare two methods of developing short forms of the OHIP(M).
2) To provide preliminary data on the impact of oral conditions on the quality of life of the
adult population in Malaysia.
3) To compare the impact of oral conditions on the quality of life between Malaysian and
Canadian population aged 50 and above.

CHAPTER 4
METHODOLOGY
This chapter outlines the methodology used in this study. This study was divided into two
phases and each phase was divided into stages in order to achieve the goal of the study (Table
4.1). The aim was stated and the method was described for each stage.
Table 4.1. Phase and stage of the study.
Sample Sample
size
Phase 1: /nstrument development and adaptation.
Stage 1- Translation and back-iranslation process
Stage 2- Qualitative interviews Purposive 36
Phase 2: Evaluation of the technical properties of the
instrument.
Stage 1: Pre-testing. Convenience 20
Stage 2: Testing of Response options. Convenience 171
Stage 3: Field testing. Random 426
4.1) PHASE 1: INSTRUMENT DEVELOPMENT AND ADAPTATION
This phase was divided into two stages (Table 4.1).
4.1.1) Stage 1: Translation and back-translation.
The aim of this stage was to produce a Malay version of the questionnaire, using the forward-
backward translation technique to establish semantic equivalence (Behling and Law, 2000;
Del Greco, 1987).
88
89
Translators:
The process of translation, for this study, involved six translators. Three translators were
involved in forward translation (Forward translators) and another three were involved in the
back translation (back translators). All translators were bilingual.
All three forward translators were Malay and Malay language was their mother tongue.
Two of them were lecturers in the Faculty of Languages and Linguistics, University Malaya
and both of them have a background in Malay studies. They were considered as the Malay
language expert. The third translator was a primary school teacher, where English was her
teaching subject.
Ideally, it is recommended that the translators translate into their mother tongue (Beaton
et al, 2000; Guillemin et al, 1993). However, it was not possible in this study to find someone
bilingual, with English as his/her mother tongue. Therefore, it was decided to appoint “English
expert” as back-translators. Of the three backward translators, two of them were considered as
English experts, since they were English lecturer at the Department of English Language,
University Malaya, and one was a primary English schoolteacher.
Process of translation:
Forward translation: The forward translators (FT) translated the original instrument, which is
in English, into the Malay language, the national language of Malaysia. Prior to the translation
process, the translators were briefed by the investigator on the aims of the instrument and the
population on which it would be used. This was to ensure that the words used were appropriate
to the target population (Herdman et al, 1998). The translators were also informed that the
focus of the translation was to retain the meaning of the items (semantic equivalence) rather
than a word-by-word translation. Therefore they were expected not to translate items literally.

90
They were also asked to note any items, which were not easy or impossible to translate. The
investigator combined all three translations, together with the original questionnaire (OQ) in
one table to facilitate comparison (Table 4.2). To avoid revealing the identity of the translators,
symbols (T1, T2, T3) were used instead of their names. The combined translation was given to
each of the FT before a reconciliation session was held. At the reconciliation session, all three
FT together with the investigator decided on the single Malay version (MQ).
Table 4.2. Example of combined file
Original T1 T2 T3 Solution
Q1) Have you Adakah anda Pernahkah anda | Pernahkah anda had difficulty mengalami mengalami mengalami chewing any masalah ketika kesukaran kesukaran untuk foods because of | mengunyah mengunyah mengunyah problems with makanan sebarang sebarang your teeth, disebabkan makanan makanan
mouth or masalah gigi, disebabkan disebabkan oleh dentures? mulut atau gigi masalah gigi, masalah
palsu? mulut atau gigi berkaitan paisu anda? dengan gigi,
mulut atau gigi paisu anda
Backward translation: Once a single forward translation was achieved, the backward
translators (BT) then back translated this Malay version into English. The original version was
not given to the back-translators to avoid bias in their back translation. The same process as in
the forward translation was carried out but this time was to come out with a single back
translated English version (BTQ).
Committee review: The MQ, BTQ and the OQ were compiled in a single table and brought to
committee meeting to ensure that the translations were satisfactory. A committee comprised of
the investigator and the six translators, reviewed the translation version in terms of:
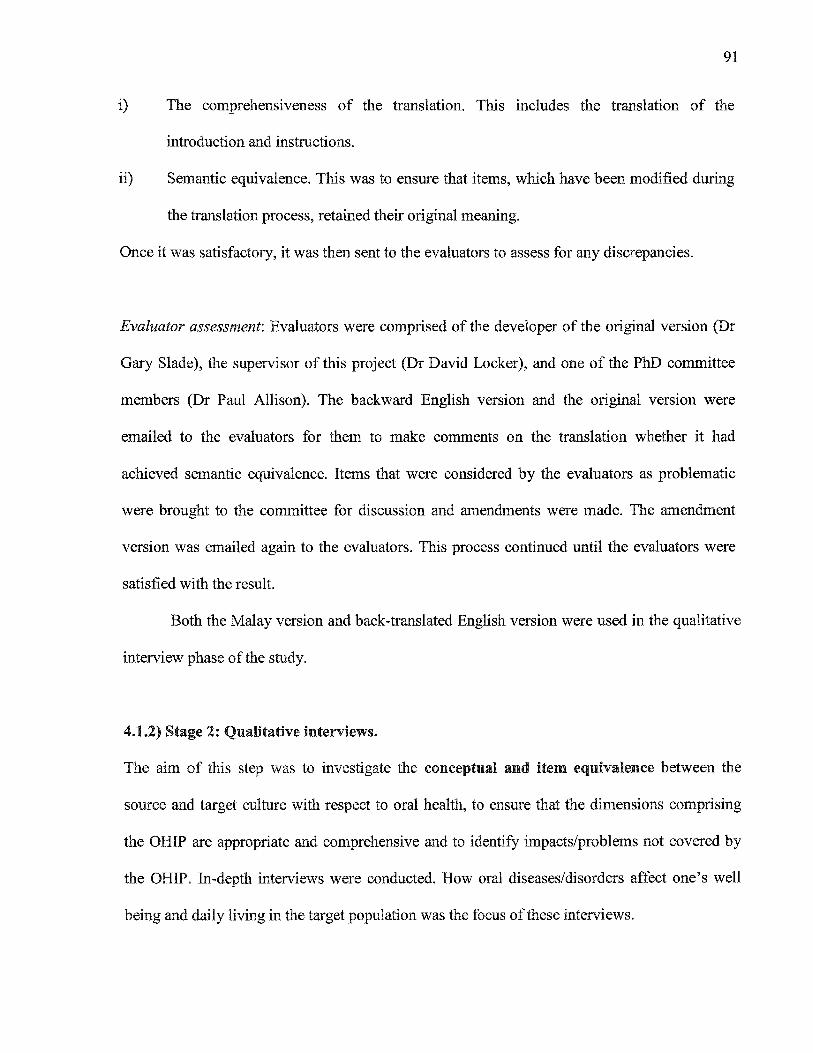
91
1) The comprehensiveness of the translation. This includes the translation of the
introduction and instructions.
ii) Semantic equivalence. This was to ensure that items, which have been modified during
the translation process, retained their original meaning.
Once it was satisfactory, it was then sent to the evaluators to assess for any discrepancies.
Evaluator assessment: Evaluators were comprised of the developer of the original version (Dr
Gary Slade), the supervisor of this project (Dr David Locker), and one of the PhD committee
members (Dr Paul Allison). The backward English version and the original version were
emailed to the evaluators for them to make comments on the translation whether it had
achieved semantic equivalence. Items that were considered by the evaluators as problematic
were brought to the committee for discussion and amendments were made. The amendment
version was emailed again to the evaluators. This process continued until the evaluators were
satisfied with the result.
Both the Malay version and back-translated English version were used in the qualitative
interview phase of the study.
4.1.2) Stage 2: Qualitative interviews.
The aim of this step was to investigate the conceptual and item equivalence between the
source and target culture with respect to oral health, to ensure that the dimensions comprising
the OHIP are appropriate and comprehensive and to identify impacts/problems not covered by
the OHIP. In-depth interviews were conducted. How oral diseases/disorders affect one’s well
being and daily living in the target population was the focus of these interviews.

92
Respondents:
A convenience sample of the target population was drawn from patients attending clinics at the
Faculty of Dentistry, University of Malaya. The reason for selecting a convenience sample
rather than a random sample is because of the likely range of oral diseases with consequent
social impact (Slade and Spencer, 1994a). Patients were recruited from three departments,
namely Prosthetic, Orthodontics, and Primary Care. The purpose of recruiting patients from
different departments was to ensure that patients with a variety of oral conditions/disorders
were obtained. Patients were equally distributed in terms of ethnicity (Malay, Chinese, Indian)
and age group (Young adult, Middle adult, Old adult). These groups were known as the
“natient group”. Patients were added until the investigator was satisfied that the data were
complete and interviews were no longer eliciting additional information regarding perceptions
of oral health in the Malaysian culture. A total of 36 patients were interviewed.
Procedure:
Face to face interviews were conducted. The interview was conducted in Malay language or
English depending upon the language preference of the individual. The trained assistant (Dental
Surgery Assistance, Ms Pauline) approached the patient and briefly explained about the study.
Once the patient agreed to participate, he or she was brought to the interview room.
Each patient then was given a written statement of the aims and objectives of the study
and the nature of their participation. This information sheet was printed on the Faculty of
Dentistry, University of Malaya letterhead and was available in two languages, Malay and
English (Appendix B). Once patients understood the nature of their participation, a written
consent was obtained from the patient using the consent form (Appendix C). The consent form
was also printed on Faculty of Dentistry, University of Malaya letterhead and also available in

93
Malay and English. Each patient was informed that refusal to participate would not affect his or
her eligibility for services provided by the Faculty of Dentistry. They were told that they could
refuse to answer any questions they were asked and that they could withdraw at any time during
the course of the interview if they so wished. Patients were also informed that they could request
that the tape recorder not be used to record their responses at any time during the course of the
interview.
The first part of the interview was conducted to assess whether or not Malaysians
conceptualized oral health in a similar way as Australians. The interview was semi-structured.
That is, it consisted of open-ended questions and probes designed to elicit as much detail as
possible from the respondent concerning their perceptions of oral health (guideline of the
interview as shown in Appendix D). Patients were asked to describe why they had come to the
Faculty of Dentistry and the nature of the problem or problems that they wished to have treated.
The focus of the interview was on the ways in which their oral problems impact on daily life and
psychosocial well-being. Following the responses to these questions, they were asked about
areas of daily living that they had not mentioned spontaneously. Probes were again used to elicit
as much information as possible. The interview was ended by asking for demographic
information. The interview was tape recorded for the purpose of retrieving information.
After this component of the interview was completed the appropriate language version of
the OHIP was shown to each patient. Each statement was read to the patient, and the patient was
asked to comment on the relevance of the statement (i.e. does the problem it describes apply to
them) and whether or not the statement is clear or unclear in terms of its meaning. Patients’
comments concerning relevance and clarity were recorded. After the statements from each
OHIP domain were discussed, the individual was asked to describe any problems they may have
experienced not covered by the items in that domain. This information was also recorded.

94
Analysis:
Each of the interviews was transcribed exactly directly into a computer using Microsoft word
processor. The transcription was then checked against the tape for accuracy. The spelling was
also checked. Once the accuracy of the transcription was ensured, the coding and sorting process
began, using The Ethnograph version 5 software. Words or phrases that describe the functional
and psychosocial impacts of oral disorders were identified and a code was inserted into the text.
The codes were assigned according to the domains from the original questionnaire, as shown in
Table 4.3. The data were then sorted according to the domains. If additional domains were
identified, these would be given codes.
Table 4.3. Codes for Oral Health Impact Profile domains
Domain Code
Functional limitation FL1
Physical pain P1
Psychological discomfort P2
Physical disability D1
Psychological disability D2
Social disability D3
Handicap H1
Committee review:
Revision of the content of the questionnaire based on a list of impacts/problems obtained from
the qualitative interview and patients’ comments concerning the relevance and clarity of the
items was carried out. The committee that developed the translated versions of the questionnaire
reviewed these revisions. Discussion on the appropriate response format was given emphasis,
since the response format used in the original OHIP, which is the Likert scale with 5 points, may
encounter some difficulty when used with a Malaysian population, since Malaysians are modest

95
in giving their opinion. The time reference for the response scale was discussed. At this stage,
the committee worked only with the Malay version. This version was used in the second phase
of the research.
Questionnaire formatting:
Two sets of questionnaires were formed: Long (Appendix E) and short (Appendix F) versions.
The main reason for developing a short form was to provide an alternative, cheaper and less
time consuming way of collecting information related to oral health related quality of life. The
short version was created based on the items most frequently reported by the patients who were
interviewed at the qualitative interview stage. The two most commonly reported items from
each of the subscales were chosen to form the short version. The short version has 14 items.

96
4.2) PHASE 2: EVALUATION OF THE INSTRUMENT
This phase was divided into three stages (Table 4.1).
4.2.1) Stage 1: Pre-testing.
The aim of this stage was to check the wording, clarity, as well as comprehensibility of the
adapted questionnaire since it had undergone some modification (new items were added and
some items were modified). This phase was also used to check whether respondents were
interpreting the meaning of each item in an appropriate manner.
Subject:
A convenience sample of 20 respondents was selected from the patients attending clinics at the
Faculty of Dentistry, University of Malaya.
Procedure:
The investigator approached the patients while they were in the waiting area of the clinics. After
obtaining verbal agreement to participate, each patient was given a copy of the translated Malay
OHIP version to complete. After the patient had completed the questionnaire, he/she was asked
to comment on the questionnaire as a whole (Table 4.4). Then random questions were selected
and the interviewer probed by asking the patient a question: “What do you think is meant by this
question?’’, Patients were encouraged to elucidate their understanding of the items in an open-
ended manner. Patients’ comments were recorded verbatim.

97
Table 4.4, Questions asked to assess the questionnaire
Area tested Question asked
Format and instruction of the questionnaire:- | Did you have any difficulty to complete the questionnaire?
Were the instructions easy to follow?
Wording of questions:- Were there any questions that you found difficult to understand?
Time to complete:- How long did the questionnaire take to complete?
Analysis:
Data from the questionnaires were analyzed and any necessary changes to the wording of
items, instructions or response formats were carried out. The questionnaire would be re-tested
on a group of ten patients recruited from the same clinics if substantial changes were made to
the content or wording of the items comprising the questionnaire.
4.2.2) Stage 2: Testing of Response options.
The aim of this stage was to test whether the response format of the questionnaire is appropriate
for a Malaysian population. The response format is a five-point Likert frequency scale, with the
options ‘very often’, ‘fairly often’, ‘occasionally’, ‘hardly ever’ and ‘never’.
Subject:
A convenience sample of 200 patients attending dental clinics at the Faculty of Dentistry,
University Malaya and Bangsa dental clinic was selected. Patients were chosen to be the
participants at this stage because it was expected that they would be more likely to respond to
the more extreme options.

98
Procedure:
To test the response options, the short version of the questionnaire was used. Patients were
asked to complete the questionnaire (self-completed). The reason for using a short version rather
than long version is because the short version consists of the most common items reported,
therefore it was expected that the respondents would be more likely to use the full range of
options.
Analysis:
Questionnaire data were used to determine if the respondents used the full range of response
options by plotting the frequency distribution for each item.
4.2.3) Stage 3: Field Testing.
At this stage, the mode of administration, mail verses interview, was assessed and the
measurement properties, in terms of reliability and validity, were evaluated. The latter
determined whether the Malay language version of the OHIP had acceptable psychometric
properties. The results were then compared with similar assessments undertaken in Australia
and Canada in order to assess the measurement equivalence of the OHIP(M).
Study design:
A cross-sectional study design was used in this study, since the intention was to develop a
descriptive and discriminative measure, that is, measure that can be used to describe the impact
of oral conditions on the quality of life and are able to identify groups or individuals that are
most affected by their oral health at one point in time.

99
Subject:
Since a population-based sample was required, participants for this phase were a sub-sample of
the Malaysian National Oral Health Survey of Adults (NOHSA 2000). Permission to use the
NOHSA’s sub-sample and access to the database was obtained from the Dental Director,
Ministry of Health Malaysia. In the NOHSA, an adult was defined as those aged 15 and above.
However, for this study, only respondents aged 18 and above were included. The sample in the
NOHSA study was based on a subsample of Enumeration Blocks (EB) and Living Quarters
(LQ) from the fourth Quarter Labour Force Survey 1998. The country is divided into states and
each state was divided into urban and rural strata. A two-stage stratified random sampling was
used. The first stage involved a random selection of EBs from urban and rural strata within
each Malaysian state. The second stage was the selection of LQs randomly within these EBs.
All subjects age 15 years and above in all households in the selected LQs were interviewed and
clinically examined. The response rate was 66%.
For this study, the Selangor state was chosen as the sampling area. Selangor is one of
the 14 states in Malaysia. Administratively, it is divided into nine districts; Gombak, Klang,
Kuala Langat, Kuala Selangor, Petaling, Sabak Bernam, Sepang, Ulu Langat and Ulu Selangor.
Selangor was the most populous state in Malaysia with a total population of 4.2 million
(Department of Statistics Malaysia, 2001).
A sample of Selangor state was identified from the NOHSA database. Those who were
below 18 years by the year 2002, were removed from the sample. For the purpose of
convenience, Petaling district, was used as the sampling frame for the interview group and all
the other districts were used for the mail group. Respondents in each group were randomly
assigned either to complete the L-OHIP(M) or S-OHIP(M).

100
Sample Size:
The sample size was calculated based on differences in expected response rates between
interview and mail administered versions of the OHIP(M). If the former produces a response
rate of 60% and the latter 40%, then 77 subjects per group was required for a one-tailed test of
proportions with alpha at 0.05 and beta at 0.20 (Lwanga and Lemeshow, 1991). In order to
examine variations by age for the mail questionnaire where literacy rates are an issue, the
sample for the mail component was doubled. Test-retest reliability assessment with the null
ICC set at 0.6 requires 40 subjects in order to detect an ICC of 0.8 (Donner and Eliasziw,
1987). Sample sizes were increased to ensure that sufficient data was obtained for respondents
for other analytic purposes (See Table 4.5).
Table 4.5. Assigned groups and sample sizes required
Type of administration Age L-OHIP(M) S-OHIP(M)
Mail 18+ 150 150
interview 18+ 100 100
Procedure:
Two methods of administration, mail questionnaire and interviews, were employed and two
types of questionnaire, L-OHIP(M) and S-OHIP(M) were used.
Mail questionnaire: For those in the Mail group, a set of questionnaires together with an
introductory letter (Appendix G) and a prepaid stamped return envelope was sent to the
participants. In order to identify the respondents, a number, which was assigned to the
respondent, was stamped on the return envelope. A pen was enclosed to show an appreciation
for their participation.

101
Participants were asked to complete the questionnaire and return it to the sender using
the envelope enclosed. To maximize returns, the steps outlined by Dillman (1978) were
followed. Seven to ten days after the first mailing, a postcard (Appendix H) was sent to thank
those who had returned the questionnaire, and remind the others of the study’s importance. The
card also indicated to those who had mislaid the original where they can get another copy.
Three weeks later, a second letter was sent to those participants who did not return the
questionnaire (Appendix I). A second copy of the questionnaire and a return envelope was also
included. If there was no response from them after one month from the date the second
questionnaire was sent, a participant was regarded as a non-respondent.
Interviews: Household interviews were carried out for the interview group by the trained
interviewer: Investigator (Dr Saub) and three dental students (Mr Monaj, Mr Mahadzar and Mr
Huzaiman). The interviewers were trained by the investigator on how to conduct the interview.
They were given the following items to be carried with them when performing the interviews:
1) a set of location maps, 2) the name and address of the respondents, 3) laminated
identification letters (Appendix J), 4) the questionnaires, 5) pen (to be given to the respondents
as a token), and 6) the appointment card (Appendix K).
For security purposes, the police where the interviews were conducted were informed
(Appendix L). In order to obtain better response from the respondent as well as to make them
aware of the study, one month before the interviews started, an introductory letter (Appendix
M) regarding the study from the Dean of the dental faculty of University Malaya was sent to all
respondents. Subsequently, the interviewer went to each respondent’s house to interview him or
her. In the case where the respondent was not available, an appointment card (Appendix K) was
left at the house, asking him/her to contact the interviewer so that an appointment could be

102
made. However, if he/she did not get back to the interviewer within one week, a second visit to
the respondent’s house was made. The respondent was regarded as a non-respondent after two
visits were made. For convenience, the interviews were carried out area by area.
Re-administration: In order to carry out test-retest analysis, a second administration was carried
out. Fifteen days after the first administration of the questionnaire, the second administration
was carried out on a selected sub-sample. For the mail questionnaire, the sample was selected
based on those who had returned the questionnaire within two weeks from the time that the
questionnaire was first posted to them. For the interview questionnaire, after fourteen days
from the first interviews, the second interviews were made. All areas were revisited once. No
second visit was made. The same method of administration and type of questionnaire as at the
first administration were employed. At this stage one additional question regarding whether
their oral health had changed since the first administration was added.
Data entry:
Before data were entered into the computer, the source data were coded and then entered direct
into the computer using SPSS+ program. L-OHIP(M) and S-OHIP(M) data were entered
separately.
Data cleaning:
Before analysis was performed, data were first cleaned by two procedures: range checking and
contingency checking (Aday, 1996).

103
Range checking: this was done by running the frequency distribution for each item and verified
that only valid ranges of numbers were used. If any number in the coding was not valid, the
original questionnaire was used to determine the correct answer.
Contingency checking: Cross-tabulation was performed on the related questions to check for
accuracy in data entery. For example, if the question was meant for denture wearers, then those
who were not wearing dentures should only respond to the option “not applicable” for that
particular question. If another option was entered, then it was corrected to the “not applicable”
option.
Missing data:
Two procedures were applied in the case of missing data: total exclusion and mean item
imputation (Slade, 1997b):
1) If more than twenty percent of the data (nine and more items for L-OHIP(M)
and two or more items for S-OHIP(M)) were missing (blank entries or “don’t
know” responses), then it was excluded from the final analysis.
ii) In the case where less than 20 percent of the data were missing (blank entries or
“don’t know” responses), then the item was imputed by the mean of that
particular item.
Scoring:
Two methods of scoring were computed: Additive (ADD score) and Simple count (SC score)
(Allen and Locker, 1997). ADD scores were calculated by adding up the response codes and
SC score was calculated by summing the number of items reported as “very often” and “often”.

104
For L-OHIP(M), the ADD score could range from 0 to 180 and the SC score from 0 to 45. For
S-OHIP(M), the ADD score could range from 0 to 56 and the SC score from 0 to 14. A high
score indicated poor OHRQoL.
Analysis
Analysis was performed using the Stata version 7 program to deal with the complex sampling
design used in the study. The variances (standard deviations squared) of estimates obtained
from the complex designs generally differ from those based on a simple random sample (Aday,
1996). The stata statistical program can deal with this design effect.
Appropriate statistical analyses were performed. A p value was set at 0.05. The analyses
performed were:
1) To compare the two modes of administration (Interview vs mail) in terms of
response rate, completeness of data and the OHIP(M) score.
2) To assess the reliability of the measures.
3) To assess the validity of the measures.
4) To compare OHIP(M) with OHIP(Australia) and OHIP(Canada)
5) To compare the two types of S-OHIP(M) derived using two methods (frequency and
regression),
6) To describe the impact of oral conditions on the quality of life of the adult
population.
7) To compare the impact of oral conditions on the quality of life between Malaysian
and Canadian populations aged 50 and above.

105
1) To compare the two modes of administration (Interview vs mail)
The comparison of the two modes of administration was made by assessing three parameters:
response rates, completeness of data and OHIP(M) scores. A questionnaire was considered
incomplete if more than 20% of responses were left blank or marked don’t know: nine or more
items for the L-OHIP(M) and two or more items for S-OHIP(M) (Slade and Spencer, 1994a).
The following hypotheses were tested using the ra test or Mann-Whitney test.
Hypothesis:
Response Rates e The response rate for the L-OHIP(M) would be lower than response rate of S-
OHIP(M), both interview and mail.
e The response rate for mail questionnaire of the L-OHIP(M) would be lower than mail questionnaire S-OHIP(M).
Percentage of Incomplete data (%ID): e The %ID for the L-OHIP(M) would be higher than %ID for the S-OHIP(M), both
interview and mail.
e The %ID for mail questionnaire of the L-OHIP(M) would be higher than mail questionnaire S-OHIP(M).
OHIP score
e Ho: The score obtained through mail questionnaire would be no different with the score obtained through interviews, both L-OHIP(M) and S-OHIP(M).
2) Reliability
Two types of reliability were assessed: internal consistency and test-retest reliability.
Internal consistency.
Internal consistency was assessed using Cronbach’s reliability coefficient a based on the
responses from the first administration. Scores of 0.6 or more indicate good to excellent
reliability (Locker and Slade, 1993).

106
Test-retest reliability
To ensure that the questionnaire was reproducible in stable subjects, intraclass correlation co-
efficients were calculated using scores from the repeated administrations of the OHIP(M).
sample. The value of 0.7 was considered as an acceptable level (Aday, 1996).
3) Validity
To ensure that the instrament measures what it is supposed to measure, validity tests were
carried out. Data from the first administration of this part of the study was used to assess the
validity of the instrument. Because there was no “gold standard”, construct validity was
assessed. Two types of construct validity test were performed: Convergent validity and
discriminative validity.
Convergent Construct validity
Convergent validity describes how closely a measure is related to other measures of the same
construct to which it should be related. Correlation between the global rating of oral health and
OHIP(M) score using Spearman’s rank correlation test was performed to assess convergent
validity.
Discriminative Construct validity
Discriminative validity is related to how well the scale is able to distinguish between groups
with known differences. This was assessed by examining the association between:
i. The OHIP(M) score and satisfaction with oral health.
ii. The OHIP(M) score and self-perceived need for dental treatment.
iti. The OHIP(M) score and dental status (Dentate/Edentulous).

107
The following hypotheses were tested using the Mann-Whitney test for comparing two groups
and the Kruskal-Wallis test for comparing more than two groups.
Hypotheses:
e Those who were not satisfied with their oral health would be more likely to have
high OHIP scores
e Those who perceived that they needed dental treatment would be more likely to
have higher OHIP scores than those who did not.
e The edentulous subjects and dentate subjects wearing dentures would be more
likely to report more functional problems and have higher OHIP scores than
dentate subjects not wearing dentures
4) Comparison of the technical properties of the OHIP(M) with OHIP(Australia), and
OHIP(Canada)
The results of reliability and validity analyses were compared with those from the OHIP
(Australia) and OHIP (Canada) to establish measurement equivalence. The information on the
psychometric properties for OHIP (Australia) was obtained from a published paper by Slade
and Spencer (1994a), while OHIP (Canada) was obtained from the database of the Ontario
Study of the Oral Health of Older Adults (Locker and Slade, 1993).
The Cronbach’s alpha values and Intraclass correlation coefficients were compared.
Two analyses were performed in order to compare the ability of the measures to distinguish
between groups: the differences in the mean ranks (DMR) between categories of the
independent variables, obtained from the Mann-Whitney test and odds ratios based on the
median splits (Allen and Locker, 1997). To perform these analyses, the OHIP scores were
standardized to a range score of 0 to 100 using the formula below (Fayers and Machin, 2000):

108
Z = X [100/(m x (k-D}
Z= Standardize score
X= Sum-score
m= Number of items
k= Response categories
5) To compare two types of short form developed using two different methods.
Although a long measure provides more comprehensive data, some research settings do not
permit its use, thus, most health related quality of life measures develop a short form to provide
an alternative form of collecting data. There are different methods to shorten a measure. Slade
(1997c) derived a short form using regression analysis, which contains 14 items, two from each
domain. In this study, a short form was developed based on the most common items reported
by the patients who were interviewed at the qualitative interview stage. The two most
commonly reported items from each of the subscales were chosen to form the short version.
This method is known as item-frequency method. The question is between these two methods —
regression and item-frequency - which is a better method to produce a short form?
Thus, in order to assess the performance of the two different methods of deriving short
form, L-OHIP(M) data was used in creating the two forms - Frequency-S-OHIP(M) and
Regression-S-OHIP(M) - so that the comparison could be made on the same sample. The
Regression-S-OHIP(M) was reproduced using the controlled regression analysis as described
by Slade (1997c). The total score of the 45 items was used as the dependent variable and all the
45 individual items as an independent variable. Stepwise regression was performed. The item
that makes the least contribution to the R-squared and which is in a dimension that already has
two items in the model was deleted. The model was then refitted. The procedure was continued
until two items from each dimension were selected. To compare these two forms, the following
analyses were performed:
a. To compare the content,

109
b. To compare the score obtained using these two version of S-OHIP(M).
c. To compare the reliability (Cronbach’s alpha and ICC) of these two version of
S-OHIP(M).
d. To compare the concurrent and construct validity of these two version.
e. To compare the ability of the measures to distinguish between groups. Two
analyses were performed: the differences in the mean ranks (DMR) between
categories of the independent variables, obtained from the Mann-Whitney test
and odds ratios based on the median splits (Allen and Locker, 1997).
6) To describe the impact of oral conditions on the quality of life of the adult population.
Data obtained using the L-OHIP(M) was used to describe the impact of oral conditions on the
quality of life of the adult population of Malaysia. In this analysis, the response categories were
reduced to three: i) “very often” or “often”, ii) “sometimes” and iii) “once in a while” or
“never”. The cut off point used in estimating the proportion of impacts was “very often” and
“often”. This represents the most stringent cut off point and identifies those who experienced
oral health related problems on a relatively frequent basis (Locker and Slade, 1993).
7) To compare the impact of oral conditions on the quality of life between Malaysian and
Canadian population aged 50 and above.
The Malaysian data obtained from the present study was compared with Canadian data
obtained from the database of the Ontario Study of Older Adults. For the purpose of this
comparison, the age was standardized at 50 years old and above. The cut off point used for this
analysis was “very often” and “often”.

110
4.3) PRIVACY AND CONFIDENTIALITY
All participants involved in this study were assured that all information they supplied would be
kept confidential. No identifiers such as names or patient numbers would appear on any of the
instruments used during the study and no names would be used in any papers or reports. Once
the tape recordings of the in-depth interviews had been transcribed, the tapes would be
destroyed. Completed questionnaires would be destroyed once the data had been entered into
the computer. The signed consent forms would be retained but kept in a locked filing cabinet
separate from other documentation and data files created for the study.
4.4) SCIENTIFIC AND ETHICAL REVIEW
The protocol of this study was reviewed and approved by the Faculty of Dentistry Research
Committee and the Ethical Committee University of Toronto. There was no Ethical review at
the Faculty of Dentistry, University of Malaya. Thus, Ethical review was only obtained from the
University of Toronto.

CHAPTER 5
RESULT
5.1) TRANSLATION
This section describes the results of the translation process to produce an equivalent Malay
questionnaire (MQ) of the OHIP using a forward-backward translation technique. It involved
translating the original English questionnaire (OQ) (Appendix A) into the Malay language.
One of the drawbacks of the forward-backward translation technique is that when the
translators are aware that their work will be evaluated by back-translations, they tend to translate
literally (van de Vijver and Leung, 1997; Geisinger, 1994). However, in this study the
investigator was convinced that the translators (FT) had translated the questionnaire in a
dynamic way rather than in a literal way, and it is shown in the example below:
Example
OQ: Have you felt that your breath has been stale because of problems with your teeth, mouth or dentures?
Literally translated: Pernahkah anda merasakan yang nafas anda menjadi_basi
disebabkan oleh masalah gigi, mulut atau gigi palsu?
In this example, if the question had been translated literally, the translation would have no
sensible meaning in Malay language because there is no such phase as “nafas menjadi basi” in
Malay. The word “basi” that was literally translated for “stale” is commonly used to describe
food but not breath.
Table 5.1 shows the distribution of the level of difficulty in translating the content of the
questionnaire into the Malay language. The level of difficulty, i.e, easy, difficult, or impossible
(Herdman et al, 1998), was based on the consensus given by the forward-translators: at least two
of them agreed upon the degree of difficulty.
ill

112
Table 5.1. Level of translation difficulty.
Result No.ltem Easy to translate 37
Difficult to translate 12
Impossible to translate 0
More than 75% of the questions were rated as easy to translate and none of the items
were considered impossible to translate. Twelve questions were considered difficult to translate
(Table 5.2). These difficulties are discussed below.
Table 5.2. Difficult to translate questions
Q3) Have you noticed a tooth which doesn't look right?
Q5) Have you felt that your breath has been stale because of problems with your teeth, mouth or dentures?
Q8) Have you felt that your digestion has worsened because of problems with your teeth, mouth or dentures?
Q10) Have you had a sore jaw?
Q16) Have you had sore spots in your mouth?
Q20) Have you been self conscious because of your teeth, mouth or dentures?
Q21) Have dental problems made you miserable?
Q26) Have you felt that there has been less flavor in your food because of problems with your teeth, mouth or dentures?
Q32) Have you had to interrupt meals because of problems with your teeth, mouth or dentures?
Q34) Have you been upset because of problems with your teeth, mouth or dentures?
Q42) Have you been a bit irritable with other people because of problems with your teeth, mouth or dentures?
Q45) Have you suffered any financial loss because of problems with your teeth, mouth or dentures?

113
The first difficulty encountered in this study was related to finding equivalent Malay
words to explain the English concept underlying them. For example, the words “self-conscious”,
“miserable”, and “irritable” describe internal feelings. Members of Malay society are known to
be very shy and non-expressive, especially in matters related to personal feelings or emotions,
and this could place limits on the number of Malay words that describe feeling or emotions.
This is supported by a statement made by Asmah Haji Omor (1985), a Malay linguistic expert.
She wrote:
“It has long known and accepted fact that language is an index to culture. This
means that language reflects the culture of its speakers — the way of life they lead
as well their physical and social environment. Such function is borne by the
vocabulary of the language concerned. As such, the language of people engaged in agriculture is expected to be rich in the vocabulary of agricultural.”
To overcome this problem, the committee used the “Dewan English-Malay” dictionary
to look up Malay equivalents of these words (self-conscious, miserable, and irritable). The
Dewan English-Malay dictionary was used because the aim of this dictionary is to provide an
equivalent for Malay to English words. For example, it was found that the equivalent word for
““rritable” is “lekas/cepat marah’”’. Therefore, this phrase was used to mean “irritable”. However,
when this was translated back to English, the word “irritable” did not show up. Rather, it was
translated as “got angry easily”. Hence, the word “irritable” is assumed, to a certain extent, to be
similar to “got angry easily”.
The dictionary gives “sedih” as the equivalent for “miserable”, but “sedih” is also used
as the equivalent word for “sad” and “upset” (Q34). Thus, when these two questions (Q34 and
Q42) were translated into Malay, they ended up being the same. Therefore, one of the questions
had to be deleted.
Another word that caused difficulty was “self-conscious”. We found that one specific
dictionary (Dato Asmah Haji Omar, 2000) translated “self-conscious” as “sogok”. However,

114
“sogok” is not a widely used word and, hence, it has not been internalized by the Malaysian
people. Thus, this word could not be used. “Segan” was the closest word that was found to
represent “self-concious”. However, the word “segan” is commonly used interchangeably with
the word “malu” (“embarrass” or “shy’”), although academically these two words have slightly
different meanings. Furthermore, the word “segan” has a different meaning in different parts of
Malaysia. For example, in the northern part of Peninsular Malaysia, the word “segan” is used to
describe laziness rather than embarrassment or shyness. Nevertheless, the word “segan’” was
kept to be examined in the qualitative interviews.
The second problem in translation is related to the clarity of the words or the sentences.
This was seen clearly when translating “sore jaw” and “sore spot”. These two words were not
familiar or understood by the forward-translators. Thus, clarification of the meaning was
obtained from the developer of the OHIP. Based on his explanation, the investigator changed the
word “sore jaw” to “pain in the jaw” and “sore spot” to “ulcer”. These changes enabled the FT
to translate these words to the Malay language.
The third problem was related to the terms used, many of which could be misinterpreted
by the respondents. One example was “dental problem”. This phrase was easily translated into
Malay language as “masalah pergigian”. However, it was anticipated that by using this word,
the focus would be only on the teeth. Thus, to avoid such a problem, the phrase “dental
problem” was translated to “teeth, mouth and denture”. Question number 45, “Have you
suffered any financial loss because of problem with your teeth, mouth or dentures?” was totally
restructured at this stage to “Have you had to spend a lot of money due to problems with your
teeth, mouth or dentures?” This was done because the word “financial loss” was not suitable in
this context.

115
At this stage, no items were removed. However, there were questions which seemed to
have a similar meaning after they had been translated into the Malay language. This translated
questionnaire will be used in the qualitative interviews, and is discussed in the next section.

116
5.2) QUALITATIVE INTERVIEWS
This section describes the results of the in-depth interviews that were carried out to establish the
conceptual and items equivalence (content validity). Herdman et al (1998) suggested that the
most important aspect of cross-cultural adaptation is to determine that the two populations
(source and target) conceptualize health and quality of life in similar ways.
The results will be presented in two parts. Part 1 presents the results of the interview
with the patients in eliciting information on how oral diseases and oral disorders affect their
daily life. Part 2 presents the results related to assessing the content and face validity of the
translated OHIP questionnaire.
The interviews took five months to complete, starting September 2001 and ending in
January 2002. The interviews were conducted in an isolated room. This had at least two
advantages: 1) it improved the quality of recording, which was extremely important to facilitate
transcription, and 2) it helped to reduce distractions, which made the patient more focussed on
the interview. An external microphone was added to the tape recorder after the interviewer
realized that the first few interviews were not very clear.
To encourage participation of the patients, an incentive was given. This included a dental
examination and appropriate treatment by the investigator, tokens in terms of oral care products
and money. Such incentives, especially immediate dental examination, have been shown to be
good motivational factors in encouraging participations.
On average, each interview was about 20 minutes long. In general, the interviewer
probed heavily for answers, especially in matters related to social well-being. The interviews
were conducted in Malay or English, depending upon the patient’s preference. However, most
of the time the interviews ended up using both languages. It was also observed that Chinese and
Indians preferred to speak English during the interviews.

117
A total of thirty-six patients were interviewed (Table 5.3). Of those, 17 respondents were
Chinese. About half of the total sample was a middle-aged group (40-59 years old). The
patients interviewed had a range of oral diseases and disorders. It is important to note that the
purpose of sampling was not to get a representative sample but, rather, to get a broad view on
how oral diseases or disorders affect people’s lives across age and ethnicity in Malaysia.
The number of Chinese interviewed was higher than Malays and Indians. This could be
due in part to the time frame in which the interviews were conducted. The months of November
and December are fasting months as well as the religious celebration for the Malay. During
those months, the number of Malay people attending dental clinics drops drastically. The low
number of Indian participants could be due to the fact that most Indians have good teeth and,
therefore, do not to go to dental clinics for treatment. In addition, the interview months were at
the end of the year, which happens to be a school holiday.
Table 5.3. Sample distribution for qualitative interview.
Agegroup Malay Chinese indian Total
18-39 6 5 2 13
40-59 6 8 4 18
60+ 0 4 1 5
Total 12 17 7 36
Part 1: From the transcriptions, significant statements on the impact of oral diseases and oral
disorders were extracted and treated as raw data. Then, duplicate statements were eliminated,
which resulted in forty-nine significant impacts as listed in Table 5.4. Of these, three were
considered to be new impacts, which had frequently emerged in the interviews. They were
“unable to enjoy their favorite foods”, “losing appetite” and “‘no self-confidence”.

Table 5.4. Impacts of oral disease and oral disorder.
118
1. OONAAEWN
20. 21. 22. 23.
Difficult to chew foods (especially hard foods: nuts, chicken bone, sugar cane)
Can't bite hard foods.
Can't pronounce certain words (eg: “s”) Face look ugly “like old person” Look awkward
Loose denture
Unsatisfied with the look of the denture
Cause headache Cause pain on the other part of the body (eg. Ear, hand, neck)
. Toothache
. Pain on the gums
. Ulcer
. Sensitive to cold water
. Denture pain
. Feel shy
. Worry to laugh or talk. . Feel uncomfortable due to food stuck in
between the teeth or dentures.
. Scared that it might worsen
. Scared that the tooth next to it will be
affected
Bad breath
Feel worry about it Feel very unhappy
Uncomfortable denture
24.
25. 26. af. 28. 29. 30. 31. 32. 33. 34. 35. 36. 37. 38. 39.
40. 41. 42. 43. 44. 45. 46. 47. 48.
Avoid certain foods (eg. Sweets, cold drink, hard foods) Avoid chew on the pain side.
Avoid talking Avoid laughing Difficult to brush teeth. Unable to eat favorite foods Have to cover the mouth when smiling Have to blend the foods. Food feel less tasty Difficult to clean Have to brush more frequently
Avoid using that side. Tend to close the mouth Disturb sleep (have to take pain killer)
Sleep ail day long Unable to concentrate (eg: to other people conversation, study, work). Lazy to do other works besides sleeping. Easy to get angry Loss appetite. Can’t enjoy the foods Preferred to stay at home. Less confident to talk to people Tend to be quiet Tend to stand far from people Have to take medical certificate (mc) Financial burden.
These impacts were then analyzed and grouped into a hypothetical domain as in the
original development of the OHIP. They are “functional limitation”, “physical pain”,
“psychological discomfort”, “physical disability”, “psychological disability”, “social disability”
and “handicap”. Although there were impacts that were not listed in the original questionnaire,
they belonged to one of the domains (Appendix N). No new domain emerged, nor was a domain
excluded. Thus, it could be concluded that Malaysians and Australians conceptualize oral health
similarly in terms of how oral diseases or oral disorders affect daily life.
Part 2: In the second part of the interview, the patients were shown the translated questionnaire
and asked to comment on the relevancy and their understanding of each statement. Table 5.5

119
shows the distribution of items based on relevancy and the respondents’ understanding of the
questions. Most of the items were understood and relevant. Two pairs of questions, in the
translated version, were viewed by most of the patients interviewed as being the same. They
were question Q20 “self-conscious” with question Q38 “embarrassed” and question Q21
“miserable” with question Q34 “upset”.
Table 5.5. Relevancy of items
Situation Number of items Understood and relevant 40
Understood and Similar meaning 2 pairs
Difficult to understand/Ambiguous 4
Understood but irrelevant 4
Although there is no precise Malay word for “self-conscious”, the concept does exist in
Malaysian society. This was shown in the following narrative.
“Kita gigi rongakkan, jadi kita rasa janggallah, tapi kawan-kawan tak kisah
pun.... Dia orang buat macam biasa je.., tapi saya malu” (I don’t have teeth, so I feel odd, but my friends don’t bother... they act as
normal.. but me myself feel shy.) 52-year- old Malay woman
The word “malu’” here was used to describe her own feeling of being self conscious rather than
being embarrassed. However, the word “malu” was also used to describe the feeling of being
embarrassed, as shown in the following narrative.
“sometime saya rasa malu bila when people making joke of my braces....gigi besi” (sometime, I felt embarrassed when people making joke of my braces.....iron teeth)
32-year-old Malay man, orthodontic patient

120
Therefore, the word “malu” was used interchangeably, depending on the context where
it had been used. However, in a dental context, it very often referred to being self-
conscious rather than being embarrassed.
Four questions were considered as difficult to understand and ambiguous as listed in
Table 5.6. For example, in Q3, the majority of respondents did not understand the questions.
Whereas question Q9 “the pain in the mouth” was confusing and too broad, and most patients
interviewed asked whether it included toothache or gum pain. For question Q29 and Q48, the
words “diet pemakanan” and “berfungsi sepenuhnya” were not understood by most of the
respondents, especially those who were older and uneducated. In one question, Q6, “sense of
taste” seemed to be irrelevant, since most patients interviewed did not feel that his/her sense of
taste had anything to do with their teeth, mouth or dentures. One of the patients felt that the
cause of her reduced sense of taste was due to her age: she believed that it was related to her
blood circulation and not because of her teeth, mouth or dentures.

121
Table 5.6. Problem questions
Difficult to understand/ambiquous:
Q3) Pernahkah anda perasan terdapat gigi yang kelihatan tidak sempurna? (Have you noticed a tooth which doesnt look right?)
Q9) Pernahkah anda mengalami kesakitan di dalam mulut anda? (Have you experienced pain in your mouth?)
Q29) Pernahkah anda merasakan diet pemakanan anda menjadi tidak memuaskan disebabkan masalah gigi, mulut atau gigi palsu anda? (Have you felt that your diet became less satisfactory because of problems with
your teeth, mouth or dentures?)
Q48) Pernahkah anda tidak dapat berfungsi sepenuhnya disebabkan masalah gigi, mulut atau gigi palsu anda? (Have you been unable to function fully because of problems with your teeth, mouth or dentures?)
Understood but irrelevant:
Q6) Pernahkah anda merasakan yang deria rasa anda menjadi semakin kurang disebabkan masalah gigi, mulut atau gigi palsu anda? (Have you felt that your sense of taste has become worse due to problems with your teeth, mouth or dentures?)

122
5.3) TRANSLATED AND ADAPTED QUESTIONNAIRE
Based on the translation process and qualitative interviews’ results, a Malaysian version of the
OHIP questionnaire was produced. This adapted questionnaire will be referred to hereafter as
the Malaysian Oral Health Impact Profile [OHIP(M)], which will be used in the subsequent
stages of this study. The word “M” in brackets indicates “Malaysia”.
Seven items were excluded from the original version either because the items were
ambiguous, yielded similar meanings to other items, or were not relevant (Table 5.7). Three
items were restructured and/or reworded and three items were added, as shown in Table 5.7. All
patients interviewed reported that they had experienced food getting stuck between their teeth or
under their dentures, and that this had become a normal occurrence for them. Thus, the
committee felt that it was more meaningful to ask patients whether or not they had experienced
discomfort due to food getting stuck between the teeth or under the dentures.
In Q8, when “digestion has worsen”, was translated to Malay, the understanding was that
the person already had a degree of digestive problems and whether or not dental problems had
made this worse. Therefore, the committee felt that the question was not appropriate. Hence, the
question was reworded to “Have you felt that foods you eat have not digested properly due to
problems with your teeth, mouth or dentures?”
In Q41, “trouble getting along with other people” was regarded as giving a negative
impression to people. Therefore it was anticipated that it would not elicit honest answers from
the respondents. Hence, the question was reworded as shown in Table 5.7. Three new questions
were included in the questionnaire (Table 5.7). This was done because most patients interviewed
reported these impacts.

123
Table 5.7. Deleted, reworded and new items
DELETED ITEMS:
Q3) Q6)
Q9) Q20) Q21) Q29)
Q48)
Have you noticed a tooth which doesn't look right? Have you felt that your sense of taste has worsened because of problems with your teeth, mouth or dentures?
Have you had painful aching in your mouth?
Have you been self conscious because of your teeth, mouth or dentures?
Have dental problems made you miserable? Has your diet been unsatisfactory because of problems with your teeth, mouth or
dentures?
Have you been totally unable to function because of problems with your teeth, mouth or dentures?
REWORDED/RESTUCTURED ITEMS:
Q7)
Q8)
Q41)
Have you had food catching in your teeth or dentures? (Have you experienced food getting stuck in between your teeth or dentures?)
Have you felt that your digestion has worsened because of problems with
your teeth, mouth or dentures? (Have you felt that your digestion is
becoming poorer due to problems with your teeth, mouth or dentures?)
Have you had trouble getting along with other people because of problems with your teeth, mouth or dentures? (Have you experienced problems having friendships with others because of problems with your teeth, mouth or dentures?)
NEW ITEMS:
A25) A34) A44)
Have you felt discomfort due to food getting stuck in between your teeth or dentures?
Have you felt that foods you eat have not digested properly due to problems with your teeth, mouth or dentures?
Have you been unable to mix around with
others because of problems with your teeth, mouth or dentures?
Have you been unable to eat your favorite foods? Have you felt a loss of appetite due to problems with your teeth, mouth or dentures?
Have you felt less confident of yourself due to problems with your teeth, mouth or dentures?

124
The OHIP(M) at this stage was divided into four parts as shown in Table 5.8. Part A
consists of 45 questions of impacts as compared to 49 questions in the original questionnaire.
Part B consists of three global self-rating questions. Part C has four questions regarding
dentition and dentures. Part D consists of questions regarding respondents’ socio-demographic
background.
Tabie 5.8. Format of questionnaire
Part Part A: OHIP questions
45 questions
Part B: Global self ratings: i. Self-rating of oral health
ii. Self-perceived treatment need iii. | Satisfaction with oral health.
Part C: Dental status 4 questions
Part D: Sociodemographic: ii Age
ii, Sex iii. Ethnicity iv. Level of education
Type of data Ordinal/Interval
Ordinal
Dichotomous
Dichotomous
Dichotomous
Interval
Nominal
Nominal Nominal
Categories Likert scale (5 point scale). (Very often/often/sometimes/ once a while/never)
Very good/Good/ Fair/ Poor Yes/No Yes/No
Yes/No
Birth date
Male/Female Malay/Chinese/India/Other No education/ Primary/
Secondary/ University/ Other)
Two versions of the OHIP(M) were developed: a long form consisting of 45 items and
designated as L-OHIP(M) (Appendix E), and a short form consisting of 14 items and designated
as S-OHIP(M) (Appendix F).

125
5.4) PRE-TESTING
A total of twenty respondents completed the L-OHIP (M) questionnaire. Table 5.9 shows the
characteristics of the respondents. The mean age of the respondents was 44.1 years old, ranging
from 18 to 88 years old. Sixty percent of the respondents were female, and the majority were of
Malay ethnicity. All respondents had at least a primary education.
Table 5.9. Characteristics of the respondents for Pretesting
Characteristics N (%) Mean (SD) Age (n=20)
18-39 7 (35.0) 44.1 (19.4) 40-59 10 (50.0) 60+ 3 (15.0)
Gender (n=20) Male 8 (40.0) Female 12 (60.0)
Ethnic (n=20) Malay 9 (45.0) Chinese 7 (35.0) indian 4 (20.0)
Education level (n=20) Primary 1 (5.0) Secondary 9 (45.0) University 10 (50.0)
All respondents agreed that the format and instruction on how to complete the
questionnaire were easy to follow. Almost all respondents completed the entire questionnaire.
This indicates that the instructions and the questions were easily understood. On average, the
time taken to complete the L-OHIP(M) questionnaire was 20 minutes (Table 5.10).
Most of the respondents had no difficulty understanding the questions except one person
who had difficulty understanding the word “rahang”. Since only one person did not understand
the word “rahang”, it was retained. No major changes were made except for a minor change to

126
question D4 (level of education), where one category was added to the response options to
provide an option to those who felt that they had other forms of education. Since only one minor
change was made, the questionnaire was not re-tested.
Tabie 5.10. Summary of pretesting finding.
Area tested Result
Format and instruction of the questionnaire:- e Did you have any difficulty to complete
the questionnaire?
e Was the instruction easy to follow?
Wording of questions:- e Were there any questions that you found difficult to understand?
Time to complete:- e How long the questionnaire took to complete?
All respondent did not have any problem to follow the instruction.
Most respondents had no difficulty understanding the questions.
20 minutes

127
5.5) TEST OF RESPONSE OPTIONS
A total of 171 respondents completed the S-OHIP (M) questionnaire. Table 5.11 shows the
characteristics of the respondents. The mean age of the respondent was 31.6 years old, and
ranged from 18 to 100 years old. The majority of respondents were younger adults (18 to 39
years old), female and of Malay ethnicity. All respondents had at least a primary education.
Table 5.11. Characteristics of the respondents for test of response options study.
Characteristics N (%) Mean (SD) Age
18-39 122 (73.5) 31.6 (13.8) 40-59 39 (22.9) 60+ 6 (3.6) Total 166 (100.0)
Gender Male 59 (34.9) Female 110 (65.1) Total 169 (100.0)
Ethnic
Malay 122 (71.8) Chinese 24 (14.1) Indian 22 (12.9) Total 170 (100.0)
Education level Primary 2 (1.2)
Secondary 78 (46.2) University 89 (52.6) Total 169 (100.0)
Figure 5.1 shows the distribution of the response options for each of the questions. It was
observed that all ranges of options were utilized. This indicates that the response options of five-
point frequency Likert scales can be used for a Malaysian adult population.

Percent
Percent
“Mlezing ‘Once a white
Never ‘Sometime
Difficulty chewing Bad breath
Percent
Once a white Percent
Sometime Vary often
Food stuck discomfort
‘Somabina
Percent
Percent
Onca a while Sometime Never
Lass confident
‘Somakme
,
50
40
30
Py
* 2 0 z ®
: i é @ Ok peewee Mizaing (Ores 2 while Often
Maver Sometime Very ofan ‘ever Sametime Very often
Avoid eating Avoid smiling
100
80
60
40
20
5 3 i 3 8 é a ol : .
Missing: Miseing Often:
Never Semotine Vary offen Somotime Vary often,
Concentration disturbed Avoid going out
Percent
Percent
Percent
Missing ‘Onea a while Often Nover Sometime Very offen
Eating discomfort
Percent
Once awhile Sometime Vary offen
Once o white
Never Sometime
Sleep disturbed
Very often
Missing Oncea while
Sometires
Daily activites
Figure 5.1. Distribution of response options.
128

129
5.6) FIELD TESTING
5.6.1) Total Response Rate
Table 5.12 shows the response rate for the field-testing stage. A total of 979 subjects were
selected from the NOHSA sample. Of those, 694 subjects were allotted for a mail questionnaire
and 285 were allotted for an interview. All 694 subjects were sent a questionnaire (long or
short). Sixty-six questionnaires were returned uncompleted, either because of a wrong address
or because the person had moved or died. Thus, an eligible sample for the mail questionnaire
was 628 respondents. About 48% of those subjects completed the questionnaire.
Of the 285 subjects visited for an interview, 73 respondents had moved away, 40 refused
to be interviewed and 46 were not available even after two attempts were made by the
interviewers. The response rate for interviews was almost 60%.
Tabie 5.12. Response rate for field testing stage.
Interview Mail Total 1) Original Sample 285 694 979
2) Ineligible sample: 139 Moved 67 18 Wrong address 6 46 Died - 2 Total 73 66
3) Eligible sample (1-2): 212 628 840
4) Non-responders: 414 Refusal 40 NA Not available (2 visit) 46 NA Unreturned questionnaire NA 328 Total 86 328
5) Completed 126 300 426
6) Response Rate (5/3) 59.4% 47.8% 50.7%

5.6.2) Characteristics of respondents and non-respondents.
130
Table 5.13 shows the characteristics of the respondents and non-respondents. It was observed
that a higher proportion of the non-respondents were young adults (18 to 39 years old);
however, no significant difference was observed in terms of gender. More Malays than Chinese
and Indians responded. Almost 60% of the respondents were Malay.
Table 5.13. Characteristics of respondents and non-respondents.
Characteristics
Respondent Non-respondent p-value N % N %
Agegroup (year-old): 18-39 208 48.8 232 56.0 40 - 59 166 39.0 126 30.4 0.034 60+ 52 12.2 56 13.5 Total 426 100.0 414 100.0
Gender: Male 185 43.4 191 46.1 0.430 Female 241 56.6 223 53.6 Total 426 100.0 414 100.0
Ethnic:
Malay 253 59.4 158 38.2 0.000 Chinese 108 25.4 180 43.5
indian 50 11.7 73 17.6 Others 15 3.5 3 0.7 Total 426 100.0 414 100.0
Chi-sq test for comparing group differences

131
5.6.3) Quality of data
Table 5.14 and 5.15 show the percentage of missing data (blank and “don’t know” responses)
for each item. For the S-OHIP(M), the total of missing data ranged from 0.5 to 2.9 percent. The
item “had bad breath” had the highest missing values.
Table 5.14. Percentage of missing items for the S-OHIP(M)
Item Don’t know Blank Total N (%) N (%) N (%)
A1 ___ Difficult chewing any foods 2 (1.0) 1 (0.5) 3 (1.5) A4 Had bad breath cause by dental problem 5 (2.4) 4 (0.5) 6 (2.9) A1i1 Discomfort eating any foods 0 (0.0) 1 (0.5) 1 (0.5) A1i2 Had ulcer in the mouth 3 (1.5) 1 (0.5) 4 (1.9) A116 Felt discomfort due to food getting stuck. 0 (0.0) 4 (0.5) 1 (0.5)
A17_ Felt shy 4 (1.9) 0 (0.0) 4 (1.9) A24_ Had to avoid eating some foods 1 (0.5) 0 (0.0) 1 (0.5)
A27 Avoided smiling 1 (0.5) 0 (0.0) 1 (0.5) A29 Your sleep been disturbed 2 (1.0) 0 (0.0) 2 (1.0) A33 Your concentration been disturbed 3 (1.5) 0 (0.0) 3 (1.5) A35 Avoided going out 2 (1.0) 0 (0.0) 2 (1.0) A39_ Problems in carrying out daily activities 4 (0.5) 0 (0.0) 1 (0.5) A41_ Had to spend a lot of money 2 (1.0) 0 (0.0) 2 (1.0) A44__ Felt less confident of yourself 3 (1.5) 0 (0.0) 3 (1.5)
Note: N=206
The total missing items for the L-OHIP(M) ranged from 0.5 to 7.3 percent. Seven items
had more than four percent of missing data. The percentage of “don’t know” responses ranged
from 0 to 5.5 percent. Generally, a very small percentage (less than 2 percent) was left blank.
All items had a missing value of less than five percent except “felt uncomfortable with the
appearance”, which was 7.3 percent. Of that 7.3 percent, 5.5 percent of the respondents provided
a “don’t know” response.

132
Table 5.15. Percentage of missing items for the L-OHIP(M)
Ttem Don’t know Blank Total
N (%) N (%) N (%) Al Difficult chewing any foods 0 (0.0) 1 (0.5) 1 (0.5) A2 Trouble pronouncing words 1 (0.5) 1 (0.5) 2 (1.0) A3 Felt that appearance has been affected 9 (4.1) 4 (0.5) 10 (4.6) A4 Had bad breath cause by dental problem 6 (2.7) 1 (0.5) 7 (3.2) Ad Feit that foods you eat have not digested 6 (2.7) 1 (0.5) 7 (3.2)
properly.
A6 Had pain on the jaw 8 (3.8) 2 (0.9) 10 (4.5) AT Had headache due to dental problem 10 (4.5) 4 (0.5) 11 (5.0) A8& Had sensitive teeth 3 (1.4) 2 (0.9) 5 (2.3) AQ Had toothache 3 (1.4) 1 (0.5) 4 (1.8) A10_— Had painful gums 3 (1.4) 1 (0.5) 4 (1.8) Ai1 Discomfort eating any foods 2 (0.9) 2 (0.9) 4 (1.8) A1i2 Had ulcer in the mouth 6 (2.7) 1 (0.5) 7 (3.2) Ai3 Felt denture was loose 4 (1.8) 2 (0.9) 6 (2.7)
A14 Felt uncomfortable with your dentures 6 (2.7) 3 (1.4) 9 (4.1) Ai5 Felt worried 6 (2.7) 4 (1.8) 10 (4.5) Ai6 Felt discomfort due to food getting stuck. 3 (1.4) 3 (1.4) 6 (2.8) A17 Felt shy 7 (3.2) 2 (0.9) 9 (4.1) A18 Felt uncomfortable with the appearance of the 12 (5.5) 4 (1.8) 16 (7.3)
teeth, mouth or dentures
A19 Felt stressed up 5 (2.3) 4 (0.5) 6 (2.7) A20 Speech been unclear 6 (2.7) 1 (0.5) 7 (3.2) A21 People misunderstood some of your words 4 (1.8) 4 (0.5) 5 (2.3) A22 Felt food less tasty 4 (1.8) 2 (0.9) 6 (2.7) A23 Been unable to brush your teeth properly 1 (0.5) 2 (0.9) 3 (1.4) A24 Had to avoid eating some foods 0 (0.0) 1 (0.5) 1 (0.5) A25 Been unable to eat your favorite foods 3 (1.4) 2 (0.9) 5 (2.3) A26 __ Difficulty eating because of problem related to 1 (0.5) 4 (1.8) 5 (2.3)
the dentures A27 = Avoided smiling 4 (1.8) 3 (1.4) 7 (3.2) A28 Had an interrupt meals 4 (0.5) 2 (0.9) 3 (1.4) A29 Your sleep been disturbed 4 (1.8) 2 (0.9) 6 (2.7) A30 Been sad 4 (1.8) 2 (0.9) 6 (2.7) A31___ Difficult to relax 4 (1.8) 2 (0.9) 6 (2.7) A32 ~~ Felt depressed 3 (1.4) 2 (0.9) 5 (2.3) A33 Your concentration been disturbed 5 (2.3) 0 (0.0) 5 (2.3)
A34_ ‘Felt a loss of appetite to eat 3 (1.4) 0 (0.0) 3 (7.4)
A35 Avoided going out 4 (0.5) 0 (0.0) 1 (0.5) A36_— Been less tolerant of your spouse or family 2 (0.9) 0 (0.0) 2 (1.0) A37 Unable to mix around with other people 1 (0.5) 0 (0.0) 1 (0.5) A38 Got angry easily. 3 (1.4) 0 (0.0) 3 (1.4) A39 Problems in carrying out daily activities 4 (1.8) 4 (0.5) 5 (2.3) A40_ Felt unwell 2 (0.9) 4 (0.5) 3 (1.4) A41 Had to spend a lot of money 3 (1.4) 1 (0.5) 4 (1.8) A42_ Felt less happy to be in the company of others 3 (1.4) 1 (0.5) 4 (1.8) A43 Been less satisfied with life 4 (0.5) 4 (0.5) 2 (1.9)
A44 Felt less confident of yourself 0 (0.0) 1 (0.5) 4 (0.5) A45__ Been unable to work to your full capacity 3 (1.4) 4 (0.5) 4 (1.8)
Note: N=220

133
5.6.4) Comparison of mode of administration — mail vs interview.
Table 5.16 shows the characteristics of the eligible sample for mail and interview groups. Both
samples were similar in terms of age group and gender distribution. However, there was a
higher proportion of Chinese in the interview group. All interview samples were located in an
urban area, whereas almost 25 percent of the mail samples were located in a rural area.
Table 5.16. Characteristics of the eligible sample for mail and interview group.
Characteristics Mail interview
N(%) N(%)
Age 18-39 319 (50.8) 121 (57.1)
40-59 217 (34.6) 75 (35.4)
60+ 92 (14.6) 16 (7.5)
Gender
Male 288 (45.9) 88 (41.5)
Female 340 (54.1) 124 (58.5)
Ethnic
Malay 319 (50.8) 92 (43.4) Chinese 189 (30.1) 99 (46.7)
indian 105 (16.7) 18 (8.5) Others 15 (2.4) 3 (1.4)
Strata
Urban 475 (75.6) 212 (100.0)
Rural 153 (24.4) -
To compare the two modes of administration, three parameters were assessed, they were:
a) response rate,
b) percentage of incomplete data.
c) OHIP(M) score.

134
5.6.4.1) Response rate
Table 5.17 shows the response rate of mail questionnaires and interviews for the L-OHIP(M)
and the S-OHIP(M). In total, the interview response rate was significantly higher than the
response rate for the mail questionnaire. Almost 60% of respondents completed the interview.
Less than 50% of the total sample for the mail group returned the questionnaire. The type of
questionnaire used - either long or short - did not show any significant difference in the response
rate for the mail questionnaire. This suggests that the length of the questionnaire did not
determine the response rate.
Table 5.17. Response rate of mail and interview for the L-OHIP(M) and the S-OHIP(M)
L-OHIP(M) S-OHIP(M) TOTAL
Total Responded | Total Responded Total Responded
N n (%) N n (%) N n (%)
Mail 310 149 (48.1)* 318 151 (47.5)* 628 300 (47.8)*
interview 125 71 (56.8)* 87 55 (63.2)* 212 126 (59.4)*
TOTAL 435 220 (50.6) 405 206 (50.9) 840 426 (50.7)
*Chi-sq test, p<0.05
5.6.4.2) Percentage of incomplete data.
Table 5.18 shows the percentage of incomplete data. The data was regarded as incomplete when
more than twenty percent of the items were either left blank or had a “don’t know” response. In
total, less then three percent of the completed questionnaires were considered incomplete. The
percentage of incomplete data for the L-OHIP(M) and the S-OHIP(M) mail questionnaires were
four and two percent respectively. However, these differences were not significant.

Table 5.18. Percentage of the incomplete data.
135
L-OHIP(M) S-OHIP(M) N Complete incomplete N Complete incomplete
(< 20%) (>20%) (< 20%) (>20%) n (%) n (%) n (%) n (%)
Mail 149 143 (96.0) 6 (4.0) 154 148 (98.0) 3 (2.0))
Interview 71 71 (100.0) 0 (0.0) 55 55 (100.0) 0 (0.0)
Total 220 214 (97.3) 6 (2.7) 206 203 (97.1) 3 (1.5)
5.6.4.3) OHIP Score
Table 5.19 shows the mean scores (ADD-Score and SC-Score) of both types of questionnaires,
i.e., L-OHIP(M) and S-OHIP(M), for the two types of modes of administration (mail and
interview). It was observed that the mean scores - both ADD score and SC score - were lower
for interviews than for mail for both the L-OHIP(M) and the S-OHIP(M). However, the
differences were not significant.
Table 5.19. Mean ADD-Score and SC-Score
L-OHIP(M) S-OHIP(M)
ADD-Score $C-Score ADD-Score SC-Score
N Mean (SD) Mean N Mean (SD) Mean (SD) (SD)
Mail 143 28.48 (24.78) 2.71 (4.95) 146 11.25 (9.48) 1.16 (2.20)
Interview 71 25.27 (18.47) 1.89 (3.13) 54 10.15 (6.69) 0.98 (1.14)
Total 214 27.42 (22.89) 2.44 (4,44) 200 10.96 (8.81) 1.11 (2.01)
Summary for mode of administration:
1) Interview yielded a higher response rate than mail questionnaire.
2)
3)
4)
was not statistically significant.
Less missing data for the interview.
Length of questionnaire did not affect the response rate.
Score tends to be lower for interview than mail questionnaire; however, the difference

136
5.6.5) Reliability
5.6.5.]) Internal consistency
The internal consistency was assessed by Cronbach’s alpha. Table 5.20 shows the Cronbach’s
alpha values for the seven subscales of the L-OHIP(M) and the overall alpha value for the S-
OHIP(M) by mode of administration. Cronbach’s alpha was not calculated for the S-OHIP(M)
subscales. The overall Cronbach’s alpha for the seven subscales of the L-OHIP(M) ranged from
0.72 to 0.87. A higher value was observed for the mail questionnaire for all the subscales, which
ranged from 0.75 to 0.88 than the interview, which ranged from 0.66 to 0.84. However,
regardless of mode of administration all values were more than 0.60, indicating good to
excellent reliability. For the S-OHIP(M), the scale Cronbach’s alpha value was 0.89. The mail
questionnaire had a higher value than the interviews.
Table 5.20. Internal consistency for the L-OHIP(M) and the S-OHIP(M) by mode of administration.
L.-OHIP(M) S-OHIP(M)
Subscale Ni Mail Interview Total NI Mail interview Total
(N=143) (N=71) (N=214) (N=148) (N=55) (N=203)
Functional Limitation 6 0.77 0.73 0.76 ee Physical Pain 7 0.75 0.66 0.72
Psychologica! Discomfort |6 0.85 0.80 0.84
Physical Disability 9 0.88 0.84 0.87
Psychological Disability 6 0.88 0.73 0.86
Social Disability 5 0.83 0.73 0.84
Handicap 6 0.82 0.66 0.78
Scale 45 0.96 0.93 0.95 14 0.91 0.80 0.89 Note: NI = number of items
Table 5.21 shows the Cronbach’s alpha values by age groups. The mean age for the
respondents completing the L-OHIP(M) was 25.4 (sd 4.8) for the 18 to 34 years old group and
45.5 (sd 11.1) for the 35 years old and older group. For the S-OHIP(M) respondents, the mean

137
age was 26.1 (sd 5.2) for the 18 to 34 years old group and 48.5 (sd 11.5) for the 35 years old and
older group. Cronbach’s alpha values for the scale - both L-OHIP(M) and S-OHIP(M) - were
shown to have excellent internal consistency in both agegroups. For respondents aged 35 and
above who completed the L-OHIP(M), the Cronbach’s alpha values ranged from 0.72 to 0.88,
and indicated good internal consistency. However, for the 18-34 year old agegroup, the
handicap subscale showed lower Cronbach’s alpha values (less then 0.60).
Table 5.21. Internal consistency for the L-OHIP(M) and the S-OHIP(M) by agegroup.
L-OHIP(M) S-OHIP(M)
Subscale Agegroup Agegroup
NI 18-34 35+ NI 18-34 35+
(N=65) (N=149) (N=86) (N=117)
Functional Limitation 6 0.68 0.77
Physical Pain 7 0.73 0.72
Psychological Discomfort 6 0.82 0.84
Physical Disability 9 0.80 0.88
Psychological Disability 6 0.83 0.87
Social Disability 5 0.76 0.82
Handicap 6 0.56 0.82 :
Scale 45 0.94 09 | 14 088 0.90
Note: NI = number of items
5.6.5.2) Test-retest
A total of 71 and 73 respondents completed the L-OHIP(M) and the S-OHIP(M), respectively,
for the second time. For the L-OHIP(M), 42 respondents completed the mail questionnaire and
29 respondents were re-interviewed. For the S-OHIP(M), 49 respondents completed the mail
questionnaire and 24 respondents were re-interviewed (Table 5.22)

138
Table 5.22. Number of respondents who completed the questionnaire for the second time.
Mail interview Total
L-OHIP(M) 42 29 71
S-OHIP(M) 49 24 73
Table 5.23 shows the characteristics of the respondents. There was a higher proportion
of respondents in the younger adult group (aged 18-39 years old) in the S-OHIP(M) sample than
in the L-OHIP(M) sample. The L-OHIP(M) sample had three more respondents with no formal
education than the S-OHIP(M) sample. The distributions in terms of gender and ethnicity for
both samples were similar, with a higher proportion of female and Malay in both samples.
Table 5.23. Respondents’ characteristics — Test- Retest.
L-OHIP(M) S-OHIP(M Characteristics Original Retest Original Retest
(N=214) (N=71) (N=203) (N=73) n(%) n(%) n(%) n(%)
Agegroup (year-old): 18-39 91 (42.5) 35 (49.3) 114 (56.2) 46 (63.0) 40 — 59 94 (43.9) 29 (40.8) 68 (33.5) 22 (30.1) 60+ 29 (13.6) 7 (9.9) 21 (10.3) 5 (6.8)
Gender: Male 96 (44.9) 29 (40.8) 89 (43.8) 31 (42.5) Female 118 (55.71) 42 (59.2) 114 (56.2) 42 (57.5)
Ethnic: Malay 423 (57.5) 48 (67.6) 424 (61.1) 49 (67.1) Chinese 58 (27.1) 17 (23.9) 49 (24.1) 18 (24.7) indian 25 (11.7) 3 (4.2) 23 (11.3) 5 (6.8) Others 8 (3.7) 3 (4.2) 7 (3.4) 1 (1.4)
Level of education: No formal education 25 (11.7) 6 (8.5) 14 (6.9) 3 (4.1) Primary Schooi 38 (17.8) 41 (15.5) 35 (17.2) 11 (15.1) Secondary School 117 (54.7) 41 (57.7) 109 (53.7) 45 (61.6) College 14 (6.5) 5 (7.0) 20 (9.9) 8 (11.0) University 20 (9.3) 8 (11.3) 25 (12.3) 6 (8.2)

139
To assess the stability of the instrument, the Intraclass Correlation Coefficient (ICC) was
calculated for the overall scale and seven subscales. The results are shown in Table 5.24. For the
L-OHIP(M), the overall ICC ranged from 0.67 to 0.80 in seven subscales, whereas the S-
OHIP(M) ranged from 0.76 to 0.86. Overall, the short form of the questionnaire yielded better
results than the long form of the questionnaire.
Table 5.24. intraclass correlation coefficient by mode of administration.
L-OHIP(M) S-OHIP(M) Subscale Both Mail interview Both Mail Interview
(N=71) = (n=42) (n=29) (N=73) (n=49) (n=24)
Functional Limitation 0.79 0.79 0.79 0.78 0.79 0.75
Physical Pain 0.79 0.78 0.81 0.76 0.78 0.73
Psychological Discomfort 0.67 0.64 0.74 0.76 0.79 0.72
Physical Disability 0.71 0.71 0.73 0.88 0.91 0.82
Psychological Disability 0.72 0.75 0.59 0.81 0.84 0.71
Social Disability 0.77 0.84 0.63 0.76 0.78 0.45
Handicap 0.80 0.75 0.84 0.86 0.90 0.70
Scale 0.79 0.76 0.84 0.91 0.92 0.91
Table 5.25 shows the ICC values by age group. In general, the ICC values were more
than 0.7, indicating a good to excellent reliability. Psychological discomfort and physical
disability subscales of the L-OHIP(M) and the social disability subscale of the S-OHIP(M) had
an ICC lower than 0.7; however, all had an ICC above 0.6. The ICC value for the overall scale
was higher in the younger age group compared to the older adults for the L-OHIP(M), and vice
versa for the S-OHIP(M).

140
Tabie 5.25. intraclass correlation coefficient by agegroup
L-OHIP(M) S-OHIP(M)
Subscale Agegroup Agegroup
18-34 35+ 18-34 35+
(N=29) (N=42) (N=34) (N=39)
Functional Limitation 0.70 0.77 0.74 0.90
Physical Pain 0.73 0.83 0.71 0.79
Psychological Discomfort 0.74 0.64 0.67 0.82
Physical Disability 0.83 0.66 0.77 0.94
Psychological Disability 0.73 0.71 0.84 0.81
Social Disability 0.85 0.73 0.82 0.67
Handicap 0.77 0.78 0.88 0.85
Scale 0.85 0.75 0.84 0.95
5.6.6) Validity
5.6.6.1) Convergent Construct Validity.
It was observed that the mean score of the L-OHIP(M) increased as the respondents’ perceived
oral health status changed from good to poor (Table 5.26). It was also observed that there was a
significantly positive correlation between the L-OHIP(M) score (scale and all seven subscales)
and self-perceived oral health. This supported the construct validity whereby the greater the
impact on the quality of life, the poorer the perceived oral health status.

i4i
Tabie 5.26. Mean ADD-Scores and Spearman’s rank correlation coefficients for the L-OHIP(M)
Mean ADD-Score (SD)
Subscale Very good Good Fair Poor rho
(n=2) (n=103) (n=96) (n=6)
Functional Limitation 3.00 (4.24) 2.98 (3.60) 5.74 (3.97) 9.67 (1.21) 0.433*
Physical Pain 6.50 (9.79) 4.77 (3.57) 7.18 (3.87) 10.33 (1.75) 0.364*
Psychological Discomfort 5.00 (7.07) 3.53 (3.63) 6.91 (4.60) 12.17 (3.19) 0.443*
Physical Disability 6.00 (8.49) 3.21 (4.78) 6.28 (5.63) 12.50 (4.42) 0.379*
Psychological Disability 5.00 (7.07) 1.89 (2.89) 4.28 (4.15) 7.33 (4.08) 0.379*
Social Disability 2.50 (3.54) 0.83 (1.87) 1.67 (2.41) 3.17 (4.02) 0.239*
Handicap 4.00 (5.66) 4.40 (2.06) 3.34 (3.37) 5.33 (3.01) 0.361*
Scaie 32.00 (45.25) 18.61 (18.02) | 35.46 (23.37) | 60.50 (13.20) | 0.469*
* p-value < 0.001
A similar finding was also observed when the S-OHIP(M) was used. The score increased
as respondents’ perceived oral health status changed from good to poor (Table 5.27). This
significantly positive correlation indicates that there is a relationship between the two related
measures. This observation provides evidence of construct validity.
Table 5.27. Mean ADD-Scores and Spearman’s rank correlation
coefficients for the S-OHIP(M)
Perceived oral N Mean ADD-score rho
health status
Very good 11 2.27 (2.37)
Good 78 7.11 (5.27) 0.518*
Fair 107 13.56 (8.58)
Poor 7 27.86 (11.39)
p-value < 0.001

142
5.6.6.2) Discriminative Construct Validity
Table 5.28 shows the mean score of the L-OHIP(M) by global rating of perceived treatment
need and satisfaction with oral health. Those respondents who reported that they did not need
dental treatment and were satisfied with their oral health had a lower score than those who
perceived they required treatment and were not satisfied with their oral health. These differences
were statistically significant.
Table 5.28. L-OHIP mean score by perceived dental treatment need and satisfaction with orai
health.
Global rating N ADD Score SC Score Mean (SD) Mean (SD)
Perceived dental treatment need
Need treatment 135 33.45 (23.96) 3.01 (5.03) Do not need treatment 75 16.25 (16.37) 1.32 (2.89)
‘p= 0.000 "p= 0.001
Satisfaction with oral health
Yes 126 19.33 (17.70) 4.43 (3.32) No 84 39.08 (24.72) 3.83 (5.39)
"p= 0.000 "p= 0.000
'Mann-Whitney test.
Table 5.29 shows the S-OHIP(M) mean scores of perceived dental treatment need and
satisfaction with oral health. Respondents who perceived a need for dental treatment and did not
feel satisfied with their oral health had significantly higher S-OHIP(M) scores for both ADD
and SC scores.

143
Table 5.29. S-OHIP mean score by perceived dental treatment need and satisfaction with oral
health.
Global rating N ADD Score SC Score Mean (SD) Mean (SD)
Perceived dental! treatment need
Need treatment 443 13.06 ($.00) 1.14 (2.25) Do not need treatment 60 5.97 (5.60) 0.35 (0.86)
‘p= 0.000 ‘p= 0.000
Satisfaction with oral health Yes 118 7.31 (5.70) 0.45 (1.07) No 85 16.04 (9.71) 1.99 (2.62)
‘p= 0.000 ‘p= 0.000
Mann-Whitney test,
Table 5.30 shows the mean score by dental status of the L-OHIP(M) for the seven
subscales. However, for the S-OHIP(M), only the mean score for the scale was calculated. The
edentulous respondents had a higher score for both ADD and SC on the L-OHIP(M) scales than
the dentate with dentures and the dentate without dentures. On the other hand, the dentate
without dentures had the lowest score for both ADD and SC scores. However, these differences
were not statistically significant. When examined for each of the subscales, there was a
statistically significant difference in scores, both for ADD and SC, between the three groups on
the functional limitation and physical disability subscales.
When the S-OHIP(M) was used, those who were dentate with a denture had a
significantly higher mean ADD score than the edentulous and the dentate without a denture.
However, they had a lower SC score than the other two groups.

bri
JS] SUJO AA -JOYSNAN »
258°0 |
(Z9°Z) LLL
(Z€°1) 760
(60°Z) ZL'L
GZO'O |
(LE LL)
OOOL |
(ZZ) Py'EL
(98°8) 6P'OL
aj29S (
; (o9p=u)
( (09p=u)
pe=u pe=u)
enjea (g=u)
ainjuep
aunjuep eniea
(g=u) einjuep
sanjuep
~d, eyejuepy
UIA 9]e]U8Q
ou 9]e8]U8q
-d, eyejuepg
UPA 872]U8G
ou ajejueq
(IN)dIHO-S
(ag) e100s
9s ueeW
(as) e1095
Gay ues
6910 |
(L8°9) ELS
(pe's) 28°Z
(S9'&) £0°%
Zo
| (ozo)
ze°8e |
(9E°Sz) r8'0E
|
(6g°0z) L9°Sz
aje9g
geo |
(6G°0) £70
(¢¢°0) 910
(L¥'0) 80°0
2190 (Lay)
ebe (gL'€)
ee°c (GL°Z)
622 deolpuey
9so'0 |
(9S°0) 0z'0
(€€'0) 90'0
026'0 (6r'€)
£64 (16'L)
80°b (6L'Z)
LZL Ayiqesiq
jeloos
ZEL0 |
(90'L) eS°0
(vZ'0) 9L'0
(850) ZL'0
76c'0 (68°)
ZO'7 (€9'€)
GZ Z
(ye) SZ'e
Ayigesiq jea1Gojoyohsq
€00'0 |
(612) 09'F
(vs) 69°0
(L6°0) LE’O
000°0 (26°9)
196 (4S°9)
29°9 (eS'p)
Lee Ayigesig
jeaisAud
296°0 |
(LLL) 29°0
(Zr L)
620 (LE’L)
L9°0 oso
(L0°¢) 29°9
(L9°S) 29°S
(@'v) GL'S
yojwoosiq |ea1Gojoyohsq
Gz9'0 |
(ZL'L) 09°0
(160) ev'0
(98'0) LEO
Ocr'o (90'r)
Z9°S (19'€)
699 (€0'r)
LOS ule
jealshud
ozo'o |
(6r'b) 224
(60'L) 25°0
(92°0) Z€°0
200'0 (erg)
el 2
(eG'v) 8S
(9r'€) eg'€
uoneywry jeuoyoun4
(A) dIHO1
(0$}=u) (
) Ce)
(67=u) 6p=u
anjea (gp=u)
ainquep
eAnquep enjea
($L=u) einjuep
4nquep
ajeosqns
-d,. ayejuepa
UA
312]U0G ou
ajejueq -d,
ayejusps
UUM aje}UEG
ou ajejueqd
(as) 1098
DS UeaWy
(as) 81095
Gay ueeI
“snjyeys peyusp
Aq (IN)dIHO-S
24} Pue
(IN)dIHO-1 84}
JO Bs00S
UBAI] “OES
B12

145
5.6.7) Comparison of the technical properties of the L-OHIP(M) with the Australian
OHIP(A) and Canadian OHIP(C) data
To establish the measurement equivalence of the L-OHIP(M), a comparison of the technical
properties was made with the Australia data (OHIP(A)). In addition, a comparison was also
made with Canadian data (OHIP(C)). It has to be noted that in both the Australia and the
Canadian OHIP, the evaluation of the properties was done on an elderly population, whereas the
L-OHIP(M) was assessed in a population aged 18 years and above.
Table 5.31 compared the reliability (internal consistency and test-retest) of the L-
OHIP(M) with the OHIP(A) and the OHIP(C). Generally, the internal consistency of the L-
OHIP(M) was better than that of the OHIP(A), especially for the handicap domain. However,
the OHIP(A) had better internal consistency than the L-OHIP(M) for the pain domain. In
contrast, the OHIP(C) had better internal consistency for most of the subscales than the L-
OHIP(M). It has to be noted that the sample size of the Canadian sample was big. In terms of
stability, two subscales of the L-OHIP(M) had an ICC slightly lower than 0.7 compared to the
three subscales of the OHIP(A) that were lower than 0.5. This suggests that the L-OHIP(M) was
a more stable instrument than the OHIP(A).

146
Table 5.31. Comparison of the reliability of the L-OHIP(M) with the OHIP(A) and the OHIP(C)
L-OHIP(M) OHIP(A)' | OHIP(C)* Reliability 18-34 35+ 60+ 50+
(N=65) (N=149) (N=122) | (N=525)
internal Consistency (Cronbach's a ): Functional limitation 0.68 0.77 0.70 0.84
Physical pain 0.73 0.72 0.76 0.81
Psychological discomfort 0.82 0.84 0.77 0.88
Physical disability 0.80 0.88 0.82 0.88
Psychological disability 0.83 0.87 0.83 0.90 Social disability 0.76 0.82 0.73 0.88 Handicap 0.56 0.82 0.37 0.80
Test-retest:
Functional limitation 0.70 0.77 0.77 Not
Physical pain 0.73 0.83 0.42 available Psychological discomfort 0.74 0.64 0.76 Physical disability 0.83 0.66 0.72 Psychological disability 0.73 0.71 0.74 Social disability 0.85 0.73 0.08 Handicap 0.77 0.78 0.48
L-OHIP(M)=Malaysia, OHIP(A)=Australia, OHIP(C)=Canada.
Source: ‘Slade GD, Spencer AJ. Development and evaluation of the Oral Helath Impact Profile. Community
Dental Health 1994; 11:3-11.
’Secondary data from Ontario Study of the Oral Health of Older Adults database.
Construct validity of the L-OHIP(M) was compared with the OHIP(C) by assessing the
ability to distinguish between groups based on related self-reported measures (self-perceived
oral health status and self-perceived treatment needs). As shown in Table 5.32, differences in
mean ranks (DMR) obtained from Mann-Whitney tests indicated that both measurements
discriminate between groups; however, the OHIP(C) performed better in this regard. When the
odds ratio based on median splits was calculated, the L-OHIP(M) seemed to perform marginally
better than the OHIP(C). Since the database of the OHIP(A) could not be accessed, the same
analysis could not be performed on the OHIP(A).

Table 5.32. Comparison of the validity of the OHIP(M) with the OHIP(C)
147
Standardized ADD score Standardized SC score
Construct validity Median Median Malaysia Canada® Malaysia Canada*
Perceived oral health status
Very good/good 7.22 7.14 0.00 0.00 Fair/poor 18.89 16.84 4.44 2.04 p-value 0.000 <0.000 0.000 <0.0001 DMR 55 142 47 85 Odds ratio (good/poor) 5.4 5.2 7.7 2.5
Perceived dental treatment need Need treatment 14.44 13.77 2.22 2.04 Do not need treatment 5.56 7.14 0.00 0.00
p-value 0.000 0.000 0.001 0.000 DMR 52 400 27 64 Odds ratio (no/yes) 3.5 3.2 3.2 2.1
Satisfied with oral health
Yes 8.33 0.00 No 20.00 4.44 p-value 0.000 NA 0.000 NA
DMR 55 44 Odds ratio (yes/no) 49 6.6
p-values: Mann-Whitney tests DMR: difference in mean ranks between categories of grouping variables
Source: “Secondary data from Ontario Study of the Oral Health of Older Adults database.
5.6.8) Establishing functional equivalence
According to the model of equivalence (Herdman et al, 1998), functional equivalence is
achieved when all other types of equivalence in the model have been achieved. Therefore, it can
be claimed that functional equivalence has been achieved in this study since all aspects of
equivalence were established, as summarized below.
1) The semantic equivalence was ensured through a standard process of forward-backward
translation and expert panel assessment.
2) The qualitative interviews with the target population revealed that the way Malaysian
and Australian people conceptualized oral health and quality of life was similar in terms

3)
4)
5)
148
of how oral conditions affect people’s lives. The domains were the same even though
there were few other impacts identified.
Item equivalence was established by recognizing items which were not relevant to the
target population, removing some items which were causing some confusion, and adding
new items that were considered important for the target population.
Operational equivalence in terms of format of the questionnaire, response options and
method of administration were established. The format used has been shown to be
effective since most respondents either in the pretest or the field study returned a
completed questionnaire. The five-point response format can be used for the Malaysian
population. Since most people in Malaysia are literate, a mail questionnaire can be used;
however, the response rate could be compromised as with any other mail study.
Reliability and validity were reassessed and it was found that the L-OHIP(M) was
reliable and valid. It was then compared with the English version (the OHIP(A) and the
OHIP(C)), and it was revealed that the L-OHIP(M) performed equally well as the
OHIP(A) and the OHIP(C).

149
5.7) COMPARISON OF THE REGRESSION S-OHIP(M) WITH THE FREQUENCY
S-OHIP(M)
The original OHIP has a short form that was derived using a regression method. In the present
study, a short form was also developed based on the frequency method. Thus, in order to
compare these two methods, short forms based on regression and frequency were created
utilizing data from the L-OHIP(M), as described in the methodology. An evaluation in terms of
the content, score, reliability and validity of these two forms was conducted.
5.7.1) Content of the two S-OHIP(M)
Table 5.33 lists the 14 items for the regression and frequency forms of the S-OHIP(M). The two
short forms had four items in common: “had painful ulcer”, “felt shy”, “had difficulty carrying
out daily activities”, and “felt less confident of yourself’. The regression-S-OHIP(M) contained
more low frequency items than the frequency-S-OHIP(M). For the former, prevalence ranged
from 6.1 to 30.4 percent while the latter ranged from 4.2 to 55.1 percent. The frequency-S-
OHIP(M) contained seven items of more than 20 percent compared to the regression-S-
OHIP(M), which had only three items.

Table 5.33. ltem content and percent reported “very often”, “often” or “sometimes”
150
Subscale Regression-S-OHIP(M) Frequency-S-OHIP(M)
ltem % ltem %
Functional e Trouble pronouncing 12.6 Difficult chewing any 35.0 limitation wards. foods.
° Felt that foods you eat 30.4 Had bad breath cause | 33.2 have not digesied by dental problem properly.
Physical pain Had pain on the jaw. 16.4 Found it uncomfortable | 28.0 Had painful ulcer in 22.9 to eat any foods.
the mouth. Had painful ulcer in 22.9 the mouth.
Psychological ® Felt shy. 24.3 Felt shy 24.3 discomfort e Felt stressed up 15.9 Felt discomfort due to | 55.1
food stuck.
Physical disability | Been unable to eat your | 18.2 Had to avoid eating 28.5 favorite foods. some foods.
e Had an interrupt meals. | 18.2 Avoided smiling 13.6
Psychological e Been sad. 15.0 Your sleep been 16.8 disability ® Found it difficult to relax | 13.6 disturbed.
Your concentration 13.6 been affected.
Social disability ® Been less tolerant of 6.1 Avoided going out. 4.2 your spouse or family. Had difficulty 7.9
e Had difficulty carrying | 7.9 carrying out daily out daily activities. activities
Handicap e Felt unwell. 12.6 Had to spend a lot of 13.6 ® Feit less confident of 6.4 money.
yourself. Felt less confident of | 6.1 yourself.
Note: same items are bold
5.7.2) Score for both types of the S-OHIPCVY) forms
Table 5.34 shows the scores for both versions of the S-OHIP(M). The frequency-S-OHIP(M)
form had significantly higher scores than the regression-S-OHIP(M). The ADD score for
regression-S-OHIP(M) and frequency-S-OHIP(M) versions were 8.09 and 10.29, respectively.

151
Table 5.34. Mean, median and range of ADD score and SC score
Type of form ADD score SC2-score $C3-score
S-OHIP(M)- Regression Mean(SD) 8.09 (7.44) 0.59 (1.40) 2.20 (2.83) Median 6.0 0.0 1.0
Range 0-41.0 0-14 0-13
S-OHIP(M)- Frequency Mean(SD) 10.29 (7.55) 0.99 (1.56) 3.03 (2.99) Median 9.0 0.0 2.0 Range 0 - 36.0 0-710 0-13
p value* 0.000 0.000 0.000
ADD score=Additive score, SC2 Score=number of items reported as “very often and often”, SC3-score=number of
items reported as “very often, often and sometimes”
* Wilcoxon signed rank test
5.7.3) Technical properties for the two S-OHIP(M) forms.
The technical properties (reliability and validity) for both forms were tested and compared. It
was found that both forms performed equally well, as shown in Table 5.35. Both forms had a
Cronbach’s alpha of more than 0.8, which indicates excellent consistency. Both had similar ICC
values of above 0.7, indicating that both were stable measures.
The scores of both of the short versions were highly correlated with the score of the L-
OHIP(M). This indicates that both of them were able to measure equally well the same construct
as the long version. Construct validity was assessed for both of the S-OHIP(M) forms, showing
that both of them followed the hypothesis as postulated, except in discriminating between
people in terms of their dental status (dentate and edentate). The differences in mean rank,
obtained from the Mann-Whitney test, indicated that the frequency-S-OHIP(M) was marginally
better. Odds ratios based on the median splits also indicated that the frequency-S-OHIP(M) was
marginally better than the regression-S-OHIP(M).

152
Table 5.35. Comparison of the technical properties of the two forms of the S-OHIP(M)
Property §-OHIP(M) - S-OHIP(M) - Regression Frequency
RELIABILITY: Internal consistency 0.89 0.86 Test-retest 0.76 0.77
VALIDITY: Concurrent validity:
Correlation between S-OHIP(M) ADD rho = 0.965 rho = 0.964 Score with L-OHIP(M)45 score *p=0.000 *p=0.000
Convergent vaiidity: Perceived oral health status
Very good (n=2) 12.00 (16.97) 8.00 (11.31) Good (n=103) 5.08 (5.58) 7.00 (6.08) Fair (n=96) 10.46 (7.87) 13.21 (7.56) Poor (n=6) 18.50 (4.59) 20.17 (4.96)
rho= 0.440,*p=0.000 rho=0.491,*p=0.000 DMR* 51 57 Odds ratio 6.0 5.1
Discriminative validity: Perceived dental treatment need
Do not treatment (n=75) 4.41 (5.22) 6.36 (5.59) Need treatment (n=135) 40.06 (7.77) 12.44 (7.74)
‘p=0.000 ‘p=0.000 DMR 54 53 Odds ratio 3.5 4.1
Satisfaction with oral heaith
Yes (n=126) 5.56 (5.95) 7.44 (5.92) No (n=84) 11.65 (7.91) 14.38 (7.78)
‘p=0.000 ‘p=0.000 DMR 54 57 Odds ratio 46 5.6
Dental Status Deniate no denture 7.63 (6.95) 9.77 (7.10) Dentate with denture 8.43 (7.82) 10.98 (7.89) Edentate 11.60 (10.10) 13.20 (10.20)
*p =0.270 *p=0.389 DMR* 10 11 Odds ratio 1.18 1.48
* Snearman’s correlation, ‘Mann-Whitney test ,’Kruskal-Wallis test
# Categories were pooled to very good/good vs fair/poor
£ Categories were pooled to Dentate no denture vs dentate with denture/edentate
§ 95% confident interval includes 1
DMR-differences in mean rank.

153
5.8) THE IMPACT OF ORAL CONDITIONS ON THE QUALITY OF LIFE OF A
MALAYSIAN ADULT POPULATION.
The data of the L-OHIP(M) was used to described the impact of oral conditions on the quality of
life of the adult population of Malaysia and to explore variation by age group, gender, ethnicity,
level of education, and dental status.
Overall, slightly more than fifty percent of the sample had at least one impact reported as
either “very often” or “often” (Table 5.36). This suggests that a significant number of people in
this study experienced the impact on a relatively frequent basis. More than one third of the
sample frequently experienced some form of psychological discomfort due to poor oral health.
More than one quarter were bothered by the functional consequences of oral disorders and oral
pain.
Table 5.36. Percent responding “very often” or “often” to one
or more items in each subscale.
Subscale % Functional limitation 27.1
Physical pain 22.9 Psychological discomfort 37.4 Physical disability 18.7
Psychological disability 12.1
Social disability 3.7 Handicap 7A
Scale 52.8
Table 5.37 shows the response to each of the 45 OHIP items organized into seven
subscales. The response categories were reduced to three: 1) “very often” or “often”, 2)
“sometimes”, and 3) “once in a while” or “never”.

154
Table 5.37. Response to OHIP(M)
Very Sometimes Once ina often/often while/Never
“Functional. Limitation OE a iis Oe ma Difficult chewing any foods 12.1 65.0 Trouble pronouncing words 1.9 10.7 87.4 Felt that appearance has been affected 4.2 12.6 83.2 Had bad breath cause by dental problem 10.7 22.4 66.8 Felt that foods you eat have not digested properly. 12.1 18.2 69.6 Felt denture was loose 7.0 _ 5.1 87.9
“Physical Pain 0 0 ee ee EE ES a
Had pain on the jaw 3.3 13.1 83.6 Had headache due to dental problem 2.8 12.6 84.6 Had sensitive teeth 11.2 26.6 62.1 Had toothache 47 23.8 71.5 Had painful gums 3.7 16.8 79.4 Found it uncomfortable to eat any foods 9.3 18.7 72.0 Had painful ulcer in the mouth 4.7 — 18.2
“Psychological Discomfort . « Me BR SAR ah URS Felt uncomfortable with your dentures 4.7 4.2 91.1 Felt worried 16.8 21.0 62.1 Felt discomfort due to food stuck. 30.4 24.8 44.9 Felt shy 6.1 18.2 75.7 Felt uncomfortable with your appearance 6.5 14.5 79.0 Felt stressed up 5.1, 10.7 84.1 Physical Disability Lo. So fees Speech been unclear 4.2 5.6 90.2
People misunderstood some of your words 1.9 6.5 91.6 Felt food less tasty 4.2 10.7 85.0 Been unable to brush your teeth properly 7.5 10.3 82.2 Had to avoid eating some foods 10.7 17.8 715 Been unable to eat your favorite foods 5.6 12.6 81.8 Been unable to eat with your dentures 4.2 3.3 92.5 Avoided smiling A7 8.9 86.4 Had an interrupt meals . - 6.1 _ 12.4 _ 81.8 Psychological Disability ee ' Ee CO MS ge 8 a UIE ag Your sleep been disturbed 1.4 15.4 83.2
Been sad 7.0 7.9 85.0 Found it difficult to relax 2.3 11.2 86.4 Felt depressed 2.3 8.4 89.3 Your concentration been affected 1.9 11.7 86.4 Felt a loss of appetite to eat 47 13.6 818° Social Disability Ce SOR Le ae ei Tg Avoided going out 0.9 3.3 95.8 Been less tolerant of your spouse or family 0.5 5.6 93.9 Unable to mix around with other people 1.4 4,2 94.4
Got angry easily. 1.9 5.1 93.0 Had difficulty carrying out daily activities 0.9 7.0 92.1
. Handicap no CE epn Rs Ty SNS oe Ee Uta gE Felt unwell 2.3 10.3 87.4 Had to spend a lot of money 3.7 9.8 86.4 Felt less happy to be in the company of others 1.4 7.3 90.7
Felt that life in general was less satisfying 1.4 7.9 90.7
Felt less confident of yourself 14 47 93.9 Been unable to work fo your full capacity 0.9 6.4 93.0

155
Less than ten percent of the respondents responded “very often” or “often” for most of
the items except “felt discomfort due to food stuck” (30.4%), “felt worried” (16.8%), “difficulty
chewing any food” (12.1%), “felt food has not digested properly” (12.1%), “had sensitive teeth”
(11.2%), “had bad breath” (10.7%) and “avoid eating certain food” (10.7%). Of these seven
items, three belong to the functional limitation, two to the psychological discomfort and one
each to the pain and the physical disability scales.
Table 5.38 shows the percentage of respondents who answered “very often” or “often” to
one or more items in each subscale, as well the overall scores by sociodemographic
characteristics. The middle agegroup (40-59 years old) reported more impact than the younger
agegroup (18-39 years old) and older agegroup (60+ years old). More than one third of the
middle and older adults were bothered with the functional consequences of oral conditions,
compared to approximately one sixth of the younger adults. A higher proportion of middle and
older adults reported having more physical and psychological disabilities due to oral conditions
than younger adults. The younger and middle adults were more likely to have experienced some
form of psychological discomfort due to poor oral health. However, it was observed that there
was no big difference in terms of oral pain, social disability and handicap between age groups.
Both genders experienced the same amount of impact on their quality of life due to oral
conditions. When comparing among the three main ethnic groups in Malaysia, the results show
that the quality of life of Indians was most affected by poor oral health. Slightly more than
seventy percent of Indians reported having at least one of the impacts on a frequent basis. More
than fifty percent of Indians experienced some psychological discomfort due to oral conditions
as compared to only 25 percent of Malays and Chinese. Generally, Malays and Chinese had
similar impacts on all dimensions of quality of life. However, Chinese respondents experienced
more handicaps due to poor oral condition than the Malay respondents.

156
Those who had tertiary education (college or higher) reported more impacts than those
who had a lower level of education (secondary and lower). It was observed that more than one
third of the respondents having a secondary or higher education experienced some psychological
discomfort.
Almost seventy percent of the edentate respondents reported that they had at least one
impact “very often” or “often”. About one half of the edentulous respondents experienced
problems “very often” or “often” in the areas of functional limitation and physical disability.

LSI
(GL=U) ayeyuepy
: (6p=u)
299 0°02
eel 19%
L6y eee
6'te ee
@INJUSP UM
a}e]U8q O'S
ZOL 00
Zs vt
L9€ G9%
G92 (OS$L=u)
0%
eg Ov
OZ Lvl
o8e Le
Lye SiNjUSp
OU e}e]UEq
:snjeys je}ueq
9°8S 62
6z 6S
bt Ze
LL Geez
(pe=U) seyBiy
gy eBayjop ELS
v6 9%
Let SLL
Lav v2
Le? (ZL L=u)
Arepuooceg ves
€9 €9
Leb g'eZ
0'2z 9°8z
G'9e (€g=U)
JeMo] 9g A
le
UOHEONP
JO jeAa"]
9°S9 00
00 00
0'Sz Gle
GZL 0°SZ
(g=u) 4810
Oe
091 O'9L
0'8z oze
09S ozE
O'9€ (¢Z=u)
uelpuy eer
€ OL 0'0
98 0'6L
Gre v2
O6L (gg=U)
eseulyD v0g
6
ee vt
vSh ose
O27 £62
(eZ) =u) Aejey)
ou
zs G8
ve Z OL
6 OL O'6e
ZL
0'8z (QL
)=u) sjewey
Les €9
ov QFE
802 pse
0'Sz 0'92
(96=U) 9/eIN
i -depues)
© 8r 69
ve SEL
92Z L102
L0Z ole
(6z=U)+09 v'9S
vl Ze
6'r1L or
Gly Llé
O've (v6=U)6S-OP
g'0g Ll
VV 88
Z El G'8e
ZL
GOL (L6=U)
6E-81L :dnowbaby
Ayyiqesip Ayiqesip
Aynqesip HOJWUODSIP
ujed UOHe HUT
snjejs je}U8q
ayeos desipuey
jelsos jeaiBojoyoAsyg
jeaisAud jearBojoysAsy
= jesisAug
jeuonoung
jaiudesGowapols0sg
snjels
je}usp pue
soiyesBowapolsos
Aq sajeasqns
yore ul
suey! SJOLWU
JO BUO
O} , UdYO,,
JO ,,Uayo
Aiaa,, Buipuodsas
Jusdied "ge's
aiqeL

158
5.9) COMPARISON OF THE ORAL HEALTH-RELATED QUALITY OF LIFE
BETWEEN THE MALAYSIAN POPULATION AND THE CANADIAN
POPULATION AGED 50 AND ABOVE.
Table 5.39 shows the background of the Malaysian and Canadian data. The Malaysian data were
collected in 2002, whereas the Canadian data were collected in 1991 and 1992. For the purpose
of this comparison, the age of the respondents was standardized to 50 years old and above. The
total sample size for the Malaysian sample was 56 and for the Canadian sample was 519. The
Malaysian sample had a higher proportion of male respondents compared to the Canadian
sample. Both samples had a higher proportion of dentate respondents than edentulous.
Table 5.39. Background of the Malaysian and Canadian data
Malaysia Canada
Year of data collection 2002 1991/92
Total sample size 56 519
Gender
Male 29 (51.8) 227 (43.7)
Female 27 (48.2) 292 (56.3)
Dental status
Dentate 44 (78.6) 428 (82.5)
Edentulous 12 1.4) 91 (17.5)
(percent)
Figure 5.2 compares the impacts of oral health on the quality of life between a Malaysian
population and a Canadian population aged 50 and above. Overall, the Malaysian sample had a
slightly higher impact compared to the Canadian sample. Generally, the Malaysian sample had
higher impacts on all dimensions of quality of life than the Canadian sample. Functional
consequences were most affected by the oral health conditions for both samples. Nevertheless, It

159
was observed that physical aspects were more affected than social aspects of life in both
samples.
60 “%o
f Malaysia 50
Canada
EE PSUS BES ie SS Functional Psychological Physical Psychological Social Handicap Scale
Limitation discomfort disability disability disability Score
Figure 5.2. Comparison of the percent responding “very often” or “often”
to one or more items in each subscale between the Malaysian sample and the Canadian sample
Table 5.40 compares the oral health impact on the quality of life between the two
populations by gender. Generally, both genders in the Malaysian sample reported more impact
than in the Canadian sample. The male respondents had a slightly higher impact than the female
respondents in the Malaysian sample, whereas in the Canadian sample the female respondents
reported slightly more impacts than the male respondents. The female respondents of the
Canadian sample reported higher impacts than the male respondents on all subscales except
functional limitation. In the Malaysian sample, the male respondents reported higher impacts on
pain, psychological discomfort, and psychological disability, whereas the female respondents

160
reported more impacts on functional limitation, physical disability, social disability, and
handicap.
Table 5.40. Comparison of the percent responding “very often” or “often” to one
or more items in each subscale between the Malaysian sample and the Canadian
sample by gender
Malaysia Canada
Subscales Male Female Male Female
N=29 N=27 N=227 N=292
% % % %
Functional limitation 37.9 44.4 38.8 38.0
Physical pain 27.6 18.5 15.0 19.9
Psychological discomfort 44.8 25.9 10.1 14.0
Physical disability 27.6 29.6 9.7 10.6
Psychological disability 24.1 11.1 3.4 5.8
Social disability 3.4 3.7 1.8 2.1
Handicap 6.9 14.8 3.5 7.2
Scale 55.2 51.9 44.1 45.5
Table 5.41 compares the impact of oral health on the quality of life between the two
populations by dental status. Overall, edentulous respondents in both populations had a higher
impact compared to dentate respondents. It was also observed that the edentulous respondents
had a higher score on almost all domains of quality of life for both samples.

161
Table 5.41. Comparison of the percent responding “very often” or “often” to one
or more items in each subscale between the Malaysian sample and the Canadian
sample by dental status
Malaysia Canada
Subscales Dentate | Edentulous | Dentate | Edentulous
N=44 N=12 N=428 N=91
% % % %
Functional limitation 36.4 58.3 37.4 42.9
Physical pain 22.7 25.0 15.9 26.4
Psychological discomfort 36.4 33.3 11.2 17.6
Physical disability 25.0 41.7 9.7 10.6
Psychological disability 15.9 25.0 3.0 12.1
Social disability 2.3 8.3 0.9 6.6
Handicap 6.8 25.0 4.9 8.8
Scale 50.0 66.7 43.7 50.5
CHAPTER 6
DISCUSSION AND CONCLUSION
The main aim of this project was to develop an OHRQoL measure for a Malaysian adult
population aged 18 and above. The reason for choosing 18 years old as the cut-off point is
because 18 year olds have completed secondary school and are beginning to enter work force or
the higher education system. Thus, they are no longer under the systematic school oral health
care program, which means that they have to obtain oral health care themselves.
Since there are a number of OHRQoL measures that have been developed and tested, the
investigator decided to adapt one of those measures rather than to develop a new one. This
would not only facilitate the development of the measure, but also reduce the need for
developing new measures that have the same purpose. In addition, it would also allow some
direct comparison to be made across cultures.
The review of the OHRQoL measures revealed that the Oral Health Impact Profile
(OHIP) is the most sophisticated measure currently available. Since the items were selected
from an interview with the patients, the items included in the instrument could be considered to
be important to the patient. As such, to a certain extent, items included in this measure not only
capture aspects of life that have been affected but also the importance of these aspects to the
respondents. The OHIP’s psychometric properties have been assessed in several countries. In
addition, it covers a broad range of oral health-related quality of life domains. Thus, the OHIP
was the most suitable measure to be adapted for the Malaysian population.
According to Hunt (1995), if the adaptation of a measure to another language or culture
is performed with no intention to carry out a cross-cultural comparison, then the original
measure is used merely as a template or guide for the production of a culturally appropriate set
162
163
of items. However, if the intention of adaptation is to compare or combine data cross-culturally,
then it is fraught with difficulties of a conceptual, technical and ethical nature. Although the
main aim of this project was not intended to carry out cross-cultural comparison, it is desirable
to be able to do so. Therefore, proper adaptation was carried out based on the framework
proposed by Herdman et al (1998). Herdman et al’s framework provides the clearest way to
adapt a measure. The concept of equivalence is a fundamental aspect in cross-cultural
adaptation, as discussed in the literature review (page 71). Herdman’s model proposes that six
types of equivalence need to be assessed. Thus, to establish these equivalences, a multistage
study was designed as described in the methodology section of this thesis.
6.1) STUDY LIMITATIONS
As in any study, the present study has several limitations. Thus, interpretation of the data was
based on these limitations.
Translation and adaptation: Some researchers recommended that the translators translate to
their mother tongue (Beaton et al, 2000; Guillemin et al, 1993) and be familiar with both
cultures (Carlson, 2000; Leplege and Verdier, 1995; Geisinger, 1994). However, it was
extremely difficult to find translators who meet these criteria for this study. Nevertheless, the
involvement of the evaluators - who are English-speaking people - in the process of translation
increased the confidence in the quality of the translation.
Another limitation in the process of adaptation in this study was that the allocation of the
two methods of administration of the questionnaire was not random. Ideally, a crossover study
design would have been more appropriate. Thus, any comparison between these two modes of
administration must be interpreted within this limitation.

164
Comparison between two short forms: Ideally, to compare two different types of measure, these
measures need to be administered to the same sample independently. In this study we compared
two different forms of short version of OHIP(M). However, we utilized an existing long form of
OHIP(M) data to create and compare these two measures. As such, this comparison entails some
limitations.
Comparison between two cultures: The data used to compare the impact of oral conditions
between Malaysian and Canadian populations were obtained from two separate studies
conducted independently at different time using different methods. Thus, the comparison must
be treated with caution.
6.2) TRANSLATION
The decision to translate OHIP into Malay language was made because the Malay language is
the national language of Malaysia. Thus, it was assumed that all Malaysians understand the
language. However, it must be noted that the Malay language itself is not homogenous in nature.
Although there is a standard Malay language, there are several Malay dialects spoken
throughout Malaysia. For example, the word “segan” has inconsistencies in meaning from
dialect to dialect, as discussed in the result section (see page 114). Hence, one of the problems in
the process of translation of the OHIP into Malay is to ensure that no particular dialect word is
used, but at the same time to make sure that all words will be understood by all people.
Although a dictionary is a valuable resource, its language is often not the language of the people
(Sechrest et al, 1972). For example, the word “sogok” is an equivalent word for “self conscious”
given by a dictionary but its use is very limited among the people in Malaysia. Thus, such words
should be avoided.

165
There are several ways to translate an existing HRQoL measure as discussed in the
literature review (see page 78). In this study, a forward-backward translation technique was
applied since this technique had been widely used and had been empirically proven to be
effective in achieving semantic equivalence (Kim and Lim, 1999). In this study, such a process
allowed the original developer and other evaluator, whom are English speakers, to be directly
involved in the process of ensuring that the translation achieved semantic equivalence. As such,
there is confidence that the translation achieved an acceptable semantic equivalence.
There were some difficulties encountered in the process of translation, as discussed in
the result section (see page 113). Some of these difficulties could be due to the way in which the
original questionnaire was written. According to the developer of the original questionnaire, the
questions were written based on the patients’ own language (communication via email). Hence,
some of the items used colloquial words (for example “sore jaw”), which were difficult to
translate into Malay language. One of the suggestions put forward by Brislin et al (1973) to help
in writing translatable English is to avoid metaphors and colloquialisms. Perhaps the original
questionnaire was developed with no expectation that it would be translated to other languages.
Because the focus of translation is to transfer meaning from the source language to the target
language, the translator first needs to understand the meaning of the statement before it can be
translated into the target language (Esposito, 2001). Thus techniques such as “‘decentering” and
“explain around” were used (Brislin, 1973) and have been shown to be helpful.
It is evident that the socio-emotional items were the most difficult items to translate. In
some cases, two different levels of emotional states in the English language were translated into
the same word in the Malay language, for example, “miserable” and “upset”. Limited
vocabularies for describing emotional states reflect the culture of the Malay society, which
could be considered to be a collectivist society. A similar situation was also observed by Hunt et

166
al (1986). Hunt stated that “the socio-emotional items are likely to cause the most trouble and
items as what are perhaps more universal experiences, like pain, sleep and impaired physical
mobility, the least.” Nevertheless, most of the items in the original questionnaire were
considered by the translators to be easy to translate.
6.3) CULTURAL ADAPTATION
Translation alone is not sufficient to ensure the validity of the measurement, since culture has a
significant impact on the way concepts are expressed. Thus, the measure also needs to be
adapted to the culture and lifestyle of the target population, as discussed in the literature review
(page 82).
In this study, qualitative interviews with patients were conducted to assess conceptual
and items equivalence. A purposive sample was used. It has to be noted that the purpose of
sampling was not to get a representative sample. Rather, it was based on getting a broad view on
how oral diseases or disorders affect people’s lives across age groups and ethnicity in Malaysia.
Although Malaysian society is heterogeneous with people of different cultures and religious
backgrounds, they have integrated into the so called “Malaysian” culture. Thus, language in
particular is no longer a barrier between different ethnic groups in Malaysia (Jaafar, 1995). As
such, language was not a barrier in the interviews.
From the interview, we found that most of the impacts of oral diseases or disorders were
similar across ethnicity in Malaysia’s population. We also observed that some impacts were
more commonly reported by the younger adults than the older adults, for example, “self-
confident”.
It was concluded that the way Malaysians and Australians conceptualize oral health was
similar in terms of the impact of oral disease on daily activities. It has to be noted that the items

167
of the original questionnaire were selected from a pool of items, derived from interviews with an
elderly population. Thus, items such as “self confident”, which were found to be important
among the younger adults, were not included in the original questionnaire. Since this adapted
questionnaire will be used in an adult population (18 years old and above), such items were
included.
In order to make the content culturally sensitive to the target population some items were
deleted, rephrased or added, as discussed in the result section (page 122). However, most of the
items were retained because of their universality, at least for these two populations (Malaysian
and Australian), as shown from the results of the qualitative study. A total of 45 questions were
finally included in the OHIP(M), compared to 49 questions in the original questionnaire.
Because of the cost incurred in administering a long questionnaire, most measures develop a
shorter version. Thus, based on the qualitative interviews, a short version was also developed,
containing only 14 items.
It is recommended to pretest adapted questionnaires to assess the face validity. This
ensures that the level of language used is appropriate to the target population (Leplége and
Verdier, 1995). In addition, it also enables investigators to establish whether or not respondents
understand the concept or task (Collins, 2003). A convenience sample of twenty participants
was used to assess face validity for this study. Aday (1996) mentioned that a nonprobability
sample is appropriate to be used in the early stages of designing a standardized survey. In this
study, a small sample size was used at this stage because it was qualitative in nature. This pre-
testing demonstrated that the format, instruction and language used were appropriate across
ethnicity and agegroup for the target population.
One important aspect of a standardized questionnaire is the response format. There are
several types of response format available, such as Visual Analog Scale, Likert Scale, etc. Some

168
of them are too complicated to be used in some population groups. Thus, it is important to
assess the suitability of the response format for the target population. A non-appropriate
response format will result in either a loss of sensitivity or will create a “noise” on the
instrument, causing a response-bias. In this study, the suitability of the five-point frequency
Likert scale response format was assessed. Because Malaysian people are very moderate when
providing responses, it is necessary to test whether or not they use the entire spectrum of
options. However, in this study it was observed that the response format could be used in the
Malaysian adult population. Perhaps, the questions in the questionnaire were not threatening:
there is evidence that the way that people respond to a question will depend on how threatening
they perceive the question to be (Aday, 1996).
Field testing was conducted in order to assess the suitability of the mode of
administration and to re-establish the psychometric properties of the adapted OHIP. Because the
intention was to use this measure on the general Malaysian population, a population-based
sample was used to test its psychometric properties. With the time and resource constraints, the
sample was limited only to one state of Malaysia, namely Selangor. Nevertheless, the sample
was selected based on probability sampling. Thus, the results could be generalized to Selangor
and, to a certain extent, to Peninsular Malaysia. However, it could not be generalized to the East
Malaysia population because their culture and lifestyle is quite different from the population of
Peninsular Malaysia. In addition, preparation of the questionnaire was based only on the main
ethnic groups of Peninsular Malaysia, namely Malay, Chinese and Indian. The main ethnic
group of East Malaysia was not included.
As mentioned in the methodology, the sample for this stage was obtained from the
NOHSA, where a complex design was used; this has resulted in what is known as “design
effect”. To overcome this problem, the Stata statistical program was used to deal with the design

169
effect. Nevertheless, according to Dr. Slade’s opinion (personal communication), for the
purpose of testing reliability and validity, a complex design could be treated as a simple random
sample since these tests only show correlations or associations existing within the sample - not
within the population. However, this effect becomes important and has to be taken into account
when estimating the means or proportion of the population.
The question of how this questionnaire was going to be administered was re-addressed.
There are several methods of administering questionnaires. The methods commonly used are
face-to-face interviews, telephone interviews and by mail. Computer administered
questionnaires have recently become popular. Most researchers are concerned with obtaining a
high response rate because it is an indirect indication of the extent of a non-response bias. It has
been shown that some methods of administration are superior to others in terms of getting a high
response rate; however, the cost is higher.
In this study, only two methods of administration were assessed: a face-to-face interview
and a mail questionnaire. Although the original OHIP could be administered through a
telephone interview, it is not appropriate for use in Malaysia at this time because not all
households have a telephone. Since the original questionnaire was not designed for computer-
assisted administration, this method was not assessed in this study. To assess this, the sample
was divided into two groups: mail and interviews. However, it was not randomly allocated due
to administrative reasons as mentioned earlier. As such, the comparison between these two
modes of administration may be biased. Thus, interpretation of the results was made within this
limitation.
In most surveys, mail is preferred over interviews and other methods mainly because it is
cheaper. However, mail administration is not appropriate when there is a low literacy rate. In the
case of the Malaysian population, statistics have shown that the literacy rate is high (see

170
introduction page 6). Despite the high literacy rate in Malaysia, the response rate for mail
questionnaire in this study was low (slightly lower than fifty percent) even when respondents
were given two reminders. Perhaps the response rate could have been improved by increasing
the number of reminders. However, Locker and Miller (1994a) concluded that the four-wave
design tends to be inefficient, with relatively few respondents responding to the fourth mailing.
It also has to be noted that a low response rate could have been due partly to using a sample
which had been used by several other studies prior to the present study. Furthermore, due to
financial constraints this study did not offer any incentives for participation. Another reason
could be due to using only a Malay language questionnaire. This could have led to a lower
response rate among the non-Malays. Thus, perhaps a multilingual questionnaire is needed to
increase the response rate among the non-Malay population, especially if a self-completed
questionnaire is administered.
On the other hand, the interview yielded better response rate, as expected. However, a
face-to-face interview is time-consuming and costly. In this study, the process of finding the
homes of the respondents was very time consuming, since the map was not very reliable.
Furthermore, the interview could only be done on weekends because most of the respondents
work on weekdays. In addition, the interview needed to be done at a very specific time in order
to obtain a better response. For example, most people have lunch from 12:00 — 2:00 pm and do
not like to be disturbed, and after 2:00 pm most families take an afternoon nap. Thus, perhaps
the most appropriate time for interviews is from 10:00 am to 12:00 pm and after 5:00pm.
About half of the non-respondents refused to be interviewed. The main reason was
because they had been involved in many studies prior to the present study. Slightly more than
half of the non-respondents could not be interviewed because they were not available. Most of

171
them did not respond to the appointment card left at their house. This could have indicated that
they were not interested in participating in the study.
Incomplete data is another source of non-response bias (Streiner and Norman, 1995). In
this study, the questionnaire was considered to be unusable when more than twenty percent of
the items were left blank or had “don’t know” responses. As anticipated, the mail questionnaire
had a higher percentage of incomplete data than the interview questionnaire both for the L-
OHIP(M) and the S-OHIP(M). It was also observed that the length of the questionnaire
influenced the completeness of data.
Another parameter used to compare the two modes of administration was the OHIP(M)
score. It was observed that the mail questionnaire had a slightly higher score than the interview;
however, the differences were not significant. A crossover study conducted by Slade et al (1992)
examined the effects of data collection methods for a self-reported instrument and concluded
that “mail questionnaire responses to oral health impact questions are less prone to subject
acquiescence or response bias.”
Therefore, potential users of the OHIP(M) have to decide which method they want to
employ. On one hand, the mail questionnaire compromised the response rate. On the other hand,
it reduced the response-bias as well as the cost and time, compared to interview. It is also
noteworthy that it is much easier to deal with a non-response bias than a response bias. Thus,
potential users have to draw a line between response rate, cost and response bias. It is also
recommended that only one method of administration should be used.
It was important to re-establish the psychometric properties of the adapted measures
since some changes had been made. Moreover, reliability and validity are situation-dependent.
Thus, the reliability and validity of the L-OHIP(M) were reestablished and the S-OHIP(M) was
tested as presented in the results section. In general, the findings suggest that both versions of

172
the OHIP(M) demonstrated good reliability and validity. A detail of the S-OHIP(M)
psychometric properties will be discussed in the next section.
Although in psychometrics testing a value of 0.7 is considered to be an acceptable level
for assessing homogeneity, this study used a slightly lower value of 0.6 to indicate good
reliability. This is because OHIP is an outcome measure rather than a measure of traits such as
intelligence or anxiety, whereby the subscales of this measure contain more than one concept.
Thus, the items are not expected to be homogenous. It has also been suggested that there is no
need for more than a moderate internal consistency for such measurements (Fitzpatrick et al.,
1998). This study suggests that the L-OHIP(M) had a good internal consistency for all subscales
and it was slightly better than the OHIP(A).
Test-retest reliability is a necessary property for discriminative patient-based outcome
measures. Estimates of the test-retest reliability of the L-OHIP(M) are slightly better than the
OHIP(A). However, it must be noted that these differences could be due to: 1) the differences in
the population studied (adult population aged 18+ for the present study and the elderly in the
Australian study), and 2) could be due to the time between the administration of the
questionnaire (two weeks for the present study and three months for the Australian study).
However, in most instances, two weeks is a sufficient time frame, especially for a long
questionnaire to test for stability.
Reliability testing alone is not sufficient to establish the usefulness of a measure
(Streiner and Norman, 1995). This is because reliability testing only tells us about the
reproducibility of the measure but does not ensure that it measures what it was intended to
measure - in other words, the scale’s validity. Since the L-OHIP(M) scores obtained from mail
and interviews were not significantly different, the data were combined for validity analysis.
This was done to increase the number of respondents in each category of independent variables.

173
Since there was no “gold standard”, construct validity was assessed. As expected, it was
observed that the poorer the perception of oral health status, the higher the score of the L-
OHIP(M) and that they were significantly correlated. In addition, the Malaysian version of the
OHIP was also able to discriminate between groups. These findings provide evidence to support
the validity of the L-OHIP(M).
Locker and Slade (1994) found that there were very weak correlations between clinical
measures and the OHIP score. This is consistent with the conceptual model used to develop the
OHIP, which suggests that functional and psychosocial impacts of disease are modified by
sociodemographic and other variables. Therefore, no attempt was made to correlate or associate
clinical indicators with the OHIP(M), except for dental status (dentate and edentate). The reason
for using dental status to validate the measure is because studies have found that the edentulous
reported more impact than the dentate especially in terms of functioning (Slade and Spencer,
1994(b)). Moreover, this data can be easily collected using a questionnaire. As expected,
edentulous and dentate with dentures had significantly higher scores for functional limitation
and physical disability subscales. Although the overall score did not show significant
differences, there was a trend that those who were edentulous and dentate with a denture had a
higher overall score than dentate without a denture. However, further analysis looking at the
association between the numbers of teeth retained and the score is needed to obtain a true
picture of the situation.
This study demonstrated that the Malaysian version of the OHIP works equally well as
the English version. Hence, it can be concluded that it has achieved functional equivalence as
one of the criteria in cross-cultural adaptation proposed by Herdman, et al (1998).

174
6.4) RELIABILITY AND VALIDITY OF THE S-OHIP(M)
The short form of the OHIP(M) was developed and it is designated as S-OHIP(M). As
mentioned in the methodology (page 108), the main reason for developing a short form is to
provide an alternative, cheaper and less time-consuming means of data collection based on the
premise that a long questionnaire is not permitted to be used in some research settings and
clinical practices even though it provides more comprehensive data. For example, a measure
that takes a long time to complete and score may not be feasible in a clinical setting because of
the burden placed on patients or clinicians (Locker and Allen, 2002b).
The S-OHIP(M) was developed simultaneously with the adaptation of the long version
of the OHIP where the reliability and validity of the adapted L-OHIP(M) were not yet
established. Thus, the L-OHIP(M) cannot be considered as a gold standard (Coste et al, 1997).
Consequently, the expert-based approach, where patients were the experts, was employed in this
study. The selection of the items for the S-OHIP(M) was made based on an assumption that the
items were considered as important when they were frequently reported by the patients
interviewed in the qualitative interview stage. As such, it reflects the patients’ collective opinion
of the importance of the items selected. In this way, the method could be considered as an
“expert-based’ approach. Since a large proportion of items were deleted from the L-OHIP(M),
the measurement properties were not the same as the L-OHIP(M). Hence, the S-OHIP(M) was
treated as a new measure and the reliability and validity were tested on the new and independent
sample of the target population as recommended by Coste, et al (1997).
This study demonstrated that the S-OHIP(M) is reliable, as shown by the ICC and
Cronbach’s alpha. The ICC of more than 0.9 indicated that the measure is stable. Similar ICC
values were observed for mail and interview questionnaires. This suggests that the S-OHIPCM)

175
is stable regardless of how it is administered. A high Cronbach’s alpha value suggests that the
items are homogenous in terms of measuring oral health-related quality of life.
The way that the items were selected to create the S-OHIP(M), where the two most
frequent items reported from each domain were selected, ensures the content validity in terms of
coverage. The results presented on page 141 demonstrate that the S-OHIP(M) was valid.
Although the S-OHIP(M) was developed to be used in surveys as a descriptive and
discriminative measure, it is also desired to be used in clinical trials and in clinical practice as an
evaluative measure. However, in this study, the responsiveness of this measure was not tested
due to time and resources constraints. Therefore, the responsiveness will be tested in future
research.
6.5) COMPARISON FREQUENCY S-OHIP(M) WITH REGRESSION S-OHIP(™)
Basically, there are three ways in which a measure can be shortened: 1) statistical approach
(regression, internal consistency or factor analysis), 2) expert-based approach, and 3) item-
impact method (Locker and Allen 2002b). The original OHIP was shortened using the
regression statistical approach (Slade, 1997c), whereas the Malaysian short version was
developed based on the most frequent items reported by patients, as discussed earlier. The
question as to whether these two approaches yielded different sets of measures was investigated
in this study. To make this comparison feasible, the same sample was used, as reported in the
methodology (page 108). However, it has to be noted that the comparison was not made with
Slade’s short form due to the changes that had occurred during the process of adaptation.
The results of this study found that a different method of shortening produced a different
set of items. This study found that only four items were identical. Similar findings were also
reported by Locker and Allen (2002b) in their attempt to shorten the OHIP using an item-impact

176
method. Even using the same method in a different culture produced a different set of items as
reported by Wong et al (2002a) when producing the Chinese short version of OHIP using the
same method as the original short version. They found that only five items were identical in
both the Chinese short form and the original short form. Although they have a different set of
items, they were found to be reliable and valid. This may suggest that the methods in producing
a short version are not stable. The issue of which methods are more stable is a matter of debate.
As Locker and Allen (2002b) stated, “probably the method of developing a short form
instrument is not as important as its content.” They also suggested that different short forms may
be needed according to the purpose for which they are used. If the measure is to be used as a
descriptive measure in a survey to document population oral health-related quality of life, then
the aim should be to maximize the score. A measure consisting of low-prevalence items failed to
document the full extent of the oral health impact (Locker and Allen, 2002b). This study found
that the frequency short form had more items whose prevalence exceeded 20 percent and had
higher scores compared to the regression short form, indicating that it identified more oral
health impacts. Therefore, in a case where a measure is used as a descriptive measure, then
frequency S-OHIP(M) would be the choice.
In a case where a measure is to be used as a discriminative instrument, items affecting
most patients will fail to distinguish between those who are and are not severely compromised
(Locker and Allen, 2002b). As such, the inclusion of low-frequency, relatively severe items will
maximize the ability of the measure to discriminate between groups. On the other hand, if the
measure is to be used as an evaluative measure, high frequency items which are more likely to
demonstrate change as a result of health care interventions should be included in the instrument
(Locker and Allen, 2002b; Guyatt et al, 1986). Nevertheless, according to Juniper et al (1997),

177
the ultimate approach is to test the properties of the instruments based on their purpose, as
described in the literature reviews (page 24)
This study found that both short forms showed excellent internal consistency reliability
and good test-retest reliability when used for this population. High correlation between scores
from both short forms, and scores from the L-OHIP(M), indicated that both forms had good
concurrent validity. Both short forms performed equally well when tested for discriminative
validity. However, the responsiveness of these measures was not tested in this present study.
This could be one of the future research areas to determine which methods will be more superior
in terms of detecting change.
6.6) THE IMPACT OF ORAL HEALTH TO QUALITY OF LIFE OF AN ADULT
POPULATION
This study was also aimed to provide preliminary data on the impact of oral conditions on the
quality of life of the adult population of Malaysia. The L-OHIP(M) data was utilized. The data
obtained by mail and interview was combined since the difference in scores was not statistically
significant. Because the sample of this study was selected based on a probability sampling, the
findings could be generalized at least for the Selangor population. However, due to a small
sample size, only a descriptive analysis was performed.
The response rate of the present study was low in spite of the response-enhancement
strategies that were employed to a certain extent; for example, a letter of introduction was sent
prior to the interview and two reminders were sent to the mail respondents. Perhaps the response
rate could have been increased if a higher number of callbacks and visits to the respondents’
houses were made. Due to time and resources constraints, this was not done. A high non-
response rate in this study could have caused a non-response bias. However, Locker et al (1990)

178
reported that “when the responders and non-responders to surveys do not differ, the response
rate has no effect on prevalence estimates: high participation rates merely serve to make these
estimate more precise.” In the case of the present study, the respondents and non-respondents
did differ in terms of age groups and ethnicity. As such, the prevalence of the OHRQoL reported
here may be biased. However, the direction and the magnitude of the bias could not be
determined in this study. A study by Patten et al (2003) examined the effect of giving an
incentive on response rates in a community-based irritable bowel syndrome (IBS) survey and
found that the prevalence of IBS was higher in the group that was offered no incentive. This
may suggest that persons with IBS may be more likely to participate in such survey. If a same
phenomenon applies to the present study, then the result would be overestimated. Thus, to
ensure that a future study addresses this issue, it is suggested that more money is put to obtain
information on non-respondents rather than attempts to increase the response (Locker et al,
1990). Nevertheless, caution has to be used when interpreting the findings from this study.
The results revealed that a substantial proportion of the adult population in this sample
experienced some very frequent impacts associated with their oral condition. More than one
fourth of the sample reported functional problems, about one fifth reported pain, more than one
third experienced some form of psychological discomfort, and one fifth reported that they were
disabled in some way because of poor oral health.
Many studies on oral health-related quality of life have focused on older populations
with the assumption that they will be more likely to perceive a greater impact on their quality of
life because of a lifetime’s experience of oral ill health. However, the result of this study showed
that the younger age group perceived slightly greater impacts than the older generation. A
similar observation was also seen by Srisilapanan and Sheiham (2001) whereby based on the
OIDP measure, the younger Thai adult population (35-44 years old) had higher impacts than the

179
older people of Thailand. This could be due to the fact that the older generation had adapted to
the situation.
Although McGrath and Bedi (2000) concluded that there are gender variations in the
social and psychological impacts of oral health, this study observed that both genders perceived
similar impacts. The preliminary report of NOHSA found a similar result using a non-
standardized questionnaire in collecting data on the psychosocial impacts (Oral Health Division
Ministry of Health Malaysia, 2001b). This suggests that gender did not affect how oral health is
perceived among adult populations of Malaysia.
In this study, it was found that those of Indian ethnicity experienced the greatest impact
on a relatively frequent basis for almost all domains, compared to the Malay and the Chinese.
However, it must be noted that the sample size of Indians in this study was too small to make a
valid comparison. Further research is needed using a bigger sample size to confirm this
observation.
It was observed that those who attained a higher education reported more impacts related
to oral conditions. It was also observed that respondents who achieved a lower education
reported more impact on the functional limitation, compared to other domains. However, among
those who had a higher education, psychological discomfort was most prevalent. This finding
was similar with the NOHSA preliminary result, where the level III subjects (middle secondary
level and below) reported a significantly higher impact on functional limitation (Oral Health
Division Ministry of Health Malaysia, 2001b).
This study observed that edentulous persons reported more social impacts than dentate
persons on a more frequent basis. However, it must be noted that the sample size for the
edentulous is too small. Slade and Spencer (1994b) also reported that edentulous persons aged
60 and older in South Australia had more social impacts than dentate persons. According to

180
them, the result was not surprising since most of the items in the OHIP related to chewing or
eating.
6.7) VARIATION IN THE ORAL HEALTH IMPACT BETWEEN MALAYSIAN AND
CANADIAN POPULATIONS
This study also aimed to determine whether or not there was variation in terms of oral health
impacts on the quality of life between two different cultures - Malaysian and Canadian - using
the Oral Health Impact Profile (OHIP) measure. OHIP has been adapted for the Malaysian
population. In the process of adaptation, changes to the content were made. Nevertheless, the
Malaysian version of OHIP measures the same underlying concepts as the original OHIP. Thus,
a comparison was only made between each domain rather than between individual items.
Because of the limitations of this study (as noted earlier) it has to be noted that this comparison
only provides some insight rather than making a valid comparison.
From the findings, it was determined that Malaysian older adults were more affected by
their oral conditions than the Canadian older adults. More than half of the Malaysian
respondents experienced very frequent impacts associated with their oral conditions. Were these
high impacts reported by the Malaysian respondents due to their poor oral health status as
measured by the clinical indicators or due to their perception or expectation of oral health? As
Locker et al (1991) observed, respondents who had worse clinical oral health status were not
reflected by their self-reported indicators. It is interesting to note that although Malaysian
respondents reported a higher impact on each subscale, the pattern of impact was almost similar:
physical aspects were most affected and social aspects were the least affected.
When looking at the differences of the impacts between genders, both Malaysian men
and women were more affected than Canadian men and women. Malaysian men had a slightly

181
higher impact than Malaysian women. In contrast, Canadian women had a higher impact than
Canadian men. However, the differences were small in both samples.
In both populations, edentulous respondents reported more impacts than dentate
respondents. However, Malaysian dentate and edentulous groups had higher impacts than the
Canadian population, respectively.
The differences observed in this study could be due to the social and cultural factors
between these two populations. Due to the nature of the study design for both studies we are
unable to determine which factors contributed to the differences observed in this comparison.
However, it provides some evidence that Malaysian adults were more affected than Canadian
adults. Further study with a more appropriate study design is needed to determine what factors
have contributed to these differences.
6.8) CONCLUSION
1) Two versions of the OHIP were developed: L-OHIP(M) and S-OHIP(M). Both versions
were found to be valid and reliable regardless of the mode of adminstration. However,
this study only provides initial evidence for reliability and validity of these measures.
Further study is recommended to collect more evidence to support the validity and
reliability of these measures.
2) Two types of short forms were developed using different methods: frequency and
regression. Both forms performed equally well when tested for discriminative validity.
However, the responsiveness of these measures was not tested in the present study. This
could be one of the future research areas to determine which version will be superior in
terms of detecting change.

3)
4)
182
The preliminary results revealed that a substantial proportion of the sample included in
this study experienced frequent psychosocial impacts associated with oral conditions.
The Malaysian population aged 50 and above had slightly higher impacts than the
Canadian population. However, the pattern of impacts was similar, where physical
consequences were most affected and social aspects were the least affected.
6.9) FUTURE RESEARCH
1)
2)
3)
To translate the Malay version of OHIP(M) to other main languages of Malaysia;
namely English, Tamil and Mandarin, and to test its validity.
Rationale: in this study it was found that the response rate among the non-Malays was
low. This could be due to the difficulty in answering the Malay questionnaire among the
non-Malays. Perhaps, a multilingual questionnaire could improve the response rate
among the non-Malay population.
To test its reliability and validity to Sabah and Sarawak people.
Rationale: The adaptation of the questionnaire in this study was only based on people of
Peninsular Malaysia. Since the culture and lifestyle of Sabah and Sarawak people are
quite different from people of Peninsular Malaysia, the reliability and validity of these
measures need to be reassessed before the questionnaire can be used for Sabah and
Sarawak populations.
To assess the evaluative properties of these measures.
Rationale: The aim of this study was to develop an OHRQoL measure for descriptive
and discriminative purposes. There is a need to develop an evaluative measure to use in
program evaluation, clinical trials, and clinical practice. Thus, the responsiveness
property needs to be established.

183
4) To establish the normative values for the Malaysian population.
Rationale: In order to make a meaningful interpretation of the OHRQoL results, a local
reference of what is ‘normal’ for the population is required (McGrath and Bedi, 2002).

REFERENCES
Aday LA (1996). Designing and conducting health surveys: A comprehensive guide. Second edition. San Francisco: Jossey-Bass Publishers.
Adulyanon S, Sheiham A (1996). A new socio-dental indicators on daily performances.
Journal of Dental Research; 75 (IADR abstracts): abstract # 1711.
Adulyanon S, Sheiham A (1997). Oral Impacts on Daily Performances. In: Slade GD (Ed).
Measuring oral health and quality of life. Chapel Hill, North Carolina: Department of Dental
Ecology, School of Dentistry, University of North Carolina.
Adulyanon S, Vourapukjaru J, Sheiham A (1996). Oral impacts affecting daily performances
in a low dental disease Thai population. Community Dentistry and Oral Epidemiology; 24: 385-389.
Allen PF, Locker D (1997). Do item weights matter? An assessment using the oral health impact profile. Community Dental Health; 14: 133-138.
Allen PF, Mc Millan AS, Walshaw D, Locker D (1999). A comparison of the validity of generic-and disease-specific measures in the assessment of oral health-related quality of life.
Community Dentistry and Oral Epidemiology; 27: 344-352.
Allen PF, McMillan AS (1998). The impact of tooth loss in a denture wearing population: an assessment using the Oral Health Impact Profile. Community Dental Health; 16: 176-180.
Allen PF, McMillan AS, Locker D (2001a). An assessment of sensitivity to change of the Oral Health Impact Profile in a clinical trial. Community Dentistry and Oral Epidemiology; 29: 175-182.
Allen PF, McMillan AS, Walshaw D (2001b). A patient-based assessment of implant- stabilized and conventional complete dentures. Journal of Prosthetic Dentistry; 85: 141-147.
Allison P, Locker D, Jokovic A, Slade G (1999). A cross-cultural study of oral health values.
Journal of Dental Research; 78: 643-649.
Asmah Haji Omar (1985). Language and the worldview of the Malay peasants. In: Osman MT
(Ed). Malaysian world-view. Singapore: Institute of Southeast Asian Studies.
Atchison KA, Der-Martirosian C, Gift H (1998). Components of self-reported oral health and general health in racial and ethnic groups. Journal of Public Health Dentistry; 58: 301-308.
Atchison KA, Dolan TA (1990). Development of the Geriatric Oral Health Assessment Index.
Journal of Dental Education; 54:670-687.
184

185
Awad MA, Locker D, Kormmer-Bitensky N, Feine JS (2000). Measuring the effect of intra-oral implant rehabilitation of health-related quality of life in a randomized controlled clinical trial.
Journal of Dental Research; 79: 1659-1663.
Badia X, Herdman M, Mearin F, Perez I (2000). Adaptation into Spanish of the IBSQOL
questionnaire for the measurement of quality of life in patients with irritable bowel syndrome. Rev. Esp Enfern Dig; 92: 644-650.
Beaton DE, Bombardier C, Guillemin F, Ferraz MB (2000). Guidelines for the process of cross-cultural adaptation of self-report measures. Spine; 25: 3186-3191.
Behling O, Law KS (2000). Translating questionnaires and other research instruments:
problems and solution series, quantitative application in the social sciences. Thousand Oaks: Sage Publications Inc.
Brislin RW, Lonner WJ, Thorndike RM (1973). Cross-cultural Research methods. New York: John Wiley & sons.
Broder HL, Slade G, Caine R, Reisine S (2000). Perceived impact of oral health conditions among minority adolescents. Journal of Public Health Dentistry; 60: 189-192.
Buck D, Jacoby A, Baker GA, Ley H, Steen N (1999). Cross-cultural differences in health-
related quality of life of people with epilepsy: Findings from a European study. Quality of Life Research; 8: 675-685.
Bullinger M, Anderson R, Cella D, Aaronson N (1993). Developing and evaluating cross-
cultural instruments from minimum requirements to optimal models. Quality of Life Research; 2: 451-459.
Bumiputra Commerce (2003). Special economic issue: Summary of Bank Negara 2002 annual report. Economic Research Services; 2:.
Calabrese JM, Friedman PK, Rose LM, Jones JA (1999). Using the GOHAI to assess oral
health status of frail homebound elders: reliability, sensitivity and specificity. Special Care in Dentistry; 19: 214-219.
Carlson ED (2000). A case study in translation methodology using the Health-Promotion
Lifestyle Profile Ul. Public Health Nursing; 17 : 61-70.
Carmines EG, Zeller RA (1979). Reliability and validity assessment. Beverly Hills: Sage Publications.
Cella DF, Lloyd SR, Wright BD (1996). Cross-cultural instruments equating: current research
and future directions. In Spilker B (Ed.). Quality of life and pharmacoeconomics in clinical
trials. Second edition. Philadelphia: Lippincott-Raven.
186
Central Bank of Malaysia (2002). Release of the 2002 Bank Negara Malaysia Annual Report:
Malaysian economy in 2002. http:/www.bnm.gov.my/en/Documents/News/2003.
Coates E, Slade GD, Goss AN et al (1996). Oral conditions and their social impact among HIV dental patients. Australian Dental Journal; 41: 33-36.
Cohen LK, Jago JD (1976). Toward the formulation of sociodental indicators. International Journal of Health Services; 6(4): 681-699.
Collins D (2003). Pretesting survey instruments: An overview of cognitive methods. Quality of Life Research; 12: 229-238.
Coste J, Guillemin F, Pouchot J, Fermanian J (1997). Methodological approaches to shortening composite measurement scales. Journal of Clinical Epidemiology; 50: 247-252.
Cushing AM, Shetham A, Maizels J (1986). Developing socio-dental indicators. The social
impact of dental disease. Community Dental Health; 3:3-17.
Dato Asmah Haji Omar (2000). Oxford Fajar advanced learner’s English-Malay dictionary/ A.S Hornby. Shah Alam: Fajar Bakti.
Del Greco L, Walop W, Eastridge L (1987). Questionnaire development 3: Translation.
Canadian Medical Association; 136:817-818.
Department of Statistics Malaysia (2001). Population and housing census of Malaysia 2000:
Population distribution and basic demographic characteristics. Malaysia: Department of Statistics Malaysia.
Department of Statistics Malaysia (2002). Population and housing census of Malaysia 2000: Education and social characteristics of the population. Malaysia: Department of Statistics Malaysia.
DeVellis RF (1991). Scale development: theory and applications. New Delhi: Sage
Publications.
Deyo RA, Diehr P, Patrick DL (1991). Reproducibility and responsiveness of health status
measures. Controlled Clinical Trials; 12(Suppl): 142-158
Dillman DA (1978). Mail and telephone survey: the total design method. New York: Wiley.
Dolan TA (1997). The sensitivity of the Geriatric Oral Health Assessment Index to dental care.
Journal of Dental Education; 61: 37-46.
Donner A, Eliasziw M (1987). Sample size requirements for reliability studies. Statistics in Medicine 1987; 6: 441-448.

187
Esposito N (2001). From meaning to meaning: the influence of translation techniques on non- English focus group research. Qualitative Health Research;11: 568-579.
Fayers PM, Machin D (2000). Quality of life: Assessment, analysis and interpretation.
England: John Wiley & Sons Ltd.
Fitzpatrick R, Davey C, Buxton MJ, Jones DR (1998). Evaluating patient-based outcome
measures for use in clinical trials. Helath Technology Assessment; 2(14): 1-74.
Flaherty JA, Gaviria FM, Pathak D et al (1988). Developing instruments for cross-cultural psychiatric research. The Journal of Nervous and Mental Disease; 176: 257-263.
French DJ, Caroll A, Christie MJ (1998). Health-related quality of life in Australian Children
with asthma: lessons for the cross-cultural use of quality of life instruments. Quality of Life Research; 7: 409-419.
Geisinger KF (1994). Cross-cultural normative assessment: Translation and adaptation issues
influencing the normative interpretation of assessment instruments. Psychological Assessment; 6: 304-312.
Gift HC, Redford M (1992). Oral health and the quality of life. Clinics in Geriatric Medicine; 8:673-683.
Gill TM, Feinstein AR (1994). A critical appraisal of the quality of quality-of-life
measurements. Journal of American Medical Association; 272: 619-626.
Gilmer JS, Tripp-Reimer T, Buckwalter KC et al (1995). Technical notes: Translation and validation issues for a multidimensional elderly self-assessment instrument. Western Journal of Nursing Research; 17: 220-226.
Gooch BF, Dolan TA, Bourque LB (1989). Correlates of self-reported dental health status
upon enrollment in the RAND health insurance experiment. Journal of Dental Education; 53:629-637.
Green LW, Lewis FM (1986). Measurement and evaluation in health education and health
promotion. California: Mayfield Publishing Company.
Guamaccia PJ (1996). Anthropological perspectives: the importance of culture in the
assessment of quality of life. In Spilker B (Ed.). Quality of life and pharmacoeconomics in
clinical trials. Second edition. Philadelphia: Lippincott-Raven.
Guillemin F, Bombardier C, Beaton D (1993). Cross-cultural adaptation of health-related
quality of life measures: literature review and proposed guidelines. Journal of Clinical
Epidemiology; 46:1417-1432.

188
Guillemin F, Bombardier C, Beaton D (1993). Cross-cultural adaptation of health-related quality of life measures. Literature review and proposed guidelines. J. Clinical Epidemiology; 46: 1417-1432.
Guyatt GH, Bombardier C, Tugwell PX (1986). Measuring disease specific quality of life in clinical trials. The Canadian Medical Association Journal; 134: 889-895.
Guyatt GH, Kirshner B, Jaeschke R (1992). Measuring Health Status. What are the necessary
measurement properties? Journal of Clinical Epidemiology; 45: 1341-1345.
Hanley A, Schott J (1999). Culture, religion and patient care in a multi-ethnic society: A
handbook for professionals. London: Age Concern England.
Hays RD, Anderson R, Revicki DA (1995). Psychometric evaluation and interpretation of
health-related quality of life data. In: Shumaker SA, Berzon R (Eds). The International
Assessment of Health-Related Quality of Life: theory, translation, measurement and analysis.
Oxford: Rapid Communications.
Helman CG (1990). Culture, health and illness. Second edition. London: Wright.
Herdman M, Fox-Rushby J, Badia X (1997). ‘Equivalence’ and translation and adaptation of
health-related quality of life questionnaires. Quality of Life Research; 6:237-247.
Herdman M, Fox-Rushby J, Badia X (1998). A model of equivalence in the cultural adaptation of HRQoL instriments: the universalist approach. Quality of Life Research; 7: 323-335
Higginson IJ, Carr AJ (2001) Measuring quality of life: Using quality of life measure in
clinical setting. British Medical Journal; 322: 1297-1300.
Hunt RJ, Slade GD, Strauss RP (1995). Differences between Racial Groups in the Impact of
Oral Disorders among older Adults in North Carolina. Journal of Public Health Dentistry;
§5(4): 205-209.
Hunt SM (1995). Cross-cultural comparability of quality of life measures. In: Guggenmoos- Holzmann I, Bloofield K, Brenner H, Flick U (Eds). Quality of life and health: Concepts,
methods and applications. Berlin: Blackwell Wissenschafts-Verlag.
Hunt SM, McEwen J, McKenna SP (1986). Measuring health status. London: Croom Helm
Ltd.
Jaafar N (1995). Oral health behaviour in a multi-ethnic society. Symposium: Developing
methods to assess cultural dimensions of oral health and disease.73™ Genaral Session and
Scientific Meeting, International Association for Dental Research, Singapore.

189
John MT, Patrick DL, Slade GD (2002). The German version of the Oral Health Impact
Profile-translation and psychometric properties. European Journal of Oral Sciences; 110: 425- 433.
Jui-meng C (1998). A message from the Minister of health of Malaysia.
http://dph.gov.my/messages/minister/index.htm 1998.
Juniper EF, Guyatt GH, Jaeschke R. (1996). How to develop and validate a new health-related
quality of life instrument. In: Spilker B (ed.). Quality of life and pharmacoeconomics in clinical trials. 2"* edition. Philadelphia: Lippincott-Raven.
Juniper EF, Guyatt GH, Streiner DL, King DR (1997). Clinical impact versus factor analysis for quality of life questionnaire construction. Journal of Clinical Epidemiology; 50: 233-238.
Kim A, Lim EY (1999). How critical is back translation in cross-cultural adaptation of attitue
measures? Paper presented at the annual meeting of the American Educational Research Association, Montreal, Canada.
Kirshner B, Guyatt G (1985). A methodological framework for assessing health indices. Journal of Chronic Disease; 38: 27-36.
Kline P (2000). Handbook of psychological testing. Second edition. London: Routledge.
Kressin N, Spiro A, Bosse R, Garcia R, Kazis L (1996). Assessing oral health-related quality of life: findings from the normative aging study. Medical Care; 34:416-427.
Kressin NR, Atchison KA, Miller DR (1997). Comparing the impact of oral disease in two
populations of older adults: Application of the Geriatric Oral Health Oral Health Assessment
Index. Journal of Public Health Dentistry; 57: 224-232.
Leao A, Sheiham A (1995). Relation between clinical dental status and subjective impacts on daily living. Journal of Dental. Research; 74:1408-1413.
Leplége A, Verdier A (1995). The adaptation of health status measures: methodological aspects of the translation procedure. In: Shumaker SA, Berzon R (Eds). The International
Assessment of Health-Related Quality of Life: theory, translation, measurement and analysis.
Oxford: Rapid Communications.
Locker D (1988). Measuring oral health: A conceptual framework. Community Dental Health;
5:3-18.
Locker D (1996). Applications of self-reported assessment of oral health outcomes. Journal of
Dental Education; 60: 494-500.

190
Locker D (1997a). Concepts of oral health, disease and the quality of life. In: Slade GD.
Measuring oral health and quality of life. Chapel Hill, North Carolina: Department of Dental
Ecology, School of Dentistry, University of North Carolina.
Locker D (1997b). Subjective Oral Health Status Indicators. In: Slade GD (Ed). Measuring
oral health and quality of life. Chapel Hill, North Carolina: Department of Dental Ecology,
School of Dentistry, University of North Carolina.
Locker D (1997c). Clinical correlates of changes in self-perceived oral health in older adults.
Community Dentistry and Oral Epidemiology; 25: 199-203.
Locker D (1998). Issues in measuring change in self-perceived oral health status. Community Dentistry and Oral Epidemiology; 26: 41-47.
Locker D, Matear D, Stephens M, Jokovic A (2002a). Oral health-related quality of life of a
population of medically compromised elderly people. Community Dental Health; 19: 90-97.
Locker D, Allen PF (2002b). Developing short-form measures of oral health-related quality of
life. Journal of Public Health Dentistry; 62: 13-20.
Locker D, Clarke M, Payne B (2000). Self-perceived oral health status, psychological well-
being and life satisfaction in an older adult population. Journal of Dental Research; 79: 970-
975.
Locker D, Jokovic A (1996). Using subjective oral health status indicators to screen for dental
care needs in older adults. Community Dentistry and Oral Epidemiology; 24: 398-402.
Locker D, Jokovic A (1997). Three-year changes in self-perceived oral health status in an
older Canadian population. Journal of Dental Research; 76:1292-1297.
Locker D, Miller Y (1994a). Evaluation of subjective oral health status indicators. Journal of
Public Health Dentistry; 54(3): 167-176.
Locker D, Miller Y (1994b). Subjectively reported oral health status in an adult population. Community Dentistry and Oral Epidemiology; 22:425-430.
Locker D, Slade G (1993). Oral Health and the Quality of Life Among older adults: The Oral
Health Impact Profile. Journal of Canadian Dental Association; 59: 830-838. (cont. Ref. On
page 844).
Locker D, Slade G (1994). Association between clinical and subjective indicators of oral
health status in an older adult population. Gerodontology; 11: 108-114.
Locker D, Leake JL, Hamilton M, Hicks T, Lee J, Main PA (1991). The oral health status of
older adults in four Ontario communities. Journal of Canadian Dental Association; 57: 727-
732.

191
Locker D, Slade GD, Leake JL (1990). The response rate problem in oral health surveys of
older adults in Ontario. Canadian Journal of Public Health; 81: 210-214.
Lwanga SK, Lemeshow S (1991). Sample size determination in health studies: A practical
Manual. Geneva: World Health Organization.
MacLachlan M (1997). Culture and health. Toronto: John Wiley & Sons.
Masalu JR, Astrom AN (2003). Applicability of an abbreviated version of the Oral Impacts on Daily Performances (OIDP) scale for use among Tanzanian students. Community Dentistry
and Oral Epidemiology; 31: 7-14.
Mascarenhas AK (1999). A comparison of oral health in elderly populations seeking and not seeking dental care. Special Care in Dentistry; 19: 248-253.
McDowell I, Newell C (1996). Measuring health: A guide to rating scales and questionnaires. Second edition. New York: Oxford University Press.
McGrath C, Bedi R (2000). Gender variations in the social impact of oral health. Journal of the
Irish Dental Association; 46: 87-91.
McGrath C, Bedi R (2001). An evaluation of a new measure of oral health related quality of
life - OHQoL-UK(W)° . Community Dental Health; 18: 138-143.
McGrath C, Bedi R (2002). Population based norming of the UK oral health related quality of
life measure [OHQoL-UK(W)*! British Dental journal; 193: 521-524.
Melas F, Marcenes W, Wright PS (2001). Oral health impact on daily performances in patients
with implant-stabilized overdentures and patients with conventional complete dentures. International Journal of Oral and Maxillofacial Implants; 16: 700-712.
Ministry of Education (2003). Sekolah. http://www.moe.gov.my/sekolah/frinsckolah. htm
Morigama IM (1968). Problems in the measurement of health status. In: Shelton EB, Moore W
(Eds). Indicators of social change: Concepts and measurements. New York: Russell Sage.
Moroldo MB, De Cunto C, Hiibscher O et al (1998). Cross-cultural adaptation and validation of an Argentine Spanish version of the Stanford Childhood Health Assessment Questionnaire.
Arthritis Care and Research; 11(5): 382-390
Newton JT, Corrigan M, Gibbons DE, Locker D (2003). The self-assessed oral health status of
individuals from White, Indian, Chinese, and Black Caribbean communities in South-east
England. Community Dentistry and Oral Epidemiology; 31: 192-199.
NHHES’96 Team (1999). National household health expenditure survey 1996 (NHHES’96) Malaysia: Final report. Kuala Lumpur: Department of Social and Preventive Medicine,
Faculty of Medicine, University of Malaya.

192
Oral Health Division, Ministry of Health Malaysia (2001a). Oral healthcare in Malaysia.
Malaysia: Oral Health Division, Ministry of Health Malaysia.
Oral Health Division, Ministry of Health Malaysia (2001b). Oral health status, impacts and
treatment needs of Malaysian adults. Kuala Lumpur: Oral Health Division, Ministry of Health Malaysia.
Patrick DL, Deyo RA (1989). Generic and disease-specific measures in assessing health status and quality of life. Medical Care; 27: $217-S232.
Patten SB, Li FX, Cook T, Hilsden RJ, Sutherland LR (2003). Irritable bowel syndrome: are
incentives useful for improving survey response rates? Journal of Clinical Epidemiology; 56:
256-261.
Phillips LR, Luna-de Hernandez I, Torres de Ardon E (1994). Strategies for achieving cultural
equivalence. Research in Nursing and Health; 17:149-154.
Ramli R (2001). Challenges and prospects of oral health promotion — The Malaysian
experience. Paper presented at the FDI conference Kuala Lumpur.
Reisine ST, Fertig J, Waber J, Leder S (1989). Impact of dental conditions on patients’ quality
of life. Community Dentistry and Oral Epidemiology; 17:7-10.
Robinson PG, Gibson B, Khan FA, Birnbaum W (2001). A comparison of OHIP 14 and OIJDP
as interviews ans questionnaires. Community Dental Health; 18: 144-149.
Saunders MJ, Paunovich ED, Cornell JE (1995). Oral health quality of life inventory: development and validation. Journal of Dental Research; 74 (AADR abstracts): abstract #
1253.
Sechrest L, Fay TL, Zaidi SMH (1972). Problems of translation in cross-cultural research.
Journal of Cross-Cultural Psychology; 3: 41-56.
Sheiham A, Steele JG, Marcenes W, Tsakos G, Finch S, Walls AWG (2001). Prevalence of
impacts of dental and oral disorders and their effects on eating among older people; a national
survey in Great Britain. Community Dentistry and Oral Epidemiology; 29: 195-203.
Slade GD (Ed) (1997a). Measuring oral health and quality of life. Chapel Hill, North Carolina:
Department of Dental Ecology, School of Dentistry, University of North Carolina.
Slade GD (1997b). The Oral Health Impact Profile. In: Slade GD (Ed). Measuring oral health
and quality of life. Chapel Hill, North Carolina: Department of Dental Ecology, School of
Dentistry, University of North Carolina.

193
Slade GD (1997c). Derivation and validation of a short-form oral health impact profile. Community Dentistry and Oral Epidemiology; 25: 284-296.
Slade GD (1998). Assessing change in quality of life using the Oral Health Impact Profile.
Community Dentistry and Oral Epidemiology; 26: 52-61.
Slade GD, Hoskin GW, Spencer AJ (1996a). Trends and fluctuations in the impact of oral conditions among older adults during a one year period. Community Dentistry Oral
Epidemiology; 24: 317-321.
Slade GD, Spencer AJ, Locker D et al (1996b). Variations in the Social Impact of oral
Conditions Among Older Adults in South Australia, Ontario, and North Carolina. Journal of Dental Research; 75: 1439-1450.
Slade GD, Spencer AJ (1994a). Development and evaluation of the Oral Health Impact Profile. Community Dental Health; 11:3-11.
Slade GD, Spenser AJ (1994b). Social impact of oral conditions among older adults.
Australian Dental Journal; 39: 358-364.
Slade GD, Spencer AJ, Keily P (1992). Effects of data collection methods on self-reported oral
health impact. Journal of Dental Research; 71: 978 Abstract 15.
Srisilapanan P, Shetham A (2001a). The prevalence of dental impacts on daily performances in
older people in Northern Thailand. Gerodontology; 18: 102-108.
Srisilapanan P, Sheiham A (2001b). Assessing the difference between sociodental and
normative approaches to assessing prosthetic dental treatment needs in dentate older people..
Gerodontology; 18: 25-34.
Strauss RP, Hunt RJ (1993). Understanding the value of teeth to older adults: influences on the quality of life. Journal of American Dental Association; 124:105-110.
Streiner DL, Norman GR (1995). Health measurement scales: A practical guide to their development and use. Second edition. Oxford: Oxford University Press.
Szklo M, Nieto FJ (2000). Epidemiology: beyond the basic. Maryland: An Aspen Publication.
Tewolde S (1999). Malaysia: A cultural profile. University of Toronto, Toronto: Anti-Racism,
Multiculturalism and Native Issues(AMNIJ) Centre, Faculty of Social Work.
Tickle M, Craven R, Blinkhorn AS (1997a). An evaluation of a measure of subjective oral
health status in the UK. Community Dental Health; 14: 175-180.

194
Tickle M, Craven R, Worthington HV (1997b). A comparison of subjective oral health status
of older adults from deprived and affluent communities. Community Dentistry and Oral Epidemiology; 25: 217-222.
Touw-Otten F, Meadows K (1996). Cross-cultural issues in outcome measurement. In: Hutchinson A (Ed). Health outcome measures in primary and out-patient care. The Netherlands: Harwood Academic Publishers.
Tsakos G, Marcenes W, Sheiham A (2001a). Evaluation of a modified version of the index of
Oral Impacts on Daily Performances (OIDP) in elderly populations in two European countries. Gerodontology; 18: 121-130.
Tsakos G, Marcenes W, Shieham A (2001b). Cross-cultural differences in oral impacts on daily performances between Greek and British older adults. Community Dental Health; 18: 209-213.
Tubert-Jeannin S, Riordan PJ, Morel-Papernot A, Porcheray S, Saby-Collet S (2003).
Validation of an oral health quality of life index (GOHAI) in France. Community Dentistry and Oral Epidemiology; 31: 275-284.
van de Vijver F, Kwok Leong (1997). Methods and data Analysis for Cross-cultural research.
Thousand Oaks: Sage Publication Inc.
Wilkin D, Hallam L, Doggett MA (1992). Measures of need and outcome for primary health
care, Oxford: Oxford University Press.
Wilson IB, Cleary PD (1995). Linking clinical variables with health-related Quality of life.
Journal of American Medical Association; 273: 59-65.
Wong MC, Lo EC, McMillan AS (2002a). Validation of a Chinese version of the Oral Health
Impact Profile (OHIP). Community Dentistry and Oral Epidemiology; 30: 423-430.
Wong MCM, Liu JKS, Lo ECM (2002b). Translation and validation of the Chinese version of GOHAL. Journal of Public Health Dentistry; 62: 78-83.
World Health Organization (1948). Primary health care. Report of the international
conference on primary health care. Alma-Ata, U.S.S.R., Geneva: World Health Organization.

APPENDIX A
Oral Health Impact Profile Questionnaire — Original
195

-t.
Xe, oO {w3q 40°
The University of North Carolina at Chapel Hill
School of Dentistry
Oral Health Impact Profile
Page 1

INSTRUCTIONS THE QUESTIONNAIRE. This questionnaire asks how troubles with your teeth, mouth or dentures may have caused problems in your daily life. We would like you to complete the questionnaire even if you have good dental health. We would like to know how often you have had each of the 49 listed problems during the LAST YEAR.
HOW TO ANSWER THE QUESTIONS. Each question on the left hand side of the page asks you about a particular dental problem. You should think about each question in turn, and circle the answer to the right of the question, to indicate how often you have had the problem during the last year.
If you occasionally had sore spots in your mouth, you would circle the answer as shown in this example.
Q16.Have you had any sore spots in VERY FAIRLY /O HARDLY NEVER DON'T your mouth? OFTEN OFTEN EVER KNOW
If you have never had the problem during the last year, circle "NEVER" as follows. Q16.Have you had any sore spots in VERY FAIRLY OCCAS- HARDLY DON'T
your mouth? OFTEN OFTEN IONALLY EVER KNOW
WHAT IF THE QUESTION DOES NOT APPLY? Question 3 applies only to people who have all or some of their own teeth. If the question does not apply to you then you would answer by checking the box as follows. EXAMPLE
Q13.Have you had a toothache? VERY FAIRLY OCCAS- HARDLY NEVER DON'T OFTEN OFTEN IONALLY EVER KNOW
Does not apply - | do not have my own teeth [4
ANY QUESTIONS? If you would like to speak to one of the researchers, please phone Kevin Moss at the School of Dentistry, phone (919) 966-2791. Once again, thank you for your help!
Page 2

HOW OFTEN have you had the problem during the last year? (circle your answer)
Q1. Have you had difficulty chewing any foods because of problems VERY FAIRLY OCCAS- HARDLY NEVER DON’T
with your teeth, mouth or OFTEN OFTEN JONALLY EVER KNOW dentures?
Q2. Have you had trouble pronouncing any words because VERY FAIRLY OCCAS- HARDLY NEVER DON’T
of problems with your teeth, OFTEN OFTEN IONALLY EVER KNOW mouth or dentures?
Q3. Have you noticed a tooth which VERY FAIRLY OCCAS- HARDLY NEVER DON’T
doesn't look right? OFTEN OFTEN {ONALLY EVER KNOW
Q4. Have you felt that your appearance has been affected VERY FAIRLY OCCAS- HARDLY NEVER DON’T
because of problems with your OFTEN OFTEN JONALLY EVER KNOW teeth, mouth or dentures?
Q5. Have you felt that your breath has been stale because of problems VERY FAIRLY OCCAS- HARDLY NEVER DON'T with your teeth, mouth or OFTEN OFTEN IONALLY EVER KNOW
dentures?
Q6. Have you felt that your sense of taste has worsened because of VERY FAIRLY OCCAS- HARDLY NEVER DON’T
problems with your teeth, mouth OFTEN OFTEN IONALLY EVER KNOW or dentures?
Q7. Have you had food catching in VERY FAIRLY OCCAS- HARDLY NEVER DON’T your teeth or dentures? OFTEN OFTEN IONALLY EVER KNOW
Q8. Have you felt that your digestion has worsened because of VERY FAIRLY OCCAS- HARDLY NEVER DON'T
problems with your teeth, mouth OFTEN OFTEN IONALLY EVER KNOW or dentures?
Q9. Have you had painful aching in VERY FAIRLY OCCAS- HARDLY NEVER DON’T your mouth? OFTEN OFTEN IONALLY EVER KNOW
Q10. Have you had a sore jaw? VERY FAIRLY OCCAS- HARDLY NEVER DON’T
OFTEN OFTEN JONALLY EVER KNOW Qii. Have you had headaches
because of problems with your VERY FAIRLY OCCAS- HARDLY NEVER DON’T
teeth, mouth or dentures? OFTEN OFTEN JIONALLY EVER KNOW
Page 3

HOW OFTEN have you had the problem during the last year? (circle your answer)
Q12. Have you had sensitive teeth, for example, due to hot or cold foods VERY FAIRLY OCCAS- HARDLY NEVER DON'T or drinks? OFTEN OFTEN JIONALLY EVER KNOW
Does not apply - | do not have my own teeth
Q13. Have you had toothache? VERY FAIRLY OCCAS- HARDLY NEVER DON'T OFTEN OFTEN IONALLY EVER KNOW
Does not apply - | do not have my own teeth
Q14. Have you had painful gums? VERY FAIRLY OCCAS- HARDLY NEVER DON’T OFTEN OFTEN IONALLY EVER KNOW
Q15. Have you found it uncomfortable to eat any foods because of VERY FAIRLY OCCAS- HARDLY NEVER DON’T
problems with your teeth, mouth OFTEN OFTEN JIONALLY EVER KNOW or dentures?
Q16. Have you had sore spots in your VERY FAIRLY OCCAS- HARDLY NEVER DON'T
mouth? OFTEN OFTEN IONALLY EVER KNOW
Q17. Have you felt that your dentures VERY FAIRLY OCCAS- HARDLY NEVER DON'T have not been fitting properly? OFTEN OFTEN IONALLY EVER KNOW
Does not apply - | do not have dentures
Q18. Have you had uncomfortable VERY FAIRLY OCCAS- HARDLY NEVER DON'T
dentures? OFTEN OFTEN IONALLY EVER KNOW
Does not apply - | do not have dentures
Q19. Have you been worried by dental VERY FAIRLY OCCAS- HARDLY NEVER DON'T problems? OFTEN OFTEN JONALLY EVER KNOW
Q20. Have you been seif conscious because of your teeth, mouth or VERY FAIRLY OCCAS- HARDLY NEVER DON'T dentures? OFTEN OFTEN IONALLY EVER KNOW
Q21. Have dental problems made you VERY FAIRLY OCCAS- HARDLY NEVER DON'T miserable? OFTEN OFTEN JONALLY EVER KNOW
Q22. Have you felt uncomfortable about the appearance of your VERY FAIRLY OCCAS- HARDLY NEVER DON'T
teeth, mouth or dentures? OFTEN OFTEN IONALLY EVER KNOW
Page 4

HOW OFTEN have you had the problem during the last year?
(circle your answer)
Q23. Have you felt tense because of VERY FAIRLY OCCAS- HARDLY NEVER DON’T problems with your teeth, mouth OFTEN OFTEN JONALLY EVER KNOW or dentures?
Q24. Has your speech been unclear because of problems with your VERY FAIRLY OCCAS- HARDLY NEVER DON’T teeth, mouth or dentures? OFTEN OFTEN IONALLY EVER KNOW
Q25. Have people misunderstood some of your words because of VERY FAIRLY OCCAS- HARDLY NEVER DON’T
problems with your teeth, mouth OFTEN OFTEN JIONALLY EVER KNOW or dentures?
Q26. Have you felt that there has been less flavor in your food because VERY FAIRLY OCCAS- HARDLY NEVER DON’T
of problems with your teeth, OFTEN OFTEN JIONALLY EVER KNOW mouth or dentures?
Q27. Have you been unable to brush your teeth properly because of VERY FAIRLY OCCAS- HARDLY NEVER DON’T problems with your teeth, mouth OFTEN OFTEN IONALLY EVER KNOW or dentures?
Does not apply - | do not have my own teeth
Q28. Have you had to avoid eating some foods because of problems VERY FAIRLY OCCAS- HARDLY NEVER DON’T
with your teeth, mouth or OFTEN OFTEN {ONALLY EVER KNOW dentures?
Q29. Has your diet been unsatisfactory
because of problems with your VERY FAIRLY OCCAS- HARDLY NEVER DON'T
teeth, mouth or dentures? OFTEN OFTEN JONALLY EVER KNOW
Q30. Have you been unable to eat with your dentures because of VERY FAIRLY OCCAS- HARDLY NEVER DON'T problems with them? OFTEN OFTEN IONALLY EVER KNOW
Does not apply - | do not have dentures
Q31. Have you avoided smiling because of problems with your VERY FAIRLY OCCAS- HARDLY NEVER DON’T
teeth, mouth or dentures? OFTEN OFTEN JONALLY EVER KNOW
Page 5

HOW OFTEN have you had the problem during the last year? (circle your answer)
Q32. Have you had to interrupt meals
because of problems with your VERY FAIRLY OCCAS- HARDLY NEVER DON’T
teeth, mouth or dentures? OFTEN OFTEN IONALLY EVER KNOW
Q33. Has your sleep been interrupted
because of problems with your VERY FAIRLY OCCAS- HARDLY NEVER DON’T
teeth, mouth or dentures? OFTEN OFTEN JONALLY EVER KNOW
Q34. Have you been upset because of problems with your teeth, mouth VERY FAIRLY OCCAS- HARDLY NEVER DON’T or dentures? OFTEN OFTEN IONALLY EVER KNOW
Q35. Have you found it difficult to relax because of problems with your VERY FAIRLY OCCAS- HARDLY NEVER DON’T teeth, mouth or dentures? OFTEN OFTEN JONALLY EVER KNOW
Q36. Have you felt depressed because of problems with your teeth, VERY FAIRLY OCCAS- HARDLY NEVER DON'T mouth or dentures? OFTEN OFTEN JIONALLY EVER KNOW
Q37. Has your concentration been affected because of problems VERY FAIRLY OCCAS- HARDLY NEVER DON’T with your teeth, mouth or OFTEN OFTEN IONALLY EVER KNOW dentures?
Q38. Have you been a bit embarrassed because of problems with your VERY FAIRLY OCCAS- HARDLY NEVER DON'T
teeth, mouth or dentures? OFTEN OFTEN JONALLY EVER KNOW
Q39. Have you avoided going out because of problems with your VERY FAIRLY OCCAS- HARDLY NEVER DON'T
teeth, mouth or dentures? OFTEN OFTEN JONALLY EVER KNOW
Q40. Have you been less tolerant of your partner or family because of VERY FAIRLY OCCAS- HARDLY NEVER DON'T
problems with your teeth, mouth OFTEN OFTEN JONALLY EVER KNOW
or dentures?
Q41. Have you had trouble getting along with other people because VERY FAIRLY OCCAS- HARDLY NEVER DON'T
of problems with your teeth, OFTEN OFTEN JIONALLY EVER KNOW mouth or dentures?
Page 6

HOW OFTEN have you had the problem during the last year? (circle your answer)
Q42. Have you been a bit irritable with other people because of VERY FAIRLY OCCAS- HARDLY NEVER DON'T
problems with your teeth, mouth OFTEN OFTEN IONALLY EVER KNOW or dentures?
Q43. Have you had difficulty doing your usual jobs because of problems VERY FAIRLY OCCAS- HARDLY NEVER DON'T with your teeth, mouth or OFTEN OFTEN IONALLY EVER KNOW dentures?
Q44. Have you felt that your general health has worsened because of VERY FAIRLY OCCAS- HARDLY NEVER DON’T
problems with your teeth, mouth OFTEN OFTEN IONALLY EVER KNOW or dentures?
Q45. Have you suffered any financial loss because of probiems with VERY FAIRLY OCCAS- HARDLY NEVER DON'T
your teeth, mouth or dentures? OFTEN OFTEN IONALLY EVER KNOW
Q46. Have you been unable to enjoy other people's company as much VERY FAIRLY OCCAS- HARDLY NEVER DON’T
because of problems with your OFTEN OFTEN {ONALLY EVER KNOW teeth, mouth or dentures?
Q47. Have you felt that life in general was less satisfying because of VERY FAIRLY OCCAS- HARDLY NEVER DON’T
problems with your teeth, mouth OFTEN OFTEN JONALLY EVER KNOW or dentures?
Q48. Have you been totally unable to function because of problems VERY FAIRLY OCCAS- HARDLY NEVER DON'T
with your teeth, mouth or OFTEN OFTEN JONALLY EVER KNOW dentures?
Q49. Have you been unable to work to
your full capacity because of VERY FAIRLY OCCAS- HARDLY NEVER DON’T
problems with your teeth, mouth OFTEN OFTEN JONALLY EVER KNOW
or dentures?
Q50. Please write today’s date /_ J month day year
Page 7

APPENDIX B
Qualitative Interview Statement
196

UNIVERSITY MALAYA
JABATAN PERGIGIAN MASYARAKAT FAKULTI PERGIGIAN, UNIVERSITI MALAYA 50603 KUALA LUMPUR MALAYSIA
Department of Community Dentistry
Faculty of Dentistry, University of Malaya Tel: 603-7967 4805 50603 Kuala Lumpur Malaysia Fax: 603-7967 4532
Development of an Oral Health-Related Quality of Life Measure for the Malaysian Population: Cross-cultural Adaptation of the Oral Health Impact Profile
INFORMATION SHEET
(in-depth interview study)
What are we doing? As part of my PhD research I am developing a questionnaire that will assess the
problems that dental and oral diseases create for people in their day to day life. This questionnaire can be used in many ways — to help to determine the amount and type of dental care needed by the Malaysian population, or to tell us if the treatment we provide to patients does in fact improve their overall health and well-being. A questionnaire of this type, called the Oral Health Impact Profile, was developed in Australia and part of our work is to see if it will be useful for us to use here in Malaysia. We expect that the questionnaire will need to be modified in several ways to make it appropriate for the Malaysian population.
What would we like you to do? First, we would like to talk to you about the dental or oral problems that have brought
you to the Faculty today and the way these problems affect your daily life. We would like to tape record this interview to ensure that we get as much detailed information as possible. Then we would like to show you a copy of the Oral Health Impact Profile and have your opinions on the relevance and clarity of the questions it contains. Also we would like to know if your dental or oral condition causes you any problems that are not covered by these questions. The interview will take between 30 and 40 minutes to complete.
Your participation in this study is entirely voluntary and will not affect the services you receive from the Faculty of Dentistry. You may request that your interview is not recorded and you can decline to answer any of the questions you are asked. You are free to withdraw from the interview at any time.
What happens next? The questionnaire will be revised based on the comments of the people who take part
in this phase of the study. We will then do another study to see if the questionnaire is easy to complete and acceptable to the Malaysian population on whom it will be used. We will then use it in further studies to make sure that it does measure how dental and oral problems affect
the well-being of Malaysians.
Investigator: Dr Roslan Saub, Department of Community Dentistry, Faculty of Dentistry, University of Malaya.
Phone number: 7967 4551/4805/4856 Email: [email protected]
N:\Windows NT 5.0 Workstation Profile\My Documents\Appendix\Appendix B -interviewinfo-English.doc

UNIVERSITY MALAYA
JABATAN PERGIGIAN MASYARAKAT FAKULTI PERGIGIAN, UNIVERSITI MALAYA
50603 KUALA LUMPUR MALAYSIA
Department of Community Dentistry
Faculty of Dentistry, University of Malaya Tel: 603-7967 4805 530603 Kuala Lumpur Malaysia Fax: 603-7967 4932
“Development of an Oral Health-Related Quality of Life Measure for the Malaysian Population: Cross-cultural Adaptation of the Oral Health Impact Profile”
MAKLUMAT KAJIAN (Kajian Temu Ramah)
Apa yang kami buat? Saya sedang menghasilkan satu borang kajiselidik untuk menilai kesan masalah pergigian ke
atas kehidupan seharian seseorang sebagai sebahagian dari projek PhD saya. Borang kajiselidik ini boleh digunakan dalam berbagai cara — membantu di dalam menentukan kuantiti dan jenis penjagaan pergigian yang diperlukan oleh masyarakat Malaysia, atau memberitahu kita samada rawatan yang
diberikan kepada pesakit telah meningkatkan mutu keseluruahan kesihatan dan kesejahteran hidup. Borang kejiselidik seperti ini yang dikenali sebagai “Profile kesan kesihatan mulut” yang telah dibentuk di Australia dan sebahagian dari kerja saya ialah untuk mengkaji samada borang kajiselidik ini sesuai untuk digunakan di Malaysia. Saya menjangkakan borang ini perlu divbahsui dalam beberapa cara untuk disesuikan bagi kegunaan di Malaysia.
Apa yang kami hendak anda lakukan?
Pertamanya kami ingin menemu ramah anda tentang masalah pergigian yang anda alami yang telah membawa anda ke Fakulti Pergigian ini dan juga kami ingin mengetahui bagaimana masalah tersebut memberi kesan ke atas kehidupan seharian anda. Kami ingin merakamkan temu ramah ini untuk memastikan kami dapat semua maklumat secara terperinci yang mungkin. Kemudian kami akan memberikan kepada anda borang kajiselidik “Profile Kesan Kesihatan Mulut” untuk mendapatkan pendapat anda samada soalan yang terkandung di dalam borang tersebut releven dan jelas. Kami juga ingin mengetahui jika ada masalah yang anda hadapi disebabkan masalah pergigian anda yang tidak terdapat di dalam borang kajiselidik ini. Temu ramah ini akan mengambil masa selama lebih kurang 30 —40 minit.
Penglibatan anda di dalam kajian ini adalah secara sukarela dan ia tidak akan menjejaskan perkhidmatan yang anda terima di Fakulti Pergigian. Anda boleh meminta supaya temu ramah anda tidak dirakamkan dan anda boleh untuk tidak menjawab mana-mana soalan yang ditanya. Anda boleh untuk menarik diri pada bila-bila masa sahaja.
Apa yang berlaku kemudian? Borang kajiselidik tersebut akan dikaji semula berpandukan kepada komen yang diberikan
oleh mereka yang terlibat di dalam temu ramah ini. Kami kemudian akan menjalankan satu lagi kajian untuk melihat samada borang kajisedik yang telah dihasilkan mudah untuk dijawab dan sesuai untuk masyarakt Malaysia. Kemudian kami akan menjalankan kajiselidik seterusnya dengan menggunakan borang kajiselidik ini untuk memastikan ia dapat mengukur kesan masalah pergigian keatas kesejahteran hidup seseorang.
Penyelidik: Dr Rosian Saub, Jabatan Pergigian Masyarakat, Fakulti Pergigian, Universiti Malaya. Phone number: 7967 455 1/4805/4856 Email: [email protected]
N:\Windows NT 5.0 Workstation Profile\My Documents\Appendix\Appendix B-interviewinfo-bahasa.doc

APPENDIX C
Consent Form — Qualitative Interview
197

Appendix C
UNIVERSITY MALAYA
JABATAN PERGIGIAN MASYARAKAT FAKULTI PERGIGIAN, UNIVERSITI MALAYA $0603 KUALA LUMPUR MALAYSIA
Department of Community Dentistry
Faculty of Dentistry, University of Malaya me pone tes 50603 Kuala Lumpur Malaysia “oe
CONSENT FORM
(In-depth interview study)
This consent form is to indicate my agreement to participate in the study “Development of an oral health-related quality of life measure for the Malaysian population; Cross-cultural adaptation of the Oral Health Impact Profile”.
I have been informed that the study is part of the PhD project of Dr Roslan Saub and aims to develop a questionnaire which can measure the way in which oral diseases and disorders affect people in their everyday life. I have been informed that I will be asked to participate in an interview of approximately 30 to 40 minutes in which I will be asked
questions concerning my dental and oral problems and the way in which they affect my daily
activities such as eating, communicating with others and how I feel about myself. I have been informed that this interview will be tape-recorded. I have also been informed that I will be asked to examine an existing questionnaire (the Oral Health Impact Profile) to see if it does or
does not describe adequately things that happen to me because of oral problems. I will be asked to comment on the content of the questionnaire and the relevance and clarity of the questions that it contains.
I understand that my participation is entirely voluntary and I can either refuse to take part, or if I do take part to refuse to answer any questions that I might be asked. I understand that I can also withdraw at any time during the interview and also request that the tape recorder is not used to record my comments. I understand that a refusal to take part or to answer any questions will not affect my receipt of any services provided by the Faculty of Dentistry, University of Malaysia. I have been assured that all information I give will remain completely confidential and my name will not appear on any forms or documents other than this consent form or appear in any papers or reports based on the study. I understand that I will not benefit from taking part in the study.
Name Signature
Date
Witness
[1
N:\Windows NT 5.0 Workstation Profile\My Documents\Appendix\Appendix C- interviewconsent-English.doc

UNIVERSITY MALAYA
JABATAN PERGIGIAN MASYARAKAT FAKULTI PERGIGIAN, UNIVERSITI MALAYA 50603 KUALA LUMPUR MALAYSIA
Department of Community Dentistry
Faculty of Dentistry, University of Malaya Tel. 603-7967 4805
50603 Kuala Lumpur Malaysia Fax: 603-7967 4532
SURAT PERAKUAN (Kajian Temu Ramah)
‘Surat perakuan ini menandakan yang saya bersetuju untuk melibatserta di dalam kajian yang bertajuk “Development of an oral health-related quality of life measure for the Malaysian population; Cross-cultural adaptation of the Oral Health Impact Profile”.
Saya telah diberitahu bahawa kajian ini adalah sebahagian daripada Projek PhD Dr Roslan Saub yang bertujuan untuk menghasilkan satu borang soalselidik yang boleh digunakan untuk mengukur kesan masalah pergigian keatas kehidupan seharian seseorang. Saya diberitahu bahawa saya dikehendaki terlibat di dalam satu temu ramah yang akan mengambil masa selama lebihkurang 30 - 40 minit di mana saya akan ditanya soalan berkaitan dengan masalah mulut dan gigi dan kesannya keatas kehidupan seharian saya seperti makan, berkomunikasi dengan orang lain dan bagaimana saya merasakan tentang diri saya sendiri. Saya diberitahu bahawa temu ramah ini akan dirakamkan. Saya juga dikehendaki meneliti borang kajiselidik yang sediaada (Profile Kesan Kesihatan Mulut) untuk melihat samada borang ini mengambarkan sepenuhnya perkara yang berlaku ke atas diri saya yang disebabkan oleh masalah mulut dan gigi. Saya juga dikehendaki untuk memberikan komen tentang kandungan borang kajiselidik tersebut samada soalan—soalan yang terkandung relevan dan jelas.
Saya faham bahawa penglibatan saya di dalam kajian ini adalah sukarela dan saya boleh untuk tidak terlibat di dalam kajian tersebut dan jika saya terlibat saya boleh untuk tidak menjawab mana- mana soalan yang ditanya kepada saya. Saya faham bahawa saya juga boleh menarik diri pada bila- bila masa semasa temu ramah dijalankan dan saya juga boleh meminta supaya komen saya tidak dirakamkan. Saya juga faham bahawa jika saya tidak mahu terlibat di dalam kajian tersebut atau menjawab mana-mana soalan yang diajukan kepada saya tidak akan menjejaskan perkhidmatan yang diberikan oleh Fakulti Pergigian Universiti Malaya kepada saya. Saya telah diberi jaminan bahawa segala maklumat yang saya berikan akan dianggap sulit dan nama saya tidak akan digunakan di dalam apa-apa borang atau dokumen melainkan borang perakuan ini atau dalam mana-mana laporan berkaitan dengan kajian ini. Saya faham saya tidak mempunyai sebarang keuntungan dari menyertai kajian ini.
Nama Tandatangan
Tarikh
Saksi
LT]
N:\Windows NT 5.0 Workstation Profile\My Documents\Appendix\Appendix C- interviewconsent-bahasa.doc

APPENDIX D
Guidelines - Qualitative Interview
198

CHECKLIST FOR INTERVIEWS
What is your reason for coming today?
How long you have this............ (the problem)?
Can you tell me little bit more about your problem?
How does this............ (problem) affect your daily life?
Eating?
Difficulty chewing food?
Avoiding some food?
The taste of the food?
Speech?
Appearance?
Work?
Relationship with family, friends etc.?
Mood change?
Sleep?
Pain and discomfort?
Oral care?
Do you wear dentures or any prosthesis? If “Yes”
What type of denture do you wear?
Can you tell me your experience wearing dentures?
Demography information:
N:\Windows NT 5.0 Workstation Profile\My Documents \Appendix\Appendix D -interview guideline.doc

SENARAI SEMAK UNTUK TEMU RAMAH
Apakah tujuan kehadiran anda hari ini?
Berapa lama anda telah mengalami........... (masalah)?
Bolehkah anda beritahu saya lebih lanjut berkaitan dengan.......
(masalah)?
Bagaimana......... (masalah) memberi kesan ke atas kehidupan seharian
anda?
Makan?
Kesukaran mengunyah?
Cegah sesetengah makanan?
Rasa makanan?
Pertuturan?
Rupa-paras?
Kerja?
Perhubungan dengan keluarga dan rakan.?
Peruabhan mood?
Tidur?
Kesakitan dan ketidak selesaan?
Penjagaan mulut?
Adakah anda memakai gigi palsu atau sebarang prostesis? Jika “Ya”
Apakah jenis gigi palsu anda pakai?
Bolehkah anda beritahu saya pengalaman anda memakai gigi palsu?
informasi demografi: COP OORT ee OTE ORE EE E O ERHO E e
N:\Windows NT 5.0 Workstation Profile\My Documents \Appendix\ Appendix D -interview guideline.doc

APPENDIX E
Malaysian Oral Health Impact Profile Questionnaire — Long Form
L-OHIPC™)
199

UNIVERSITI MALAYA
JABATAN PERGIGIAN MASYARAKAT
FAKULTI PERGIGIAN, UNIVERSITI MALAYA
50603 KUALA LUMPUR MALAYSIA
Department of Community Dentistry
Faculty of Dentistry, University of Malaya
50603 Kuala Lumpur Malaysia
BORANG SOAL SELIDIK PROFIL KESAN KESIHATAN MULUT
L-OHIP(M)
ID:CILILIC

KAM! AMAT MENGHARGAI JASA BAIK ANDA MELUANGKAN SEDIKIT MASA UNTUK MENJAWAB BORANG SOAL SELIDIK INI.
BAHAGIAN A Bahagian ini ingin mengetahui sejauh mana masalah berkaitan dengan gigi, mulut atau gigi palsu mengganggu kehidupan seharian anda. Kami ingin mengetahui berapa kerap anda
pemah mengalami masalah yang tersenarai sepanjang SETAHUN YANG LEPAS. Apa yang anda perlu lakukan ialah menanda (V) pada kotak yang disediakan untuk setiap soalan- soalan berikut.
BERAPA KERAPKAH ANDA MENGALAMI MASALAH-MASALAH YANG TERSENARAI SEPANJANG SETAHUN YANG LEPAS.
(Tandakan ¥ untuk jawapan anda)
Pejabat
Ai) Pernahkah anda mengalami kesukaran mengunyah sebarang makanan [at disebabkan masalah gigi, mulut atau gigi palsu anda?
[ISANGAT [| /KERAP [_|KADANG- [| |SEKALI- [| |TIDAK | |TIDAK KERAP KADANG SEKALA PERNAH TAHU
A2) Pernahkah anda mengalami kesukaran menyebut sebarang perkataan | ta2 disebabkan masalah gigi, mulut atau gigi palsu anda?
[JSANGAT [| |KERAP | |KADANG- | |SEKALI- [| |TIDAK | |TIDAK KERAP KADANG SEKALA PERNAH TAHU
A3) Pernahkan anda merasakan wajah anda terjejas disebabkan masalah gigi, [las mulut atau gigi palsu anda?
[ISANGAT [| |KERAP | |KADANG- [| |SEKALI- [ |TIDAK [_ ]TIDAK KERAP KADANG SEKALA PERNAH TAHU
A4) Pernahkah anda merasakan yang masalah gigi, mulut atau gigi palsu anda [jaa menyebabkan nafas anda berbau?
[|ISANGAT [| |KERAP [ |KADANG- [ |SEKAL- [ |TIDAK []TIDAK KERAP KADANG SEKALA PERNAH TAHU
A5) Pernahkah anda merasakan makanan yang dimakan tidak hadam dengan | [_|as baik disebabkan masalah gigi, mulut atau gigi palsu anda?
[]SANGAT [| |KERAP | |KADANG- [| |SEKALI- [ /TIDAK | |TIDAK KERAP KADANG SEKALA PERNAH TAHU
iD: OOF 2

BERAPA KERAPKAH ANDA MENGALAMI MASALAH-MASALAH YANG TERSENARAI SEPANJANG SETAHUN YANG LEPAS.
(Tandakan ¥ untuk jawapan anda)
AB)
A7)
A8)
AQ)
A10)
A11)
A12)
Pernahkah anda mengailami sakit rahang?
[ |ISANGAT | |KERAP [| |KADANG- | |SEKALI- [ |TIDAK | |TIDAK KERAP KADANG SEKALA PERNAH TAHU
Pernahkah anda mengalami masaiah gigi, mulut atau gigi palsu yang menyebabkan anda sakit kepala?
[|SANGAT | |KERAP | |KADANG- | |SEKALI- [| /TIDAK | |TIDAK KERAP KADANG SEKALA PERNAH TAHU
Pernahkah anda mengalami rasa ngilu pada gigi, contohnya apabila terkena air atau makanan panas atau sejuk?
| _|TIDAK BERKAITAN - SAYA TIDAK MEMPUNYAI GIGI SENDIRI.
[JSANGAT | IKERAP | |KADANG- [| |SEKALI- | /TIDAK | |TIDAK KERAP KADANG SEKALA PERNAH TAHU
Pernahkah anda mengalami sakit gigi?
[_|TIDAK BERKAITAN - SAYA TIDAK MEMPUNYAI GIG! SENDIRI.
[ISANGAT [| |KERAP [| |KADANG- [| |SEKALI- | |TIDAK | |TIDAK KERAP KADANG SEKALA PERNAH TAHU
Pernahkah anda mengalami sakit gusi?
[_ISANGAT | |KERAP | |KADANG- | |SEKALI- | |TIDAK | |TIDAK KERAP KADANG SEKALA PERNAH TAHU
Pernahkah anda mengalami rasa tidak selesa untuk makan sebarang makanan disebabkan masalah gigi, mulut atau gigi palsu anda?
[]SANGAT [| |KERAP [| |KADANG- [ |SEKALL- [ |TIDAK [_|TIDAK KERAP KADANG SEKALA PERNAH TAHU
Pernahkah anda mengalami tompok-tompok putih yang pedih (Ulser) di dalam mulut?
[ISANGAT [| |KERAP [| |KADANG- [| |SEKALI- [| |TIDAK [ |TIDAK KERAP KADANG SEKALA PERNAH TAHU
ID: CILIC I
Pejabat
| |a6
[| Aq
[las
[las
[ato
[Jan
| dan

BERAPA KERAPKAH ANDA MENGALAMI MASALAH-MASALAH YANG TERSENARAI SEPANJANG SETAHUN YANG LEPAS.
(Tandakan V untuk jawapan anda)
A13)
A14)
A15)
A16)
A17)
A18)
Pernahkah anda merasakan yang gigi palsu anda longgar semasa anda memakainya?
|_| TIDAK BERKAITAN - SAYA TIDAK MEMAKAI GIGI PALSU.
[ISANGAT [| |KERAP [| |KADANG- [| |SEKALI- [| ITIDAK [ |TIDAK KERAP KADANG SEKALA PERNAH TAHU
Pernahkah anda merasa kurang selesa dengan gigi palsu anda?
|_|TIDAK BERKAITAN - SAYA TIDAK MEMAKAI GIGI PALSU.
[ISANGAT | |KERAP [| |KADANG- | |SEKALI- | |TIDAK [ |TIDAK KERAP KADANG SEKALA PERNAH TAHU
Pernahkah anda merasa risau dengan masalah gigi, mulut atau gigi palsu anda?
[ISANGAT [ |KERAP [| |KADANG- | |SEKALI- [| |TIDAK | |TIDAK KERAP KADANG SEKALA PERNAH TAHU
Pernahkah anda merasa tidak selesa disebabkan makanan terlekat di celah
gigi atau gigi palsu anda?
[-JSANGAT [| |KERAP [| |KADANG- [| |SEKALI- | /TIDAK | |TIDAK KERAP KADANG SEKALA PERNAH TAHU
Pernahkah anda merasa malu disebabkan masalah gigi, mulut atau gigi palsu anda?
(_ISANGAT | |KERAP [| |KADANG- | |SEKALI- [| |TIDAK |_|TIDAK KERAP KADANG SEKALA PERNAH TAHU
Pernahkah anda merasa tidak selesa dengan penampilan gigi, mulut atau gigi palsu anda?
[]SANGAT [ |KERAP [.|KADANG- [ /SEKALI- | |TIDAK | |TIDAK KERAP KADANG SEKALA PERNAH TAHU
ID: ILICIL]
Pejabat
[dan
[lai
[jas
late
[law
[las

BERAPA KERAPKAH ANDA MENGALAMI MASALAH-MASALAH YANG TERSENARAI SEPANJANG SETAHUN YANG LEPAS.
(Tandakan V untuk jawapan anda)
A19)
A20)
A21)
A22)
A23)
A24)
A25)
Pernahkah anda merasa tertekan disebabkan masalah gigi, mulut atau gigi palsu anda?
[ISANGAT [|_|KERAP [| |KADANG- | |SEKALI- | /TIDAK | |TIDAK KERAP KADANG SEKALA PERNAH TAHU
Pernahkah pertuturan anda menjadi tidak jelas disebabkan masalah gigi, mulut atau gigi palsu anda?
[ISANGAT [ |KERAP | |KADANG- [| |SEKALI- | [TIDAK [ |TIDAK KERAP KADANG SEKALA PERNAH TAHU
Pernahkah orang tersalah faham sesetengah perkataan yang anda sebutkan disebabkan masalah gigi, mulut atau gigi palsu anda?
[ISANGAT [| |KERAP | |KADANG- | [SEKALI- | |TIDAK | ]TIDAK KERAP KADANG SEKALA PERNAH TAHU
Pernahkah anda merasa makanan yang dimakan kurang sedap disebabkan masalah gigi, mulut atau gigi palsu anda?
[_ISANGAT [ |KERAP [| |KADANG- | |SEKALI- [ |TIDAK | |TIDAK KERAP KADANG SEKALA PERNAH TAHU
Pernahkah anda mengalami kesukaran untuk memberus gigi dengan sempurna disebabkan masalah gigi, mulut atau gigi palsu anda?
[ISANGAT [| |KERAP [| |KADANG- [ |SEKALL- [_ |TIDAK | |TIDAK KERAP KADANG SEKALA PERNAH TAHU
Pernahkah anda mengelak daripada memakan makanan tertentu disebabkan masalah gigi, mulut atau gigi palsu anda?
[]SANGAT | |KERAP [ |KADANG- [ |SEKALI- [_|TIDAK | |TIDAK KERAP KADANG SEKALA PERNAH TAHU
Pernahkah anda tidak dapat makan makanan kesukaan anda disebabkan
masalah gigi, mulut atau gigi palsu anda?
[|ISANGAT [| |KERAP [| |KADANG- [| |SEKALI- [_|TIDAK | |TIDAK KERAP KADANG SEKALA PERNAH TAHU
DIO
Pejabat
| las
|_| a20
[a2
[| a2s
[laze
|| aos

BERAPA KERAPKAH ANDA MENGALAMI MASALAH-MASALAH YANG TERSENARAI SEPANJANG SETAHUN YANG LEPAS.
(Tandakan V untuk jawapan anda)
A26)
A27)
A28)
A29)
A30)
A31)
Pernahkah anda mengalami kesukaran untuk makan dengan menggunakan gigi palsu anda disebabkan masalah padanya?
[| TIDAK BERKAITAN - SAYA TIDAK MEMAKAI GiGi PALSU.
[-|SANGAT | |KERAP [ |KADANG- [| |SEKALI- [| |TIDAK |_ |TIDAK KERAP KADANG SEKALA PERNAH TAHU
Pernahkah anda mengelak daripada senyum disebabkan masalah gigi, mulut
atau gigi palsu anda?
[ISANGAT [| |KERAP [| |KADANG- [| |SEKALI- [| |TIDAK [_|TIDAK KERAP KADANG SEKALA PERNAH TAHU
Pernahkah makan anda terganggu seketika disebabkan masalah gigi, mulut atau gigi palsu anda?
[ISANGAT [| |KERAP [| |KADANG- [| |SEKALI- (| /TIDAK [_|TIDAK KERAP KADANG SEKALA PERNAH TAHU
Pernahkah tidur anda terganggu disebabkan masalah gigi, mulut atau gigi palsu anda?
[ |SANGAT [| |KERAP | |KADANG- | |SEKALI- | /TIDAK | |TIDAK KERAP KADANG SEKALA PERNAH TAHU
Pernahkah anda merasa sedih disebabkan masalah gigi, mulut atau gigi palsu anda?
[]SANGAT [| |KERAP | |KADANG- [ |SEKALI- [ (TIDAK |_|TIDAK KERAP KADANG SEKALA PERNAH TAHU
Pernahkah anda berasa sukar untuk relaks disebabkan masalah gigi, mulut atau gigi palsu anda?
[ISANGAT [| |KERAP [ /KADANG- [ |SEKALL [ |TIDAK | |TIDAK KERAP KADANG SEKALA PERNAH TAHU
ID:CILILIL)
Pejabat
| are
[a7
[| ars
| | a29
[| A30
[Jas

BERAPA KERAPKAH ANDA MENGALAMI MASALAH-MASALAH YANG TERSENARAI SEPANJANG SETAHUN YANG LEPAS.
(Tandakan V untuk jawapan anda)
A32)
A33)
A34)
A35)
A36)
A37)
Pernahkah anda merasa murung disebabkan masalah gigi, mulut atau gigi palsu anda?
[ISANGAT | |KERAP [| |KADANG- | |SEKALI- [ |TIDAK | |TIDAK KERAP KADANG SEKALA PERNAH TAHU
Pernahkah tumpuan anda terganggu disebabkan masalah gigi, mulut atau gigi palsu anda?
[ISANGAT | |KERAP | |KADANG- | |SEKALI- [ |TIDAK [ |TIDAK KERAP KADANG SEKALA PERNAH TAHU
Pernahkah anda merasa kurang selera makan disebabkan masalah gigi, muiut atau gigi palsu anda?
[ISANGAT | |KERAP | |KADANG- [| |SEKAL- | /TIDAK [ ]TIDAK KERAP KADANG SEKALA PERNAH TAHU
Pernahkah anda mengelak daripada keluar berjalan-jalan disebabkan masalah gigi, mulut atau gigi palsu anda?
[-JSANGAT [| |KERAP | |KADANG- [ |SEKALI- [ |TIDAK | |TIDAK KERAP KADANG SEKALA PERNAH TAHU
Pernahkah anda menjadi kurang bertolak-ansur dengan pasangan atau
keluarga anda disebabkan masalah gigi, mulut atau gigi palsu anda?
[]SANGAT [ |KERAP [| |KADANG- [ |SEKALI- [| /TIDAK | |TIDAK KERAP KADANG SEKALA PERNAH TAHU
Pernahkah anda tidak dapat bergaul dengan orang lain disebabkan masalah gigi, mulut atau gigi palsu anda?
[ISANGAT [| |KERAP [ |KADANG- [| |SEKALL- [| |TIDAK ( |TIDAK KERAP KADANG SEKALA PERNAH TAHU
IDS ICILILI
Pejabat
| | a32
[| A33
[| A34
[| A35
[| a36
das

BERAPA KERAPKAH ANDA MENGALAMI MASALAH-MASALAH YANG TERSENARAI SEPANJANG SETAHUN YANG LEPAS.
(Tandakan V untuk jawapan anda)
A38)
A39)
A40)
A41)
A42)
A43)
Pernahkah anda menjadi cepat marah terhadap orang lain disebabkan masalah gigi, mulut atau gigi palsu anda?
[|ISANGAT [| |KERAP [| |KADANG- [ |SEKALI- [ |TIDAK | |TIDAK KERAP KADANG SEKALA PERNAH TAHU
Pernahkah anda mengalami masalah untuk menjalankan kerja-kerja harian anda disebabkan masalah gigi, mulut atau gigi palsu anda?
[ISANGAT [| |KERAP [| |KADANG- [| |SEKALI- [_ |TIDAK [ |TIDAK KERAP KADANG SEKALA PERNAH TAHU
Pernahkah masaiah gigi, mulut atau gigi palsu anda menyebabkan anda merasa tidak sihat?
[|ISANGAT [| |KERAP [| |KADANG- | |SEKALI- | |TIDAK | \TIDAK KERAP KADANG SEKALA PERNAH TAHU
Pernahkah anda terpaksa mengeluarkan perbelanjaan yang tinggi
disebabkan masalah gigi, mulut atau gigi palsu anda?
[ISANGAT | |KERAP [| |KADANG- [ |SEKALI- [| |TIDAK []TIDAK KERAP KADANG SEKALA PERNAH TAHU
Pernahkah anda merasa kurang gembira berada bersama dengan orang lain disebabkan masaiah gigi, mulut atau gigi palsu anda?
[]SANGAT [| |KERAP [| |KADANG- | |SEKALI- | |TIDAK | |TIDAK KERAP KADANG SEKALA PERNAH TAHU
Pernahkah anda merasa kurang berpuashati dengan kehidupan anda disebabkan masalah gigi, mulut atau gigi palsu anda?
[JSANGAT [ |KERAP [| |KADANG- [| |SEKALI- [| |TIDAK [ |TIDAK KERAP KADANG SEKALA PERNAH TAHU
IDs CILIC)
Pejabat
| lass
[lass
[| A40
[| Adl
[| Aq
[| A43

BERAPA KERAPKAH ANDA MENGALAMI MASALAH-MASALAH YANG TERSENARAI SEPANJANG SETAHUN YANG LEPAS.
(Tandakan V untuk jawapan anda)
A44) Pernahkah anda merasa kurang yakin dengan diri anda disebabkan masalah gigi, mulut atau gigi palsu anda?
[ISANGAT | |KERAP | /KADANG- | |SEKALI- [| TIDAK (_ |TIDAK KERAP KADANG SEKALA PERNAH TAHU
A45) Pernahkah anda menghadapi masalah untuk melaksanakan kerja sepenuh kemampuan anda disebabkan masalah gigi, mulut atau gigi palsu anda?
[ISANGAT [| |KERAP | |KADANG- [ |SEKALI- | /|TIDAK | |TIDAK KERAP KADANG SEKALA PERNAH TAHU
BAHAGIAN B
Pejabat
[| Add
[| A45
Bahagian ini adalah bertujuan untuk mengetahui pendapat anda secara keseluruhan berkaitan dengan kesihatan mulut anda. Apa yang anda perlu lakukan ialah hanya
menandakan (V) pada kotak yang disediakan untuk setiap soalan dibawah ini.
Bi) Pada pendapat anda, kesihatan mulut anda pada tahap?
| |SANGAT | |BAIK | _|SEDERHANA | ]BURUK BAIK
B2) Adakah anda merasakan yang anda memeriukan rawatan pergigian?
[ |YA | |TIDAK
B3) Adakah anda berpuashati dengan kesihatan mulut anda sekarang?
| |YA | |TIDAK
ID:CICILIT
Pejabat
(|p
[|e
[lps

BAHAGIAN C Bahagian ini adalah berkenaan gigi dan gigi palsu anda. Anda hanya perlu tandakan (7) pada kotak yang disediakan untuk soalan-soalan berikut.
C1) Adakah anda telah kehilangan kesemua gigi bahagian atas? a
[_]YA | |TIDAK
C2) Adakah anda telah kehilangan kesemua gigi bahagian bawah? [le
[YA | |TIDAK
C3) Adakah anda memakai gigi palsu atas? lle
[_]YA | |TIDAK
C4) Adakah anda memakai gigi palsu bawah? | ea
_|YA | |TIDAK
BAHAGIAN D Bahagian ini adalah berkenaan latarbelakang anda. Anda hanya perlu isikan tempat kosong
yang disediakan atau tandakan (Vv) yang mana berkenaan pada soalan-soalan berikut.
Pejabat
D1) Tarikh lahir anda: / { [ip Hari bulan Tahun
D2) Jantina: | |Lelaki | |Perempuan | _|pe
D3) Bangsa: [ |Melayu [ |Cina | lindia [ |Lain-lain [lps (Nyatakan:....... ee )
D4) Tahap pendidikan tertinggi: | |Tidak bersekolah [_|pa
| \Sekolah Rendah
| _|Sekolah Menengah
| Universiti
[ |Lain-lain, (Nyatakan:........0000c6cccccceeces ) KAMI MENGUCAPKAN RIBUAN TERIMA KASIH.
IDC ICILIC] 10

APPENDIX F
Malaysian Oral Health Impact Profile Questionnaire — Short Form
S-OHIP(M)
200

UNIVERSITI MALAYA
JABATAN PERGIGIAN MASYARAKAT
FAKULTI PERGIGIAN, UNIVERSITI MALAYA
50603 KUALA LUMPUR MALAYSIA Department of Community Dentistry
Faculty of Dentistry, University of Malaya
50603 Kuala Lumpur Malaysia
BORANG SOAL SELIDIK PROFIL KESAN KESIHATAN MULUT
S-OHIP(M)
mL ICICI]

KAM! AMAT MENGHARGAI JASA BAIK ANDA MELUANGKAN SEDIKIT MASA UNTUK MENJAWAB BORANG SOAL SELIDIK INI.
BAHAGIAN A Bahagian ini ingin mengetahui sejauh mana masalah berkaitan dengan gigi, mulut atau gigi palsu mengganggu kehidupan seharian anda. Kami ingin mengetahui berapa kerap anda pernah mengalami masalah yang tersenarai sepanjang SETAHUN YANG LEPAS. Apa yang
anda perlu lakukan ialah menanda (Vv) pada kotak yang disediakan untuk setiap soalan- soalan berikut.
BERAPA KERAPKAH ANDA MENGALAMI MASALAH-MASALAH YANG TERSENARAI SEPANJANG SETAHUN YANG LEPAS.
(Tandakan ¥ untuk jawapan anda)
Pejabat
A1) Pernahkah anda mengalami kesukaran mengunyah sebarang makanan Plat disebabkan masalah gigi, mulut atau gigi palsu anda?
| |ISANGAT [ |KERAP [| |KADANG- [| |SEKALL- [ |TIDAK | |TIDAK KERAP KADANG SEKALA PERNAH TAHU
A2) Pernahkah anda merasakan yang masalah gigi, mulut atau gigi palsu anda [laa menyebabkan nafas anda berbau?
| |ISANGAT [ |KERAP | |KADANG- [_|SEKALI- [ |TIDAK | |TIDAK KERAP KADANG SEKALA PERNAH TAHU
A3) Pernahkah anda mengalami rasa tidak selesa untuk makan sebarang (dan
makanan disebabkan masalah gigi, mulut atau gigi palsu anda?
[ ]SANGAT [ |KERAP [ |KADANG- [ |SEKALI- [ |TIDAK | |TIDAK KERAP KADANG SEKALA PERNAH TAHU
AA) Pernahkah anda mengalami tompok-tompok putih yang pedih (Ulser) di | lar
dalam mulut?
[ |SANGAT [| |KERAP = [|KADANG- [| |SEKALI- [ |TIDAK | |TIDAK KERAP KADANG SEKALA PERNAH TAHU
A5) Pernahkah anda merasa tidak selesa disebabkan makanan terlekat di celah [Als gigi atau gigi paisu anda?
| ISANGAT [ |/KERAP [ |KADANG- | |SEKAL-E [| |TIDAK [ |TIDAK KERAP KADANG SEKALA PERNAH TAHU
wm OOOo 2

BERAPA KERAPKAH ANDA MENGALAMI MASALAH-MASALAH YANG TERSENARAI SEPANJANG SETAHUN YANG LEPAS.
(Tandakan V untuk jawapan anda)
A6)
A7)
A8)
AQ)
A10)
A11)
Pernahkah anda merasa malu disebabkan masalah gigi, mulut atau gigi palsu anda?
| |SANGAT | |KERAP [_|KADANG- | |SEKALI- [ |TIDAK | ITIDAK KERAP KADANG SEKALA PERNAH TAHU
Pernahkah anda mengelak daripada memakan makanan tertentu disebabkan
masalah gigi, mulut atau gigi palsu anda?
[ JSANGAT [| |KERAP [| |KADANG- [| |SEKALI- | |TIDAK | |TIDAK KERAP KADANG SEKALA PERNAH TAHU
Pernahkah anda mengelak daripada senyum disebabkan masalah gigi, mulut
atau gigi paisu anda?
[-|SANGAT [| |KERAP [| |KADANG- | |SEKALI- [_|TIDAK [ |TIDAK KERAP KADANG SEKALA PERNAH TAHU
Pernahkah tidur anda terganggu disebabkan masaiah gigi, mulut atau gigi palsu anda?
[-|SANGAT | |KERAP [_|KADANG- [| |SEKALI- [| |TIDAK | |TIDAK KERAP KADANG SEKALA PERNAH TAHU
Pernahkah tumpuan anda terganggu disebabkan masalah gigi, mulut atau
gigi palsu anda?
[ ISANGAT | /KERAP [| |KADANG- [| |SEKALI- [ |TIDAK | |TIDAK KERAP KADANG SEKALA PERNAH TAHU
Pernahkah anda mengelak daripada keluar berjalan-jalan disebabkan masalah gigi, mulut atau gigi palsu anda?
[ |SANGAT [_|KERAP [| /KADANG- | |SEKAL- [| |TIDAK | |TIDAK KERAP KADANG SEKALA PERNAH TAHU
wri JC ILL)
Pejabat
[jai
[jaz
[aor
[| azo
[| A33
[| A3S

BERAPA KERAPKAH ANDA MENGALAMI MASALAH-MASALAH YANG TERSENARAI SEPANJANG SETAHUN YANG LEPAS.
(Tandakan ¥ untuk jawapan anda)
A12)
A13)
A14)
Pernahkah anda mengalami masalah untuk menjalankan kerja-kerja harian
anda disebabkan masalah gigi, mulut atau gigi palsu anda?
| |SANGAT | |KERAP [| |KADANG- [ |SEKALI- [ |TIDAK | |TIDAK KERAP KADANG SEKALA PERNAH TAHU
Pernahkah anda terpaksa mengeluarkan perbelanjaan yang tinggi disebabkan masalah gigi, mulut atau gigi palsu anda?
[ ]|SANGAT | |KERAP [| |KADANG- [ |SEKALI- [ |TIDAK [_|TIDAK KERAP KADANG SEKALA PERNAH TAHU
Pernahkah anda merasa kurang yakin dengan diri anda disebabkan masalah gigi, mulut atau gigi palsu anda?
| |SANGAT [| |KERAP [| |KADANG- [| |SEKALI [| |TIDAK | \TIDAK KERAP KADANG SEKALA PERNAH TAHU
BAHAGIAN B Bahagian ini adalah bertujuan untuk mengetahui pendapat anda secara keseluruhan berkaitan dengan kesihatan mulut anda. Apa yang anda perlu lakukan ialah hanya menandakan (V) pada kotak yang disediakan untuk setiap soalan dibawah ini.
B1)
B2)
B3)
Pada pendapat anda, kesihatan mulut anda pada tahap?
[_]SANGAT ( |BAIK |_|SEDERHANA [_ |BURUK BAIK
Adakah anda merasakan yang anda memerlukan rawatan pergigian?
[YA | |TIDAK
Adakah anda berpuashati dengan kesihatan mulut anda sekarang?
[_IYA | |TIDAK
wm: IL ILI]
Pejabat
[__]a39
[lai
[| aaa
Pejabat
[|p
| |p
| lps

BAHAGIAN C
Bahagian ini adalah berkenaan gigi dan gigi palsu anda. Anda hanya periu tandakan (V) pada kotak yang disediakan untuk soalan-soalan berikut.
C1) Adakah anda telah kehilangan kesemua gigi bahagian atas? Ma
[ \YA [_ |TIDAK
C2) Adakah anda telah kehilangan kesemua gigi bahagian bawah? | le
[ |YA |_|TIDAK
C3) Adakah anda memakai gigi palsu atas? lle
[ lYA | |TIDAK
C4) Adakah anda memakai gigi palsu bawah? ( Jea
| YA | |TIDAK
BAHAGIAN D Bahagian ini adalah berkenaan latarbelakang anda. Anda hanya perlu isikan tempat kosong yang disediakan atau tandakan (V) yang mana berkenaan pada soalan-soalan berikut.
Pejabat
D1) Tarikh lahir anda: / / [|p Hari bulan Tahun
D2) Jantina: | |Lelaki | |Perempuan [|p
D3) Bangsa: [ |Melayu [| /Cina | lindia [|Lain-lain [Ips (Nyatakan:.........c ccc )
D4) Tahap pendidikan tertinggi: |_|Tidak bersekolah [ |ps
| Sekolah Rendah
|__|Sekolah Menengah
| |Universiti KAM! MENGUCAPKAN RIBUAN TERIMA KASIH.
wi JOO 5

APPENDIX G
Introductory Letter - Mail Respondents
201

UNIVERSITY MALAYA
JABATAN PERGIGIAN MASYARAKAT
FAKULTI PERGIGIAN, UNIVERSITI MALAYA 50603 KUALA LUMPUR MALAYSIA
Department of Community Dentistry
Faculty of Dentistry, University of Malaya Tel: 603-7967 4805 50603 Kuala Lumpur Malaysia Fax: 603-7967 4532
Tarikh: ..... 0c... eee ee
Tuan/Puan,
Kaji selidik kesan kesihatan mulut masyarakat Malaysia.
Saya sedang menjalankan kajian untuk mengetahui sejauh mana penyakit pergigian memberi kesan ke atas kualiti hidup seseorang. Ini adalah sejajar dengan matlamat Kementerian Kesihatan untuk melahirkan masyarakat yang sihat dan mempunyai kualiti hidup yang tinggi. Oleh itu maklumat berkenaan dengan kesan penyakit pergigian adalah perlu bagi membolehkan kerajaan merancang perkhidmatan pergigian Malaysia dengan lebih berkesan dan seterusnya melahirkan masyarakat sihat.
Maka dengan itu saya meminta jasabaik tuan/puan untuk mengisi borang kajiselidik yang dikepilkan dan mengembalikan borang yang telah lengkap diisi kepada saya dengan mengunakan sampul surat yang disertakan bersama. Jawapan dari tuan/puan adalah penting untuk memastikan satu gambaran sebenar berkenaan perkara tersebut.
Di sini saya memberi jaminan kepada tuan/puan bahawa segala maklumat yang tuan/puan berikan adalah rahsia. Nama tuan/puan tidak akan digunakakn didalam sebarang terbitan hasil dari kajiselidik ini.
Saya sertakan juga sebatang pen sebagai tanda terima kasih saya yang tidak terhingga kepada tuan/puan yang telah membantu saya di dalam projek ini.
Sekian, terlma kasih.
Yang benar,
Dr Rosian Saub
Email: [email protected]
Tel(off) : 03-7967 4551
PENCEGAHAN PUNCA KESTHATAN

APPENDIX H
Reminder Postcard — Mail Respondents
202

Tarikh:
Tuan/Puan,
Borang Kaji Selidik Profil Kesan Kesihatan Mulut
Saya ingin mengucapkan ribuan terima kasih kerana telah memulangkan borang kaji
selidik di atas. Jika tuan/puan belum berbuat demikian, saya sangat berharap jasa baik
tuan/puan untuk mengisi dan memulangkannya kepada saya dengan seberapa segera
kerana jawapan tuan/puan adalah amat penting.
Jika tuan/puan telah kehilangan borang tersebut, tuan/puan boleh menghubungi
Jururawat Pauline atau Puan Nani di talian berikut 03-7967 4856, 03-7967 4876 atau
emailkan kepada Dr Roslan Saub di alamat os . dan kami akan kirimkan
kepada tuan/puan borang yang baru.
Sekian, terima Kasih
Yang benar
Dr Roslan Saub
Setem Kepada
Jabatan Pergigian Masyarakat
Fakulti Pergigian Universiti Malaya
Lembah Pantai
50603 Kuala Lumpur

APPENDIX I
Second Reminder Letter — Mail Respondents
203

UNIVERSITY MALAYA
JABATAN PERGIGIAN MASYARAKAT
FAKULTI PERGIGIAN, UNIVERSITI MALAYA
50603 KDALA LUMPUR MALAYSIA
Department of Community Dentistry
Faculty of Dentistry, University of Malaya Tel: 603-7967 4805 50603 Kuala Lumpur Malaysia Fax: 603-7967 4532
Tuan/Puan,
Kaji selidik kesan kesihatan mulut masyarakat Malaysia.
Lebih kurang tiga minggu yang lepas saya ada menghantar borang kajiselidik kepada tuan/puan untuk mengetahui sejauh mana penyakit mulut memberi kesan ke atas kualiti hidup tuan/puan. Sehingga setakat ini saya belum lagi menerima borang jawaban dari tuan/puan.
Demi untuk mencapai matlamat Kementerian Kesihatan Malaysia untuk melahirkan masyarakat yang sihat dan mempunyai kualiti hidup yang tinggi, kerajaan perlu merancang perkhidmatan pergigian dengan lebih berkesan. Untuk tujuan tersebut, maklumat berkenaan dengan kesan penyakit pergigian adalah amat perlu. Maka dengan itu saya meminta jasabaik tuan/puan untuk mengisi borang kajiselidik tersebut kerana setiap jawapan dari tuan/puan adalah amat penting untuk kajian ini.
Bersama ini saya kepilkan sekali lagi borang kaji selidik tersebut. Saya sertakan juga sampul surat bersetem bagi memudahkan tuan/puan untuk mengembalikannya kepada saya.
Di sini saya memberi jaminan kepada tuan/puan bahawa segala maklumat yang tuan/puan berikan adalah rahsia. Nama tuan/puan tidak akan digunakan di dalam sebarang terbitan hasil dari kajiselidik ini.
Kerjasama tuan/puan amat saya hargai.
Sekian, terima kasih.
Yang benar,
Dr Roslan Saub
Penyelidik
Email: [email protected] Tel(off) 03-7967 4551/4805
PENCEGAHAN PUNCA KESTHATAN

APPENDIX J
Identification Letters — The Interviewers
204

UNIVERSITY MALAYA
JABATAN PERGIGIAN MASYARAKAT FAKULTI PERGIGIAN, UNIVERSITI MALAYA 50603 KUALA LUMPUR MALAYSIA
Department of Community Dentistry
Faculty of Dentistry, University of Malaya Tel: 603-7967 4805 50603 Kuala Lumpur Malaysia Fax: 603-7967 4532
SURAT PENGENALAN
Tuan/ Puan,
KAJISELIDIK KESAN KESIHATAN MULUT KE ATAS KEHIDUPAN HARIAN MASYARAKAT MALAYSIA.
Pembawa surat ini adalah seorang pelajar di Fakulti Pergigian, Universiti Malaya, yang telah dilantik dan dilatih oleh saya untuk menjalankan temubual dengan tuan/puan bagi tujuan kaji selidik di atas. Nama dan alamat beliau adalah seperti berikut:
Nama: 00... cece ceeeeecceneeceeneceeasenes
Alamat: ..0 000.000 cece ceeec ee ccaceceeesseeesesecesnecevaeeenenaeess
No. telefon: .........0.......0008
2) Jika tuan/puan mempunyai sebarang kemusykilan, tuan/puan bolehlah menghubungi saya seperti berikut:
Nama: Dr Roslan Saub Alamat tempat kerja: Jabatan Pergigian Masyarakat,
Fakulti Pergigian, Universiti Malaya
50603, Kuala Lumpur No. telefon tempat kerja: 03-7967455 1/4805 Email: [email protected]
Sekian, terima kasih
Yang benar,
Dr Roslan Saub
Penyelidik Email: [email protected]
Tel(off — direct) : 603-7967 4551
PENCEGAHAN PUNCA KESIHATAN

APPENDIX k
Appointment Card — Interview Respondents
205

Tarikh:
Tuan/Puan,
Kajian Kesan Kesihatan Mulut Ke Atas Kehidupan Seharian Masyarakat Malaysia
Saya telah hadir di rumah tuan/puan pada ........ fiw. ee , pukul ........ (pagi/petang) untuk menemuramah tuan/puan berkenaan kajian di atas tetapi tuan/puan tiada di rumah. Saya berharap tuan/puan dapat menghubungji saya di talian......................08 bagi membolehkan saya membuat temujanji dengan tuan/puan.
Sebarang pertanyaan berkenaan kaji selidik ini bolehlah dikemukan kepada Dr Roslan Saub (penyelidik) di talian 03-79674551/4805 atau emailkan kepada beliau di alamat
Sekian, terima Kasih
Yang benar
( ) Penemuramah
Setem Kepada
Jabatan Pergigian Masyarakat
Fakulti Pergigian
Universiti Malaya
Lembah Pantai
50603 Kuala Lumpur

APPENDIX L
Letter to the Police
206

UNIVERSITY MALAYA
JABATAN PERGIGIAN MASYARAKAT FAKULTI PERGIGIAN, UNIVERSITI MALAYA 50603 KUALA LUMPUR MALAYSIA
Department of Community Dentistry
° : . Tel: 603-7967 4805 Faculty of Dentistry, University of Malaya Fax: 603.7967 4532
50603 Kuala Lumpur Malaysia
24 Mei, 2002.
Ketua,
Polis Daerah Petaling
Tbu Pejabat Polis Petaling Jaya
46050 Petaling Jaya Selangor
Tuan,
KAJI SELIDIK KESAN PENYAKIT MULUT KE ATAS KEHIDUPAN SEHARIAN MASYARAKAT MALAYSIA.
Adalah dengan segala hormatnya saya merujuk kepada perkara tersebut di atas.
Dimaklumkan bahawa saya Dr Roslan Saub dari Jabatan Pergigian Masyarakat, Fakulti Pergigian, Universiti Malaya akan menjalankan satu kaji selidik seperti di atas. Kaji selidik
ini akan melibatkan penghuni-penghuni rumah yang berusia 18 tahun ke atas yang telah dipilih dalam kawasan tuan. Saya atau penemurah yang telah dilantik oleh saya akan membuat lawatan dari rumah ke rumah untuk menemubual dengan penghuni yang terpilih dalam proses pengumpulan data. Projek ini akan bermula pada pertengahan bulan Jun 2002 sehingga Ogos 2002.
Sekian dimaklumkan. Terima kasih
Yang benar,
Dr Roslan Saub
Email: [email protected] I a eee t ERE SEE e
Tel(off) : 603-7967 4551/4805
PENCEGAHAN PUNCA KESTHATAN

UNIVERSITY MALAYA
JABATAN PERGIGIAN MASYARAKAT
FAKULTI PERGIGIAN, UNIVERSITI MALAYA
50603 KUALA LUMPUR MALAYSIA
Department of Community Dentisiry
Faculty of Dentistry, University of Malaya Tel: 603-7967 4805 50603 Kuala Lumpur Malaysia Fax: 603-7967 4532
24 Mei, 2002.
Ketua,
Polis Daerah Shah Alam
Polis Di Raja Malaysia Persiaran Damai
Sekyen 11 40000 Shah Alam
Selangor
Tuan,
KAJI SELIDIK KESAN PENYAKIT MUOLUT KE ATAS KEHIDUPAN SEHARIAN MASYARAKAT MALAYSIA.
Adalah dengan segala hormatnya saya merujuk kepada perkara tersebut di atas.
Dimaklumkan bahawa saya Dr Roslan Saub dari Jabatan Pergigian Masyarakat, Fakulti Pergigian, Universiti Malaya akan menjalankan satu kaji selidik seperti di atas. Kaji selidik ini akan melibatkan penghuni-penghuni rumah yang berusia 18 tabun ke atas yang telah
dipilih dalam kawasan tuan. Saya atau penemurah yang telah dilantik oleh saya akan membuat lawatan dari rumah ke rumah untuk menemubual dengan penghuni yang terpilih dalam proses pengumpulan data. Projek ini akan bermula pada pertengahan bulan Jun 2002
sehingga Ogos 2002.
Sekian dimaklumkan. Terima kasih
Yang benar,
Dr Roslan Saub Email: [email protected]
Tel(off) : 603-7967 4551/4805
PENCEGAHAN PUNCA KESIHATAN

APPENDIX M
Introductory Letter From The Dean — Interview Respondents
207

UNIVERSITI MALAYA Pejabat Dekan/Office of the Dean Fakulti Pergigian/Faculn’ of Dentistry Universiti Malava
50603 Kuala Lumpur Malaysia
Tel No: 6-03-79674800
6-03-7956 5143 (DL) Fax : 6-03-7967 4809
e-mail: [email protected]
Dean: Professor Dr. Ishak Abdul Razak, BDS (Malava), DDPHRCS (England), MSe (London), PhD (Malaya) FICD
Bil Tuan/Your ref:
Bil. Kami/Our ref:
Tarikh
Tuan/Puan,
Kajian Kesan Penyakit Mulut ke atas Kehidupan Seharian Masyarakat Malaysia.
Saya ingin memaklumkan kepada tuan/puan bahawa Dr. Roslan Saub dari Jabatan Pergigian Masyarakat, Fakulti Pergigian, Universiti Malaya, sedang menjalankan kajian tersebut di atas untuk mengukur sejauh mana penyakit pergigian memberi kesan ke atas kehidupan seharian tuan/puan. Maklumat ini kelak dapat digunakan didalam merancang perkhidmatan pergigian di Malaysia dengan lebih berkesan dan saksama. Kajian ini adalah merupakan sebahagian dari pengajian Doktor Falsafah (PhD) beliau.
Beliau dan pasukan beliau akan hadir di kawasan tuan/puan untuk menemuramah dengan tuan/puan. Projek ini akan bermula dari bulan Jun 2002 hingga Ogos 2002.
Dengan itu saya amat berharap agar tuan/puan dapat memberikan kerjasama kepada beliau.
Sekian, terima kasih
Yang benar
Fakulti Pergigian Univesiti Malaya.

APPENDIX N
Impact Of Oral Disorders On Daily Lives According To The Domains
208

Impacts of oral disorders on daily lives according to the domains
Domain Individual impacts
Functional Limitation Difficult to chew foods (especially hard foods: nuts, chicken bone, sugar cane)
Can’t bite hard foods.
Can’t pronounce certain words (eg: “s”
Face look ugly “like old person”
Look awkward
Loose denture
Unsatisfied with the look of the denture
Physical Pain Cause headache
Cause pain on the other part of the body (eg. Ear, hand, neck)
Toothache
Pain on the gums
Ulcer
Sensitive to cold water
Denture pain
Psychological Discomfort Feel shy
Worry to laugh or talk.
Feel uncomfortable due to food stuck in between the
teeth or dentures.
Scared that it might worsen
Scared that the tooth next to it will be affected
Bad breath
Feel worry about it
Feel very unhappy
Uncomfortable denture
Physical Disability Avoid certain foods (eg. Sweets, cold drink, hard foods)
Avoid chew on the pain side.
Avoid talking
Avoid laughing Difficult to brush teeth.
Unable to eat favorite foods
Have to cover the mouth when smiling
Have to blend the foods.
Food feel less tasty
Difficult to clean
Have to brush more frequently
Avoid using that side.
Tend to close the mouth Psychological Disability Disturb sleep (have to take pain killer)
Sleep all day long
Unable to concentrate (eg: to other people conversation,

103
study, work).
Lazy to do other works besides sleeping.
Easy to get angry
Loss appetite.
Can’t enjoy the foods
Social Disability Preferred to stay at home.
Tend to be quite
Tend to stand far from people
Handicap Have to take medical certificate (mc)
Financial burden.
Less confident to talk to people
Copyright © 2022 FDOKUMEN