CROSS-COUNTRY RESEARCH ON TAX POLICY AND INEQUALITY: COMPARATIVE STUDY OF INDONESIA, SOUTH AFRICA...
46
COMPARATIVE STUDY OF INDONESIA, SOUTH AFRICA AND BRAZIL 1 CROSS-COUNTRY RESEARCH ON TAX POLICY AND INEQUALITY: COMPARATIVE STUDY OF INDONESIA, SOUTH AFRICA AND BRAZIL YUSTINUS PRASTOWO SUGENG BAHAGIJO SITI KHOIRUN NIKMAH Empowering Civil Society Organisation in an Unequal Multi-Polar World SouthAfrican Network on Inequality
-
Upload
independent -
Category
Documents
-
view
0 -
download
0
Transcript of CROSS-COUNTRY RESEARCH ON TAX POLICY AND INEQUALITY: COMPARATIVE STUDY OF INDONESIA, SOUTH AFRICA...
COMPARATIVE STUDY OF INDONESIA, SOUTH AFRICA AND BRAZIL 1
CROSS-COUNTRY RESEARCH ON TAX POLICY AND INEQUALITY:COMPARATIVE STUDY OF INDONESIA, SOUTH AFRICA AND BRAZIL
YUSTINUS PRASTOWOSUGENG BAHAGIJOSITI KHOIRUN NIKMAH
Empowering Civil Society Organisation in an Unequal Multi-Polar World
SouthAfrican Network on Inequality

COMPARATIVE STUDY OF INDONESIA, SOUTH AFRICA AND BRAZIL i
CROSS-COUNTRY RESEARCH ON TAX POLICY AND INEQUALITY:COMPARATIVE STUDY OF INDONESIA, SOUTH AFRICA AND BRAZIL
YUSTINUS PRASTOWOSUGENG BAHAGIJOSITI KHOIRUN NIKMAH
ISBN 978-979-8811-08-1
@ June 2015

CROSS-COUNTRY RESEARCH ON TAX POLICY AND INEQUALITYii
Author: Yustinus Prastowo, Director Executive Center for Taxation Analysis (CITA) Sugeng Bahagijo, Director Executive International NGO Forum on Indonesian Development (INFID)Siti Khoirun Nikmah, Program Manager International NGO Forum on Indonesian Development (INFID)
This publication has been produced with the assistance of the European Union. The contents of this
the European Union.
This report has been developed with the assistance of Oxfam in order to share research results and to contribute to debate on development and humanitarian policy and practice. The content and views expressed in this report are the responsibility of the author and do not necessarily represent the views of Oxfam.
Supported by:
COMPARATIVE STUDY OF INDONESIA, SOUTH AFRICA AND BRAZIL iii
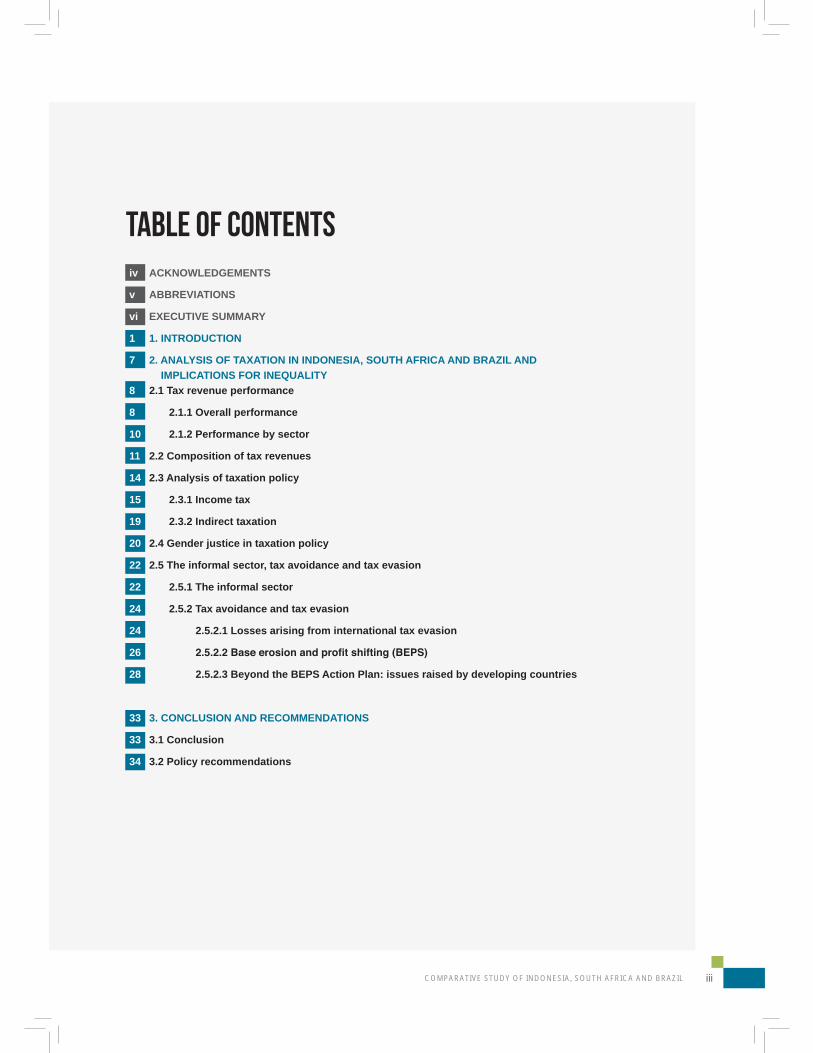
v ABBREVIATIONS
vi EXECUTIVE SUMMARY
1 1. INTRODUCTION
7 2. ANALYSIS OF TAXATION IN INDONESIA, SOUTH AFRICA AND BRAZIL AND IMPLICATIONS FOR INEQUALITY8 2.1 Tax revenue performance
8 2.1.1 Overall performance
10 2.1.2 Performance by sector
11 2.2 Composition of tax revenues
14 2.3 Analysis of taxation policy
15 2.3.1 Income tax
19 2.3.2 Indirect taxation
20 2.4 Gender justice in taxation policy
22 2.5 The informal sector, tax avoidance and tax evasion
22 2.5.1 The informal sector
24 2.5.2 Tax avoidance and tax evasion
24 2.5.2.1 Losses arising from international tax evasion
26
28 2.5.2.3 Beyond the BEPS Action Plan: issues raised by developing countries
33 3. CONCLUSION AND RECOMMENDATIONS
33 3.1 Conclusion
34 3.2 Policy recommendations
TABLE OF CONTENTSiv ACKNOWLEDGEMENTS

CROSS-COUNTRY RESEARCH ON TAX POLICY AND INEQUALITYiv
ACKNOWLEDGEMENTSWe are using this opportunity to express our gratitude to several individuals for their support
and guidence. We are grateful to Yanuar Falak Abiyunus as Research Assistant at Center
for Indonesia Taxation Analysis (CITA) who provided information and processing the data
needed for the research. We thank to M. Yudha Fathoni at INFID for huge assistance with
administrative process and help us to communicate with fellow researchers in Indonesia,
South Africa, Brazil, the UK, and other parties associated with the success of this research.
We would like to show our gratitude to Thomas Dunmore Rodriguez at OXFAM GB in Mexico
City, Mexico who continuously provided insight and expertise that greatly assisted the
research. Our gratitude is also given to Sibulele Poswayo and Ayabonga Cawe at SANI in
South Africa, Johnlyn Tromp at OXFAM in South Africa, and Pauline Cazaubon at OXFAM in
Brazil for sharing their comments and data during the course of this research although any
errors are our own and should not tarnish the reputations of these esteemed persons. We
also place on record, our sense of gratitude to all who directly or indirectly contribute to the
success of this research.
COMPARATIVE STUDY OF INDONESIA, SOUTH AFRICA AND BRAZIL v
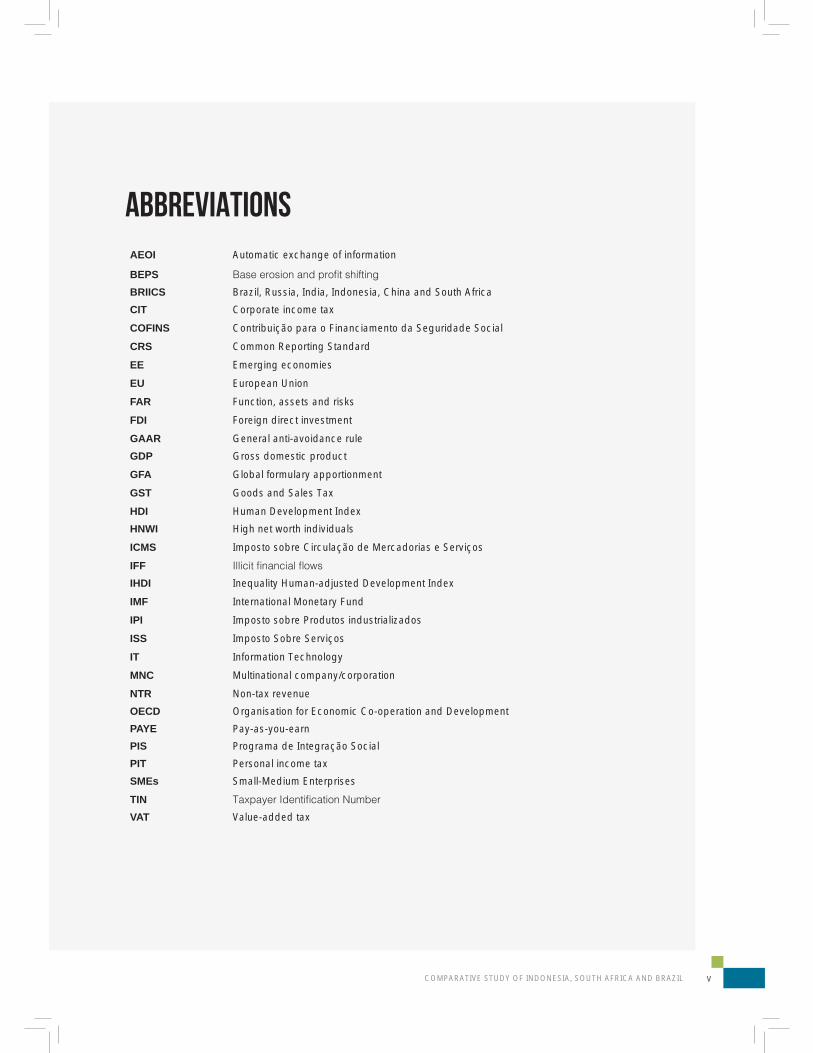
ABBREVIATIONSAEOI Automatic exchange of information
BEPS
BRIICS Brazil, Russia, India, Indonesia, China and South Africa
CIT Corporate income tax
COFINS Contribuição para o Financiamento da Seguridade Social
CRS Common Reporting Standard
EE Emerging economies
EU European Union
FAR Function, assets and risks
FDI Foreign direct investment
GAAR General anti-avoidance rule
GDP Gross domestic product
GFA Global formulary apportionment
GST Goods and Sales Tax
HDI Human Development Index
HNWI High net worth individuals
ICMS Imposto sobre Circulação de Mercadorias e Serviços
IFF
IHDI Inequality Human-adjusted Development Index
IMF International Monetary Fund
IPI Imposto sobre Produtos industrializados
ISS Imposto Sobre Serviços
IT Information Technology
MNC Multinational company/corporation
NTR Non-tax revenue
OECD Organisation for Economic Co-operation and Development
PAYE Pay-as-you-earn
PIS Programa de Integração Social
PIT Personal income tax
SMEs Small-Medium Enterprises
TIN
VAT Value-added tax

CROSS-COUNTRY RESEARCH ON TAX POLICY AND INEQUALITYvi
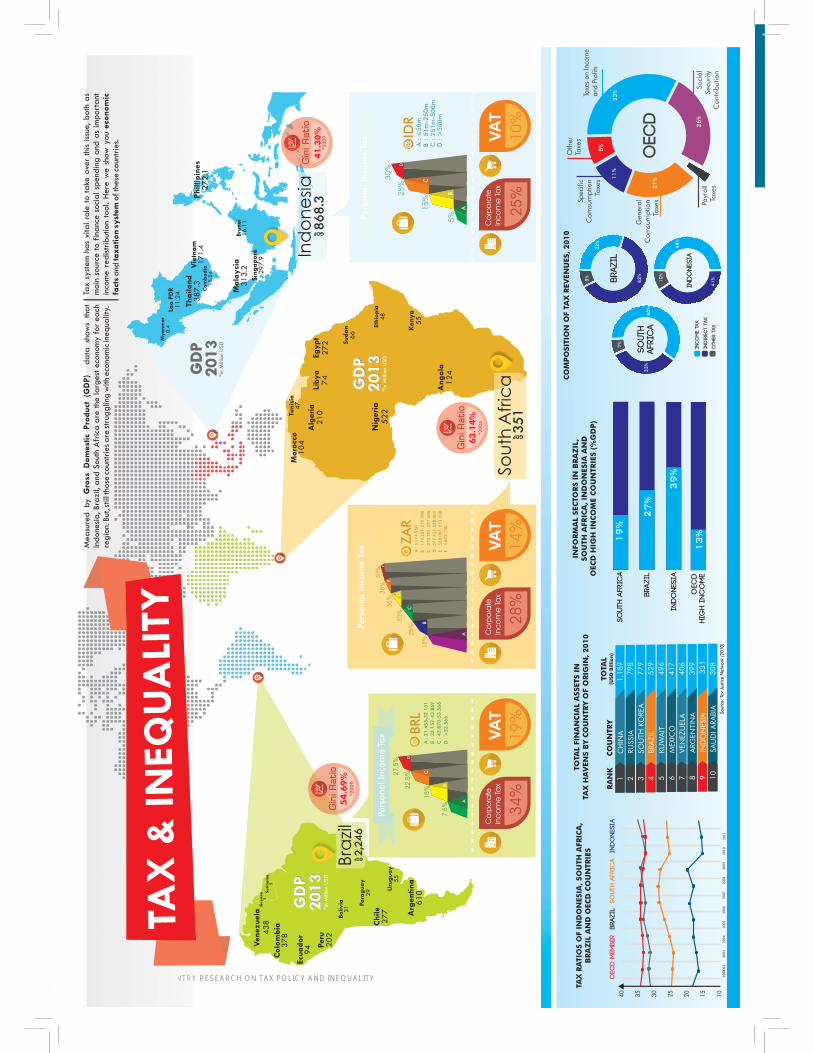
Indonesia, South Africa and Brazil are developing countries with strong economic
performances in comparison with their peers, although this is accompanied by severe
inequalities. Inequality can create a number of problems, including unsustainable economic
growth. Taxation is an effective policy instrument that can be used by governments to tackle
the ever widening gap between rich and poor: taxes can be both a source of sustainable
funds for public spending and a tool for income redistribution. At the same time, the quantity
of tax revenue (the amount raised) and its quality (progressiveness, optimization of tax
expenditures) can provide benchmarks for assessing a country’s tax system in terms of
economic inequalities.
Available data show that the revenue performance of all three countries lags far behind that
of developed countries, and the way in which revenue is collected is far from equitable. In
Brazil, the tax revenue system is dominated by regressive indirect taxes. In South Africa
and Indonesia, tax revenues consist mostly of more progressive direct taxes but there is
dependence on pay-as-you-earn (PAYE) systems or other withholding mechanisms.
The structure of the taxation systems in all three countries leads to inequitable outcomes.
Brazil has a complex system of indirect taxation based on earmarking. In terms of personal
income tax, all three countries impose relatively low maximum tariffs compared with
developed nations. In Indonesia and South Africa, the maximum income tax rate is applicable
only to impossibly high levels of income. Furthermore, tax policies in these countries do not
One of the reasons for low levels of tax revenue compared with what could potentially be
raised is widespread tax evasion and tax avoidance, which take place in all three countries.
This is made possible by international tax schemes and tax havens, of which High Net Worth
Individuals and multinational corporations are able to take advantage. In studies looking
pricing, all three countries have consistently ranked in the top ten. Many self-employed and
workers in the informal sector also evade taxes, as indicated by the existence of substantial
EXECUTIVE SUMMARY
COMPARATIVE STUDY OF INDONESIA, SOUTH AFRICA AND BRAZIL vii
To effectively overcome disparities, a system of taxation that is sound, both quantitatively
and qualitatively, must be in place. Tax potential should continually be maximized by
strengthening law enforcement and increasing levels of tax compliance. Brazil needs to
increase its proportion of direct taxes, while Indonesia and South Africa should work towards
personal income tax) must also be able to support a progressive tax structure by setting
marginal tax rates as high as possible, with the top rates applied to the lowest possible
levels of income. Tax expenditures should also be optimized through tax allowances and tax
exemptions targeted towards vulnerable women and children, low-income workers and other
marginalized groups.
To combat international tax evasion, multilateral partnerships are necessary, engaging as
many countries as possible. One way to do this is by initiating action on the digital economy,
Shifting (BEPS) Action Plan. Beyond the BEPS Action Plan, developing countries must take
initiatives themselves, including participating in discussions and the formulation of future
action plans on BEPS; moving towards greater regional cooperation; reviewing unfavourable
clauses and implementation of tax treaties; proposing the adoption of unitary taxation and
formulary apportionment regimes by means of country-by-country reporting, as an alternative
to the current ‘arm’s length’ approach, and a comparability test for transfer pricing; and
between tax jurisdictions.
CROSS-COUNTRY RESEARCH ON TAX POLICY AND INEQUALITYviii NTRY

COMPARATIVE STUDY OF INDONESIA, SOUTH AFRICA AND BRAZIL 1
1. INTRODUCTIONThe rapid growth of emerging economies has created a new force in the global economy.
Countries such as Brazil, Russia, India, Indonesia, China and South Africa (often called the
BRIICS) now play a more important role in the global economy.1 According to the World Bank,
emerging economies may join developed countries as the main drivers of global growth by
2025.2 Among the BRIICS countries, Indonesia, South Africa and Brazil are prominent in their
respective regions. For the past decade, Indonesia has had one of the strongest and most
Africa after Nigeria, with a per capita gross domestic product (GDP) that far exceeds the
average for sub-Saharan Africa. Meanwhile, with a GDP of USD 2.24 trillion, Brazil had the
seventh largest economy in the world in 2013.
Figure 1.1: Economic performance of Indonesia, South Africa and Brazil
Source: data.worldbank.org
1 C. Hackenesch and H. Janus (2011) Post 2015: How Emerging Economies Shape the Relevance of a New Agenda.
2 World Bank (2011) Multipolarity: The New Global Economy. Washington DC.
2000
2001
2002
2003
2004
2005
2006
2007
2008
2009
2010
2011
2012
8
6
4
2
0
Indonesia
1961
1965
1969
1973
1977
1981
1985
1989
1993
1997
2001
2005
2009
10000
5000
0
South Africa
GDP Per Capita South Africa Vs. Sub Saharan Africa
Ranking Economymillions of US dollars
1 United States 16.768.100
2 China 9.240.270
3 Japan 4.919.563
4 Germany 3.730.261
5 United Kingdom 2.806.428
6 Brazil 2.245.673
7 Italy 2.149.485
8 Russian Federation 2.096.777
9 India 1.876.797
10 Canada 1.826.769
11 Australia 1.560.372
12 Spain 1.393.040
13 Korea, Rep. 1.304.554
14 Mexico 1.260.915
15 Indonesia 868.346
33 South Africa 350.630
1
CROSS-COUNTRY RESEARCH ON TAX POLICY AND INEQUALITY2
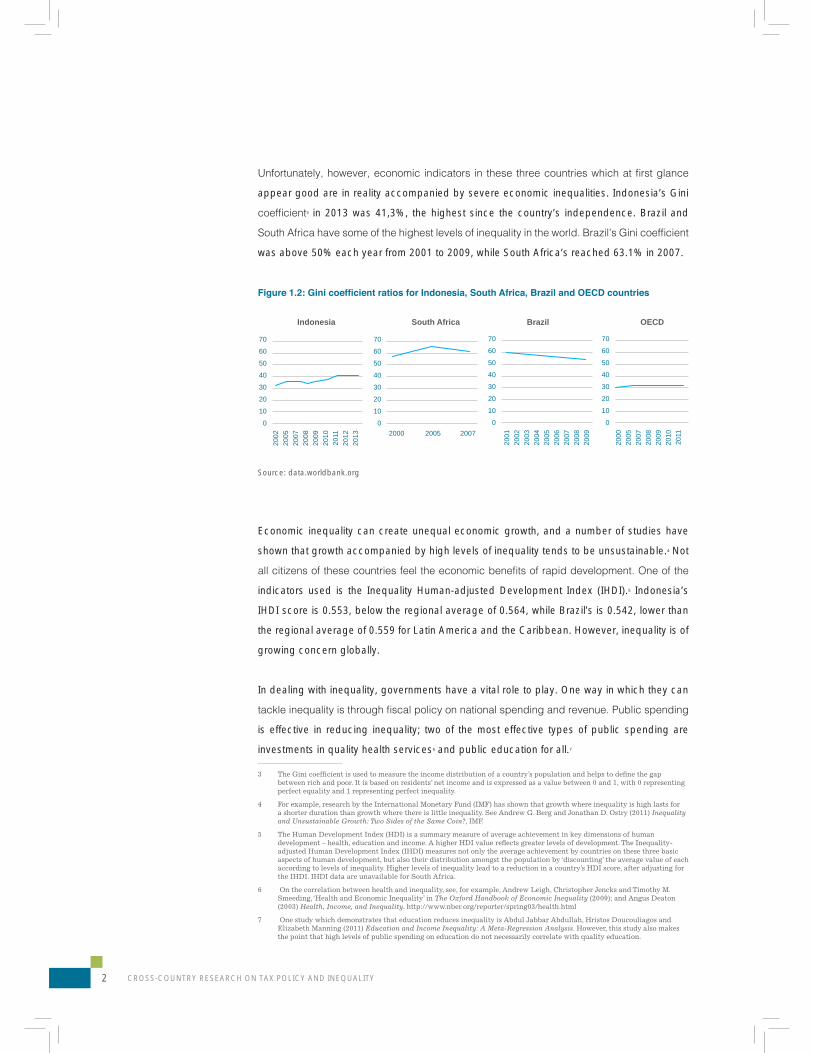
appear good are in reality accompanied by severe economic inequalities. Indonesia’s Gini
3 in 2013 was 41,3%, the highest since the country’s independence. Brazil and
was above 50% each year from 2001 to 2009, while South Africa’s reached 63.1% in 2007.
Source: data.worldbank.org
Economic inequality can create unequal economic growth, and a number of studies have
shown that growth accompanied by high levels of inequality tends to be unsustainable.4 Not
indicators used is the Inequality Human-adjusted Development Index (IHDI).5 Indonesia’s
IHDI score is 0.553, below the regional average of 0.564, while Brazil’s is 0.542, lower than
the regional average of 0.559 for Latin America and the Caribbean. However, inequality is of
growing concern globally.
In dealing with inequality, governments have a vital role to play. One way in which they can
is effective in reducing inequality; two of the most effective types of public spending are
investments in quality health services6 and public education for all.7
3 The Gini coefficient is used to measure the income distribution of a country’s population and helps to define the gap
between rich and poor. It is based on residents’ net income and is expressed as a value between 0 and 1, with 0 representing
perfect equality and 1 representing perfect inequality.
4 For example, research by the International Monetary Fund (IMF) has shown that growth where inequality is high lasts for
a shorter duration than growth where there is little inequality. See Andrew G. Berg and Jonathan D. Ostry (2011) Inequality and Unsustainable Growth: Two Sides of the Same Coin?, IMF.
5 The Human Development Index (HDI) is a summary measure of average achievement in key dimensions of human
development – health, education and income. A higher HDI value reflects greater levels of development. The Inequality-
adjusted Human Development Index (IHDI) measures not only the average achievement by countries on these three basic
aspects of human development, but also their distribution amongst the population by ‘discounting’ the average value of each
according to levels of inequality. Higher levels of inequality lead to a reduction in a country’s HDI score, after adjusting for
the IHDI. IHDI data are unavailable for South Africa.
6 On the correlation between health and inequality, see, for example, Andrew Leigh, Christopher Jencks and Timothy M.
Smeeding, ‘Health and Economic Inequality’ in The Oxford Handbook of Economic Inequality (2009); and Angus Deaton
(2003) Health, Income, and Inequality. http://www.nber.org/reporter/spring03/health.html
7 One study which demonstrates that education reduces inequality is Abdul Jabbar Abdullah, Hristos Doucouliagos and
Elizabeth Manning (2011) Education and Income Inequality: A Meta-Regression Analysis. However, this study also makes
the point that high levels of public spending on education do not necessarily correlate with quality education.
2002
2005
2007
2008
2009
2010
2011
2012
2013
70
60
50
40
30
20
10
0
Indonesia
2000 2005 2007
70
60
50
40
30
20
10
0
South Africa
2001
2002
2003
2004
2005
2006
2007
2008
2009
70
60
50
40
30
20
10
0
Brazil
2000
2005
2007
2008
2009
2010
2011
70
60
50
40
30
20
10
0
OECD
COMPARATIVE STUDY OF INDONESIA, SOUTH AFRICA AND BRAZIL 3
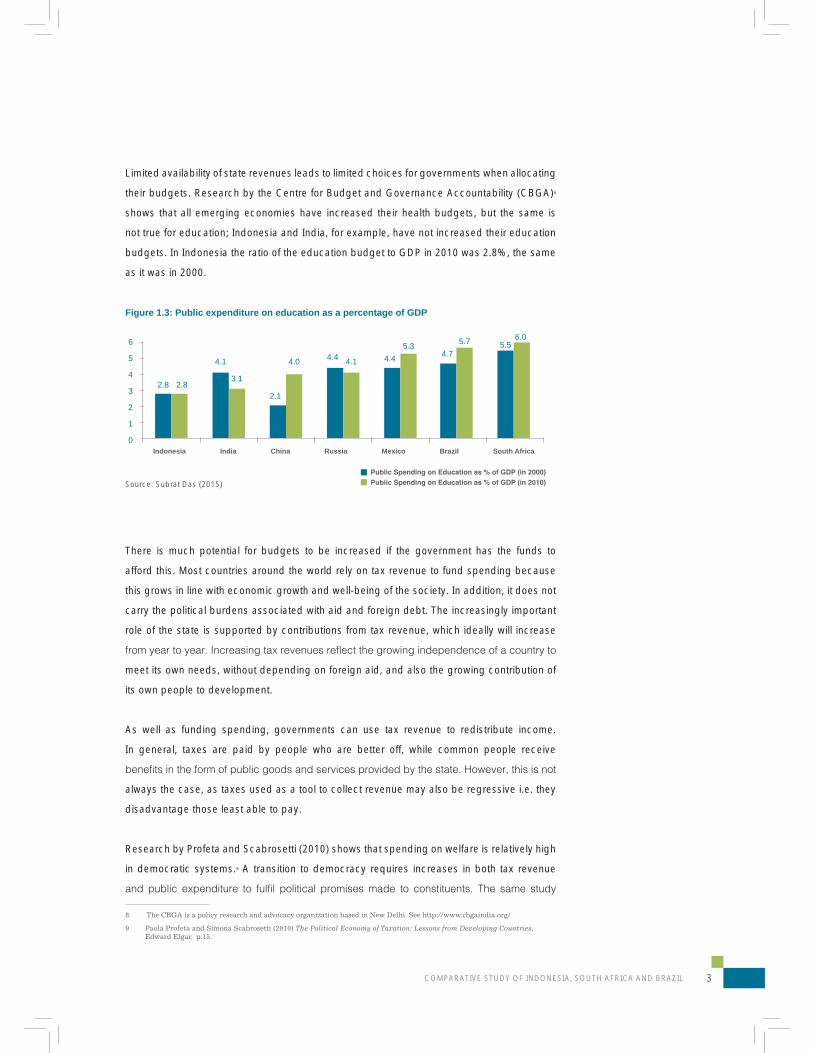
Limited availability of state revenues leads to limited choices for governments when allocating
their budgets. Research by the Centre for Budget and Governance Accountability (CBGA)8
shows that all emerging economies have increased their health budgets, but the same is
not true for education; Indonesia and India, for example, have not increased their education
budgets. In Indonesia the ratio of the education budget to GDP in 2010 was 2.8%, the same
as it was in 2000.
Figure 1.3: Public expenditure on education as a percentage of GDP
Source: Subrat Das (2015)
There is much potential for budgets to be increased if the government has the funds to
afford this. Most countries around the world rely on tax revenue to fund spending because
this grows in line with economic growth and well-being of the society. In addition, it does not
carry the political burdens associated with aid and foreign debt. The increasingly important
role of the state is supported by contributions from tax revenue, which ideally will increase
meet its own needs, without depending on foreign aid, and also the growing contribution of
its own people to development.
As well as funding spending, governments can use tax revenue to redistribute income.
In general, taxes are paid by people who are better off, while common people receive
always the case, as taxes used as a tool to collect revenue may also be regressive i.e. they
disadvantage those least able to pay.
Research by Profeta and Scabrosetti (2010) shows that spending on welfare is relatively high
in democratic systems.9 A transition to democracy requires increases in both tax revenue
8 The CBGA is a policy research and advocacy organization based in New Delhi. See http://www.cbgaindia.org/
9 Paola Profeta and Simona Scabrosetti (2010) The Political Economy of Taxation: Lessons from Developing Countries,
Edward Elgar, p.15.
6
5
4
3
2
1
0
2.8 2.8
4.1
3.1
2.1
4.0 4.4 4.1 4.4
5.34.7
5.7 5.56.0
Indonesia India China Russia Mexico Brazil South Africa

CROSS-COUNTRY RESEARCH ON TAX POLICY AND INEQUALITY4
shows a positive correlation between tax revenue and economic openness. Using data from
the Polity IV dataset10 and Freedom House,11 the authors found a positive correlation between
a country’s GDP per worker and the quality of democracy.12
The present study sets out to analyse in depth how the current tax revenue performances
of Indonesia, South Africa and Brazil compare with their potential. As well as analysing
overall revenues, it investigates the composition of revenues by type of tax. This is important
because not all taxes are progressive i.e. they do not depend on the economic ability of the
taxpayer to pay. Moreover, certain types of tax are paid only by certain people: for example,
payroll tax is imposed only on employees and not on self-employed workers. An analysis
of the way tax revenues are composed can indicate whether a state has a progressive tax
system in place and whether all segments of society are being taxed equitably.
The paper looks in depth at the prevailing tax policy in each country to measure how
progressive their tax systems are, using examples of developed countries as a benchmark
for comparison. It also analyses the gender dimension of tax policy to determine whether or
not the country’s tax system has taken gender equity into account.
Further, it examines levels of tax avoidance and tax evasion in the countries concerned
and examples of the most frequently employed tax avoidance schemes. The degree of
tax avoidance and tax evasion indicated by this study implies two things: (i) developing
countries lose large amounts of revenue that could be used for social spending and (ii) it
is comparatively easy for HNWI and multinational companies to avoid their tax obligations,
given the existence of a wide range of international tax avoidance/evasion schemes of
which they are able to take advantage. The paper further examines the extent of the informal
sectors in the countries concerned: these escape the taxation system and so there is a
large potential loss of revenue, while at the same time workers in these sectors may not be
receiving the rights they are due, which worsens levels of inequality. It should be noted that
informal sectors include not only small businesses but also large companies that are not
properly registered.
initiatives to combat harmful tax practices, such as the Organisation for Economic Co-
10 The Polity IV Project measure characteristics of countries’ political regime and transitions by scoring polity annually, with
country reports exploring trends from 1946 to the present. See: http://www.systemicpeace.org/polity/polity4x.htm
11 Freedom House is an independent watchdog organization dedicated to expanding freedom around the world. See: https://
freedomhouse.org/about-us#.VWxKV9Kqqko
12 Paola Profeta and Simona Scabrosetti (2010) The Political Economy of Taxation: Lessons from Developing Countries, p.45.
COMPARATIVE STUDY OF INDONESIA, SOUTH AFRICA AND BRAZIL 5
It also looks at whether such initiatives allow developing countries to expand their tax bases
while also maintaining a competitive investment climate.
Finally, based on this analysis, the paper draws conclusions and attempts to formulate
recommendations on taxation for these three emerging economies, in the context of both
domestic policy and global participation, that would help them to reduce inequality while
achieving sustainable growth and prosperity.

CROSS-COUNTRY RESEARCH ON TAX POLICY AND INEQUALITY6
COMPARATIVE STUDY OF INDONESIA, SOUTH AFRICA AND BRAZIL 7
2. ANALYSIS OF TAXATION IN INDONESIA, SOUTH AFRICA AND BRAZIL AND IMPLICATIONS FOR INEQUALITY
In many countries, tax is the largest source of state revenue and also the most sustainable
because it grows in line with economic growth and the population’s well-being – unlike aid or
foreign debt, which come with a political burden. The contribution of tax revenue to GDP has
Various studies have shown that increased tax revenue (in terms of percentage of GDP) is
associated with economic openness, democratization, stronger institutions and civil society,
and the reduction of corruption.13
At the same time, the principle of justice in taxation cannot be neglected. Adam Smith (often
called the father of modern economics) said in The Wealth of Nations, published in 1776,
the capabilities and incomes of taxpayers, without discrimination. The core part of this study
analyses whether Indonesia, South Africa and Brazil have maximized their tax revenue
potential so as to be able to fund social spending in order to reduce social inequality, and
whether these three countries currently have taxation policies that offer equality for their
citizens.
13 Paola Profeta and Simona Scabrosetti (2010) The Political Economy of Taxation: Lessons from Developing Countries,
pp.15-16, p.45. See also Deborah Brautigam (2008) ‘Introduction: taxation and state-building in developing countries’, in
Deborah Brautigam, Odd-Helge Fjeldstad and Mick Moore, Taxation and State-Building in Developing Countries: Capacity and Consent, Cambridge University Press, pp.1-2.
2
CROSS-COUNTRY RESEARCH ON TAX POLICY AND INEQUALITY8
2.1 Tax revenue performance
2.1.1 Overall performance
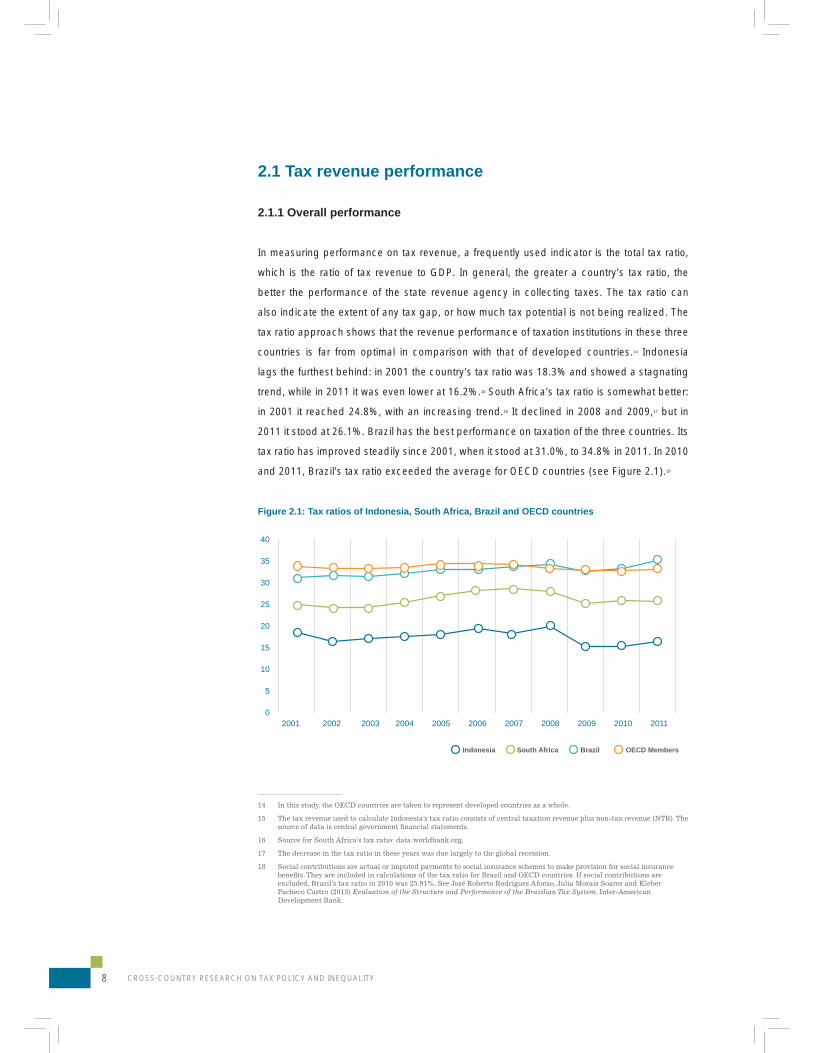
In measuring performance on tax revenue, a frequently used indicator is the total tax ratio,
which is the ratio of tax revenue to GDP. In general, the greater a country’s tax ratio, the
better the performance of the state revenue agency in collecting taxes. The tax ratio can
also indicate the extent of any tax gap, or how much tax potential is not being realized. The
tax ratio approach shows that the revenue performance of taxation institutions in these three
countries is far from optimal in comparison with that of developed countries.14 Indonesia
lags the furthest behind: in 2001 the country’s tax ratio was 18.3% and showed a stagnating
trend, while in 2011 it was even lower at 16.2%.15 South Africa’s tax ratio is somewhat better:
in 2001 it reached 24.8%, with an increasing trend.16 It declined in 2008 and 2009,17 but in
2011 it stood at 26.1%. Brazil has the best performance on taxation of the three countries. Its
tax ratio has improved steadily since 2001, when it stood at 31.0%, to 34.8% in 2011. In 2010
and 2011, Brazil’s tax ratio exceeded the average for OECD countries (see Figure 2.1).18
Figure 2.1: Tax ratios of Indonesia, South Africa, Brazil and OECD countries
14 In this study, the OECD countries are taken to represent developed countries as a whole.
15 The tax revenue used to calculate Indonesia’s tax ratio consists of central taxation revenue plus non-tax revenue (NTR). The
source of data is central government financial statements.
16 Source for South Africa’s tax ratio: data.worldbank.org.
17 The decrease in the tax ratio in these years was due largely to the global recession.
18 Social contributions are actual or imputed payments to social insurance schemes to make provision for social insurance
benefits. They are included in calculations of the tax ratio for Brazil and OECD countries. If social contributions are
excluded, Brazil’s tax ratio in 2010 was 25.91%. See José Roberto Rodrigues Afonso, Julia Morais Soares and Kleber
Pacheco Castro (2013) Evaluation of the Structure and Performance of the Brazilian Tax System. Inter-American
Development Bank.
2001 2002 2003 2004 2005 2006 2007 2008 2009 2010 2011
40
35
30
25
20
15
10
5
0
Indonesia South Africa Brazil OECD Members
COMPARATIVE STUDY OF INDONESIA, SOUTH AFRICA AND BRAZIL 9
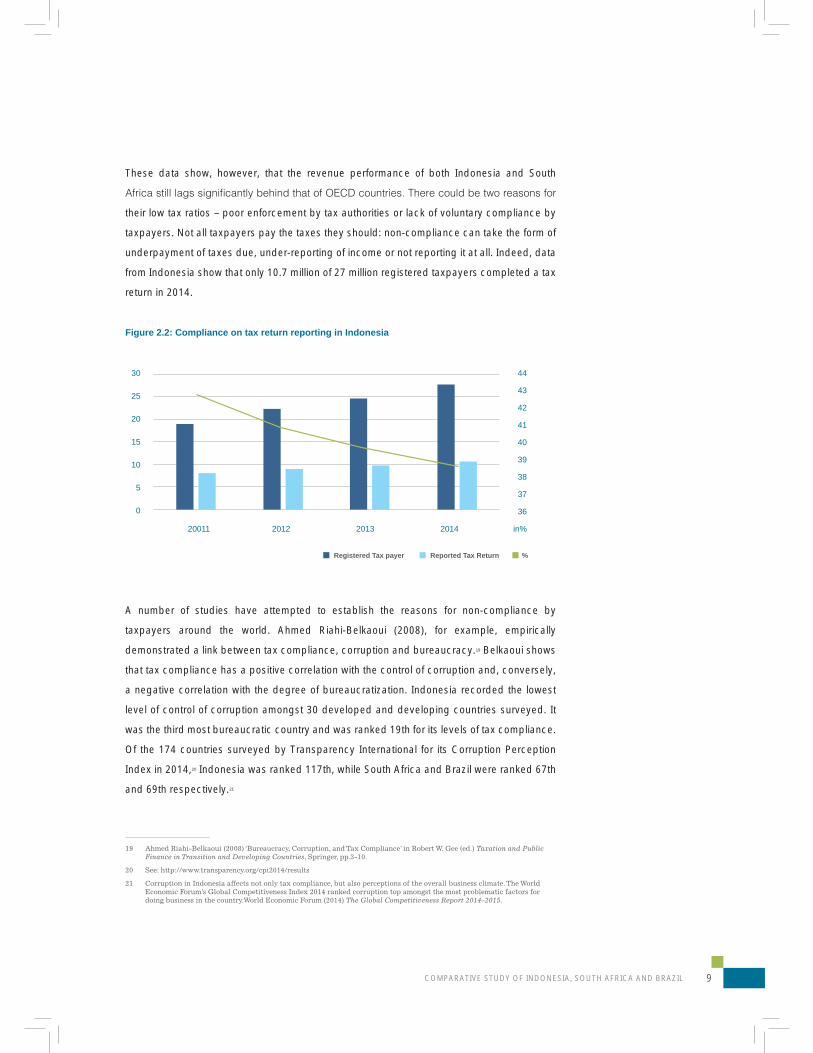
These data show, however, that the revenue performance of both Indonesia and South
their low tax ratios – poor enforcement by tax authorities or lack of voluntary compliance by
taxpayers. Not all taxpayers pay the taxes they should: non-compliance can take the form of
underpayment of taxes due, under-reporting of income or not reporting it at all. Indeed, data
from Indonesia show that only 10.7 million of 27 million registered taxpayers completed a tax
return in 2014.
Figure 2.2: Compliance on tax return reporting in Indonesia
A number of studies have attempted to establish the reasons for non-compliance by
taxpayers around the world. Ahmed Riahi-Belkaoui (2008), for example, empirically
demonstrated a link between tax compliance, corruption and bureaucracy.19 Belkaoui shows
that tax compliance has a positive correlation with the control of corruption and, conversely,
a negative correlation with the degree of bureaucratization. Indonesia recorded the lowest
level of control of corruption amongst 30 developed and developing countries surveyed. It
was the third most bureaucratic country and was ranked 19th for its levels of tax compliance.
Of the 174 countries surveyed by Transparency International for its Corruption Perception
Index in 2014,20 Indonesia was ranked 117th, while South Africa and Brazil were ranked 67th
and 69th respectively.21
19 Ahmed Riahi-Belkaoui (2008) ‘Bureaucracy, Corruption, and Tax Compliance’ in Robert W. Gee (ed.) Taxation and Public Finance in Transition and Developing Countries, Springer, pp.3-10.
20 See: http://www.transparency.org/cpi2014/results
21 Corruption in Indonesia affects not only tax compliance, but also perceptions of the overall business climate. The World
Economic Forum’s Global Competitiveness Index 2014 ranked corruption top amongst the most problematic factors for
doing business in the country.World Economic Forum (2014) The Global Competitiveness Report 2014–2015.
30
25
20
15
10
5
0
44
43
42
41
40
39
38
37
36
in%20011 2012 2013 2014
Registered Tax payer Reported Tax Return %
CROSS-COUNTRY RESEARCH ON TAX POLICY AND INEQUALITY10
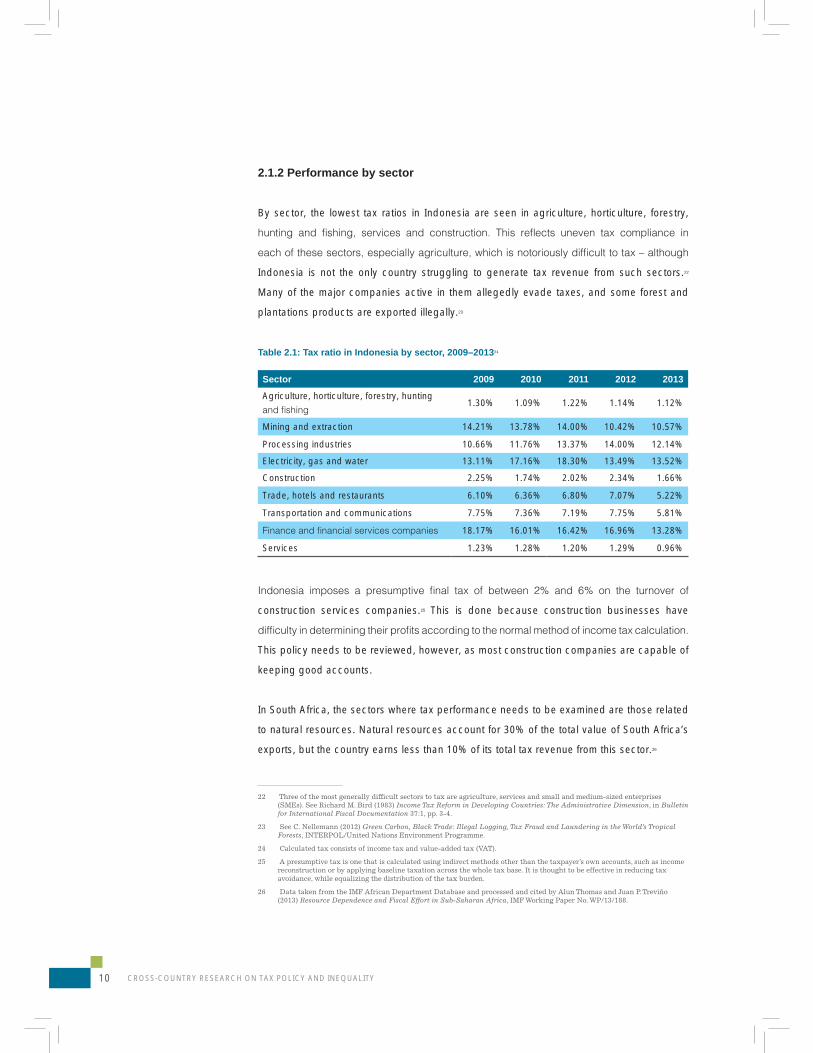
2.1.2 Performance by sector
By sector, the lowest tax ratios in Indonesia are seen in agriculture, horticulture, forestry,
Indonesia is not the only country struggling to generate tax revenue from such sectors.22
Many of the major companies active in them allegedly evade taxes, and some forest and
plantations products are exported illegally.23
Table 2.1: Tax ratio in Indonesia by sector, 2009–201324
Sector 2009 2010 2011 2012 2013
Agriculture, horticulture, forestry, hunting 1.30% 1.09% 1.22% 1.14% 1.12%
Mining and extraction 14.21% 13.78% 14.00% 10.42% 10.57%
Processing industries 10.66% 11.76% 13.37% 14.00% 12.14%
Electricity, gas and water 13.11% 17.16% 18.30% 13.49% 13.52%
Construction 2.25% 1.74% 2.02% 2.34% 1.66%
Trade, hotels and restaurants 6.10% 6.36% 6.80% 7.07% 5.22%
Transportation and communications 7.75% 7.36% 7.19% 7.75% 5.81%
18.17% 16.01% 16.42% 16.96% 13.28%
Services 1.23% 1.28% 1.20% 1.29% 0.96%
construction services companies.25 This is done because construction businesses have
This policy needs to be reviewed, however, as most construction companies are capable of
keeping good accounts.
In South Africa, the sectors where tax performance needs to be examined are those related
to natural resources. Natural resources account for 30% of the total value of South Africa’s
exports, but the country earns less than 10% of its total tax revenue from this sector.26
22 Three of the most generally difficult sectors to tax are agriculture, services and small and medium-sized enterprises
(SMEs). See Richard M. Bird (1983) Income Tax Reform in Developing Countries: The Administrative Dimension, in Bulletin for International Fiscal Documentation 37:1, pp. 3-4.
23 See C. Nellemann (2012) Green Carbon, Black Trade: Illegal Logging, Tax Fraud and Laundering in the World’s Tropical Forests, INTERPOL/United Nations Environment Programme.
24 Calculated tax consists of income tax and value-added tax (VAT).
25 A presumptive tax is one that is calculated using indirect methods other than the taxpayer’s own accounts, such as income
reconstruction or by applying baseline taxation across the whole tax base. It is thought to be effective in reducing tax
avoidance, while equalizing the distribution of the tax burden.
26 Data taken from the IMF African Department Database and processed and cited by Alun Thomas and Juan P. Treviño
(2013) Resource Dependence and Fiscal Effort in Sub-Saharan Africa, IMF Working Paper No. WP/13/188.
COMPARATIVE STUDY OF INDONESIA, SOUTH AFRICA AND BRAZIL 11
2.2 Composition of tax revenues
In addition to overall revenue performance, in analysing aspects of inequality it is important
to look at the structure of tax revenues. Data on revenue performance show that Brazil has
the highest levels of tax collection, followed by South Africa and Indonesia. Brazil and South
Africa meanwhile are among the countries with the highest levels of inequality. Therefore
the performance of state revenue collection is not enough on its own to measure whether a
Indicators that can be used to determine whether or not a tax system is just include the
proportions of direct and indirect taxes. Direct taxes have great potential to reduce inequality
because they are progressive and are based on the subject’s ability to pay. The more
capable the tax subject, the bigger the tax burden incurred (the income tax policies of
the study countries are examined in section 2.3.1). Conversely, for poorer people the tax
burden is smaller. Indirect taxes, by contrast, potentially cause imbalances because they
are regressive, i.e. they have no regard for the economic status of the taxpayer. Indirect
taxes are imposed on objects, the most common forms being value-added tax (VAT) and
goods and services tax (GST).27A study in South Africa estimated that VAT accounts for 86%
of the tax burden borne by a person with an income of ZAR 1,799, while for someone with an
income of ZAR 10,241 the VAT burden accounts for only 18% of total tax paid.28
In developed OECD countries, income tax is the main focus of state revenue (see Figure
2.3). In most OECD countries, the regressive impact of indirect taxes is mitigated by personal
income tax (PIT) systems that are progressive and help provide good social security systems.
In developing countries, however, the redistributive effect of income tax is not optimized; one
reason for this is that the structure of taxation is dominated by indirect taxes.29
27 VAT is widely used because it is a simple, effective and fair source of revenue for a state with limited administrative
capacity. See Michael Keen (2013) ‘Taxation and Development – Again’, in Critical Issues in Taxation and Development, Clemens Fuest and George R. Zodrow (eds), Massachusetts Institute of Technology, pp.20-21.
28 Imraan Valodia and Terence Smith, Gender and Taxation In South Africa, University of KwaZulu-Natal, Durban, p.25.
http://www.levyinstitute.org/pubs/CP/May2006_symposium_papers/paper_Valodia.pdf
29 Eric M. Zolt and Richard M. Bird (2005) Redistribution Via Taxation: The Limited Role of The Personal Income Tax In Developing Countries, UCLA School of Law.
CROSS-COUNTRY RESEARCH ON TAX POLICY AND INEQUALITY12
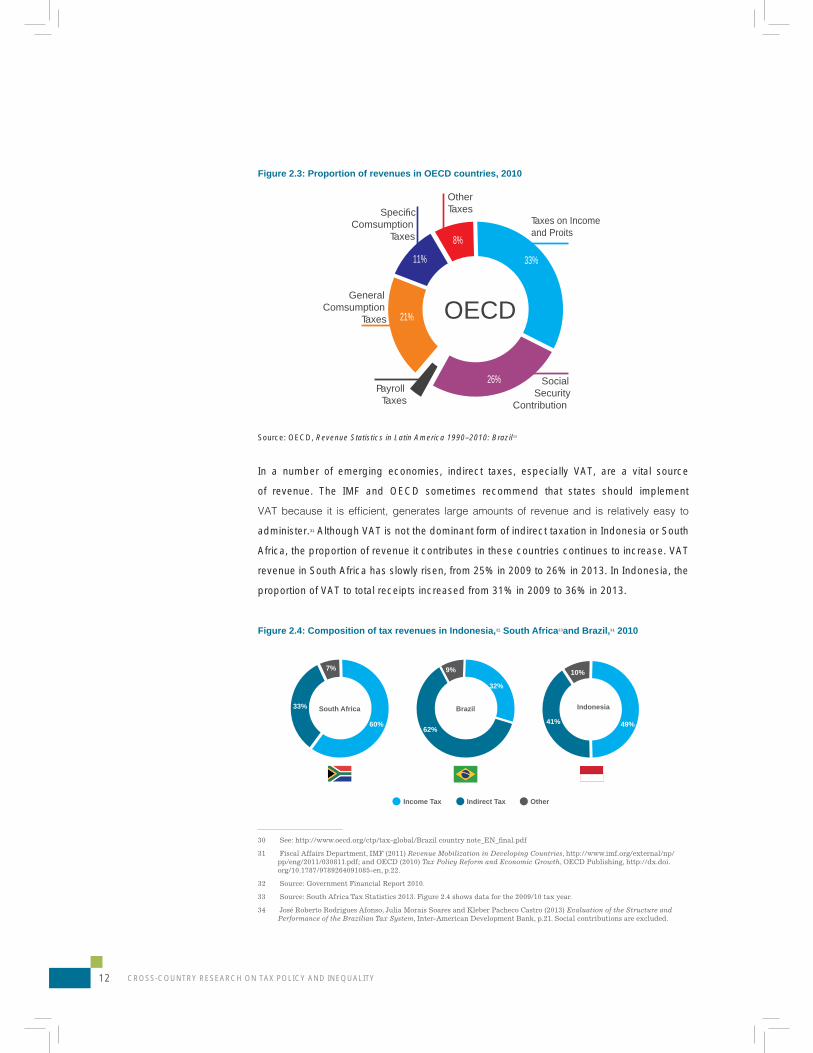
Figure 2.3: Proportion of revenues in OECD countries, 2010
Source: OECD, Revenue Statistics in Latin America 1990–2010: Brazil30
In a number of emerging economies, indirect taxes, especially VAT, are a vital source
of revenue. The IMF and OECD sometimes recommend that states should implement
administer.31 Although VAT is not the dominant form of indirect taxation in Indonesia or South
Africa, the proportion of revenue it contributes in these countries continues to increase. VAT
revenue in South Africa has slowly risen, from 25% in 2009 to 26% in 2013. In Indonesia, the
proportion of VAT to total receipts increased from 31% in 2009 to 36% in 2013.
Figure 2.4: Composition of tax revenues in Indonesia,32 South Africa33and Brazil,34 2010
30 See: http://www.oecd.org/ctp/tax-global/Brazil country note_EN_final.pdf
31 Fiscal Affairs Department, IMF (2011) Revenue Mobilization in Developing Countries, http://www.imf.org/external/np/
pp/eng/2011/030811.pdf; and OECD (2010) Tax Policy Reform and Economic Growth, OECD Publishing, http://dx.doi.
org/10.1787/9789264091085-en, p.22.
32 Source: Government Financial Report 2010.
33 Source: South Africa Tax Statistics 2013. Figure 2.4 shows data for the 2009/10 tax year.
34 José Roberto Rodrigues Afonso, Julia Morais Soares and Kleber Pacheco Castro (2013) Evaluation of the Structure and Performance of the Brazilian Tax System, Inter-American Development Bank, p.21. Social contributions are excluded.
OECD21%
11%
8%
33%
26%
Speci c Comsumption
Taxes
General Comsumption
Taxes
Payroll Taxes
SocialSecurity
Contribution
Other Taxes
Taxes on Incomeand Proits
Brazil
62%
32%
9%
South Africa
7%
33%
60%
Indonesia
10%
41% 49%
Income Tax Indirect Tax Other
COMPARATIVE STUDY OF INDONESIA, SOUTH AFRICA AND BRAZIL 13
Of the three countries, Brazil relies the most on indirect taxes: in 2010, such taxes accounted
for 62% of the country’s total tax revenue. Income tax, which in most countries makes up the
biggest slice of revenue, accounted for only 29% in Brazil. The country’s huge dependence
on indirect taxes is likely to be one of the reasons why inequality is so great, despite it having
a relatively high tax ratio.
years in both countries has accounted for approximately half of total tax revenues. In South
Africa, income tax revenue exceeded 60% of the total in 2009, before declining to 55% in
2013. In Indonesia, income tax accounted for 51% of revenues in 2009, though this had
declined to 47% in 2013.
In developing countries, the proportion of corporate income tax (CIT) often outweighs
revenue from personal income tax (PIT). Except for some large-scale industries, in particular
those based on natural resources such as mining, oil and gas, corporate income tax is
imbalance might also indicate a lack of compliance by individual taxpayers.
The collection of PIT revenue in developing countries has not been optimal. Of the three
countries studied, only South Africa collects a majority of its revenues from individual income
tax; in Indonesia and Brazil corporate income tax is the main source of revenue. In Indonesia
in 2014 the ratio of PIT to CIT revenue was 24:33. In Brazil, the difference was even more
Weak tax administrations and widespread tax evasion are two reasons for low levels of
revenue from PIT. The problem is compounded by the size of the informal sector, which is
‘invisible’ to the tax authorities and where people do not pay tax on income. In Latin American
countries, the estimated tax gap (i.e. the difference between what revenues should be and
what they actually are) is often more than 50%.35
In terms of individual taxation, if taxpayers consist only of a certain group of people, then
that country’s tax system cannot be regarded as fair – for example, if taxpayers are mostly
middle-class employees while business people and professionals with high levels of income
do not pay their fair share of taxes. Indicators that can be used to analyse fairness include
the individual income ratio obtained from a country’s pay-as-you-earn (PAYE) or withholding
35 J.P. Jimenez, J.C. Gómez Sabaini and A. Podestá (2010) Tax Gap and Equity in Latin America and the Caribbean, Fiscal
Studies, No. 16, published in Public Finance and Administrative Reform Studies, ECLAC and GTZ, Eschborn.
CROSS-COUNTRY RESEARCH ON TAX POLICY AND INEQUALITY14
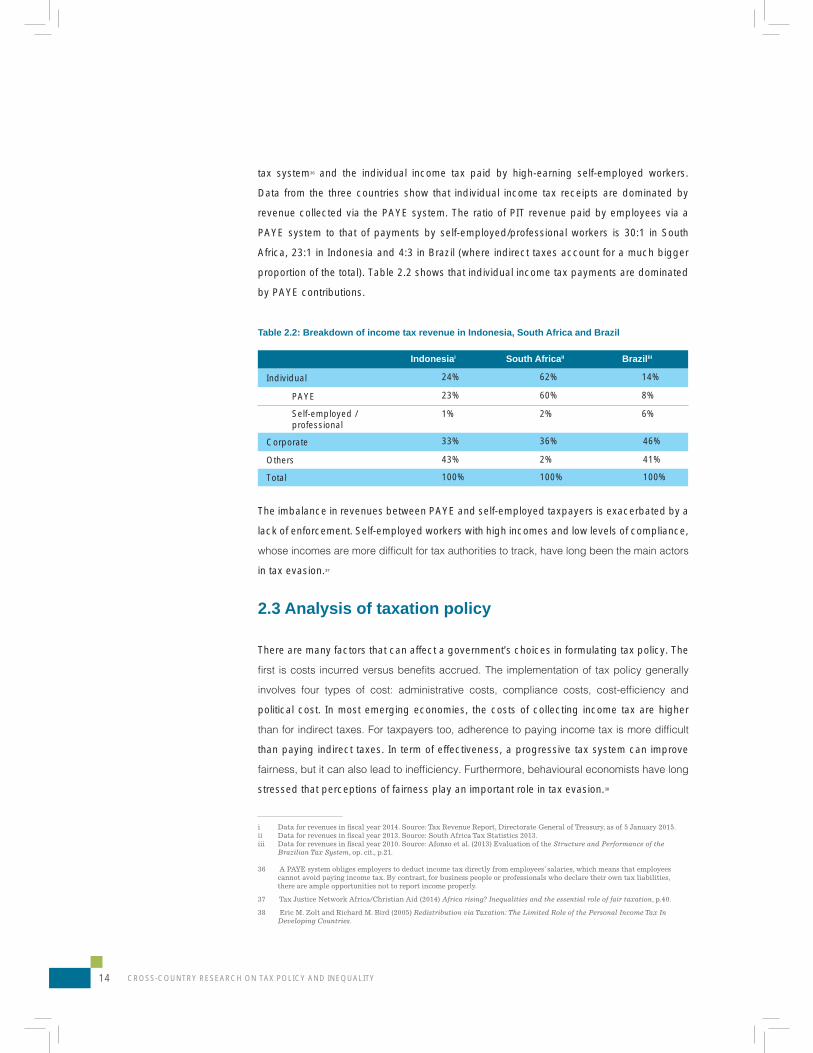
tax system36 and the individual income tax paid by high-earning self-employed workers.
Data from the three countries show that individual income tax receipts are dominated by
revenue collected via the PAYE system. The ratio of PIT revenue paid by employees via a
PAYE system to that of payments by self-employed/professional workers is 30:1 in South
Africa, 23:1 in Indonesia and 4:3 in Brazil (where indirect taxes account for a much bigger
proportion of the total). Table 2.2 shows that individual income tax payments are dominated
by PAYE contributions.
Table 2.2: Breakdown of income tax revenue in Indonesia, South Africa and Brazil
Indonesiai South Africaii Braziliii
Individual 24% 62% 14%
PAYE 23% 60% 8%
Self-employed /professional
1% 2% 6%
Corporate 33% 36% 46%
Others 43% 2% 41%
Total 100% 100% 100%
The imbalance in revenues between PAYE and self-employed taxpayers is exacerbated by a
lack of enforcement. Self-employed workers with high incomes and low levels of compliance,
in tax evasion.37
2.3 Analysis of taxation policy
There are many factors that can affect a government’s choices in formulating tax policy. The
political cost. In most emerging economies, the costs of collecting income tax are higher
than paying indirect taxes. In term of effectiveness, a progressive tax system can improve
stressed that perceptions of fairness play an important role in tax evasion.38
i Data for revenues in fiscal year 2014. Source: Tax Revenue Report, Directorate General of Treasury, as of 5 January 2015.
ii Data for revenues in fiscal year 2013. Source: South Africa Tax Statistics 2013.
iii Data for revenues in fiscal year 2010. Source: Afonso et al. (2013) Evaluation of the Structure and Performance of the Brazilian Tax System, op. cit., p.21.
36 A PAYE system obliges employers to deduct income tax directly from employees’ salaries, which means that employees
cannot avoid paying income tax. By contrast, for business people or professionals who declare their own tax liabilities,
there are ample opportunities not to report income properly.
37 Tax Justice Network Africa/Christian Aid (2014) Africa rising? Inequalities and the essential role of fair taxation, p.40.
38 Eric M. Zolt and Richard M. Bird (2005) Redistribution via Taxation: The Limited Role of the Personal Income Tax In Developing Countries.
COMPARATIVE STUDY OF INDONESIA, SOUTH AFRICA AND BRAZIL 15
A large proportion of direct taxes does not necessarily mean that a country’s tax system is
fair, nor does a large proportion of indirect taxes necessarily make it unfair. Even if direct
taxes dominate, a system cannot be considered equitable if only certain groups of people are
paying taxes, such as employees through withholding tax or PAYE schemes while individual
income tax revenues from businesses remain very small. Indirect taxes may exclude certain
basic items (tax exemptions) while levying an additional amount on goods consumed by
HNWI, for example in the form of a tax on luxury goods.
2.3.1 Income tax
Income tax is a progressive39 type of tax, especially individual income tax, which is calculated
annually on the basis of all taxable income for that year. Indonesia, South Africa and Brazil all
the rate charged. Some exceptions apply: individual income tax systems take account of
taxpayers’ circumstances, such as the number of dependants they have or their insurance
premiums.
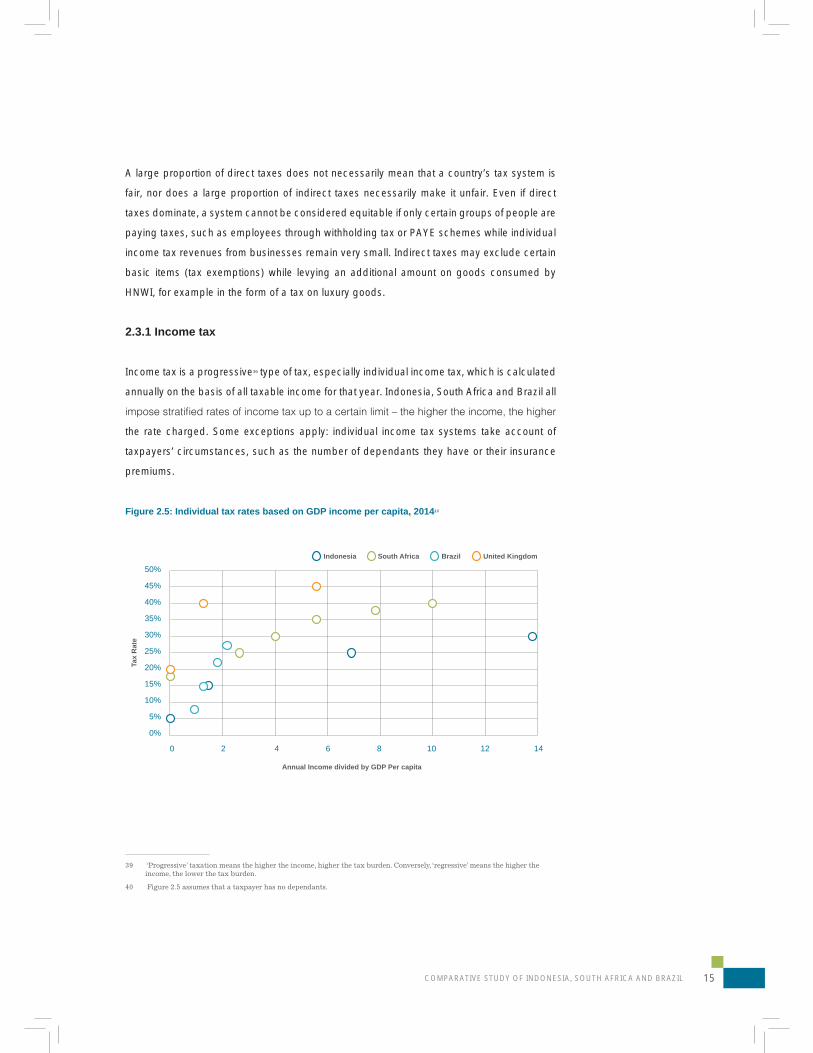
Figure 2.5: Individual tax rates based on GDP income per capita, 201440
39 ‘Progressive’ taxation means the higher the income, higher the tax burden. Conversely, ‘regressive’ means the higher the
income, the lower the tax burden.
40 Figure 2.5 assumes that a taxpayer has no dependants.
0 2 4 6 8 10 12 14
50%
45%
40%
35%
30%
25%
20%
15%
10%
5%
0%
Tax
Rat
e
Annual Income divided by GDP Per capita
Indonesia South Africa Brazil United Kingdom
CROSS-COUNTRY RESEARCH ON TAX POLICY AND INEQUALITY16
In Indonesia, individual income tax is applied at four different rates, or bands. The basic
rate is a 5% tariff payable by those who have an annual taxable income of up to IDR 50
million, or 1.4 times GDP per capita.41 The highest tax rate is 30%, imposed on individuals
with an income of more than IDR 500 million, or approximately 13.8 times GDP per capita.
Taxable income is determined after a number of deductions from gross income, including a
personal allowance of IDR 24.3 million and an extra IDR 2 million for each dependant (up to
a maximum of three) and additional to marital status. Married women are considered not to
have dependants, as they are included in the calculation of a husband’s taxes.
Brazil also has four different tax bands, with the lowest rate of 7.5% applying to taxpayers
with an annual income of BRL 20,529, or 0.8 times GDP per capita. The highest rate of 27.5%
is levied on individuals whose incomes exceed BRL 51,259, approximately 2.1 times GDP
per capita. Unlike Indonesia, Brazil does not limit the number of dependants a taxpayer
can claim for, but instead limits total deductions to BRL 14,542: besides dependants, this
includes medical, social and education costs. Annual incomes of below BRL 20,529 are not
taxed.
South Africa has the most tax bands, with six, and also higher rates of tax than Indonesia
and Brazil. Its lowest rate is 18%, which is applied to incomes of up to ZAR 165,600, or about
1.1 times GDP per capita. The highest rate is 40%, applicable to taxpayers whose incomes
exceed ZAR 638,600, or about 10 times GDP per capita. South Africa allows certain costs to
be deducted from taxable income, including medical expenses. Taxpayers also receive the
following allowances that reduce taxable income: ZAR 12,080 for those aged up to 65 years,
an additional ZAR 6,750 for those aged 65–75 and a further ZAR 2,250 for those aged over
75. Individuals younger than 65 with an income of less than ZAR 67,111 are not subject to
tax.
Optimal progressiveness and a fair tax system can be achieved by increasing marginal tax
rates for the highest levels of income.42 However, an examination of the highest tax brackets
in the three countries shows that their individual income tax systems have a long way to go
in terms of progressiveness. The highest tax rates in all three countries are lower than in
developed countries, although the levels of income to which the top rates apply are relatively
high. By comparison, the average top tax rate for OECD countries in 2013 was 42%,43 with an
41 Calculated by the authors: the present study uses a GDP per capita comparison as it describes the tax burden relative to the
economic capacity of the population.
42 Peter Diamond and Emmanuel Saez (2011) The Case for a Progressive Tax: From Basic Research to Policy Recommendations, in Journal of Economic Perspectives, Vol. 25, No. 4 (Fall 2011), pp.165-190.
43 This refers to tax rates alone; when elements of social contribution are included, the rate rises to 46%. See: http://stats.
oecd.org/index.aspx?DataSetCode=TABLE_I7
COMPARATIVE STUDY OF INDONESIA, SOUTH AFRICA AND BRAZIL 17
average upper income limit of 2.38 times GDP per capita.44 One OECD country, the United
Kingdom, has a maximum rate of 45%, applicable to the highest-earning individuals with
incomes of 5.6 times GDP per capita. In South Africa and Indonesia, the top rates of income
are respectively 10 times and 13.8 times GDP per capita. Of the three countries, Brazil has
the lowest income limit for the highest tax rates, at only 2.42 times GDP per capita.
The personal taxation system in South Africa used to be more progressive. More than a
decade ago, the country had tax brackets of 42% and 45%. However, as well as a reduction
in rates, the amount of tax that can be obtained from personal taxpayers has decreased.
Analysis by the Alternative Information and Development Centre (AIDC) shows that the same
annual income that in 1994/95 was taxed at 33.8% was effectively taxed at only 18.2% in
2010/11.45
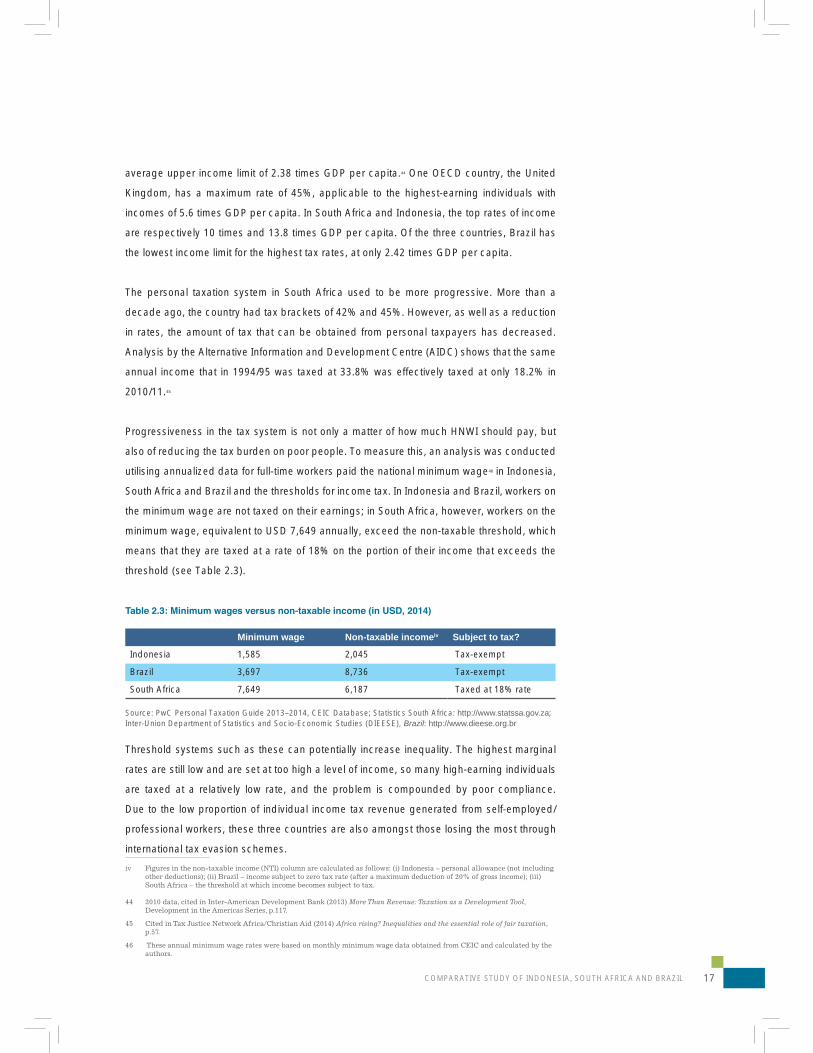
Progressiveness in the tax system is not only a matter of how much HNWI should pay, but
also of reducing the tax burden on poor people. To measure this, an analysis was conducted
utilising annualized data for full-time workers paid the national minimum wage46 in Indonesia,
South Africa and Brazil and the thresholds for income tax. In Indonesia and Brazil, workers on
the minimum wage are not taxed on their earnings; in South Africa, however, workers on the
minimum wage, equivalent to USD 7,649 annually, exceed the non-taxable threshold, which
means that they are taxed at a rate of 18% on the portion of their income that exceeds the
threshold (see Table 2.3).
Minimum wage Non-taxable incomeiv Subject to tax?
Indonesia 1,585 2,045 Tax-exempt
Brazil 3,697 8,736 Tax-exempt
South Africa 7,649 6,187 Taxed at 18% rate
Source: PwC Personal Taxation Guide 2013–2014, CEIC Database; Statistics South Africa: http://www.statssa.gov.za; Inter-Union Department of Statistics and Socio-Economic Studies (DIEESE), Brazil: http://www.dieese.org.br
Threshold systems such as these can potentially increase inequality. The highest marginal
rates are still low and are set at too high a level of income, so many high-earning individuals
are taxed at a relatively low rate, and the problem is compounded by poor compliance.
Due to the low proportion of individual income tax revenue generated from self-employed/
professional workers, these three countries are also amongst those losing the most through
international tax evasion schemes.
iv Figures in the non-taxable income (NTI) column are calculated as follows: (i) Indonesia – personal allowance (not including
other deductions); (ii) Brazil – income subject to zero tax rate (after a maximum deduction of 20% of gross income); (iii)
South Africa – the threshold at which income becomes subject to tax.
44 2010 data, cited in Inter-American Development Bank (2013) More Than Revenue: Taxation as a Development Tool, Development in the Americas Series, p.117.
45 Cited in Tax Justice Network Africa/Christian Aid (2014) Africa rising? Inequalities and the essential role of fair taxation,
p.57.
46 These annual minimum wage rates were based on monthly minimum wage data obtained from CEIC and calculated by the
authors.
CROSS-COUNTRY RESEARCH ON TAX POLICY AND INEQUALITY18
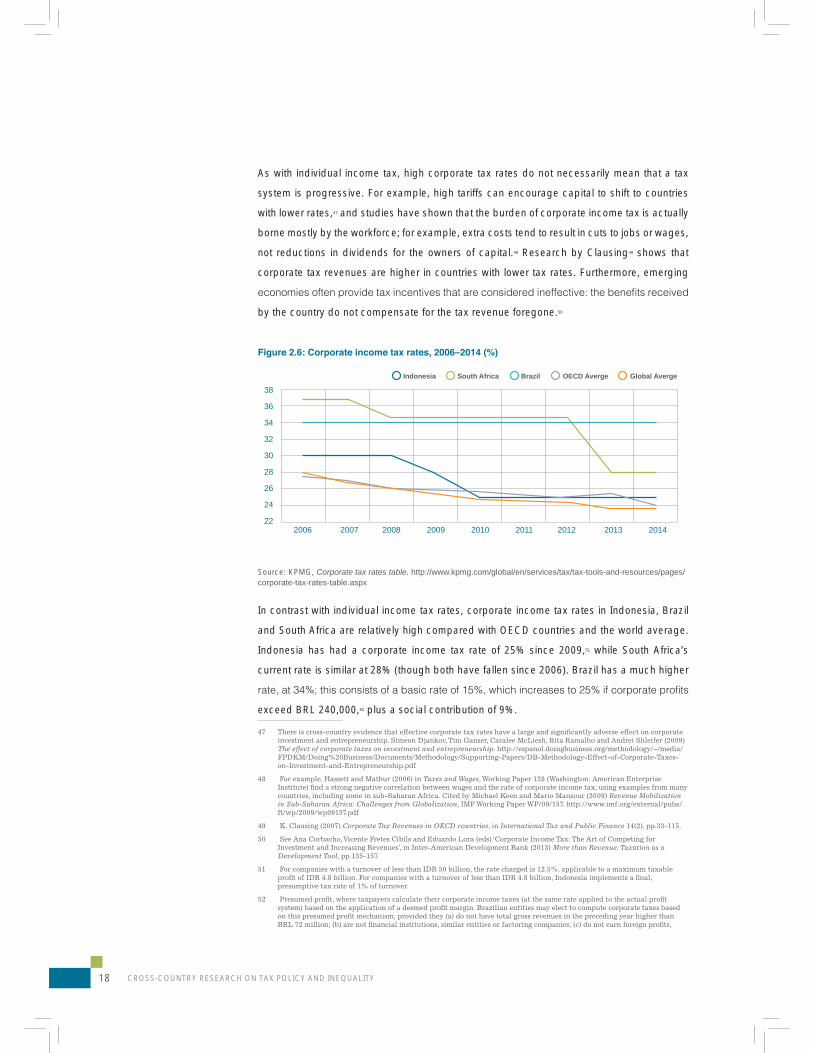
As with individual income tax, high corporate tax rates do not necessarily mean that a tax
system is progressive. For example, high tariffs can encourage capital to shift to countries
with lower rates,47 and studies have shown that the burden of corporate income tax is actually
borne mostly by the workforce; for example, extra costs tend to result in cuts to jobs or wages,
not reductions in dividends for the owners of capital.48 Research by Clausing49 shows that
corporate tax revenues are higher in countries with lower tax rates. Furthermore, emerging
by the country do not compensate for the tax revenue foregone.50
Source: KPMG, Corporate tax rates table. http://www.kpmg.com/global/en/services/tax/tax-tools-and-resources/pages/corporate-tax-rates-table.aspx
In contrast with individual income tax rates, corporate income tax rates in Indonesia, Brazil
and South Africa are relatively high compared with OECD countries and the world average.
Indonesia has had a corporate income tax rate of 25% since 2009,51 while South Africa’s
current rate is similar at 28% (though both have fallen since 2006). Brazil has a much higher
exceed BRL 240,000,52 plus a social contribution of 9%.
47 There is cross-country evidence that effective corporate tax rates have a large and significantly adverse effect on corporate
investment and entrepreneurship. Simeon Djankov, Tim Ganser, Caralee McLiesh, Rita Ramalho and Andrei Shleifer (2009)
The effect of corporate taxes on investment and entrepreneurship. http://espanol.doingbusiness.org/methodology/~/media/
FPDKM/Doing%20Business/Documents/Methodology/Supporting-Papers/DB-Methodology-Effect-of-Corporate-Taxes-
on-Investment-and-Entrepreneurship.pdf
48 For example, Hassett and Mathur (2006) in Taxes and Wages, Working Paper 128 (Washington: American Enterprise
Institute) find a strong negative correlation between wages and the rate of corporate income tax, using examples from many
countries, including some in sub-Saharan Africa. Cited by Michael Keen and Mario Mansour (2009) Revenue Mobilization in Sub-Saharan Africa: Challenges from Globalization, IMF Working Paper WP/09/157. http://www.imf.org/external/pubs/
ft/wp/2009/wp09157.pdf
49 K. Clausing (2007) Corporate Tax Revenues in OECD countries, in International Tax and Public Finance 14(2), pp.33-115.
50 See Ana Corbacho, Vicente Fretes Cibils and Eduardo Lora (eds) ‘Corporate Income Tax: The Art of Competing for
Investment and Increasing Revenues’, in Inter-American Development Bank (2013) More than Revenue: Taxation as a Development Tool, pp.135-157.
51 For companies with a turnover of less than IDR 50 billion, the rate charged is 12.5%, applicable to a maximum taxable
profit of IDR 4.8 billion. For companies with a turnover of less than IDR 4.8 billion, Indonesia implements a final,
presumptive tax rate of 1% of turnover.
52 Presumed profit, where taxpayers calculate their corporate income taxes (at the same rate applied to the actual profit
system) based on the application of a deemed profit margin. Brazilian entities may elect to compute corporate taxes based
on this presumed profit mechanism; provided they (a) do not have total gross revenues in the preceding year higher than
BRL 72 million; (b) are not financial institutions, similar entities or factoring companies; (c) do not earn foreign profits,
Indonesia South Africa Brazil OECD Averge Global Averge
38
36
34
32
30
28
26
24
222006 2007 2008 2009 2010 2011 2012 2013 2014

COMPARATIVE STUDY OF INDONESIA, SOUTH AFRICA AND BRAZIL 19
2.3.2 Indirect taxation
In Indonesia, the main indirect taxes applied are VAT and excise taxes. Businesses with a
turnover of more than IDR 4.8 billion are required to register for VAT. The VAT rate is 10%,
with exemptions for some goods and services; exempted goods include rice, grain, corn,
sago, soy, salt, meat, eggs, milk, fruits and vegetables. Indonesia has an additional sales tax
on luxury goods (i.e. a factory gate tax), which is levied at rates of between 10% and 200%53
and applies generally to goods that are consumed by high-income people or are seen as
indicating status.
The indirect tax system in Brazil is quite complex as it consists of various types of tax and is
administered at both central and local levels. It includes the following:
1. Imposto sobre Circulação de Mercadorias e Serviços (ICMS), a tax on goods and
services administered by the state. ICMS is payable on the transfer of goods and is
also levied on inter-city and inter-state transport services, communication services and
electricity supply. The general rate is 17%, with a range of 7–12% for inter-state delivery
of goods;
2. Imposto sobre Produtos Industrializados (IPI), a production tax levied on all goods
imported or manufactured in Brazil. IPI that has already been paid on raw materials can
and rates range from 0% up to 330%, including the taxation of luxury goods;
3. Imposto sobre Serviços (ISS), a tax on services administered at the municipal level, with
a rate of 5%;
4. Contribuição para o Financiamento da Seguridade Social (COFINS), which is the portion
of tax earmarked as a social contribution,54 charged at a rate of 7.6%;
5. Programa de Integração Social (PIS), an indirect tax earmarked for social integration
programmes and set at a rate of 1.65%.
As it is dominated by indirect taxation, Brazil’s tax system overall is very regressive, despite
progressive elements in its income tax system. In addition, the system of earmarking taxes
55
income or gains (i.e. directly or through foreign subsidiaries); and (d) do not qualify for an exemption or reduction of
corporate income tax. See: http://www.pwc.com/en_US/us/tax-services-multinationals/newsletters/latin-american-tax/
assets/pwc-brazilian-presumed-profits-method-cap.pdf
53 Law No. 42 of 2009 on VAT and Luxury Tax.
54 The Brazilian system earmarks certain taxes for specific purposes e.g. COFINS for social contributions and PIS for
integration programmes.
55 For more on Brazil’s VAT system, see José Teófilo Oliveria and Ana Carolina Guiberti (2009) ‘Tax Structure and Tax Burden
in Brazil: 1980–2004’ in Roger Gordon (ed.) Taxation in Developing Countries: Six Case Studies and Policy Implications,
Columbia University Press, New York, pp.255-290.
CROSS-COUNTRY RESEARCH ON TAX POLICY AND INEQUALITY20
South Africa levies VAT at a rate of 14%. Exports, certain foods and certain other items are
public transportation). South Africa also levies additional charges for luxury items, with rates
ranging up to 60%.56
2.4 Gender justice in taxation policy
‘Inequality’ has a broad meaning and is not limited to injustices of economic capability.
In general, inequalities can be divided into ‘vertical inequality’ and ‘horizontal inequality’.
Economic inequality is a type of vertical inequality,57 while horizontal inequality is based on
inequality are currently being addressed by a number of high-level UN panels working on
the post-2015 development agenda.58
The type of horizontal inequality highlighted in this study is gender inequality, which
has been chosen for several reasons. A number of recent studies at the global level of
this area;59 for example, the World Bank’s World Development Report 2012
compounding effect between gender and other forms of inequality.60 Individual women face
a social construct of gender perspectives that often leaves them marginalized economically,
politically and culturally, while women as a group are often marginalized economically and
politically. In Indonesia, welfare for mothers and children is neglected in state budgets and is
not a primary policy.61 Analysis of public policy can help to mainstream welfare policies that
and participatory.
One indicator used to analyse gender imbalances in the tax system is the units on which
taxation is based. A system based on family units treats the family as a single economic
and legal entity, with a man as the head of the household and the rights and obligations
of a wife who works treated as part of the husband’s tax obligations. A system based on
individual units treats women separately, with taxation rights and obligations independent
of their husbands. From the perspective of gender equality, the concept of individual units
56 PwC, Overview of VAT in Africa – 2014, p.153.
57 The term ‘vertical’ here refers to economic capacity.
58 Tax Justice Network Africa/Christian Aid (2014) Africa rising? Inequalities and the essential role of fair taxation, p.21.
59 Ann Mumford (2010) Tax Policy, Women and the Law, Cambridge; Kim Brooks, Asa Gunnarson, Lisa Philipps, Maria Wersig
(eds) (2011) Challenging Gender Inequality in Tax Policy Making, Hart Publishing; Caren Grown and Imraan Valodia (eds)
(2010) Taxation and Gender Equity, Routledge. See also Anthony C. Infanti and Bridget J. Crawford (eds) (2007) Critical Tax Theory, Cambridge.
60 World Bank (2012) World Development Report 2012: Gender Equality and Development.
61 Independent Budget Commission (2012) The 2012 state budget is still conservative and residual.
COMPARATIVE STUDY OF INDONESIA, SOUTH AFRICA AND BRAZIL 21
is preferable, as this treats women equally, giving them the same rights and obligations as
men. Another useful indicator is tax deductions. For women, relevant deductions include
those for dependants and for working wives who are the main breadwinners.
Of the three countries under review, only Indonesia bases its taxation system on family units.
needs to combine her income with that of her husband to calculate the income tax that they
should jointly pay, which is levied in proportion to their respective net incomes. As a result,
married women who work and who have their own TIN potentially face a higher tax burden
due to the progression of income tax rates. The systems in South Africa62 and Brazil are
based on individual units, which means that married women are taxed separately from their
husbands.
The differences between family and individual taxation also affect gender equality in terms
of employment. Changing from a taxation system based on family units to one based on
individual units can increase the amount of labour in aggregate. A study by the IMF has
shown that women are more responsive to taxes than men,63 and this is reinforced by another
study that shows that a reduction in the tax burden on the second earner contributed to an
increase in the number of women workers in Canada between 1995 and 2001.64
In Indonesia, different treatments are applied to wives with income from a single employer
and those who are self-employed. Income from an employer is not combined with the
husband’s income, while income from self-employment is. This means that wives who are
self-employed may be taxed at a higher rate when their income is added to that of their
husbands. A family in which a working wife is not an employee potentially faces a higher tax
burden than one where she is.
In South Africa, VAT is a heavier burden on men than on women, by a margin of about 8%.
For each ZAR 1 spent, it is calculated that families with a male head pay 9.23 cents in VAT
while families with a female head pay 8.13 cents.65
is consumption behaviour: indirect taxes are higher on alcohol and tobacco and on motor
fuel, and this tends to affect men more.
62 This provision came into force in 1994, having been proposed by the Commission of Enquiry into Certain Aspects of the Tax
Structure of South Africa (KATZ), which was set up by the new government. See Imraan Valodia and Terence Smith, Gender and Taxation in South Africa, University of KwaZulu-Natal, Durban.
63 IMF (2012) Fiscal Policy and Employment in Advanced and Emerging Economies, Board Paper, Washington DC. Cited in
Katrin Elborgh-Woytek et al. (2013) Women, Work, and the Economy: Macroeconomic Gains from Gender Equity, p.13.
64 E. Tsounta (2006) Why Are Women Working So Much More in Canada? An International Perspective, IMF Working Paper
06/92, Washington DC.
65 See: http://sds.ukzn.ac.za/files/GenderTaxSA_policy_brief_final.pdf

CROSS-COUNTRY RESEARCH ON TAX POLICY AND INEQUALITY22
Indonesia’s taxation policy is gender-neutral and does not exempt goods from tax on gender
lines. However, this means that there is no clear vision promoting fairness and equal treatment
for women. Basic goods needed by women and children should be excluded from taxation
to protect their access to them.
2.5 The informal sector, tax avoidance and tax evasion
2.5.1 The informal sector
The informal sector is a growing problem for state revenue collection in many emerging
businesses but also large enterprises that are not registered. In general, informal sectors
can be divided into two categories: (i) legal activities, which generally consist of income not
reported by employers, wages of informal employees and exchange transactions; and (ii)
illegal activities, such as drugs, prostitution and smuggling. Table 2.4 shows informal sector
Table 2.4: Taxonomy of activities in the informal sector
Type of activity Monetary Transactions Non Monetary Transactions
ILLEGAL ACTIVITIES
Trade with stolen goods, drug dealing and manufacturing; prostitution; gambling; smuggling and fraud
Barter of drugs, stolen goods, smuggling etc. Produce or growing drugs for own use. Theft for own use
Tax Evasion Tax Avoidance Tax Evasion Tax Avoidance
LEGAL ACTIVITIES Unreported income from self-employment; Wages, salaries and assets from unreported work related to legal services and goods
Employee discounts, fringe
Barter of legal services and goods
All do-it-yourself work and neighbor help
Source: Christopher Bajada and Friedrich Schneider (2003) The Size and Development of the Shadow Economies in , p.4.
it is very large in India and Indonesia and in other developing countries such as Brazil, China
COMPARATIVE STUDY OF INDONESIA, SOUTH AFRICA AND BRAZIL 23
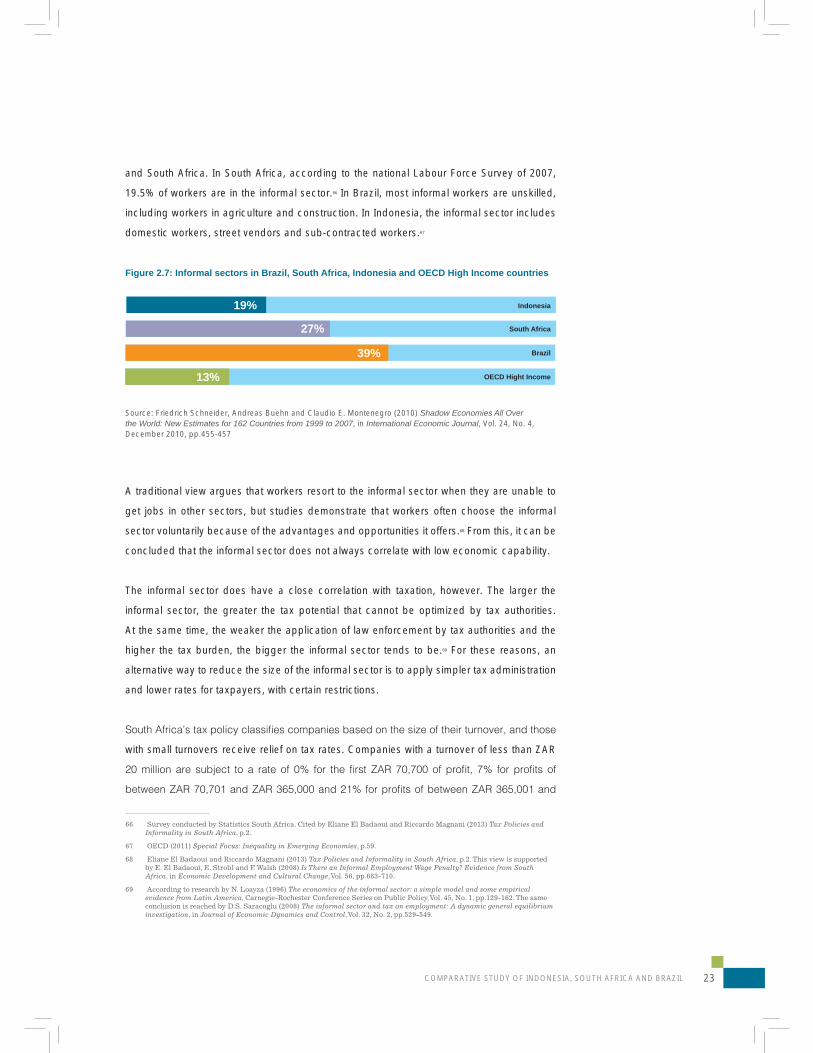
and South Africa. In South Africa, according to the national Labour Force Survey of 2007,
19.5% of workers are in the informal sector.66 In Brazil, most informal workers are unskilled,
including workers in agriculture and construction. In Indonesia, the informal sector includes
domestic workers, street vendors and sub-contracted workers.67
Figure 2.7: Informal sectors in Brazil, South Africa, Indonesia and OECD High Income countries
Source: Friedrich Schneider, Andreas Buehn and Claudio E. Montenegro (2010) Shadow Economies All Over the World: New Estimates for 162 Countries from 1999 to 2007, in International Economic Journal, Vol. 24, No. 4, December 2010, pp.455-457
A traditional view argues that workers resort to the informal sector when they are unable to
get jobs in other sectors, but studies demonstrate that workers often choose the informal
sector voluntarily because of the advantages and opportunities it offers.68 From this, it can be
concluded that the informal sector does not always correlate with low economic capability.
The informal sector does have a close correlation with taxation, however. The larger the
informal sector, the greater the tax potential that cannot be optimized by tax authorities.
At the same time, the weaker the application of law enforcement by tax authorities and the
higher the tax burden, the bigger the informal sector tends to be.69 For these reasons, an
alternative way to reduce the size of the informal sector is to apply simpler tax administration
and lower rates for taxpayers, with certain restrictions.
with small turnovers receive relief on tax rates. Companies with a turnover of less than ZAR
66 Survey conducted by Statistics South Africa. Cited by Eliane El Badaoui and Riccardo Magnani (2013) Tax Policies and Informality in South Africa, p.2.
67 OECD (2011) Special Focus: Inequality in Emerging Economies, p.59.
68 Eliane El Badaoui and Riccardo Magnani (2013) Tax Policies and Informality in South Africa, p.2. This view is supported
by E. El Badaoui, E. Strobl and F. Walsh (2008) Is There an Informal Employment Wage Penalty? Evidence from South Africa, in Economic Development and Cultural Change, Vol. 56, pp.683-710.
69 According to research by N. Loayza (1996) The economics of the informal sector: a simple model and some empirical evidence from Latin America, Carnegie-Rochester Conference Series on Public Policy, Vol. 45, No. 1, pp.129-162. The same
conclusion is reached by D.S. Saracoglu (2008) The informal sector and tax on employment: A dynamic general equilibrium investigation, in Journal of Economic Dynamics and Control, Vol. 32, No. 2, pp.529-549.
Indonesia19%
27%
39%
13%
South Africa
Brazil
OECD Hight Income
CROSS-COUNTRY RESEARCH ON TAX POLICY AND INEQUALITY24
70 In addition,
the government provides administrative relief for ‘very small companies’ by calculating direct
taxation on the basis of turnover (i.e. presumptive tax). Companies with an annual turnover
of less than ZAR 1 million can take advantage of this scheme, with rates ranging from 0% to
6% depending on turnover.
Since 2007 Brazil has applied a simple tax system known as Simples Nacional. The system
allows qualifying companies to pay all types of tax due (income tax, IPI, social contribution,
PIS, COFINS, ICMS and ISS) in a single combined payment, with progressive rates charged
based on turnover. The system is quite successful and encourages companies to participate
in the formal sector.71
In 2013 Indonesia adopted special rules for individuals and corporations with a turnover
of less than IDR 4.8 billion, under Government Regulation No. 46/2013. Under these rules,
rate of 1% of turnover each month. Implementation of this policy was expected to ease the
some types of business with small margins are more burdened by this system compared
with the previous one. Furthermore, it is possible that a tax subject may have to pay taxes
and via the normal tax regime on income that is excluded from the 1% scheme. Therefore it
is doubtful that this policy will result in a large reduction in the informal sector or will reduce
the tax administration burden to any great extent.
2.5.2 Tax avoidance and tax evasion
2.5.2.1 Losses arising from international tax evasion
As mentioned in the introduction, taxation has a vital role to play in maintaining sustainable
and to reduce inequality. Optimization of tax revenue potential is hindered by low levels of
compliance by taxpayers and by the poor administrative capacity of tax authorities. Studies
consistently rank Indonesia, South Africa and Brazil high on the list of countries suffering the
largest losses as a result of international tax evasion schemes, which are largely used by
High Net Worth Individuals (HNWI) and multinational corporations (MNCs).
70 Tax year 2014–2015, source: PwC Worldwide Tax Summaries.
71 FGV Projetos, Taxation Of Micro And Small Businesses In Brazil.
COMPARATIVE STUDY OF INDONESIA, SOUTH AFRICA AND BRAZIL 25
schemes, investors – both individuals and multinational companies – can shift income earned
in one country to another country that has lower tax rates, or to tax havens where there is little
or no real economic activity.72
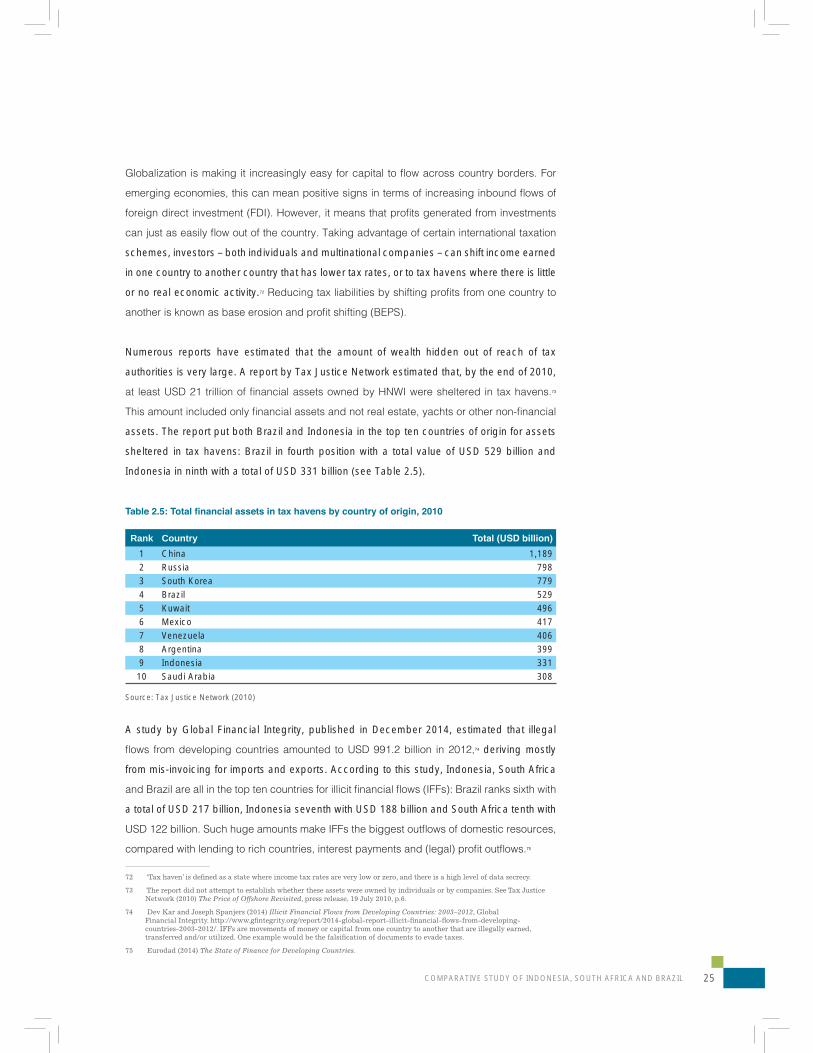
Numerous reports have estimated that the amount of wealth hidden out of reach of tax
authorities is very large. A report by Tax Justice Network estimated that, by the end of 2010,
73
assets. The report put both Brazil and Indonesia in the top ten countries of origin for assets
sheltered in tax havens: Brazil in fourth position with a total value of USD 529 billion and
Indonesia in ninth with a total of USD 331 billion (see Table 2.5).
Rank Country
1 China 1,1892 Russia 7983 South Korea 7794 Brazil 5295 Kuwait 4966 Mexico 4177 Venezuela 4068 Argentina 3999 Indonesia 33110 Saudi Arabia 308
Source: Tax Justice Network (2010)
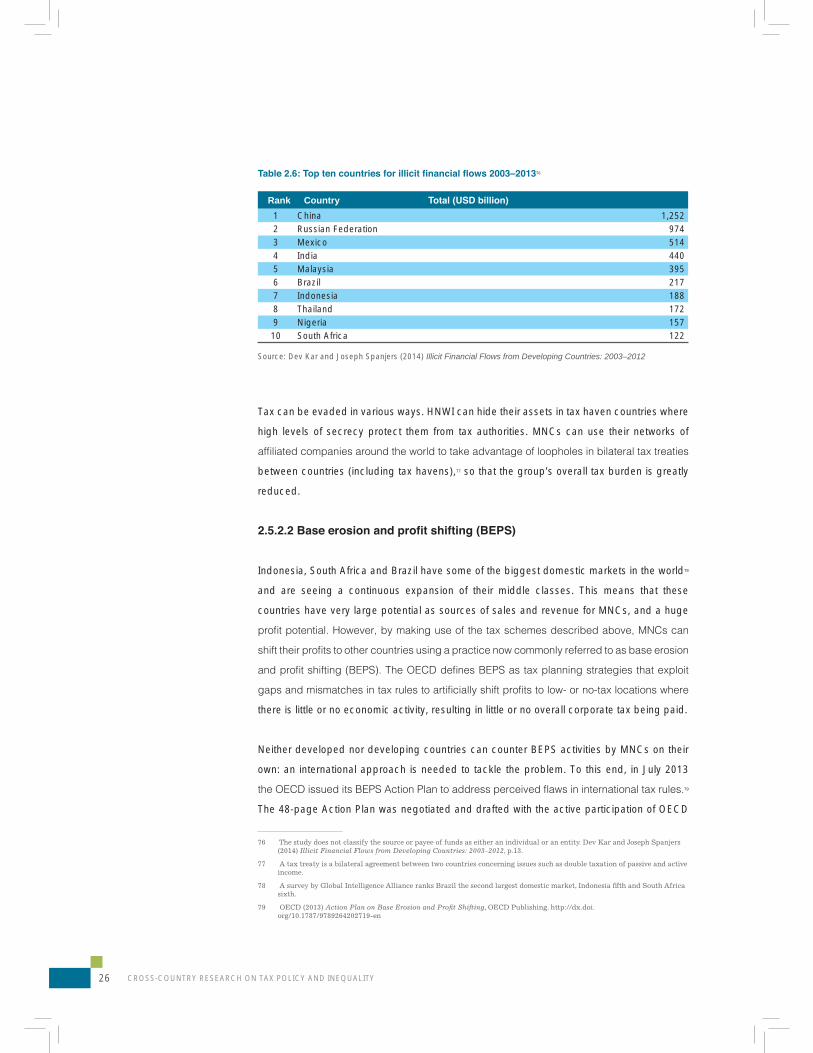
A study by Global Financial Integrity, published in December 2014, estimated that illegal
74 deriving mostly
from mis-invoicing for imports and exports. According to this study, Indonesia, South Africa
a total of USD 217 billion, Indonesia seventh with USD 188 billion and South Africa tenth with
75
72 ‘Tax haven’ is defined as a state where income tax rates are very low or zero, and there is a high level of data secrecy.
73 The report did not attempt to establish whether these assets were owned by individuals or by companies. See Tax Justice
Network (2010) The Price of Offshore Revisited, press release, 19 July 2010, p.6.
74 Dev Kar and Joseph Spanjers (2014) Illicit Financial Flows from Developing Countries: 2003–2012, Global
Financial Integrity. http://www.gfintegrity.org/report/2014-global-report-illicit-financial-flows-from-developing-
countries-2003-2012/. IFFs are movements of money or capital from one country to another that are illegally earned,
transferred and/or utilized. One example would be the falsification of documents to evade taxes.
75 Eurodad (2014) The State of Finance for Developing Countries.
CROSS-COUNTRY RESEARCH ON TAX POLICY AND INEQUALITY26
76
Rank Country
1 China 1,252 2 Russian Federation 9743 Mexico 5144 India 4405 Malaysia 3956 Brazil 2177 Indonesia 1888 Thailand 1729 Nigeria 15710 South Africa 122
Source: Dev Kar and Joseph Spanjers (2014) Illicit Financial Flows from Developing Countries: 2003–2012
Tax can be evaded in various ways. HNWI can hide their assets in tax haven countries where
high levels of secrecy protect them from tax authorities. MNCs can use their networks of
between countries (including tax havens),77 so that the group’s overall tax burden is greatly
reduced.
Indonesia, South Africa and Brazil have some of the biggest domestic markets in the world78
and are seeing a continuous expansion of their middle classes. This means that these
countries have very large potential as sources of sales and revenue for MNCs, and a huge
there is little or no economic activity, resulting in little or no overall corporate tax being paid.
Neither developed nor developing countries can counter BEPS activities by MNCs on their
own: an international approach is needed to tackle the problem. To this end, in July 2013
79
The 48-page Action Plan was negotiated and drafted with the active participation of OECD
76 The study does not classify the source or payee of funds as either an individual or an entity. Dev Kar and Joseph Spanjers
(2014) Illicit Financial Flows from Developing Countries: 2003–2012, p.13.
77 A tax treaty is a bilateral agreement between two countries concerning issues such as double taxation of passive and active
income.
78 A survey by Global Intelligence Alliance ranks Brazil the second largest domestic market, Indonesia fifth and South Africa
sixth.
79 OECD (2013) Action Plan on Base Erosion and Profit Shifting, OECD Publishing. http://dx.doi.
org/10.1787/9789264202719-en

COMPARATIVE STUDY OF INDONESIA, SOUTH AFRICA AND BRAZIL 27
member states and contains 15 separate action points or workstreams, some of which are
ministers at a summit in St. Petersburg in September 2013. Among the critical issues covered
in the BEPS Action Plan that relate to developing countries are the digital economy, transfer
pricing and transparency of information.
The digital economy:80 The rapid development of information technology (IT) in recent years
has created a new business model in the form of the digital economy. One aspect of the digital
economy is a reduction in the relevance for transactions of space and time. For example,
a company incorporated in country A may sell its products in country B through a website
server established in country C, without ever having to set up a physical store. Moreover,
tradable goods can now be in digital form, such as software applications or e-books, and so
have no physical presence. Indonesia, South Africa and Brazil all have large markets and are
via the digital economy without conducting substantial business activities there.
The digital economy raises new challenges for developing countries in terms of levying
be based on a company’s functions, assets and risks (FAR). In the digital economy, FAR
Ultimately, market countries, where the revenue is generated, have fewer taxation rights than
the countries where companies are based.
Furthermore, for a country to have the right to tax business income, the international taxation
system requires the company to have a ‘permanent establishment’ in that country. This is
or partly carried out, which means that market countries like Indonesia, South Africa and
Brazil have a disadvantage in the digital economy, which is less tangible.
Transfer pricing:81 Transfer pricing is a pricing policy that involves inter-company transfers
within a group of MNCs (intra-group).82 In the context of taxation, it is often associated with
a company’s actions in setting prices so that the transfer tax payable in one country can
80 OECD BEPS Action Plan, ‘Action 1: Address the tax challenges of the digital economy’.
81 Transfer pricing is mentioned under Actions 8, 9, 10 and 13 of the BEPS Action Plan.
82 Robert Feinscreiber (2004) Transfer Pricing Methods: An Application Guide, John Wiley & Sons, p.3

CROSS-COUNTRY RESEARCH ON TAX POLICY AND INEQUALITY28
be transferred to other countries. Research by Christian Aid suggests that in Indonesia loss
of revenue to the state through the abuse of transfer pricing is very high.83 Amongst G20
the amount of tax revenue lost due to transfer pricing.
Source: Christian Aid (2009) , p.12
Transparency of information:84 As described above, international tax evasion schemes
can be utilized by MNCs with a presence in different jurisdictions, and can involve the
use of tax havens that have low tax rates or impose no tax at all. Cooperation between tax
is the exchange of information. In 2014 the OECD created a single common global standard
for the automatic exchange of information (AEOI) – the Common Reporting Standard (CRS)
or, more formally, the Standard for Automatic Exchange of Financial Account Information.
This was designed by the OECD in conjunction with the G20 and other jurisdictions, with
However, AEOI requires a proper tax administration system and advanced IT capability to
meet these requirements. If no action is taken, less developed countries will be unable to
implement the standard.
2.5.2.3 Beyond the BEPS Action Plan: issues raised by developing countries
Lack of involvement in the formulation of global initiatives: The OECD states that many low-
and middle-income countries have signed up to the Action Plan; however, their involvement
83 Christian Aid (2009) False profits: robbing the poor to keep the rich tax-free. https://www.christianaid.org.uk/Images/false-
profits.pdf
84 This is coveerd in the OECD BEPS Action Plan under ‘Action 5: Counter harmful tax practices more effectively, taking into
account transparency and substance’.

COMPARATIVE STUDY OF INDONESIA, SOUTH AFRICA AND BRAZIL 29
is limited to its implementation – they were not involved in formulating it. Unsurprisingly, this
lack of involvement means that the Action Plan tends to favour developed countries, and
in some areas it is unlikely to propose solutions that are either effective or appropriate for
developing countries.
Similarly, in the area of transparency of information, developing countries were not involved
or consulted at the design stage of the CRS.85 It would have made more sense to have
worked through a truly international and representative institution such as the UN Committee
of Experts on International Cooperation in Tax Matters (UN Tax Committee), or even to have
established a new and representative international tax body that included both developed
and developing countries on an equal basis. The Global Forum, an organization that
encompasses both developed and developing countries and is responsible for monitoring
the exchange of information, is dependent on and is essentially controlled by the OECD. The
Global Forum was asked to help develop and monitor the new global standard on information
member and non-member countries. However, the deadline for responses to the survey was
26 February 2014, and the OECD had already published its standard on 13 February, two
weeks earlier. This clearly demonstrates a lack of serious interest in consultation.86 Involving
developing countries in the debate about international tax issues and the formulation of
policies will aid efforts to tackle these issues, since it adds legitimacy and encourages global
support.
The OECD has acknowledged that the BEPS
Action Plan was not intended to change provisions of the existing international taxation
regime. In the context of transfer pricing, this means that the Action Plan continues to take
by calculating a company’s functions, assets and risks. The greater the third element – risk
– the greater the proportion of income that is eligible to be taxed by the country where that
high-risk-company is based.
As IT continues to develop rapidly, it becomes increasingly easy to execute cross-border
transactions. MNCs established in one country can easily sell products in other countries
across a whole continent without having to set up branch companies. The concept of
international taxation is currently very detrimental to developing countries with large domestic
85 Andres Knobel and Markus Meinzer (2014) Automatic Exchange of Information: An Opportunity for Developing Countries to Tackle Tax Evasion and Corruption, Tax Justice Network. http://www.taxjustice.net/wp-content/uploads/2013/04/AIE-
An-opportunity-for-developing-countries.pdf
86 Ibid.

CROSS-COUNTRY RESEARCH ON TAX POLICY AND INEQUALITY30
markets, such as Brazil, Indonesia and South Africa, as income may be generated in their
a company operates.
Given these circumstances, it is important for developing countries to evaluate themselves
what measures would be suitable for them to adopt, either alone or, preferably, jointly with
other developing countries. They need to investigate more radical measures that could
potentially be more effective and easier to administer.
As far as the division of taxation rights is concerned, one method to consider is assessment
of multinational corporations on a unitary basis87 using a system of global formulary
to jurisdictions in which they have a taxable presence. It is widely seen as being a better
approach in principle and in many ways a more practical and effective alternative, though it
88 in transfer pricing, and facilitated by a move towards country-by-
country reporting, which is part of the OECD Action Plan.
The implementation of formulary apportionment by a number of countries on a regional basis
may diminish the competition concerns that might arise if countries were to adopt reforms
independently. Further, GFA requires coordination between states to support country-by-
the interest of developing countries.
A major problem faced by developing countries is tax
evasion. By shifting their assets and ownership to more favourable tax regimes or to tax
89
of tax haven regimes protects them from investigation and the exchange of information.
87 This means that MNCs are taxed based on their global profits, with the global profit allocated according to a specific
formula.
88 The profit split method is used to evaluate controlled transactions to determine if the allocation of profits and losses
between the related parties was conducted at arm’s length, based on the relative value of their contributions to the profit or
loss.
89 ‘Legal ownership’ means that an entity has an enforceable claim or title to an asset or property, recognized by law.
‘Beneficial ownership’ means that an entity enjoys the possession and/or benefits of ownership (such as receipt of income)
of a property, even if its ownership (title) is in the name of another entity (called a ‘nominee’ or ‘registered owner’). Use of
a nominee (who may be an agent, a custodian or a trustee) does not change the position regarding tax reporting and tax
liability, and the beneficial owner (also called the ‘actual owner’) remains responsible.
COMPARATIVE STUDY OF INDONESIA, SOUTH AFRICA AND BRAZIL 31
Developing countries need to improve cooperation to combat this kind of tax evasion
by strengthening their tax laws and tax systems i.e. by mandatory declaration of foreign
assets and investments, increasing cooperation on the exchange of information with other
developing countries and adopting a general anti-avoidance rule (GAAR),90 especially by tax
they have any real economic substance.
90 A set of broad and general principles-based rules enacted in the tax code aimed at counteracting avoidance of tax

CROSS-COUNTRY RESEARCH ON TAX POLICY AND INEQUALITY32
COMPARATIVE STUDY OF INDONESIA, SOUTH AFRICA AND BRAZIL 33
3. CONCLUSION AND RECOMMENDATIONS
3.1 Conclusion
Indonesia, South Africa and Brazil are emerging economies with relatively strong economic
performances, although this is accompanied by high levels of economic inequality, which
can lead to a variety of problems, including unsustainable economic growth. To address the
widening inequality gap, their governments can use taxation policy as an effective tool of
and as a tool for income redistribution.
The data indicate that the revenue performance of these countries has lagged behind that of
developed countries, and the composition of their tax revenues does not indicate progressive
systems. The Brazilian system is very regressive due to the preponderance of indirect taxes.
Equally in South Africa and Indonesia, although direct taxation accounts for the majority of
revenues, individual income tax is raised largely from taxes paid by employees, with very
little contribution from self-employed individuals. This indicates that voluntary tax compliance
by individual taxpayers is very low, as the system relies largely on PAYE or withholding
mechanisms.
a very complex system of indirect taxation, which reduces taxpayers’ willingness to comply.
In terms of individual income tax, the three countries have maximum rates that are relatively
low compared with those of developed countries. In Indonesia and South Africa, the income
levels set for the maximum rate of individual income tax are too high. Furthermore, the
taxation policies of all three countries fail to observe principles of gender justice.
One cause of low levels of tax revenue is the huge extent of tax evasion and tax avoidance
schemes and tax haven jurisdictions. Studies looking at the extent of assets sheltered in tax
have consistently put these three countries in the top ten globally for lost revenue. Tax
3
CROSS-COUNTRY RESEARCH ON TAX POLICY AND INEQUALITY34
evasion is also an issue that concerns the informal sector, which makes a large contribution
to GDP but a very small contribution to tax revenue.
To combat international practices of tax evasion, multilateral cooperation is required,
involving as many countries as possible. One way to do this to encourage implementation
of the action points relating to transfer pricing, the digital economy and the exchange of
information contained in the OECD BEPS Action Plan. However, despite its comprehensive
nature and the wide support it has gained from non-OECD countries, the Action Plan as it
stands does not do enough to counter tax evasion in developing countries. By involving
developing countries more in their formulation, future action plans will be more legitimate and
will win greater support, making them more likely to succeed.
3.2 Policy recommendations
Based on the research undertaken for this paper, the authors make the following
recommendations:
• In terms of revenue performance, tax revenue potential should be maximized so that
public and social spending can be increased to help reduce inequality. They should
not rely heavily on indirect taxes for their revenues, due to their regressive nature. For
personal income tax, compliance by self-employed individuals needs to be improved,
rather than continuing to rely on the PAYE system.
• The highest marginal rates for individual taxpayers need to be raised to strengthen the
progressive nature of the countries’ personal income tax systems. At the same time, the
highest marginal levels of income need to be reduced.
• Corporate tax rates are relatively high and need to be reviewed. This is important to
prevent capital shifting to other countries where rates are lower.
•
• Personal income tax systems should be based on individual tax units rather than on
family units so that women are not adversely affected by higher marginal tax rates.
COMPARATIVE STUDY OF INDONESIA, SOUTH AFRICA AND BRAZIL 35
• To prevent gender inequality, when designing tax policies (including tax expenditures)
differing basic needs according to gender should be taken into consideration.
• To reduce the size of the informal sector, lower tax rates can be applied and administration
made easier to encourage compliance.
• Beyond the current BEPS Action Plan, developing countries should be more involved in
discussing and formulating future action plans. Developing countries should also aim
to improve regional cooperation, review the application of tax treaties and the ways in
which such treaties can be abused, support the introduction of unitary taxation regimes
and global formulary apportionment with country-by-country reporting as an alternative
to the ‘arm’s length’ principle, and force developed countries to provide assistance in
the implementation of information exchange, as well as enhancing the transparency of
reduced.
• It is also suggested that developed countries should assist developing countries so that
they can put such policies into practice, with proper administration.
•
awareness and to encourage real cooperation between developed and developing
countries in order to standardize the automatic exchange of information and to review
tax planning structures that do not have economic substance.

CROSS-COUNTRY RESEARCH ON TAX POLICY AND INEQUALITY36

CROSS-COUNTRY RESEARCH ON TAX POLICY AND INEQUALITY4 ISBN 978-979-8811-08-1
Cross country research on tax policy and inequality: comparative study ofIndonesia, South Africa and Brazil / Yustinus Prastowo, Sugeng Bahagijo, Siti Khoirun Nikmah