Critical composition of for high CMR
11
Journal of Magnetism and Magnetic Materials 311 (2007) 594–604 Critical composition of La 0:7x Dy x Ca 0:3 MnðFeÞO 3 for high CMR S.C. Bhargava a, , Sher Singh a , S.K. Malik b a Solid State Physics Division, Bhabha Atomic Research Centre, Mumbai 400 085, India b Tata Institute of Fundamental Research, Colaba, Mumbai 400 005, India Received 13 July 2006; received in revised form 12 August 2006 Available online 27 September 2006 Abstract La 0:7x Dy x Ca 0:3 MnðFeÞO 3 is studied extensively using Mo¨ssbauer spectroscopy, AC susceptibility, DC magnetization, and resistivity measurements. MR shows a cusp-like increase at the critical composition x ¼ 0:10. Based on the experimental results, we provide an explanation for the high MR. Several properties of the manganite that undergo changes at this composition as x is varied are found. Our study, thus, reveals a mechanism by which CMR in excess of 10 8 % can be obtained. r 2006 Elsevier B.V. All rights reserved. PACS: 71.30.+h; 75.30.Vn; 76.80.+y; 76.60.Es; 73.43.Qt Keywords: Colossal magnetoresistance; Phase coexistence; Ferromagnetic and spin glass phases; Critical composition 1. Introduction Manganite La 1x Ca x MnO 3 shows a variety of properties as x is varied. Extensively studied is the phenomenon of metal–insulator (MI) transition when 0:25oxo0:5, which is associated with a colossal magnetoresistance (CMR) [1–7]. Initially, the double exchange theory was considered to adequately describe the phenomenon [8–10]. Subsequently, the roles of Jahn–Teller distortion [11], polaron formation [12–14], etc., were investigated. The role of the phase separation to CMR has been realized in recent studies. Separation of phases with different electronic densities has been known for a long time. Phase separation in manganite, which involves phases with equal densities, has been discussed [7] recently, and is the subject of the present study. The substitution of Mn or La with other cations in a manganite has been found to affect CMR and other properties. The two coexisting phases that are vitally important to the phenomena are ferromagnetic (FM) and spin glass (SG) phases. The magnetic and structural characteristics of the two phases differ substantially, though compositionally they are similar. In the FM phase, the lattice distortion is insignificant, facilitating the hopping of the e g electrons between the ferromagnetically coupled Mn ions. The hopping is also responsible for the conductivity. Thus, there is an insulator metal transition along with magnetic ordering on lowering the temperature. Earlier study of the MI transition in La 1x Ca x MnO 3 , 0:15pxp0:33, which is accompanied by a FM transition at T C , has shown that the tilting of MnO 6 octahedra decreases with decreasing T above T C , undergoes an abrupt change at T C , and remains practically constant at T oT C [15]. Thus, there is an abrupt change of the matrix element describing the electron hopping between Mn sites at T C . Abrupt decrease in the lattice parameters of La 0:75 Ca 0:25 MnO 3 at T C has also been observed [16–19], and these sharp anomalies were attributed to both the FM ordering as well as the change in the electronic properties. Similarly, a decrease of the unit-cell volume is found for x ¼ 0:33 [16,20] when long-range FM ordering sets in at low temperatures. Furthermore, it has been found that the unit cell of the structure shrinks significantly and con- tinuously with the development of spin ordering induced by an external field [15], which also shows that the spin ordering is strongly coupled to the lattice [8,12,16,21]. ARTICLE IN PRESS www.elsevier.com/locate/jmmm 0304-8853/$ - see front matter r 2006 Elsevier B.V. All rights reserved. doi:10.1016/j.jmmm.2006.08.038 Corresponding author. Tel.: +1 919 607 2864. E-mail address: [email protected] (S.C. Bhargava).
-
Upload
independent -
Category
Documents
-
view
2 -
download
0
Transcript of Critical composition of for high CMR

ARTICLE IN PRESS
0304-8853/$
doi:10.1016
�CorrespE-mail a
Journal of Magnetism and Magnetic Materials 311 (2007) 594–604
www.elsevier.com/locate/jmmm
Critical composition of La0:7�xDyxCa0:3MnðFeÞO3 for high CMR
S.C. Bhargavaa,�, Sher Singha, S.K. Malikb
aSolid State Physics Division, Bhabha Atomic Research Centre, Mumbai 400 085, IndiabTata Institute of Fundamental Research, Colaba, Mumbai 400 005, India
Received 13 July 2006; received in revised form 12 August 2006
Available online 27 September 2006
Abstract
La0:7�xDyxCa0:3MnðFeÞO3 is studied extensively using Mossbauer spectroscopy, AC susceptibility, DC magnetization, and resistivity
measurements. MR shows a cusp-like increase at the critical composition x ¼ 0:10. Based on the experimental results, we provide an
explanation for the high MR. Several properties of the manganite that undergo changes at this composition as x is varied are found. Our
study, thus, reveals a mechanism by which CMR in excess of 108% can be obtained.
r 2006 Elsevier B.V. All rights reserved.
PACS: 71.30.+h; 75.30.Vn; 76.80.+y; 76.60.Es; 73.43.Qt
Keywords: Colossal magnetoresistance; Phase coexistence; Ferromagnetic and spin glass phases; Critical composition
1. Introduction
Manganite La1�xCaxMnO3 shows a variety of propertiesas x is varied. Extensively studied is the phenomenon ofmetal–insulator (MI) transition when 0:25oxo0:5, which isassociated with a colossal magnetoresistance (CMR) [1–7].Initially, the double exchange theory was considered toadequately describe the phenomenon [8–10]. Subsequently,the roles of Jahn–Teller distortion [11], polaron formation[12–14], etc., were investigated. The role of the phaseseparation to CMR has been realized in recent studies.Separation of phases with different electronic densities hasbeen known for a long time. Phase separation in manganite,which involves phases with equal densities, has been discussed[7] recently, and is the subject of the present study.
The substitution of Mn or La with other cations in amanganite has been found to affect CMR and otherproperties. The two coexisting phases that are vitallyimportant to the phenomena are ferromagnetic (FM) andspin glass (SG) phases. The magnetic and structuralcharacteristics of the two phases differ substantially,
- see front matter r 2006 Elsevier B.V. All rights reserved.
/j.jmmm.2006.08.038
onding author. Tel.: +1919 607 2864.
ddress: [email protected] (S.C. Bhargava).
though compositionally they are similar. In the FM phase,the lattice distortion is insignificant, facilitating thehopping of the eg electrons between the ferromagneticallycoupled Mn ions. The hopping is also responsible for theconductivity. Thus, there is an insulator metal transitionalong with magnetic ordering on lowering the temperature.Earlier study of the MI transition in La1�xCaxMnO3,0:15pxp0:33, which is accompanied by a FM transition atTC, has shown that the tilting of MnO6 octahedradecreases with decreasing T above TC, undergoes anabrupt change at TC, and remains practically constant atToTC [15]. Thus, there is an abrupt change of the matrixelement describing the electron hopping between Mn sitesat TC. Abrupt decrease in the lattice parameters ofLa0:75Ca0:25MnO3 at TC has also been observed [16–19],and these sharp anomalies were attributed to both the FMordering as well as the change in the electronic properties.Similarly, a decrease of the unit-cell volume is found forx ¼ 0:33 [16,20] when long-range FM ordering sets in atlow temperatures. Furthermore, it has been found that theunit cell of the structure shrinks significantly and con-tinuously with the development of spin ordering inducedby an external field [15], which also shows that the spinordering is strongly coupled to the lattice [8,12,16,21].
ARTICLE IN PRESS
Table 1
Results of X-ray analysis of La0:7�xDyxCa0:3Mn0:97Fe0:03O3
x a (A) c (A) b (A)
0.08 5.4557 5.4594 7.7018
0.09 5.45075 5.4601 7.6971
0.10 5.4469 5.4605 7.6941
0.11 5.4485 5.4637 7.6927
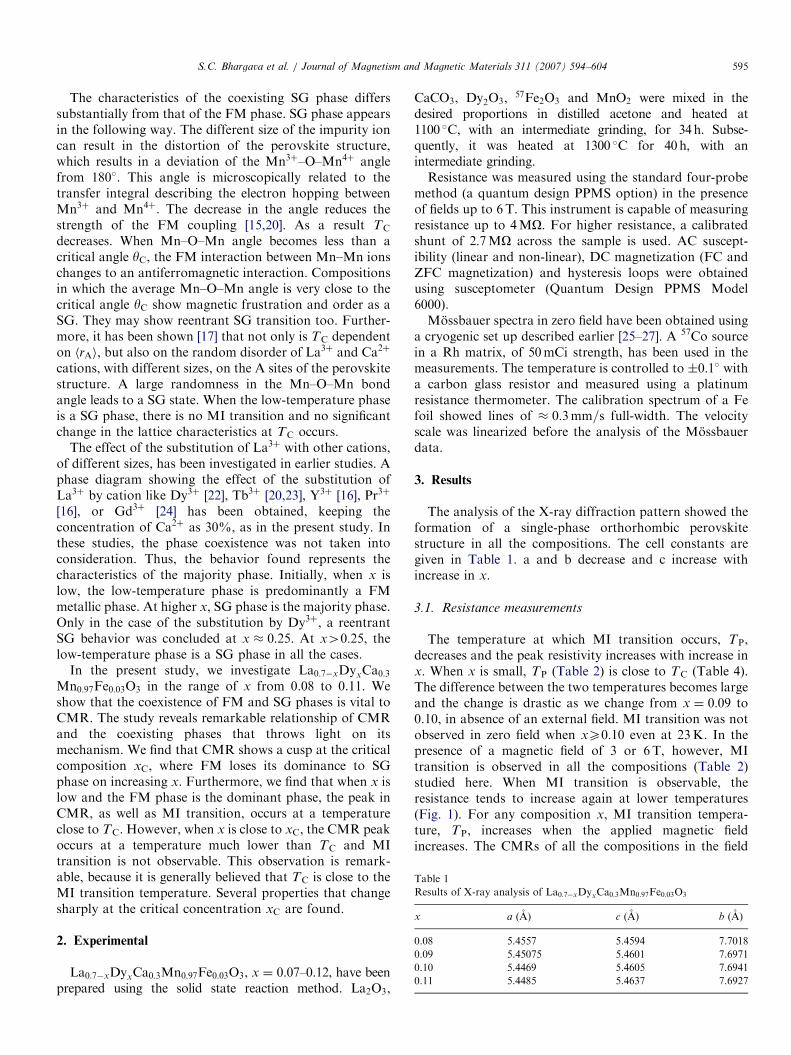
S.C. Bhargava et al. / Journal of Magnetism and Magnetic Materials 311 (2007) 594–604 595
The characteristics of the coexisting SG phase differssubstantially from that of the FM phase. SG phase appearsin the following way. The different size of the impurity ioncan result in the distortion of the perovskite structure,which results in a deviation of the Mn3þ–O–Mn4þ anglefrom 180�. This angle is microscopically related to thetransfer integral describing the electron hopping betweenMn3þ and Mn4þ. The decrease in the angle reduces thestrength of the FM coupling [15,20]. As a result TC
decreases. When Mn–O–Mn angle becomes less than acritical angle yC, the FM interaction between Mn–Mn ionschanges to an antiferromagnetic interaction. Compositionsin which the average Mn–O–Mn angle is very close to thecritical angle yC show magnetic frustration and order as aSG. They may show reentrant SG transition too. Further-more, it has been shown [17] that not only is TC dependenton hrAi, but also on the random disorder of La3þ and Ca2þ
cations, with different sizes, on the A sites of the perovskitestructure. A large randomness in the Mn–O–Mn bondangle leads to a SG state. When the low-temperature phaseis a SG phase, there is no MI transition and no significantchange in the lattice characteristics at TC occurs.
The effect of the substitution of La3þ with other cations,of different sizes, has been investigated in earlier studies. Aphase diagram showing the effect of the substitution ofLa3þ by cation like Dy3þ [22], Tb3þ [20,23], Y3þ [16], Pr3þ
[16], or Gd3þ [24] has been obtained, keeping theconcentration of Ca2þ as 30%, as in the present study. Inthese studies, the phase coexistence was not taken intoconsideration. Thus, the behavior found represents thecharacteristics of the majority phase. Initially, when x islow, the low-temperature phase is predominantly a FMmetallic phase. At higher x, SG phase is the majority phase.Only in the case of the substitution by Dy3þ, a reentrantSG behavior was concluded at x � 0:25. At x40:25, thelow-temperature phase is a SG phase in all the cases.
In the present study, we investigate La0:7�xDyxCa0:3Mn0:97Fe0:03O3 in the range of x from 0.08 to 0.11. Weshow that the coexistence of FM and SG phases is vital toCMR. The study reveals remarkable relationship of CMRand the coexisting phases that throws light on itsmechanism. We find that CMR shows a cusp at the criticalcomposition xC, where FM loses its dominance to SGphase on increasing x. Furthermore, we find that when x islow and the FM phase is the dominant phase, the peak inCMR, as well as MI transition, occurs at a temperatureclose to TC. However, when x is close to xC, the CMR peakoccurs at a temperature much lower than TC and MItransition is not observable. This observation is remark-able, because it is generally believed that TC is close to theMI transition temperature. Several properties that changesharply at the critical concentration xC are found.
2. Experimental
La0:7�xDyxCa0:3Mn0:97Fe0:03O3, x ¼ 0:07–0.12, have beenprepared using the solid state reaction method. La2O3,
CaCO3, Dy2O3,57Fe2O3 and MnO2 were mixed in the
desired proportions in distilled acetone and heated at1100 �C, with an intermediate grinding, for 34h. Subse-quently, it was heated at 1300 �C for 40h, with anintermediate grinding.Resistance was measured using the standard four-probe
method (a quantum design PPMS option) in the presenceof fields up to 6T. This instrument is capable of measuringresistance up to 4MO. For higher resistance, a calibratedshunt of 2:7MO across the sample is used. AC suscept-ibility (linear and non-linear), DC magnetization (FC andZFC magnetization) and hysteresis loops were obtainedusing susceptometer (Quantum Design PPMS Model6000).Mossbauer spectra in zero field have been obtained using
a cryogenic set up described earlier [25–27]. A 57Co sourcein a Rh matrix, of 50mCi strength, has been used in themeasurements. The temperature is controlled to �0:1� witha carbon glass resistor and measured using a platinumresistance thermometer. The calibration spectrum of a Fefoil showed lines of � 0:3mm=s full-width. The velocityscale was linearized before the analysis of the Mossbauerdata.
3. Results
The analysis of the X-ray diffraction pattern showed theformation of a single-phase orthorhombic perovskitestructure in all the compositions. The cell constants aregiven in Table 1. a and b decrease and c increase withincrease in x.
3.1. Resistance measurements
The temperature at which MI transition occurs, TP,decreases and the peak resistivity increases with increase inx. When x is small, TP (Table 2) is close to TC (Table 4).The difference between the two temperatures becomes largeand the change is drastic as we change from x ¼ 0:09 to0.10, in absence of an external field. MI transition was notobserved in zero field when xX0:10 even at 23K. In thepresence of a magnetic field of 3 or 6T, however, MItransition is observed in all the compositions (Table 2)studied here. When MI transition is observable, theresistance tends to increase again at lower temperatures(Fig. 1). For any composition x, MI transition tempera-ture, TP, increases when the applied magnetic fieldincreases. The CMRs of all the compositions in the field

ARTICLE IN PRESS
0 50 100 150 200 250 300 350
0
5
10
15
20
25
0 50 100 150 200 250 300 350
0.0
0.1
0.2
0.3
0.4
0.5
6 tesla
3 tesla
Res
ista
nce
(M
.Oh
m )
Temperature (K)
0 tesla
Res
ista
nce
(M
.Oh
m)
Temperature (K)
Fig. 1. Resistivity of La0:7�xDyxCa0:3Mn0:97Fe0:03O3, x ¼ 0:09, in pre-
sence of magnetic fields up to 6T.
Table 3
Peak temperature of MR and CMR of La0:7�xDyxCa0:3MnðFeÞO3
x Peak temperature (K) CMR (in %)
0.07 104 18 000
0.08 72 42 000
0.09 64.5 61 144
0.10 o23 46:0� 108
0.11 o41 42:5� 106
0.12 o62 47:2� 105
Table 2
The peak temperature (in K) in the temperature dependence of resistivity
of La0:7�xDyxCa0:3Mn0:97Fe0:03O3 in magnetic fields of various strengths
x Magnetic fields (T)
0 3 6
0.07 107 126.5 142
0.08 78.5 100 114
0.09 66 89 101
0.10 o23 87 98
0.11 o49 64 78.5
0 50 100 150 200 250 300 350
0
1
2
3
4
5
6
7
10-8
CM
R (
in %
)
Temperature (K)
3 tesla6 tesla
Fig. 2. Magnetoresistance of La0:7�xDyxCa0:3Mn0:97Fe0:03O3, x ¼ 0:10, inpresence of magnetic fields up to 6T.
0
2
4
6
8
0 20 40 60 80 100
20 K
50 K
10-8
CM
R (
in %
)
Magnetic Field (in tesla)
40 K
30 K
Fig. 3. Magnetoresistance of La0:7�xDyxCa0:3Mn0:97Fe0:03O3, x ¼ 0:10, atvarious temperatures in fields up to 9T.
S.C. Bhargava et al. / Journal of Magnetism and Magnetic Materials 311 (2007) 594–604596
of 6T are given in Table 3. It shows a cusp-like increase atx ¼ 0:1. CMR of x ¼ 0:10 in field of 6 T is greater than6:0� 108 and is the highest for this series of compositions(Fig. 2). To confirm the high value of CMR for thiscomposition, we measured the field dependence of resis-tance at 20, 30, 40 and 50K. The magnetic fielddependencies of CMR at these temperatures thus obtainedare shown in Fig. 3. The high value of CMR for x ¼ 0:1 is,thus, confirmed.
3.2. Hysteresis loop
Hysteresis loops of x ¼ 0:08, 0.09, 0.10, and 0.11 havebeen obtained as follows. The sample was demagnetized bytaking it to the ambient temperature and cooled in zerofield to the measurement temperature. The magnetic fieldwas raised to 9T, then decreased to �9T, and then againincreased to 9T. At any field, the measurement was doneby going into the persistent mode. Hysteresis loop of thecomposition x ¼ 0:09 at 2K is shown in Fig. 4a. It showsanomalous behavior. Initial shape is typical of a non-collinear (NC) substance. At a critical field, HCr, NC phasestarts converting into FM phase. As can be seen, thetransition is sharp at 2K, as in a first-order phase

ARTICLE IN PRESS
-9 -6 -3 0 3 6 9
-100
-50
0
50
100
M (
emu/
gm)
H (tesla)
T = 2K
-9 -6 -3 0 3 6 9
-100
-50
0
50
100
M (
emu/
gm)
Magnetic Field (tesla)
T = 2K
(a)
(b)
Fig. 4. Hysteresis loop of La0:7�xDyxCa0:3Mn0:97Fe0:03O3, (a) x ¼ 0:09,(b) x ¼ 0:12, at 2K.
S.C. Bhargava et al. / Journal of Magnetism and Magnetic Materials 311 (2007) 594–604 597
transition (FOPT). It gets thermally smeared to a broadtransition at higher temperatures. When the field islowered, the FM phase does not reconvert back to theSG phase, even when the field is decreased to �9T. Theshape of the magnetization curve is typical of a FM phasewhen the field is taken from 9 to �9T and back to 9T. Theanomaly is not present when x ¼ 0:07, but increasessubsequently with x. The critical field, required for thetransition from FM to SG phase, increases with x.Furthermore, the transition occurs in two steps when x ¼
0:12 (Fig. 4b): the first transition occurs when the fieldreaches 4.5 T and the second one when the field reaches 6T.The two-step transition is less striking at lower x.
3.3. Field cooled (FC) and zero field cooled (ZFC)
magnetizations
FC and ZFC magnetizations have been measured asfollows. The sample was warmed to the ambient tempera-
ture, to demagnetize, and cooled in zero field to 6K. A DCfield of 100Oe was applied and ZFC magnetizationmeasured while warming. The sample was again warmedto the ambient temperature, to demagnetize. It was cooledin presence of a DC field of 100Oe to 6K. The FCmagnetization was measured by measuring the magnetiza-tion in the presence of 100Oe while warming. The resultsobtained are shown in Fig. 5. The branching temperaturesof FC and ZFC magnetizations of various compositionsare given in Table 4. Remarkably, the branching tempera-tures are not related to the temperatures at which MR ismaximum. The observation of ZFC and FC magnetiza-tions for x ¼ 0:08, 0.09, 0.10, 0.11 enables us to derive therelation between branching temperature of FC and ZFCmagnetizations and AC susceptibility peak temperature aswill be seen below. This is important because it implies thateven in x ¼ 0 composition, SG phase is likely to be present,as FC and ZFC magnetization of x ¼ 0 also showbranching. Another remarkable feature of the result(Fig. 5) is the change that occurs as x is increased from0.09 to 0.10. The lanthanide becomes predominantly SGphase when x ¼ 0:10. The present measurements show thatthe contribution of the SG phase decreases as x decreases.It is small when x ¼ 0:08, but is observable. It is notdistinctly observable in the AC susceptibility whenx ¼ 0:07. The presence of the SG phase in this compositionat 50K is, however, shown by the field dependence ofmagnetization (Fig. 6).
3.4. Linear AC-susceptibility
In the present study, frequency, DC field, and x
dependence of the AC susceptibility have been measured.As described below, they reveal several phenomena.
3.4.1. Field dependence
For measurement of AC susceptibility in a DC field, thesample was first warmed to the ambient temperature, todemagnetize, and then cooled in zero field to 6K beforeapplying the DC field. AC susceptibilities of the composi-tions with x ¼ 0:08, 0.09, 0.1, and 0.11 in DC fields up to3000Oe are shown in Fig. 7a–d. The contribution of theFM phase, visible at lower temperatures, grows as x
decreases. In the AC susceptibilities of the compositionsx ¼ 0:09, 0.08 and 0.07, the FM phase is distinctly visible.It is insignificant when x ¼ 0:10 or higher. In zero field, asharp peak appears at higher temperature in all the cases.As the DC field increases, this peak splits into two. One ofthe peaks moves to higher temperature and its amplitudedecreases as the field increases. The other peak moves tothe lower temperature and broadens as the field increases.The splitting is prominent even in low field when x ¼ 0:08and 0:09: The part that moves to lower temperature mergeswith the FM part. The part which moves to highertemperature looks like a SG peak and is less prominentthan the lower temperature part in these two compositions.The change in the behavior that occurs as we change from

ARTICLE IN PRESS
0 50 100 1500
1
2
3
4
0
1
2
3
4
5
0
1
2
3
4
5
6
7
0
1
2
3
4
0.08
Temperature (K)
0.09
0.10
M
x = 0.11
Fig. 5. FC and ZFC magnetizations of La0:7�xDyxCa0:3Mn0:97Fe0:03O3,
x ¼ 0:08–0.11.
Table 4
Branching temperatures of FC and ZFC magnetizations, and temperature
of AC susceptibility peak of La0:7�xDyxCa0:3Mn0:97Fe0:03O3
x Br. temperature (K) Peak temperature (K)
0.07 95
0.08 78 79
0.09 70 72
0.10 60 64
0.11 55 58
0.12 50 53
0 3 6 90
20
40
60
80
100
M (
emu/
gm)
H (tesla)
T = 50K
Fig. 6. Field dependence of magnetization of
La0:7�xDyxCa0:3Mn0:97Fe0:03O3, x ¼ 0:07, at 50K.
S.C. Bhargava et al. / Journal of Magnetism and Magnetic Materials 311 (2007) 594–604598
x ¼ 0:09 to 0.10 is remarkable. The part of the SG peakthat moves to lower temperature becomes small, the partwhich moves to higher temperature and represents SGphase is relatively prominent. Secondly, the movement tothe lower temperature is large when x ¼ 0:08 and 0.09, incomparison to the movement in cases when x ¼ 0:10 and
0.11. Thus, the measurements show distinctly differentbehavior of xp0:09 compositions than of xX0:10 compo-sitions.
3.4.2. Frequency dependence
AC susceptibility of the compositions x ¼ 0:08, 0.09,0.10 and 0.11, in zero DC field and frequency up to3333Hz, are shown in Fig. 8a–d, respectively. The sharpchanges that occur as we change from x ¼ 0:09 to 0.10 areindeed remarkable. There are three regions that can bedistinctly seen in M 00. A peak around 78K, a peak around50K, and a region below 25K. At low x, the peak around78K is distinctly visible. Remarkably, it changes from alarge peak when x ¼ 0:09 to a insignificant peak whenx ¼ 0:10. The peak at 50K is pronounced when xX0:10,but insignificant below x ¼ 0:10. M 00 rises below 25K whenxp0:09, but becomes a well-defined peak when xX0:10.The frequency dependence is seen in all parts except in thepeak at 78K. The changes in M 0 with x are similar, thoughless pronounced. The frequency dependence of M 0 ischaracteristic of SG phase when xX0:10. The results showthat the SG fraction rises below 20K with the lowering oftemperature when xp0:09. Thus, a part of the magnetic

ARTICLE IN PRESS
0 30 60 90 120 1500.0
0.1
0.2
0.3
0.4M
' (em
u/gm
)
Temperature (K)
0 30 60 90 120 1500.00
0.07
0.14
0.21
0.28
0.35
M' (
emu/
gm)
Temperature (K)
0 Oe
100 Oe
200 Oe
400 Oe
600 Oe
800 Oe
1000 Oe
1200 Oe
2000 Oe
3000 Oe
0 Oe
100 Oe
200 Oe
400 Oe
600 Oe
800 Oe
1000 Oe
1200 Oe
2000 Oe
3000 Oe
0 30 60 90 120 1500.0
0.1
0.2
0.3
0.4
0.5
0.6
M' (
emu/
gm)
Temperature (K)
0 30 60 90 120 1500.0
0.1
0.2
0.3
0.4
0.5
M' (
emu/
gm)
Temperature (K)
0 Oe
100 Oe
200 Oe
400 Oe
600 Oe
800 Oe
1000 Oe
1200 Oe
2000 Oe
3000 Oe
0 Oe
100 Oe
200 Oe
400 Oe
600 Oe
800 Oe
1000 Oe
1200 Oe
2000 Oe
3000 Oe
(a)
(c)
(b)
(d)
Fig. 7. AC susceptibility of La0:7�xDyxCa0:3Mn0:97Fe0:03O3, (a) x ¼ 0:08, (b) x ¼ 0:09, (c) x ¼ 0:10, (d) x ¼ 0:11, measured, using AC field of 0.1Oe and
frequency 300Hz, in presence of DC fields up to 3000Oe.
S.C. Bhargava et al. / Journal of Magnetism and Magnetic Materials 311 (2007) 594–604 599
lattice shows a reentrant SG behavior. The changes thatoccur when x is increased from 0.09 to 0.10 are remarkable.
3.5. Paramagnetic Mossbauer spectra
The spectrum, for any x, at the ambient temperatureshows two doublets even though Fe occupies equivalentsites. The paramagnetic spectrum is fitted with twosymmetric doublets. The spectra of the compositionx ¼ 0:09 are shown in Fig. 9a. The doublet with smallerrelative intensity (RI) does not disappear (Fig. 9b) evenwhen the temperature is lowered to TC. Quadrupolesplittings (QS) of the two doublets show little temperaturedependencies (Fig. 9c). The paramagnetic spectra of x ¼
0:10 are shown in Fig. 10a. Unlike the behavior forxp0:09, the doublet with smaller intensity disappears asthe temperature is lowered to TC. The temperaturedependencies of the relative intensities are shown in
Fig. 10b. The paramagnetic spectrum of the compositionwith higher x shows behavior similar to that of x ¼ 0:1. Inconclusion, the paramagnetic components in the Moss-bauer spectra of the compositions xp0:9 and xX0:1behaves differently. Thus, we show that the change inbehavior of the component spectra occurs at the criticalcomposition x ¼ 0:10:
4. Discussion
The study shows that the SG and FM phases coexist inthe manganite La0:7�xDyxCa0:3Mn0:97Fe0:03O3 below TC.As mentioned above, the two phases differ magneticallyand structurally, even though they are similar composi-tionally. There is a sudden change in the lattice parametersas PM state changes to a FM state at TC, as is the case in afirst-order transition. This is accompanied by MI transi-tion. Such changes are absent when the PM state changes

ARTICLE IN PRESS
0 50 100 150-1.0
0.0
1.0
2.1
3.1
4.1
5.2
6.2
7.3
8.3
0.0
2.6
5.2
7.8
10.4
13.0
15.5
M"
(10-3
em
u/g)
M' (
emu/
g)
Temperature (K)
M' (
10-2
em
u/g)
33 Hz
333 Hz
1333 Hz
3333 Hz
0 40 80 120 160
0.00
0.05
0.10
0.15
0.20
0.25
0.30
0.35
0
1
2
3
4
5
6
7
8
Temperature (K)
M"
(10-3
em
u/gm
)
3333 Hz1333 Hz333 Hz
33 Hz
0 50 100 150-0.5
0.0
0.5
1.0
1.5
2.0
2.5
3.0
3.6
0.0
2.5
5.1
7.6
10.2
12.7
15.2
17.8
20.3
M"
(10-3
em
u/g)
M"
(10-3
em
u/g)
M' (
10-2
em
u/g)
Temperature (K)
33 Hz
333 Hz
1333 Hz
3333 Hz
20 40 605.1
7.6
10.2
12.7
15.2
17.8
M' (
10-2
emu/
g)
Temperature (K)
M' (
10-2
em
u/g)
0 50 100 150
0.0
3.3
6.6
9.9
13.2
16.6
19.9
0.0
0.7
1.3
2.0
2.6
3.3
4.0
4.6
Temperature (K)
33 Hz
333 Hz
1333 Hz
3333 Hz
(a) (b)
(c) (d)
Fig. 8. AC susceptibility of La0:7�xDyxCa0:3Mn0:97Fe0:03O3, (a) x ¼ 0:08, (b) x ¼ 0:09, (c) x ¼ 0:10, (d) x ¼ 0:11, measured, using AC field of 0.1Oe and
frequency up to 3333Hz, in presence of zero DC field.
S.C. Bhargava et al. / Journal of Magnetism and Magnetic Materials 311 (2007) 594–604600

ARTICLE IN PRESS
-3 -2 -1 0 1 2 315
16
17
18
19
20
21
22
70
75
80
85
90
95
100
80.5 K
Velocity (mm/s)
296 K
10-
4 C
ou
nts
50 100 150 200 250 300
10
20
30
40
50
60
70
80
90
component 1
Rel
ativ
e In
ten
sity
(m
m/s
)
Temperature (K)
50 100 150 200 250 3000.2
0.4
0.6
0.8
1.0
1.2
1.4
1.6
TC = 76 K
Qu
adru
po
le S
plit
tin
g (
mm
/s)
Temperature (K)
(a) (b)
(c)
Fig. 9. (a) The paramagnetic Mossbauer spectra of La0:7�xDyxCa0:3Mn0:97Fe0:03O3, x ¼ 0:09. The temperature dependencies of the (b) relative intensities
and (c) quadrupole splittings of the two component spectra of La0:7�xDyxCa0:3Mn0:97Fe0:03O3, x ¼ 0:09.
S.C. Bhargava et al. / Journal of Magnetism and Magnetic Materials 311 (2007) 594–604 601
to a SG phase. A remarkable behavior is, however, shownby the SG phase. SG phase converts into a FM phase whenan applied magnetic field exceeds a critical value (HCr). Thetransition is sharper at lower temperatures, as in a first-order transition. This is shown by the hysteresis loop at alow temperature. HCr gives a measure of the barrier
separating the free energy minima of the two phases. Wecan speculate, the free energy of the FM phase depends onthe following: the magnetic energy due to the hopping ofthe eg electrons which results in the FM ordering, theenergy due to the lattice contraction at TC, and the strainenergy due to the fact that there is no significant bending of

ARTICLE IN PRESS
-3 -2 -1 0 1 2 3
13
14
15
16
17
18
22
24
26
28
30
192021222324252627
74 K
Velocity (mm/s)
76 K
10-4
Co
un
ts
296 K
50 100 150 200 250 3000
20
40
60
80
100
TC (Mossbauer Spectroscopy) = 69 K
component 1
Rel
ativ
e in
ten
sity
(%
)
Temperature (K)(a) (b)
Fig. 10. (a) The paramagnetic Mossbauer spectra of La0:7�xDyxCa0:3Mn0:97Fe0:03O3, x ¼ 0:10. (b) The temperature dependencies of the relative intensities
of the two component spectra of La0:7�xDyxCa0:3Mn0:97Fe0:03O3, x ¼ 0:10.
S.C. Bhargava et al. / Journal of Magnetism and Magnetic Materials 311 (2007) 594–604602
Mn–O–Mn bond, even though the substituted ions are ofdifferent size. The free energy of the SG phase depends onthe following facts: there is no hopping of the eg electrons,the strain energy is low as the differing size of the impurityions is able to cause Mn–O–Mn bond angle to becomesmaller than 180�, Jahn–Teller distortion energy, and thelattice contraction as a result of magnetic ordering isabsent. The free energy minima of the two coexistingphases are separated by energy barrier (HCr). When thefield is first applied, SG ordering is opposed by the appliedfield. Thus, the free energy of the SG phase increases. Onthe other hand, the increase in the magnetic field lowers thefree energy of the FM phase, below the zero field freeenergy of the FM phase. SG phase changes into FM phaseas soon as the increase in energy exceeds the barrierbetween the SG and FM phases. When the magnetic field islowered back to zero, the system approaches the zero fieldfree energy of the FM state. When field is taken to �9T,the energy of the FM state lowers again, instead ofincreasing. Thus, the free energy of the FM state is unableto cross the barrier to go back to the SG state.
The increase in the substitution of La3þ by Dy3þ
increases the free energy of the FM phase and decreasesthe free energy of the SG phase. As a result, the volumefraction of the SG phase increases with x. The temperatureat which the temperature dependence of resistivity shows apeak, TP, decreases as x increases. This is close to themagnetic ordering temperature when x is low and FMphase is the dominant phase below TC. Thus, when
x ¼ 0:09, magnetic ordering temperature is around 70K,and TP is 66K. However, when x changes from 0.09 to0.10, FM phase looses its dominance, and SG phasebecomes the dominant phase below TC. As a result, there isno MI transition even at temperature as low as 23K, eventhough the magnetic ordering occurs at 60K. In presenceof a field as low as 3T, however, there appears a MItransition and TP becomes as high as 87K. In comparison,at higher x ¼ 0:11, zero field resistivity rises rapidly at44K, instead of at 23K, and TP in 3 T show peak at 59K,instead of at 87K. Thus, the difference in the behaviorbetween zero field and a field as low as 3T is largest whenx ¼ 0:10. This is the composition where the FM phase hasjust lost its dominance to the SG phase. This is shown byseveral measurements described above. As a result, CMR islargest for this composition and shows a cusp-like behaviorat x ¼ 0:10. The application of a magnetic field increasesFM phase and the effect is same as that of reducing x. Incomposition x ¼ 0:1, in which FM just lost its dominanceto SG phase, the external field of 3T is most effective inconverting SG back to FM phase. As a result, MItransition, which was not observable in zero field even at23K, occurs at much higher temperature in presence offield of 3 T. The large difference between the behavior ofMI transition in and without field results in a large CMR.Thus, we conclude that the value of x where FM and SGphases meet in the phase diagram is the critical concentra-tion where CMR is maximum. At higher x, the effect of themagnetic field becomes less dramatic. Thus, CMR

ARTICLE IN PRESSS.C. Bhargava et al. / Journal of Magnetism and Magnetic Materials 311 (2007) 594–604 603
decreases again as x increases above the critical value of0.1.
The transition from predominantly FM phase to thepredominantly SG phase of the manganite, as Dy contentis increased, is a FOPT. As a result of increase in thesubstitution, Mn–O–Mn bond angle (y) and bond lengthsdecrease. There is a critical angle yC when FM and AFMinteractions become comparable, resulting in frustration.Moreo et al. [7] have shown that sharp FOPT would occurat yC and 0K in the absence of disorder. This implies asharp FOPT at xC. The presence of disorder results in arange of x around xC, over which FOPT would occur. Inthe manganite under study, the range of x found is from0.07 to 0.10. Hysteresis loop measurements also show thatFOPT is sharper at lower temperatures.
At low x (p0:07), small bubbles of SG phase coexists inpredominantly FM manganite. The energy cost of suchbubbles is proportional to the domain wall area. This isprovided by disorder in yC, which in turn depends on thedisorder in FM (hopping of eg electrons) and antiferro-magnetic exchange couplings (between T2g electrons)around the non-disorder values [7]. The present studyshows that when the SG bubbles are small, the externalfield required to convert them to FM phase (HCr) is alsosmall. As x increases, the size and stability of SG fractionincreases. This increases HCr too. At large x (X0:1),bubbles of FM phase exist inside SG phase. In the region ofx between 0.09 and 0.10, there is a transformation fromFM to SG phase domination in the manganite. It has beenshown by Moreo et al. [7] that the cluster size depends onthe extent of disorder from the non-disorder at the FOPT.When the disorder is small (large), cluster size is large(small).
In the discussion below, we list other notable behaviorobserved in the present study. As we will see below, eventhough FM phase increases as x decreases, it is not fullyFM at low x. Similarly, Mossbauer study showed that eventhough SG component increases with x, it is not fully SGphase even when x is high. Thus, we conclude that there isa co-existence of SG and FM phases even when x is low orhigh. In none of the compositions it is fully FM or SG like.
AC susceptibility of the composition x ¼ 0:07, 0.08 or0.09, in zero DC field, shows that the flat part representingthe FM phase dips at a lower temperature, and possessessignificant frequency dependence. This shows the presenceof reentrant transition below 20K. We can, therefore,visualize three phases: two of them (FM and SG phases)formed at the magnetic transition temperature. The third, aSG phase, forms at low temperature (around 20–30K) andoriginates from FM part of the lattice at higher tempera-tures.
It is found that the branching temperature in the FC andZFC magnetizations and the temperature at which peakoccurs in the AC susceptibility are related to each other(Table 4). This can be seen clearly in the compositionsxX0:08, when the peak in the AC susceptibility is distinctlyobservable. This shows the relation between the onset of
irreversibility in magnetization (branching of FC and ZFCmagnetizations) and the SG transition. We may, therefore,conclude that the branching of FC and ZCF magnetiza-tions shows the presence of SG component. The branchingof FC and ZFC magnetization is observable even whenx ¼ 0. It, thus, appears that the SG phase is present evenwhen x ¼ 0, even though it is not visible in the ACsusceptibility, even when x is as high as 0.07.
5. Conclusion
We find increase in CMR as x is increased. It attains amaximum value (greater than 6� 108%) for x ¼ 0:10, anddecreases again with further increase in x. Our extensivemeasurements show that the composition where FM phasehas just lost its dominance to SG phase shows highestCMR and the behavior as a function of x shows cusp-likeincrease in CMR at the critical composition (xC). At thecritical point in the phase diagram, where FM and SGphases meet, the field causes drastic change in resistivitybehavior, leading to maximum CMR. Several relatedchanges that occur at xC have also been determined inthe present study.The coexisting SG and FM phases are related by FOPT,
which depends on x and Hext, and is sharper at lowertemperatures [7]. The free energies of the two phases areseparated by barrier HCr. Small bubbles of SG phasecoexist in the FM phase when xp0:07. These bubbles growas x is increased. In xX0:1, small bubbles of FM phaseexist in the SG phase.
References
[1] E. Dagotto, T. Hotta, A. Moreo, Phys. Rep. 344 (2001) 1.
[2] A.P. Ramirez, J. Phys. Condens. Matter 9 (1997) 8199.
[3] J.M.D. Coey, M. Viret, S. von Molnar, Adv. Phys. 48 (1999) 167.
[4] M.B. Salamon, M. Jaime, Rev. Modern Phys. 73 (2001) 583.
[5] E.L. Nagaev, Phys. Rep. 346 (2001) 387.
[6] Y. Tokura, Phys. Today July (2003).
[7] A. Moreo, M. Mayr, A. Feiguin, S. Yunoki, E. Dagotto, Phys. Rev.
Lett. 84 (2000) 5568.
[8] C. Zener, Phys. Rev. 81 (1951) 440.
[9] P.W. Anderson, H. Hasegawa, Phys. Rev. 100 (1955) 675.
[10] P.G. De Gennes, Phys. Rev. 118 (1960) 141.
[11] A.J. Millis, B.I. Shraiman, R. Muller, Phys. Rev. Lett. 77 (1996) 175.
[12] T. Mizokawa, D.I. Khomskii, G.A. Sawatzky, Phys. Rev. B 63 (2001)
24403.
[13] J.M. de Teresa, M.R. Ibarra, P.A. Algarabel, C. Ritter, C. Marquina,
J. Blasco, J. Garca, A. del Moral, Z. Arnold, Nature 386 (1997) 256.
[14] K.L. Clausen, W. Hayes, D.A. Keen, K.M. Kusters, R.L. McGreevy,
J. Singleton, J. Phys. Condens. Matter 1 (1989) 2721.
[15] Q. Huang, A. Santoro, J.W. Lynn, R.W. Erwin, J.A. Borchers, J.L.
Peng, K. Ghosh, R.L. Greene, Phys. Rev. B 58 (1998) 2684.
[16] H.Y. Hwang, S.-W. Cheong, P.G. Radaelli, M. Marezio, B. Batlogg,
Phys. Rev. Lett. 75 (1995) 914.
[17] P.G. Radaelli, D.E. Fox, M. Marezio, S.-W. Cheong, P.E. Schiffer,
A.P. Ramirez, Phys. Rev. Lett. 75 (1995) 4448.
[18] L.M. Rodriguez-Martinez, J.P. Attfield, Phys. Rev. B 54 (1996)
R15622.
[19] A. Anane, J.P. Renard, L. Reversat, C. Dupas, P. Villet, M. Virat, L.
Pinsard, A. Reveolevschi, Phys. Rev. B 59 (1999) 77.

ARTICLE IN PRESSS.C. Bhargava et al. / Journal of Magnetism and Magnetic Materials 311 (2007) 594–604604
[20] J.M. De Teresa, M.R. Ibarra, J. Garcia, J. Blasco, C. Ritter, P.A.
Algarabel, C. Marquina, A. del Moral, Phys. Rev. Lett. 76 (1996) 3392.
[21] S. Hebert, A. Maignan, C. Martin, B. Raveau, Solid State Commun.
121 (2002) 229.
[22] T. Terai, T. Kakeshita, T. Fukuda, T. Saburi, N. Takamoto, K.
Kindo, M. Handa, Phys. Rev. B 58 (1998) 14908.
[23] J. Blasco, J.M. de Teresa, M.R. Ibarra, P.A. Algarabel, C. Marquina,
J. Phys. Condens. Matter 8 (1996) 7427.
[24] Y. Sun, M.B. Salamon, W. Tong, Y. Zhang, Phys. Rev. B 66 (2002)
94414.
[25] S.C. Bhargava, Phys. Rev. B 58 (1998) 3240.
[26] S.C. Bhargava, A.H. Morrish, H. Kunkel, Z.W. Li, J. Phys. Condens.
Matter 12 (2000) 9667.
[27] S.C. Bhargava, in: B.V. Thosar, P.K. Iyengar, J.K. Srivastava, S.C.
Bhargava (Eds.), Advances in Mossbauer Spectroscopy, Elsevier,
Amsterdam, 1983.