Critical Analysis of Effectiveness of REDD+ for Forest ...
135
Project Reference Number: EBLU2012-02NMY(R)-Takeuchi The following collaborators worked on this project: Prof. Kazuhiko Takeuchi, UNU-ISP, Japan, [email protected] Mr. Luohui Liang, UNU-ISP, Japan, [email protected] Dr. Jintana Kawasaki, IGES, Japan, [email protected] Mr. Oroth Sengtaheuanghoung, NAFRI, Laos, [email protected] Dr. Narit Yimyam, CMU, Thailand, [email protected] Prof. Krishna Gopal Saxena, JNU, India, [email protected] Dr. Shimako Takahashi, UNU-ISP, Japan, [email protected] Ms Alva Lim, Seeds of Life, Timor-Leste, [email protected] National Agriculture and Forestry Critical Analysis of Effectiveness of REDD+ for Forest Communities and Shifting Cultivation, based on Lessons Learnt from Conservation Efforts in Laos and Thailand - Making a Difference – Scientific Capacity Building & Enhancement for Sustainable Development in Developing Countries FINAL REPORT for APN PROJECT
-
Upload
khangminh22 -
Category
Documents
-
view
1 -
download
0
Transcript of Critical Analysis of Effectiveness of REDD+ for Forest ...

Project Reference Number: EBLU2012-02NMY(R)-Takeuchi
The following collaborators worked on this project:
Prof. Kazuhiko Takeuchi, UNU-ISP, Japan, [email protected]
Mr. Luohui Liang, UNU-ISP, Japan, [email protected] Dr. Jintana Kawasaki, IGES, Japan, [email protected]
Mr. Oroth Sengtaheuanghoung, NAFRI, Laos, [email protected]
Dr. Narit Yimyam, CMU, Thailand, [email protected]
Prof. Krishna Gopal Saxena, JNU, India, [email protected]
Dr. Shimako Takahashi, UNU-ISP, Japan, [email protected]
Ms Alva Lim, Seeds of Life, Timor-Leste, [email protected]
National Agriculture and Forestry
Critical Analysis of Effectiveness of REDD+ for
Forest Communities and Shifting Cultivation, based
on Lessons Learnt from Conservation Efforts in
Laos and Thailand
- Making a Difference – SScciieennttiiffiicc CCaappaacciittyy BBuuiillddiinngg && EEnnhhaanncceemmeenntt ffoorr SSuussttaaiinnaabbllee DDeevveellooppmmeenntt iinn DDeevveellooppiinngg CCoouunnttrriieess
FINAL REPORT for APN PROJECT
Critical Analysis of Effectiveness of REDD+ for
Forest Communities and Shifting Cultivation,
based on Lessons Learnt from Conservation
Efforts in Laos and Thailand
Project Reference Number: EBLU2012-02NMY®-Takeuchi
Final Report submitted to APN
©Asia-Pacific Network for Global Change Research
PAGE LEFT INTENTIONALLY BLANK
OVERVIEW OF PROJECT WORK AND OUTCOMES 1. Introduction and background Covering about 30 percent of the world’s land area, forests are home to around 300 million people
around the world, including many indigenous people. More than 1.6 billion people depend, to
varying degrees, on forests for their livelihoods, e.g. fuelwood, timber, medicinal plants, forest foods,
income and fodder, and for their cultural and spiritual identify. Forests sustain critical environmental
services such as conservation of biodiversity, water and soil, and climate regulation. In spite of the
importance of forests, around 13 million hectares of natural forests were lost between 2000 and
2010. Deforestation is estimated to account for almost 18% of global greenhouse gas emissions, as
well as unimaginable losses in biodiversity, human and environmental well-being. Thus, the new
global initiative for reduction of deforestation and degradation, including the role of conservation,
sustainable management of forests and enhancement of forest carbon stocks or REDD Plus (+) has
substantial potential to deliver co-benefits for climate change mitigation/adaptation, biodiversity
conservation and livelihoods.
Successful REDD+ strategies are those that not only justify economic rationale for forest
conservation versus alternative uses, but also provide positive incentives to those who live around
forests and are dependent on forests for their livelihoods. This requires integrating and
complementing traditional forest management and agro-forestry practices of many local and
indigenous communities, rather than handling the two land uses as independent land use systems.
Traditional shifting cultivation often practiced in the tropical forests integrates a short cropping
phase and a long forest fallowing phase in rotation. In the cropping phase many cereals, root crops
and vegetables are cultivated to ensure a balanced diet for shifting cultivators, while soil seed bank
and tree stumps are conserved through zero tillage to facilitate subsequent forest regeneration. In
the fallow phase, forests not only provide a range of products so crucial for livelihoods, but also
contribute to soil fertility through transfer of nutrients from deeper horizons to surface soil, nitrogen
fixation, carbon sequestration, control of weeds and soil conservation. Apart from forest fallows,
natural forests are maintained at places by shifting cultivators for timber, honey, pollination, water
supply and spiritual values. Over generation, shifting cultivators have created and accumulated
profound knowledge on cropping as well as forest management. Nevertheless, traditional shifting is
undergoing a variety of changes, driven by both internal and external factors, with implications for
local livelihoods and ecosystem services.
2. Participating countries: The UN University, in partnership with National Agriculture and Forest Research Institute (NAFRI),
Laos, and Chiang Mai University (CMU), Thailand, with the support of the Asia-Pacific Network for
Global Change Research (APN) undertook a 3-year project to address the knowledge gaps and
potential opportunities and challenges of REDD+ in harmonizing co-benefits of carbon sequestration,
biodiversity conservation and livelihood improvement in the shifting cultivation landscapes. As part
of the UNU network, the research carried out by Jawaharlal Nehru University (JNU) land use,
biodiversity, carbon and livelihood dynamics in the Himalayas contributed to sharing of experiences
and success stories for sustainable development in marginal mountain regions. The nodal project
collaborators were:
• Mr. Oroth Sentaheuanghoung, National Agriculture and Forestry Research Institute (NAFRI),
Ministry of Agriculture and Forestry, Vientiane, Lao PDR. Tel. +85-6-21-770-075, Email.
[email protected], [email protected]
• Dr. Narit Yimyam, Highland Research and Training Centre, Chiang Mai University, Thailand.
Tel. +66-53-944-052, Fax. +66-53-222-014, Email. [email protected]

• Prof. Krishna Gopal Saxena, School of Environmental Sciences, Jawaharlal Nehru University,
New Delhi, India. Tel. +91-11-2671-7502/2616-9962, Email. [email protected]
3. Objectives:
The main objectives of the APN project were to (1) assess the potential social, economic and
environmental challenges and opportunities of REDD+ for selected communities in Laos and
Thailand by drawing lessons from past/ongoing forest conservation policies; (2) provide much-
needed scientific evidence on the potential co-benefits of traditional forest management and agro-
forestry practices by comparing it with alternative land-uses; and (3) develop participatory
community-based MRV mechanisms for REDD+. Findings assisted the pro-poor design and
implementation of REDD+, improved the well-being of forests dependent communities and
integrated traditional agro-forestry as an approach to climate change mitigation.
Amount granted and number years supported The Grant awarded to this project was: 3 years from 2011-2013
US$ 44,000 for Year 1:
US$ 38,000 for Year 2:
US$ 38,000 for Year 3:
Activities undertaken The project activities in the Year 1 included (1) the inception workshop to finalize site selection,
project implementation and monitoring framework and work plan; (2) the methodology training to
develop national capacity for project implementation; (3) the field work to characterize project sites,
classify and map land uses as a basis for carbon stock measurements, and (4) communication and
advocacy strategy of reaching out to various stakeholders involved in policy making and
implementation. The inception workshop held in Chiang Mai, Thailand in January 2011 re-confirmed
the above work plan, and agreed to build on the land use survey to test the carbon stock
measurement methodology in Year 1 although carbon stock estimation was planned for Year 2 in
the project.
In Year 2, the project activities included land use mapping, household surveys, field and laboratory
work, and plot sampling for estimation of carbon storage intensity. The inventory of carbon stock
and assessment of land use and carbon dynamics in project sites were successful. Two national
workshops were organized: on December 25-27, 2011 in Jinghong, China and on July 19-21, 2012 in
Chiang Mai, Thailand. The national workshop in Jinghong also promoted exchange of information
and linkages with other relevant projects in China. A training course on “What are carbon stocks and
how to monitor them” was organized in Tee Cha Village in Northern Thailand on 11-13 October 2012
for building the capacity of local farmers and forest officers to understand and manage forest carbon
stocks as stipulated in the MRV mechanism of UN-REDD. A good practice of avoiding burning to
enhance understory vegetation, carbon stock and biodiversity in teak plantation was demonstrated
to local farmers and officials in Laksip Village in Northern Laos.
In Year 3, the project findings were compiled and presented to a wider group of local officials,
communities, researchers, policymakers and international community in the international workshop
in Tokyo, Japan on 8-12 October 2013. The training on “What are carbon stocks and how to monitor
multiple functions of forest ecosystems” was organized in the Chang Khain Highland Research
Station in Chiang Mai, Thailand on 1-4 November 2013 for local farmers, local forest officers and
academic staffs of Chiang Mai University to disseminate the lessons learnt in community-
based MRV.

Site selection
Three major land-use systems/landscapes in tropical mountains: shifting cultivation, transition from
shifting to sedentary and sedentary cultivation and forest landscapes around Laksip Village, Luang
Prabang. Lao PDR and Tee Cha Village (a Pwo Karen Village in Sop Moei District of Mae Hong Son
Province), Thailand were selected based on a quick review of secondary data and supplementary
field survey. Characterization of both sites is described in details in Technical Report.
In order to share experience across different countries in SLM-MMSEA, the project team discussed
with the Indian partner to identify an associate project site in India with financial support from
different sources. A research activity on the sedentary land use systems/landscape has been carried
out in the Ratagad micro watershed, Indian Himalaya in Uttarakhand State of India. Land use/land
cover changes were mapped using satellite data and carbon densities in above-ground and below-
ground compartments within each land use/land cover type were estimated based on ground
measurements. It was agreed to select the Ratagad micro watershed as associate study site for the
APN project to exchange carbon stock estimation method and experience. The Chinese partner of
SLM-MMSEA carried out a new Ford Foundation project to assess multiple ecosystem services of
ancient tea forests in Mangjing Village in Southern Yunnan and to promote this system for the FAO’s
Globally Important Agricultural Heritage Systems (GIAHS) site. Inventory of high biodiversity and
carbon stocks in the tea forests is a critical element of the Ford Foundation-funded project. It was
agreed to select Mangjing village as an associate site for the new APN project to exchange
information and experience with the Chinese partner. The project associate sites in India and China
represent sedentary land use systems/landscapes in the mountainous regions.
Development of the project methodologies
The project evaluated different methods/models of estimating opportunity costs and carbon
stocks under different land use and land cover types and their suitability for community
based MRV. The project conducted both biophysical and socio-economic surveys. The
biophysical survey included mapping of land use-land cover types, inventory of carbon
stocks and biodiversity in different land use-land cover types, and analysis of carbon
dynamics and biodiversity under different land use scenarios and reference level. The socio-
economic survey analyzed the economic benefits of different land uses and opportunity cost
of REDD+ for forest conservation versus alternative land uses. Good land use practices were
identified to enhance co-benefits of carbon sequestration, biodiversity conservation and
income generation. The project teams demonstrated good land use practices to local
farmers and officials in Thailand and Laos. The project results were used to train local
stakeholders to appreciate, manage, measure and monitor forest carbon pools as a process
of community-based MRV. The project workshops were organized to develop methodology,
exchange knowledge and review progress across different participating countries.
Project workshops and training
As planned over the period of 3 years, five project workshops were organized as follows:
• Project Inception Workshop, 17-19 January 2011, Chiang Mai, Thailand. Project members
reviewed and discussed the project goals and expected outcomes, finalized the project
framework, and confirmed selection of two project sites, one each in Laos and Thailand.
Under the framework, project members discussed and agreed on the project work plan and
responsibilities. The workshop proposed to review and develop a project methodology to
guide land use survey and carbon stock inventory, and tested it this year. The methodology
workshop was then planned to take place in Luang Prabang, Laos in June 2011. The

workshop offered a good opportunity for the visiting project team members to appreciate
different land uses and their ecosystem services, including rotational shifting cultivation
practices in the Tee Cha Village, Northern Thailand, and details in Annex 1.
• Project Methodology Workshop, 19-21 June 2011, Luang Prabang, Laos. In this workshop,
different methodologies for carbon stock measurement at landscape level, and the
proposed methodology for each project site in India, Thailand and Laos were reviewed and
harmonized as the project methodology. The results of the workshop were then summarized
as a working manual to guide carbon stock measurement in all project sites. During the
field trip to the Laksip Village, the project team discussed and advised the Lao team to
develop land use/land cover classification for carbon stock measurement and laying sample
plots in the Laksip Village. The workshop provided a training opportunity for young
researchers to learn about the methodology for carbon stock measurement in the forested
landscape, details in Annex 2.
• Project Workshop, 25-27 Dec 2011, Jinghong, China. Project members reviewed findings of
carbon stocks measurement at the landscape-level across participating countries and
compare the carbon stocks of different land uses in the village landscape, and reviewed
relevant policies and propose a policy action plan. The project team visited and discussed on
measurement of carbon stocks at the associated project site in Yunnan, China is part of the
Ford Foundation-funded project “Demonstrate the use of World Agricultural Heritage Status
to strengthen community rights over natural resources in marginal ethnic minority
communities of western China”.
• Project International Workshop, 19-21 July 2012, Chiang Mai, Thailand. Project members
reviewed the project progress on carbon stock measurement, land use and carbon dynamics
and future scenarios, reference levels and opportunity cost, and discussed operational
guidelines for community based MRV and demonstration of good land use practices. The
project teams visited Pah Poo Chom village and Pang Ma O village near Chiang Mai and
discussed with local officials and farmers on land use management, and learned about the
process of Miang tea including harvesting, streaming and fermenting.
• Project Workshop, 8-12 October 2013, Tokyo, Japan. Project members reviewed the final
project reports of national teams on five aspects of the project: land use-land cover, biomass
and soil organic carbon estimation; land use and carbon dynamics: scenarios and references
levels; economic analysis-opportunity cost/benefit analysis; community based MRV process,
and policy recommendations. The project teams visited the Globally Important Agricultural
Heritage System (GIAHS) site of the “traditional integrated tea-grass system” in Higashiyama
Area, Kakegawa City, Shizuoka Prefecture, and an area of ice terraces. Rice terraces were
abandoned many years ago, but are being restored through an innovative system of
memberships.
• Project Training: while above project workshops shared and enhanced expertise and
capacity of project teams across different countries, training programmes were conducted
to develop capacity of local farmers and local forest officers on topics of “What are carbon
stock and how to measure it in forest”: two in Chiang Mai Province, Thailand and one in
Luangprabang Province, Laos. The training report is attached in Annex 3.
Relevance to the APN Goals, Science Agenda and to Policy Processes
In response to APN goals, the project promoted regional cooperation in global change research on
conservation of tropical forests in Southeast Asia and South Asia, and further enhanced the UNU
research network on sustainable land management in the mountainous region of mainland
Southeast Asia (SLM-MMSEA), disseminated the project findings to other countries through SLM-
MMSEA, such as Yunnan Province of China and Myanmar. Project coordinators in Lao PDR, Thailand
and India are based in national research institutions and have regular interactions with policy-
making at national and local levels. In addition to regular discussions with policy makers, policy
workshops were held at end of the project in Laos, Thailand and at UNU to present project findings
to policy makers and researchers. Scientific knowledge from the project was also provided to local
communities through training and field demonstration activities in Laos and Thailand. The regional
cooperation, through the south to south (Laos, Thailand and India) and the north to south (Japan
and other developing countries) linkages, the research capabilities of participating nations in the
region have been strengthened. The research capacity of young project team members also
benefited from the international programme “On-the-Job Research Capacity Building for Sustainable
Agriculture/Forestry in Developing Countries (OJCB)” which is funded by Ministry of Agriculture,
Forestry and Fisheries (MAFF). Postgraduate students benefited from their participation in the
project. Through UNU coordination, the project contributed to the University Network for Climate
Ecosystems and Change Adaptation Research (UN-CECAR). In particular, the project networking in
Southeast Asia helped develop the new project on Sustainable Forest Rehabilitation and
Management for the Conservation of Trans-boundary Ecological Security in Montane Mainland
Southeast Asia– Pilot Demonstration Project of Lao PDR, Myanmar and China/Yunnan” (SFR-MMSEA),
which is funded by the Asia-Pacific Network for Sustainable Forest Management and Rehabilitation
(APFNet). The project team also shared relevant expertise and experience with members of the new
project SFR-MMSEA at the final project workshop held in UNU in October, 2013.
The project directly contributed to APN’s Science Agenda by deepening regional research on forest
ecosystem, biodiversity and land-use change. More specifically, it explored the symbiotic
relationship between communities, agricultural systems and forests, and the way in which policy
interventions like REDD+ can affect it. The project brought together natural, socio-economic and
political sciences and non-science stakeholders. The project involved science-policy-community
partnerships as a key element of the MRV mechanism for REDD+. Regular policy discussions and
workshops were held to develop strategies with policymakers and decision-makers, and mainstream
outputs into policy processes. Project collaborators hold unique positions in their own right as a
bridge between local people, academia, government, and UN and other international
organizations/networks. Regular publications and presentations were used to disseminate scientific
findings, and increase the regional visibility of the APN to policymakers, end-users and the public
from local to national and international levels.
Self evaluation
The project selected two excellent study sites, one each in Northern Thailand (Tee Cha, a Pwo Karen
village in Sop Moei District of Mae Hong Son Province), and Northern Laos (Laksip, a Khmu village in
Luang Prabang Province). The rotational shifting cultivation remains the major livelihood in the study
village in Northern Thailand while the shifting cultivation is converting to plantations in the study
village in Northern Laos. Two villages offer a good comparison of traditional land use systems in
transition with consequences on carbon stock, biodiversity and livelihoods. Two associate sites in
India and China provided a contrast of sedentary agriculture in similar mountainous areas.
As planned, the project carried out successfully four major components: (1) biophysical survey
mapped land use-land cover types, measured carbon stocks and biodiversity in different land use-
land cover types, analyzed land use scenarios, carbon dynamics and reference level; (2) Socio-
economic survey investigated economic benefits of different land use-land cover types, estimated
opportunity cost of REDD+ (focusing on forest conservation versus alternative land uses); (3) good
land use practices were identified to enhance co-benefits of carbon stocks, economic benefits as
well as biodiversity through integration of biophysical and socio-economic assessments, and (4)

community-based MRV, capacity building, networking and policy recommendation (5 workshops,
training activities/field demonstrations). Good land use practices were demonstrated to local
farmers and officials, and relevant training programmes organized for local farmers and officials to
manage, measure and monitor forest carbon pools as a process of community-based MRV. These
activities produced and disseminated relevant research findings on co-benefits of forests as well as
enhanced regional cooperation and led to a new follow-up project SFR-MMSEA, and strengthened
national and local capacity in sustainable forest management. In addition, the project developed a
working manual for carbon stock measurement at a landscape level (see Appendix).
Potential for further work
Deforestation remains a global challenge in tropical regions. As an important watershed and hotspot
of biocultural diversity, MMSEA suffers from severe deforestation with negative impacts on ecology,
hydrology and local livelihoods, resulting from inappropriate land use change under internal and
external pressures. Forest conservation often incurs the opportunity cost by forgoing more
profitable alternative land uses, such as conversion to cropland. REDD+ is expected to mitigate the
opportunity cost. However, the payment from REDD+ remains unpredictable, and could be too small
in comparison with other forms of support for forest conservation. It is important to combine
REDD+ with other measures for forest conservation. Moreover, carbon stocks exist in non-forest
land uses (such as cropland, home garden, agro forest, or fallow fields), and should be managed at a
landscape level. Agro-forestry system can also significantly increase income from components of
cropping and NTFPs beyond carbon benefits. Past efforts to rehabilitate degraded land are often
through mono-species plantations with limited contribution to restoration of environmental services.
There is a critical need to further study multiple values or co-benefits of forests and develop
practical models of forestry that combine production as well as environmental values.
Publications 1. Semwal, R.L., Nautiyal, S., Maikhuri, R.K., Rao, K.S. and Saxena, K.G. 2013. Growth and
carbon stocks of multipurpose tree species plantations in degraded lands in Central
Himalaya, India. Forest Ecology and Management, 310, 450-459.
2. Bhadauria, T., Kumar, P., Kumar, R., Maikhuri, R.K. and Saxena, K.G. 2012. Earthworm
populations in a traditional village landscape in Central Himalaya, India. Applied Soil
Ecology, 53, 83-93.
3. Takeuchi K., Takahashi S., Lim A., Kawasaki J., and Liang L. 2011. REDD+ for Forest
Communities. APN Newsletter Vol. 7, Issue 3, Sep. 2011, ISSN 2185-6907.
4. Takeuchi, et al, 2012. Forest Carbon Stocks in Shifting Cultivation of Thailand and Lao PDR,
APN Science Bulletin Issue 2, March 2012, ISSN 2185-761x
Acknowledgments
We are grateful to APN for financial support, to our colleagues for their collaboration, and to local
communities at the study sites in Laos, Thailand and India for their cooperation and participation in
the project implementation. We are also grateful to Southwest Forestry University of China (SWFU)
for hosting a project workshop in Jinghong, China on 25-27 Dec, 2011, providing a good platform for
exchange with relevant research in China.

Final Technical Report: EBLU2012-XXXX-XXX 0
TECHNICAL REPORT
Preface
With APN’s financial support, UNU, CMU, NAFRI, and JNU undertook the 3-year project “Critical
analysis of effectiveness of REDD+ for forest communities and shifting cultivation, based on lessons
learnt from conservation efforts in Laos and Thailand” from 2011-2014. This report is an outcome of
the joint project. The draft reports from participating countries were first reviewed at the final
project workshop held in UNU in 9-11 October 2013. These reports have been then updated and
presented to national policy makers and researchers for feedbacks, and finalized and synthesized
according to the APN format. The contents are organized into five sections. Section I discusses
project background, justification and objectives. Section II explains the project methodology,
including biophysical and socio-economic survey and analysis. Section III provides a synthesis of
project results and discussions. Section IV summarizes project findings. Section V identifies gaps in
knowledge and areas of future research and development. Views expressed in this volume are of the
authors and not necessarily of the organizations they are affiliated to.
Table of Contents
Introduction ......................................................................................................................... 2
Background ......................................................................................................................................... 2
Objectives of current project .............................................................................................................. 5
Location of main project sites ................................................................................................ 5
Methodology ....................................................................................................................... 6
Land use and biodiversity survey ........................................................................................................ 6
Carbon stock measurement in the forested landscape ..................................................................... 7
Economic analysis-opportunity cost/benefit analysis ................................................................ 8
Results & Discussion ............................................................................................................. 9
Thailand .............................................................................................................................. 9
General background of project site in Thailand ............................................................................. 9
Land use-land cover mapping ....................................................................................................... 15
Biodiversity in different land uses ................................................................................................ 17
Biomass and carbon storage estimation in different land uses ................................................... 18
Land use and carbon dynamics: reference level, carbon stock changes and future scenarios .... 22
Economic analysis- opportunity cost/benefit analysis ................................................................. 27
Community based MRV process ................................................................................................... 30
Laos .................................................................................................................................. 31
General background of project site in Laos .................................................................................. 31
Land use-land cover mapping ....................................................................................................... 32
Biodiversity in different land uses ................................................................................................ 34

Final Technical Report: EBLU2012-02NMY-Takeuchi 1
Biomass and carbon storage estimation in different land uses ................................................... 35
Land use and carbon dynamics: reference level, carbon stock changes and future scenarios .... 43
Economic analysis- opportunity cost/benefit analysis ................................................................. 50
Community based MRV process and demonstration of good land use practices ........................ 56
India .................................................................................................................................. 56
General background of associated project site in India ............................................................... 56
Study area and land use-land cover mapping .............................................................................. 57
Tree survival, tree growth and carbon stock measurements ....................................................... 60
Discussion ..................................................................................................................................... 68
Conclusions .................................................................................................................... 71
Future Directions ............................................................................................................ 74
References ..................................................................................................................... 74
Appendix ........................................................................................................................... 80
Annex 1: Summary report of the inception workshop of the join UNU-CMU-NAFRI project on
“Critical analysis of effectiveness of REDD: for forest communities and shifting cultivation, based
on lessons learnt from conservation efforts in Laos and Thailand”, 17-19 January 2011, Chiang
Mai, Thailand..................................................................................................................................... 80
Annex 2: Summary report of project methodology workshop on “REDD+ for forest communities:
Learning from forest conservation in Laos and Thailand”, 19-21 June 2011, Luang Prabang, Laos
and the working manual for carbon stock estimation ...................................................................... 89
Annex 3: Summary report training on “What are carbon stocks and how to measure the tree in
forest” in Thailand ........................................................................................................................... 108
Annex 4: The species type of plant found that in the different fallow year in short rotational
shifting cultivation of Tee Cha village, Thailand ............................................................................. 114
Annex 5: Photos of the project activities .............................................................................. 117
Annex 6: Funding sources outside the APN .................................................................................... 123
Annex 7: List of Young Scientists ..................................................................................................... 123
Annex 8 Glossary of Terms ............................................................................................... 123
2 Final Technical Report: EBLU2012-02NMY-Takeuchi
1.0 Introduction
1.1 Background
Forests are home to around 300 million people around the world, including people of indigenous
and tribal groups, who are largely dependent on forests. More than 1.6 billion people depend to
varying degrees on forests for their livelihoods, e.g. fuelwood, medicinal plants, forest foods and
income, and for their cultural and spiritual identity. Forests sustain critical environmental services
such as conservation of biodiversity, water and soil conservation, and climate regulation.
According to FAO’s the Global Forest Resources Assessment 2010, the world's forests covered just
over four billion hectares, or 31 per cent of total terrestrial area, and stored more than 650 Gt of
carbon, presenting a significant global carbon stock. However, 13 million hectares of forests mainly
in tropical regions was lost every year between 2000 and 2010. Deforestation is estimated to
account for almost 20% of global greenhouse gas emissions, resulting in losses in biodiversity,
environmental services and human well-being.
Forest carbon stocks can be increased through reforestation and afforestation. The Clean
Development Mechanism of Kyoto Protocol (CDM) allows industrialized countries to meet a part of
their carbon emission reduction commitments by carrying out afforestation and reforestation (AR) in
developing countries. On the other hand, loss of forest carbon stocks as emission of greenhouse
gases can be avoided through conservation of standing forests that would be otherwise lost and
degraded, i.e. reducing deforestation and forest degradation. Nevertheless, avoided deforestation to
reduce emission is not included under the Kyoto Protocol.
Reducing Emissions from Deforestation and Forest Degradation in Developing Countries (REDD) is an
emerging international instrument initially proposed at the COP 11 of UNFCC in Montreal in 2005 to
provide economic incentives to developing countries to undertake actions for protection and
enhancement of standing forest carbon stocks. Discussion on REDD was focused first on ‘reducing
emissions from deforestation’ or RED. ‘Avoided degradation’ – the second D in REDD – was officially
added later at COP13 in Bali, 2007, when it was realized that for some countries, forest degradation
was an even bigger problem than deforestation. There was further recognition that even greater
climate benefits could be achieved if positive actions, such as conservation of forest carbon stocks,
sustainable management of forest and enhancement of forest carbon stocks could be combined
with avoided deforestation and degradation. The positive actions became the ‘+’ in REDD+, and was
officially endorsed one year later at COP14 in Poznan.
Similar to payments for environmental and ecosystem services (PES) mechanisms, REDD+ is
expected to provide incentives to forest owners and users for not converting forests to other uses
to prevent loss of forest carbon stocks, or for not overusing forests to avoid degradation of forest
carbon stocks. The incentives or payments are based on the net change in carbon stocks for a
specific period in comparison to a reference level. The net change in carbon stocks are measured
and calculated into certified ‘carbon credits’ which can be eventually bought and sold on a carbon
market or paid through a fund. However, the global architecture for REDD+ still remains under
development.
The success of any REDD+ projects must consider the sustainability of forest communities whose
livelihoods depend on forest ecosystem services. REDD+ strategies need to go beyond carbon

Final Technical Report: EBLU2012-02NMY-Takeuchi 3
benefits to promote co-benefits for environment and forest communities through the harmonious
integration of multiple values of forests, including poverty reduction, food and livelihood security,
biodiversity conservation, climate change mitigation and adaptation. In another words, REDD+
should promote the multiple values of forests, not only carbon benefits but also co-benefits of food
and livelihoods, and biodiversity conservation. Any attempts that enforce a barrier between local
people and their forests, without consideration of their needs or other conflicting policy priorities,
may do little to alleviate poverty, and even fail to enhance carbon stocks and prevent biodiversity
loss in the long term. Carbon benefits for global climate regulation should not be achieved at
expense of forest functions to support local livelihoods and biodiversity. Furthermore, a whole
landscapes approach is necessary to ensure against ‘leakage’ whereby the carbon benefits from
areas protected under REDD+ are offset by severe reductions in carbon storage and biodiversity
from inappropriate land use intensification and land degradation in surrounding areas.
Learning from the past
From a historical perspective, REDD+ is only one out of a long line of many other approaches that
have been used for forest conservation. Past and ongoing forest efforts have had mixed results, they
include forest regulations and laws, zoning of protected areas, projects to rehabilitate degraded
forests and lands, relocation of forest communities, etc. While some may have achieved objectives
for increased forest cover, it has often been at the expense of forest communities. In some cases,
perverse and unintended consequences have emerged or even resulted in the worsening of
deforestation rates. This raises many ethical, equitable and sustainability concerns that should not
be repeated under REDD+.
One of the past efforts for forest conservation is to deal with shifting cultivation which includes a
short period of cropping and a relatively long period of forest fallow. Many forest communities,
including those in Southeast Asia rely on shifting cultivation as one of their main livelihoods. A wide-
scale forest conservation policy has been implemented to restrict and stop shifting cultivation by
promoting sedentary agriculture, allocating forest fallows for forest conservation and resulting in
land shortage for shifting cultivation. Without providing alternative livelihoods and capacity
development, forest communities have had to increase the cropping period of the shifting
cultivation and decrease the fallow period to cope with the land shortage, but at the risk of
accelerating land degradation (Liang, et al, 2010). Time-averaged aboveground carbon stocks could
decline by about 90% if the long fallow periods of traditional swidden cultivation are reduced to 4
years short fallow system (Bruun, et al, 2009). REDD+ can be both a challenge and opportunity for
shifting cultivators (Mertz, 2009).
Restrictions on forest access, reductions in available land for shifting cultivation, and then on top of
that, increased population density, competing land-use pressures and conflicting policies have led to
significant acceleration in land degradation and unsustainable agricultural intensification, as well as
observed reductions in soil fertility and species and plant biodiversity. This in turn has caused
increased hardship, food insecurity, and social tensions. It is likely that at the landscape level, the
overall carbon-storage balance was also affected negatively, yet more scientific research is needed
to determine this. Other perverse consequences include the loss of crop diversity embraced in the
traditional shifting cultivation.
Learning the lessons from the past and how the experience will be translated into REDD+ are only
partially considered in current mainstream debates on REDD+. The introduction of any additional

4 Final Technical Report: EBLU2012-02NMY-Takeuchi
forest conservation measures, even those like REDD+ with its carbon storage-focus, cannot be
analysed in a vacuum separated from the past but as part of a continuum of one of many forest
conservation efforts. Nor can it be developed in isolation from communities who not only depend on
forests, but who are also critically needed and supported for the long-term and on-the-ground
management, monitoring, reporting and verification (MRV) of forests within REDD+ so as to benefit
from carbon finance as additional source of income from forests. The realities of forest conservation
policies and its success in achieving stated goals and the socio-economic impacts (spatial and
temporal) on local communities must be clearly evaluated. Without understanding why past forest
conservation and rehabilitation efforts have failed and how to properly address the drivers of
deforestation will only guarantee failure. As it stands, the development of REDD and REDD+ appears
to follow similar paths taken by past forest conservation efforts, i.e. as stand-alone approaches that
focus purely on carbon accounting and seek to erect barriers between local communities and
forests. What could result is a fragmented mosaic where ‘conservation islands’ of protected forest
areas exist next to poverty-ridden forest-agriculture frontiers.
Going beyond REDD+
The approach of REDD+ has so far mirrored present conservation approaches to treat ‘nature’ and
human societies as separate entities. That is, exclude, even, expulse humans from protected forest
areas (carbon sinks) as their intervention causes its degradation. This thinking devalues the role of
local and indigenous communities in shaping and maintaining the surrounding landscapes and
ecologies with which they live in, and ignores the positive impacts that their traditional (agri)cultural
practices can have on the integrity, richness and resilience of ecosystems and landscapes (Takeuchi,
et al, 2002; van Oudenhoven, et al, 2010).
With the uncertainty of future climate change, it is necessary to enhance the resilience and
adaptability of these landscapes by enhancing diversity and flexibility of social-ecological systems.
Because of the role socio-ecological landscapes play in soil fertility, carbon sequestration,
biodiversity, food and water security, livelihoods and increased climate change resilience for the
poor, they must be incorporated and supported by REDD+ mechanisms. Rerkasem (2003) and Hajjar
et al, 2008 argue that the complex mosaic landscapes of traditional land-use systems, with well-
managed forest fallows, provide a range of environmental and social services: hydrology,
biodiversity, carbon storage, and livelihoods. They are socio-ecologically productive landscapes that
maintain ecosystem functioning and support a rich repository of agricultural biodiversity through
social mechanisms of exchange and use of many varieties and species. In addition, the indigenous
knowledge and technology have been adapted to deal with the social and economic change
(Rerkasem, et al, 2009; Liang, et al, 2009).
Presently, the objectives and scope of REDD+ remain narrow with its focus on carbon sequestration
and ‘officially-defined’ forests areas. One of the difficulties is the complicated definitions of what a
forest is and what to do with the many trees that exist outside areas officially defined as forests,
such as on farms. In developing countries, around 1.2 billion people practice farming that combines
both agriculture and forestry, or agroforestry (FAO, 2005). It is also at these agricultural-forest
interfaces where much soil and land degradation can occur from land-use pressures should those
trees be removed. Agricultural-forest interfaces, agroforests and tree-based land-use systems
managed by farmers still remain at the fringes of the REDD+ debate. However there have been calls
to include agriculture, agroforestry and other land use types (AFOLU) in the carbon accounting
Final Technical Report: EBLU2012-02NMY-Takeuchi 5
(Smukler, S., and Palm, C., 2009). More recently, the ‘reducing emissions from all land uses’ (REALU)
approach has been put forward for arguing that “a whole-landscape approach to reducing emissions
and managing carbon stocks can help address the drivers of deforestation, reduce problems like
leakage, and eliminate the need for precise forest definitions” (van Noordwijk, M. et al, 2009.)
REDD+ is about recognizing the multiple values of forests and should not narrowly emphasize forests
as carbon sinks. The traditional forest and trees-based land-use systems and landscapes offer many
models to integrate many values of forests and trees into REDD+. Systematic research and scientific
data are needed to evaluate past/ongoing forest conservation efforts and assess their stated
objectives to the actual realities on the ground, and then translate the lessons learned into
improving future forestry schemes like REDD+.
1.2 Objectives of the current project
In order to address the knowledge gap on potential opportunities and challenges of REDD+ as
discussed above, the UN University, in partnership with National Agriculture and Forestry Research
Institute, Laos, Chiang Mai University, Thailand and Jawaharlal Nehru University, India, with the
support of the Asia Pacific Network has undertaken the 3-year project that aims to:
• Assess the potential social, economic and environmental challenges and opportunities of
REDD+ for forest communities in Laos and Thailand. Lessons will be drawn from
past/ongoing forest conservation policies;
• provide much-needed scientific evidence on the potential co-benefits of traditional forest
management practices and comparing it with alternative land-uses; and
• Develop participatory community-based MRV mechanisms for REDD+ to enable local
communities to incorporate carbon stocks into their forest management.
Findings could assist the pro-poor design and implementation of REDD+, improve the well-being of
forests dependent communities and integrate traditional agriculture and forestry as a climate
change mitigation agenda. The project was launched in Chiang Mai University in Jan 2011 with
identification of two study villages, one each in Northern Thailand and Northern Laos.
1.3 Location of main project sites Two project sites, one each from Thailand and Laos, were selected. Tee Cha Village, the project site
in Thailand and Laksip Village, the project site in Laos represent different forms of shifting cultivation
and changes therein. The rotational shifting cultivation remains the major livelihood in the study
village in Northern Thailand while the shifting cultivation is in transition to plantations in the study
village in Northern Laos. Two villages offer a good comparison of traditional land use systems in
transition. In addition, UNU research network members in India and China associated their study
villages to the research project for a cross-region comparison. Location of both sites is indicated in
the Figure 1 at end of the annex. Details of each of these two project sites are characterized in the
section three.

6 Final Technical Report: EBLU2012-02NMY-Takeuchi
Figure 1 Location of Project Sites
Laksip Village, Laos
Tee Cha Village, Thailand
2.0 Methodology The project methodology was formulated to answer the questions: (i) which land uses encompass
high levels of carbon stocks/biodiversity and what are the rates of losses or gains in carbon
associated with different land use/management changes?; (ii) what are the factors driving
conversion of high carbon stock/biodiversity land uses to low carbon stock/biodiversity land uses?;
(iii) what opportunities and challenges are available for promoting conversion of low carbon
stock/biodiversity land uses to high carbon stock /biodiversity land uses?; and (iv) what
opportunities and challenges are available for promoting conservation of high carbon
stock/biodiversity land uses?
The methodology is composed of four components: (1) biophysical survey and analysis mapped land
use-land cover types, measured carbon stocks and biodiversity in different land use-land cover
types, analyzed land use scenarios, carbon dynamics and reference level; (2) Socio-economic survey
assessed economic benefits of different land use-land cover types, estimated opportunity cost of
REDD+ (focusing on forest conservation versus alternative land uses); (3) Identification of good land
use practices to enhance co-benefits of carbon stocks, economic benefits as well as biodiversity
through integration of biophysical and socio-economic assessments, and (4) good land use practices
were demonstrated to local farmers and officials, and relevant training programmes organized for
local farmers and officials to appreciate, measure, monitor and manage forest carbon pools as a
process of community-based MRV.
2.1 Land use and biodiversity survey Each project site village represents a land use system and landscape with different land uses which
support village livelihoods as well as provide ecosystem services. Tee Cha Village in Thailand

Final Technical Report: EBLU2012-02NMY-Takeuchi 7
represents the land use system of shifting cultivation; Laksip Village in Laos presents the land use
system in transition from shifting cultivation to sedentary system. The associate sites in India and
China represent sedentary land use systems. These land use systems create particular village
landscapes and cover a mixture of land uses to detect and compare land use and carbon dynamics in
MMSEA.
Land use survey determined different land uses, areas and their spatial distribution in the whole
village landscape, and provided a basis for stratification of the village landscape into relatively
homogenous units for sampling investigation of carbon stock and biodiversity in each major land use
type in the village landscape, and for identification of good land use practices rich in these
ecosystem services. While drawing the land use classification scheme, due attention was paid to the
indigenous management systems so that local communities were able to better participate in the
MRV process and appreciate impacts of their land management practices on carbon stocks and
biodiversity.
Mapping of existing and historical land use-land cover types in each project site integrated satellite
based and ground surveyed based information, including review of secondary data. All data were
pooled in a digital data base and analyzed in a GIS system. Land use change analysis over a number
of time series projected land use scenarios, carbon dynamics and reference level.
2.2 Carbon stock measurement in the forested landscape
The carbon storage estimation
Carbon density in vegetation in a given land use-land cover was estimated as 50% of the oven-dried
biomass.
The biomass measurement
A. In the Forest Areas
A.1 The biomass of plant species (above ground biomass)
Measurement in each replication (4 Rep. in forest type)
• For plant height (>1.5 m) we used plot size as follows:
� Plot size 40m X 40m for measuring diameter of mature trees with DBH ≥4.5 cm
� Plot size 20m X 20m for measuring diameter of other trees and shrubs
• Biomass was calculated using allometric equation given by Tsutsumi et al. (1983):
Biomass of Stem (WS) = 0.0509*(D2 H)
0.919
Biomass of Branch (WB) = 0.00893*(D2 H)
0.977
Biomass of Leaf (WL) = 0.0140*(D2 H) 0.669
and by Ogawa et al. (1965) for Utility forest
Biomass of Stem (WS) = 0.0396* (D2H)
0.9326
Biomass of Branch (WB) = 0.003487*(D2H) 1.027
Biomass of Leaf (WL) = ((28.0/Ws+ WB) +0.025)–1
A.2 The biomass of root trees (below ground biomass)
Root biomass was estimated by equation given by Cairns et al., (1997) and Jobbagy and Jackson
(2000).
Root biomass = 24% of Aboveground biomass of trees
A.3 The biomass of the groundcover (groundcover/herbaceous plants and litter)
The biomass of the groundcover and litter was estimated by .
• Cutting off all standing plants at ground level in 2 m x 2 m plots and collection of litter
on ground floor.

8 Final Technical Report: EBLU2012-02NMY-Takeuchi
• Samples were weighed directly and sub-sample of 3 kg (groundcover plant) and 1 kg
(litters) were taken for oven drying at 80 o c for 48 hours to calculated oven-dried
biomass.
For the carbon storage in the soil
Measurement of soil organic matter
Soil organic carbon content (Cs) was estimated in soil collected from 0-30 cm layer using the
equation of
Cs = 58% OM x Soil mass
Soil mass = D * A * H
OM = organic matter,
D = Soil bulk density (g/cm3), A = Area (ha), H = soil depth (cm)
The carbon content
The carbon content in the biomass of the aboveground and belowground portions of the trees was
calculated by summarizing total biomass, then conversion factor at 0.5 for carbon content
estimation.
BT = BS+BB+BL+BR
TC = BT x 0.5
Whereas: BT = Total biomass of tree (ton/ha)
BS = Total biomass of stem (ton/ha)
BB = Total biomass of branch (ton/ha)
BL = Total biomass of leave (ton/ha)
BR = Total biomass of root (ton/ha)
TC = Total carbon content of tree (ton/ha)
The groundcover carbon content was estimated by the following equation
GT = GCT x 0.5
Whereas: GT = Total groundcover carbon content (ton/ha)
GCT = Total biomass of groundcover (ton/ha)
The carbon content of top soil horizon (0-30cm.) will be calculated by the following equation:
ST = Soil mass X SOC concentration (%)
Soil mass (ton/ha) = [Area X Depth] X Bulk density
Whereas: ST = Total soil carbon content in top soil horizon (ton/ha)
D = Bulk density (g/ cm3)
H = Depth (cm)
SOC = Soil Organic Carbon = 58%OM
Total carbon content was estimated by the following equation:
CT = TC+GT+ST
Whereas: TC = Total carbon content of tree (ton/ha)
GT = Total carbon content of groundcover (ton/ha)
ST = Total soil carbon content of soil (ton/ha)
2.3 Economic analysis- opportunity cost/benefit analysis

Final Technical Report: EBLU2012-02NMY-Takeuchi 9
Based on farmers’ interview, the monetary costs and benefits under different types of land use were
used to estimate the opportunity costs of land use by using the Net Present Value (NPV) formula.
• NPV is calculated to estimate the profitability of a land use over 20 years
• Discount rate used is 5 % for every year; there are no discount rate for the years where
there is no profit
• NPV of each land use is an accumulation of every year profit (revenues minus costs of
material and labor inputs) minus discount rate
3.0 Results & Discussion
3.1 Thailand
3.1.1 General background of project site in Thailand
The project site-Tee Cha village, Mae Hongson Province, saw over 5-fold increase in number of
households/population and 2-fold reduction in the length of fallow phase between two successive
croppings on the same site during 1950 —2011 period decline in length of fallow. The settlement
patterns of farmers in Tee Cha Village (1934-2011) are showed in table 1 and figure 2.
Table 1 Settlement patterns of farmers in Tee Cha Village (1934-2011)
Year Households Fallow cycle (years)
<1950 5-9 >10-20
1950-1957 15 10
1958-1994 8-18 10
1994-2005 32-35 7
2011 48 7

10 Final Technical Report: EBLU2012-02NMY-Takeuchi
Figure 2 Expansion of cropping area in Tee Cha during 1937-1957

Final Technical Report: EBLU2012-02NMY-Takeuchi 11
At present, Tee Cha village is Pwo Karen Village of Sop Moei in Mae Hong Son province (19°78 N,
93°84 E), in Northern Thailand. The village has 172 people in 48 households. The cycle of rotational
shifting cultivation is 7 year rotation.
General characteristics of village site are the mountainous area of Pwo Karen ethnic group. The
climate in Tee Cha (700-900 m MSL) is slightly more annual rainfall at 1,204 mm and 3 seasons, rain
season in June-September, winter season in November-February and summer season in March-May.
The average temperature is 24.4 0C (T max 41.2
0C, T min 9.5
0C). The soil in Tee Cha is sandy loam
texture with good drainage property and generally poor with low pH (average 5.16 pH).
Table 2 The site description of Tee Cha Village, Thailand
Characteristic Tee Cha
Demographic
• Household
• Population
- Male
- Female
48
172
83
89
School Primary school
Infrastructures
• Electricity
• Road
• Water supplied
90 %
Soil road
60 %
Occupation
• On-farm
• Other
48 HH
0 HH
Production system Short rotational shifting cultivation system
Productivity For subsistence
Location
• Province
• Altitude (MSL)
National context.
• National policy relevance
• Potential contribution from
implementing Agencies
Critical problems facing by
government and implementing
agencies
Main problem of land degradation
Mae Hon Son
700-900
Reduce fallow period for 10 to
7 years and promote sustainable farming practices
Tambon Administration Offices (TAOs)
Reduce fallow period
Deforestation, soil erosion and
soil degradation

12 Final Technical Report: EBLU2012-02NMY-Takeuchi
Land allocation and tenure arrangement
In Tee Cha, land allocation and tenure arrangements are basically based on local tradition,
customary rules and regulations. According to local rules and regulations, Karen community allows
individual families to own paddy fields and permanent orchards. Shifting cultivation fields were
originally managed on communal basis. Community made almost every decision from choosing land
for opening up, time of slashing and burning, and allocation of land to individual household for
upland rice production. Village leader (Ran Koo) plays a significant role in these decisions. With
increasing pressures on land, the previous plot allocated for household production is allocated and
fixed permanently to household members in the village. Rights to land ownerships are determined
from families who open up the land first and big trees are often used as the land mark. After
burning, the land may be lined up with bamboo or any tree stems to demarcate the plot.
Demarcation of the plot would have to conduct jointly with owners of the adjacent fields in order to
avoid any conflicts of interests. Inherited rights of land to the youngest daughter in family are
common in Karen community. The reason for this relates to her duty to look after her parents when
they are old. Land may be shared and exchanged with relatives in order to keep his or her rights.
Sharing land with people outside kinship is a risk to losing land rights. This may happen with small
family but occupy big piece of land. Every household has access to at least a piece of land for upland
rice cultivation. The land has to be redistributed among the member households. Final decision has
to be reached before agreement to opening up fallow field. The customary land tenure and
ownerships of Pwo Karen community are shown in table 3.
Table 3 Activities of rotational shifting cultivation of farmers in Tee Cha Village
Activities Timing(month) Management Decision
1. Village meeting - -
• New year ceremonial February Communal
• Selection of field plot for
cropping February Communal
• Land allocation to each
household February Communal / Household
• To ask permission land
spirit February Household
2. Slashing and looping big trees March Collection
3. Drying and burning
• Firebreak construction April Communal
• Control burning End of April Communal
• Land spirit ceremonial (in
the 7 days after burning) April-May Household
• Cleaning May Household
• Shelter May Household
• Fencing May Household
4. Preparing seeds
(rice & swidden crops) May Household
• Planting pre-rice-swidden
crops May Household
• Planting upland rice May Collection

Final Technical Report: EBLU2012-02NMY-Takeuchi 13
• Planting seven-hole rice May Household
• Planting post-rice-swidden
crops May Household
5. Rice establishment June-July Household
6. Weeding
• First weeding June Household
• Second weeding July Collection
• Third weeding August Collection
7. Spirit ceremonial
• Seven-hole rice spirit
ceremonial July Family
• Land spirit ceremonial July Family
• Trees spirit ceremonial July Family
• Protection bad spirit
ceremonial July Household
8. Animals protection July Household
9. Harvesting swiddens July-January Household
10. Harvesting and staking End of Oct - Nov Collection
11. Rice drying November Household
12. Threshing December Household
• Rice spirit ceremonial December Household
13. Transportation December Household / Collection
14. Storage January Household
Source: Yimyam (2006)
Sources of cash incomes and livelihood activities
According to Tambon and district statistics, average annual income of farmers in Tee Cha was 1,500
baht person-1
year-1
. Chilli was the major source of cash income derived from selling chilli (table 4).
Wage labours outside the village have significant contribution to household income. More than half
of total households in the village have gone out to lowland village for Longan picking. Many
households also harvest forest products, e.g., edible mushroom, bee honey, bamboo shoot and
bamboo worm, for selling to outside markets. Cattle and buffaloes are sold out during emergencies.
Almost all of household have own animals. Small animals, pigs and chickens are raised for own
consumption and offered to please spirits and village deities.
So far, cash income earning activities are somewhat supplement to the overall livelihood of the
household. Villagers in Tee Cha are concerning with rice production for subsistence of the farming
household. It was said that surplus production from one year of swidden cycle could adequately
support the family for at least the next 2 years of poor production.
Table 4 Livelihood activities of villagers in Tee Cha Village
Activity Number of Households % of total HH

14 Final Technical Report: EBLU2012-02NMY-Takeuchi
Upland rice 48 100.00
Paddy 5 10.42
Chillies 35 72.92
Fruit trees 9 18.75
Sugar cane 1 2.08
Coffee 8 16.67
Swidden crops 48 100.00
Weaving 48 100.00
Basketry 34 70.83
Fishing 34 70.83
Livestock
• Pigs/ chicken
• Cattle/ buffalo
48
33
100.00
68.75
Forest products collected
• Mushroom
• Honey
• Fruit and vegetable
• Bamboo shoot
• Bamboo worm
48
5
48
48
48
100.00
10.42
100.00
100.00
100.00
Wage labour
• Longan picking
• General wage labour
25
10
52.08
20.83
Small shops 5 10.42
Source: Household interview (2011)
In Thailand, the areas under protected forests in the North range from over 75% of national reserves
and over 95% of total area of national parks and wildlife sanctuaries in the country (Suraswadi et. al.
2004). The Tee Cha is locating in reserved forest in Sop Moei District under control of the conserve
office area 16 (Chiang Mai) of the local administrative control of forest area of Department of
Natural Parks, Wildlife and Plant Conservation. At present, shifting cultivation represents the
dominant agricultural land use covering 45.8% of total area. Natural forests cover 51.5% of total area
in the village.
The year 1985 was the turning point when the forest area in the country was reduced to < 30% of
total land area in the country. In Northern Thailand, even though recent rates of forest loss are
declining, the percentage loss forest cover remains higher than national average (Suraswadi et. al.
2004). The principal proximate causes of deforestation in Northern Thailand are conversion of forest
to agriculture and logging. While conversion of forests to agriculture and logging was basically due
to lowland populations, traditional practice of shifting cultivation of highland population was blamed
for deforestation to justify forest conservation by law enforcement. Importance of diversity and
complexity of land use practiced by the diverse ethnic groups on the highlands is being realized but
much more needs to be done, especially in the face of land use transition to sedentary agriculture, in
order to improve policy process (Kunstadter et. al. 1978 and Yimyam et. al. 2005). Lack of
understanding has led the government to increase the area and extent of protected sites, especially

Final Technical Report: EBLU2012-02NMY-Takeuchi 15
the National Parks and Wildlife Sanctuaries, in Northern Thailand enormously for the past two
decades.
After the National Parks and Wildlife Sanctuaries declared the reserve forest areas above some areas
of shifting cultivation of Tee Cha Village, restriction on existing land use reduced areas available for
shifting cultivation and led to shorter cycle of 4-5 years for rotational shifting cultivation.
Community forests are being transferred to local forestry offices responsible for reforestation.
Since 2002, local authorities have been trying to stop shifting cultivation with law enforcement. This
has created tension between communities and local authorities. To avoid conflicts with
communities, the authorities are currently trying to negotiate with local communities for shorter
rotation, say a maximum of 4-5 years cycle under the restricted areas. Together with infrastructure
improvement, traditional land use system is under a big threat with no direction and support for
such the big change.
3.1.2 Land use-land cover mapping
Land use in Tee Cha village is the rotational shifting cultivation represents the dominant agricultural
land use with an overall area of about 495.6 ha or 45.8% of total area. Area under forests remains
557.2 ha or 51.5% of total area in the village (table 5 and figure 3).
Table 5 Land use in Tee Cha Village
Type of Land Use Area
Ha %
Forests Area 557.17 51.48
• Conservation forest and head water 84.21 7.78
• Community forest 47.19 4.36
• Utility forest 422.30 38.01
• Cemetery forests 3.47 0.32
Village Site 5.50 0.51
Agriculture Lands 519.68 48.01
• Shifting Cultivation 495.6 45.79
Fallow since 2005 70.61 6.52
Fallow since 2006 57.71 5.33
Fallow since 2007 59.78 5.52
Fallow since 2008 104.43 9.65
Fallow since 2009 86.32 7.98
Fallow since 2010 69.94 6.46
Fields cropped in the year 2011 46.81 4.32
• Permanent Fields 16.08 1.49
• Wet Paddy fields and Fish ponds 8.00 0.74
Total Area 1082.35 100.00
Source: Field survey (2011)
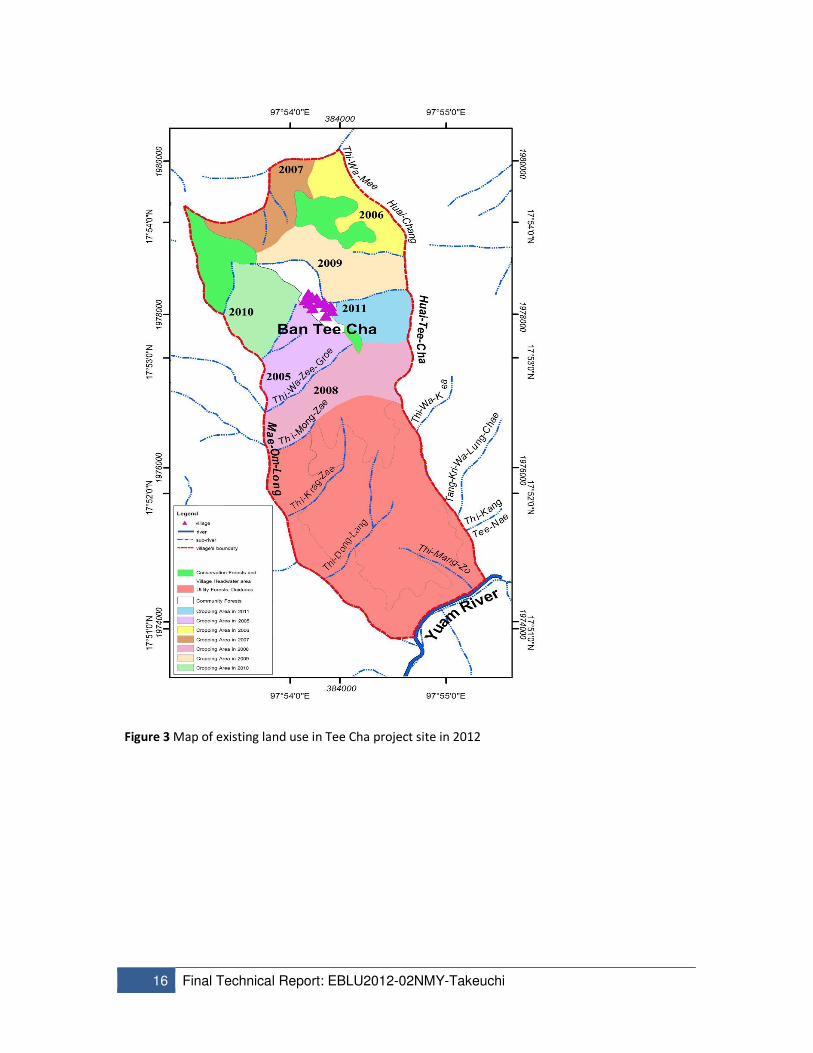
16 Final Technical Report: EBLU2012-02NMY-Takeuchi
Figure 3 Map of existing land use in Tee Cha project site in 2012

Final Technical Report: EBLU2012-02NMY-Takeuchi 17
3.1.3 Biodiversity in different land uses
Farmers in Tee Cha could maintain their shifting cultivation system with high diversity of upland rice
and swidden crop species traditionally managed and conserved over generations (Yimyam 2006).
1. Genetic diversity of upland rice
In Tee Cha farmers are planting both glutinous and non-glutinous rice type. There are some 12
varieties of non-glutinous and 5 varieties of glutinous type. On average, a household would grow 3-5
varieties, depending upon the conditions of the field and their preference.
2. Species diversity of swidden crops
The total number of swidden crops grown in Tee Cha was found to be as high as 56 species. The
average number of species grown by farmers in the whole village remained fairly constant 35
species.
3. Plant species in various land use stages and field types
In Tee Cha Village, farmers are managing Macaranga denticulata to sustain their traditional shifting
cultivation for subsistent production of upland rice and a rich diversity of other swidden crops with
fairly short rotation Rerkasem (2000) observed that species richness in the Macaranga dominant
bush fallow is less than those of forests that were community-managed as well as unmanaged
natural ecosystems (table 6).
Table 6 Number of plant species in various land use stages and field types of Tee Cha Village
Land Use Stags/Field Types Number of Species
Total Useful
Undisturbed Headwater 72 64
Community Forests (>200 years) 64 57
Utility Forests (Dry Dipterocarpus) 54 45
Bush Fallow with Reduced Cycle (7 years) 41 37
Cropping year in shifting cultivation
Mixed Perennial and Fruit trees garden (Mr. Nopporn)
84
49
64
40
Home gardens 85 nd
Total 308 nd
Source: Rerkasem (2000); nd= Not determined

18 Final Technical Report: EBLU2012-02NMY-Takeuchi
3.1.4 Biomass and carbon storage estimation in different land uses
Carbon storage estimation
Figure 4 distributions of plots in conservation forest, community forests and fallow fields for carbon
storage estimation in Tee Cha Village
Final Technical Report: EBLU2012-02NMY-Takeuchi 19
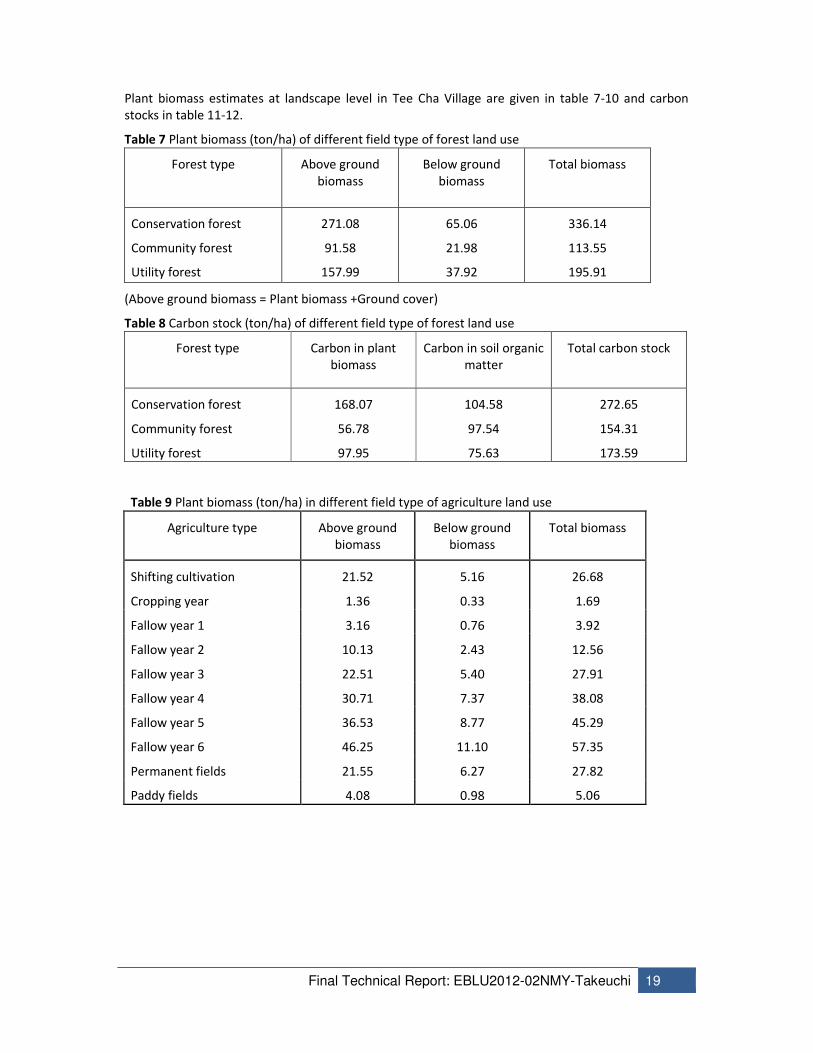
Plant biomass estimates at landscape level in Tee Cha Village are given in table 7-10 and carbon
stocks in table 11-12.
Table 7 Plant biomass (ton/ha) of different field type of forest land use
Forest type Above ground
biomass
Below ground
biomass
Total biomass
Conservation forest
Community forest
Utility forest
271.08
91.58
157.99
65.06
21.98
37.92
336.14
113.55
195.91
(Above ground biomass = Plant biomass +Ground cover)
Table 8 Carbon stock (ton/ha) of different field type of forest land use
Forest type Carbon in plant
biomass
Carbon in soil organic
matter
Total carbon stock
Conservation forest
Community forest
Utility forest
168.07
56.78
97.95
104.58
97.54
75.63
272.65
154.31
173.59
Table 9 Plant biomass (ton/ha) in different field type of agriculture land use
Agriculture type Above ground
biomass
Below ground
biomass
Total biomass
Shifting cultivation 21.52 5.16 26.68
Cropping year 1.36 0.33 1.69
Fallow year 1 3.16 0.76 3.92
Fallow year 2 10.13 2.43 12.56
Fallow year 3 22.51 5.40 27.91
Fallow year 4 30.71 7.37 38.08
Fallow year 5 36.53 8.77 45.29
Fallow year 6 46.25 11.10 57.35
Permanent fields 21.55 6.27 27.82
Paddy fields 4.08 0.98 5.06
20 Final Technical Report: EBLU2012-02NMY-Takeuchi
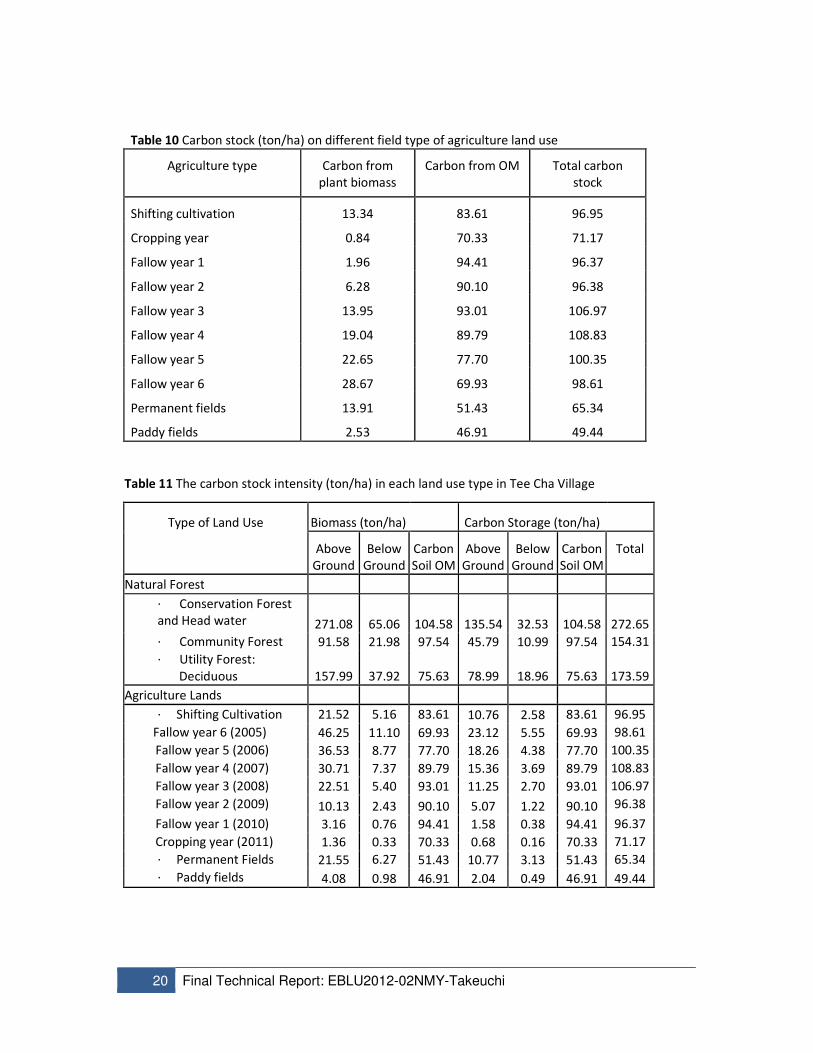
Table 10 Carbon stock (ton/ha) on different field type of agriculture land use
Agriculture type Carbon from
plant biomass
Carbon from OM Total carbon
stock
Shifting cultivation 13.34 83.61 96.95
Cropping year 0.84 70.33 71.17
Fallow year 1 1.96 94.41 96.37
Fallow year 2 6.28 90.10 96.38
Fallow year 3 13.95 93.01 106.97
Fallow year 4 19.04 89.79 108.83
Fallow year 5 22.65 77.70 100.35
Fallow year 6 28.67 69.93 98.61
Permanent fields 13.91 51.43 65.34
Paddy fields 2.53 46.91 49.44
Table 11 The carbon stock intensity (ton/ha) in each land use type in Tee Cha Village
Type of Land Use Biomass (ton/ha) Carbon Storage (ton/ha)
Above
Ground
Below
Ground
Carbon
Soil OM
Above
Ground
Below
Ground
Carbon
Soil OM
Total
Natural Forest
· Conservation Forest
and Head water 271.08 65.06 104.58 135.54 32.53 104.58 272.65
· Community Forest 91.58 21.98 97.54 45.79 10.99 97.54 154.31
· Utility Forest:
Deciduous 157.99 37.92 75.63 78.99 18.96 75.63
173.59
Agriculture Lands
· Shifting Cultivation 21.52 5.16 83.61 10.76 2.58 83.61 96.95
Fallow year 6 (2005) 46.25 11.10 69.93 23.12 5.55 69.93 98.61
Fallow year 5 (2006) 36.53 8.77 77.70 18.26 4.38 77.70 100.35
Fallow year 4 (2007) 30.71 7.37 89.79 15.36 3.69 89.79 108.83
Fallow year 3 (2008) 22.51 5.40 93.01 11.25 2.70 93.01 106.97
Fallow year 2 (2009) 10.13 2.43 90.10 5.07 1.22 90.10 96.38
Fallow year 1 (2010) 3.16 0.76 94.41 1.58 0.38 94.41 96.37
Cropping year (2011) 1.36 0.33 70.33 0.68 0.16 70.33 71.17
· Permanent Fields 21.55 6.27 51.43 10.77 3.13 51.43 65.34
· Paddy fields 4.08 0.98 46.91 2.04 0.49 46.91 49.44

Final Technical Report: EBLU2012-02NMY-Takeuchi 21
Table 12 The total carbon storage in Tee Cha Village
Type of Land Use Total Area Total Carbon Storage (ton)
ha % Above
Ground
Below
Ground
Carbon
Soil OM
Total
Natural Forest 555.7 51.41 47,090.97 11,301.83 45,500.06 103,892.86
· Conservation Forest and Head
water 84.20 7.79 11,412.54 2,739.01 8,805.26 22,956.81 · Community Forest 47.20 4.37 2,161.18 518.68 4,603.65 7,283.52 · Utility Forest: Deciduous 424.30 39.25 33,517.25 8,044.14 32,091.14 73,652.53
Agriculture Lands 519.7 48.08 5,522.46 1,334.21 42,640.48 49497.16
· Shifting Cultivation 495.6 45.85 5,332.66 1,279.84 41,437.17 48,049.66 Fallow year 6 (2005) 70.61 6.53 1,632.77 391.86 4,937.95 6,962.59
Fallow year 5 (2006) 57.71 5.34 1,054.00 252.96 4,484.05 5,791.01 Fallow year 4 (2007) 59.78 5.53 917.92 220.30 5,367.63 6,505.85 Fallow year 3 (2008) 104.43 9.66 1,175.10 282.02 9,713.48 11,170.61 Fallow year 2 (2009) 86.32 7.99 437.21 104.93 7,777.19 8,319.33 Fallow year 1 (2010) 69.94 6.47 110.42 26.50 6602.99 6,739.91 Cropping year (2011) 46.81 4.33 31.89 7.65 3292.04 3,331.58
· Permanent Fields 16.1 1.49 173.48 50.45 828.07 1,052.00 · Paddy fields 8 0.74 16.33 3.92 375.25 395.50
Village Site 5.5 0.51 Total 1,080.9 100.00 52,613.43 12,636.04 88,140.54 153,390.01

22 Final Technical Report: EBLU2012-02NMY-Takeuchi
3.1.5 Land use and carbon dynamics: reference level, carbon stock changes and future
scenarios
The total carbon storage in this village is 153,390 ton. In the national forest areas; the highest total
carbon content was recorded in conservation forest while the difference in carbon density utility and
community forest was negligible. For the agriculture lands; highest total carbon content was found
in shifting cultivation followed by permanent fields and paddy fields (figure 5).
Figure 5 The total carbon content (ton per hectare) of different land use in Tee Cha Village
We predict the length of cultivation cycle in future from current situation of land use demand of
farmers and rate of the increase in population. The shifting cultivation cycle in future scenarios and
reference levels are presented in table 13.
Table 13 The shifting cultivation cycle of farmers in Tee Cha Village
Year Rotational shifting cycle (years)
1990 20
1995 15
2000 10
2005 7
2012 7
2015 4
2020 3
2025 2
2030 2

Final Technical Report: EBLU2012-02NMY-Takeuchi 23
If the farmers change the fallow area to the forest (Reforestation or with REDD+), the changed
scenarios of land cover-land use and carbon stocks are presented in figure 6 and figure 7.
Figure 6 Land use areas (%) of farmers in Tee Cha Village
132.00
133.00
134.00
135.00
136.00
137.00
138.00
139.00
140.00
141.00
142.00
143.00
1990 1995 2000 2005 2012 2015 2020 2025 2030
Carbon storage (ton/ha) of reforestation
Figure 7 Carbon storage change of Tee Cha Village (in period 1990-2030) in case of reforestation
(with REDD+)

24 Final Technical Report: EBLU2012-02NMY-Takeuchi
If farmers change the fallow area to short cycle (from 7 years to 2 years) of the shifting cultivation
system (deforestation or without REDD+) we can estimate the land use change (%) same in figure 8
and carbon storage change show in figure 9
Figure 8 Land use areas (%) of farmers in Tee Cha Village (Deforestation)
Figure 9 Carbon storage change of Tee Cha Village (in period 1990-2030) in case of deforestation
(without REDD+)
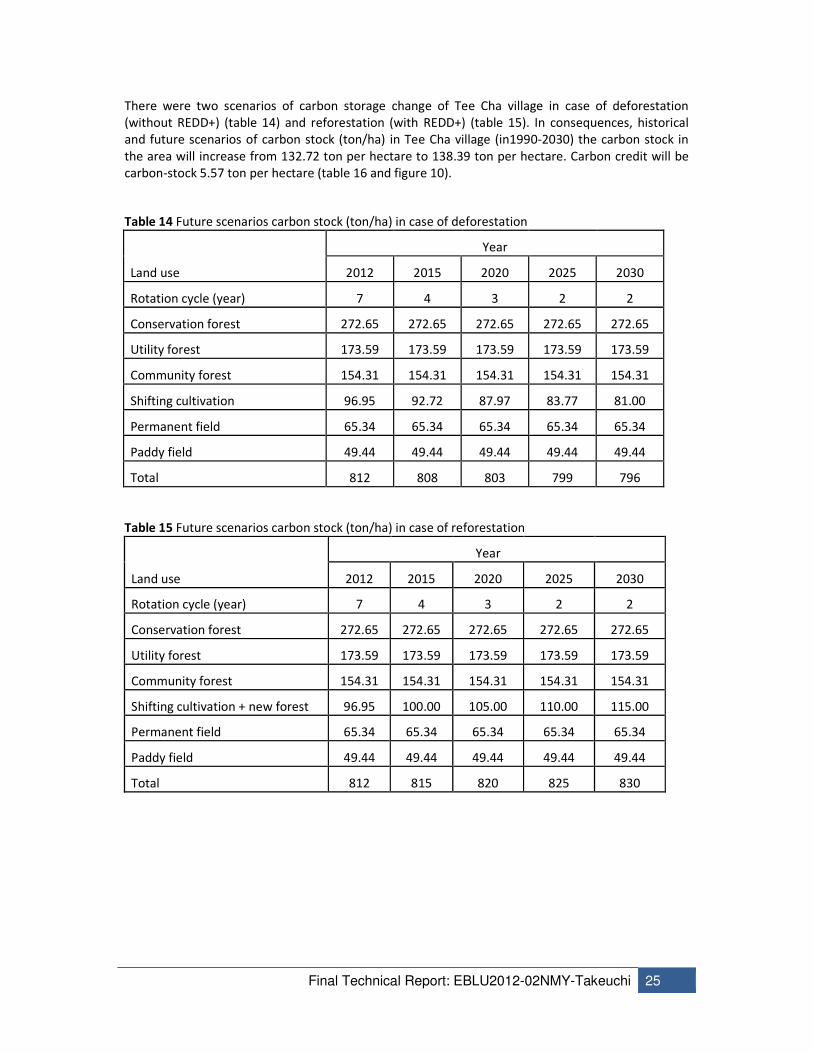
Final Technical Report: EBLU2012-02NMY-Takeuchi 25
There were two scenarios of carbon storage change of Tee Cha village in case of deforestation
(without REDD+) (table 14) and reforestation (with REDD+) (table 15). In consequences, historical
and future scenarios of carbon stock (ton/ha) in Tee Cha village (in1990-2030) the carbon stock in
the area will increase from 132.72 ton per hectare to 138.39 ton per hectare. Carbon credit will be
carbon-stock 5.57 ton per hectare (table 16 and figure 10).
Table 14 Future scenarios carbon stock (ton/ha) in case of deforestation
Year
Land use 2012 2015 2020 2025 2030
Rotation cycle (year) 7 4 3 2 2
Conservation forest 272.65 272.65 272.65 272.65 272.65
Utility forest 173.59 173.59 173.59 173.59 173.59
Community forest 154.31 154.31 154.31 154.31 154.31
Shifting cultivation 96.95 92.72 87.97 83.77 81.00
Permanent field 65.34 65.34 65.34 65.34 65.34
Paddy field 49.44 49.44 49.44 49.44 49.44
Total 812 808 803 799 796
Table 15 Future scenarios carbon stock (ton/ha) in case of reforestation
Year
Land use 2012 2015 2020 2025 2030
Rotation cycle (year) 7 4 3 2 2
Conservation forest 272.65 272.65 272.65 272.65 272.65
Utility forest 173.59 173.59 173.59 173.59 173.59
Community forest 154.31 154.31 154.31 154.31 154.31
Shifting cultivation + new forest 96.95 100.00 105.00 110.00 115.00
Permanent field 65.34 65.34 65.34 65.34 65.34
Paddy field 49.44 49.44 49.44 49.44 49.44
Total 812 815 820 825 830
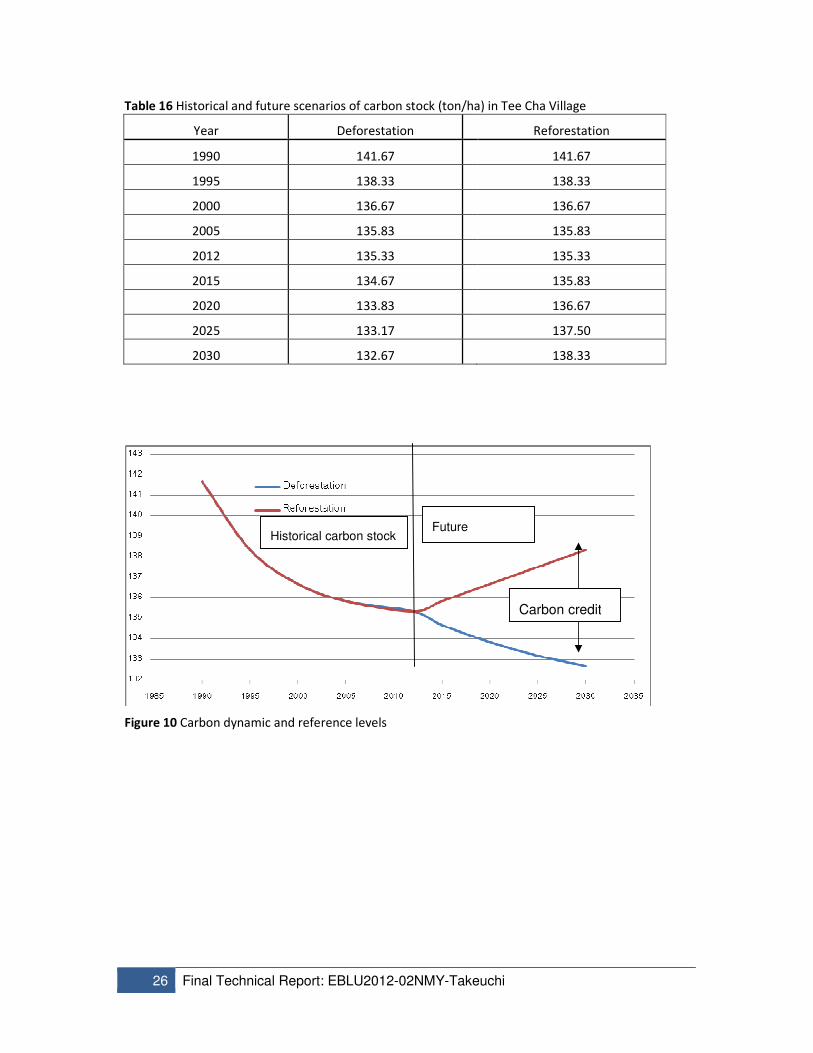
26 Final Technical Report: EBLU2012-02NMY-Takeuchi
Table 16 Historical and future scenarios of carbon stock (ton/ha) in Tee Cha Village
Year Deforestation Reforestation
1990 141.67 141.67
1995 138.33 138.33
2000 136.67 136.67
2005 135.83 135.83
2012 135.33 135.33
2015 134.67 135.83
2020 133.83 136.67
2025 133.17 137.50
2030 132.67 138.33
Figure 10 Carbon dynamic and reference levels
Carbon credit
Historical carbon stock Future
scenarios

Final Technical Report: EBLU2012-02NMY-Takeuchi 27
3.1.6 Economic analysis- opportunity cost/benefit analysis
The costs and benefits under different land uses including upland rice system, paddy rice system and
permanent system for example coffee system show in table 17-19.
Table 17 Costs and benefits of upland rice system
Costs
Items Unit Costs /Unit Costs (THB) Costs (US)
Seed 65 kg 20 THB/kg 1,300 43.33
Land preparation 125 man day 150 THB/ man day 18,750 625.00
Planting 31 man day 150 THB/ man day 4,650 155.00
Weeding 94 man day 150 THB/ man day 14,100 470.00
Total 1,293.33
Benefits
Land used type Yield (ton/ha) Benefits/Unit Benefits(THB) Benefits (US)
7 years cycle 3 15,000 THB 45,000 1,500.00
Table 18 Costs and benefits of paddy rice system
Costs
Items Unit Costs /Unit Costs (THB) Costs (US)
Seed 35 kg 20 THB/kg 700 23.33
Land preparation 10 man day 150 THB/ man day 1,500 50.00
Planting 31 man day 150 THB/ man day 4,650 155.00
Fertilizer 6 sacks 1000THB/sack 6,000 200.00
Weeding 18 man day 150 THB/ man day 2,700 90.00
Total 518.33
Benefits
Land used type Yield (ton/ha) Benefits/Unit Benefits(THB) Benefits (US)
Every year 1.5 15000 THB 22,500 750.00

28 Final Technical Report: EBLU2012-02NMY-Takeuchi
Table 19 Costs and benefits of permanent system: case of coffee system
Costs
year 1-3
Items Unit Costs /Unit Costs (THB) Costs (US)
Seedling 2,500 10 THB/seedling 25,000 833.33
Land preparation 12.5 man day 150 THB/ man day 1,875 62.50
Planting 31 man day 150 THB/ man day 4,650 155.00
Fertilizer 6 sacks 1,000 THB/sack 6,000 200.00
Weeding 18 man day 150 THB/ man day 2,700 90.00
Total 1,340.83
year 4-20
Items Unit Costs /Unit Costs (THB) Costs (US)
Seedling 2,500 10 THB/seedling 25,000 833.33
Land preparation 12.5 man day 150 THB/ man day 1,875 62.50
Planting 31 man day 150 THB/ man day 4,650 155.00
Fertilizer 20 sacks 1,000THB/sack 20,000 666.67
Weeding 18 man day 150 THB/ man day 2,700 90.00
Total 1,807.50
Benefits
Land used type Yield (ton/ha) Benefits/Unit Benefits(THB) Benefits (US)
1 - 3 years 0 0 0 0
4 - 20 years 5 15000 75000 2500.00
The estimation of NPV carbon stock and CO2 stock under different land uses over 20 years is
presented in table 20.
Table 20 The NPV carbon stock and CO2 stock of different land use types
Type of land
use Total NPV (US$)
NPV
(US$/ha/year)
Carbon stocks
(ton/ha)
CO2 stocks
(ton/ha)
Upland rice 785.35 39.27 97 355.99
Paddy rice 4401.73 220.09 50 183.5
Coffee 7161.39 358.07 65 238.55
Forest 28.50 1.43 273 1001.91

Final Technical Report: EBLU2012-02NMY-Takeuchi 29
Net present value from different land uses
Among four main land uses in study site, it was found that coffee plantation had the highest NPV
(358.07 US/ha/year), followed by paddy rice (220.09 US/ha/year) and upland rice (39.27 US/ha/year)
(figure 11). The forest had the lowest NPV at 16 US$ /ha/year.
Figure 11 Net present values from different land use
Carbon stock under different land use
In terms of carbon stock, forests had the highest carbon stock of 273 ton/ha, followed by upland rice
(97 ton/ha) and coffee (65 ton/ha). The paddy rice had the lowest carbon stock at 50 ton/ha.
Calculation of carbon stock losses from converting forest to agriculture land use can show in Figure
12
Figure 12 Carbon stock losses from converting forest to agriculture land use

30 Final Technical Report: EBLU2012-02NMY-Takeuchi
Profit gain from converting forest to agricultural land
Conversion from forest to coffee plantation had the highest profit (NPV/ha) at 356.64 US/ha,
followed by changing forest to paddy rice (NPV 218.66 US/ha) and conversion of forest to rice (NPV
37.84 US/ha) (Figure 13).
Figure 13 Profit gain from changing forest to agriculture land use
Opportunity cost of different land use change
The study assessed the opportunity cost of three types of land use changes: 1) conversion from
forest to coffee plantation; 2) forest to paddy rice; and 3) forest to upland rice). The results show the
conversion from forest to coffee plantation had the highest opportunity cost (0.47 US/ton CO2),
followed by changing from forest to paddy rice (0.27 US/ton CO2). The conversion from forest to
upland rice had the lowest opportunity cost at 0.06 US/ton CO2 (Figure 14).
Figure 14 Opportunity cost of different agriculture land use
3.1.7 Community based MRV process
The specific objective of community-based MRV is to increase awareness of the impacts of climate
change due to carbon emissions from land use change at village level and encourage villagers to
manage, monitor and verify of carbon storage in the community. The study emphasized on the
Final Technical Report: EBLU2012-02NMY-Takeuchi 31
reduction of carbon emissions and forest degradation by enhancing social fencing, increasing forest
cover areas and applying of good SLM agricultural practices.
3.2 LAOS
3.2.1 General background of project site in Laos
The project site-Laksip Village, Luang Prabang Province, is a mountainous Khmu village in northern
part of Lao PDR. The village is located at 10 kilometres from Luang Prabang along the national road
No. 13 linking the northern provinces of the Lao PDR to Vientiane. The village (102° 08’ 38” - 102° 11’
33” E latitude and 19° 47’ 42” - 19° 52’ 00” N longitude) comprises 95 households, with a total of
population of 450 persons. Three main ethnic groups currently live in Laksip Village: 89% for Khmu,
9.5% for Laolum, and 1.5% for Hmong. The majority of family heads graduated only from primary
school. Few graduated from the secondary school. Shifting cultivation remains the livelihood for
majority of villagers. This area has a tropical monsoon climate with April to October being hot-wet
and November to March cool-dry seasons. Settlement of Laksip Village began in 1962 by Pho Thao
Phuy from Oudomxay, and two more families following him. The population increased slowly
between 1962 and 1975 with the arrival of new families fleeing the war in the northern provinces of
Laos, temporally resettled in the village and then moved out from the village. In 1997, after
Huaynokpit Village merged with Laksip Village based on the agreement of the district committee
dated 27 April 1999.
Currently, Laksip Village covers an area of 1,746 ha largely allocated for agriculture and forests.
Agricultural lands comprise cropped fields and 1-4 years’ fallows under short rotational shifting
cultivation in narrow valleys and catchments. Agriculture covers 240 ha or 14 % of the total village
area. Forests consist of dense forest (conservation, sacred, cemetery forests), open forest (degraded
forests with Dipterocarpus sp.), teak plantations and > 5 year old shifting cultivation fallows. Forests
cover 1,496 ha or 85.6 % of the total village area. Forest land can be subdivided in 3 sub groups:
conservation forest, protection forest, and production forest. Most of conservation forest is located
at high mountains in the north and southwest part of the village. Teak plantations have expanded
from less than 20 ha in 1995 to 477 ha in 2011. Most teak plantations are developed through
intercropping of teak seedlings with annual crops in the shifting cultivation. The common practice is
to intercrop teak seedlings with rice in the first year, maize in the second year and job’s tear in the
third year. The plot is left to teak plantation alone after the fourth year. Due to allocation of the old
fallows for forest conservation and conversion of short fallows for teak plantation, land available for
cropping has been significantly reduced. Consequently, fallow period has to be shortened from more
than 8 years in 1970’ to about 2 years at present.
In spite of transition to a commercial production of teak, local farmers continue to conserve crop
diversity. However, NTFPs have been reduced as a result of conversion of fallow land to teak
plantation. Nevertheless, the Laksip Village is still home to more than 900 plant species wild plant
species.
The main crops include upland rice for subsistence as well as maize, while cash income comes from
vegetable production, collecting forest products (e.g. job’s tear, fuel wood, mushrooms, and
bamboo shoots), livestock farming, and perennial tree production. Some villagers are now working
in off-farm activities such as government officers, traders and handicraftsmen in Luang Prabang City
nearby.

32 Final Technical Report: EBLU2012-02NMY-Takeuchi
3.2.2 Land use and land cover mapping
In Laksip Village, the natural forest covers about 1,019 ha or 58% of total land area, including dense
forest comprising of conservation and sacred forest, open forest and forest re-growth in old shifting
cultivation fields. The remaining 719 ha or 41% of total land is agricultural land including teak
plantation, rotational fallow lands and annual crop fields (Table 21 and Figure 15)
Table 21 Land use in Lak Sip village in 2011
Type of Land Use Area
ha %
Natural Forests 1019 58.33
• Dense forest (Conservation forest) 476 27.25
• Open forest (Protection forest) 12 0.69
• Old fallow (Abandoned shifting cultivation ) 531 30.40
Agricultural Land 719 41.11
Plantation forest (Teak) 477 27.30
Rotated fallow land for shifting cultivation 195 11.15
• Annual field crops 46 2.60
• Fish pond 1 0.06
Residential area 9 0.56
Total Area 1747 100.00

Final Technical Report: EBLU2012-02NMY-Takeuchi 33
Figure 15 Land use map of Laksip Village in 2011
34 Final Technical Report: EBLU2012-02NMY-Takeuchi
3.2.3 Plant biodiversity under the different land uses
Plant species in dense forest
Wood species
There are 29 major woody species. Three species are highly valuable timber: Dalbergia Lanceoraria,
Afzelia Xylocarpa and Pterocarpus macrocarpus. The common woody species are Bischoffia Javanica.
Duabanga soneratioides, Chakrasia. Tabularis, Diospyros eugenii, Mangifera sp., Amorphophallus
paenonufolius, livistona speciosa, afzelia Xylocarpa, Dalbergia lanceoraria, Albizia procera,
Dipterocarpus intricatius, tretameles. Nudiflora, Ficus drupacea, Protium Serrotium. Symplocus
racemosa, Erutrina fusca, Astonia rostrata, ficus spp, Ardisia evanymifolia, Dipterocarpus intricatus,
Ailanthus trifisa, Paramichelia baillonni,Spondrias. Lakonensis, Elacocarpus robustus, Cassia
garrettiana, pometia eximia, Eugenia fluviatilis, Banlox albidium and Largerstroemia villosa.
Non timber forest products (NTFP) species
Edible plants
There are 17 species of plants whose fruits, stems and young leaves are used as food and spices by
local farmers: Spathodea stipulate, Amorphophallus campanulatus, Celatrus multiflorus, Paper
boehmeriafolium, Castanopsis macrostachya, Baccaurea ramiflora, Flacourtia sepiaria, Livistona
cochinchinensis, Mangifera pinnata, Bignonia indica, Averrhoa pentandra, Amalocalyx burmanicus,
Arenga westerhoutii (Palmae), Acacia pennata, Melientha acuminata, Rhus semialata, Ficus
semicordata.
Herbs or medicinal plants
Five species are used in local health care: Dracaena chochinchinensis, Zingiberaceae, Tinospora
tuberculata, Amomum microcapum, Smilax hookeri.
Fibers
Bambusa tulda, Oxytenanthera parviflora, Dendrocalamus spp, Calamus poilanei, Calamus henyanus,
Daemononus jenkinsiana are the fibre species occurring in Laksip village.
Plant species in open forest
The common species in open forests are: Shorea siamensis, Mangifera spp, Dimocarpus longan,
Protium serratum, Macaranga denticulate. Alstonia rostrata, Cratoxylum formosum, Leguminosae -
Caesalpinioideae, Pistachia aleosa, Dalbergia lanceolaria, and some natural grasses like Imperata
cyllindrica, Vetiveria species and Celastrus paniculatus.
Plant species under teak plantation
There are very few plant species under teak plantation. Mimosa invisa, chromolena odorata and
Lygopodium are the weeds common in teak plantations
Plant species in fallow land
Fallow land is very rich in plant diversity, especially; it is very rich in weed species.
Wood and shrub species
There are more than 73 species of woody species in fallow land including Acacia concinna, Omosia
cambodiana, Lepisanthes rubiginosa, Protium serratum, Antidesma acidum, Broussonetia papyrifera,
Final Technical Report: EBLU2012-02NMY-Takeuchi 35
Cassia fistula, Ardisia spp, Ficus hispida, Zizyphus cambodiana, Bauhinia monandra, Harrisonia
perforate, Millettia pubinervis, Boehmera nivea, Apurosa octandra, Albizia odoratissima, Flacourtia
jangomus, Wikstroemia meyeniana, Celastrus paniculatus, Quigualis indica, Polyathia corticosa,
Gardenia philastrei, Stixis flavescens, Phyllostachys sp, Milientha suavis, Albizia procera, Spodias
pinnata, Zizyphus oenoplia, Ixora stricta, Fluggea microcarpa, Bambusa arundinacea, Xerospermum
laoticum, Oroxylum indicum, Caesalpinia decapetala. Terminalia belerica, Duabenga grandiflora,
Euonymus similis, Crateva maqua, Markhamia stipulate, Femandoa adenophylla Lagerstreomia
venusta, Bambusa tulda, Zygostelma bentham, Bauhinia malabanica, trevisia lateopera, Holarrhena
pubescens, Caesalpinia enneaphylla, Baccaurea ramiflora, Quescus kingiane, Largerstreomia
macrocarpus, Parane phelium, Grewia abutifolia, Apostia wallachii, Stereospermum neuranthum,
Zanthoxylum avicennae, Eriolaena candollei, Siegesbeckia orientalis, Helicteres elongate, Embelia
sessiliflora, Celosia argentea, Argyreia pierreana, Catunaregam spinosa.
Weeds, herbs and lianas
It was found that there are more than 72 species of weeds and 28 species of lianas in the fallow
land, out of which 13 species are classified as edible plants for local farmers such as Lygopodium
flexuosum, Passiflora foetida, Amalocalyx microlobus, Limacia triandra, Amaranthus xaudasus,
Amorphophallus paeonifolius, Spilanthes paniculata, Oxalis corniculata, Momordica charantia,
Breynia glauca, Dioscorea glabra, Cyclea barbata, Calamus viminalis, and 5 species are used as
medicine plants such as Vernonia cinerea, Ficus hispida, Paederia pilifera, Senna tora, Blumea
balsamifera.
Major herbs, lianas and weeds found in fallow land are: Chomolaena odorata. Mimosa invisa,
Imperata cylindrical, Lygopodium flexuosum, Saccharum spontaneum, Microstegium ciliatum,
Passiflora foetida, Ageratum conyzoides, Crassocephalum crepidioides, Amalocalyx microlobus.
Conyza sumatrensis Cyperus cyperoides, Vernonia cinerea, Piper sylvaticum, Mollugo pentaphylla,
Diphyllarium mekongense, Tiliacora triandra, Cissus adnata, Commelina benghalensis, Solanum
torvum, Bidens pilosa, Mucuna pruriens, Thunbergia grandiflora, Smilax ovalifolia, Amaranthus
viridis, Euphorbia hirta, Amischotolype glabrata, Amorphophallus paeoniifolius, Costus speciosus,
Pennisetum purpureum, Lepistemon binectariferum, Cyanotis cristata, Spilanthes paniculata, Scleria
terrestris, Pueraria phaseoloides, Paederia pilifera, Momordica charantia, Ichnocarpus frutescens,
Momordica subangulata, Calamus viminalis, Clausena excavate, Dioscorea glabra, Pueraria lobata,
Phyllanthus amarus, Eleusine indica, Cyclea barbata, Angiopteris evecta, Thelypteris subelata,
Selaginella helferi, Microlepia speluncae, Adiantum zollinger, Tectaria impressa, Pteris vittala,
Stereospermum colais, Tectaria sp, Lygodium polystachyum, Thelypteris ciliate, Cyperus iria, Cyperus
laxus, Echinochloa crusgalli, Panicum cambogiense, Setaria palmifolia, Panicum notatum,
Oplismenus compositus, Panicum sarmentosum, Echinochloa colona, Paspalum urvillei, Dioscorea
japonica, Digitaria thyrsoidea, Blumea mollis, Digitaria radicosa, Axonopus compressus, Mallotus
barbatus, Achyranthes aspera, Panicum brevifolium, Jasminum nervosum, Knoxia mollis, Dioscorea
bulbifera, Dioscorea alata, Aristolochia tagala, Mukia maderaspatana, Stephania crebra, Dalbergia
foliacea, Trevesia palmate, Lysimachia fortunei, Colona floribunda, Blumea balsamifera, Distemon
indica, Abelmoschus moschatus, Torenia cordifolia
3.2.4 Biomass and carbon storage estimations in different land uses
For carbon stock measurement, land use-land cover in Laksip Village was classified as:
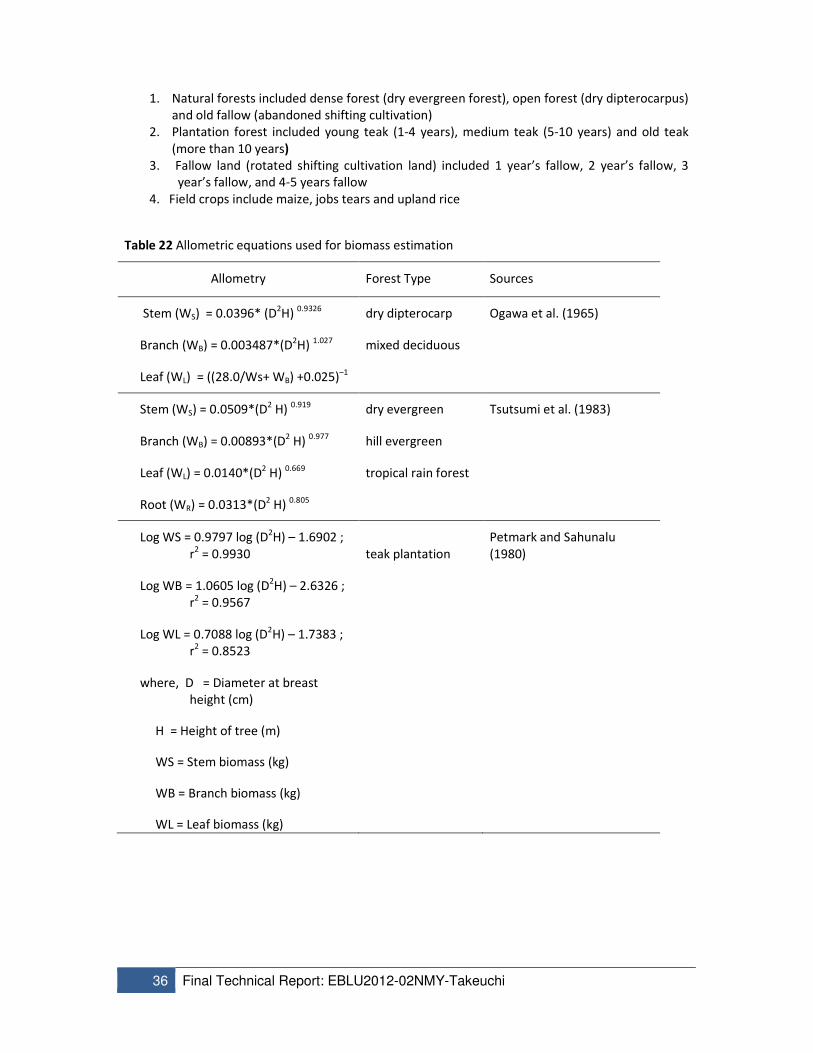
36 Final Technical Report: EBLU2012-02NMY-Takeuchi
1. Natural forests included dense forest (dry evergreen forest), open forest (dry dipterocarpus)
and old fallow (abandoned shifting cultivation)
2. Plantation forest included young teak (1-4 years), medium teak (5-10 years) and old teak
(more than 10 years)
3. Fallow land (rotated shifting cultivation land) included 1 year’s fallow, 2 year’s fallow, 3
year’s fallow, and 4-5 years fallow
4. Field crops include maize, jobs tears and upland rice
Table 22 Allometric equations used for biomass estimation
Allometry Forest Type Sources
Stem (WS) = 0.0396* (D2H)
0.9326 dry dipterocarp Ogawa et al. (1965)
Branch (WB) = 0.003487*(D2H) 1.027 mixed deciduous
Leaf (WL) = ((28.0/Ws+ WB) +0.025)–1
Stem (WS) = 0.0509*(D2 H) 0.919 dry evergreen Tsutsumi et al. (1983)
Branch (WB) = 0.00893*(D2 H)
0.977 hill evergreen
Leaf (WL) = 0.0140*(D2 H) 0.669 tropical rain forest
Root (WR) = 0.0313*(D2 H) 0.805
Log WS = 0.9797 log (D2H) – 1.6902 ;
r2 = 0.9930 teak plantation
Petmark and Sahunalu
(1980)
Log WB = 1.0605 log (D2H) – 2.6326 ;
r2 = 0.9567
Log WL = 0.7088 log (D2H) – 1.7383 ;
r2 = 0.8523
where, D = Diameter at breast
height (cm)
H = Height of tree (m)
WS = Stem biomass (kg)
WB = Branch biomass (kg)
WL = Leaf biomass (kg)

Final Technical Report: EBLU2012-02NMY-Takeuchi 37
Allometry Forest Type Sources
Rainfall (mm/yr)
W = 0.139 D2.32 Dry (<1500) (Brown, 1997)
W = 0.118 D2.53 Moist (1500-4000) (Brown, 1997)
W = 0.049 D2H (Brown et al., 1995)
W= 0.037 D1.89H Wet (>4000) (Brown, 1997)
W = Tree Biomass(kg/tree)
D=dbh(cm)
W= 0.0303 D2.1345;R2=0.9887 Banana (Arifin, 2001)
W = 0.2811 D2.0635;R2=0.9455 Coffee (Arifin, 2001)
W = 0.1594 D1.1517 Tea (Camelia sinensis) (Hariyadi, 2005)
Wt = 0.22187 (D)2.2749 Bamboo(Thyrsostachys siamensis) Suwannapinunt (1983)
Wt = 0.17446 (D2)1.0437 Bamboo(Cephalostachyum pergracile) Kutintara et al. (1995)
Stem (WS) = 89.3059(D2 H) 0.66513 tree higher than 1.3 m. Manop (1982)
Branch (WB) = 15.3063(D2 H)
0.58255 and the diameter at breath <4.5cm.
Leaf (WL) = 19.399(D2 H) 0.44363
Root (WR) = 0.0313*(D2 H) 0.805
Dry biomass under natural and plantation forests
The highest biomass was found in dense forest, with 339 ton per hectare of aboveground and 41
tons per hectare of belowground biomass.
The open forest contained a total biomass of 121 tons per hectare, of which 98 tons per hectare was
from above ground (stems, branches, leaves, ground cover and litter) and 23 tons per hectare from
below ground (roots). Total biomass found in old fallow forest is 41 tons per hectare, of which 34
tons was from above ground and 7 ton per hectare was from below ground, presents in table 23.

38 Final Technical Report: EBLU2012-02NMY-Takeuchi
Among teak plantation forest, the old teak (>10 years) contained the highest total dry biomass of
102 tons per hectare, of which 93 ton per hectare was from above ground and 9 tons per hectare
was from below ground followed by the medium teak (6-10 year old) which had a total biomass of
53 tons per hectare, of which 47 tons was from above ground and 5 tons from below ground. The
young teak (1-5 year old) contained the lowest biomass of 12 tons per hectare only, of which 10.40
tons (stems, branches, leaves) was from above ground and 1.95 tons was from below ground
(roots).
Table23 Dry biomass, ton per hectare under different forest types
Forest types Above ground (ton/ha) Below ground (ton/ha) Total biomass (ton/ha)
Natural forest 157.00 40.89 194.55
Dense forest 339.00 81.00 420.00
Open forest 98.00 23.50 121.50
Old fallow 34.00 8.16 42.16
Plantation forest 151.68 36.40 188.08
Young teak 10.40 2.50 12.90
Medium teak 47.52 11.40 58.92
Old teak 93.76 22.50 116.26
Carbon content under different forest types
The highest total carbon content was found in dense forest. The amount of carbon stock is followed
by open forest and old fallow (abandoned shifting cultivation) as per details given in Table 24.
Table 24 Carbon stock ton per hectare under natural forest
Land use types Biomass (ton/ha) Carbon contents (ton/ha) Total carbon
content
Above
ground
Below
ground
Above
ground
Below
ground
Soil
carbon
(ton/ha)
Natural forests 157 37.55 78.50 18.78 78.15 175.43
Dense forest 339 81 169.5 40.5 98.25 308.25
Open forest 98 23.50 49 11.75 66.95 127.70
Old fallow 34 8.16 17 4.08 69.25 90.33

Final Technical Report: EBLU2012-02NMY-Takeuchi 39
Carbon stock under plantation forest (teak)
Total carbon stock under teak plantation was 273.19 tons per hectare. Among forest plantation , the
old teak (>10 years) produced the highest total carbon content of 108 tons per hectare of which 46.8
tons were from above ground (stems, branches, leaves, ground cover and litter)and 11.25 tons were
from below ground (roots) and 50.75 tons were from soils. The medium teak (6-10 years old)
produced carbon content, total carbon was 89.76 tons per hectare of which 23.76 tons was from
above ground and 5.7 tons from below ground (roots) and 60.3 tons were from soil. The young teak
(1-5 years old) produced total carbon content of 74.55 tons per hectare of which 5.20 tons was from
above ground (stems, branches, leaves, ground cover and litter) and 68.1 tons was from below
ground (roots) and 29.37 tons were from soil. (Table 25)
Table 25 Carbon stock ton per hectare under plantation forest (teak)
Land use
types
Biomass (ton/ha) Carbon contents (ton/ha) Total carbon content
Above
ground
Below
ground
Above
ground
Below
ground
Soil carbon (ton/ha)
Plantation
forest 50.56 12.13 25.28 6.07 59.72 91.05
Young teak 10.40 2.50 5.20 1.25 68.10 74.55
Medium
teak 47.52 11.40 23.76 5.70 60.30 89.76
Old teak 93.76 22.50 46.88 11.25 50.75 108.8
Dry biomass under fallow land
The highest dry biomass obtained in 4-5 year’s fallow, with an amount of biomass of 73.34 tons per
hectare, followed by 3 year’s and 2 year’s fallow which produced the amount of dry biomass of
47.93 and 18.42 tons per hectare respectively. The lowest biomass was found in the 1 year’s fallow
(7.29 tons per hectare), presents in table 26.
Table26 Dry biomass, ton per hectare under different fallow types
Fallow types Above ground biomass
(ton/ha)
Below ground biomass
(ton/ha)
Total biomass
(ton/ha)
1 year’s fallow 5.88 1.41 7.29
2 year’s fallow 14.86 3.56 18.42
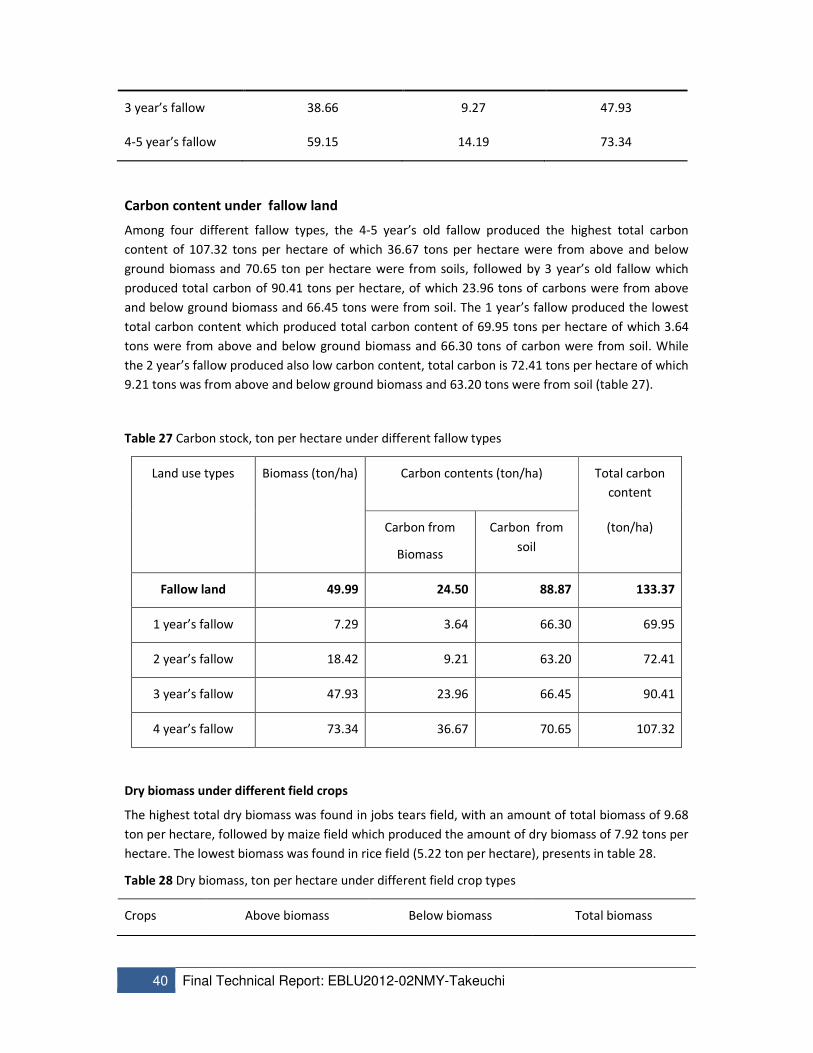
40 Final Technical Report: EBLU2012-02NMY-Takeuchi
3 year’s fallow 38.66 9.27 47.93
4-5 year’s fallow 59.15 14.19 73.34
Carbon content under fallow land
Among four different fallow types, the 4-5 year’s old fallow produced the highest total carbon
content of 107.32 tons per hectare of which 36.67 tons per hectare were from above and below
ground biomass and 70.65 ton per hectare were from soils, followed by 3 year’s old fallow which
produced total carbon of 90.41 tons per hectare, of which 23.96 tons of carbons were from above
and below ground biomass and 66.45 tons were from soil. The 1 year’s fallow produced the lowest
total carbon content which produced total carbon content of 69.95 tons per hectare of which 3.64
tons were from above and below ground biomass and 66.30 tons of carbon were from soil. While
the 2 year’s fallow produced also low carbon content, total carbon is 72.41 tons per hectare of which
9.21 tons was from above and below ground biomass and 63.20 tons were from soil (table 27).
Table 27 Carbon stock, ton per hectare under different fallow types
Land use types Biomass (ton/ha) Carbon contents (ton/ha) Total carbon
content
Carbon from
Biomass
Carbon from
soil
(ton/ha)
Fallow land 49.99 24.50 88.87 133.37
1 year’s fallow 7.29 3.64 66.30 69.95
2 year’s fallow 18.42 9.21 63.20 72.41
3 year’s fallow 47.93 23.96 66.45 90.41
4 year’s fallow 73.34 36.67 70.65 107.32
Dry biomass under different field crops
The highest total dry biomass was found in jobs tears field, with an amount of total biomass of 9.68
ton per hectare, followed by maize field which produced the amount of dry biomass of 7.92 tons per
hectare. The lowest biomass was found in rice field (5.22 ton per hectare), presents in table 28.
Table 28 Dry biomass, ton per hectare under different field crop types
Crops Above biomass Below biomass Total biomass

Final Technical Report: EBLU2012-02NMY-Takeuchi 41
Maize 6.39 1.53 7.92
Job's tears 7.81 1.87 9.68
Rice 4.21 1.01 5.22
Carbon content under different field crops
Among three different field crop types, the jobs tears field produced the highest total carbon
content of 70.64 tons per hectare of which 4.84 ton per hectare was from above and below ground
biomass and 65.80 tons per hectare from soil. While rice and maize produced as the nearly same
amount of total carbon content. The amounts were 64.43 tons and 65.76 tons for rice and maize
respectively in table 29.
Table 29 Carbon stock, ton per hectare under different field crop types
Land use types Biomass (ton/ha) Carbon contents(ton/ha) Total carbon
content
Carbon from
biomass
Carbon from
soil
(ton/ha)
Field crops 7.61 3.81 63.14 66.94
Maize 7.92 3.96 61.80 65.76
Jobs steers 9.68 4.84 65.80 70.64
Rice 5.22 2.61 61.82 64.43
Table 30 Summary of carbon storage (Ton per hectare) under different land use types
Land use types Biomass (ton/ha) Carbon storage (ton/ha) Total carbon
storage
(ton/ha) Above
ground
Below
ground
Above
ground
Below
ground
Soil
carbon
Natural forests 157 37.55 78.50 18.78 78.15 175.43
Dense forest 339 81 169.5 40.5 98.25 308.25
Open forest 98 23.50 49 11.75 66.95 127.70
Old fallow forest 34 8.16 17 4.08 69.25 90.33

42 Final Technical Report: EBLU2012-02NMY-Takeuchi
Plantation forest 50.56 12.13 25.16 6.07 59.72 91.06
Young teak 10.40 2.50 5.20 1.25 68.10 74.55
Medium teak 47.52 11.40 23.76 5.70 60.30 89.76
Old teak 93.76 22.50 46.88 11.25 50.75 108.8
Fallow land 118.55 28.43 59.27 14.22 266.60 340.10
1 year’s fallow 5.88 1.41 2.94 0.72 66.30 69.95
2 year’s fallow 14.86 3.56 7.43 1.78 63.20 72.41
3 year’s fallow 38.66 9.27 19.33 4.63 66.45 90.41
4 year’s fallow 59.15 14.19 29.57 7.09 70.65 107.32
Field crops 18.41 4.41 9.20 2.20 189.42 200.83
Maize 6.39 1.53 3.19 0.76 61.80 65.76
Job's tears 7.81 1.87 3.90 0.95 65.80 70.64
Rice 4.21 1.01 2.10 0.50 61.82 64.43
Total Carbon storage at village level
Total carbon storage in Laksip Village was 255,650 tons out of which natural forest where the area
was 1,019 ha or occupies 58.68% of total village land use areas produced highest carbon storage of
196,224 tons, followed by plantation forest (teak) where the areas was 477 ha or occupies 27.46 %
of total village land use areas produced 41,004 tons. The fallow land where the areas was 195 ha or
occupies 11.22% of total village land use areas produced 15,377 tons and field crops where the areas
was 46 ha or occupies 2.64% of total village land use areas produced 3,036 tons in table 31.
Table 31 Total carbon storage in Laksip village: for better presentation: columns should be 1. Area of
a given land use (ha), 2- Carbon density (t/ha) – aboveground, belowground biomass and soil organic
carbon 3. Total carbon density = aboveground +belowground biomass+ soil organic carbon 4. Total
carbon in a given land use = value in column 1 x value in carbon3
Land use types Area Carbon storage (ton) Total carbon
at. village level
(ton)
ha % Above
ground
Below
ground
Soil
carbon
Natural forests 1,019 58.68 90,297 21,585 84,342 196,224.00

Final Technical Report: EBLU2012-02NMY-Takeuchi 43
Dense forest 476.00 80,682 19,278 46,767 14,6727
Open forest 12.00 588 141 803 1,532
Old fallow forest 531.00 9027 2,166 36,771 47,965
Plantation forest 477.00 27.46 9,112 2,187 29,712 41,011
Young teak 238.00 1,237 297 16,207 17,743
Medium teak 144.00 3,421 820 8,683 12,925
Old teak 95.00 4,453 1068 4,821 10,343
Fallow land 195.00 11.22 2,095.33 502.97 12,779.55 15,377.85
1 year’s fallow 58.00 170.52 41.76 3,845.4 4,057.68
2 year’s fallow 78.00 579.54 138.84 4,929.6 5,647.98
3 year’s fallow 39.00 753.87 180.57 2,591.55 3,525.99
4 year’s fallow 20.00 591.4 141.8 1413 2146.2
Field crops 46.00 2.64 123.32 29.58 2,883.36 30,36.26
Maize 8.00 25.52 6.08 494.40 526.00
Job's tears 10.00 39.00 9.50 658.00 706.00
Rice 28.00 58.80 14.00 1,730.96 1,803.00
Total 1737.00 100 255,650.90
3.2.5 Land use and carbon dynamics: reference level, carbon stock changes and future
scenarios
The highest total carbon content were found in dense forest , with an amount of carbon stock of 308
tons per hectare, followed by open forest and abandoned shifting cultivation (old fallow). The open
forest produced total carbon content of 127 tons per hectare. Total carbon content obtained from
old fallow forest was 90 tons per hectare.
Among teak plantation, the old teak (>10 years) produced the highest total carbon content of 108
tons per hectare. The medium teak (6-10 year old) produced nearly 89 tons per hectare for carbon
content. The young teak (1-5 year old) produced total carbon content of 74 tons per hectare.
Among four different fallow types, the 4-5 year’s old fallow produced the highest total carbon
content of 107 tons per hectare, followed by 3 year’s old fallow which produced total carbon of 90

44 Final Technical Report: EBLU2012-02NMY-Takeuchi
tons per hectare. The 1 year’s fallow produced the lowest total carbon content which produced total
carbon content of 30 tons per hectare. While the 2 year’s fallow produced also low carbon content,
total carbon was 69 ton per hectare.
Among three different field crop types, the jobs tears field produced the highest total carbon
content of 70 tons per hectare. While rice and maize produced as the nearly same amount of total
carbon content. The amounts were 64 tons and 65 tons for rice and maize respectively (table32)
Table 32 C-stock (ton/ha) of different land use types
Land uses C-stock (T/ha)
Dense forest 308.25
Open forest 127.70
Old fallow 90.33
Old teak 108.80
Medium teak 89.75
Young teak 74.55
Fallow 4 years 107.32
Fallow 3 years 90.41
Fallow 2 years 72.41
Fallow 1 year 69.95
Maize field 65.76
Jobs tear field 70.64
Rice field 64.43
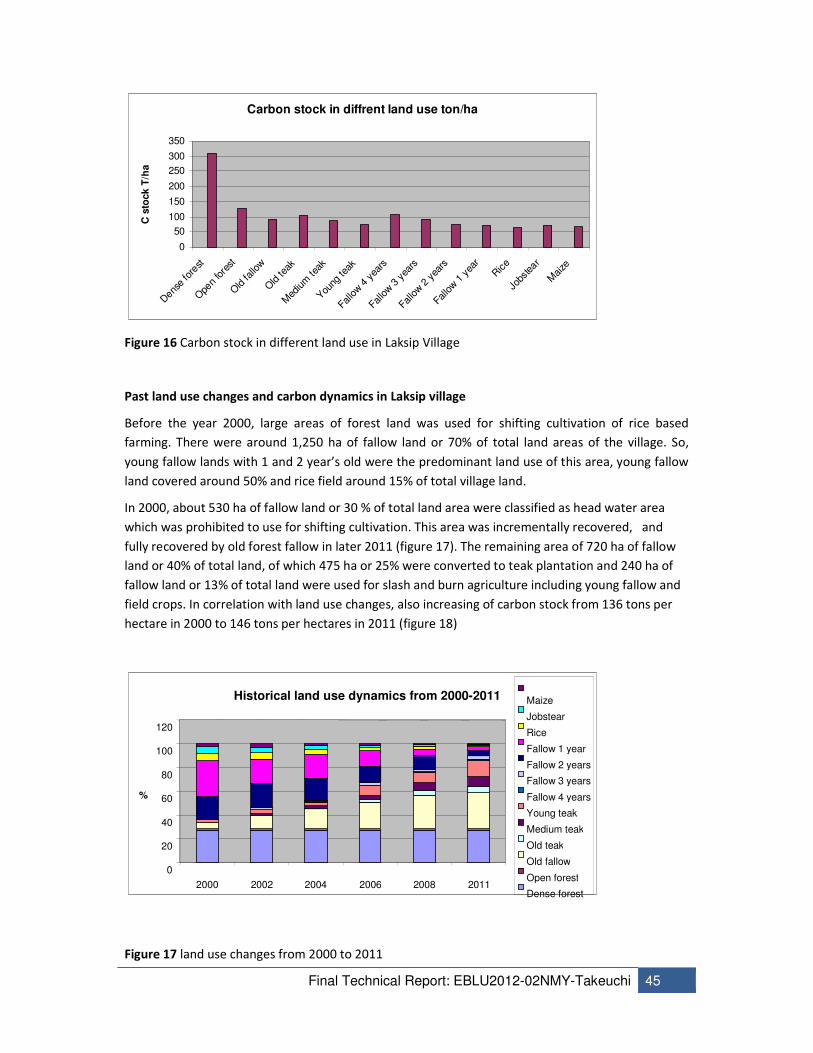
Final Technical Report: EBLU2012-02NMY-Takeuchi 45
Carbon stock in diffrent land use ton/ha
0
50
100
150
200
250
300
350
Dens
e fore
st
Ope
n fo
rest
Old fa
llow
Old te
ak
Med
ium
teak
You
ng te
ak
Fallow 4 y
ears
Fallow 3 y
ears
Fallow 2 y
ears
Fallow 1 y
ear
Rice
Jobs
tear
Maize
C s
tock T
/ha
Figure 16 Carbon stock in different land use in Laksip Village
Past land use changes and carbon dynamics in Laksip village
Before the year 2000, large areas of forest land was used for shifting cultivation of rice based
farming. There were around 1,250 ha of fallow land or 70% of total land areas of the village. So,
young fallow lands with 1 and 2 year’s old were the predominant land use of this area, young fallow
land covered around 50% and rice field around 15% of total village land.
In 2000, about 530 ha of fallow land or 30 % of total land area were classified as head water area
which was prohibited to use for shifting cultivation. This area was incrementally recovered, and
fully recovered by old forest fallow in later 2011 (figure 17). The remaining area of 720 ha of fallow
land or 40% of total land, of which 475 ha or 25% were converted to teak plantation and 240 ha of
fallow land or 13% of total land were used for slash and burn agriculture including young fallow and
field crops. In correlation with land use changes, also increasing of carbon stock from 136 tons per
hectare in 2000 to 146 tons per hectares in 2011 (figure 18)
Figure 17 land use changes from 2000 to 2011
Historical land use dynamics from 2000-2011
0
20
40
60
80
100
120
2000 2002 2004 2006 2008 2011
%
Maize
Jobstear
Rice
Fallow 1 year
Fallow 2 years
Fallow 3 years
Fallow 4 years
Young teak
Medium teak
Old teak
Old fallow
Open forest
Dense forest

46 Final Technical Report: EBLU2012-02NMY-Takeuchi
Table 33 Land use changes in Lak Sip Village from 2000 to 2011
Land use types 2000 2002 2004 2006 2008 2011
Dense forest 27.40 27.40 27.40 27.40 27.40 27.40
Open forest 0.69 0.69 0.69 0.69 0.69 0.69
Old fallow 5.76 11.51 17.27 23.03 28.79 30.57
Old teak 0 0 0 2.01 4.03 5.47
Medium teak 0 1.44 2.30 3.91 5.87 8.29
Young teak 2.30 3.45 3.17 7.48 9.10 13.70
Fallow 4 years 0 0 0.58 0.86 1.15 1.15
Fallow 3 years 0 1.73 1.15 1.44 1.73 2.25
Fallow 2 years 19.46 20.15 18.54 14.39 10.71 4.49
Fallow 1 year 29.94 21.01 20.15 13.24 6.28 3.34
Rice 6.28 4.95 3.97 2.59 2.19 1.61
Job's tear 5.64 4.49 3.17 1.84 1.61 0.58
Maize 2.53 3.17 1.61 1.09 0.46 0.46
Figure 18 Historical carbon stock dynamic from 2000 to 2011
Table 34 Trend of carbon stock in Lak Sip Village from 2000 to 2011
Years 2000 2002 2004 2006 2008 2011
C stock T 137.00 138.88 140.35 142.82 145.20 146.64
Future scenarios of land use change in case of deforestation and forest degradation without REDD
from 2011 – 2012 in Laksip Village
Two scenarios have been worked out : (i) Scenario 1 without REDD– with increase in population
pressure and lack of REDD, shortening of shifting cultivation continues and hence old fallows get
Historical carbon dynamics from 2000-2011
132
134
136
138
140
142
144
146
148
2000 2002 2004 2006 2008 2011
Ton/ha

Final Technical Report: EBLU2012-02NMY-Takeuchi 47
converted to young fallows and (ii) Scenario 2 with REDD for forest conservation, the young fallows
are converted to forest fallows.
If old fallow, which occupied nearly half of forest land in 2011, is converted without REDD to young
fallow (1 years fallow), in year’s 2020, as shows in figure 19. In consequences, carbon stock in the
area would decrease from 146 C-ton per hectare to 135 ton per hectare figure 20 – in fallow fields or
the entire village.
Future scenarios of future land use from 2011-2020
0%
20%
40%
60%
80%
100%
2011 2012 2014 2016 2018 2020
% o
f la
nd
use t
yp
es
Maize
Jobstear
Rice
Fallow 1 year
Fallow 2 years
Fallow 3 years
Fallow 4 years
Young teak
Medium teak
Old teak
Old fallow
Open forest
Dense forest
Figure 19 Future scenarios of future deforestation and forest degradation in Laksip Village.
Historical carbon dynamics from 2000-2011
132
134
136
138
140
142
144
146
148
2000 2002 2004 2006 2008 2011
Ton/ha
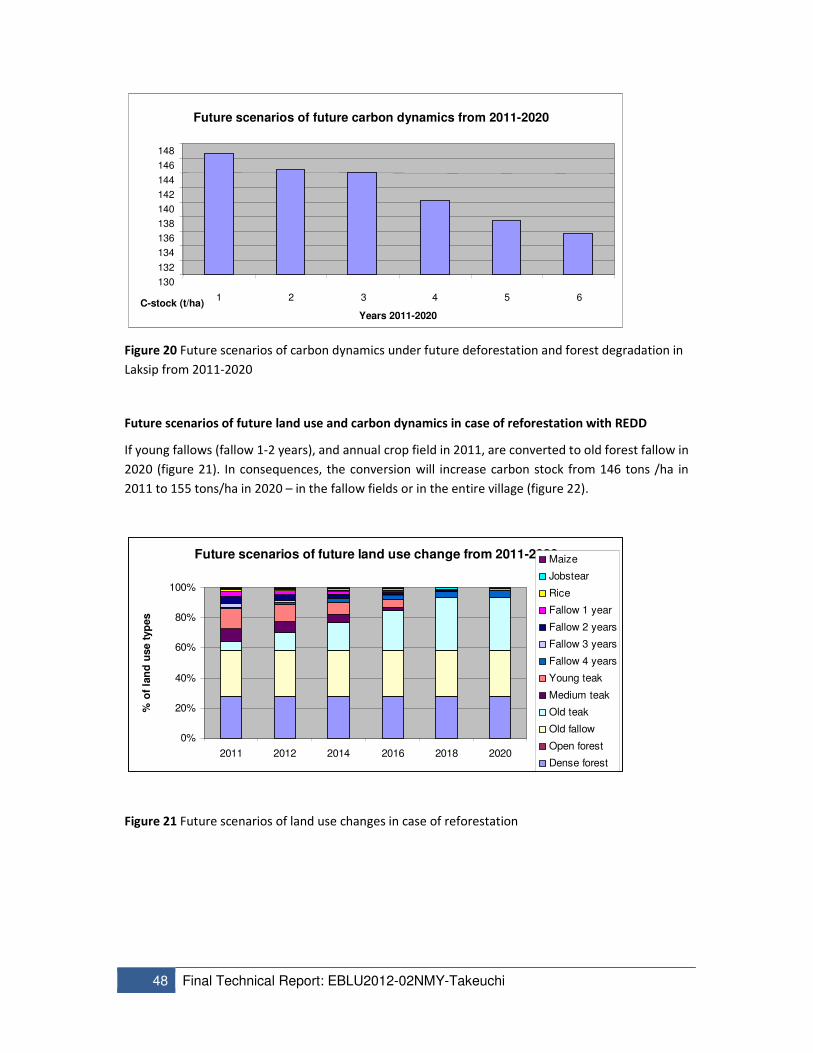
48 Final Technical Report: EBLU2012-02NMY-Takeuchi
Figure 20 Future scenarios of carbon dynamics under future deforestation and forest degradation in
Laksip from 2011-2020
Future scenarios of future land use and carbon dynamics in case of reforestation with REDD
If young fallows (fallow 1-2 years), and annual crop field in 2011, are converted to old forest fallow in
2020 (figure 21). In consequences, the conversion will increase carbon stock from 146 tons /ha in
2011 to 155 tons/ha in 2020 – in the fallow fields or in the entire village (figure 22).
Future scenarios of future land use change from 2011-2020
0%
20%
40%
60%
80%
100%
2011 2012 2014 2016 2018 2020
% o
f la
nd
use t
yp
es
Maize
Jobstear
Rice
Fallow 1 year
Fallow 2 years
Fallow 3 years
Fallow 4 years
Young teak
Medium teak
Old teak
Old fallow
Open forest
Dense forest
Figure 21 Future scenarios of land use changes in case of reforestation
Future scenarios of future carbon dynamics from 2011-2020
130
132
134
136
138
140
142
144
146
148
1 2 3 4 5 6
Years 2011-2020
C-stock (t/ha)
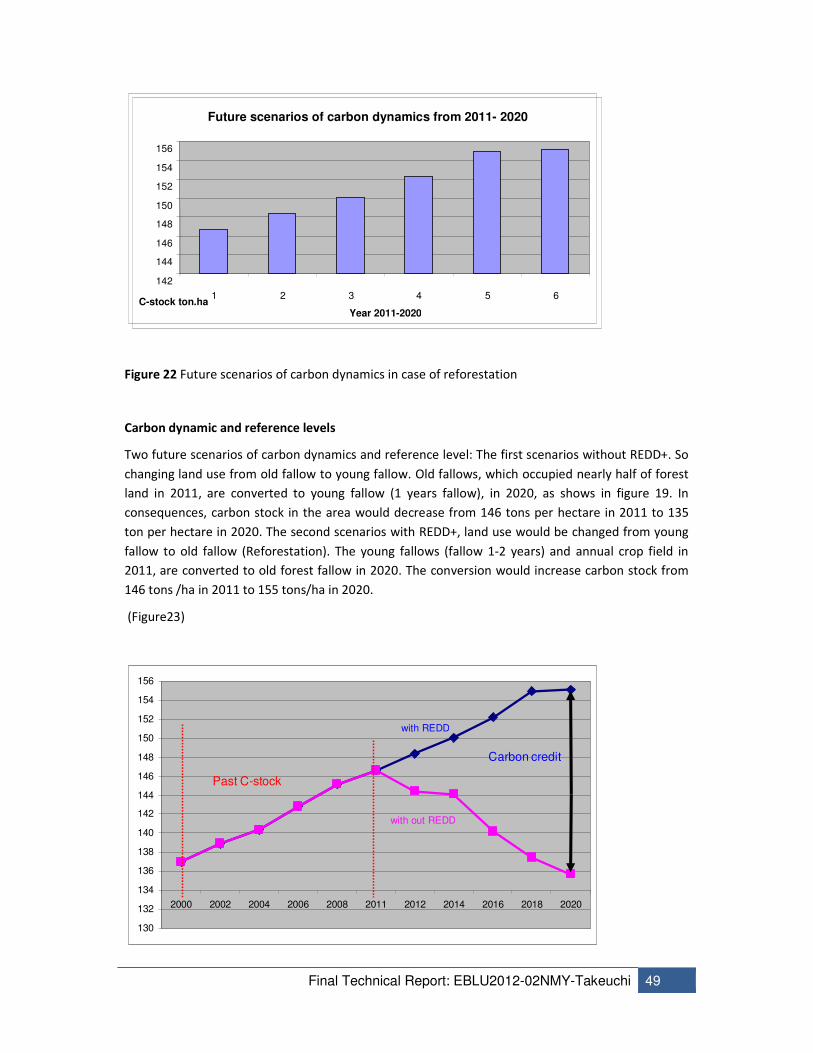
Final Technical Report: EBLU2012-02NMY-Takeuchi 49
Figure 22 Future scenarios of carbon dynamics in case of reforestation
Carbon dynamic and reference levels
Two future scenarios of carbon dynamics and reference level: The first scenarios without REDD+. So
changing land use from old fallow to young fallow. Old fallows, which occupied nearly half of forest
land in 2011, are converted to young fallow (1 years fallow), in 2020, as shows in figure 19. In
consequences, carbon stock in the area would decrease from 146 tons per hectare in 2011 to 135
ton per hectare in 2020. The second scenarios with REDD+, land use would be changed from young
fallow to old fallow (Reforestation). The young fallows (fallow 1-2 years) and annual crop field in
2011, are converted to old forest fallow in 2020. The conversion would increase carbon stock from
146 tons /ha in 2011 to 155 tons/ha in 2020.
(Figure23)
130
132
134
136
138
140
142
144
146
148
150
152
154
156
2000 2002 2004 2006 2008 2011 2012 2014 2016 2018 2020
with REDD
with out REDD
Past C-stock
Carbon credit
Future scenarios of carbon dynamics from 2011- 2020
142
144
146
148
150
152
154
156
1 2 3 4 5 6
Year 2011-2020C-stock ton.ha

50 Final Technical Report: EBLU2012-02NMY-Takeuchi
Figure 23 Carbon dynamic and reference levels (C stock Ton/ha).
We can summarize two scenarios of carbon storage change of Laksip Village ( in period from 2000 -
2020) in case of deforestation (without REDD+) (figure 20). In consequences, carbon stock in the
area would decrease from 146 C-ton per hectare to 135 ton per hectare. Reforestation scenario
with REDD+ (figure 22) would increase carbon stock in the area from 135 ton per hectare to 155 ton
per hectare. Carbon credit would be 20 ton per hectare (figure 23).
3.2.6 Economic analysis- opportunity cost/benefit analysis
The opportunity cost of converting natural forest (dense forest) to 4 alternative land uses including
teak plantation, rice cultivation, maize cultivation and jobs tears cultivation were worked out.
Cost of implementation and maintenance of different land uses
Implementation costs included material costs (i.e. seeds and seedlings) and labour costs for land
clearing and weeding.
Table 35 Cost of teak plantation in 2012
No Items
Unit
(person-
labour
days)?? Cost/Unit Cost(kips) Cost(US$)
1 Teak seedling 1,100 500 550,000 68.75
2 Land clearing 30 30,000 900,000 112.5
3 planting 20 30,000 600,000 75
4 weeding 50 30,000 1,500,000 187.5
Total cost 3,550,000 443.75
Table 36 Cost of rice production in 2012
No Items Unit Cost/Unit Cost(Kips) Cost(US$)
1 Rice seed 50 5000 250,000 31.25
2 Land Clearing 58 30,000 1,740,000 217,5
3 Planting 10 30,000 300,000 37.5
4 Weeding 74 30,000 2,220,000 277.5

Final Technical Report: EBLU2012-02NMY-Takeuchi 51
Total cost 4,510,000 563.75
Table 37 Cost of Jobs tear production in 2012
No Items Unit Cost/Unit Cost(Kips) Cost(US$)
1 Jobs tear seed 30 6,000 180,000 22.5
2 Land Clearing 60 30,000 1,800.000 225
3 Planting 8 30,000 240,000 30
4 Weeding 50 30,000 1,500,000 187.5
Total cost 3,720,000 465
Table 38 Cost of maize production in 2012
No Items Unit Cost/Unit Cost(Kips) Cost(US$)
1 Maize seed 20 5,000 100,000 12.5
2 Land Clearing 60 30,000 1,800,000 225
3 Planting 8 30,000 240,000 30
4 Weeding 45 30,000 1,350,000 168.75
Total cost 3,490,000 436.25
Profit from different land use types
Benefits from different land uses were products or yield obtained from land unit (ha) and converted
to monetary values (US$/ha)
Table 39 Teak product and profit in 2012
Ages Yield (m3) Cost/m3 Cost/ha in (US$)
1 to 5 75 - -
5 to 10 88 - -
10 to 15 103 - -
15 to 20 128 - -

52 Final Technical Report: EBLU2012-02NMY-Takeuchi
More than 20 150 100 15,000
Table 40 Rice product and profit in 2012
Category of land Yield (ton/ha) Cost/ton in US$ Cost/ha (US$)
newly open forest 3 250 750
fallow 3 years 2 250 500
Fallow 2 years 1 250 250
fallow 1 year 0.8 250 200
Table 41 Jobs tear product and profit in 2012
Category of land Yield (ton/ha) Cost/ton in US$ Cost/ha (US$)
newly open forest 4 375 1500
fallow 3 years 3 375 1125
fallow 2 years 2.5 375 937.5
fallow 1 year 2 375 750
Table 42 Maize product and profit in 2012
Category of land Yield (ton/ha) Cost/ton in US$ Cost/ha (US$)
newly open forest 4 225 900
fallow 3 years 3 225 675
fallow 2 years 2 225 450
fallow 1 year 1 225 225
Net present value from different land uses: Among 5 different land uses, it was found that teak
plantation gave the highest NPV. The NPV was 599 US$/ha, followed by Jobs tear which produced
NPV of 214 US$/ha, and Maize, NPV was 84 US$/ha. The lowest NPV was under rice where the NPV
was 16 US$/ha only. However, the NPV of dense forest was 1.42 US$/ha, of which benefits were
mostly from non timber forest products.
Table 43 Net present value from different land use from 2000-2020

Final Technical Report: EBLU2012-02NMY-Takeuchi 53
Land use type Real NPV (US$)
NPV
(US$/ha/y)
Carbon stock
(t/ha)
CO2 stock
(t/ha)
Forest 29.925.00 1.42 308.30 1131.00
Teak 12577.20 599.00 103.40 279.30
Rice 347.70 16.50 64.43 236.50
Maize 1763.20 84.00 65.76 241.30
Jobs tear 4495.40 214.00 70.64 259.20
Carbon stock under different land use
In terms of carbon stock, dense forest produced the highest C stock of 308 tons/ha, followed by teak
plantations where the C-stock was 108 tons/ha , jobs tear produced 70 tons/ha of C-stock and Maize
produced 65 tons /ha of C-stock. The lowest of carbon stock was found under rice field (64 tons per
hectare).
Table 44 Carbon stock in different land use
Land use C stock (ton/ha)
Forest 308
Teak 108
Rice 64
Maize 65
Jobs tear 70

54 Final Technical Report: EBLU2012-02NMY-Takeuchi
C stock T/ha under different land use types
0
50
100
150
200
250
300
350
Forest Teak Rice Maize Jobstear
Land use
C s
tock T
/ha
Series1
Carbon loss from converting forest to agriculture
Conversion of forest to rice and maize cultivation follows the loss of around 240 ton/ha in the whole
village or in the forest area converted to agriculture?? In converting forest to jobs tear cultivation,
the loss of carbon was 237 tons/ha. The lowest carbon loss was found under teak plantation where
the loss was 204 tons/ha.
Table 45 Carbon loss from converting forest land to agricultural land
Land uses Carbon loss (ton/ha)
Teak 204
Rice 243
Maize 242
Jobs tear 237
Profit gain from converting forest to agricultural land
The opportunity cost of not changing forest to 4 different land use types, it was found that from
changing forest to teak plantation gave the highest profit (NPV/ha). The profit (NPV/ha) was
597.58US$/ha, followed by changing forest to jobs tear which produced profit (NPV/ha) of 212
US$/ha, and Maize, profit (NPV/ha) was 82 US$/ha. The lowest profit (NPV/ha) was under rice where
the profit (NPV/ha) was 14.58 US$ only.
Table 46 Profit (NPV/ha) gain from converting forest to agriculture land use types
Land use Profit (NPV/ha) (US$/ha)
Teak 597.58

Final Technical Report: EBLU2012-02NMY-Takeuchi 55
Rice 14.58
Maize 82.58
Jobs tear 212.58
Profit gain from changing forest to agriculture
0
100
200
300
400
500
600
700
Teak Rice Maize Jobstear
US
$/h
a
Opportunity cost of different land use change
The opportunity cost of four types of land use changes (forest to teak plantation, rice, maize and
jobs tear), it was found that the change from forest to teak plantation gave the highest opportunity
cost, The opportunity cost was 0.795US$/ton CO2, followed by changing from forest to jobs tear
which produced opportunity cost of 0.244 US$/ton CO2, and changing from forest to maize,
opportunity cost was 0.093 US$/ton CO2. The lowest opportunity cost was under changing from
forest to rice where it was 0.093 US$/tonCO2 only.
Table 47 Opportunity cost of different land use changes
Land use Opportunity cost (US$/ton CO2)
Teak 0.795
Rice 0.016
Maize 0.093
Jobs tear 0.244

56 Final Technical Report: EBLU2012-02NMY-Takeuchi
3.2.7 Community based MRV process and demonstration of good land use practices
The main objective of community-based MRV was to increase awareness about emerging economic
opportunities from climate change mitigation through carbon sequestration and stipulated
mechanism of managing, monitoring and verifying (MRV) carbon storage.
The project teams in Laos presented the existing land use available in the village to the villagers.
The villagers were informed that:
• Natural forest produced highest carbon stock of 526 tons/ha of which Carbon storage is very high
in dense forest. The content of carbon is up to 308 tons per ha
• Plantation forest teak produced 264 ton per ha of which old teak produced highest carbon of 108
tons per ha
• Rotated fallow land produced 340 tons per hectare of which 4 years fallow produced highest
carbon of 107 tons per ha
• Field crops produced less carbon storage of 200 tons per hectare only.
Demonstration of good land use practices
• Silva-cultural practices to enhance soil C stock and diversify of plant species under teak, including
planting space, thinning, no burning leave residues and keep litter under teak plantation were
demonstrated by making a comparison of two demonstration plots. One plot of teak with burning
of teak leaves and weed residues and another one without burning and clearing of crop residues.
The plot without burning and clearing of crop/weed residues showed better tree growth as well
as soil carbon stocks and soil fertility levels.
• Agro-techniques for field crop cultivation to increase carbon in soil and sustain crop yield by
using mulching of crop residues, cover crops (leguminous ) interplant with annual crops and
restoration of soil fertility by natural way through keeping fallow for long period ( more than 3
years) and by leguminous fallows such as pigeon pea. A demonstration of short fallow of 2 years
and long fallow of 4 years fallow were compared during the site visit, Laksip villagers observed
that under long fallow of 4 years, there are more plant diversity especially wood and shrub
species, soil is soft and has dark colour that is indicator of high organic matter content while the
plot of short fallow of 2 years there are less shrubs and wood species but more weed species, the
soil is hard and has red colour that means low content of soil organic matter. And two plots of
field crops (rice) also demonstrated to villagers the first one is upland rice field with 4 years fallow
and the second one is upland rice field with 2 years fallow. It showed that the first one the rice
stalk is more thick and high while the second one the rice stalk is very thin and short and the yield
from the first one is much higher than the second one.
3.3 INDIA
3.3.1 General background of associated project site in India
Himalaya, a vast mountain system extending across eight Asian countries (viz., Afghanistan,
Bangladesh, Bhutan, China, India, Myanmar, Nepal and Pakistan), is a biodiversity hotspot (Myers et
al., 2000). Deforestation and forest degradation are widespread, with immense variation in their
rates and driving factors (Rao and Pant, 2001; Wangda and Ohsawa, 2006; Panta et al., 2008).
Scarcity of fodder, manure (the mixture of forest leaf litter and livestock excreta), fuelwood and a
range of other non-timber forest products crucial for local livelihoods coupled with increasing
aspiration for off-farm economy resulted in outmigration and abandonment of agricultural land use
after 1980 (Maikhuri et al., 1995). Degraded forests and abandoned agricultural lands cover 37%
area of the total geographical area of Indian Himalaya (59 million ha) (Maikhuri et al., 1997).

Final Technical Report: EBLU2012-02NMY-Takeuchi 57
Farmers of Himalaya have been using and managing several multipurpose tree species (Thapa et al.,
1995; Singh et al., 2008) as also by farmers in mountain regions of south-east Asia (Mulyoutami et
al., 2009) and Latin America (Diemont and Martin, 2009). However, cover and vigor of these species
are quite poor due to: (i) selective protection of natural regeneration rather than systematic tree
planting, (ii) excessive lopping (Semwal et al., 2002), (iii) small farm holdings, (iv) restrictions on
commercial utilization of tree products (Singh et al., 2008; Sood and Mitchell, 2009), (v) stress on
planting timber/industrially valued species by government agencies and (vi) exclusion of people in
designing plantation programmes (Maikhuri et al., 1997; Lamb and Gilmour, 2003). Tree planting in
degraded lands, apart from enhancing ecosystem functions of the treated areas, contributes to
conservation of the remaining forests (Lamb et al., 2005), climate change mitigation (Antle et al.,
2007) and to socio-economic upliftment of local communities (Hayes and Persha, 2010; Adnan and
Holscher, 2011) in developing countries. Though huge investments have been made to rehabilitate
degraded lands by planting trees since the 1970s in the Himalayan region, the impact has, by and
large, been poor because of inappropriate technologies and callous or negative attitudes of the local
people (Saxena et al., 2001; Lamb and Gilmour, 2003).
As a result of research priorities on industrially valued tree species, quantitative information on
growth and ecological impacts of multipurpose trees in Himalaya is quite limited (Gilmour et al.,
1990; Maikhuri, 1993; Dhyani and Tripathi, 1999) as is also the case with other developing regions
(Deans et al., 2003; van Breugel et al., 2011). Deficiency of long-term data on performance of
multipurpose tree plantations in degraded lands delimits the scope of realization of economic
benefits from the United Nations- REDD+ (Reducing Emissions from Deforestation and Forest
Degradation) initiative of climate change mitigation by making payments for reducing emissions in
developing countries. Repeated sampling of a plantation over long term is likely to yield more
accurate biomass/carbon accumulation trends compared to the chronosequence based ones
(Johnson and Miyanishi, 2008; Walker et al., 2010) but has been rarely attempted.
We developed participatory approaches to tree planting as a component of land rehabilitation plans
in selected villages in Indian Himalaya spread over an elevation range of 1200–2500 m amsl.
(Maikhuri et al., 1995, 1997; Rao et al., 1999). At mid-elevations (1200–1350 m amsl.), mixed
plantation of ten multipurpose tree species with cropping developed in abandoned agricultural land
sequestered carbon in tree component 2.8 times and in top 15 cm soil 1.5 times higher compared to
exclusive tree plantation in degraded forest land, with Alnus nepalensis, Albizzia lebbeck and
Albergia sissoo showing higher mortality at the latter site but insignificant site effect on
aboveground biomass (Maikhuri et al., 2000). Comparison of crop performance under varied lopping
regimes in 6-yearold tree-crop mixed system suggested that retention of 25% branches did not
reduce crop yields (Semwal et al., 2002). The objective of the present study was to collect additional
data on tree survival, growth and carbon stocks to describe the long term effects of growing
multipurpose trees in degraded lands in Himalaya. To our knowledge, this is the first attempt of
evaluating the performance of plantations in degraded lands based on repeated-measurements of
the same sites over a 20-year-period in the Himalaya.
3.3.2 Study area and land use-land cover mapping
The study was carried out at Bhiri-Banswara village (latitude 30_270N and 79_50E) at 1200 m amsl.
In Rudraprayag district in Garhwal region of Indian Himalaya. The climate is typical monsoon, with
annual rainfall varying in the range of 1400–1700 mm and monthly minimum and maximum
temperatures of 7–24 *C and 19–34*C, respectively. The soil is derived from feldspathic quartz
schists, quartz muscovite schists and quartz chlorite schists and can be classified as Dystric Cambisol
according to FAO system. Potential vegetation has been described as subtropical broadleaved/ pine

58 Final Technical Report: EBLU2012-02NMY-Takeuchi
forests (Champion and Seth, 1968). At the time of initiation of the study in 1990, the village
community comprised 1400 people in 256 families, with mean land holding size of 0.45 ha.
Moderately degraded natural forests (15–25 m high trees on 25–30* slopes; tree density: 350 trees
ha_1; basal area: 41 m2 ha_1), highly degraded natural forests (1–2 m tall herbaceous vegetation on
20–30* slopes with isolated stunted <5 m tall trees with basal area of <2 m2 ha_1), pure crop system
(5–8*outward sloping, 4–7 m-wide and 1–2 m-high terraces devoid of trees), tree-crop mixed
agroforestry system (scattered 5–8 m tall multipurpose tree species maintained in land previously
under pure crop system; tree density: 170 trees ha_1; basal area: 13 m2 ha_1) and abandoned
agricultural land (herbaceous vegetation on damaged terraces) covered 46%, 3%, 35%, 10% and 6%,
respectively, of the total village area (Bhadauria et al., 2012).
Plantation establishments
The information presented here is based on the previous studies of the same area (Maikhuri et al.,
1997, 2000; Semwal et al., 2002). Interviews with the heads of 219 families staying permanently in
Bhiri-Banswara in 1990–91 revealed farmers’ preferences for planting eight tree species viz.
Boehmaria rugulosa Wedd., Grewia optiva J.R. Drummond ex Burret, Celtis australis L. and Ficus
glomerata Roxb. Valued most for fodder, D. sissoo Roxb. and A. lebbeck (L.) Benth. for timber, Pyrus
pashia Buch.-Ham. ex D. Don. for fuelwood and Prunus cerasoides D. Don for its edible fruits and
flowers attracting honeybees. Farmers were initially not willing to plant A. nepalensis D. Don and
Sapium sebiferum (Michaux) Roxb. for their poor quality fodder and fuelwood. They agreed to plant
A. nepalensis after we informed them of its scientifically proven potential to improve soil fertility
and support high crop productivity (Singh et al., 1989) and S. sebiferum after we informed them of
market value of its tallow and oil (Gaur, 1999). Except for B. rugulosa, an evergreen tree, all other
species were deciduous between December and March/April, with minor species specific differences
in leaf fall/production dynamics.
Site and treatment characteristics
After a series of participatory discussions, it was decided to (i) demarcate one plot (3 ha) each of
abandoned agricultural land (AAL) and highly degraded forest land (HDFL) with similar topographic
conditions but separated by a distance of 50–100 m, (ii) protect the plots from fire and grazing, (iii)
transplant healthy saplings/ plantlets of the ten multipurpose tree species listed above obtained
from the village farm/forest land in 45 x45 x 45 cm size pits providing 2 kg of traditional farmyard
manure, the mixture of forest leaf litter and livestock excreta (moisture: 265%; C: 29.2%; N: 1.28%),
at 3 m spacing in July 1991, (iv) mix species such that neighboring individuals did not belong to the
same species, (v) construct a tank with locally available resources to store water to alleviate stress to
crops during dry spells only at the AAL site and (vi) monitor all costs/inputs and benefits/outputs
related to the trials in each site (Maikhuri et al., 1997). Soil at the AAL site had lower bulk density,
higher organic carbon, total nitrogen and exchangeable potassium, calcium and magnesium
compared to the HDFL site, while the two sites resembled in terms of soil texture and water holding
capacity (Table 35). A summary of management practices at the two sites is provided in Table 2. At
the AAL site, the terraces were repaired and annual food crops were grown providing farm yard
manure (40 Mg ha_1
year_1
during the first-five years and 20 Mg ha_1
year_1
during 6–10-year period)
and turmeric from eleventh year onwards with average manure input of 2 Mg ha_1 year_1. Trees
were lopped from the sixth year onwards during winter season only at the AAL site.
Table 48 Selected attributes of the abandoned agricultural land (AAL) site and highly degraded forest
land (HDFL) site in Bhiri-Banswara village landscape, Central Himalaya, India at the time of tree
planting in the year 1991

Final Technical Report: EBLU2012-02NMY-Takeuchi 59

60 Final Technical Report: EBLU2012-02NMY-Takeuchi
3.3.3 Tree survival, tree growth and carbon stock measurements Survival rate was assessed based on complete census of all planted individuals at the end of 1, 3, 5,
7, 15 and 20 years of plantation. Density of trees established through natural regeneration was
determined based on observations in 30 quadrats, each of 10 m x 10 m, in each site only after 20
years of plantation. Twenty random individuals of each species at each site were selected to
measure height and girth (10 cm above ground level at the age of 1 and 3 years and at breast height
at 5–20 years). Carbon stocks in vegetation, litter and soil and material inputs/outputs were
estimated before and 5, 15 and 20 years after-treatment in each site.
At 5, 15 and 20 years, five plots of 10 m x 10 m were laid out in each site and one randomly selected
tree of each species in each plot was harvested, aboveground biomass separated into bole, branches
and leaves and fresh weights obtained in the field. Shrub biomass was estimated in a 5 m x5 m
quadrat nested in the centre and herbaceous biomass in five 1 m2 quadrats, one each around the
central and corner points, of the 10 m x 10 m plots. Surface litter was collected from ten 1 m2
quadrats, two each around central and corner points of the 10 m x 10 m plots.
Aboveground shrub/herbaceous biomass was segregated by species and surface litter into leaf and
woody material. In the centre of each litter quadrat, soil from 50 cm x 50 cm area was dug out up to
100 cm depth. Visible root fragments in 0–15, 15–30 cm and 30–100 cm soil layers were hand-
picked. Subsamples of different vegetation components were dried at 80 ± 5 *C for 72 h and
biomass of different components was computed using dry-fresh weight ratios. Weight and volume of
gravels (>2 mm) in each of the three soil layers were determined and sub-samples of soil were dried
at 105 ± 5 *C for 72 h to determine bulk density following Anderson and Ingram (1993). Soil organic
carbon concentration was determined by the Walkley–Black dichromate oxidation method in <2 mm
soil component finely ground to pass through 0.25 mm sieve (Jackson, 1962). Organic carbon stocks
in different soil layers were determined based on the concentrations, bulk density and gravel
content (Davids on and Ackerman, 1993). 50% of dry plant biomass was considered as its carbon
content. Slope correction was applied for determining carbon stocks on per unit area basis.
Statistical analysis
Analysis of variance (ANOVA) and least significant difference (LSD) were applied to evaluate the
effect of age and species on tree growth at different sites and change in carbon stock with time after
testing the data for normality and independence by Kolmogorov–Smirnov test and runs test,
respectively. Student t-test was used to compare growth of a species and carbon pools at the two
sites at different stages of site development (Sokal and Rohlf, 1981). Because of operational
constraints, we could not monitor growth and carbon stocks at uniform time intervals and replicate
sites.
Table 49 Comparison of management practices adopted for rehabilitation of the abandoned
agricultural land (AAL) and highly degraded forest land (HDFL) sites in Bhiri-Banswara village
landscape, Central Himalaya, India.

Final Technical Report: EBLU2012-02NMY-Takeuchi 61

62 Final Technical Report: EBLU2012-02NMY-Takeuchi
Results
(1) Survival
At the abandoned agricultural land (AAL) site, F. glomerata and P. cerasoides did not suffer any
mortality, A. lebbeck, C. australis, B. rugulosa and G. optiva suffered mortality only during the initial
3-year-period and A. nepalensis, D. sissoo, S. sebiferum and P. pashia during the initial 3-year-period
and also after 7 years. At the highly degraded forest land (HDFL) site, all species experienced
mortality only during the initial 3-year-period. Mortality was higher at the HDFL site compared to the
AAL site, more so in B. rugulosa, G. optiva and F. glomerata. Average survival at the AAL site was
87% compared to 51% at the HDFL site, with 970 trees ha_1 at the former and 564 trees ha_1 at the
latter site surviving after 20 years (Table 50).
Table 50 Number of surviving trees (trees ha_1) of different species after 1, 3, 5, 7, 15 and 20 years of
plantation at the abandoned agricultural land (AAL) site and highly degraded forest land (HDFL) site
in Bhiri-Banswara village landscape, Central Himalaya, India (planting density: 110 saplings of each
species ha_1
or 1110 saplings of all species ha_1
).

Final Technical Report: EBLU2012-02NMY-Takeuchi 63

64 Final Technical Report: EBLU2012-02NMY-Takeuchi
(2) Tree growth: height, girth and aboveground biomass
Height growth 7 years after plantation was negligible in A. lebbeck, G. optiva, P. pashia and S.
sebiferum at the AAL site and in all species except A. lebbeck, S. sebiferum and P. cerasoides at the
HDFL site. At the AAL site, A. nepalensis was taller than C. australis and F. glomerata, and D. sissoo
taller than P. cerasoides until 7 years but the differences between the former three and between the
latter two species became insignificant (P > 0.05) after 15 years. At the HDFL site, A. nepalensis, D.
sissoo and A. lebbeck were taller than P. cerasoides, and F. glomerata taller than S. sebiferum until 7
years but the differences between the former four species and between the latter two species
became insignificant (P > 0.05) after 15 years. Site effect was insignificant (P > 0.05) in A. lebbeck at
all ages and in P. pashia 5 years after plantation. All other species grew taller at the AAL site
compared to the HDFL site at all ages (P < 0.05). At the age of 20 years, F. glomerata, B. regulosa and
C. australis trees were 2.1–2.9-times and D. sissoo, A. nepalensis, P. cerasoides, S. sebiferum and G.
optiva 1.4–1.8-times taller at the AAL site than the HDFL site (Fig. 24a and b).

Final Technical Report: EBLU2012-02NMY-Takeuchi 65
Figure 24 (a and b) Height of different tree species after 1, 3, 5, 7, 15 and 20 years of plantation at
the (a) abandoned agricultural land (AAL) site and (b) highly degraded forest land (HDFL) site in Bhiri-
Banswara, Central Himalaya India. Vertical lines represent the least significant differences (P = 0.05)
between species at different ages. AAL: Fage (5, 1140) = 3145.4, Fspecies (9, 1140) = 462.7, Fagex
species (45, 1140) = 40.4; DFL: Fage (5, 1140) = 2552.9, Fspecies (9, 1140) = 580.7, Fage x species (45,
1140) = 39.1.
Increase in girth was insignificant (P > 0.05) in P. pashia and S. sebiferum at the AAL site and D. sissoo
at the HDFL site after 7 years and in other species at both sites after 15 years of plantation. At the
AAL site, A. nepalensis had larger girth than B. rugulosa and D. sissoo larger than C. australis and P.
cerasoides till 7 years but the differences between the former two and among the latter three
species diminished by the age of 15 years. At the HDFL site, A. nepalensis had larger girth than P.
cerasoides and A. lebbeck larger than C. australis till 7 years but the differences between the former
two and the latter two species became insignificant (P > 0.05) by the age of 15 years. Site did not
have any significant (P > 0.05) effect on girth of A. lebbeck on all sampling times and in P. cerasoides
and P. pashia 7 years after plantation. At the age of 20 years, F. glomerata and D. sissoo had 2.0–2.3-
times and A. nepalensis, B. rugulosa, C. australis, G. optiva and S. sebiferum 1.2–1.6-times larger
girths at the AAL site compared to the HDFL site (Fig. 25a and b).
Figure 25 (a and b) Girth of different tree species after 1, 3, 5, 7, 15 and 20 years of plantation at the
(a) abandoned agricultural land (AAL) site and (b) highly degraded forest land (HDFL) site in Bhiri-
Banswara, Central Himalaya, India. Vertical lines represent the least significant differences (P = 0.05)
between species at different ages. AAL: Fage (5, 1140) = 4525.5, Fspecies (9, 1140) = 554.1, Fage x
species (45, 1140) = 54.9; DFL: Fage (5, 1140) = 6151.2, Fspecies (9, 1140) = 561.0, Fage x species (45,
1140) = 112.4.

66 Final Technical Report: EBLU2012-02NMY-Takeuchi
A. nepalensis at both sites and S. sebiferum and P. pashia only at the AAL site did not show any
significant (P > 0.05) increase in biomass after 15 years. All other species showed a linear increase in
biomass till 20 years at the HDFL site unlike a sharp decline in biomass accumulation rates after 15
years at the AAL site. B. rugulosa had 5.7-, G. optiva 3.2-, C. australis 2.3-, F. glomerata 1.6- and P.
cerasoides 1.5-fold higher aboveground biomass at the AAL site compared to the HDFL site after 20-
years. A. nepalensis and D. sissoo had significantly (P < 0.05) larger and A. lebbeck lower biomass at
the AAL site by the age of 20 years but differences between them were not significant (P > 0.05) until
5 years. P. pashia had significantly (P < 0.05) higher biomass at the AAL site than at the HDFL site
until 5 years but the site effect was not significant (P > 0.05) by the age of 20 years. S. sebiferum
accumulated larger biomass until 5 years but lower biomass thereafter at the AAL site compared to
the HDFL site (Fig. 26a and b).
At the AAL site where trees were lopped, F. glomerata, B. rugulosa, A. nepalensis, and G. optiva
yielded the highest amount of foliage biomass from lopped branches (83–96 kg tree_1
) followed by
C. australis (54 kg tree_1
), S. sebiferum, P. cerasoides, D. sissoo and A. lebbeck (36–43 kg tree_1
) and
P. pashia (16 kg tree_1). Fuelwood yield varied from 102 kg tree_1 from A. nepalensis and F. glomerata
to 25 kg tree_1 from P. pashia.
Figure 26 (a and b) Mean aboveground biomass of different species after 5, 15 and 20 years of
plantation at the (a) abandoned agricultural land (AAL) site and (b) highly degraded forest land
(HDFL) site in Bhiri-Banswara, Central Himalaya, India. Vertical lines represent the least significant
differences (P = 0.05) between species at different ages. AAL: Fage (2, 120) = 4525.5, Fspecies (9,
120) = 554.1, Fage xspecies (18, 120) = 54.9; DFL: Fage (5, 120) = 6151.2, Fspecies (9, 120) = 561.0,
Fage x species (18, 120) = 112.4.

Final Technical Report: EBLU2012-02NMY-Takeuchi 67
(3) Natural regeneration
Cinnamomum tamala at the AAL site, Phyllanthus emblica and Syzygium cumini at the HDFL site and
Engelhardtia spicata, Lannea coromandelica, Toona hexandra, Bombax ceiba, Mallotus philippensis
and Pinus roxburghii at both sites established through selective protection of natural regeneration
by farmers (Table 38). Of the planted species, D. sissoo, S. sebiferum and P. cersaoides regenerated
only at the AAL site after 7 years but were weeded out.
(4) Carbon stock
Before plantation, the AAL site had slightly higher value of C stocks compared to the HDFL site which
was due to an increase in soil organic C, despite the very high amounts of farmyard manure added to
the AAL site in the past. Both sites received 6.5 Mg C ha_1
through farm yard manure added to the
soil at the time of transplanting saplings. The AAL site received a huge additional amount of 117 Mg
C ha_1 over the 20-year-period through manure applied primarily to benefit understorey crops.
Around 7 Mg C ha_1
in palatable grass biomass was taken out from the HDFL site compared to 103
Mg C ha_1 in fodder, fuelwood and food taken out from the AAL site.
Setting aside the C pools taken out of the sites, the standing C pools at the two sites are shown in
Fig. 27. C pool in the standing aboveground biomass after 20 years was 2.3-times lower at the AAL
site and 3.1-times higher at the HDFL site compared to that taken out of the site. Changes in
aboveground biomass C pools retained in the site during 16–20 year period were insignificant (P >
0.05) at the AAL site, while there was a significant (P < 0.05) but slow increase in the tree and shrub
C pools at the HDFL site. Over the 20-year period, the AAL site accumulated C in standing
aboveground pool at the rate of 2.09 Mg C ha_1 year_1 compared to 0.95 Mg C ha_1 year_1 at the
HDFL site. At the AAL site, A. nepalensis, B. rugulosa, C. australis, D. sissoo and P. cerasoides were
the most efficient species each making 14–17% of total C stock in aboveground tree biomass
followed by F. glomerata (9%) and A. lebbeck, S. sebiferum, G. optiva and P. pashia, (2–5%). At the
HDFL site, A. nepalensis, D. sissoo and P. cerasoides were the most efficient with their contributions
to the total tree C stock varying in the range of 15–22% followed by A. lebbeck, C. australis and S.
sebiferum (9–11%), and B. rugulosa, F. glomerata, G. optiva and P. pashia (1–6%).
Root C stocks were negligible compared to the soil organic C stocks at both sites. Total belowground
(soil + root) C stock consistently increased till 20 years at the HDFL site unlike the AAL site where it
increased during the initial 5 years followed by a margin decline during the 6–15-year period and
insignificant change (P > 0.05) during the 16–20-year period. Over the 20-year period, the HDFL site
accumulated belowground C at the rate of 1.37 Mg C ha_1
year_1
compared to 0.44 Mg ha_1
year_1
at
the AAL site.
Total C stock (vegetation + soil) at the AAL site was 61% greater after 5 years of treatment compared
to the HDFL site. The differences between the two sites gradually diminished and became
insignificant (P > 0.05) by the age of 20 years, with both sites accumulating C at a rate of 2.3–2.5 Mg
C ha_1 year_1(Fig. 27). If agroforestry system was developed on all degraded lands in the village, a
family would earn US 37 family_1
year_1
as compensation for carbon sequestration (considering
compensation of US $ 10 Mg CO2 _1
and carbon sequestration rate of 2.5 Mg C or 9.2 Mg CO2 ha_1
)
compared to US $ 400–900 family_1 year_1 from understorey food crops.

68 Final Technical Report: EBLU2012-02NMY-Takeuchi
Figure 27 Carbon pools before (0 yr) and 5–20 years after tree planting with cropping at the
abandoned agricultural land (AAL) site and without any cropping at the highly degraded forest land
(HDFL) site in Bhiri-Banswara, Central Himalaya, India. The horizontal line crossing at ‘0’ on y axis
refers to the soil surface, with values above it depicting the aboveground biomass C pool
(aboveground biomass C in trees, shrubs, herbs including crops at the AAL site and litter on ground)
and below it the belowground C pools (soil organic C in 0–15 cm, 15–30 cm and 30–100 cm soil
layers and roots). Least significant differences (P = 0.05) for carbon pools at different ages at the two
sites are shown. Fage (3, 16) = 40.0, 33.9, 7.4, 32.5, 9.6, 12.3, not significant and 285.4 at the AAL
site and 134.7, 23.1, 8.3, 17.4, 12.9, 15.9, 17.7 and 56.8 for soil (0–15 cm) organic C pool, soil (15–30
cm) organic C pool, soil (30–100 cm) organic C pool, root biomass C pool, litter biomass C pool,
aboveground biomass C of herbs/crops, aboveground biomass C of shrubs
and aboveground biomass C of trees, respectively.
3.3.4 Discussion
Survival of transplants and natural regeneration Better soil quality as a result of irrigation and addition of manure primarily applied to favor crop
growth was the key factor favoring higher survival rates at the AAL site compared to the HDFL site
until 5 years of tree growth when trees were not lopped and care was taken to avoid pruning of tree
roots by ploughing. Subsequently, farmers started ploughing right up to the bole causing pruning of
roots together with lopping of branches to minimize the risks of reduced crop yields due to negative
tree-crop interactions (Maikhuri et al., 2000; Semwal et al., 2002). High quality fodder species B.
rugulosa, G. optiva, F. glomerata and C. australis had lower capacity to survive in the more stressful
soil conditions at the HDFL site but high capacity to survive the persistent disturbances of lopping of
branches and pruning of roots caused by ploughing (Schroth, 1999) compared to A. nepalesnsis, D.
sissoo, S. sebiferum and P. pashia showing some mortality after 7 years of growth only at the AAL
site. Mature tree density of 564 trees ha_1 after 20 years of planting at the HDFL site is comparable
to that of healthy Himalayan forests (Sharma et al., 2010). Nonetheless, average survival of 51% at
the HDFL site was quite low and could be improved by more effective site preparation (Knapp et al.,
2006; Fonseca et al., 2011), biological amendments (Tiwari et al., 2003), selection of healthy
plantlets (Davidson et al., 1998; He et al., 2009) and by setting initial planting density higher than
1100 trees ha_1
in the present case. Enhancement of biodiversity through natural regeneration

Final Technical Report: EBLU2012-02NMY-Takeuchi 69
following protection and plantation in the present study was quite poor compared to other reports
in the Himalaya (Gilmour et al., 1990) and elsewhere (Lee et al., 2005; Farwig et al., 2009) due partly
to disturbances caused by intensive weeding at the AAL site and cutting of grasses at the HDFL site.
Table 51 Density (trees ha_1) of naturally regenerated trees protected by the farmers at the
abandoned agricultural land (AAL) site and the highly degraded forest land (HDFL) site after 20 years
of tree planting in Bhiri-Banwara village landscape, Central Himalaya, India.
Tree growth Tree density (970 trees ha_1) and basal area (34 m2 ha_1) after 20 years at the AAL site are fairly
higher than 180–428 trees ha_1 and 6–26 m2 ha_1 basal area in the age-old traditional farms in the
Himalayan region (Singh et al., 2008). Interviews with Bhiri-Banswara farmers revealed that they
considered 20-year-old trees at the HDFL site too weak to sustain lopping in the absence of any
irrigation and manuring. Direct species interactions may have significant influence on performance
of individual species in mixed plantations (Piotto et al., 2010) but may not be significant in the
present case where lopping of branches and pruning of roots caused by ploughing delimited
intermixing of neighboring trees at the AAL site and slow tree growth and low survival in the absence
of irrigation and manuring at the HDFL site (Schroth, 1999; Jackson et al., 2000). At the AAL site,
trees grew in better soil conditions arising from irrigation and manuring but faced disturbances of
lopping of branches and pruning of roots caused by ploughing unlike the HDFL site with poorer soil
conditions and absence of any disturbances caused by lopping and ploughing. The fodder trees B.
rugulosa, G. opitva, F. glomerata and C. australis and P. cerasoides valued for its edible fruits and
attracting honeybees having 1.6–5.7-fold higher aboveground biomass compared to that at the HDFL
site after 20 years were more responsive to amelioration of soil fertility at the AAL site compared to
A. nepalensis and D. sissoo, showing 1.2-fold difference between the two sites or P. pashia showing
insignificant site effect. Better performance of S. sebiferum and A. lebbeck at the HDFL site
compared to the AAL site after 5 years suggests their limited adaptation to persistent lopping,
pruning of roots in surface soil and shade stress caused by neighboring taller species. Local people
would prefer plantations dominated by G. optiva, B. rugulosa, C. australis and F. glomerata because
fodder is crucial for their livelihood and policies do not provide for income from wood (Maikhuri et
al., 2000; Singh et al., 2008). Poor performance of these species valued most by the farmers in more
stressful soil conditions at the HDFL site suggests the necessity of soil and water management for
their success. However, these fodder species with poor growth under soil moisture and nutrient
stress conditions would be less efficient in carbon accumulation compared to A. nepalensis and D.
sissoo maintaining fairly high biomass under such conditions. Further, the fodder species lacking
nitrogen fixing potential and producing smaller quantities of slowly decomposing litter would not be
as efficient in recuperating soil fertility in degraded lands as nitrogen fixing A. nepalensis, D. sissoo
70 Final Technical Report: EBLU2012-02NMY-Takeuchi
and A. lebbeck producing larger quantities of fast decomposing litter (Semwal et al., 2003). A species
like A. nepalensis highly susceptible to pests and pathogens is not appreciated by local people
because policies do not provide for freedom to farmers to remove diseased trees as well any income
from the wood of such trees.
Carbon stocks Against the net addition of 21 Mg C ha
_1 through manure over 20-year period at the AAL site (124
Mg ha_1 input through manure – 103 Mg C ha_1 output in the form of food, fodder and fuelwood
biomass taken out of the site = 21 Mg C ha_1
), increase in soil organic C stock was only 9 Mg C ha_1
,
indicating a loss of 12 Mg C ha_1
from decomposition of manure favored by high levels of aeration,
lack of moisture stress and abundance of soil biota under ploughed and irrigated soil (Albrecht and
Kandji, 2003; Bhadauria et al., 2012). However, with accumulation of 44 Mg C ha_1 in biomass build
up, there was a net sequestration of 32 Mg C ha_1
at the AAL site. At the HDFL site, with input of C
through manure being just equal to the output through grass taken out of the site, lower biological
activities releasing carbon dioxide from soil due to poor aeration and moisture and nutrient stress
and higher inputs of litter to the soil in the absence of lopping, trees seemed to have significantly
contributed to accumulation of 27 Mg C ha_1
in soil over the 20-year-period. Increase in soil organic
C after tree planting corroborates similar trends reported by others (Paul et al., 2002; Wen-Jie et al.,
2011; Rytter, 2012). C accumulation rate of 1.3 Mg C ha_1 year_1 in complete soil profile (100 cm soil
depth) over 20 year-period at the HDFL site is quite higher than the global average of 0.14 Mg ha_1
year_1 in top 30 cm soil in 19-year-old plantations (Paul et al., 2002) but comparable to 1.4 Mg C ha_1
year_1 in top 20 cm soil in 25-year-old larch plantations in China (Wen-Jie et al., 2011). However,
reports of a decline or insignificant change in soil organic C pool after tree planting (Laclau, 2003;
Jimenez et al., 2007; Potvin et al., 2011) warrant any generalization. Higher rates of soil C
accumulation at the HDFL site with a long history of grazing before treatment compared to the AAL
site do not support the conclusion that afforestation in croplands is more efficient in sequestering C
in soil than in pastures (Guo and Gifford, 2002; Laganière et al., 2010).
Carbon stocks at the AAL or HDFL sites after 20 years of plantation (33–49 Mg ha_1 in soil and 23–48
Mg ha_1
in vegetation) were substantially lower compared to the natural forests in the region (87–
231 Mg ha_1
in soil and 67–137 Mg ha_1
in vegetation) (Sheikh et al., 2009; Sharma et al., 2010; Singh
et al., 2011) suggesting that 20-year-period is too short to fully recover C stocks, as is also the case
with biodiversity (Bhadauria et al., 2012). Higher rates of C sequestration can be maintained by
removing >15-yearold A. nepalensis trees, transforming the wood into long lasting products and
appropriate replacements of the removed trees (Houghton, 2007; Mascaro et al., 2012) along with
reduced risks of proliferation of pests/pathogens associated with this species. Such removals are not
likely to affect forest health adversely (Sharma et al., 2009; Mon et al., 2012). However, policy
interventions would be required to avoid emissions from its use as fuelwood and to enhance wood
processing, crafting and marketing skills of local communities.
Participatory land rehabilitation and its scope of REDD+
In Indian Himalaya where timber trade is banned and local people enjoy practically unrestricted
rights of utilizing non-timber forest products free of any cost and privileges of getting timber
required for subsistence on nominal cost from government forests (Singh et al., 2008), tree planting
confers only indirect and longterm benefits to them. An income of US $ 37 per family_1 year_1 from
carbon sequestration in degraded lands would be too low to mobilize tree planting by individuals or
communities without any external support. Tree-crop mixed systems enabling an income of US $
400–900 family_1 year_1 from the crop component could mobilize farmer-led rehabilitation
initiatives and at the same time sequester as much carbon as the exclusive tree plantations.
Exclusive tree planting in degraded lands is likely to succeed if local people are allowed income from

Final Technical Report: EBLU2012-02NMY-Takeuchi 71
timber (Newby et al., 2012), income from non-timber products are quite high (He et al., 2009; Adnan
and Holscher, 2011) and landless/marginal farmers are provided all basic needs in return of their
labor input (Shankar et al., 1998). For safeguarding the economic interests of the local communities
from tree planting under REDD+ (Hayes and Persha, 2010), changes in the present policies, which
enable local communities to develop tree-crop mixed systems in degraded lands, remove over-
mature/diseased trees and to enhance their capacity of value addition and marketing of forest
products, are required. The trend of narrowing down of the difference in carbon stocks at the two
sites with age highlights the need of appropriate consideration of time scale while determining
payments for ecological benefits from land rehabilitation.
4.0 Conclusions
The project aimed to assess challenges and opportunities of REDD+ for forest communities in Laos
and Thailand, including lessons from past/ongoing forest conservation policies, provide much-
needed scientific evidence on the potential co-benefits of traditional forest management practices
and comparing it with alternative land-uses; and develop participatory community-based MRV
mechanisms for REDD+ to enable local communities to incorporate carbon stocks into their forest
management. In response to the project objectives, the project findings are summarized as follows:
4.1 Participatory assessment of challenges and opportunities
For the first time, the project followed a participatory methodology (working with local
communities) to measure present carbon stocks and past and future likely changes; assess
biodiversity and livelihoods in various land use - land cover types at a village landscape level. The
research results show not only forests, but also other land uses contain rich carbon stocks, including
biomass and soil organic carbon. Maximum carbon storage approaching 300 ton C/ha in the study
site was found in conservation-headwater forest which are never cultivated, with minimum use in
harvesting of timber and other forest products. Carbon storage declined with increasing intensity of
land use, from communally managed utility forests (with 60% of the carbon in conservation forest),
to shifting cultivation fields, to permanent crop field (growing mixture of perennial and annual
crops), to paddy fields (with only 18% of the carbon in conservation forest). As a major land use, the
shifting cultivation combining crop fields and forest fallows holds rich carbon and biodiversity,
supporting local livelihoods. Time-averaged carbon content in a 7-year cycle of shifting cultivation in
the study site in Thailand is as high as 96.95 ton/ha, higher than 65.34 ton/ha in permanent fields
and 49.44 ton/ha in paddy fields. There were 56 species of crops in shifting cultivation. Among
others 17 varieties of upland rice were cultivated in shifting cultivation. The traditional community
forest management at the study site has conserved as wide as 52 % of the village land for forests,
including conservation, utility, community and cemetery with rich carbon stocks of 272.65 ton/ha,
173.59 ton/ha and 154.31 ton/ha respectively. If actions, such as REDD+ are taken to support local
livelihoods for forest conservation, the cycle of forest fallows might become longer to encourage full
regeneration of forests with increasing carbon storage. Otherwise, the cycle of forest fallows would
become shorter with decreasing carbon storage. In spite of remarkable achievements in forest
conservation, “Community Forest Legislation” has not yet become law in Thailand. This absence of
any legal basis is an obstacle to recognize achievements made so far by highland communities and to
promote their conservation activities. Shifting cultivation is still discouraged for expansion of cash
cropping with negative impact on carbon stock and biodiversity in mountainous areas.
Similarly, time-averaged carbon intensity in shifting cultivation in the study site in Laos is not so
much different from the carbon intensity in teak plantations as the former has richer soil carbon
stocks to make up lower biomass above ground. Teak plantations have lower biodiversity and higher
soil erosion compared to fallows. The past land allocation policy at the study site led to zoning of

72 Final Technical Report: EBLU2012-02NMY-Takeuchi
significant fallow areas (old fallows) for forest conservation. As a result, shifting cultivators had to
intensify cultivation within smaller areas zoned for agriculture, leading to short fallows with low rice
yield. Teak production is a profitable land use in the project site. The opportunity cost for protecting
forests from converting to teak plantations ($0.795/t CO2) much higher than that for (upland
rice$0.016/t CO2). Along with discriminate policy against shifting cultivation, the combination of the
low rice yield and the profitable teak production has promoted increasing conversion of short
fallows into teak plantations with negative impacts on biodiversity and soil conservation. Without
REDD+ and other conservation policies, old fallows might be opened for cultivation, leading to loss
of carbon stocks. Implementation of REDD+ and other conservation policies might encourage
conversion of young fallows or cropping fields to old fallows, leading to growth of carbon stocks.
In the associate study site in India, oak forest and home garden had significantly higher carbon
content as compared to other land use - land cover types. Pine forest had similar total carbon
content as compared to irrigated agriculture but significantly higher as compared to rainfed
agriculture, abandoned agricultural land and scrub. Home garden also holds rich biodiversity,
including 17 tree species, 16 herb species and 12 crops. Expansion of homegardens can more than
compensate the losses of carbon occurring through forest degradation leading to deforestation over
a period of time. Conversion of oak forests to pine forests for revenue followed 37% reduction in
carbons stocks. Conversion of rainfed agricultural land to irrigated land will increase soil carbon
stocks together with high food production. The carbon measurement found out that the estimation
of soil carbon was influenced by soil depth. Estimation of litter biomass should also take into account
seasonality. Age of tree plantations was found to influence the rate of carbon sequestration. During
the first-fifteen years of rehabilitation, the abandoned agricultural land site (AAL) site accumulated
aboveground C at a rate 150% higher compared to the scrubland/highly degraded forest land (HDFL)
site. While changes in all aboveground C pools during 16-20 year period were insignificant at the
AAL site, there was a significant but quite slow increase in the tree and shrub C pools at the HDFL
site.
4.2 Potential co-benefits of traditional forest management practices
The project findings from the participatory assessment indicate potential co-benefits of traditional
forest management practices for carbon storage, biodiversity conservation and livelihoods. Land use
intensification or shortening of forest fallow has been the main strategy to cope with population
pressure. With support of REDD+ and other efforts for forest conservation, the cycle of shifting
cultivation might be maintained and even extended to allow full regeneration of forests for carbon
sequestration, conservation of biodiversity, soils and water, and enhancement of local livelihoods.
Cropping systems with short rotations and commercial crop plantations without carefully managed
understory pose a much greater threat to soils than cropping systems under shifting cultivation with
long rotations. Converting land from traditional slash-and-burn production systems to commercial
cash crops such as maize, cassava can result in substantial increases in sediment yields. Favouring
the conservation of fallow-like areas within the landscape would therefore assist in controlling soil
detachment and inter-rill erosion. To meet this challenge, adequate land use management and
practices need to be defined. Among them, the conservation of riparian areas, planned management
of understory, strictly controlled burning, or sufficiently long fallow period within the shifting
cultivation cycle associated with no tillage practices during cultivation should be promoted. The
community forest management has also allocated and maintained a high percentage of the village
land for long-term forest conservation with multiple benefits, such as timber, NTFPs as well as water
sources.
Final Technical Report: EBLU2012-02NMY-Takeuchi 73
Shifting cultivation systems can be sustainable. Rates of sediment generation under the shifting
cultivation systems are well within the bounds of natural replacement. As long as the fallow phase
on the rotation is long enough (8-15 years), and the cropping phase is short (1-3 seasons), these
systems can rejuvenate and remain highly productive. A key to sustaining shifting cultivation systems
is the relative low population density of most upland areas. Depopulation of uplands associated with
urbanization and out-migration for off-farm opportunities will help traditional shifting cultivation
systems to remain sustainable. For these reasons, a review of current policies encouraging the
eradication of slash-and-burn farming systems is warranted. Promotion of commercial cash cropping
systems for maize, cassava should be tied to appropriate conservation methods that minimize
sediment generation. Many simple, inexpensive methods are readily available. However,
conservation policies using these technologies and approaches need to be formulated and enforced.
These may include incentive-based mechanisms such as payments for environmental services (PES)
or a National Soil Conservation Act enforceable through a legal framework and institutions (e.g.,
conservation and extension services). This becomes even more critical in the context of climate
change, when severe extreme events are predicted. Watersheds respond rapidly to changes in land
use. Re-vegetation of catchments either naturally or through plantations will result in declining dry
season water yields. This has significant implications for people in communities and industries who
depend on these flows. Ideally, provisions will be made to ensure the supply of water in light of land
uses in upper catchments. Such provision might include small water storage and supply
infrastructures as well as land uses that are diversified to match upland landscapes. As land-use
changes are often initiated by changes in property rights or market incentives, such instruments will
require an ex-ante impact assessment before being implemented.
Carbon market is volatile and highly risky. It is dangerous to rely on carbon market only for forest
conservation. Other opportunities for forest conservation should be mobilized. The current regional
emphasis on hydropower generation could be undermined by high erosion rates and reservoir
siltation. Hydropower developers could protect their investments through partnerships with upland
communities that offer economic incentives for forest conservation, and the use of conservation
agricultural practices in upland watersheds. Agroforestry system is another important opportunity to
harness various livelihood benefits beyond potential carbon income. The present study in India
shows that tree growth was better in tree crop mixed system with manure and irrigation applied
primarily to benefit crops in abandoned agricultural lands than exclusive plantations in highly
degraded forest lands, the two plantation systems did not differ in total carbon sequestration over a
period of 20 years and the income from carbon sequestration was negligible compared to that from
crops. B. rugulosa, G. optiva, C. australis and F. glomerata seem to be more suitable for planting in
abandoned agricultural lands where amelioration of soil moisture and nutrient stress is feasible, A.
lebbeck, S. sebiferum and P. pashia in distant highly degraded forest lands where such amelioration
is not feasible and A. nepalensis and P. cerasoides in either situation. In biodiversity hotspots like the
Indian Himalaya, where land holdings as well as area of degraded lands available to local people are
small, income from timber is prohibited, natural regeneration of degraded lands is ineffective and
people remain economically marginal, there is an urgent need of policies (i) safeguarding economic
interests of local people from tree planting in degraded lands and (ii) enhancing scientific knowledge
on multipurpose species to strike a better coupling and trade-offs of direct and indirect, short term
and long term and local and global benefits from land rehabilitation.
4.3 Develop capacity for community-based MRV

74 Final Technical Report: EBLU2012-02NMY-Takeuchi
Through the south to south and the south to north cooperation, the project developed a
participatory methodology (see Appendix) and built national capacity for REDD+. The field
assessment involved local communities as well as local officials to develop local capacity. The
research results were shared with local communities and authorities to understand, manage and
monitor forest carbon storage and respond to the REDD+. Good land use practices, such as
understory management, controlled burning, were demonstrated for local communities to enhance
carbon stocks, protect biodiversity, and enhance productivity. Community-based MRV is cost-
effective in ground based measurement, and beneficial to the remote sensing technology-based
MRV. Moreover, local communities can expand their objectives of forest management beyond
traditional scope of forest products to include carbon enhancement. The project findings were
presented to policy makers and reseaerchers at national and international levels. The project
networking with partners in Yunnan of China and Myanmar facilitated development of the new
international project on Sustainable Forest Rehabilitation and Management for the Conservation of
Trans-boundary Ecological Security in Montane Mainland Southeast Asia– Pilot Demonstration
Project of Lao PDR, Myanmar and China/Yunnan (SFR-MMSEA).
hoto credit: Christian
5.0 Future Directions
Ecosystem services (ES) are not well recognized. There is a need to strengthen assessment and
communication of the multiple values of ecosystem services to raise public awareness at all levels.
The scope of ES should be broadened to include multiple values of ES, not limiting to carbon or
biodiversity values. Payment for ES should be also broadened to support multiple values of
ecosystem services, not limiting to carbon. Thus, local communities could benefit from multiple
values of integrated ecosystem management. There are many opportunities to integrate
enhancement of carbon stock, other ecosystem services and livelihood improvement for co-benefits
of the REDD+. Carbon stocks in non-forests and below-ground should be also appreciated to
achieve the integrated ecosystem management at landscape level. Nevertheless, the future studies
are necessary to build on history-tested traditional knowledge for integrated ecosystem
management.
Institutional barriers remain a big challenge even if ES is recognized. The global mechanism for
implementation of the REDD+ remains in discussion in spite of many pilot efforts. Watershed service
is well recognized, but the cooperation between upstream and downstream communities is often
lacking. Inappropriate land tenure is also limiting options for ES-based land management. While
timber tree planting is encouraged in Thailand, farmers are not allowed to harvest and sell the
timber trees. As a result, farmers concentrate on non-timber forest products only and do not like to
plant timber trees in their farms even if tree planting could enhance ES. Cooperation among
different sectors is necessary to promote sustainable forest management. So far, PES, such as
REDD+, is still minor compared to other livelihoods or policy supports. It is important to link PES with
other rural development policies. Development of alternative livelihoods is also very important to
reduce local pressure on natural resources. Development of alternative livelihoods will need
innovations and new business models in marketing of ES. Capacity building of local communities is
also essential to support ground-based MRV. Synergy of remote sensing and community
participation will make MRV more cost-effective.
References Adnan, M., Holscher, D., 2011. Medicinal plants in old-growth, degraded and regrowth forests of NW
Pakistan. Forest Ecology and Management 261, 2105–2114.
Albrecht, A., Kandji, S.T., 2003. Carbon sequestration in tropical agroforestry systems. Agriculture,
Ecosystems and Environment 99, 15–27.

Final Technical Report: EBLU2012-02NMY-Takeuchi 75
Anderson, J.M., Ingram, J.S.I. (Eds.), 1993. Tropical Soil Biology and Fertility: A Handbook of
Methods. CAB International, Wallingford, UK.
Antle, J.M., Stoorvogel, J.J., Valdivia, R.O., 2007. Assessing the economic impacts of agricultural
carbon sequestration: terraces and agroforestry in the Peruvian Andes. Agriculture,
Ecosystems and Environment 122, 435–445.
Bhadauria, T., Kumar, P., Kumar, R., Maikhuri, R.K., Rao, K.S., Saxena, K.G., 2012. Earthworm
populations in a traditional village landscape in central Himalaya, India. Applied Soil Ecology
53, 83–93.
Brown S. 2008. Assessment of the Advantages and Limitations of Ground-Based Surveys and
Inventories. UNFCCC Workshop on Methodological Issues Relating to REDD in Developing
Countries 25-27 June. Tokyo, Japan.
http://unfccc.int/files/methods_and_science/lulucf/application/pdf/080625_tokyo_brown.pd
f.
Bruun, et al, 2009. Environmental Consequences of the Demise in Swidden Cultivation in Southeast
Asia: Carbon Storage and Soil Quality. Hum Ecol (2009) 37:375–388
Cairns M A, Brown S, Helmer E H and Bumgardner G A. 1997. Root biomass allocation in the world’s
upland forests. Oecologia, 111: 1-11.
Champion, S.G., Seth, S.K., 1968. A Revised Survey of the Forest Types of India. Manager of
Publications, Government of India, Delhi, India.
Chave J, Andalo C, Brown S, Cairns MA, Chambers JQ, Eamus D, Folster H, Fromard F, Higuchi N, Kira
T, Lescure JP, Nelson BW, Ogawa H, Puig H, Riera B, Yamakura T. 2005. Tree allometry and
improved estimation of carbon stocks and balance in tropical forests. Oecologia. 145(1):87-99.
Davidson, E.A., Ackerman, I.L., 1993. Changes in soil carbon inventories following cultivation of
previously untilled soils. Biogeochemistry 20, 161–193.
Davidson, R., Gagnon, D., Mauffette, Y., Hernandez, H., 1998. Early survival, growth and foliar
nutrients in native Ecuadorian trees planted on degraded volcanic soil. Forest Ecology and
Management 105, 1–19.
Deans, J.D., Diagne, O., Nizinski, J., Lindley, D.K., Seck, M., Ingleby, K., Munro, R.C., 2003.
Comparative growth, biomass production, nutrient use and soil amelioration by nitrogen-
fixing tree species in semi-arid Senegal. Forest Ecology and Management 176, 253–264.
Dhyani, S.K., Tripathi, R.S., 1999. Tree growth and crop yield under agrisilvicultural practices in north-
east India. Agroforestry Systems 44, 1–12.
Diemont, S.A.W., Martin, J.F., 2009. Lacandon Maya ecological management: sustainable design for
subsistence and environmental restoration. Ecological Applications 19, 254–256.
Dixon, R. K., Brown, S., Solomon, R. A., Trexler, M. C., and Wisniewski, J. 1994. Carbon pools and flux
of global forest ecosystem. Science 263: 185-190.
Farwig, N., Sajita, N., Bohning-Gaese, K., 2009. High seedling recruitment of indigenous tree species
in forest plantations in Kakamega Forest, western Kenya. Forest Ecology and Management
257, 143–150.
Fonseca, F., Figueiredo, Tomas de, Martins, A., 2011. Survival and growth of mixed forest stands
installed in Mediterranen Region: effects of site preparation intensity. Forest Ecology and
Management 262, 1905–1912.
Gaur, R.D., 1999. Flora of the District Garhwal North West Himalaya (with ethanobotanical notes).
Transmedia Publication, Srinagar (Garhwal), India.
Gibbs HK, Brown S, Niles JO and Foley JA. 2007. Monitoring and estimating tropical forest carbon
stocks: making REDD+ a reality. Environ. Res. Lett. 2 045023 (13pp).
Gilmour, D.A., King, G.C., Applegate, G.B., Mohns, B., 1990. Silviculture plantation forest in central
Nepal to maximize community benefits. Forest Ecology and Management 32, 173–186.
Guo, L.B., Gifford, R.M., 2002. Soil carbon stocks and land use change: a meta nalysis. Global Change
Biology 8, 345–360.

76 Final Technical Report: EBLU2012-02NMY-Takeuchi
Hairiah K, Dewi S, Agus F, van Noordwijk M, Rahayu S, Velarde SJ. 2010. Measuring Carbon Stocks
Across Land Use Systems: A Manual. Bogor, Indonesia. World Agroforestry Centre (ICRAF), SEA
Regional Office, Brawijaya University and ICALRRD (Indonesian Center for Agricultural Land
Resources Research and Development) at www.worldagroforestrycentre.or/seaHajjar, R., Jarvis,
D.I. and Gemmill-Herren, B. 2008. The utility of crop genetic diversity in maintaining ecosystem
services, Agriculture, Ecosystems and Environment, Vol. 123 No. 4, pp. 261-270.
Hayes, T., Persha, L., 2010. Nesting local forestry initiatives: revisiting community forest
management in a REDD+ world. Forest Policy and Economics 12, 545– 553.
He, J., Zhou, Z., Weyerhaeuser, H., Xu, J., 2009. Participatory technology development for
incorporating non-timber forest products into forest restoration in Yunnan, Southwest China.
Forest Ecology and Management 257, 2010–2016.
Houghton, R.A., 2007. Balancing the global carbon budget. Annual Review of Earth and Planetary
Sciences 35, 313–347.
Jackson, M.L., 1962. Soil Chemical Analysis. Blackwell, Oxford, UK. Jackson, N.A., Wallace, J.S., Ong,
C.K., 2000. Tree pruning as a means of controlling water-use in an agroforestry system in
Kenya. Forest Ecology and Management 126, 133–140.
Jimenez, J.J., Lal, R., Leblanc, H.A., Russo, R.O., 2007. Soil organic carbon pool under native tree
plantations in the Carbbean lowlands of Costa Rica. Forest Ecology and Management 24, 134–
144.
Johnson, E.A., Miyanishi, K., 2008. Testing the assumptions of chronosequences in succession.
Ecology Letters 11, 419–431.
Kamau D M, Spiertz JHJ and Oenema O. 2008. Carbon and nutrient stocks of tea plantations
differing in age, genotype and plant population density. Plant Soil 307:29–39.
Knapp, B.O., Wang, G.G., Walker, J.L., Cohen, S., 2006. Effects of site preparation treatments on early
growth and survival of planted longleaf pine (Pinus palustris Mill.) seedlings in North Carolina.
Forest Ecology and Management 226, 122– 128.
Kuntadter, P., Chapman, E. and Sabhasri, S. 1978. Farmers in the Forests: Economic Development
and Marginal Agriculture in Northern Thailand. Honolulu: The University of Hawaii Press for
East-West Center.
Kurnianto S. and Murdiyarso D. 2010 Forest carbon database: a Web-based carbon stock data
repository and exchange system. CIFOR, Bogor, Indonesia. 16p.
Laclau, P., 2003. Biomass and carbon sequestration of ponderosa pine plantations and native cypress
forests in northwest Pantagonia. Forest Ecology and Management 180, 317–333.
Laganière, J., Angers, D.A., Parè, D., 2010. Carbon accumulation in agricultural soils after
afforestation: a meta-analysis. Global Change Biology 16, 439–453.
Lamb, D., Gilmour, D., 2003. Rehabilitation and Restoration of Degraded Forests, IUCN, Gland,
Switzerland and Cambridge, UK and WWF, Gland, Switzerland,110pp.
Lamb, D., Erskine, P.D., Parrotta, J.A., 2005. Restoration of degraded tropical forest landscapes.
Science 310, 1628–1632.
Lasco RD. 2002. Forests carbon budgets in Southeast Asia following harvesting and land cover
change. Science in China (series C), Vol. 45: 55-64.
Lee, E.W.S., Han, B.C.H., Corlelt, R.T., 2005. Natural regeneration in exotic tree plantations in Hong
Kong, China. Forest Ecology and Management 212, 358–366.
Liang, L., Shen, L., Yang,W., Yang, X., Zhang, Y., 2009. Building on traditional shifting cultivation for
rotational agroforestry: Experiences from Yunnan, China, Forest Ecology and Management 257
(2009) 1989–1994

Final Technical Report: EBLU2012-02NMY-Takeuchi 77
Liang L., Sengtaheuanghoung O., and Takehashi S. 2010. Land use change, cause, and consequence
in Montane Mainland Southeast Asia: A case study in Northern Laos, in Meeting Climate Change
Challenges in Transboundary Basins: Role of Sciences, CECAR Series No.4, UNU-ISP, Tokyo, Japan,
ISBN: 978-92-808-8027-4
Maikhuri, R.K., 1993. Evaluation of some multipurpose trees in traditional agroforestry of Garhwal
Himalaya. Nitrogen Fixing Tree Research Report 1, 11–13.
Maikhuri, R.K., Saxena, K.G., Rao, K.S., 1995. Experiences in developing a village agroforestry project
in Garhwal Himalaya, India. International Tree Crops Journal 8, 213–221.
Maikhuri, R.K., Semwal, R.L., Rao, K.S., Saxena, K.G., 1997. Rehabilitation of degraded community
lands for sustainable development in the Himalaya: a case study in Garhwal Himalaya, India.
International Journal of Sustainable Development and World Ecology 4, 192–203.
Maikhuri, R.K., Semwal, R.L., Rao, K.S., Singh, K., Saxena, K.G., 2000. Growth and ecological impacts
of traditional agroforestry tree species in central Himalaya, India. Agroforestry Systems 58,
257–272
Mascaro, J., Hughes, R.F., Schnitzer, S.A., 2012. Novel forests maintain ecosystem processes after the
decline of native tree species. Ecological Monograph 82, 221–228.
Mertz, O. 2009. Trend in shifting cultivation and the REDD mechanism. Current Opinion in
Environmental Sustainability. Volume 1, Issue 2, December 2009, Pages 156-160
Mokany K, Raison J R, and Prokushkin AS, 2006. Critical analysis of root-shoot ratios in terrestrial
biomes. Global Change Biolology 12: 84-96.
Mon, M.S., Mizoue, N., Htun, N.Z., Kajisa, T., Yoshida, S., 2012. Factors affecting deforestation and
forest degradation in selectively logged production forests: a case study in Myanmar. Forest
Ecology and Management 267, 190–198.
Mulyoutami, E., Rismawan, R., Joshi, L., 2009. Local knowledge and management of simpukng (forest
gardens) among the Dayak people in East Kalimantan, Indonesia. Forest Ecology and
Management 257, 2054–2061.
Myers, N., Mittermeier, R.A., Mittermeier, C.G., da Fonseca, G.A.B., Kent, J., 2000. Biodiversity
hotspots for conservation priorities. Nature 403, 853–858.
Newby, J.C., Cramb, R.A., Sakanphet, S., McNamara, S., 2012. Smallholder teak and agrarian change
in Northern Laos. Small-scale Forestry 11, 27–46.
Ogawa, H., K. Yoda, K. Ogino and T. Kira. 1965. Comparative ecological studies on three main types
of forest vegetation in Thailand. II. Plant Biomass. Nature and Life in Southeast Asia 4 : 49-80.
Panta, M., Kim, K., Joshi, C., 2008. Temporal mapping of deforestation and forest degradation in
Nepal: applications to forest conservation. Forest Ecology and Management 256, 1587–1595.
Paul, K.I., Polglasc, P.J., Nyakuengama, J.N., Khanna, P.K., 2002. Change in soil carbon following
afforestation. Forest Ecology and Management 168, 241–257.
Piotto, D., Craven, D., Montagnini, F., Alice, F., 2010. Silvicultural and economic aspects of pure and
mixed native tree species plantations on degraded pasturelands in humid Costa Rica. New
Forests 39, 369–385.
Potvin, C., Mancill, L., Buchmann, N., Monteza, J., Moore, T., Murphy, M., Turner, B.L., Wilcke, W.,
Zeugin, F., Wolf, S., 2011. An ecosystem approach to biodiversity effects: carbon pools in a
tropical tree plantation. Forest Ecology and Management 261, 1614–1624.
Rao, K.S., Pant, R., 2001. Land use dynamics and landscape change pattern in a typical micro
watershed in the mid elevation zone of central Himalaya, India. Agriculture, Ecosystems and
Environment 86, 113–124.
Rao, K.S., Maikhuri, R.K., Saxena, K.G., 1999. Participating approach to rehabilitation of degraded
forest lands: a case study in high altitude village of Indian Himalaya. International Tree Crops
Journal 10, 1–17.

78 Final Technical Report: EBLU2012-02NMY-Takeuchi
Rerkasem, K. 2000. Chiang Mai Activity 1999-2000. UNU-PLEC Annual Report. Chiang Mai
University. 52 p.
Rerkasem K., Yimyam N., and Rerkasem B. 2009. Land use transformation in the mountainous
mainland Southeast Asia region and the role of indigenous knowledge and skills in forest
management. In Rerkasem K., Yimyam N., and Rerkasem B., 2009. Forest Ecology and
Management (257): 2035–2043.
Rytter, R.-M., 2012. The potential of willow and poplar plantations as carbón sinks in Sweden.
Biomass and Bioenergy 36, 86–95.
Saxena, K.G., Rao, K.S., Sen, K.K., Maikhuri, R.K., Semwal, R.L., 2001. Integrated natural resource
management: approaches and lessons from the Himalaya. Conservation Ecology 5, 14.
Schroth, G., 1999. A review of belowground interactions in agroforestry, focusing on mechanisms
and management options. Agroforestry Systems 43, 5–34.
Semwal, R.L., Maikhuri, R.K., Rao, K.S., Singh, K., Saxena, K.G., 2002. Crop productivity under
differently lopped canopies of multipurpose trees in central Himalaya, India. Agroforestry
Systems 56, 57–63.
Semwal, R.L., Maikhuri, R.K., Rao, K.S., Sen, K.K., Saxena, K.G., 2003. Leaf litter decomposition and
nutrient release patterns of six multipurpose tree species of central Himalaya, India. Biomass
and Bioenergy 24, 3–11.
Shankar, U., Lama, S.D., Bawa, K.S., 1998. Ecosystem reconstruction through ‘taungya’ plantations
following commercial logging of a dry, mixed deciduous forest in Darjeeling Himalaya. Forest
Ecology and Management 102, 131–142.
Sharma, G., Sharma, R., Sharma, E., 2009. Impact of stand age on soil C, N and P dynamics in a 40-
year chronosequence of alder-cardamom agroforestry stands of the Sikkim Himalaya.
Pedobiologia 52, 401–414.
Sharma, C.M., Baduni, N.P., Gairola, S., Ghildiyal, S.K., Suyal, S., 2010. Tree diversity and carbon
stocks of some major forest types of Garhwal Himalaya, India. Forest Ecology and
Management 260, 2170–2179.
Sheikh, M.A., Kumar, M., Bussman, R.W., 2009. Altitudinal variation in soil organic carbon stock in
coniferous subtropical and broadleaf temperate forests in Garhwal Himalaya. Carbon Balance
and Management 4, 1–6.
Singh, K.A., Rai, R.N., Patiram, Bhutia, D.T., 1989. Large cardamom (Amomum subulatum Roxb.)
plantation – an age old agroforestry system in Eastern Himalayas. Agroforestry Systems 9,
241–257.
Singh, K., Maikhuri, R.K., Rao, K.S., Saxena, K.G., 2008. Characterizing land-use diversity in village
landscapes for sustainable mountain development: a case study from Indian Himalaya.
Environmentalist 28, 429–445.
Singh, S.K., Pandey, C.B., Sidhu, G.S., Sarkar, D., Sagar, R., 2011. Concentration and stock of carbon in
the soils affected by land uses and climates in the western Himalaya, India. Catena 87, 78–89.
Smukler, S., and Palm, C. 2009. Agriculture and Climate Change: An Agenda for Negotiation in
Copenhagen For Food, Agriculture, and the Environment Monitoring, Reporting, and Verification
Methodologies for Agriculture, Forestry, and Other Land Use, International Food Policy Research
Institute (IFPRI), Focus 16 Brief 8, May 2009.
Sokal, R.R., Rohlf, F.J., 1981. Biometry. The Principles and Practice of Statistics in Biological Research.
W.H. Freeman & Company, New York, USA.
Sood, K.K., Mitchell, C.P., 2009. Identifying important biophysical and social determinants of on-farm
tree growing in subsistence-based traditional agroforestry systems. Agroforestry Systems 75,
175–187.

Final Technical Report: EBLU2012-02NMY-Takeuchi 79
Suraswadi, P., Thomas, D. E., Pragtong, K., Preechapanya, P. and Weyerhaeuser, H. 2004. Northern
Thailand: Changing smallholder land use patterns. Agriculture Ecosystems and Environment
104: 355-384.
Takeuchi K, Brown RD, Washitani I, Tsunekawa A, Yokohari M. (eds) 2002. Satoyama: the traditional
rural landscape of Japan. Springer, Tokyo.
Thapa, B., Sinclair, F.L., Walker, D.H., 1995. Incorporation of indigenous knowledge and perspectives
in agroforestry development. I. Review of methods and their application. Agroforestry
Systems 30, 249–261.
Tiwari, M., Singh, S.P., Tiwari, A., Sundriyal, R.C., 2003. Effect of symbiotic associations on growth of
host Coriara nepalensis and its facilitative impact on oak and pine seedlings in the Central
Himalaya. Forest Ecology and Management 184, 141–147.
Tsutsumi, T., Yoda. K., Sahunalu, P., Dhanmanonda, P., and Prachaiyo, B. 1983. Forest: felling,
burning and regeneration. In K. Kyuma and C. Pairitra (eds.). Shifting cultivation. (pp. 13-26).
Tokyo.
van Breugel, M., Hall, J.S., Craven, D.J., Gregoire, T.G., Park, A., Dent, D.H., Wishnie, M.H., Mariscal,
E., Deago, J., Ibarra, D., Cede~no, N., Ashton, M.S., 2011. Early growth and survival of 49
tropical tree species across sites differing in soil fertility and rainfall in Panama. Forest Ecology
and Management 261, 1580–1589.
van Noordwijk, M., Minang, P.A., Dewi, S., Hall, J., Rantala, S. 2009. Reducing Emissions from All Land
Uses (REALU): The Case for a whole landscape approach. ASB PolicyBrief 13. ASB Partnership for
the Tropical Forest Margins, Nairobi, Kenya. Accessible at
http://www.asb.cgiar.org/pdfwebdocs/ASBPB13.pdf
van Oudenhoven, F.J.W., Mijatovic, D., and Eyzaguirre, P.B. 2010. Bridging managed and natural
landscapes: The role of traditional (agri)culture in maintaining the diversity and resilience of
social-ecological systems, in Bélair C., Ichikawa K., Wong B.Y. L., and Mulongoy K.J. (Editors)
(2010).
Walker, L.R., Wardle, D.A., Bradgett, R.D., Clarkson, B.D., 2010. The use of chronosequences in
studes of ecological succession and soil development. Journal of Ecology 98, 725–736.
Wangda, P., Ohsawa, M., 2006. Structure and regeneration dynamics of dominant tree species along
altitudinal gradient in a dry valley slopes of the Bhutan Himalaya. Forest Ecology and
Management 230, 136–150.
Wen-Jie, W., Ling, Q., Yuan-Gang, Z., Dong-Xue, S., Jing, A., Hong-Yan, W., Guan-Yu, Z., Wei, S., Xi-
Quan, C., 2011. Changes in soil organic carbon, nitrogen, pH and bulk density with the
development of larch (Larix gmelinii) plantations in China. Global Change Biology 17, 2657–
2676
Yimyam, N., Rerkasem, B. and Rerkasem, K. 2005. Shifting agriculture in northern Thailand: Land
use changes and alternative management for sustainable production and improvement of
livelihoods. Paper presented at the international workshop on Shifting Agriculture,
Environmental Conservation and Sustainable Livelihoods of Marginal Mountain Societies.
Organized by the Jawaharlal Nehru University (JNU) and the United Nations University (UNU).
6-10 October 2005. National Institute of Rural Development (NIRD), North-Eastern Regional
Centre, Jawaharnagar, Guwa hati, India.
Yimyam, N. 2006. Fallow regeneration and upland rice yield variation in a system of shifting
cultivation with Pada (Macaranga denticulata (BL.) Muell. Arg) as the fallow enriching species
in northern Thailand. Ph.D. Thesis. Chiang Mai University. 285 p.

80 Final Technical Report: EBLU2012-02NMY-Takeuchi
Appendix
Annex 1: Summary report of the inception workshop of the join UNU-CMU-NAFRI project on
“Critical analysis of effectiveness of REDD: for forest communities and shifting cultivation,
based on lessons learnt from conservation efforts in Laos and Thailand”, 17-19 January 2011,
Chiang Mai, Thailand
1. Background
Chiang Mai University (CMU) and United Nations University Institute for Sustainability and Peace
(UNU-ISP), with the support of the Asia-Pacific Network for Global Change Research (APN), jointly
organized the project inception workshop “REDD+ for Forest Communities” in Chiang Mai, Thailand
from 17 to 19 January 2011. The workshop included two days of in-house discussion and one day to
visit the Thai project study site, Tee Cha Village in Sop Moei District, Mae Hong Son Province of the
Northern Thailand.
The objectives of the workshop were
• Review the project goals and expected outcomes
• Discuss and finalize the project methodology
• Discuss and finalize the project workplan and responsibilities
• Initiate the field work in Thailand
Overview of the workshop
Monday 17 January 2011:
• Welcome remarks
• Overview of the project, objective and study site
• Session I: Community-based monitoring of land use and forest
• Session II: Community-based monitoring of land use and forest
• Session III: Payment for ecosystem services and livelihoods
• Session IV: Integration of policy
Wednesday 18 January 2011: Field visit to Ban Tee Cha
• Group meeting with staff and village headman
• Field walk observing village landscape and land use practices
• Meet with village group and local officials to discuss problems, ideas and history of forest
management
Thursday 19 January 2011:
• Review and discussion of the work plan and responsibilities
• Budget
2. Participants
The workshop was attended by
Prof. Theera Visitpanich, Dean, Faculty of Agriculture, Chiang Mai University

Final Technical Report: EBLU2012-02NMY-Takeuchi 81
Prof. Benjawan Rerkasem, Faculty of Agriculture, Chiang Mai University
Prof. K.G. Saxena, School of Environmental Sciences, Jawaharlal Nehru University (JNU)
Mr. Oroth Sengtaheuanghoung, National Agriculture and Forestry Research Institute (NAFRI)
Dr. Narit Yimyam, Highland Research and Training Center, Chiang Mai University (CMU)
Mr. Luohui Liang, United Nations University Institute for Sustainability and Peace
Dr. Shimako Takahashi, United Nations University Institute for Sustainability and Peace
Dr. Jintana Kawasaki, United Nations University Institute for Sustainability and Peace
Ms. Alva Lim, United Nations University Institute for Sustainability and Peace
3. Summary of the Discussion
1. Prof. Theera Visitpanich, Dean of the Faculty of Agriculture, Chiang Mai University warmly
welcomed the participants to Chiang Mai. He highlighted the value of the project and that it
complemented well with recent efforts the University is doing with regards to forest carbon stocks.
2. As Chair of the first session, Prof. Rerkasem emphasized Prof. Visitpanich’s sentiments, and then
invited all participants to briefly introduce themselves before beginning the presentations.
3. In the first presentation, Mr. Liang gave an overview of the new joint project between UNU-CMU-
NAFRI with the support of APN, titled “Critical analysis of effectiveness of REDD+ for forest
communities and shifting cultivation, based on lessons learnt from conservation efforts in Laos and
Thailand”. As explained in the programme and project concept, the project will be of 3 year
duration, starting from 9 December 2010, and would include two project sites: one site in Laos and
one site in Thailand; and two associate sites: one site in India and one site in China.
4. The aims of the Project are to:
(1) Assess the potential social, economic and environmental challenges and opportunities of REDD+
for selected communities in Laos and Thailand. Lessons will be drawn from past/ongoing forest
conservation policies;
(2) Provide much-needed scientific evidence on the potential co-benefits of traditional agro-forestry
practices and comparing it with alternative land-uses; and,
(3) Develop participatory community-based MRV mechanisms for REDD+. With our findings we hope
to assist the pro-poor design and implementation of REDD+, improve the well-being of forests
dependent communities and integrate traditional agro-forestry as a climate change mitigation
agenda.
5. In simple terms, he explained that the core objectives of the project are to identify technological
and policy options and develop national capacity that promote synergies and co-benefits of REDD+
in the management of community forest and agroforest systems in shifting cultivation areas.
Specifically, the synergies and co-benefits, as well as trade-offs could include:
• Food and livelihood security
• Carbon storage enhancement from REDD+
• Biodiversity conservation
• Watershed services
• Enhancing adaptation to climate change
6. Mr. Liang also provided some of the key outputs to be expected from the research project, in
particular: methodologies for comprehensive carbon storage assessment of short, medium and long
forest fallows; quantified comparisons of carbon storage and sequestration of forest-agriculture
82 Final Technical Report: EBLU2012-02NMY-Takeuchi
landscapes; data, research materials and methodologies on estimates of socioeconomic impacts,
biomass and soil carbon, biodiversity, RS/GIS for Laos and Thailand; development of bottom-up
processes in Measuring, Reporting and Verification Systems (MRV); and report and
recommendations for prevention and mitigation of possible adverse impacts of REDD on forest
communities and optimal integration of agriculture-forest management systems into REDD+. Finally,
it is hoped that the project would lead to increased face-to-face engagements between local
communities, policymakers and scientific community on REDD+ and shifting cultivation.
Lao Project Site: Laksip Village, Luang Prabang District, Luang Prabang Province
7. Mr. Oroth Sengtaheuanghoung presented an overview of the Laos project study site: Laksip
Village, near Luang Prabang City in Luang Prabang Province in Northern Laos. Laksip village consists
of 95 households and has a population of 450 people. The major ethnic group is the Khmu (89%),
followed by the Lao Lum (9.5%) and the Hmong (1.5%). The main occupation of the villagers is the
practice of shifting cultivation (62%) with rice, vegetables and livestock as the main source of on-
farm income. However, rice yields (ton/ha) have been declining, particularly during 1990-2009 and
the village is currently undergoing changes in cropping patterns away from rice and towards teak
plantations; from around 10 hectares of teak plantations in 1995 to more than a 100 hectares by
2008. In the same period, the area of rice production has dropped from 60 hectares to a little over
20 hectares by 2008. More notably, the average fallow period for annual crops has dropped from 8
years to 3 years from 1970 to 2009 because land resources for shifting cultivation have been
reduced through the policy implementation. Lack of viable methods to sustain rice yield in the
reduced cycle of fallows, local people are converting their fallows to teak plantation and undertake
off-farm job for cash income to purchase rice.
8. The categorization of land use in Laksip is as follows: Conservation forests (Evergreen, Mix
deciduous, Dry Dipterocarpus forest) are areas designated for protection and conservation of
natural resources ( plant, wild life species, biodiversity), and for cultural, tourism and educational
purposes;
9. Protection forests (Dry Dipterocarpus, Bamboo, and Old fallow forests >10 years) are areas
designated as forest lands for the purpose of protecting watershed areas, rivers, roads, and
controlling of soil erosion, land degradation, etc;
10. Production forests (Bamboo, Old Fallow) are defined as natural or planted forests for utilization
purposes such as for harvesting timber and forest products to meet the social needs and livelihoods
of local peoples; and
11. Production land / Agricultural forests (Teak plantations of ages > 10 years, 5-10 years, and < 5
years, Fallow land, and Annual Crop Fields) is defined as land that can be used for agricultural
production purposes including tree, crop plantation and animal farming.
12. Construction or housing lands are areas where construction is permitted. Construction or housing
lands are areas where construction is permitted.
Thai Project Site: Ban Tee Cha, Sop Moei District, Mae Hong Son Province
13. Dr. Narit Yimyam presented details of Tee Cha Village (‘Ban Tee Cha’ in Thai) in Sop Moei District,
Mae Hong Son Province. It is located 246km from Chiang Mai in the mountains of Northern Thailand,
the village lies at an altitude of 700-900 mean sea level (MSL).
14. The people of Tee Cha belong to the Karen ethnic minority group. There are 48 households with
a population size of 172, and one primary school. All households are involved in subsistence farming
based on short rotational shifting cultivation. Main sources of case income come from cash crop e.g.
chilli, non-timber forest products e.g. mushroom, bee honey, bamboo shoot and bamboo worm, and
wage labour e.g. longan picking.

Final Technical Report: EBLU2012-02NMY-Takeuchi 83
15. The area experiences three seasons: rainy season (June-September), cool (November-February)
and summer (March-May). Average annual rainfall is 2,104 millimetres. Soils are poor loamy clay
with a low pH.
16. One of the challenges faced by the people of Tee Cha is land degradation from deforestation,
and soil erosion and degradation. This has reportedly been a direct consequence of the forced
shortening of the fallow cycle due to reduction of land resources for shifting cultivation through the
policy implementation. This has been part of a long term development strategy by the government
to replace opium production under shifting cultivation with alternative cash crops. Most recently,
the Royal Forestry Department has introduced a law that enforces land restrictions over the practice
of traditional shifting cultivation and expands forest conservation areas. As a result, fallow periods
have been reduced from 10 to 7 years. In addition to this, other pressures from increased
population, unsecure tenure and conservation demands have lead to increased tensions. In order to
cope with the reduced cycle of fallow, local people are innovative to enrich soil through planting of
pada in Thai (Macaranga Denticulate), a tree has led to maintenance of upland rice yield with
enriching property. Rice yields and biomass in the fallow of dense Macaranga are higher than those
in the fallow of sparse Macaranga.
17. Overall, government policies have shown to be the main drivers of land use change in Northern
Thailand. With pressures on land and the absence of legal rights, traditional land tenures have
changed to certain extent. Individual ownerships are becoming the common pattern in agricultural
land. In Karen village, community still maintains traditional decision in managing land for upland
rice. Natural forests are kept under community control in most of the highland villages, regardless
of ethnic background and traditional land management practices.
18. The land use change, especially the reduction of fallow periods and expansion of cash cropping
happening at two above project sites represent a general trend in the Mountainous Region of
Mainland Southeast Asia (MMSEA) home to a rich bio-cultural diversity and source of the Mekong
and other major rivers. The land use change has implications on biodiversity, carbon storage,
watershed service as well as local livelihoods. The project is timely to assess carbon storages under
different land use patterns and to help local community and government to identify synergy
between biodiversity, carbon storage and local livelihoods in the implementation of REDD+.
Session I: Land use and carbon storage dynamics,
19. In this session, Prof. K.G. Saxena assessed land use/ cover change and its implication on carbon
storage using a case study in India. In order to understand the change in time and space, land
use/cover will need to be mapped at 2-3 points of time. Enhancing thematic details, including carbon
stocks in the assessment may be achieved through integrating tools-topographic/revenue/forest
maps as well as remote sensing data, GIS, and plot sampling. Plot sampling can be done through
repeated measurements on a single site, paired sites or chronosequences where neighbouring sites
experienced land use change at different times in the past.
20. Coupling of ecological and socio-economic system is necessary to appreciate trade-offs of carbon
stock dynamics. Assessment of strengths and weaknesses of land use systems and practices will help
find out win-win options to optimize ecosystem functions, ecosystem goods and services, reducing
dependency, increase resilience/resistance of the social-ecological systems. High soil organic matter
stores high carbon, but would not necessarily contribute to the soil quality due to low labile carbon
or to the soil health due to abundance of pathogens. Thus, understanding thresholds is essential in
assessing potential synergy between carbon storage and other ecosystem services. Nutrient transfer
among different land uses, such as from forests to agriculture is important to understand the
landscape process. Environmental science will need to be linked with policy and human dimensions
so as to harmonize diverging goals of different stakeholders.
21. With regard to methods of assessment, Prof. Saxena explained four important components in

84 Final Technical Report: EBLU2012-02NMY-Takeuchi
choice of methods: (a) Phytosociology concerning number, size, shape and distribution of quadrates;
taxonomic resolution; growth forms/life forms and plant functional types (trees, shrubs and herbs -
epiphytes; non-vascular plants), (b) Soil physical-chemical properties concerning bulk density, soil
texture, pH, Cation Exchange Capacity (CEC), water holding capacity, total and/or available nutrients
(major and/minor nutrients), plough layer or multiple layers covering the whole profile, (c) Carbon
calculation concerning biomass component relations between above ground and below ground,
allometry, conversion of biomass to C using 48-50% of oven dry biomass, (d) Land use - land cover
dynamics concerning spatial and temporal scale of observation and mapping, classification scheme
(Level I, II, III), interpretation tools, NDVI etc. Existing methods will need to be reviewed to develop a
suitable methodology for the project.
22. In connection, Prof. Saxena discussed data quality. Accuracy of data depends on definition of
variables, time of measurement and other factors. Choice of methods is affected by costs of
measurement and accessibility of sampling plots affect. He also explained a few common indexes in
assessment, such as (a) Carbon Pool Index (CPI) which is total C of a given land use/Total C of the
reference land use, (b) Lability Index (LI) which is labile carbon content of a given land use/Non-
labile carbon content of a given land use, (c) Carbon Management Index (CMI) = CPI * LI * 100, and
(d) Landscape CMI’ = sum of the products of multiplication of the CMI values of different land uses
and their relative areas (%).
23. Using the case study on Ratgad Watershed in Central Himalaya India, Prof. Saxena illustrated that
the main land use change from 1963 to 2005 was abandonment of some agricultural fields while
forest areas remain unchanged. Intensity of carbon stock in home gardens is more than those in
pine forests and close to those in oak forests. The total carbon in the watershed increased from
1964-2005. However, the total carbon increased from 1964-1998, but declined from 1998-2005.
Session II: Community-based monitoring of land use and forest
24. In this session, Dr. Shimako Takahashi started her presentation on community-based MRV with a
brief review of REDD+ mechanisms. Expanding agriculture is often at expense of forest areas. A
trade-off between agriculture and forestry has to be made, especially new recognition of high
carbon stocks and other values in the forests. REDD+ provides payment to avoid forest conversion to
agricultural and other land uses. The payment from REDD+ has to compete with incentives arising
from forest conversion. Moreover, the REDD+ payment is based on reliable and credible system of
monitoring, reporting and verification (MRV) to assess changes in forest carbon stocks. MRV should
be cost-effective, but also compatible with a multiple levels of payment scheme at global, national,
and local levels.
25. Forest area changes (number of hectare) and carbon stock change estimation/carbon density
(carbon per hectare) will need to be monitored. The measurement is often based on remote sensing
and ground verification. The national forest monitoring system, verification, and reference emission
levels will need to take into account national circumstances. Transfer of scientific measurement to
the MRV system will need to be fostered to develop robust and credible MRV system. MRV at
community-level will need to build on interest and capacity of forest communities and indigenous
people. Capacity development is required to enhance communities in MRV. In addition to carbon
credits for good practices, other incentives should be considered to supporting alternative livelihood
options, enhancing land tenure and local resource rights, intensifying productivity on non forest
lands. Pressure to reduce deforestation needs to be spread across many levels to reduce the burden
on forest communities.
Session III: Payment for ecosystem services and livelihoods
26. In this session, Dr. Jintana Kawasaki’s presentation was focused on concept of opportunity costs
and trade-offs between forests and alternative land uses. The opportunity cost of forest land is
defined as the difference between the benefits provided by the forest and the alternative land uses.
Final Technical Report: EBLU2012-02NMY-Takeuchi 85
Benefits of conserving forest lands would include values of non-timber forest products as well as
credits due to reduced emission from deforestation and forest degradation, and intangible values
due to cultural services and biodiversity conservation. Benefits for alternative land use, for example,
agricultural land uses would include values of agricultural crops and timber harvesting. The credits or
payment from REDD+ as incentives for forest conservation will need to be comparable to the
opportunity cost in order to avoid forest conversion. Dr. Kawasaki noted the presence of shifting
cultivators is not necessarily the cause of deforestation as this still depends on the type of forest.
Therefore, economic assessment is to examine economic profitability of the shifting cultivation and
permanent cultivation, and on the economic adjustment process of how shifting cultivators might
adopt fallow rotation system as a means to naturally improve agricultural productivity. Dr. Kawasaki
has also proposed the work plan to assess opportunity costs. In Year one, assessment would cover
the socio-economic characteristics of people and communities, including cost-benefits for
agricultural production, and the ratio between on-farm and off-farm income, direct and indirect
benefits of forest. In Year two, the investigation will examine and compare the opportunity costs of
alternative land uses with the traditional agro-forestry practices, including values of carbon storage.
In Year 3, appropriate strategy will be recommended for forest conservation to take into account
social and economic benefits and beneficiaries of land uses.
Session IV: Integration of policy
27. In this session, Ms. Alva Lim reviewed the current policy-debate on REDD+ at the international
level and discussed its Implications for our project. Kyoto Protocol only recognizes offsets from
projects that create new forests, not from projects that protect existing ones. As a result of
afforestation and reforestation policies global forest areas expanded, mainly, but global carbon
stocks decreased because of tropical deforestation and degradation. Thus, REDD+ is important to
main forest carbon. The negotiation on REDD+ to be included in the next commitment period (post-
Kyoto 2012) is underway. The COP16 of UNFCCC at Cancun, Mexico, December 2010 has decided to
encourages developing country Parties to contribute to mitigation actions in the forest sector by
undertaking the following activities, as deemed appropriate by each Party and in accordance with
their respective capabilities and national circumstances: (a) Reducing emissions from deforestation;
(b) Reducing emissions from forest degradation; (c) Conservation of forest carbon stocks; (d)
Sustainable management of forest; and (e) Enhancement of forest carbon stocks.
28. There is a debate on national criteria and procedures for establishing reference levels. Historical
baselines need to adjust to ‘national circumstances’. Historical baseline is estimated from past forest
deforestation, forest degradation, carbon degradation (DDD) & resulting greenhouse gas (GHG)
emissions over years. Business As Usual (BAU) baseline is projected emissions from DDD without
REDD+ project. The reduced emission below the crediting baseline/Reference level as benchmark
level (cap) would be entitled to receive credits. Reference level will be affected by national policies,
including economic and rural development goals, land tenure, forestry policies, demographic
policies, agricultural policies and energy policies.
29. Our project goes beyond REDD+ scope as it is currently negotiated not to cover soil carbon and
non-forest land uses. The first step is to understand the current (pre-REDD+) situation and identify
those land uses which are carbon rich and at high risk of conversion to other land uses. The second
step is to project and map land use scenarios with or without REDD+, and compare net emissions
from the land use scenarios with BAU baseline and the project reference level. For example, to
receive carbon credits would require that fallow become longer in Tee Cha or the harvesting cycle of
teak plantations become longer in Laksip. We also need to improve understanding of the drivers of
deforestation/ degradation and local needs to develop other measures to address these root causes
for forest conservation in addition to the carbon credits. Finally, Ms. Lim stressed that project
outputs be fed into the national process.
Field visit to Ban Tee Cha

86 Final Technical Report: EBLU2012-02NMY-Takeuchi
30. The field trip to Tee Cha Village, one of project sites in Northern Thailand offered a good
opportunity for the workshop participants to appreciate different land uses with their ecosystem
services in the village. The village land use pattern is composed of forests, agricultural land under
shifting cultivation, permanent agricultural fields (paddy fields) and village settlements. Forests are
further divided into conservation forest and headwater, community forests, utility forests and
cemetery. The field trip started off with the group meeting with villagers who are used to work with
Dr. Yimyam. These villagers then took participants to observe different land uses in the village.
31. The first land use observed was the utility forests where use of timber may be permitted. The
Dipterocarpus forests are maintained in the utility forests. From point of the utility forests
participants had observed agricultural land under different age of fallow at a distance. These fallows
are largely covered by Macaranga bush to enrich soil in the reduced cycle as previous study
revealed. Forests along the boundary of these fallows were protected to mark land property. Carbon
stocks in the fallows may be determined according to the age of the Macaranga bush. The second
land use observed was paddy fields. Part of paddy fields was already abandoned due to lack of
water. The third land use observed was the community forests in which conversion to bamboo and
coffee plantations are taking place. The fourth land use observed was the conservation forests and
headwater where tree planting had been made to enrich the forests.
32. During the field trip, participants also observed village off-farm activities, such as local rice
whisky making. Finally, participants and villagers wrapped up the field trip at the field demonstration
site of the Royal Forest Department where various tree seedlings were prepared and distributed to
encourage tree planting in the village. Villagers asked participants for advice on combating land
degradation where Macaranga bush was sparse and the possible options for income generation. As
Cassia trees have been already introduced to this village, villagers may try to plant Cassia trees in
those fallows without much Macaranga and coppice them to enrich soils. As there are many orchids
in the village forests and home gardens, identification and cultivation of some medicinal orchids may
help villagers generate alternative incomes in addition to new cash crops such as Arabica coffee
being experimented. Participants appreciated the villagers for their time to share their knowledge
about forests in the village before departure. During the field trip, participants also observed village
off-farm activities, such as local rice whisky making. Finally, participants and villagers wrapped up
the field trip at the field demonstration site of the Royal Forest Department where various tree
seedlings were prepared and distributed to encourage tree planting in the village. Villagers asked
participants for advice on combating land degradation where Macaranga bush was sparse and the
possible options for income generation. As Cassia trees have been already introduced to this village,
villagers may try to plant Cassia trees in those fallows without much Macaranga and coppice them
to enrich soils. As there are many orchids in the village forests and home gardens, identification and
cultivation of some medicinal orchids may help villagers generate alternative incomes in addition to
new cash crops such as Arabica coffee being experimented. Participants appreciated the villagers for
their time to share their knowledge about forests in the village before departure.
Review and discussion of the work plan and responsibilities
33. Discussion on work plan started with review of an overall work plan for three years based on the
project proposal prepared by UNU-ISP (See below). It was agreed that three main outputs will be
achieved in Year One, including (1) Review and harmonization of carbon stock measurement with a
manual, (2) Review of relevant policies on REDD+ and development of communication plan to
participate in the policy process, and (3) Interim reports of carbon stock measurement at project
sites in Thailand and Laos, and associate sites in India and China, including review of secondary data.
UNU-ISP will be responsible for overall coordination of the project while CMU and NAFRI will
manage field activities as well as national coordination. JNU will provide technical support to
develop a manual on carbon stock measurement.
Project Work Plan: The main activities of this project will include

Final Technical Report: EBLU2012-02NMY-Takeuchi 87
Year 1 Inception workshop to finalize agreement on study sites, project strategy and 3 year plan.
National workshop and training on methodology for local communities and authorities. Remote
sensing/GIS for land-use classification and tracking land-use change. Secondary data collection and
census surveys;
Year 2 Household sampling surveys, field and laboratory work, including plot sampling for estimation
of carbon storage intensity. National workshops for mid-term review and preliminary findings.
Community academia engagements for bottom-up development of monitoring, measurement,
reporting and verification (MRV) mechanisms; and
Year 3 Synthesis of project findings. Final international workshop to present findings to local
officials, communities, researchers, policymakers and international community, develop policy
recommendations, and future steps for collaboration.
Accordingly, the project work plan will be as follows:
Year 1 (2010/2011)
Month/Year Detailed Activities
December, 2010 Selection of project sites in Laos and Thailand, and
project associate sites in India and China
January, 2011 Project inception workshop Thailand
March-May, 2011 Collection of secondary data
Assessment of land use and ecological impacts of
land use change by review of secondary data,
including GIS data.
Review of different methodologies for carbon
stocks measurement at landscape level
Review of forest policy of study countries
June, 2011 Project methodology workshop in Laos
July-September, 2011 Pre-test of methodologies for land classification,
carbon stocks measurement at landscape level
November, 2011 Interim Report
Year 2 (2011/2012)
January, 2012 International workshop in Thailand
January-May, 2012 Assessment of carbon storage in each project site
Assessment of socio-economic community impact
and opportunity costs of land use
June, 2012 National Workshop in Laos
July-September Demonstration on good land management,
including fallow enrichment for carbon
sequestration
November, 2012 Interim report
Year 3 (2012/2013)
December, 2012-
April, 2013
Building local capacity in Measurement, reporting
and verification (MRV)
May-July, 2013 Policy Analysis of forest resource management
and REDD+
August, 2013 Final Project Workshop in Thailand
November, 2013 Final Report
34. The discussion finalized the work plan for Year I (See below). From March to June 2011, existing
knowledge and information about the study sites with regards to the biodiversity, carbon stocks,

88 Final Technical Report: EBLU2012-02NMY-Takeuchi
livelihoods, and traditional knowledge in forest, and soil management will be reviewed and
knowledge gaps identified. The methodologies for measurement of carbon stocks (including
biomass above ground, below ground, and soil organic matter) in the forested landscape in the
contexts of national REDD process will be also reviewed. A methodology workshop will be held in
June 2011 to harmonize methods across participating countries as the provisional project
methodology. The provisional methodology will be then tested and finalized from July to September
2011. The pre-test will cover classification of land use and land cover, and sampling of plots in
different land use and land cover categories. The land use and land cover mapping and carbon stock
measurement in different land use/land cover categories will be carried out based on the approved
project methodology from July to November 2011 and will continue in Year 2. From March to
October 2011, all relevant policy for national REDD+ implementation will be reviewed and
synthesized to help develop a communication plan for policy impact. After the work plan for Year
One was finalized, the project budget was also agreed among project partners to implement the
work plan for Year One. The project methodology workshop has been proposed to take place in
Luang Prabang, Laos in June 2011. This forthcoming workshop will discuss the carbon stocks
measurement at landscape level and to harmonize the national methods for a project methodology
for comparable measurement across the study sites in Thailand and Laos as well as associate sites in
India and China.
35. Finally, the workshop was closed with Dr. Takahashi’s remarks to thank CMU’s excellent
organization of the workshop as well as valuable inputs of all workshop participants.
Detailed national work plan for Year I will:
Month/Year Detailed Activities Proposed Outcome
December, 2010 Selection of project sites (one site in Laos
and one site in Thailand) and associate sites
(one site in India and one site in China)
through meeting with national coordinators,
the meeting plan were:
December 13, 2010 Selection of Project
site in Laos; December 20-23, 2010 Project
site in Thailand; and December 24, 2010
Associate site in India
Two project study sites and
two associate sites
January 17-19, 2011 Project Inception Workshop in Chiang Mai,
Thailand
The project goals and
expect outcome of project,
different project
methodologies for each
country, work plan, and
responsibility
March-May, 2011 1) Data collection
2) Assessment of land use and impacts of
land use change by using of GIS data base
3) Review and harmonization of
methodologies for carbon stocks
measurement at landscape level
1) Data sets for project
sites including
methodologies of carbon
measurement, fallow
management, land use of
forest, forest community,
forest policy, and etc.
2) Comparison of land use
and impacts of land use
change between forest
land and agricultural land
3) Appropriate
Final Technical Report: EBLU2012-02NMY-Takeuchi 89
methodologies of carbon
measurement across the
region
June 27-29, 2011 Project methodology workshop in Laos Different methodologies
harmonized for carbon
stocks measurement for
each project site, and
project work plan updated
July-September, 2011 Pre-test of methodologies for land
classification, carbon stocks measurement
at landscape level
Land use classification and
carbon storage for each
project site
March to October, 2011 All relevant policies for national REDD+
implementation will be reviewed and
synthesized to help develop a
communication plan for policy impact
A communication plan for
policy impact
November 15, 2011 Preparation of project activity reports and
detailed financial reports in Laos and
Thailand, and summary reports in India and
China
Tentative interim project
report
Annex 2: Summary report of project methodology workshop on “REDD+ for forest
communities: Learning from forest conservation in Laos and Thailand”, 19-21 June 2011,
Luang Prabang, Laos and working manual for carbon stock estimation
2.1 Summary report of project methodology workshop
1. Background
National Agriculture and Forestry Research Institute of Lao PRD (NAFRI) and United Nations
University Institute for Sustainability and Peace (UNU-ISP), with the support of the Asia-Pacific
Network for Global Change Research (APN), jointly organized the project methodology workshop
“REDD+ for forest Communities” in Luang Phabang, Lao PDR from 19 to 21 June 2011 to bring
together experts from UNU, Laos, Thailand and India and discuss the carbon stocks measurement at
the landscape level. The workshop included two days of in-house discussion and one day to visit the
Lao PDR project study site, Laksip Village which is located at ten kilometres from Luang Phabang City
in the Northern Lao PDR.
The objectives of the workshop were 1) review different methodologies for carbon stocks
measurement at landscape level, including the proposed methodology for each project site; 2)
discuss and harmonize different methodologies as the project methodology; 3) initiate the field work
in Laos; and 4) review project progress and plan forward.
Overview of the workshop
Sunday 19 June 2011:
� Welcome Remarks
� Overview of the project workshop and brief introduction to the associate project site in China
� Discussion of the work plan forward Session III: Proposed methods for carbon stocks
measurement in Laos project site
Monday 20 June 2011: Field visit to Laksip Village

90 Final Technical Report: EBLU2012-02NMY-Takeuchi
� Field walk observing village landscape and land use practices in both northern and southern
parts of the Village
� Discussion of sampling methods in each land use practices for carbon stock measurement in the
Village
Tuesday 21 June 2011:
� Harmonize and propose provisional project methodology with a special reference to Laksip
Village site
� Discussion of the work plan forward
2. Participants
Name Organization
Prof. Kazuhiko Takeuchi UNU-ISP
Mr. Luohui Liang UNU-ISP
Dr. Jintana Kawasaki UNU-ISP
Prof. K.G. Saxena Jawaharlal Nehru University
Prof. Kottapalli Sreenivasa Rao University of Delhi
Mr. Oloth Sengtaheuanghoung National Agriculture and Forestry Research Institute
Mr. Aloumsawath Chanphengxay National Agriculture and Forestry Research Institute
Mr. Saysama Inthavong National Agriculture and Forestry Research Center
Dr. Narit Yimyam Chiang Mai University
Ms. Utumporn Chaiwong Chiang Mai University
3. Summary of the Discussion
1. Mr. Oloth Sengtaheuanghoung, the Deputy Director of NAFRI-ALRC on behalf of NAFRI’s Director-
General warmly welcomed the participants to Luang Phabang and gave a brief outline of the
workshop agenda.
2. The official welcoming remarks were given by Prof. Kazuhiko Takeuchi, Vice-Rector, United
Nations University/ Director, Institute for Sustainability and Peace. He highlighted decisions of
COP10/CBD and COP16/UNFCCC with regard to REDD+ and emphasized a particular need to
integrate climate change and biodiversity policies, and to establish effective international
frameworks on adaptation and REDD+ as well as that on mitigation.
3. Following the opening session, Mr. Luohui Liang, UNU-ISP, gave an overview of the workshop
objectives in the context of the project works plan in 2011 and stressed that the project
methodology need to conform to international standards as well as adapt to local circumstances of
project sites.
4. The project work plan in 2011 is to:
(1) Different methodologies for carbon stocks measurement at the landscape level (i.e. to
estimate carbon stocks above and below ground in different land uses in the landscape)
need to be harmonized as the project methodology and applied in the project sites in
Thailand and Laos, as well as the associate sites in India and China so that findings from
different countries can be compared and synthesized at the regional level;
(2) Carbon stock at landscape level at all project sites will be measured along with land use
mapping;
(3) Ongoing policy development on REDD+ in each country will be reviewed and synthesized to

Final Technical Report: EBLU2012-02NMY-Takeuchi 91
develop a policy action plan so that project findings will be fed into the national process.
5. Mr. Liang explained the project concept and expected outcomes, including the methodology for
the landscape level carbon stocks measurement, which is the main focus of this workshop. He also
reviewed the 3 years of research design to identify co-benefits and synergy of forest carbon
management and local livelihoods. He introduced two project sites where shifting cultivation is
practiced: one site in Northern Laos and one site in Northern Thailand, and two associate sites: one
site in North India and one site in Southwest China.
6. He also presented a brief introduction to the land use system in the Mangjing Village, the
associate study site where tea production is the main source of income. There are two major types
of tea production: one is traditional tea forests where tea is cultivated in natural forests and other is
modern tea plantation on the terraces. These two types of tea production contrast in terms of
carbon storage, biodiversity and sustainability. Recent appreciation of tea from the tea forests has
helped revival of the traditional practice.
Session I: Carbon stocks measurement at landscape level with special reference to India
7. In this session, Prof. K.G. Saxena explained carbon stock estimation using a case study in India.
Coupling of ecological and socio-economic system is necessary to appreciate trade-offs of carbon
stock dynamics. Assessment of strengths and weaknesses of land use systems and practices will help
find out win-win options to optimize ecosystem functions, ecosystem goods and services, reducing
dependency, increase resilience of the social-ecological systems. Thus, implementation of national
policies and measures and national strategies or action plans that could involve further capacity
building, technology development and transfer, and results-based demonstration activities.
8. With regard to methods of carbon assessment, Prof. Saxena explained two measures: (1)
measuring the stocks at two points of time; and (2) measuring the fluxes over a period of time.
9. Prof. Saxena discussed the following in details:
(1) In order to understand the change in time and spaces, land use/cover will need to be mapped
through tools of RS/GIS. Plot sampling can be done through repeated measurement at different
times. Through systematic sampling and stratified sampling, the assessment of carbon stock needs
to cover carbon pools in aboveground biomass, roots, litter, and soil in different land uses in the
village landscape.
(2) The assessment will also include participatory land use mapping and carbon inventory,
identification and selection of land holdings having all land use/cover classes and covering the village
landscape variability.
10. Aboveground biomass of woody plants (DBH.=>10 cm) is normally estimated through allometric
model. The root biomass may be estimated as a percentage of the aboveground biomass. Biomass of
understorey species with a DBH<10 cm is estimated by destructive sampling with a sample of
material oven dried and weighed. Dead wood may be estimated to take into account the dropping of
leaves. In conclusion, there is no universal standard for estimating biomass or carbon of a tree,
which depends on local circumstances as well as availability of resources.
11. Prof. K.S. Rao discussed reduction of the emissions from deforestation and forest degradation
(REDD+) with Indian case studies and potential REDD+ activities to increase carbon stocks or to avoid
loss of carbon stocks in the forested landscape in the Indian Himalaya. . He explained diversity of
the Himalayan ecosystems covers a wide range of mixed land uses under the categories of forests,
settled farming, shifting agriculture and home gardens. Biomass measurement in these land uses
often integrate different tools-remote sensing, on the ground verification, and stratified mapping.
12. Prof. Rao highlighted possible options for improvement of degraded ecosystems, including
replaced ecosystem with creation of alternative ecosystem, and rehabilitated ecosystem with
several components resembling original ecosystem. Recent conversion from traditional land use

92 Final Technical Report: EBLU2012-02NMY-Takeuchi
system to intensive wet paddy field and tree crop plantation will have significant impact on
biodiversity as well as carbon stocks in the landscape.
Session II: Proposed methods for carbon stocks measurement in Thailand project site
13. In this session, Dr. Narit Yimyam started his presentation on an overview of the land use system
in the Thailand project study site: Tee Cha Village in Sob Moei District in Mae Hong Son Province.
The land use system is composed of forests (conservation & head water forest, community forest
and utility forest), agricultural land (shifting cultivation, permanent fields and paddy fields) and
village settlement. He also explained tenure arrangement for each land uses.
14. Dr. Narit then explained the methodology the Thai team is using to measure carbon stocks in
different land uses. Carbon storage in the forests was estimated as follow: Carbon storage = plant
biomass x 0.5. Biomass of large tree (> 1.5 m high and diameter >15 cm girth at breast) was
calculated by allometric equation: Tsutsumi et al. (1983) for hill evergreen; Ogawa et al. (1965) for
dry dipterocarp, while small tree (>1.5 m high and diameter < 15 cm girth at breast) were measured
by destructive sampling, i.e. cutting every plants at ground level in the area 2 m x 2 m. Plants were
weighted directly and sub-sample of 3 kg was taken for oven dry at 80 o c for 48 hr for moisture
content and biomass. Carbon stocks in agricultural land were also estimated by destructive
sampling. Soil carbon storage was estimated based on the soil organic matter collected from the soil
depth 0-30 cm. Carbon Storage (Cs) = 58% Organic matter x Soil mass in which Soil mass = Soil bulk
density (g/cm3) x Area (ha) x H Soil depth (cm).
15. With carbon storage of Thai forest above ground, Dr. Narit reviewed some previous studies and
illustrated that it depended on type of forest. The total carbon in dry evergreen forest is about
70.29± 7.38 ton per ha, but hill evergreen is 142.32+3.36 ton per ha. He also explained amount soil
carbon depend on type of land use such as 270 ton per ha for virgin forest, 200 ton per ha for second
forest, and 80 ton per ha for crops. Results of this study will be compared with previous studies.
Session III: Proposed methods for carbon stocks measurement in Laos project site
16. In this session, Mr. Oloth Sengtaheuanghoung purposed the methods for the Laos study site.
Using the case study on Nam Theun study site in Laos, two types of organic carbon stock could be
distinguished: the above ground (including living biomass of tress, bamboos, lianas and dead
biomass) in sample plots- 10 m x 10 m in size, and the below ground (roots). The assessment of the
vegetation distribution was carried out on the basis of a 2,000 spot image in village with 1:35,000
map for ground check. The 9 sampling points per vegetation type were chosen. As result, the
thickness of soil layers consider for the calculation of below ground organic carbon stock was not
clearly defined that carbon stock was calculated down to 30 cm.
17. The methods for carbon stocks measurement in Laos project site: Laksip Village will depend on
type of land use/cover. The currently total land area of Laksip is 1,746 ha consisting of three main
land use types: forest land (including conservation forest, protection forest and production forest),
production/agricultural land (crop production), and residential land. According to local terminology,
forest land includes conservation forest, sacred forest, cemetery forest, and young forest while
agricultural land includes old fallow forest, rotated fallow land, sifting cultivation, garden, and fish
pond. For carbon stock measurement, conservation forest, sacred forest and cemetery forest are
grouped as dense forest. The teak garden is divided into young teak 1-5 year old, medium teak 5-10
year old, and mature ld teak >10.
18. Biomass of large trees will be measured through allometric equation. Biomass of tree seedlings
and other shrubs, herbs etc. will be determined by destructive sampling , i.e. cutting off the ground
level. Plants were weighted directly and the data were med to estimate above ground biomass. Soil
carbon stocks and fluxes in Laksip will be estimated based on soil organic matter. Mr. Oloth
presented shifting cultivation could contribute to soil carbon storage. When plots were cleared and
burned, 20 grams of carbon per kg of soil as biochar could get into soil profile.

Final Technical Report: EBLU2012-02NMY-Takeuchi 93
19. Over 900 plant species are found in Laksip study site. Diversity indices were derived in order to
compare the species richness, distribution and evenness in different land uses.
Field visit to Laksip Village
20. The field trip to the Laksip Village offered a good opportunity for participants to observe
different land use and land cover and assist Lao researchers in designing the forthcoming field
survey of landscape-level carbon stocks. The customary land use/land cover classification is used for
stratification of the village landscape for sampling survey to better engage local communities in
monitoring of carbon stocks in their land management.
21. The first land use observed was the production land. Annual cropping took place within a
rotational shifting cultivation system. The main crop included upland rice for subsistence as well as
maize and vegetable production (chilli, beans and parsleys)., Participants observed teak plantations
in village. Teaks play very important role in contributing to household source of income. As it is in
the rainy season, farmers have already sown upland rice. Rice usually is sown conventionally with
dibbling stick with traditional rice varieties. Harvesting will start on October or early September. The
second land use observed was the production forests where teak plantation area has been
expanded.
22. During the field trip, participants also discussed on land use classification for carbon stock
measurement, and laying sample plots-20 m x 20 m in natural forest and 10 m x 10 m in plantations
and all other land use/cover classes. Number of plots in each land use will be based on (a) resource
availability and accessibility, (b) relative area of different land use-more plots in more extensive land
use, and (c) variation within land use.
Reviews and discussion of the work plan and responsibilities:
23. With reference to Laksip village, Prof. Saxena finalized land use classification and methodology
on carbon stock measurement as follows:
(1) Forest
• Dense forest -Conservation, Sacred forest, Dense forest, and Cemetery forest
• Open forest-Young forest
(2) Shifting cultivation
• Shifting cultivation abandon fields-old fallow land
• Shifting cultivation current fallow-rotated fallow land
• Shifting cultivation cropped field – shifting cultivation (Hai)
(3) Forest plantations-teak gardens(Suan maysak)- Teak 1-15 years
• Young teak 1-5 years
• Medium teak 5-10 years
• Old teak-more than 10 years)
(4) Horticultural plantations-banana garden (2-3 years)-pine apple garden (Suan Kuay, maknut)
24. Enumeration of mature live trees in 20 m x 20 m or 10 m x 10 m plots, Prof. Saxena suggested to
start from one corner of the plot and also explain GBH and DBH and a few common indexes in
assessment such as (a) Convert GBH to DBH, for dicot trees Y = exp{-2.134+2.530 x ln (D)} where Y =
tree biomass/kg; D: DBH in cm (FAO, 2004), (b) Radius = 10/2 = 5 cm, (c) Circumference/ girth = 2 x
3.14 x 5 = 31.4 cm (2 πR), (d) Basal are area = 3.14 x 5 x 5 = 78.5 cm2
(πR2), (e) Determine biomass of
each tree, species, all live trees in plot.

94 Final Technical Report: EBLU2012-02NMY-Takeuchi
25. Enumeration of saplings: girth < 10 cm and nest a quadrate of 5 x 5 m size within 20 x 20 m or 10
x 10 m quadrate. We can use tape for measuring girth or calliper for measuring diameter. The shrubs
will use the quadrates laid for sapling enumeration through count number of individuals by species
as: harvest 10% of individuals of species; take fresh weight of the harvested individuals (x kg); take a
sample of fresh biomass (y kg); dry in oven at 8o deg C for 48 hours.
26. The litter (dead plant material lying on the ground) biomass will be collected in the plots laid for
herbaceous biomass estimation as follows: segregate litter into woody and non-woody fractions;
take fresh weight in the field; take samples for determining dry weight; determine dry woody and
non-woody litter biomass on per ha basis.
27. The soil will take soil of 0-30 cm horizon. One composite sample from each 20 m x 20 m or 10 m
x 10 m plot will determine for bulk density, soil organic carbon by Walkley-Black method (room
temperature), soil organic carbon on per ha basis (=%C x Bulk density x 30 cm x 100 cm x 100 cm =
g/m2 convert to ton/ha)
28. The root biomass will be estimated by using available regression to determine root biomass as a
percentage of the aboveground biomass. The conversion to carbon stock will take 50% of oven dry
biomass as carbon content in oven dried plant biomass. Prof. Saxena will also summarize the
methodologies based on this workshop and previous study of India, and to draft a project manual for
all researchers by the end of June.
29. The provisional carbon stock measurement of Laos study site will be then tested in 7-13 July
2011. The pre-test will cover land use classification, and lay sample plots. The Thai team (Dr. Narit
and Ms. Utumporn) will provide technical support to the field survey in the Laos study site.
30. The policy reviews with policy action plans are expected to complete on November 2011.
31. Finally, the workshop was closed with Prof. Saxena’s remarks to thank everyone for their effort
and hard work in making the workshop and discussion fruitful and successful. Dr. Jintana Kawasaki,
UNU-ISP, appreciated NAFRI for excellent organization of the workshop as well active contributions
from participants.
2.2 Working manual for carbon stock estimation
Keeping in view the time frame of the project, resource availability and local people-focus of the
UNU-APN-REDD project, it was agreed that village landscapes, covering an area of 1,000-5,000 ha
would constitute the spatial scale of operation/observation in each site.
Village landscapes, very often superimposed over natural regions like micro-watersheds, will be
appropriate for understanding existing land use practices in relation to climate change mitigation
and learning from as well as educating marginal mountain farmers to new opportunities of economic
development by maintaining/enhancing carbon stocks, biodiversity and tree cover. Nevertheless, an
overview of regional/national scope of responding to REDD+ as international programme would
always be in the background. Thus, the village landscape scale observations/data/methods will be
put within the context of national/international programmes and activities relevant to REDD+.
The village landscape analysis would aim to answer the questions: (i) which land uses encompass
high levels of carbon stocks and what are the rates of losses or gains in carbon associated with
different land use/management changes? (ii) what are the factors driving conversion of high carbon
stock land uses to low carbon stock land uses? and (iii) what opportunities are available for
promoting conversion of low carbon stock land uses to high carbon stock land uses?.
Though all sites (Lao, Thailand, China, and India) sites are located in marginal mountain areas, sites
vary in terms of biophysical, socio-cultural and policy factors. A synthesis of studies carried out in
different sites is likely to facilitate exchange of good practices between countries and to avoid
environmental costs incurred in one country in the past in the other countries at present/future in
addition to recommendations and conclusions applicable on a larger regional scale.
Final Technical Report: EBLU2012-02NMY-Takeuchi 95
The study would bring out for each site at least : (1) land use/cover map of the selected village
landscape at 1:10,000 to 1:1,000 scale, (2) area of each land use/cover type, (3)
pathways/trajectories of land use changes and factors driving them, (4) carbon density (tons C/ha) in
each land use/cover type and (5) key land use decisions/factors favouring
maintenance/enhancement of carbon stocks, biodiversity, sustainable land management and well-
being of people.
Broad steps in
methodology
Details
1. Identifying and
mapping land
use/cover types in
the landscape:
stratification of
landscape into
different classes
differing in terms of
C stocks
The core aim of this step is to classify a
landscape in land use/cover types more
uniform in terms of attributes determining
carbon stocks.
The number of land use/cover classes would
depend based on the nature and magnitude of
heterogeneity within a given landscape, scale
of mapping and technique of mapping.
To illustrate, in the Laksip village in Lao PDR,
the land use classes would encompass (i).
Natural forests: dense (crown > 60%), (ii)
Natural forests: open (crown cover 20-60%),
(iii) Teak plantations: old (> 10-year-old), (iv)
Teak plantations: middle-age (5-10-year-old),
(v) Young plantations: young (< 5-year-old)
(with or without intercropping of annual crops),
(vi) Abandoned shifting agriculture, (vii) Current
fallows:1-2-year old, (viii) Current fallows: 3-4
years old, (ix) Cropped fields: annual crops
(without teak), (x) Cropped fields: perennial
crops.
If national forest cover maps are available, it
may be useful to develop classification schemes
close to the widely applicable national
schemes. For example, if the national scheme
considers 30-70% as moderately dense and >
70% crown cover as dense forest, it may be
appropriate to adopt these limits for
classification in village landscape too.
Customary classification schemes need to be
taken in account so as to better facilitate
participation of local communities in mapping
and monitoring land use/cover and carbon
stocks.
It would be useful if land tenure/right

96 Final Technical Report: EBLU2012-02NMY-Takeuchi
system/management system is also mapped
(e.g., a map depicting distribution of
production, protection and conservation
forests in Laksip). By superimposing land
tenure/management system type map, one can
find out which tenure/management system is
more effective in enhancing carbon stocks.
Based on participatory discussions, the land
use/cover stages preceding the present ones
and probable reasons of changes should also be
identified. To illustrate, there could be three
patches of permanently abandoned shifting
cultivation land similar in terms of land cover
but different in terms of land use histories, with
depletion of soil fertility forcing abandonment
in one patch, weed infestation in the second
patch and land allocation policy forcing
abandonment in the third patch.
Area (ha) of each land use type/subtypes
should be estimated.
The country team can take final decision on the
scale of mapping 1: 10,000 to 1: 1,000 and
mapping technique (participatory mapping,
interpretation of satellite data, interpretation
of aerial photographs)
2. Deciding size and
number of plots for
estimating carbon
density in each land
use/cover type:
The past studies suggest a minimum plot size of
400 m2
(20 m × 20 m) in natural forests and 100
m2 (10 m × 10 m) in plantation forests for
enumeration of trees, of 25 m 2
(one 5 m × 5 m
quadrat) nested in the central area of tree plot
for shrubs and 1 m 2 (5 quadrats of this size,
one each around central and corner points of
the tree-plot.
The plots should be located in the central
portion of a land use patch.
If a land use is represented by several patches,
as many patches as possible (preferably all)
should be sampled.
If a size of a patch is smaller than the size of
tree plot, the whole patch should be analyzed
and its area recorded.
Sampling intensity/number of plots would be
guided by desired level of confidence level,
Details of statistical
analyses (confidence,
standard error, etc)
will be placed in
annexure: this is being
prepared and will be
circulated at a later
stage

Final Technical Report: EBLU2012-02NMY-Takeuchi 97
usually the observed mean lying within 10-20%
of true mean with 95% confidence interval. To
illustrate, if we get a mean biomass value of 20
t/ha and standard error of mean of 1.2 t/ha
based on observations recorded in 17 plots (n
=17), we are 95% confident that true mean lies
between 22.544 t/ha [20 + {2.12 (t value at P =
0.05 and df 16) × 1.2}] to 17.456 [20 - {2.12 (t
value at P = 0.05 and df 16) × 1.2}]. 22.544 and
17.456 in the present case mean 95%
confidence limits and the range 22.544-17.456
95% confidence interval.
The number of plots to be sampled could be
determined by finding out variability within a
land use based on past studies and, in the
absence of past studies, on a quick small scale
sampling (say 3-5 plots) in a given land use:
Number of desired sample plots (n) = (t × s/E)2
or E = 2 × s/square root of n; E, desired half-
width of the confidence interval = mean ×0 .1
or 0.2 (10 or 20% precision); t = 2 (sample size
is unknown); S = standard deviation.
For example, if mean = 50 t/ha; S = 10 t /ha;
desired precision = within 10% of the true
mean; then E = 50 × 0.1 = 5, n = (2 × 10/5)2 = 16
plots.
The project areas in the present case are such
that quite reliable carbon stocks could be
estimated based on observations in sampling at
4-8 plots in each land use/cover type.
Nevertheless, all areas being located in difficult
mountain terrains, number of plots would,
apart from statistical considerations, be guided
by, resource availability, accessibility. One may
start with enumerations in 4-5 plots in each
land use, determine standard
deviation/coefficient of variation and increase
number of plots in land uses with high degree
of variation such that standard deviation is less
than 30% of the mean.
3. Estimating
aboveground
biomass of live trees
(DBH > 5 cm or 16
cm CBH/GBH,i.e.,
3.14 × 5 or basal
area of 19.6 cm2,
Mark location of a plot in map, Measure and
note down the slope of the plot (for applying
slope correction at the end), average height of
trees and crown cover: (in case of plots laid in
forests)
Start from one corner of the plot
Start from one corner
of the plot
Note down the name
of species (scientific
and local name) and
CBH tree by tree

98 Final Technical Report: EBLU2012-02NMY-Takeuchi
i.e., 3.14 × 2.5 × 2.5)
Note down the name of species (scientific
name, local name and local uses) and CBH/GBH
(circumference or girth at breast height) tree by
tree
Take some measure to avoid duplication, e.g.,
by marking a tree after noting down its GBH
Measure tree height if it figures as an
independent variable in the regression
equation decided to be used for biomass
estimation. In most of the tree species in the
project sites relationship of aboveground with
DBH/CBH/basal area is likely to be as strong as
with DBH2 × height and hence measurement of
height may not be needed. Country teams need
to decide on the regression equation to be
used. However, in case of palms and bamboos
height is often more strongly correlated with
biomass than DBH and hence height
measurement for these species would be
necessary.
Drawing allometric regression equations
(statistical relationships between easily
measurable tree attributes with biomass drawn
based on harvesting of trees covering the
whole range of variation in tree size) for each
site would provide the most accurate estimates
of biomass as the nature and strength of
biomass – DBH and/height relationship varies
by species, climate, soil properties and
management practices. However, this may not
be feasible within the time and resource
constraints imposed by the project on one
hand and site/country-specific constraints on
the other. A proper choice of available
regression equations may provide estimates
with reasonable accuracy, a viewpoint also
reflected in guidelines issued by organizations
like FAO, GEF and IPCC. The country team
should choose the regression equations which
have been derived by others but in
climatic/ecological conditions quite close to the
project site. Some of the relevant available
equations have been compiled in Table 1, while
Table 2, giving an example, illustrates a wide
range of variation in aboveground biomass
estimates derived from different regression
equations.
Take some measure to
avoid duplication –by
marking trees after
noting down the GBH
Convert GBH to DBH
or basal area
depending on the
requirement of
regression equations:
For dicot trees:
Y = exp{-2.134+2.530
× ln (D)} where Y =
tree biomass/kg; D:
DBH in cm (FAO,
2004)
Determine
aboveground biomass
of each tree in the
plot
Determine biomass of
each species in the
plot
Determine biomass of
all live trees in plot
Determine biomass on
per ha basis

Final Technical Report: EBLU2012-02NMY-Takeuchi 99
Determine aboveground biomass of each tree
in the plot
Aggregate individual tree biomass values by
species in the plot to get aboveground biomass
of a species in the plot
Sum up biomass of all species to get total
aboveground live tree biomass in the plot
Apply slope correction: work out true
horizontal length for the length of the plot
along slope as Length along slope x Cos of angle
of slope (degree).
Slope corrected area of rectangular plot =
Width x horizontal length
Slope corrected area of a circular plot = 3.14 ×
actual radius x horizontal radius
Determine biomass on per ha basis from the
plot level values. For example if slope corrected
area of the plot is 250 m2, biomass of trees in
the plot is 10 t, biomass per ha would be
(10,000/250) × 10 = 400 t/ha
4. Estimating
aboveground
biomass of dead
trees
Determine tree wise, species wise and total
biomass as in the case of living trees.
Reduce biomass by 10% to account for the loss
of leaves, twigs and branches (Delaney et al.,
1998).
Apply slope correction and determine biomass
per ha
5. Estimating
biomass of lianas
As in case of trees, except for use of regression
equations drawn for lianas
6. Estimating
biomass of saplings
(individuals of tree
species with
GBH/CBH < 10 cm
Nest a quadrat of 5 m × 5 m size within 20 m ×
20 m or 10 m × 10 m quadrat
Start from one corner of the nested quadrat
Using a caliper, measure basal diameter
(diameter 10 cm above ground) of each
individual identifying its species
Pool all individuals not identifiable by species as

100 Final Technical Report: EBLU2012-02NMY-Takeuchi
miscellaneous species
Convert basal diameter to basal area 3.14 ×
(basal diameter /2) × (basal diameter/2)
Using regression equation, determine biomass
of each individual
Determine species wise biomass of saplings in
the plot
Apply slope correction and determine species
wise biomass of saplings on per ha basis
Determine total biomass of all saplings on per
ha basis
7. Estimating shrub
biomass
Enumerate shrubs in the quadrats used for
sapling enumeration
Count number of individuals by species and
pool individuals not identifiable by species as
‘miscellaneous species’
Harvest 10% of individuals of a species
Take fresh weight of the harvested individuals
in the field: 1-3 kg fresh weight taken for oven
drying
Take a sample of fresh biomass
Dry in oven at 80 deg C for 48 hours and
determine dry weight
Determine dry weight of species wise shrub
biomass in the plot
Determine species wise biomass on per ha
basis
Determine total shrub biomass on per ha basis
8. Estimating
herbaceous biomass
Herbaceous biomass
Nest five quadrats, each of 1 m × 1m size, at
each corner and the centre of 10 m × 10 m or
20 m × 20 m sample plots
Harvest all vegetation, segregate by species and
pool all individuals not identifiable by species as
‘miscellaneous’ species and separate the

Final Technical Report: EBLU2012-02NMY-Takeuchi 101
harvested biomass into above and
belowground components
Take fresh weight of harvested individuals
Take a sample of fresh biomass (around 500-
1000 g) of each species, dry in oven and
determine dry weight
Determine species-wise biomass in the plot
Apply slope correction and determine species-
wise belowground and aboveground biomass
on per ha basis
Sum up species-wise belowground and
aboveground biomass, getting total herbaceous
biomass per ha
9. Estimating root
biomass of trees and
shrubs
Use available regression equations to
determine root biomass
10. Estimating litter
biomass
Collect litter in the plots laid for herbaceous
biomass estimation
Segregate litter into woody and non-woody
fractions
Take fresh weight in the field
Take 200-1000 g samples for determining dry
weight after keeping at 80 deg C for 48 hours
Apply slope correction and determine woody
and non-woody litter biomass on per ha basis
Sum up woody and non-woody litter biomass
and get total litter biomass on per ha basis
11. Estimating
carbon stock in
vegetation
Carbon content-oven dry weight/biomass
relationship varies as shown in Table 3. In most
cases, 50% of oven dry weight is taken as
carbon content. Country teams can decide this
value
12. Estimating
carbon in soil
Keeping in view the operational constraints, soil
organic content in upper 30 cm soil layer will
estimated
Take soil of 0-30 cm horizon: sample 0-10 cm,
10-20 cm and 20-30 cm layers separately and
average for 0-30 cm layer depending upon
suitability of local conditions

102 Final Technical Report: EBLU2012-02NMY-Takeuchi
Obtain one composite sample from each 20 m
× 20 m or 10 m × 10 m plot
Determine bulk density following broadly the
method outlined by Anderson and Ingram
(1989)
• Remove surface material from the spot
where soil is to be sampled and level
the spot
• Drive a 5 cm diameter thin-sheet metal
tube of known weight (W1) and volume
(V) 5 cm deep into the soil surface
• Excavate the soil from around the tube
and cut the soil beneath the tube
bottom
• Trim excess soil from the tube ends
• Dry the soil at 105 deg C in an oven for
two days and weigh (W2)
• Calculate bulk density as (W2-W1, i.e.,
weight of oven dry soil collected in the
tube from the field)/V as g/cm3
• The size of tube can be changed based
on the local circumstances
Determine soil organic carbon by Walkley-Black
method as outlined in Anderson and Ingram
(1989)
• Air dry the soil samples (200-500 g of
composite sample) at about 40 deg C
• Sieve the soil through a 2 mm sieve,
and gently rub the crumbs through the
mesh leaving the gravels and
roots/other debris.
• Grind all the material to pass a 0.15
mm mesh
• Weigh 0.1-0.5 g of ground soil and
pour it in a 250 ml conical flask, noting
down the exact weight of soil (W)
• Add 5 ml of 1 M potassium dichromate
solution (dissolve 49.04 g of dry
potassium dichromate in 800 ml of
distilled water in a 1,000 ml volumetric
flask and make up the volume to 1000
ml), gently stir the solution, add 7.5 ml
of concentrated sulphuric acid slowly
and then stir the solution so that all soil
particles are exposed to the solution
• Keep the solution at room temperature

Final Technical Report: EBLU2012-02NMY-Takeuchi 103
till the solution comes down to room
temperature
• After solution comes down to the room
temperature, add 0.3 ml of indicator
solution (0.1 g N-phenylanthranillic acid
and 0.1 g sodium carbonate in 100 ml
of distilled water)
• Titrate the digest with 0.20 M ferrous
ammonium sulphate (dissolve 78.390 g
ferrous ammonium sulphate in 50 ml of
concentrated sulphuric acid and dilute
to 1000 ml with water) and note down
the volume of the solution when end
point, i.e., change of colour of solution
from violet to green, (T)
• Calculate organic carbon (%) as (T × 0.2
× 0.3)/W
• Determine soil organic carbon on per
ha basis = %C × Bulk density × 30 cm x
100 cm x 100 cm = g/m2 and convert to
t/ha)
Table aaaa2.1: Regression equations available for plant biomass estimation
Life form Regression equation Author and
ecoregion
Trees and palms > 5
cm DBH
Y = species specific wood density* x exp (-1.499 +
2.148 ln (DBH) + 0.207 (ln (DBH))2 – 0.0281 (ln
(DBH))3
Chave et al. (2005)
for tropical forests
Trees Y = -1.638 + 2.08 ln DBH Pilli et al. (2006)
building on the
model of WBE
model of West et
al. (1999)
Anacardium excelsum ln Yc = -3.4931 + 2.4843 ln (DBH)
ln Yc = -3.4577 + 2.4889 ln (DBH)
ln Yc = -3.4278 + 2.4830 ln (DBH)
ln Yc = -3.4877 + 2.5143 ln (DBH)
ln Yc = -3.7179 + 2.1936 ln (DBH) + 0.4132 ln
height (m)
DBH in cm
Losi et al. (2005)
Tree size 1.8 to
11.2 cm DBH for
plantations in
Panama
Dipteryx panamensis ln Yc = -2.6344 + 2.5170 ln (DBH)
ln Yc = -2.6362 + 2.5339 ln (DBH)
ln Yc = -2.2433 + 2.3661 ln (DBH)
ln Yc = -2.6203 + 2.5327 ln (DBH)
ln Yc = -3.3814 + 2.8645 ln (DBH)
Losi et al. (2005)
Trees Y(pine) = 0.084 × DBH2.47
Y(oak) = 1.91 × DBH 1.782
Y (fir) = basal area × height × taper factor × wood
density × expansion factor
Ordonez et al.
(2008) for montane
forests in Central
Mexico
104 Final Technical Report: EBLU2012-02NMY-Takeuchi
Trees ln Yc = -2.7450 + 2.6244 ln (DBH)
ln Yc = -2.0619 + 2.3088 ln (DBH)
Shepherd and
Montagnini (2001)
for plantations in
humid tropics
Dicot trees Y = exp{-2.134+2.530 x ln (D)} where Y = tree
biomass/kg; D: DBH in cm
R2 = 0.97
FAO (2004) for DBH
< 80 cm in 1500-
4000 mm rainfall
regime
Y = exp{-1.996 + 2.32 x ln (D)} where Y = tree
biomass/kg; D: DBH in cm
R2 = 0.89
FAO (2004) for 5-
40 cm DBH in 900-
1500 mm rainfall
regime
Y = 10 (raise to the power) (-0.535 + log10 (3.14
r2) Y = tree biomass/kg; r: DBH in cm
R2 = 0.94
FAO (2004) for DBH
3-30 cm in < 900
mm annual rainfall
regime
Y = exp {-2.4090 + 0.9522 x ln (DBH2) x height x
wood density
R2 = 0.99
Winrock from
Brown, Gillespie
and Lugo, 1989) for
DBH > 5 cm in
1500-4000 mm
rainfall regime
Y = exp {-3.1141 + 0.9719 x ln (DBH2) x height
R2 = 0.97
Winrock from
Brown, Gillespie
and Lugo (1989) for
DBH > 5 cm in
1500-4000 mm
rainfall regime
Y = 34.4703 – 8.0671 DBH + 0.6589 DBH2 Winrock from
Brown, Gillespie
and Lugo (1989) for
DBH > 5 cm in
<1500 annual
rainfall regime
Dicot trees and
bamboo
Y = -122.297+13.065 DBH (Dillenia indica)
Y = -163.332 + 15.09 DBH (Shorea robusta)
Y = -144.678 + 144.678 (DBH) (Schima wallichii)
Y = -63.06 + 10.562 DBH (Castanopsis indica)
Y = -91.137 + 10.887 DBH ( Garcinia cowa)
Y = -229.852 + 17.451 DBH (Gmelina arborea)
Y = -233.191 + 18.276 DBH (Artocarpus chaplasa)
Y = -115.659 + 9.998 DBH (Vitex peduncularis)
Y = 4.435 + 5.219 DBH (Milusa roxburghinana)
Y = -80 + 6.5 x (Sterculia villosa)
Y = -16.987 + 4.20 DBH (Dendrocalamus
hamiltoni)
Singh (1980) for
sub-tropical humid
forests
Cooconut palms Y = 5.5209 tree age + 89.355 Kumar (2011)
Other palms like
Arecanut and
Y = 4.5 + 7.7 height Brown (1997)
Final Technical Report: EBLU2012-02NMY-Takeuchi 105
Borassus flabellifer
Bamboo (Bambusa
sps.)
Ln Y = 4.437 + 2.576 ln (DBH) Kumar et al. (2005)
Tropical pine Y = 5.508 + 2.008 DBH Das (1980)
Sal plantation Ln Y = 2.0473 DBH – 1.4516 Singh and
Ramakrishnan
(1983)
Lianas ≥ 1 cm Y = 10 (0.12-0.91 log (BA))
Putz (1983) for
lianas in Venezuela
Shrubs Y = 0.363 ln (diametera × diameterb × height) +
0.7829
diametera and diameterb are two perpendicular
diameters of shrub crown
Ordonez et al.
(2008) for montane
forests in Central
Mexico
Saplings ≥ 1 cm Basal
diameter < 5 cm DBH
Y = exp[3.965 + 2.383 ln (BD)] Kirby and Potvin
(2007) tropical
moist forests in
eastern Panama
Tree snags ≥ 5 cm
DBH
species specific wood density [3.14 (DBH/2)2 ×
height × 0.78]
Nascimento and
Laurance (2002) for
Amazonian
rainforest
Dead trees ≥ 5 cm 90% of total aboveground biomass of live trees Delaney et al.
(1998) in six life
zones of Venezuela
Downed woody
debris
Density of dead wood [3.14 × 3.14 ∑ (d2 )/8
transect length] × slope correction factor
Brown and
Roussopoulos
(1974) for small
fuels
Root/shoot ratio 0.25 Cairns et al. (1997)
for oak and
avocado orchards
0.26 Cairns et al. (1997)
for pine
0.26 Ordonez et al.
(2008) for shrubs in
Central Montane
forests in Mexico
0.10 Ordonez et al.
(2008) for
agriculture in
Central Montane
forests in Mexico
0.18 Jaramillo et al.
(2003) tropical dry
forests of Mexico
For dicot trees:
Y = exp{-2.134+2.530
x ln (D)} where Y =
tree biomass/kg; D:
DBH in cm (FAO,
2004)
Y = exp{-2.134+2.530 x ln (D)} where Y = tree
biomass/kg; D: DBH in cm

106 Final Technical Report: EBLU2012-02NMY-Takeuchi
Root biomass of
trees, palms and
lianas ≥ 1 cm DBH
24% of aboveground biomass Cairns et al. (1997)
Root biomass in
forests
20% of above ground biomas Santantonio et al.
(1977)
Ratio of belowground
to aboveground
biomass in forests
0.2 MacDicken (1997)
Ratio of belowground
to aboveground
biomass
0.28, 0.19 and 0.61 for tree, shrub and herb
component, respectively, in Acer forest in
Himalaya
0.36, 0.31 and 0.9 for tree, shrub and herb
component, respectively, in Betula forests in
Himalaya
0.49, 0.50 and 0.89 for tree, shrub and herb
component, respectively, in Rhododendron
forests in Himalaya
Garkoti and Singh
(1995)
Belowground biomass
as percentage of total
tree biomass
6% in early successional and 21% in late
successional species in sub-tropical humid forests
Ramakrishnan et
al. (1982)
Belowground:
aboveground biomass
ratio of annual crops
0.03 to 0.14 Kritika
(unpublished) in
Himayan region
Aboveground-
belowground biomass
regression pooling all
vegetation
components
Ln Belowground biomass = 0.5667 ln
Aboveground biomass -1.1212
R2 = 0.87
Mustafa
(unpublished) in
Himalayan region
Agroforestry trees Ln Y = 0.645 Ln basal area- 0.33 (R2 = 0.51 in
abandoned agricultural land)
Ln Y = 1.0601 Ln basal area – 2.0679 (R2 = 0.67 in
degraded forest land)
Ln Y = 0.8714 Ln basal area – 1.3643 (R2 = 0.70
pooled data)
Semwal
unpublished data
in Himalayan
region
*if species specific wood density is not known, a generalized value of 0.54 g cm-3 for standing trees,
0.453 g cm-3
for sound downed deadwood and 0.319 g cm-3
for rotten dead wood
Table a2.2: Variation in biomass estimates of a tree with DBH of 14.66 cm (or basal area 168.47 cm2)
and actual biomass of 49 kg) derived from different regression equations
Regression equation Author Biomass estimate
Y = species specific wood density* x exp (-
1.499 + 2.148 ln (DBH) + 0.207 (ln (DBH))2 –
0.0281 (ln (DBH))3
Chave et al. (2005) 184.0
Y = -1.638 + 2.08 ln DBH Pilli et al. (2006) 51.8
ln Yc = -2.7450 + 2.6244 ln (DBH)
Shepherd and
Montagnini (2001)
147.7
(2 x Yc)
Y = exp{-2.134+2.530 x ln (D)} where Y = tree FAO (2004) 105.6
Final Technical Report: EBLU2012-02NMY-Takeuchi 107
biomass/kg; D: DBH in cm
R2 = 0.97
Y = exp{-1.996 + 2.32 x ln (D)} where Y = tree
biomass/kg; D: DBH in cm
R2 = 0.89
FAO (2004) 69.0
Y = 34.4703 – 8.0671 DBH + 0.6589 DBH2 Winrock from Brown,
Gillespie and Lugo
(1989)
57.8
Ln Y = 0.645 Ln basal area- 0.33 (R2 = 0.51 in
abandoned agricultural land)
Ln Y = 1.0601 Ln basal area – 2.0679 (R2 = 0.67
in degraded forest land)
Ln Y = 0.8714 Ln basal area – 1.3643 (R2 =
0.70 pooled data)
Semwal unpublished
data in Himalayan
region
19.5
28.9
22.3
Table a2.3: Relationship of carbon content with oven-dry weight (biomass) used by some
researchers in carbon stock estimations
Relation of carbon content and oven dry
weight/biomass
Authors
� 50% of dry biomass Brown, 1986; Montagnnini and Porras, 1998
� 45% of dry biomass Whittaker and Likens, 1973
� 45% for litter, 43% for seedlings, 41% for
grass, 50% for downed woody debris and
47% for trees, palms and lianas
Hughes et al., 1999
� A common value of 47.5% Fujisaka et al., 1998; Kotto-Same et al., 1997
� A common value of 46% Elias and Potvin, 2003
� 48% based on analysis of samples Losi et al., 2003
Annexure 1: Statistical analysis: formula and examples (being prepared)
References
Brown S. 2008. Assessment of the Advantages and Limitations of Ground-Based Surveys and
Inventories. UNFCCC Workshop on Methodological Issues Relating to REDD in Developing Countries
25-27 June. Tokyo, Japan.
http://unfccc.int/files/methods_and_science/lulucf/application/pdf/080625_tokyo_brown.pdf
Cairns M A, Brown S, Helmer E H and Bumgardner G A. 1997. Root biomass allocation in the world’s
upland forests. Oecologia, 111: 1-11.
Chave J, Andalo C, Brown S, Cairns MA, Chambers JQ, Eamus D, Folster H, Fromard F, Higuchi N, Kira
T, Lescure JP, Nelson BW, Ogawa H, Puig H, Riera B, Yamakura T. 2005. Tree allometry and improved
estimation of carbon stocks and balance in tropical forests. Oecologia. 145(1):87-99.
Gibbs HK, Brown S, Niles JO and Foley JA. 2007. Monitoring and estimating tropical forest carbon
stocks: making REDD+ a reality. Environ. Res. Lett. 2 045023 (13pp).
Hairiah K, Dewi S, Agus F, van Noordwijk M, Rahayu S, Velarde SJ. 2010. Measuring Carbon Stocks
Across Land Use Systems: A Manual. Bogor, Indonesia. World Agroforestry Centre (ICRAF), SEA

108 Final Technical Report: EBLU2012-02NMY-Takeuchi
Regional Office, Brawijaya University and ICALRRD (Indonesian Center for Agricultural Land
Resources Research and Development) at www.worldagroforestrycentre.or/sea.
Kamau D M, Spiertz JHJ and Oenema O. 2008. Carbon and nutrient stocks of tea plantations
differing in age, genotype and plant population density. Plant Soil 307:29–39.
Kurnianto S. and Murdiyarso D. 2010 Forest carbon database: a Web-based carbon stock data
repository and exchange system. CIFOR, Bogor, Indonesia. 16p.
Lasco RD. 2002. Forests carbon budgets in Southeast Asia following harvesting and land cover
change. Science in China (series C), Vol. 45: 55-64.
Mokany K, Raison J R, and Prokushkin AS, 2006. Critical analysis of root-shoot ratios in terrestrial
biomes. Global Change Biolology 12: 84-96.
Annex 3: Summary report training on “What are carbon stocks and how to measure the tree
in forest” in Thailand
The project was launched two training in Chiang Mai Province: 1) Training on ““What are carbon
stock and how to measurement the tree in forest” for the farmers and local forest officer at Thailand
site on 11-13 October 2012 at Tee Cha village; and 2) Training on “What are carbon stock and how to
measurement the tree in forest” on 1-4 November 2013 at the Chang Khain Highland Research
Station.
Objectives:
The main objectives of the workshop were:
• Training the local forest officer on the topic “What are carbon stock and how to
measurement the tree in forest”.
• Demonstration and practices how to measurement the tree in forest
3.1 Training on “What are carbon stocks and how to measure the tree in forest” at Tee
Cha Village, 11-13 October 2012
Chiang Mai University, Conserve Office Area 16 of Chiang Mai and Department of Natural Parks
Wildlife and Plant Conservation, jointly organized this training, total 35 participants came from
villages and provincial forest office.
Training programme and demonstration:
Wednesday, 10 October 2012:
10:00-15:00 hrs Travel from Chiang Mai University to Tee Cha village
Thursday, 11 October 2012: Tee Cha Village
9:00–9:30 hrs
Register:
• Staffs of Chiang Mai University
9:30–9:40 hrs Opening the training:
• Mr. Noi Taekhwa (head of village)
9:40–10:00 hrs Introduction to the training:
• Dr. Narit Yimyam
10:00–10:30 hrs Coffee/tea break

Final Technical Report: EBLU2012-02NMY-Takeuchi 109
10:30–12:30 hrs General village landscape and Land used
• Dr. Narit Yimyam
12:30–14:00 hrs Lunch
14:00–15:30 hrs How to used the map to land used map
• Dr. Narit Yimyam
15:30–16:00 hrs Coffee/tea break
16:00–18:00 hrs
Field walk observing village landscape and land use practices
Dr. Narit Yimyam and staffs
Friday, 12 October 2012: Tee Cha Village
8:30–10:30 hrs What are carbon stock and how to measurement the tree in forest?
Dr. Narit Yimyam
Dr. Sittichai Lordkaew
10:30-11:00 hrs Coffee/tea break
11:00-12:30 hrs What are carbon stock and how to measurement the tree in forest?
(continued)
Dr. Narit Yimyam
Dr. Sittichai Lordkaew
12:30–14:00 hrs Lunch
14:00–15:30 hrs Practices the method how to measurement the tree in forest
Dr. Narit Yimyam and staffs
15:30–16:00 hrs Coffee/tea break
16:00–18:00 hrs
Practices the method how to measurement the tree in forest (continued)
Dr. Sittichai Lordkaew and staffs
Saturday, 13 October 2012:
8:30-10:30 hrs Discussion
Staffs of CMU.
10:30–11:00 hrs Coffee/tea break
11:00-12:00 hrs Discussion continued
Staffs of CMU.
12:00–13:30 hrs Lunch
13:30–14:30 hrs Summarize
Dr. Narit Yimyam
14:30–15:00 hrs Coffee/tea break
15:00–15:30 hrs Closing
15:30-20:00 hrs Black to Chiang Mai University
The lists of participants in the 1st Training
No. Name Address (No. house ) Position

110 Final Technical Report: EBLU2012-02NMY-Takeuchi
1 Mr.Mayo Phakdeephanphana 211 Farmer
2 Mr.Daloy Cheewaboonyasit 386 Farmer
3 Mr.Kaewloy Laksanasoonthon 293 Farmer
4 Mr.Tanee Dararueangrong 202/2 Farmer
5 Mr.Luyo Deeledporn 338/1 Farmer
6 Mr.Saucha Hlaemsingkhor 346 Farmer
7 Mr.Liyo Tuphor 391 Farmer
8 Mr.Peeda Katoo 367 Farmer
9 Mr.Tucare Thongsayporisud 294 Farmer
10 Ms.Lar Koktoo 45 Farmer
11 Mr.Dipo Thongthungnapha 356 Farmer
12 Mr.Padikae Chalidaphorn 338 Farmer
13 Mr.Nopporn Sawadthisa 381 Farmer
14 Ms.Anong Thongsayporisud 294 Farmer
15 Mr.Daeng Hlaemsingkhor 291 Farmer
16 Mr.Chaemui Thawinkhrongsak 337 Farmer
17 Mr.Dichai Koksor 211/1 Farmer
18 Mr.Kan Doyngam 366 Farmer
19 Mr.Nujae Hlaemsingkhor 312 Farmer
20 Mr. Phudthawong Thongthongnapha 356 Farmer
21 Mr.Somchai Kosor 211/2 Farmer
22 Mr.Phonsawan Koatoo 45 Farmer
23 Mr.Da Naetoo 380 Farmer
24 Ms.Suyo Naetoo 380 Farmer
25 Mr.Thongdee Sawadthisa 163/1 Farmer
26 Mr.Noi Taekhwa 71 local forest officer
27 Ms.Rongruedee Taekhwa 71 local forest officer
28 Ms.Wanida sawatthisa 163/1 local forest officer
29 Ms.Siriwilai Laksanasantho 363 local forest officer
30 Mr.Caredo Khaewa 354 local forest officer
31 Dr.Narit Yimtam Chiang Mai University Chiang Mai University’s Staff
32 Dr. Sittichai Lordkaew Chiang Mai University Chiang Mai University’s Staff
33 Mr.Peeranun Mapan Chiang Mai University Chiang Mai University’s Staff

Final Technical Report: EBLU2012-02NMY-Takeuchi 111
34 Mr. Puthapong Manokam Chiang Mai University Chiang Mai University’s Staff
35 Mr. Vorrawit Sukkumpa Chiang Mai University Chiang Mai University’s Staff
Note: All farmers live in Tee Cha village Moo 10, Sop Moei Sub-district, Sop Moei district, Mae Hong
Son province
3.2 Training on “What are carbon stocks and how to measure the tree in forest” at the
Chang Khain Highland Research Station, 1-4 November 2013
Chiang Mai University and Conserve Office Area 16 of Chiang Mai jointly organized this training.
There were total 30 participants.
Training programme and demonstration:
Friday, 1 November 2013:
9:00-12:00 hrs Participants arrival to Chiang Mai University
12:00–13:00 hrs Lunch
13:00–15:00 hrs Group Travel to Chang Khain highland research station
15:00-15:30 hrs Welcome and introduction Chang Khain highland research station
Dr. Narit Yimyam
Saturday, 2 November 2013: Chang Khain Highland Research Station
9:00–9:30 hrs
Opening the training:
Director of highland research and training center
9:30–10:00 hrs Introduction to the training:
Dr. Narit Yimyam
10:00–10:30 hrs Coffee/tea break
10:30–12:30 hrs How to use the map to land used map
Assistant Prof. Teerapong Soawaphak
12:30–14:00 hrs Lunch
14:00–15:30 hrs Practices the method how use the map to land used map
Assistant Prof. Teerapong Soawaphak
15:30–16:00 hrs Coffee/tea break
16:00–18:00 hrs
Field walk observing landscape and land use practices
Dr. Narit Yimyam and staffs
Sunday, 3 November 2013:
8:30–10:30 hrs What are carbon stock and how to measurement the tree in forest?
Dr. Narit Yimyam
10:30-11:00 hrs Coffee/tea break

112 Final Technical Report: EBLU2012-02NMY-Takeuchi
11:00-12:30 hrs What are carbon stock and how to measurement the tree in forest?
(continued)
Dr. Narit Yimyam
12:30–14:00 hrs Lunch
14:00–15:30 hrs Practices the method how to measurement the tree in forest
Dr. Narit Yimyam and staffs
15:30–16:00 hrs Coffee/tea break
16:00–18:00 hrs
Forest plantation in the station
Dr. Sittichai Lordkaew and staffs
Monday, 4 November 2013:
8:30-10:30 hrs Discussion
Staffs of CMU.
10:30–11:00 hrs Coffee/tea break
11:00-12:00 hrs Summarize
Dr. Narit Yimyam
12:00–13:30 hrs Lunch
13:30–14:30 hrs Closing
14:30–19:00 hrs Departure of participants
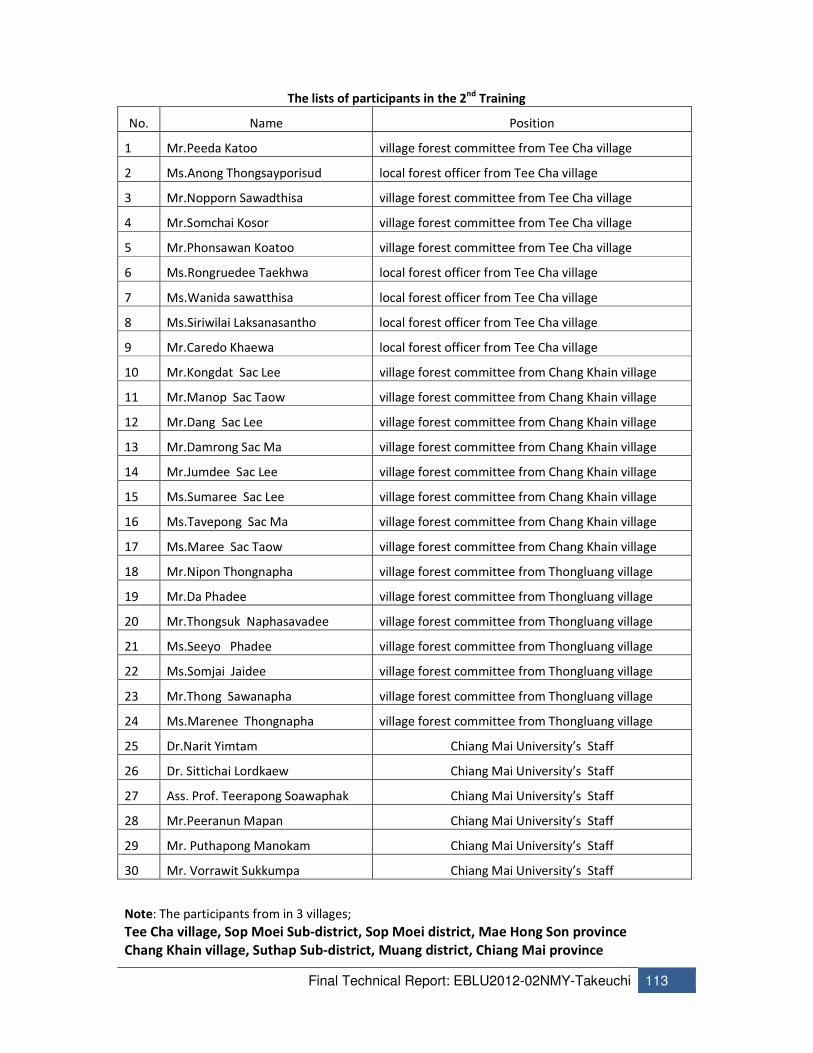
Final Technical Report: EBLU2012-02NMY-Takeuchi 113
The lists of participants in the 2nd
Training
No. Name Position
1 Mr.Peeda Katoo village forest committee from Tee Cha village
2 Ms.Anong Thongsayporisud local forest officer from Tee Cha village
3 Mr.Nopporn Sawadthisa village forest committee from Tee Cha village
4 Mr.Somchai Kosor village forest committee from Tee Cha village
5 Mr.Phonsawan Koatoo village forest committee from Tee Cha village
6 Ms.Rongruedee Taekhwa local forest officer from Tee Cha village
7 Ms.Wanida sawatthisa local forest officer from Tee Cha village
8 Ms.Siriwilai Laksanasantho local forest officer from Tee Cha village
9 Mr.Caredo Khaewa local forest officer from Tee Cha village
10 Mr.Kongdat Sac Lee village forest committee from Chang Khain village
11 Mr.Manop Sac Taow village forest committee from Chang Khain village
12 Mr.Dang Sac Lee village forest committee from Chang Khain village
13 Mr.Damrong Sac Ma village forest committee from Chang Khain village
14 Mr.Jumdee Sac Lee village forest committee from Chang Khain village
15 Ms.Sumaree Sac Lee village forest committee from Chang Khain village
16 Ms.Tavepong Sac Ma village forest committee from Chang Khain village
17 Ms.Maree Sac Taow village forest committee from Chang Khain village
18 Mr.Nipon Thongnapha village forest committee from Thongluang village
19 Mr.Da Phadee village forest committee from Thongluang village
20 Mr.Thongsuk Naphasavadee village forest committee from Thongluang village
21 Ms.Seeyo Phadee village forest committee from Thongluang village
22 Ms.Somjai Jaidee village forest committee from Thongluang village
23 Mr.Thong Sawanapha village forest committee from Thongluang village
24 Ms.Marenee Thongnapha village forest committee from Thongluang village
25 Dr.Narit Yimtam Chiang Mai University’s Staff
26 Dr. Sittichai Lordkaew Chiang Mai University’s Staff
27 Ass. Prof. Teerapong Soawaphak Chiang Mai University’s Staff
28 Mr.Peeranun Mapan Chiang Mai University’s Staff
29 Mr. Puthapong Manokam Chiang Mai University’s Staff
30 Mr. Vorrawit Sukkumpa Chiang Mai University’s Staff
Note: The participants from in 3 villages;
Tee Cha village, Sop Moei Sub-district, Sop Moei district, Mae Hong Son province
Chang Khain village, Suthap Sub-district, Muang district, Chiang Mai province
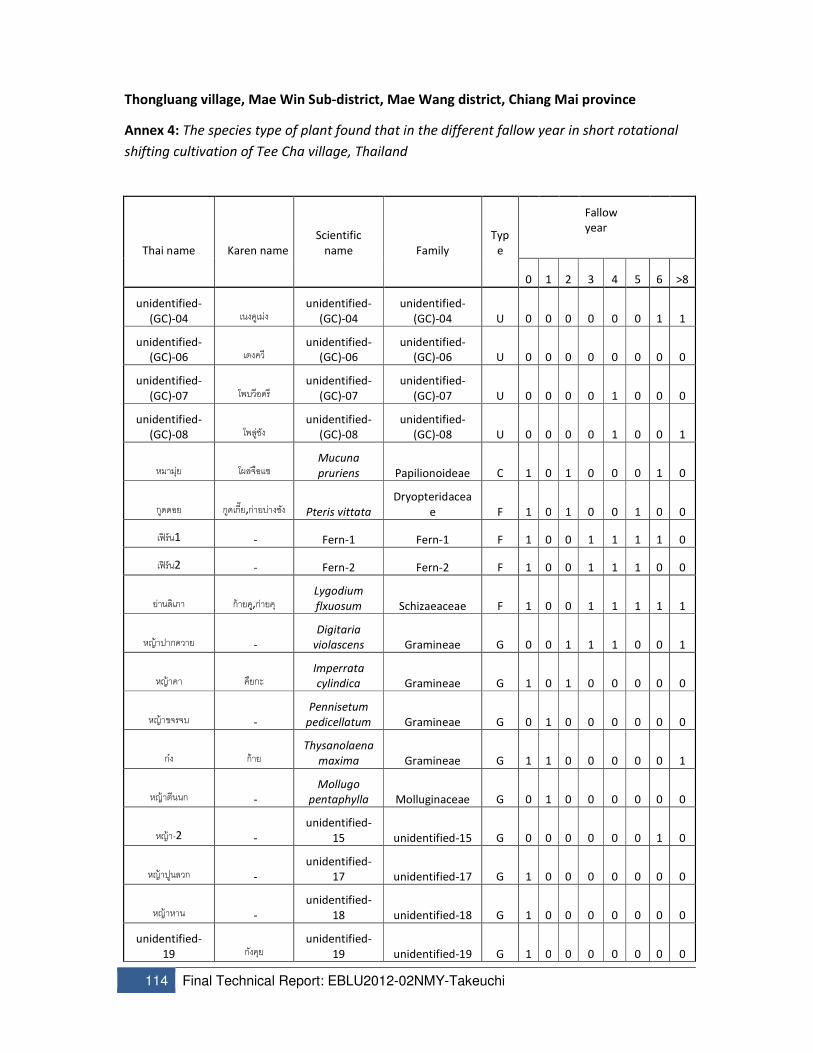
114 Final Technical Report: EBLU2012-02NMY-Takeuchi
Thongluang village, Mae Win Sub-district, Mae Wang district, Chiang Mai province
Annex 4: The species type of plant found that in the different fallow year in short rotational
shifting cultivation of Tee Cha village, Thailand
Thai name Karen name
Scientific
name Family
Typ
e
Fallow
year
0 1 2 3 4 5 6 >8
unidentified-
(GC)-04 เนงคเมง unidentified-
(GC)-04
unidentified-
(GC)-04 U 0 0 0 0 0 0 1 1
unidentified-
(GC)-06 เตงคว unidentified-
(GC)-06
unidentified-
(GC)-06 U 0 0 0 0 0 0 0 0
unidentified-
(GC)-07 โพบวอดร unidentified-
(GC)-07
unidentified-
(GC)-07 U 0 0 0 0 1 0 0 0
unidentified-
(GC)-08 โพลชง unidentified-
(GC)-08
unidentified-
(GC)-08 U 0 0 0 0 1 0 0 1
หมามย โผลจอแซ Mucuna
pruriens Papilionoideae C 1 0 1 0 0 0 1 0
กดดอย กดเก%ย,กายบางซง Pteris vittata
Dryopteridacea
e F 1 0 1 0 0 1 0 0
เฟรน1 - Fern-1 Fern-1 F 1 0 0 1 1 1 1 0
เฟรน2 - Fern-2 Fern-2 F 1 0 0 1 1 1 0 0
ยานลเภา กายค,กายค Lygodium
flxuosum Schizaeaceae F 1 0 0 1 1 1 1 1
หญาปากควาย -
Digitaria
violascens Gramineae G 0 0 1 1 1 0 0 1
หญาคา คยกะ Imperrata
cylindica Gramineae G 1 0 1 0 0 0 0 0
หญาขจรจบ -
Pennisetum
pedicellatum Gramineae G 0 1 0 0 0 0 0 0
กง กาย Thysanolaena
maxima Gramineae G 1 1 0 0 0 0 0 1
หญาตนนก -
Mollugo
pentaphylla Molluginaceae G 0 1 0 0 0 0 0 0
หญา-2 -
unidentified-
15 unidentified-15 G 0 0 0 0 0 0 1 0
หญาปนลวก -
unidentified-
17 unidentified-17 G 1 0 0 0 0 0 0 0
หญาหาน -
unidentified-
18 unidentified-18 G 1 0 0 0 0 0 0 0
unidentified-
19 กงคย unidentified-
19 unidentified-19 G 1 0 0 0 0 0 0 0

Final Technical Report: EBLU2012-02NMY-Takeuchi 115
unidentified-
20 แควคโยะด
unidentified-
20 unidentified-20 G 1 0 0 0 0 0 0 0
unidentified-
22 ดกายด
unidentified-
22 unidentified-22 G 0 1 0 0 0 0 0 0
unidentified-
24 นงกายค
unidentified-
24 unidentified-24 G 0 1 0 0 0 0 0 0
unidentified-
25 นงคล2งไล
unidentified-
25 unidentified-25 G 0 1 0 0 0 0 0 0
unidentified-
26 นงควยหม2 unidentified-
26 unidentified-26 G 0 1 0 0 0 0 0 0
unidentified-
27 นงตะสปะซอ
unidentified-
27 unidentified-27 G 0 1 0 0 0 0 0 0
unidentified-
28 นงทยเชา unidentified-
28 unidentified-28 G 0 1 0 0 0 0 0 0
unidentified-
29 นงนอแดง unidentified-
29 unidentified-29 G 0 1 0 0 0 0 0 0
unidentified-
30 นงเบเมะ unidentified-
30 unidentified-30 G 0 1 0 0 0 0 0 0
unidentified-
31 นงปะทอ
unidentified-
31 unidentified-31 G 0 1 0 0 0 0 0 0
unidentified-
32 นงพล
unidentified-
32 unidentified-32 G 0 1 0 0 0 0 0 0
unidentified-
33 นงมซ unidentified-
33 unidentified-33 G 0 1 0 0 0 0 0 0
unidentified-
34 นงลอคา unidentified-
34 unidentified-34 G 0 1 0 0 0 0 0 0
unidentified-
35 นงแวะดาย
unidentified-
35 unidentified-35 G 0 0 0 0 0 0 1 0
unidentified-
36 นางจบ
unidentified-
36 unidentified-36 G 0 1 0 0 0 0 0 0
unidentified-
38 โผลจบวย
unidentified-
38 unidentified-38 G 0 1 0 0 0 0 0 0
unidentified-
39 พล unidentified-
39 unidentified-39 G 0 1 0 0 0 0 0 0

116 Final Technical Report: EBLU2012-02NMY-Takeuchi
หญาขนไก -
Lepidagathis
incurva Acanthaceae H 0 0 0 0 0 0 0 0
ผกปราบ -
Commelina
bengalensis Commelinaceae H 1 0 0 0 0 0 0 0
สาบแรง นางเนาะมอ
Aguatum
comyzoides Compositae H 1 1 0 0 0 0 1 0
สาบเสอ
นางชะกย
/หนอชะยะ
Chromolaena
odorata Compositae H 1 1 1 1 1 1 1 1
ผกคราดหวแหวน -
Sphaeranthus
africanus Compositae H 0 1 0 0 0 0 0 0
น 8านมราชสห -
Euphorbia
hirta Euphorbiaceae H 0 1 0 0 0 0 0 0
งาข 8มอน -
Perilla
frutesens Labiatae H 1 0 0 0 0 0 0 0
ฝาย -
Gossypium
herbaceum Malvaceae H 1 0 0 0 0 0 0 0
Desmodium
sp.-1 -
Desmodium
sp.-1 Papilionoideae H 0 0 0 0 0 0 0 0
Desmodium
sp.-2 -
Desmodium
sp.-2 Papilionoideae H 0 0 0 0 0 0 0 0
งาขาว -
Sesamum
orientale Pedaliaceae H 1 0 0 0 0 0 0 0

Final Technical Report: EBLU2012-02NMY-Takeuchi 117
Annex 5: Photos of the project activities
THAILAND
Figure a1 Tee Cha Village landscape and traditional land use systems
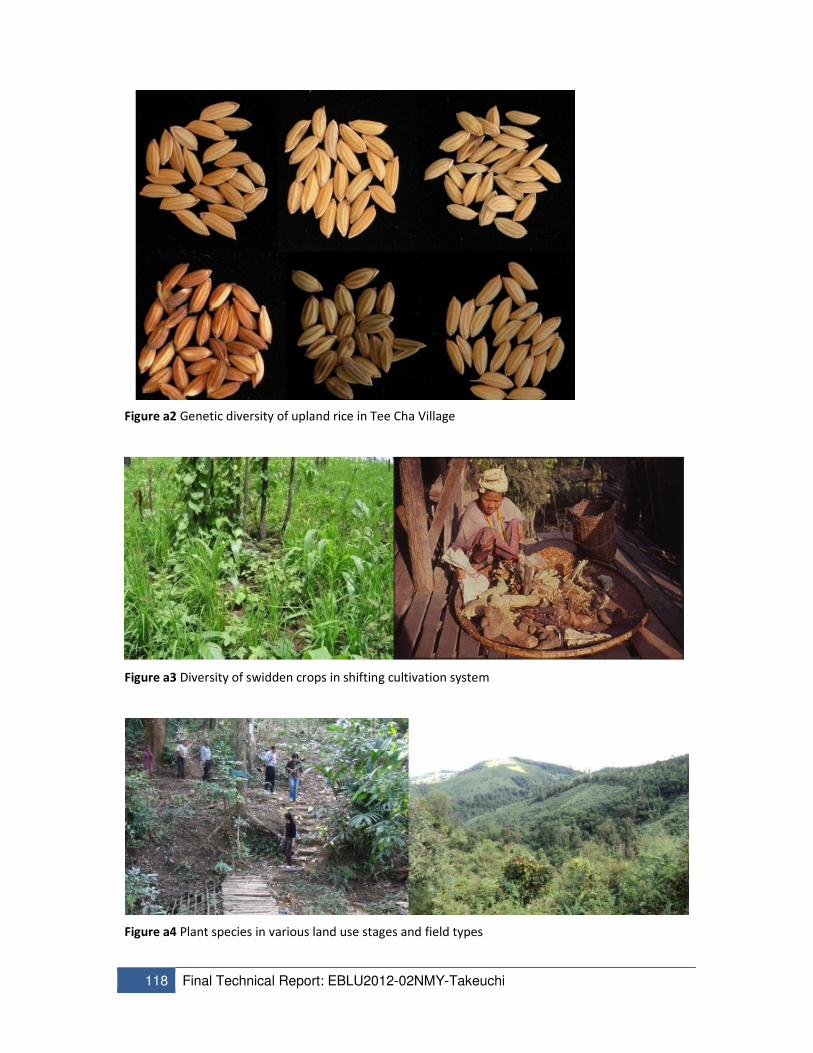
118 Final Technical Report: EBLU2012-02NMY-Takeuchi
Figure a2 Genetic diversity of upland rice in Tee Cha Village
Figure a3 Diversity of swidden crops in shifting cultivation system
Figure a4 Plant species in various land use stages and field types
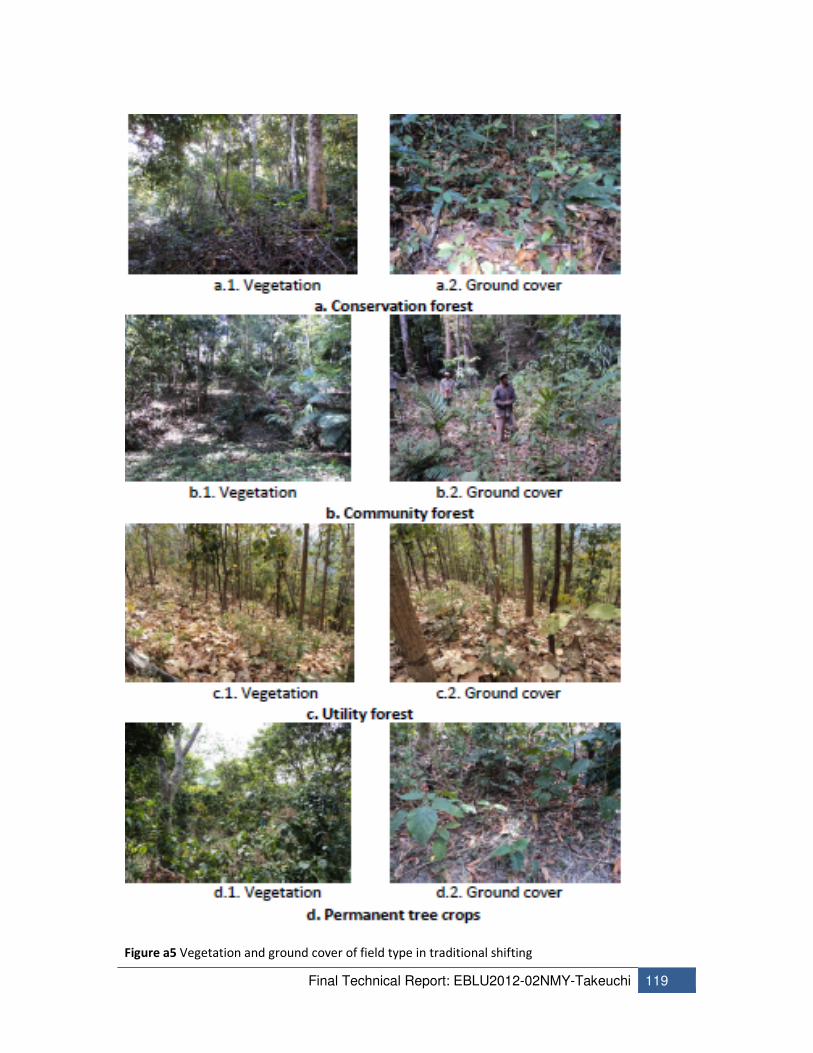
Final Technical Report: EBLU2012-02NMY-Takeuchi 119
Figure a5 Vegetation and ground cover of field type in traditional shifting

120 Final Technical Report: EBLU2012-02NMY-Takeuchi
Figure a6 Methodology of biomass measurement in field types
Figure a7 Methodology of ground cover and soil data collection

Final Technical Report: EBLU2012-02NMY-Takeuchi 121
Figure a8 Activities in training the farmers and local forest officers on 11-13 October 2012 at Tee Cha
Village

122 Final Technical Report: EBLU2012-02NMY-Takeuchi
Figure a9 Activities in training the local forest officers on 1-4 November 2013 at the Chang Khain
Highland Research Station, Tee Cha Village

Final Technical Report: EBLU2012-02NMY-Takeuchi 123
Annex 6: Funding sources outside the APN
A list of agencies, institutions, organisations (governmental, inter-governmental and/or non-
governmental), that provided any in-kind support and co-funding for the project and the amount(s)
awarded. If possible, please provide an estimate amount.
1. United Nations University Institute for Sustainability and Peace (UNU-ISP), Tokyo provided in
kind and co-funding
2. Chiang Mai University (CMU), Thailand provided in-kind support
3. National Agriculture and Forest Research Institute (NAFRI), Laos provided in-kind support
4. Jawaharlal Nehru University (JNU), India provided in-kind support
Annex 7: List of Young Scientists
1. Dr. Jintana Kawasaki involved in project coordination, and socio-economic survey and analysis, a
former researcher at UNU-ISP, now working at Institute for Global Environmental Strategies,
Japan. Email: [email protected]
2. Ms Alva Lim involved in project development and planning, and policy dialogue, a former
researcher at UNU-ISP, now working at Seeds of Life, Timor-Leste. Email: [email protected]
3. Ms. Utumporn Chaiwong involved in field survey and analysis at the project site in Thailand, a
former researcher at Chiang Mai University, now working at National Corn and Sorghum
Research Center, Thailand. Email: [email protected]
4. Mr. Vikha Vi Mektakoul involved in field survey and analysis at project site in Laos, Agricultural
Land Use Planning Centre, Laos. Email: [email protected]
Annex 8 Glossary of Terms
AAL abandoned agricultural land
APFNet Asia-Pacific Network for Sustainable Forest Management and Rehabilitation
CDM Clean Development Mechanism
CMU Chiang Mai University
ES Ecosystem services
GIAHS Globally Important Agricultural Heritage Systems
HDFL highly degraded forest land
IGES Institute for Global Environmental Strategies
JNU Jawaharlal Nehru University
MAFF Ministry of Agriculture, Forestry and Fisheries of Japan
MRV Measurement, Reporting and Verification
NAFRI National Agriculture and Forest Research Institute

124 Final Technical Report: EBLU2012-02NMY-Takeuchi
NPV Net present value
OJCB On-the-Job Research Capacity Building for Sustainable Agriculture/Forestry in Developing
Countries
PES Payment for environmental services
REDD+ Reducing Emissions from Deforestation and Forest Degradation in Developing Countries
RS/GIS Remote sensing/Geographic Information System
SFR-MMSEA Sustainable Forest Rehabilitation and Management for the Conservation of Trans-
boundary Ecological Security in Montane Mainland Southeast Asia– Pilot Demonstration Project of
Lao PDR, Myanmar and China/Yunnan
SLM-MMSEA Sustainable land management in the mountainous region of mainland Southeast Asia
SWFU Southwest Forestry University of China
UN-CECAR University Network for Climate Ecosystems and Change Adaptation Research
UNU-ISP United Nations University Institute for Sustainability and Peace, now United Nations
University Institute for the Advanced Study of Sustainability (UNU-IAS)