Commodifying forest carbon: How local power, politics and livelihood practices shape REDD+ in Lindi...
332
Commodifying forest carbon: How local power, politics and livelihood practices shape REDD+ in Lindi Region, Tanzania A thesis submitted to the University of Manchester for the degree Doctor of Philosophy in the Faculty of Humanities 2014 Andreas Scheba School of Environment, Education and Development Institute for Development Policy and Management
Transcript of Commodifying forest carbon: How local power, politics and livelihood practices shape REDD+ in Lindi...

Commodifying forest carbon:
How local power, politics and livelihood practices shape REDD+ in Lindi Region, Tanzania
A thesis submitted to the University of Manchester for the degree
Doctor of Philosophy
in the Faculty of Humanities
2014
Andreas Scheba
School of Environment, Education and Development Institute for Development Policy and Management

2
Table of Contents
Chapter 1: Introduction ........................................................................................... 13
1.1 Encountering people, forests and carbon in Lindi, Tanzania ............................. 13
1.2 The REDD+ approach...................................................................................... 17 1.2.3 REDD+ beyond carbon: social and biodiversity aspects ............................. 21 1.2.4 Governing people, forests and carbon......................................................... 24 1.2.5 REDD+ in Tanzania................................................................................... 26 1.2.6 REDD+ in Lindi......................................................................................... 30
1.3 Research rationale............................................................................................ 34 1.3.1 Research approach and objectives .............................................................. 34 1.3.2 Main and subordinated research questions.................................................. 37 1.3.3 Thesis structure .......................................................................................... 38
Chapter 2: Theoretical framework.......................................................................... 41
2.1 Introduction...................................................................................................... 41
2.2 Payments for ecosystem services (PES)............................................................. 41 2.2.1 Coasean concept of PES............................................................................. 41 2.2.2 Alternative conceptualisations of PES ........................................................ 43 2.2.3 Poverty alleviation under PES .................................................................... 45
2.3 Neoliberalism, neoliberalisation and development ............................................ 46 2.3.1 Neoliberalism and neoliberalisations .......................................................... 46 2.3.2 ‘Inclusive’ neoliberalism............................................................................ 48
2.4 Neoliberalisation of nature ............................................................................... 50
2.5 Neoliberal conservation .................................................................................... 52 2.5.1 Win-win rhetoric........................................................................................ 52 2.5.2 Reregulation and territorialisation .............................................................. 54 2.5.3 Commodification of nature......................................................................... 55 2.5.4 Hybrid governance..................................................................................... 57 2.5.5 Eco-subjectivities....................................................................................... 58 2.5.6 Politics and place matter............................................................................. 58
2.6 Neoliberal conservation and the commodification of forest carbon ................... 59
2.7 ‘Inclusive’ neoliberal conservation ................................................................... 61 2.7.1 Rise of community conservation ................................................................ 61 2.7.2 Recognising progressive change: citizenship and politics ........................... 64
2.8 Conclusion........................................................................................................ 66
Chapter 3: Methods.................................................................................................. 68
3.1 Introduction...................................................................................................... 68
3.2 Research approach ........................................................................................... 68 3.2.1 Ontological and epistemological assumptions............................................. 68 3.2.2 Ethnographic approach............................................................................... 69 3.2.3 Case Study ................................................................................................. 71
3.3 Data collection ................................................................................................. 82 3.3.1 Research schedule and language................................................................. 82

3
3.3.2 Participant observation............................................................................... 84 3.3.3 Ethnographic and semi-structured interviews ............................................. 85 3.3.4 Focus group discussion .............................................................................. 87 3.3.5 Document analysis ..................................................................................... 88 3.3.6 Household survey....................................................................................... 89
3.4 Data Analysis.................................................................................................... 91 3.4.1 Qualitative data .......................................................................................... 91 3.4.2 Quantitative data ........................................................................................ 92 3.4.3 Wealth ranking........................................................................................... 92 3.4.4 Reference adult equivalent ......................................................................... 93 3.4.5 Agricultural harvests and incomes.............................................................. 93 3.4.6 Opportunity costs calculations in Ruhoma.................................................. 94
3.5 Reflexivity and ethical considerations ............................................................... 94 3.5.1 Reflexivity ................................................................................................. 94 3.5.2 Ethical issues ............................................................................................. 96
3.6 Conclusion........................................................................................................ 97
Chapter 4: Livelihoods in rural Lindi ..................................................................... 98
4.1 Introduction...................................................................................................... 98
4.2 A brief introduction of the region and case study villages.................................. 98 4.2.1 Poverty and development in Lindi, Tanzania.............................................. 98 4.2.2 The role of agriculture.............................................................................. 101 4.2.3 The role of off-farm activities................................................................... 107
4.3 The economics of livelihoods in Ruhoma and Mihumo/Darajani ..................... 108 4.3.1 Income levels ........................................................................................... 108 4.3.2 Relevance of sectors................................................................................. 110 4.3.3 Income from crop sales ............................................................................ 112 4.3.4 Livestock grazing..................................................................................... 116 4.3.5 Forest resources ....................................................................................... 118 4.3.6 Wage work............................................................................................... 119 4.3.7 Business and services ............................................................................... 121 4.3.8 Remittances, loans and other income sources ........................................... 122
4.4 Linking wealth and land use............................................................................ 123 4.4.1 Using land for crop production................................................................. 124 4.4.2 Productivity and production volumes ....................................................... 129
4.5 Conclusion...................................................................................................... 136
Chapter 5: Material and discursive effects of REDD+.......................................... 138
5.1 Introduction.................................................................................................... 138
5.2 Perceived benefits and losses from forest protection ....................................... 139 5.2.1 General perceptions.................................................................................. 139 5.2.2 Distribution of benefits............................................................................. 143 5.2.3 Prospect of carbon payments in Mihumo/Darajani.................................... 144 5.2.4 Prospects of carbon payments in Ruhoma................................................. 146 5.2.5 Potential losses......................................................................................... 149
5.3 Promoting REDD+ as green development ...................................................... 154 5.3.1 The promise of environmental benefits..................................................... 155 5.3.2 Promising economic benefits.................................................................... 157

4
5.3.3 Promoting crisis narrative......................................................................... 160 5.3.4 Promoting green development discourse .................................................. 161
5.4 Conclusion...................................................................................................... 169
Chapter 6: The politics of territorialising village land forest reserves ................. 172
6.1 Introduction.................................................................................................... 172
6.2 The long way to CBFM & REDD+ in Mihumo/Darajani ................................ 173 6.2.1 Initiating territorialisation of Angai forest ................................................ 173 6.2.3 Territory without authority ....................................................................... 176 6.2.4 The District’s agenda: dividing villages, creating new territories .............. 178 6.2.5 Participatory land use planning under REDD+ ......................................... 180 6.2.6 A new wave of territorialisation under LIMAS......................................... 182
6.3 Establishing CBFM/REDD+ in Ruhoma......................................................... 183 6.3.1 Territorialising Ruhoma village land ........................................................ 183 6.3.2 Territorialising forestland......................................................................... 187 6.3.3 Decentralisation continues........................................................................ 190
6.4. Conclusion..................................................................................................... 192
Chapter 7: Practicing community-based forest management .............................. 195
7.1 Introduction.................................................................................................... 195
7.2 Community-based forest management institutions........................................... 195 7.2.1 Forest management plans and bylaws....................................................... 195 7.2.2 Permitted uses of the forest ...................................................................... 196 7.2.3 Prohibited uses of the forest ..................................................................... 198 7.2.4 Rights and responsibilities of stakeholders ............................................... 199
7.3 Community based forest management in practice............................................ 201 7.3.1 Knowing and owning institutions ............................................................. 201 7.3.2 Forest management activities ................................................................... 209
7.4. Conclusion..................................................................................................... 223
Chapter 8: Conservation Agriculture and farmer field schools ........................... 226
8.1. Introduction ................................................................................................... 226
8.2. Conservation Agriculture............................................................................... 227 8.2.1 Basic principles of Conservation Agriculture............................................ 227 8.2.2 The challenges constraining adoption of CA in Africa.............................. 229 8.2.3 Conservation Agriculture in Lindi, Tanzania ............................................ 229
8.3. Farmer field schools ...................................................................................... 232 8.3.1 Farmer field schools and Conservation Agriculture .................................. 232 8.3.2 Factors influencing farmer field schools performance in Lindi, Tanzania . 236 8.3.3 Farmer field schools and perceptions of ‘Conservation Agriculture’......... 242 8.3.4 Spreading knowledge via farmer field schools to villagers........................ 249
8.4 Conclusion...................................................................................................... 253
Chapter 9: Conclusions .......................................................................................... 255
9.1 Introduction.................................................................................................... 255
9.2 Thesis summary and main findings.................................................................. 257

5
9.3 Theoretical contributions ................................................................................ 269
9.4 Future research .............................................................................................. 272
Appendix I: Fieldwork schedule ............................................................................ 275
Appendix II: List of recorded interviews............................................................... 277
Appendix III: Household questionnaire ................................................................ 280
Appendix IV: Sampling procedure........................................................................ 294
Appendix V: Wealth ranking procedure ............................................................... 295
Appendix VI: Land utiliation and production of crops ........................................ 304
Appendix VII: Map of Milola Magharibi.............................................................. 308
Appendix VIII: Provisional land use map Ruhoma.............................................. 309
Appendix IX: REDD+ trial payments calculations ............................................... 310
Appendix X: Legal steps to CBFM ........................................................................ 311
Total word count (including footnotes and endnotes): 87,516

6
List of Tables
Table 1.1 Official REDD Pilot Projects in Tanzania ................................................... 28
Table 3.1 Recorded interviews.................................................................................... 87
Table 4.1 Housing structure 1 ................................................................................... 100
Table 4.2 Housing structure 2 ................................................................................... 100
Table 4.3 Education level ......................................................................................... 100
Table 4.4 Mean household and adult equivalent cash income.................................... 108
Table 4.5 Mean cash income per household and per adult equivalent........................ 109
Table 4.6 Relevance of sectors to total income.......................................................... 111
Table 4.7 Income from crop sales ............................................................................. 113
Table 4.8 Mean household net income from crop sales per ha temporary farm.......... 114
Table 4.9 Mean net income from cashew nut sales in M/D ....................................... 115
Table 4.10 Livestock holdings in Ruhoma and Mihumo/Darajani ............................. 116
Table 4.11 Mean holdings of chicken and goats per wealth class .............................. 117
Table 4.12 Income from livestock sales .................................................................... 118
Table 4.13 Income from on farm casual wage labour ................................................ 120
Table 4.14 Income from off-farm wage labour.......................................................... 121
Table 4.15 Income from business and services.......................................................... 122
Table 4.16 Household mean size of temporary farms per wealth group..................... 125
Table 4.17 Mean size of permanent farms per wealth group in M/D ......................... 125
Table 4.18 Distribution of vegetable farms in Mihumo/Darajani............................... 126
Table 4.19 Distribution of vegetable farms in Ruhoma ............................................. 127
Table 4.20 Mean temporary farm size (acre) per adult equivalent ............................. 127
Table 4.21 Mean permanent farm size per adult equivalent....................................... 128
Table 4.22 Overview of land uses for crop production .............................................. 128
Table 4.23 Overview of production volumes of survey respondents.......................... 129
Table 4.24 Output and productivity per wealth class in Ruhoma............................... 129

7
Table 4.25 Outputs (kg) and productivity per wealth class in Mihumo/Darajani........ 130
Table 4.26 Mean household spending on agriculture per wealth group...................... 131
Table 4.27 Household mean value of crop production per ha on temporary farm ...... 135
Table 4.28 Household mean cashew value in Mihumo/Darajani ............................... 135
Table 5.1 Carbon stock changes in Mihumo/Darajani VLFR .................................... 146
Table 5.2 Distribution of REDD+ trial payments ...................................................... 147
Table 5.3 Share of REDD+ payments to cash income in Ruhoma ............................. 148
List of Images, Figures and Graphs
Image 1.1 Official REDD Pilot Projects in Tanzania................................................... 29
Figure 3.2 Map of regional boundaries in Tanzania .................................................... 76
Figure: 3.3 Lindi Region with district boundaries and forest reserves.......................... 77
Figure 3.4 Map of Lindi showing districts and population size.................................... 78
Figure 3.5 Vegetation cover and forest reserves in Liwale .......................................... 80
Figure 3.6 Map of Angai village land forest reserve in 2009 ....................................... 81
Figure 3.7: Map of Noto and Chitoa Plateau ............................................................... 82
Graph 4.1 Livestock numbers and units per regions in Tanzania Mainland ............... 102
Graph 4.2 Utilisation of harvest by crop in Ruhoma.................................................. 104
Graph 4.3 Utilisation of harvest by crop in Mihumo/Darajani ................................... 104
Graph 4.4 Production of raw cashew nuts in Tanzania (1945 – 2012) ....................... 105
Graph 4.5 Export volume in TShs. Billion of major export crops.............................. 106
Graph 4.6 Farm gate prices for cashew nuts in Tanzania (2005-2011)....................... 106
Graph 4.7 Household annual mean cash income in USD........................................... 110
Graph 4.8 Relevance of cash income sources to wealth groups ................................. 111
Graph 4.9: Household mean income from crop sales................................................. 115
Graph 4.10: Household mean net income from cashew sales .................................... 116
Graph 4.11 Share of individual crops in total production in Ruhoma......................... 131

8
Graph 4.12 Share of individual crops in total production in Mihumo/Darajani .......... 132
Graph 4.13 Share of crops in total production for poor and wealthy in Ruhoma........ 133
Graph 4.14 Share of crops in total production for poor and wealthy in M/D.............. 134
Graph 5.1 Perceptions of collective benefits from forest protection........................... 139
Graph 5.2 Perceptions of individual benefits from forest protection.......................... 140
Graph 5.3 Perception of the condition of forest reserve............................................. 143
Graph 5.4 Perceptions of elite capture of benefits ..................................................... 144
Figure 5.1 Total carbon stock in Mihumo/Darajani VLFR ........................................ 145
Graph 5.5 Mean share of REDD+ trial payments to total income.............................. 148
Graph 5.6 Spending of REDD+ trial money.............................................................. 149
Graph 5.7 Opportunity costs of agricultural land use and REDD+ in Ruhoma .......... 153
Graph 5.8 Perceptions on carbon dioxide.................................................................. 159
Figure 5.2 Images from training material used by TFCG/Mjumita REDD+............... 166
Figure 5.4 Photos of multi media evening in Ruhoma............................................... 169
Figure 6.1 Map of Ruhoma and surrounding villages................................................ 185
Graph 7.1 Villagers’ perceptions of ownership of forest reserve ............................... 203
Graph 7.2 Perceptions of management responsibilities of forest reserve.................... 203
Graph 7.3 Perceptions of villagers over participation in decision making.................. 204
Graph 7.4 Perceptions of villagers of forest uses....................................................... 206
Graph 7.5 Perceptions of villagers of training in forest management......................... 209
Graph 7.5 Perceptions of villagers of village income and expenses ........................... 221
Graph 8.1 Awareness of Conservation Agriculture in Mihumo/Darajani................... 249
Graph 8.2 Awareness of Conservation Agriculture in Ruhoma ................................. 251
Graph 8.3 Perceptions of Conservation Agriculture in Ruhoma ................................ 252
Graph 8.4 Perceptions of Conservation Agriculture in Mihumo/Darajani.................. 253

9
Abstract University: The University of Manchester Candidate: Andreas Scheba Degree title: Doctor of Philosophy Date: May 2014 Thesis title: Commodifying forest carbon: How local power, politics and livelihood
practices shape REDD+ in Lindi Region, Tanzania
International efforts to promote REDD+ (Reducing emissions from deforestation and degradation, conserve and enhance forest-carbon stocks and sustainably manage forests) have enjoyed widespread support in climate negotiations. While proponents of this ‘payments for ecosystem services’ approach proclaim win-win benefits, others critique this commodification of forest carbon for contributing to social and environmental injustices that will undermine conservation and development in the longer-term. In this dissertation I respond to these concerns by critically examining how REDD+ initiatives emerge in the context of Lindi Region, Tanzania. I specifically investigate how REDD+ initiatives interact with local livelihood practices, local forest governance and the drivers of land use in order to interrogate the mechanism’s contribution to local development. I conducted ethnographic fieldwork in two villages, both characterised by relatively large forest areas and ‘shifting cultivation’, where different REDD+ projects are underway. In total I stayed in Tanzania for 11 months and applied qualitative and quantitative methods that resulted in 116 recorded interviews, one focus group discussion, innumerable journal entries from ethnographic interviewing and participant observation, 118 household surveys and data from document analysis. Drawing on debates within international development and neoliberalisation of nature I conceptualise REDD+ initiatives as processes promoting ‘inclusive’ neoliberal conservation. In doing so I point at the inherent contradictions of this mechanism that aims to combine neoliberal conservation logic with inclusive development objectives. I empirically examine local livelihood practices to question popular notions of land use and argue that REDD+ initiatives must grapple with poverty, intra-village inequality and villagers’ dependence on land for crop production to contribute to inclusive economic development. I follow up on this argument by discussing the importance of material and discursive effects of REDD+ initiatives to the livelihoods of poor, middle-income and wealthy households and to forest conservation. I then link these effects to an examination of how power and politics shape the implementation of REDD+ initiatives on the ground, specifically discussing the technically complex and politically contested process of territorialisation and the local practices of community-based forest management. I illustrate how seemingly technical REDD+ initiatives are inherently political, which gives them the potential to contribute to local empowerment. At the same time I question naïve assumptions over community conservation and good governance reforms by showing in detail how community-based forest management institutions are practiced on the ground and how this affects benefit distribution within the villages. My last empirical chapter examines how Conservation Agriculture is introduced in the villages as the best way to reconcile agricultural development with forest protection. I specifically discuss the role of social relations in shaping the dissemination and adoption of this new technology in rural Tanzania. Throughout this thesis I argue that local livelihood practices, power struggles and politics over land and people shape how REDD+ initiatives, as inherently contradictory processes of ‘inclusive’ neoliberal conservation, emerge on the ground and I empirically show what this means to different forest stakeholders.

10
Declaration I, Andreas Scheba, declare that no portion of the work referred to in the thesis has been submitted in support of an application for another degree or qualification of this or any other university or other institute of learning.
Copyright Statement i. The author of this thesis (including any appendices and/or schedules to this thesis) owns certain copyright or related rights in it (the “Copyright”) and s/he has given The University of Manchester certain rights to use such Copyright, including for administrative purposes. ii. Copies of this thesis, either in full or in extracts and whether in hard or electronic copy, may be made only in accordance with the Copyright, Designs and Patents Act 1988 (as amended) and regulations issued under it or, where appropriate, in accordance with licensing agreements which the University has from time to time. This page must form part of any such copies made. iii. The ownership of certain Copyright, patents, designs, trade marks and other intellectual property (the “Intellectual Property”) and any reproductions of copyright works in the thesis, for example graphs and tables (“Reproductions”), which may be described in this thesis, may not be owned by the author and may be owned by third parties. Such Intellectual Property and Reproductions cannot and must not be made available for use without the prior written permission of the owner(s) of the relevant Intellectual Property and/or Reproductions. iv. Further information on the conditions under which disclosure, publication and commercialisation of this thesis, the Copyright and any Intellectual Property and/or Reproductions described in it may take place is available in the University IP Policy (see http://documents.manchester.ac.uk/DocuInfo.aspx?DocID=487), in any relevant Thesis restriction declarations deposited in the University Library, The University Library’s regulations (see http://www.manchester.ac.uk/library/aboutus/regulations) and in The University’s policy on Presentation of Theses

11
Acknowledgements When I began my studies for this degree I knew very little about conservation and development. It is the result of many people from different parts in the world that I succeeded in writing this dissertation. I take this chance now to thank them for their invaluable support. I would like to thank the Austrian Ministry of Science and Research for financing the first year of my PhD studies. I am also grateful for financial support received from the School of Environment, Education and Development at the University of Manchester that contributed to fieldwork and conference expenses. I thank Dr. Irmeli Mustalahti for granting me access to her research project “The role of Participatory Forest Management in Mitigation of and Adaptation to Climate Change: Opportunities and Constrains” (financed by the Academy of Finland) and her support especially prior to my fieldwork in Lindi, Tanzania. In Tanzania I would not have been able to conduct fieldwork without the help of numerous people. I want to thank Benjamin Kinyamasongo at KIU in Dar es Salaam for his great Swahili teaching skills. My gratitude goes to Dr. Zahabu for acting as my local contact person. I am grateful to COSTECH (Tanzania Commission for Science and Technology), the Lindi Regional Administrative Secretary, Liwale District Council and Lindi Rural District Council for allowing me to conduct research in their respective areas. I am indebted to the district officers in Liwale and Lindi Rural districts, especially of the community development and natural resource departments, for their assistance from the beginning. I want to especially thank Mr. Mukama, Mr. Kabobe, Mr. Kangungu, Mr. Mkoveke, Mr. Mzui, Mr. Mwaipopo, Mr. Stanford, Mr. Shenkalwa and Mr. Nkuli for their kindness and help. In the project sites I received great support from the TFCG/Mjumita and LIMAS project staff. In Liwale I especially benefited from the assistance of Alex Njahani. In Lindi Rural I am greatly indebted to Raymond, Hamsa and Mohamed for their generosity and help during my time there. My special thanks also go to Hadija and Sarobidy, whom I got to know in Tanzania, for sharing your ideas and knowledge with me. In the villages of Mihumo/Darajani and Ruhoma I am grateful for the support that I received from some of the most forthcoming people in the world. They are too many to name them all. I am grateful to the village councils, village executive officers and village chairmen for supporting my stay there. My special thanks go to the family of Kijonjo, Ngamange and Likelile for taking care of me and allowing me to live in their homes. I thank my friends Shamu, Ali and Hemedi for showing me around in the villages, teaching me Swahili and explaining to me culture and life in rural Lindi. Thank you all for your hospitality, generosity and kindness during the many days I lived with and among you. In Manchester I benefited from the exceptional administrative and intellectual environment of the Institute for Development Policy and Management and the School of Environment, Education and Development. The department was a wonderful place for learning, researching and writing. I thank Monique, Elaine and Debra for their great support with regard to administering the PhD and all the academics for their dedication and willingness to assist in various ways.

12
Whenever I stayed in Manchester the department was a place of great enjoyment, fun and laughter thanks to lovely people such as Alex, Ana Sofia, Eleni, Chris, Gemma, Issac, Jaime, Jana, Jessica, Mark, Nikhila, Purnima, Sarah and Sooyoung. Thank you for making Manchester a great place to come to. My participation in the Society and Environment Research Group and especially in the Reading Group on Conservation and Society was invaluable for my intellectual development. I am grateful for the many discussions and exchanges I had with Aarti, Carlos, Jess, Johan, Judith, Lisa, Nathan, Robbie, Rosaleen, Tomas and many others. Among all the people in Manchester some were particularly kind to my wife and me. Special thanks go to Ashish and his family Shivani, Aru, Asmi, to Melanie, to Somjita, to Sumana and to Laura and Matt for providing us with not only a place to stay (or a place to keep our stuff), but a home to live in. Likewise, I want to thank Lin, Arietta, Kirtanya and Anslyn for hosting us a couple of times in London. You guys are really wonderful! We will be forever grateful for your hospitality, kindness and support during all these years. After returning from fieldwork I wrote this dissertation in a couple of places including South Africa, England and Austria. In these places I am lucky to have wonderful friends who make life beyond the PhD truly enjoyable. I am deeply grateful for your love and friendship, which was invaluable in staying positive and committed. My supervisors, Prof. Dan Brockington and Prof. Phil Woodhouse, have much contributed to this dissertation and to my intellectual and personal development. With his attention to detail, accuracy and critical analysis Phil has provided me with many invaluable insights and comments over the years that made the conceptualisation and write-up of this dissertation a lot stronger. As my main supervisor, Dan has truly been extraordinary and his support went well beyond what I could have ever expected. His constant encouragements, detailed supervision and close and personal guidance made this endeavour exciting, rich, stimulating, enjoyable, fun and, perhaps most importantly, come to an end. Thank you both so much! Last but not least I want to thank my family for all their generous support. I will be forever grateful to my parents in law, Yasmin and Solly, and to my brother in law Mohammed for all the love, care and encouragement over the years. I am so lucky to have you. I am deeply indebted to my parents, Veronika and Johann Scheba, for their limitless love and support from the time I was born. You made this possible. I could not imagine life without my sisters and their husbands, Michaela and Gernot Neuhauser, Katharina and Serge Noussi, and their children Hannah, Magda, Dorian, Marwin and Lionel. You make life enjoyable. I thank you all for who you are and what you have done for us. My wife Suraya and I went through this PhD journey together. In the darkest and brightest moments of life, her love was there for me. I am so grateful to have you. I love you.
This thesis is dedicated to our beloved son, Samir.

13
Chapter 1: Introduction 1.1 Encountering people, forests and carbon in Lindi, Tanzania It is August 2011 and I find myself in a 4x4 Land Rover driving into
Mihumo/Darajani’s part of the Angai village land forest reserve, which is one of
Tanzania’s largest community-owned and protected forests. The 139,420 ha large
reserve is managed and owned by 24 villages1 in Liwale, one of six districts of Lindi
Region, in South-eastern Tanzania. Fortunately, I am not alone in this vast landscape.
With me in the car are two scholars, one district official, two villagers and the driver.
They all know each other fairly well. In fact, I am the only novice in the group. The
atmosphere is relaxed and my companions are engaging in conversation, making jokes
and excitingly look out of the window into the vast woody landscape.
I am marvelling at the driver who is skilfully navigating us across country. We are far
away from ordinary roads. I see trees, bush and grassland everywhere. I can tell that this
is not an easy drive. At times the car is moving slowly. The bumpy obscure surface
causes the steering wheel to jerkily move left and right. This doesn’t seem to bother the
driver much though. He remains concentrated and alert; fully aware of the obstacles that
will come our way: little streams, bush, trees and broken branches lying across this flat
and seemingly abandoned landscape.
I continue looking from the car into the woods. Indeed, this place is full of life. It is as
vivid as any other place on earth. You can see it, smell it, and feel it. I picture how
wildlife hide in their dens. In the grassland, shrubs and bushes, or 10 metres high up in
the trees or anywhere in between. The miombo trees are striking. In their various shapes
and sizes they stand on the nutrient-poor sandy soils; so typical for this region
(Mukama, 2010; WWF, 2014). One tree emerges after the other until it passes left or
right of the car. The trees look uniform in structure but studies show that these
woodlands are extremely rich in diversity (Mukama, 2010). In 2004 more than 133 trees
species were identified within the Angai village land forest reserve alone (S. Dondeyne,
2004). Among this great variety one can spot globally known species, highly valued for
1 Previously they were 13 villages but in the year 2008/9 eight of them split into two or three villages,
creating a new total of 24 villages.

14
their outstanding timber quality, such as: Brachystegia, Julbernardia globiflora,
Dalbergia melanoxylon and Pterocarpus angolensis (Mukama et al., 2011).
The place we are driving through belongs to the Eastern miombo woodlands. An
ecoregion of grassland and ‘savannah woodlands’ found across Southern Tanzania and
Northern Mozambique. Miombo woodlands are hugely important far beyond our place.
Their reach goes beyond these two countries far into the African continent. As an
extensive forest formation they cover about 2.7 million km2 across central, eastern and
southern Africa including Angola, Zimbabwe, Zambia, Malawi, Mozambique, Tanzania
and Democratic Republic of Congo (Frost, 1996). It is a vast forest landscape that has
been inhabited by and provided vital resources to millions of people for thousands of
years (Campbell et al., 1996; Sunseri, 2009).
Among these people are the 3,000 plus residents of the village Mihumo/Darajani who
do not hesitate to state how much they value the benefits they receive from this
extensive forest landscape (Mukama et al., 2011; Mustalahti et al., 2012; Sundström,
2010; Taku Tassa, 2010). Living in one of the world’s poorest regions, it is quite clear
how much they depend on the forest resources in order to eat, build, heat and live. The
forest provides them with poles and timber that are used for construction. Mushrooms,
fruits, wild meat and honey are collected for consumption, and villagers gather firewood
for daily cooking. And in addition the forest provides water catchments and places for
non-extractive activities including celebrating the act of circumcision. In short,
communities around the Angai forest have for long relied on the forest ecosystem to
survive and to find meaning and fulfilment in an otherwise harsh environment.
No less important is the agricultural use of the forest landscape. Peasants have utilised
this fertile forestland for the cultivation of agricultural crops for centuries (Seppälä and
Koda, 1998; Sunseri, 2009). In the near absence of livestock keeping due to existence of
the harmful tsetse fly, crop production has until today remained the major income
source in this rural economy (URT, 2012a). In growing both seasonal and perennial
crops including maize, millet, sorghum, peas, rice, cassava, groundnuts, cashew nuts
and sesame, the fertile forestland has not only helped farmers to feed a continuously
growing population but also to supply international markets with primary commodities.
In return, they have received valuable cash income for the purchase of basic necessities.

15
“We have arrived at our destination”, I am told by one of the scholars. Then all of us
eagerly leave the car to see for ourselves the state of Mihumo/Darajani’s 11,792 ha
large forest reserve. It is not long before I realise that the scholars and Liwale District
Natural Resource Officer are concerned. Some trees were cut down and late and
intensive fires passed through some of the reserve, supposedly damaging regrowth and
the quality of the secondary forest. I cannot help but notice the complaints to the two
accompanying villagers about illegal timber harvesting and the use of fire for
agricultural cultivation. A sense of disappointment takes over and the conversations
suddenly become less benign.
In this moment I recalled the complaints I had heard from development actors at
previous encounters. Among them were researchers, district officials and development
professionals who expressed concerns over the unsustainable use of (forest-)land in the
Angai villages. Referring to illegal timber harvesting and “shifting cultivation” as the
major threat to protecting the precious forests, it was clear that farmers’ way of securing
their livelihoods has once again come under criticism for their destruction of a greater
‘global’ environmental good (cf. Bernstein and Woodhouse, 2007).
Something, however, was different this time. When debating about who and what might
cause forest destruction, the people around me did not just link their concerns to the
extent of biodiversity or the amount of harvestable timber in the forest. Even the two
accompanying villagers did not primarily talk about these issues. Instead, everybody
seemed to worry about the changes in carbon stocks as a result of the unwanted
activities. People around me viewed the forest landscape from the perspective of
counting carbon contents in the trees and soil. This, I felt, was something extraordinary.
Although unrecognised, carbon stored in trees and soil has always been an integral part
of villagers’ environment, but it started explicitly with participatory forest carbon
assessments in 2009, in which all of the present people participated, that farmers began
to view their forest landscape in terms of changing carbon stocks. Since then rural
villagers in Mihumo/Darajani started to think and talk about their forests as a potential
provider of carbon credits, the new global fictitious commodity created through
international climate negotiations (Kosoy and Corbera, 2010; Newell and Paterson,
2010). By being told that from protecting forests villagers can cash in from saleable
carbon credits, the rural dwellers experienced once again an attempt by foreign actors to

16
re-direct their landscapes toward international markets. When in the past villagers were
told to produce timber, ivory, copal or wild rubber for global demand (Sunseri, 2009) it
was now the promise of selling carbon to international buyers that would bring
prosperity to Angai villages (CCI, 2011; Mukama et al., 2011; Mustalahti et al., 2012;
Sundström, 2010).
Several months later and hundred kilometres to the East in a little village called
Ruhoma, about 475 people find themselves in a similar situation. It is early March 2012
and the usually busy farming village population gathers in the village centre to witness
the arrival of special visitors driven in their 4x4 cars. The honourable guests in the
vehicle were no other than members of Tanzania’s national REDD+ task force, people
from the national capital Dar es Salaam, from the Vice President’s Office, the Ministry
of Land and the national media. All of them travelled a few hundred kilometres to
converse with Ruhoma residents about their latest experiences with protecting the
carbon in their coastal forests and miombo woodlands. I assume that my own presence
as a white European researcher further contributed to making today’s village assembly
something unusual.
The important visit was of no surprise to the villagers. Well prepared, the village
authorities welcomed the guests and seated them on humble wooden chairs behind
tables, all of which were located under a big mango tree, which was the village’s usual
place for holding assemblies. Once seated in the appropriate place, the visitors could
enjoy a group of residents performing a rehearsed song illustrating the importance of
REDD+ to forests. The performance of the song was then followed by the secretary of
the local village natural resource committee who reported the latest information about
the achievements of carbon-driven forest protection.
Finally, he presented the mode of distribution of REDD+ trial payments among
villagers and the benefits that the community derived from them. Individual villagers
were asked to step forward to tell the visitors how the trial carbon money helped them
in their daily lives. Many bought food, staples such as maize and millet, but also sugar,
salt and cooking oil with it. Others, the better-off families, added clothes, radios and
other consumer items to the purchase list. Overall, people seemed happy and
appreciated the cash they received in return for their efforts – protecting the forest
carbon on their village land. Here too, in this seemingly remote village, located on the

17
Noto plateau in Lindi rural district, the global idea of selling forest carbon has found its
way among the local peasantry in Tanzania’s rural landscape.
1.2 The REDD+ approach 1.2.1 The emerging global REDD+ regime Our two encounters between people, forests and carbon in two poor forest adjacent
villages in South-eastern Tanzania cannot be understood without considering the global
context of climate change negotiations. In recent years forests, long valued for their
timber and non-timber products, have attracted much international attention because of
their important role as carbon sinks in global climate stabilisation (Buizer et al., 2014;
Corbera and Schroeder, 2011; Karsenty, 2008; Pistorius, 2012). In a world seriously
threatened by an ever-increasing amount of greenhouse gas emissions (IPCC, 2014), the
ability of trees to sequester carbon from the atmosphere has generated much interest
across political actors. This prominence has particularly gained political support with
the popularisation of certain scientific studies, among them Stern (2006), IPCC (2007),
van der Werf (2009) and Houghton (2003), which suggested that deforestation and
forest degradation could cause between 12 to 20% of total annual greenhouse gas
emissions. Based on the assumption that reversing this trend is a quicker and easier
solution than large-scale changes to fossil fuel consumption in the global North
(Eliasch, 2008; Stern, 2006), policy makers launched into the inclusion of forest
protection into global climate mitigation efforts (Buizer et al., 2014; Corbera et al.,
2010; Karsenty, 2008).
Global support for valuing trees for their carbon sequestration functions was for the first
time expressed in the United Nations Kyoto Protocol, which was negotiated in 1997 and
ratified in 2005 (Buizer et al., 2014). The protocol’s Clean Development Mechanism, a
market-based climate mitigation instrument that allows carbon trading between
developed and developing nations, successfully commenced the linking of local forestry
and development activities with international climate finance, albeit with restrictions. In
the clean development mechanism the offsetting of forest carbon was limited to
afforestation and reforestation projects, leaving emission reductions from averted
deforestation, forest degradation and enhancing biomass carbon stocks in existing
forests out for political and methodological reasons (Corbera et al., 2010; Kanninen et
al., 2007). The limited range of forest carbon projects eligible in the clean development
mechanism contributed to a marginal role of forestry projects, at least in terms of

18
number of projects, in the compliance carbon market (Buizer et al., 2014; Thomas et al.,
2010). In early 2014 there were only 55 afforestation and reforestation projects out of
7478 registered CDM projects worldwide (UNFCCC, 2014a). The significance of
forestry carbon changed with the emergence of various voluntary carbon standards,
which allowed a wider range of land-use activities for the generation of tradable carbon
credits. In 2012 forestry and land-use activities represented 32% of all over the counter
transactions in the voluntary carbon market, ranked second only to renewable energy
projects at 34% (Peters-Stanley and Yin, 2013).
Due to concerted efforts by Costa Rica, Papua New Guinea and the coalition of
rainforest nations at conferences of parties (COP) to the United Nations Framework
Convention on Climate Change in the first decade of 21st century, a rethinking has taken
place at the global level, resulting in a much broader array of forest-related conservation
activities to benefit from (future) carbon finance (Buizer et al., 2014). Under the
umbrella term REDD+ (reducing emissions from deforestation and forest degradation,
and the role of conservation, sustainable management of forests and enhancement of
forest-carbon stocks) the international community firmly expressed their willingness to
take the protection of forests for their climate benefits to another level. In addition to
earning carbon money for planting new trees (afforestation and reforestation), countries
can tap into climate finance for emission reductions from the avoidance of deforestation
and forest degradations as well as from the improvement of carbon stocks in existing
forests (Buizer et al., 2014; Corbera and Schroeder, 2011; Pistorius, 2012).
Since then the world’s nation states have worked hard to develop the REDD+ regime,
which, starting from the initial plan to financially reward rainforest nations for emission
reductions caused by deforestation (RED), extended to incorporating avoided emissions
from degradation (REDD) and recently expanded to allowing a range of carbon-stock
enhancement and conservation activities (REDD+) to be part of this global governance
framework (ibid). Despite the expansion of the mechanism in scope, the core idea of
REDD+ has remained the same: to offer financial incentives to developing countries for
forest protection by valuing and trading the carbon stock stored in trees or not emitted
into the atmosphere (Buizer et al., 2014; Corbera and Schroeder 2011).
REDD+ can be seen as the most popular example of new market-based conservation
approaches, in which a financial value is created and exchanged for nature services

19
(Arsel and Büscher, 2012; Corbera, 2012). At its core REDD+ suggests that payments
should be made between buyers and sellers of forest carbon credits, which are
conditional on the provision of independently verified emissions reductions that must be
‘additional’ to what would have happened in the absence of the project. They must also
be permanent in their nature, which means they must last for many years (often 20 years
or more) (Clements, 2010; Wunder and Wertz-Kanounnikoff, 2009). The idea of
REDD+ is thus quite straightforward in suggesting “that conservation of carbon stocks
in forests will occur only when the money received for reducing deforestation and forest
degradation exceeds the most attractive opportunity cost foregone, for instance income
from forest clearance and conversion to agriculture.“ (Buizer et al., 2014:2). Arild
Angelsen, agricultural economist and one of REDD+’s most prolific supporters,
explains the simple logic (Angelsen, 2009, p. xii).
A core idea behind underlying REDD+ is to make performance-based payments, that is, to pay forest owners and users to reduce emissions and increase removals [of carbon from the atmosphere]. Such payments for environmental (or ecosystem) services (PES) has its merits: it provides strong incentives directly to forest owners and users to manage forests better and clear less forestland. PES will fully compensate carbon rights holders that find forest conservation more lucrative than the alternatives. They simply sell forest carbon credits and less cattle, coffee, cocoa or charcoal.
1.2.2 REDD+ readiness Despite being a rather simple idea, i.e. paying forest owners for the protection and
enhancement of carbon stocks, the design and implementation of REDD+ globally and
on the ground, faces numerous challenges. A number of international stakeholders,
among them governments, UN organisations, NGOs, private companies and universities
have all been involved in attempting to resolve ongoing complex technical,
methodological and political problems.
“REDD+ readiness programmes” and demonstration projects have been implemented
by various agencies to prepare and assist developing countries in the design and
implementation of REDD+ (CIFOR, 2012; Corbera and Schroeder, 2011). The United
Nations established the REDD Programme which is implemented by its three
organisations FAO, UNEP, UNDP. The World Bank launched its Forest Carbon
Partnership Facility and Forest Investment Programme. Norway started its International

20
Climate and Forest Initiative and in addition contributed to the Amazon Fund and
Congo Basin Fund. Together these programmes have supported more than 40 countries
in analysing historical land-use emissions, designing baselines and drafting future
carbon sequestration strategies (Corbera and Schroeder, 2011)
According to estimates by Streck and Parker (2012) around USD 14.5 billion were
spent on REDD+ activities in 2010 by different international and national actors,
expecting to reach USD 32.1 billion per year by 2020. Over the years more than 500
forestry and land-use carbon projects have been implemented by companies,
international NGOs, governments and climate investors, covering an area of more than
26.5 million hectares of forests around the world. Market value of forestry and land-use
projects decreased by 8% from 2011 to 2012 still reaching a respectable sum of USD
216 million. Over time a cumulative 134 MtCO2e was transacted through forestry and
land-use projects amounting to an estimated total value of USD 0.9 billion (Peters-
Stanley et al., 2013).
Project developers have struggled with several issues foremost with problems of
ensuring permanence and avoiding leakage of carbon emission reductions (CIFOR,
2012; Corbera et al., 2010; Karsenty, 2008). These challenges relate to the difficulties
with measuring, reporting and verification (MRV) and setting the baseline of forestry
and land-use related emissions (ibid). The credibility of REDD+ crucially depends on
real, measurable and additional emission reductions or carbon stock enhancements.
Proponents agree that what is needed is a functioning monitoring, reporting and
verification system as well as agreed reference levels of past and projected emissions
(CIFOR, 2009). While considerable advances in remote sensing of forest cover and
carbon sequestration modelling has been made in the last decade (Melick, 2010;
Seymour and Forwand, 2010), there are still doubts whether carbon emission reductions
will be accurately measured and monitored. Capacity deficits in technical, human and
financial resources of REDD+ countries that limit consistent and transparent data
collection and analysis remain an important challenge. Experience has shown that there
are considerable gaps in measuring and monitoring degradation that need to be resolved
(Angelsen, 2009; Corbera et al., 2010).
How to finance REDD+ programmes is another significant matter that has not been
resolved yet. Much more money to what has already being spent will be required to

21
flow from developed to developing countries to finance REDD+ in future. For this to
materialise a variety of finance sources will be utilised including public funds and
private markets (Angelsen, 2009). The common understanding is that funding will vary
according to the different phases of implementation. Voluntary carbon markets and
bi/multilateral public funds will provide the financial support for REDD+ activities in
phase 1 and 2 (Angelsen, 2009). Once in phase 3, money from the international
compliance carbon market, which stakeholders utilise to meet legally binding
greenhouse gas reductions agreements, could most likely become the main source of
finance (Clements, 2010; Corbera et al., 2010).
Although nation states agreed at the latest COP in Warsaw that REDD+ finance should
be “adequate and predictable” (UNFCCC, 2014b) uncertainty still remains as to where
the money will come from. The Warsaw REDD-plus framework (UNFCCC, 2014c)
also recognised the importance of social safeguards and transparency in benefit sharing,
and stipulates clear rules on monitoring, reporting and verification of emissions. The
principle of free, prior and informed consent has been promoted as one of the most
important social safeguards that project stakeholders should adhere to when
implementing REDD+ on the ground. Project participants are referred to the ILO
Convention 169 and UN Declaration on the Rights of Indigenous Peoples and the
principle of benefit-sharing of the Convention on Biological Diversity (UNFCCC,
2013). A number of organisations have started to come up with specific provisions on
safeguards that shall guide REDD+ project implementation. Examples are The UN-
REDD Programme’s Social and Environmental Principles and Criteria, World Bank
Safeguards and Strategic Environmental and Social Assessment, and the REDD+ Social
and Environmental Standards.
1.2.3 REDD+ beyond carbon: social and biodiversity aspects In addition to compensating forest owners for their valuable carbon sequestration
services, it has been argued that REDD+ and carbon forestry projects can contribute to
social and biodiversity objectives (Corbera and Schroeder, 2011; Ebeling and Yasue,
2008; Harvey et al., 2010; P. D. Hirsch et al., 2011; UN-REDD, 2009). Although
REDD+ initiatives remain firmly focused on valuing and financially rewarding carbon
stocks in forests (Buizer et al., 2014), the debates have broadened over the years and
extended into examining the potentials and risks beyond carbon (Lawlor et al., 2013;
Poudyal et al., 2013).

22
This expansion of the debate thus highlights the longstanding knowledge that forests are
important to humans and nature for more than their carbon sequestration functions
(MEA, 2005). It is well known that forests are critical for all life on earth as they
provide us and other species with a range of “ecosystem services” (MEA, 2005).
However, some of these benefits are in harmony and others in conflict with carbon
sequestration.
For instance, although proponents of REDD+ have argued that it has the potential to
deliver biodiversity co-benefits (Gardner et al., 2012; Harvey et al., 2010; Phelps et al.,
2012; Pistorius, 2012), also the opposite has been suggested (Phelps et al., 2012; Potts
et al., 2013). Trade-offs between carbon and biodiversity can emerge due to
fundamental ecological differences between the two (ibid). Critics suggested that
REDD+ projects are likely to target carbon rich forests leaving aside more biodiversity
rich landscapes (Venter et al., 2010). As a potential solution to this problem the concept
of decoupling, understood as the “optimally locating both carbon and biodiversity
services on a landscape in a spatially explicit manner”, has been recently presented
(Phelps et al., 2012; Potts et al., 2013, p. 3).
Similar debates exist with regard to the livelihood consequences and social benefits of
REDD+. Many supporters of REDD+ suggested that the mechanism could contribute to
climate mitigation and socio-economic development (Angelsen, 2008; Ebeling and
Yasue, 2008; Kanowski et al., 2011; Lawlor et al., 2013). One argument goes that
REDD+ can provide significant amounts of money desperately needed by developing
countries to promote socially beneficial forest protection (Kanninen et al., 2007). The
implementation of REDD+ projects can provide a range of development benefits
including employment (Lawlor et al., 2013), additional or more diversified income
(Lawlor et al., 2013; Mahanty et al., 2013b; Swallow and Goddard, 2013; Wunder and
Albán, 2008), infrastructure development (Lawlor et al., 2014; Mahanty et al., 2013),
better governance and democratisation (Joshi et al., 2013; Kanowski et al., 2011;
Poudyal et al., 2013), improved knowledge, capacity and understanding of conservation
values (Palmer Fry, 2011).
Engel et al. (2008) and Kinzig et al. (2011) warned against creating hopes of poverty
alleviation and development benefits from REDD+ implementation as payments for

23
ecosystem schemes are primarily conservation strategies and should not be
overburdened with social and economic objectives that they cannot fulfil. This
perspective has been criticised by Corbera and Pascual (2012) who point out that one
cannot ignore questions over distributional and procedural issues when designing and
implementing PES in developing countries as this would risk delegitimizing the
mechanism, which could be counterproductive for its conservation effectiveness.
REDD+ and forest carbon initiatives have received much criticism from the moment of
their inception for their potential negative social results. Critics highlighted from the
outset that restrictions of access and use to forests for the protection of carbon could
cause significant livelihood losses and hardship to forest communities. REDD+ projects
could cause unjust alienation of local people from forests to allow powerful
conservation organisations, states and corporations to benefit from the new carbon-
revenue stream (Griffiths, 2009; Lawlor et al., 2013; Lovera, 2009; No REDD, 2011;
Phelps et al., 2010).
Empirical evidence has confirmed the legitimacy of these fears. A recent review by
Lawlor et al. (2013) shows that some projects resulted in population resettlements and
restricting use and access for sub-populations. In a paper volume produced by non-
governmental organisations (all openly critical of REDD+) it was also stated that
REDD+ preparations in Kenya resulted in the forced displacement of more than 1,650
Ogiek families since November 2009 (No REDD, 2011). Another widely reported story
by Oxfam International concerned the eviction of over 22,000 people from the Mubende
and Kiboga districts in Uganda to make way for a carbon project (Grainger and Geary,
2011).
Studies have also shown that with some projects the carbon benefits received do not
cover the foregone opportunity costs of avoided land use activities (Evans et al., 2014;
Mahanty et al., 2013b; Nelson and de Jong, 2003; Palmer and Silber, 2012). To avoid
becoming “poverty reproducers” (Wollenberg and Springate-Baginski, 2009) some
scholars have argued that REDD+ should provide additional income, alternative
livelihoods, and security over land tenure and local resource rights to communities. In
addition long-term pathways out of poverty must be created and communities must be
assisted to reduce the pressure of deforestation (Evans et al., 2014).

24
In this situation of potential positive and negative effects, several scholars have thus
suggested to think of REDD+ in terms of trade-offs (Bottazzi et al., 2014; Buizer et al.,
2014; Evans et al., 2014; Hirsch et al., 2011; Visseren-Hamakers et al., 2012). Instead
of win-win-win rhetoric scholars are encouraged to use critical trade-off analysis to
determine the winners and losers of REDD+ and similar conservation interventions
(ibid).
1.2.4 Governing people, forests and carbon How REDD+ interventions distribute costs and benefits across different stakeholders
crucially depends on governance decisions and practices on the ground. Therefore, a
growing number of scholars have argued that more attention needs to be paid to
governance issues when examining REDD+ (Agrawal et al., 2010; Chhatre et al., 2012;
Corbera and Schroeder, 2011; Evans et al., 2014; Lederer, 2012; Ribot and Larson,
2012). ‘Governance’ in the context of REDD+ means ‘who gets to decide what about
forests, and how’ (cf. Cotula and Mayers, 2009). Given that tropical forest loss and
degradation is deeply rooted in social, political, economic and ecological processes that
operate at local, national and global scales (Geist and Lambin, 2001; Seymour and
Forwand, 2010), governance and institutional factors become decisive in shaping forest
management and use (Ostrom and Nagendra, 2006). Corbera and Schroeder (2011:90)
state:
REDD+ is a governance process with multiple actors, interests and activities, involving several sources of formal and informal power and authority (UN bodies, multilateral organisations, governments, but also community and indigenous organisations), which all influence each other and may or may not coincide in their interests and vision regarding how such strategy of forest and climate governance should actually look like in the near future.
This is important to recognise because as a form of governance REDD+ shapes how the
problem of tropical deforestation and degradation is framed as well as the possible
solutions (Thompson et al., 2011). Thompson et al. (2011) describe how REDD+
derives its legitimacy to govern over a number of different actors and stakeholders and
transform a number of objects including land cover, livelihoods activities, ecosystem
services and governance capacities in a variety of different settings by linking itself to
the broader concern for global wellbeing in the sense of mitigating global climate
change.

25
Many scholars have emphasised that for the mechanism to obtain local legitimacy it
must provide equitable and just outcomes, adhere to good governance practices,
promote inclusive policies, institutional frameworks, transparency and address
corruption (Corbera and Schroeder, 2011; Kanowski et al., 2011; Larson and Petkova,
2011). In fact ‘good governance’ has become one of the most highlighted issues around
REDD+ since implementation activities started. In 2010 all member states of the
UNFCCC agreed in their negotiations during the COP16 in Cancun, Mexico, that for
REDD+ to succeed in conserving forests and providing its co-objectives, a participatory
democratic inclusion of the many stakeholders associated with and affected by forest
governance is absolutely crucial. In particular the agreement confirms the necessity to
show “respect for the knowledge and rights of indigenous peoples and members of local
communities” and “the full and effective participation of relevant stakeholders, in
particular indigenous peoples and local communities” (UNFCCC, 2011).
Governance includes a variety of issues but highly important to REDD+ are questions
around tenure and local participation (Chhatre et al., 2012). Tropical forests tend to be
in remote areas where rural people’s property rights over land and forests are often not
clearly defined, recognised and enforced. Project implementers have thus been
confronted with issues around unclear tenure over forests and forestland across the
South when designing REDD+ interventions (Naughton-Treves and Wendland, 2014).
Secure land tenure is suggested to be a key factor in ensuring equitable and effective
REDD+ outcomes (Chhatre et al., 2012; Larson et al., 2013; Naughton-Treves and
Wendland, 2014). Sunderlin et al. (2014) state that a variety of efforts are underway to
address tenure insecurity including participatory mapping, boundary demarcations,
clarification of formal tenure rights, regularization, strengthening the legal basis for
community-based forest management, and defending against external claims on land
within project boundaries.
Local participation of forest communities in designing and implementing REDD+ is
further regarded to be a necessary requirement to achieve equitable, efficient and
effective conservation on the ground. Many scholars have expressed their support for
decentralised and locally owned forest management regimes to avoid cases of social
injustice (Agrawal and Angelsen, 2009; Chhatre et al., 2012; Ribot et al., 2010;

26
Sandbrook et al., 2010). For decades community-based forest management (CBFM) has
been promoted as the best means of preventing alienation while delivering multiple
socio-ecological outcomes. The premise underlying these reforms is that sustainable
management is most likely to occur where local users are able to manage and extract
benefits from natural resources (Chhatre and Agrawal, 2008; Ostrom and Nagendra,
2006; Ribot et al., 2010). Decentralized forest management is also understood as a way
to promote a broader democratisation process in developing countries, with positive
outcomes for the performance of local governance institutions (Wily and Dewees, 2001;
Wily, 2001). Prominent scholars have argued that CBFM can help sequester carbon
without adversely affecting the equity benefits for local communities (Agrawal and
Angelsen, 2009; Chhatre and Agrawal, 2009; Larson and Petkova, 2011).
1.2.5 REDD+ in Tanzania Forests are of great importance to Tanzania’s 45 million citizens. According to a World
Bank study, rural populations derive significant forest services most of which are
unaccounted for in official statistics but estimated to be equivalent to 10 to 15 percent of
the country’s gross domestic product or between 35 USD and 50 USD per capita per
year. When placed in relation to a gross national income per capita of about 350 USD,
one can easily see the importance of forests as a livelihood source. It was also estimated
that forests provide around 90% of the country’s energy supplies, 75% of building
supplies and 100% of traditional medicines (World Bank, 2008).
The country has vast forest resources. In total, Tanzania mainland has about 33.4
million hectares of forests, covering just below 40% of its 88.6 million ha large
landmass. Out of the 33.4 million ha forests, woodlands cover about 90%, the rest are
mangrove forests, montane forests, small patches of coastal forests and plantations of
softwood and hardwood (URT, 2013). Of the total forest area 16 million ha are reserved
forests, 2 million ha are in national parks and the remaining 15.4 million ha are
unprotected forests found in Village and General lands, which is generally open-access
land (ibid).
According to official statistics the country is experiencing considerable rates of
deforestation and forest degradation. The FAO data, to which governments generally
refer to, use satellite imageries from different time periods, which suggest that the
country loses an average of 403,000 ha of forests (>1% of remaining forest area) each

27
year (URT, 2013). The average amount masks of course regional differences: coastal
forests and miombo woodland are seen to have declined by something closer to 7% and
13% respectively, compared to estimated forest decline in the Eastern Arc Mountains of
around 1%. The degradation of forests plays an equally important role in Tanzania, but
it is even less understood than deforestation (Burgess et al., 2010).
Deforestation and forest degradation are taking place both in reserved and unreserved
areas, although the latter seems to be much more affected. Official accounts from the
Government of Tanzania (URT, 2013) mention settlement and agricultural expansion,
uncontrolled wild fires, timber extraction, intense livestock grazing, industrial
development, firewood and charcoal production, refugees, illegal mining and most
recently large scale agriculture of bio-fuel production as direct and indirect drivers of
land-use change in the country. The most significant factors are suggested to be
“shifting cultivation”, timber extraction, firewood/pole gathering, charcoal production
and overgrazing. Other research (Ahrends et al., 2010) has documented that the impact
of urban growth is a significant factor driving forest degradation.
The Tanzanian government together with several conservation NGOs have recognised
the relevance of REDD+ to the country at an early stage, and have played an important
role in initiating dialogue, building institutional capacity and implementing pilot-
projects. A National Climate Change Steering Committee, a National Climate Change
Technical Committee, and a National REDD+ Task Force were established (URT,
2013). The country has received significant funding from Western governments to
facilitate the institution and capacity building process of REDD+. The Norwegian
government has been especially active, committing 500 million Norwegian Kroner
(around 80 million USD) directly or via the UN-REDD Programme to the country,
while additional smaller contributions came from the governments of Finland and
Germany, and the World Bank’s Forest Carbon Partnership Facility. In addition, several
conservation NGOs, who have been active in the country before, have rearranged their
budgets and programmes to include REDD+ in their stated activities (Burgess et al.,
2010). In collaboration with the private sector, universities, local and central
governments and international organisations, eight non-governmental organisations
received official funding from the Government of Norway to implement REDD+
demonstration projects. Tanzania has thus recorded the greatest number of sub-national
REDD+ demonstration projects in any African country (Lin et al., 2012).

28
Table 1.1 Official REDD Pilot Projects in Tanzania
Facilitating NGO / Project Name
Timeline and budget
Scope Actions
African Wildlife Foundation Advancing REDD in Kolo Hills Forests (ARKFor)
4 years, 2.56 m USD
21 villages and 71,632 ha of mixed land uses including 19,924 ha of forest
assessing carbon and other benefits; enhancing REDD+ understanding; improving land and forest management; developing benefit sharing mechanisms; supporting livelihoods alternatives, including better agricultural practices
Care Tanzania Hifadhi ya Mis-itu ya Asili (HI-MA) / Piloting REDD in Zanzibar through Community Forest Management
4 years 5.5 m USD
60,000 ha forest and 16,000 rural households across 29 sites
Promotes Community Forest Management (COFM) through: Addressing drivers; Improving governance, including equitable benefit sharing; Ensuring poor benefit and are not further disadvantaged; Controlling leakage, e.g. domestic woodlots and income generating alternatives; Mainstreaming gender
Jane Goodall Institute Building REDD Readiness in the Masito Ugalla Ecosystem Pilot Area in Support of Tanzania’s National REDD Strategy
3 years 2.8 m USD
90,989 ha of forest under varied ownership between 15 villages
Facilitating establishment of: inter-village CBOs to manage forests, replicable and scalable remote sensing method, community and CBO capacity to monitor carbon stocks, and community mechanism for equitably sharing carbon revenues; Expected outputs include 90,989 ha conserved forest, sequestering 55,000 MTeCO2
Mpingo Conservation and Development Initiative (MCDI)
4 years 1.9 m USD
Southern Tanzania, with expected 50,000 ha of conserved forest
MCDI aims to use REDD+ revenue to overcome start-up costs for PFM and FSC certification (combining REDD+, PFM and FSC) Expected outcomes sequestering 50,000 MtCO2e, and providing economic benefits to approximately 18,000 people
Tanzania Forest Conservation Group (TFCG) and Community Forest Conservation Network of Tanzania (MJUMITA) Making REDD Work for Communities and Forest Conservation in Tanzania
5 years 5.9 m USD
215,000 ha of forest and 51,000 beneficiaries across two biodiversity hotspots and 36 villages
Assisting communities to market emission reductions generated through interventions that aim to address the main deforestation drivers including PFM, improved agriculture, improved forest governance and land use planning; National and international advocacy on REDD+ policy
Tanzania Traditional Energy Development and Environ-ment Organization (TaTEDO) Community-Based REDD Mechanisms for Sustainable Forest Management in Semi-Arid Areas
4 years 2.1 m USD
11 villages working with 250 forests (10-50ha each)
Aggregation of forest/ Ngitili owners to facilitate REDD+ implementation and access to carbon markets; build local com-munity capacity on MRV and carbon market access; develop participatory benefit sharing mechanism; and address drivers, including energy efficient technologies and improved land use practices. Expected outcomes include 2,500 ha conserved forest, 108,285 MTeCO2, with 6,000 local beneficiaries
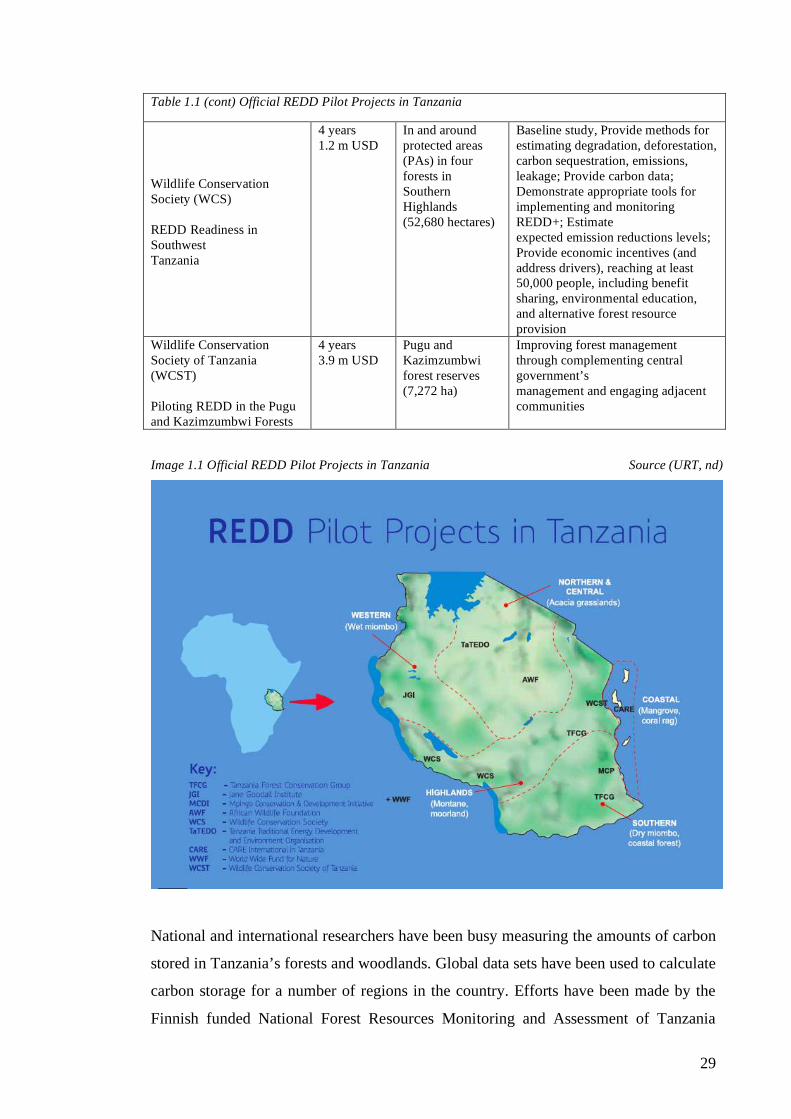
29
Table 1.1 (cont) Official REDD Pilot Projects in Tanzania
Wildlife Conservation Society (WCS) REDD Readiness in Southwest Tanzania
4 years 1.2 m USD
In and around protected areas (PAs) in four forests in Southern Highlands (52,680 hectares)
Baseline study, Provide methods for estimating degradation, deforestation, carbon sequestration, emissions, leakage; Provide carbon data; Demonstrate appropriate tools for implementing and monitoring REDD+; Estimate expected emission reductions levels; Provide economic incentives (and address drivers), reaching at least 50,000 people, including benefit sharing, environmental education, and alternative forest resource provision
Wildlife Conservation Society of Tanzania (WCST) Piloting REDD in the Pugu and Kazimzumbwi Forests
4 years 3.9 m USD
Pugu and Kazimzumbwi forest reserves (7,272 ha)
Improving forest management through complementing central government’s management and engaging adjacent communities
Image 1.1 Official REDD Pilot Projects in Tanzania Source (URT, nd)
National and international researchers have been busy measuring the amounts of carbon
stored in Tanzania’s forests and woodlands. Global data sets have been used to calculate
carbon storage for a number of regions in the country. Efforts have been made by the
Finnish funded National Forest Resources Monitoring and Assessment of Tanzania

30
(NAFORMA) Programme, which was supported by the UN-REDD Programme, to train
national technicians in remote sensing, satellite image interpretation and forest mapping
to enhance measuring, reporting and verification capacities in the country. In addition,
NAFORMA has been undertaking a National Forest Inventory based on field samples,
collecting information regarding biophysical, environmental and socio-economical
parameters (FAO, 2013). Locally based monitoring systems are also envisaged as a
cost-effective means to collect and interpret data on forest and carbon change as well as
on social and governance aspects (Burgess et al., 2010; Mukama et al., 2011).
Across the REDD+ demonstration projects the NGOs are involved in addressing
capacity issues related to forest carbon assessments, involving communities in
participatory forest management and identifying alternative livelihood strategies. A key
element of REDD+ initiatives in the country are attempts to speed up the process of
decentralising forest management, which started in the early 1990s when progressive
laws, policies and institutional frameworks were adopted (URT, 2013).
1.2.6 REDD+ in Lindi In Lindi Region of Tanzania there are currently three REDD+ interventions carried out.
Two of them are official REDD+ pilot projects that are financed by the Government of
Norway under the REDD+ programme. They are “Mpingo Conservation and
Development Initiative” in Kilwa district and “TFCG/Mjumita Making REDD work for
communities and forest conservation in Tanzania” in Lindi rural district and Kilosa
district (Morogoro Region). The third REDD+ initiative takes place in the Angai village
land forest reserve (AVLFR) in Liwale. It was initiated by Finnish researcher, Dr.
Mustalahti, and builds on a long history of Finnish development assistance in
establishing community-based forest management in Liwale. The current development
partnership programme between Finland and Tanzania in Lindi region is called LIMAS
(Lindi Mtwara Agribusiness Support) and runs from 2010 to 2014.
The three above-mentioned REDD+ projects have all highlighted the role of “shifting
cultivation”, logging and fire as the major drivers of deforestation and forest
degradation in the project areas and wider region (Forrester-Kibuga and Samweli, 2010;
Mpingo, 2013; Mukama et al., 2011). In order to increase local support of forest
protection, the project stakeholders of these three REDD+ projects stated that the most
important drivers of forest destruction must and will be addressed. While “Mpingo

31
Conservation and Development Initiative” decided to focus on fire management
techniques to reduce the impact of uncontrolled fire on forested land (Mpingo, 2013),
the project proponents of “TFCG/Mjumita Making REDD work for communities and
forest conservation in Tanzania” began to introduce Conservation Agriculture in the
villages to address “shifting cultivation” (TFCG, 2012). Conservation Agriculture is
also a main aspect of the ongoing LIMAS programme in the Angai villages of Liwale
(LIMAS Newsletter, 2013).
Conservation Agriculture represents the chosen technology to reconcile agricultural
growth with forest protection. In promoting Conservation Agriculture techniques
LIMAS and TFCG project staff hope to convince villagers to stop opening up new
farms in order to decrease the pressure on forests. Simultaneously they promise that
agricultural productivity still increases, allowing farmers to meet future food demands
and pursue economic development opportunities (LIMAS, 2010; TFCG, 2012). In
introducing Conservation Agriculture into the villages they join a powerful alliance of
global development actors who have been actively promoting this technology as the
most promising solution to Africa’s agricultural development challenge (Baudron et al.,
2012; Giller et al., 2009; Kassam et al., 2009).
Because my dissertation is based on research in the Angai village land forest reserve in
Liwale and in TFCG/Mjumita’s REDD+ project in Lindi rural district I will briefly
describe these two interventions.
1.2.6.1 REDD+ in Liwale The contemporary efforts to implement REDD+ in Angai village land forest reserve
build on previous interventions by Finnish development assistance directed at
establishing community-based forest management in Liwale district. Finland and
Tanzania have had a long development cooperation relationship particularly in the Lindi
Region and Liwale district (Seppälä and Koda, 1998; Sundström, 2010). In 1993-94 the
Liwale District council proposed to the Finnish aid programme RIPS (Rural Integrated
Programme Support; a development cooperation programme for the period of 1988 to
2004) the establishment of a Local Government Forest Reserve in the Angai2 forest.
While RIPS programme staff liked the idea of institutionalising sustainable forest
2 The name Angai, which means “poisonous roots“, (Mustalahti, 2007) summarizes a vast range of
forests, each having its own ‚local’ name such as Mbobole, Majuni, etc. (M Interview 10)

32
management, their focus on participatory development drove them to support
community centred approaches to forest management instead (Johansson, 1996 in
Mustalahti, 2007). However, between the years 1994 and 2000 efforts by RIPS staff to
create consensus with the district over the establishment of a community forest reserve
were largely unsuccessful, because of resistance from Liwale District Council to formal
loss of power and considerable income from logging operations (Mustalahti and Lund,
2010; Mustalahti, 2007).
Only in the year 2000, with the help of a new and ambitious development worker
(Irmeli Mustalahti) and in a context of favourable changes in national forestry policy
and law, a consensus on the ownership and management of the Angai forest was
reached. The District agreed to the establishment of an Angai Village Land Forest
Reserve (AVLFR) that should be managed jointly by all villages under a joint village
forest management committee (Mustalahti, 2007). After the 13 villages surrounding the
Angai forest applied in the same year for the demarcation of the forest reserve and
village boundaries, they finally obtained village land certificates and therefore legal
tenure over their village land and forest reserves in 2005 (Mustalahti, 2007). The
AVLFR covered a total area of 139,420 ha and is since then owned by 24 villages (most
of the previous 13 villages split in recent years) surrounding the Angai forest. In the
village of Mihumo/Darajani 11,792 hectares of forests were set aside under the village
land forest reserve, which covers around 40% of the entire village land (29,555 ha).
In support of the village’s efforts in negotiating and managing the village land forest
reserve with the district, RIPS decided to initiate an intervillage union called MUHIMA
(Muungano wa Hifadhi ya Msitu wa Angai). Between 2007 and 2008, several
institutions including the Tanzanian National Forest Programme, the Danish
development programme DANIDA and the Ministry of Foreign Affairs in Finland
provided technical and financial support to the Liwale District council and the villages
to prepare workable forest management plans and bylaws (Mustalahti and Lund, 2010).
In 2009 Dr. Irmeli Mustalahti (then in her capacity as a post-doctoral researcher) started
an international participatory action research project titled “The role of Participatory
Forest Management in Mitigation of and Adaptation to Climate Change: Opportunities

33
and Constrains”3. The research was specifically concerned with the idea of combining
forest decentralisation with REDD+ efforts to promote sustainable and poverty
alleviating forest management. Through the efforts by Dr. Mustalahti and her
colleagues, the idea of accessing forest carbon to promote sustainable forest
management in Liwale had gained further support by the National Forestry and
Beekeeping Division, Liwale District Council, the Clinton Climate Initiative, the
International Union for the Conservation of Nature and other research/University
partners. The Clinton Climate Initiative selected the Angai forest from a pool of 70
potential sites to support community-based forest management linked with REDD+
based carbon payments and FSC timber harvesting (CCI, 2011). However, Clinton
Climate Initiative’s proposal to include Liwale as an official site for REDD+ piloting
was not supported by the Norwegian government.
In 2010 a new Finnish led development programme started in Liwale titled LIMAS
(Lindi and Mtwara Agribusiness Support)4. LIMAS is a five-year programme aimed at
increasing agricultural productivity, business opportunities and forest management in
selected districts in Lindi and Mtwara regions. Among the options to generate more
income from forestry the LIMAS project mentions the sale of forest carbon credits
(LIMAS, 2010).
1.2.6.2 TFCG/Mjumita REDD+ project
On 6th November 2009 the Norwegian Embassy launched the “TFCG/Mjumita Making
REDD work for communities and forest conservation in Tanzania”5 as the first REDD+
pilot project in Tanzania. The TFCG/Mjumita REDD+ project is a five-year partnership
between the Tanzania Forest Conservation Group (TFCG) and Community Forest
Conservation Network of Tanzania (Mjumita). The project aim is to “reduce greenhouse
gas emissions from deforestation and forest degradation in Tanzania in ways that
provide direct and equitable incentives to communities to conserve and manage forest
sustainably”. It thus “aims to demonstrate at local, national and international levels, a
pro-poor approach to reducing deforestation and forest degradation by generating
equitable financial incentives from carbon finance sources for communities that are
sustainably managing or conserving Tanzanian forests at community level”. Through a
3 For the project website see: http://blogs.helsinki.fi/tzredd-actionresearch/
4 For the project website see: http://www.limas.or.tz/limas/
5 For the project website see: http://www.tfcg.org/makingReddWork.html

34
community carbon enterprise voluntary emissions reductions shall be aggregated and
sold according to international standards (TFCG, 2009a).
The project staff used the first half of 2010 to identify appropriate project sites for
REDD+ interventions. On the basis of various criteria Lindi rural and Kilosa districts
were selected as the two areas, where activities began to demonstrate the potential of
REDD+. By 2013 the project is implemented across 36 villages located in these two
districts with a total area of 373,200 ha, and a total forest area of 215,000. In Lindi rural
district the project includes 17 villages with a project area of 120,000 ha and a forest
area of 75,000 ha. In Ruhoma villagers set aside 2,488 hectares of forest under the
newly established village land forest reserve, which covers around 65% of the entire
village land (3,817 ha) and 88% of all forests in the village. While DANIDA had
financed PFM activities in Lindi rural and Kilosa districts (UTUMI) from 2000 to 2003,
many villages had not been part of this programme, thus no PFM related activities had
taken place before the arrival of the TFCG/Mjumita project.
1.3 Research rationale 1.3.1 Research approach and objectives Arguably REDD+ is more than just a mechanism that transfers money from the North to
South for the protection of forest carbon. From the literature review above we learnt that
REDD+ should be seen as a governance project (Thompson et al., 2011; Corbera and
Schroeder, 2011) that has the potential to “induce transformational change that
overcomes business-as-usual practices” (Korhonen-Kurki et al., 2014). It sets out to
transform “discourse, attitudes, power relations, and deliberate policy and protest action
that leads policy formulation and implementation away from business as usual policy
approaches that directly or indirectly support deforestation and forest degradation”
(Brockhaus and Angelsen, 2012, pp. 16–17). In doing so it affects the livelihoods of
various forest stakeholders on the ground resulting in winners and losers of the changes
in forest governance and management. As a value laden transformational process, which
prioritises forest carbon protection and enhancement over forest conversion, it confronts
resistance, conflicts and power struggles over land and natural resources from global to
local scales (Corbera and Schroeder, 2011).
These counter processes have the potential considerably to transform REDD+ at the
local level and making it, like we experienced with many other international policies

35
too, look very different to its initial design (cf. McAfee and Shapiro, 2010). REDD+
projects will be reshaped at the village level depending on traditions, cultures, political-
economic relations, socio-economic systems and ecological processes. Scholars
therefore call for more studies that consider how the local context specific factors,
discourses and processes shape REDD+ design and implementation on the ground
(Evans et al., 2014; Corbera and Schroeder, 2011; Sandbrook et al., 2010; Hirsch et al.,
2011). Working within the field of environmental governance they have suggested that
it is essential to analyse 1) how power and political processes come to shape its design
and actual implementation and 2) consequently how gains and losses are distributed and
allocated, with a focus on the influence of social identities, and emerging stakeholder
conflicts in particular places.
From the literature review above it is apparent that there is an intense debate about the
local livelihood consequences of REDD+ initiatives. While proponents like to
emphasise the potential economic, environmental and social benefits of REDD+
projects, critics have warned against restrictions to forest resources that are critical to
the livelihoods of poor forest dwellers. In this dissertation I respond to this concern by
empirically examining the observed and potential effects of REDD+ initiatives on local
livelihoods in Lindi, Tanzania. I do so by posing the following research question:
Research question 1: How do REDD+ initiatives interact with local livelihood strategies
in Lindi, Tanzania?
It has also been outlined above that governance reform is a critical element of REDD+
initiatives around the world. Since REDD+ projects aim to change how forest
stakeholders manage and use forestland and resources, they have to engage with
existing institutions – both formal and informal – governing human-forest relations.
Proponents specifically highlight the importance of reforming tenure regimes over
forests, ideally giving local stakeholders more control over their resources. However,
research from development theory and practice has shown that governance reforms do
not easily change the actual practices of institutions as they are deeply embedded in
social relations of power and politics (Hickey, 2013, 2012a). My dissertation aims to
respond to these issues of governance, tenure and local participation in REDD+ projects
by posing the following research question.

36
Research question 2: How do REDD+ initiatives interact with local forest governance in
Lindi, Tanzania?
In order to reduce deforestation and forest degradation REDD+ initiatives set out to
transform the primary drivers of land use change in the region. On the one hand this will
be attempted by institutional reforms towards community-based forest management and
by offering financial incentives for the protection and enhancement of forest carbon,
which should cover the opportunity costs foregone from agriculture. On the other hand
project proponents will aim to change local perceptions, opinions and discourses over
the value and benefits of forests to promote conservation friendly ways of land use. This
also includes the introduction of new technology such as Conservation Agriculture that
aims to change how farmers make use of agricultural land. While my study design and
personal skills do not allow an examination of the ecological potentials and pitfalls of
Conservation Agriculture, my research aims to provide important insights into the
socio-economic processes and factors that may hinder or promote its adoption.
Knowledge of Conservation Agriculture is critical to understanding the future potential
and performance of community based forest management and REDD+ since
agricultural expansion, which Conservation Agriculture aims to mitigate, is the single
most important driver of land use change in the villages, region and Africa at large. In
this dissertation I will carry out a critical examination of the efforts that aim to address
the drivers of land use change by responding to the following research question.
Research question 3: How do REDD+ initiatives aim to address the drivers of land use
change in Lindi, Tanzania?
From the above research questions it becomes apparent that the primary objective of my
thesis is not narrowly to test the effectiveness of REDD+ in terms of reducing
deforestation and forest carbon protection. Instead, through my research I aim to ask
critical questions about the nature of REDD+ interventions, the socio-political and
economic processes that come with it, and how local contexts and practices shape their
outcomes. This, I hope, will also shed some light on the potential ‘success’ of REDD+
to protect forests and contribute to climate mitigation. More so, however, I hope to
contribute to a better understanding of the development effects of REDD+ initiatives
and what this could mean to broader debates on development theory and practice. I

37
therefore pose a fourth, and last, research question that builds on the insights from the
previous ones to ask:
Research question 4: What is the significance of my findings about REDD+ initiatives
in Lindi, Tanzania to broader debates on development theory and practice?
1.3.2 Main and subordinated research questions In order to further specify my main research questions I will add the following sub-
questions.
Research question 1: How do REDD+ initiatives interact with local livelihood strategies
in Lindi, Tanzania?
• What are the most important livelihood strategies in the villages?
• How are local livelihoods linked to land use (change)?
• What are the benefits and losses from REDD+ in the village?
• How are the livelihoods of different village groups affected by REDD+?
Research question 2: How do REDD+ initiatives interact with local forest governance in
Lindi, Tanzania?
• How do REDD+ initiatives envisage rural villagers should govern their forests?
• How do local power struggles and politics6 shape the design and implementation
of REDD+ and forest governance at the village level?
• How do REDD+ initiatives interact with local tenure regimes?
• Ho do local villagers participate in REDD+ initiatives?
Research question 3: How do REDD+ initiatives aim to address the drivers of land use
change in Lindi, Tanzania?
• How do REDD+ initiatives change local villagers’ perceptions of farming?
6 I draw on insights from Hickey (2013:4) who build on Leftwich’s (2004) definition of politics as „all the processes of conflict, co-operation and negotiation on taking decisions about how resources are to be owned, used, produced and distributed“ but also highlight the struggle over ideas as a fundamental element of politics.

38
• What discourse is promoted in the course of introducing REDD+ in Lindi,
Tanzania?
• What are the impacts of introducing Conservation Agriculture on farming
behaviour in the villages?
Research question 4: What is the significance of my findings about REDD+ initiatives
in Lindi, Tanzania to broader debates on development theory and practice?
• How do REDD+ initiatives intend to contribute to development?
• How do REDD+ initiatives actually contribute to development?
• What type of development do REDD+ initiatives result in?
1.3.3 Thesis structure Following this introductory chapter I will proceed to present the theoretical framework
that underlines my investigation. REDD+ aims to reduce deforestation and forest
degradation by putting a financial exchange value on the carbon sequestration services
of forests. REDD+ is therefore an example of so-called payments for ecosystem
services schemes. I will begin my theoretical framework by discussing the theoretical
and practical assumptions of payments for ecosystem services. I then place payments
for ecosystem services and REDD+ within wider debates on the neoliberalisation of
nature. To do this I will draw on two bodies of literature. I will first explain the
concepts of neoliberalism and neoliberalisations within international development to
learn about the common and variegated form of neoliberalisations. In this section I will
also highlight neoliberalism’s inclusive turn in recent years. Thereafter I draw on
insights from the neoliberalisation of nature and more specifically neoliberal
conservation to learn more about REDD+ for my study. In the last section I bring the
two bodies of literature together and synthesise their arguments about the participatory
approach to development/conservation under the name ‘inclusive neoliberal
conservation’.
The third chapter will present the methods used to answer the research questions set out
in the introductory chapter. After discussing some ontological and epistemological
considerations related to my research I present the ethnographic approach as my
research strategy and describe the justification, selection and characteristics of my
selected case study sites. This is followed by information on the schedule and

39
challenges during my fieldwork, a detailed discussion of the qualitative and quantitative
methods used to collect data and the logic, assumptions and methods used to analyse the
data. I will end this chapter by discussing aspects of reflexivity and ethics of my field
research.
The fourth chapter discusses the livelihoods of villagers in Ruhoma and
Mihumo/Darajani, specifically with regard to their reliance on land for the production of
crops for food and income. I begin by comparing some data of the livelihoods in the
two case study villages with regional and national averages to analyse relative
performance regarding poverty and development. I then present information on the
amount of cash income villagers generate and the relevance of farm and off-farm
income sources to poor, middle-income and wealthy households. After this I
concentrate on showing in detail how different wealth groups make use of village land
for the production and sale of crops, which is the single most important livelihood
activity in the villages. This chapter, and the following chapter five, therefore sets the
stage for answering research question 1: How do REDD+ initiatives interact with local
livelihood strategies in Lindi, Tanzania?
The fifth chapter builds on the previous chapter to analyse the linkages between
livelihoods and REDD+ in the villages. I draw on quantitative survey results and
interview data to illustrate the benefits and losses of forest protection. This is
complemented by an examination of the REDD+ trial payments in Ruhoma and how
they compare to the opportunity costs of crop production. Having presented some of the
effects of REDD+ to livelihoods, the final section of this chapter analyses the discourse
promoted by development actors to promote forest conservation over agricultural
expansion This chapter contributes to answering research question 1, but it also offers
important findings to research question 3: “How do REDD+ initiatives aim to address
the drivers of land use change in Lindi, Tanzania?”
The chapters six and seven primarily respond to the research question 2: how do
REDD+ initiatives interact with local forest governance in Lindi, Tanzania? The sixth
chapter examines the decentralisation of forest management in our two case study
villages as a process of territorialisation that aims to shift power from the district and
customary institutions to formal village authorities. I will show that territorialisation
under neoliberalism is a complex technical and political process that highly depends on

40
state and non-state actors with limited room for villagers to determine the process,
despite donor claims of promoting ‘participatory’ development. In illustrating how
territorialisation is embedded in local politics and power struggles over votes, land and
natural resources I offer important insights to questions of how power and politics shape
the emergence of REDD+. My findings clearly show how the commodification of forest
carbon is embedded in a local political context that can either accelerate or hinder its
implementation.
In chapter seven I analyse how villagers put community based forest management into
practice. I first outline in detail the envisaged rules and regulations for the two village
land forest reserves by analysing the draft forest management plans and bylaws.
Thereafter, I will present findings from my ethnographic fieldwork to discuss the actual
performance of the community based forest management institutions. On the basis of
participant observation, interviewing and household surveys I will highlight the
convergences and divergences between the formal institutions and their practices by
villagers on the ground.
In chapter eight I will discuss efforts to promote Conservation Agriculture as the best
way to address the drivers of deforestation in the villages. I will specifically focus on
the performance of the farmer field school approach to spread knowledge about this
new technology. My findings show how Conservation Agriculture is introduced in the
villages to reduce deforestation and how this shapes local perceptions of its
opportunities and barriers. In explaining how socio-economic and cultural factors
constrain the dissemination and adoption of this new technology, I offer important
findings to answer research question 3: “How do REDD+ initiatives aim to address the
drivers of land use change in Lindi, Tanzania?”
The ninth and last chapter presents the conclusion of my dissertation. It will synthesise
the arguments presented throughout my thesis and discuss their relevance to wider
debates around REDD+, neoliberal conservation and development. In this way it will
aim to answer research question 4: “What is the significance of my findings about
REDD+ initiatives in Lindi, Tanzania to broader debates on development theory and
practice?” The last section will offer potential avenues for future research.

41
Chapter 2: Theoretical framework 2.1 Introduction In this chapter I will present the theoretical framework underpinning my study. I will
first introduce the concept of payments for ecosystem services to theorise REDD+. I
will discuss the debates around the theoretical assumptions of payments for ecosystem
schemes and their applicability in practice. This is followed by an alternative
conceptualisation of REDD+ as a process of neoliberalisation. I will analyse
neoliberalism and neoliberalisation from two different perspectives. First, I will learn
from the debates within international development to make the reader aware of the
‘inclusive’ turn of neoliberalism. Then I turn to literature on the neoliberalisation of
nature and more specifically to neoliberal conservation for an analysis of REDD+ and
payments for ecosystem services. At the end I synthesise the two bodies of literature to
derive at ‘inclusive’ neoliberal conservation as my theoretical framework underpinning
the following chapters.
2.2 Payments for ecosystem services (PES) 2.2.1 Coasean concept of PES As REDD+ places an exchange value on the carbon sequestration benefits provided by
forests, it forms part of a larger conservation ideology called payments for ecosystem
services (PES). Corbera (2012, p. 612) recently even described REDD+ “as the world’s
largest PES experiment”. Much has been written about the concept and its applicability
in practice (Muradian et al., 2013, 2010). For many years the mainstream conceptual
proposition of PES was dominated by Coasean economics that views ecosystem
services, i.e. “the benefits people obtain from ecosystems” (MEA, 2005), as positive
externalities, which are currently not paid for and thus not internalised in economic
decision-making (Muradian et al., 2010). PES programs follow this theoretical
proposition in trying to reverse this apparent market failure by internalising the positive
externalities into market or quasi-market exchanges. The argument goes as follows:
through establishing clear property rights over ecosystem services and by keeping
transactions costs low, environmental degradation can be solved by allowing actors to
trade their rights away until a Pareto-efficient provision has been achieved. Regardless
of the initial allocation of property rights, it is assumed that bargaining will lead to the
social optimum of environmental protection (Muradian et al., 2010). The creation of

42
new markets in ecosystem services is therefore proposed as the solution to
environmental degradation, which is the result of market failure (ibid).
When applying the concept of payments for ecosystem services onto REDD+, forest
ecosystems are conceptualised as providers of carbon sequestration services. To reverse
the trend of degrading or cutting down forests for the purpose of other land-uses,
payments should be made from buyers to sellers of forest-carbon credits, which are
conditional on the provisions of independently verified emission reductions from
avoided deforestation, degradation or the enhancement of forest-carbon stocks against
national or project-based baselines. This shall make the conservation or sustainable
management of forests to owners/users more economically viable than cutting them
down (Clements, 2010; Corbera, 2012; Wunder and Wertz-Kanounnikoff, 2009).
Wunder (2005, p. 3) presented the most widely used definition describing PES as
‘voluntary transactions where a well-defined ES (or a land-use likely to secure that
service) is being ‘bought’ by a (minimum one) ES buyer from a (minimum one) ES
provider if and only if the ES provider secures ES provision (conditionality)’.
According to this definition a ‘genuine’ PES scheme must fulfil three necessary
conditions: (1) there must be a clear relationship between the ecosystem provided and
the desired type of land use, (2) contracts must be voluntary and (3) additionality and
conditionality of payments for the service provided must be ensured through monitoring
systems (Muradian et al., 2010).
Based on this theoretical understanding proponents of PES argued that these
mechanisms would seek out environmental service providers of higher value and lower
cost, and are thus more flexible and cost-efficient than state or command-and-control
conservation policy in many situations (Bishop et al., 2008; Engel et al., 2008; Mayrand
and Paquin, 2004). In addition PES schemes are thought to deliver the required financial
funds that governments lack to promote the conservation of biodiversity, water, carbon,
etc. As a new market-oriented instrument it shall create innovative public-private
partnerships in order to reverse the trend of “running down natural capital assets”
(Gómez-Baggethun et al., 2010). Bishop, chief economist at IUCN, in collaboration
with members from Shell International, Forest Trends, Green Horizons and
Earthmind.net strongly illustrates this adoration of market-led conservation of nature
(Bishop et al., 2008 p. 299):

43
Conventional approaches to ecosystem management have sought to protect natural resources by taxing business and restraining the market. Such efforts often seem like a rear-guard action, defending nature while retreating in the face of growing economic pressure. There is another way […] The power of market-based environmental policy is not in doubt; the real challenge is to persuade policy makers, business leaders, and the general public that a range of ecosystem services can be managed effectively, efficiently, and equitably using market-based instruments.
People like Bishop have done well in convincing policy makers around the world about
the benefits of payments for ecosystem services. The ideology, which started in the late
1970s and particularly rose in popularity after the work of Costanza et al. (1997) and the
Millennium Ecosystem Assessment (MEA, 2005), has penetrated public and private
spheres across developed and developing countries, resulting in its adoption in several
segments of conservation policy (Gómez-Baggethun et al., 2010; McAfee and Shapiro
2010). Because of the rapid emergence and adoption of policies promoting payments for
ecosystem services across the world, Muradian proposes to think of this as “a paradigm
shift in the field of environmental conservation” (Muradian, 2013, p. 1156).
2.2.2 Alternative conceptualisations of PES With the increasing application of payments for ecosystem services across the world,
scholars have observed important deviations between the theoretical propositions
described above and actual experiences on the ground. It has been argued that PES
schemes are sometimes not voluntary or that they do not result in payments at the scale
of the service provider. Some PES schemes have not established a clear-cut relationship
between land use and the provision of ecosystem service and others have failed to meet
the criteria of conditionality (Muradian et al., 2010; Sommerville et al., 2009; Vatn,
2010). Often, and especially in developing countries, the conditions of full information,
clear property rights and competition assumed by the Coasean approach are not met in
practice (Muradian et al., 2010).
Scholars have development alternative conceptualisations of payments for ecosystem
services to more accurately reflect realities on the ground. Sommerville et al. (2009 p.
34) proposed to think of PES as “approaches that aim to transfer positive incentives to
environmental service provider that are conditional on the provision of the service,

44
where successful implementation is based on a consideration of additionality and
varying institutional contexts.” They point out that positive incentives are generally
monetary compensations for the opportunity costs incurred by participants. However,
negative incentives (e.g. social pressure, regulatory fines and punishment) may also
emerge from PES schemes, which is often overlooked in the debate, but vital to take
into consideration too (Sommerville et al., 2009).
Muradian et al. (2010) critique the Coasean approach towards PES on a number of
fronts but explicitly highlight the importance of the relationship between equity and
efficiency goals when designing and implementing schemes on the ground. In focussing
on efficiency goals while ignoring distributional issues in contexts where PES schemes
are often linked to rural development objectives, the Coasean approach is criticised for
being too limited and fails to take into account the complex situations that practitioners
face. In addition to that the Coasean approach does not pay enough attention to the role
of shared beliefs and institutions. They suggest that PES conceptualisations must pay
more attention to “the structural conditions that lead to the lack of well-functioning
markets, to trade-offs between equity and efficiency and to the importance of social
embeddedness in the design and implementation of PES schemes” (Muradian et al.,
2010 p. 1204). As an alternative they propose to define PES as “a transfer of resources
between social actors, which aims to create incentives to align individual and/or
collective land use decisions with the social interest in the management of natural
resources” (Muradian et al., 2010 p. 1205). This allows for transfers to be monetary or
non-monetary, market-based or public subsidies, but independent thereof, they are
always embedded in social relations, values and perceptions, which shape the design
and outcomes of PES in practice (ibid). In order to classify the different design and
outcomes of PES schemes they presented three criteria: the importance of the economic
incentive, the directness of the transfer and the degree of commodification of the
environmental service (ibid).
What makes payments for ecosystem services schemes different to other conservation
approaches is their performance-based character that relies on conditionality, i.e.
“whether the service provider has met the conditions of the agreement”, and
additionality, i.e. “the measure of outcomes in relation to what would have occurred in
the absence of the intervention” (Sommerville et al., 2009 p. 34). These aspects of PES
are vital as they result in the requirement of complex and methodologically challenging

45
monitoring regimes, which have not been implemented rigorously enough in many
instances (Corbera, 2012). Often the conservation outcomes are measured using proxy
land-use data as opposed to ecological indicators (ibid).
2.2.3 Poverty alleviation under PES Payments for ecosystem services as a concept is not only promoted for its nature
conservation potential but also as a means to contribute to rural poverty alleviation
(Balderas Torres et al., 2013; Pagiola et al., 2005). The provision of additional income
and potential co-benefits associated with the PES projects are thought to improve the
livelihoods of poor land owners (ibid). Because payments are made to land users, the
distribution and ownership patterns of land become decisive factors that shape the
poverty impact of PES programmes (Pagiola et al., 2005). Besides direct effects on
project participants, PES programmes may also contribute to poverty alleviation
through indirect effects including changes in land tenure, labour demand, availability
and access to other ecosystem services, strengthening local institutions, building
capacity and transferring specific know-how and building infrastructure (Balderas
Torres et al., 2013; Pagiola et al., 2005).
Other authors such as Engel et al. (2008) and Kinzig et al. (2011) argued that PES is not
primarily thought as a mechanism to alleviate poverty and conservationists should
refrain from overburden PES programmes with social and economic objectives they
cannot fulfil. This perspective has been criticised by Muradian et al. (2010) who argue
that equity and efficiency concerns are closely intertwined in PES schemes and
practitioners are confronted with difficult ethical and distributional issues when
implementing programmes on the ground. In a direct response to Kinzig et al. (2011)
Corbera and Pascual (2012) point out that ignoring questions over distributional and
procedural issues when designing and implementing PES in developing countries risks
to delegitimize the mechanism and could be counterproductive for its conservation
effectiveness. They claim that PES schemes must actively take fairness, participation,
ethical considerations and livelihood consequences into account to avoid contributing to
social and environmental injustice.

46
2.3 Neoliberalism, neoliberalisation and development 2.3.1 Neoliberalism and neoliberalisations The concept of payments for ecosystem services both in theory and practice has been
criticised for signifying neoliberal ideas of environmental governance. To many,
especially within the disciplines of development studies, human geography and
anthropology, payments for ecosystem services and other market-based conservation
policies resemble wider processes described as neoliberalisation of nature or neoliberal
environmental governance (Arsel and Büscher, 2012; Brockington and Duffy, 2010;
Büscher et al., 2012; Corbera, 2012; McAfee and Shapiro, 2010; Roth and Dressler,
2012).
Before going into the debates around neoliberalisation of nature I will first briefly take a
look at the concept of neoliberalism. The term neoliberalism is well known in and
outside of academia. Many people immediately associate with it certain historical
events, a particular ideology and distinct political economic regimes. To many
‘neoliberalism’ is practically synonymous with the intellectual work of Friedrich Hayek
and Milton Friedman, but often it is also immediately linked to the Structural
Adjustment Programmes of the Washington Consensus and the politics of Reagan and
Thatcher that started a wave of corporate globalization, privatization, financial
deregulation and liberalisation of trade across the world (Harvey, 2005; Murray, 2009;
Peck, 2013a). Neoliberalism has been used by people to describe and generally critique
contemporary forms of globalisation that restructure societies and environments,
making them more unequal and more precarious for the poor (Ferguson, 2010; Harvey,
2005). Thought of it as a political project neoliberalism has been critiqued for its
normative political ideologies and discourses that promote notions of free markets,
individual freedoms and democracy at the expense of dismantling collective institutions
and practices (Murray, 2009; Harvey, 2005). In theory neoliberal ideology is thought to
imagine a process of capital accumulation that favours state-authorised market
transformations (Peck and Theodore, 2012) of marketisation, commodification,
privatisation, de- and reregulation, market proxies in the residual public sector and the
construction of flanking mechanisms in civil society (Castree, 2008a).
By now the term has been so widely applied in all kinds of contexts that its (mis-)uses
over the many years have caused debate within academia whether it remains, or ever
was, useful as an exploratory concept (Barnett, 2005; Castree, 2010; Ferguson, 2010;

47
Hilgers, 2013; Peck, 2013b). Hilgers (2013 p. 76) recently recalled that “the multiplicity
of contradictory experiences associated with neoliberalism as well as the variety of
geographies and histories where it has been applied make consensus on a definition
particularly difficult”. The many applications of the concept, often done in an all-
encompassing and totalising way, explaining everything that is bad for the poor or the
world in general, has resulted in some analysts questioning whether we should stop
using the word altogether (Ferguson, 2010; Barnett, 2005).
In the face of powerful critiques about the ambiguity and messiness of the concept, the
thought of not saying ‘neoliberalism’ anymore sounds indeed tempting. However,
voices that call for a continuation of the term as an explanatory concept to observed
social phenomena remain pertinent (Peck, 2013b; Ferguson, 2010; Hilgers, 2013;
Castree, 2010). Their clear message though is that the usage of the term should not be
attempted without careful consideration and with as much rigour and clarity as possible.
Several scholars have therefore taken on the debate and provided us with critical
reflections that shall help us to improve our understanding of what we call
‘neoliberalism’ (ibid).
A key aspect that has been highlighted in contemporary debates about neoliberalism is
to think of it as a process rather than a fixed, monolithic ‘thing’ that hangs over the
world ready to conquer more and more places (Castree, 2008; Peck, 2013b). Instead,
neoliberalism should be seen as a process comprised of multiple yet interconnected
neoliberalisations in the plural that are organised at different spatial and temporal scales
(Castree, 2008). Neoliberalisations, as processes of restructuring, therefore always exist
among other processes that co-shape its design and outcomes. They never secure a
monopoly but always confront resistance and contradictions shaped by context specific
factors, actors and relations therefore resulting in “actually existing neoliberalism”
(Brenner and Theodore, 2002).
From this we learn that neoliberalism necessarily evolves in a ‘zigzagging course’
producing “chronically uneven spatial development, institutional polymorphism, and a
landscape littered with policy failures, oppositional pushbacks, and stuttering forms of
malregulation“ (Peck, 2013b p. 140). But these observed variegated natures of
neoliberalism on the ground must not be thought of as incomplete or partial versions of
one kind of full or ideal neoliberalism. Instead, they are all part of the whole, which can

48
only be present in ‘conjuncturally hybrid forms’ (Brenner et al., 2010; Peck, 2013b).
Neoliberalism is found, almost overwhelming empirical evidence now shows, in all manner of forms and formations, but it can never be found in a pristine state, implemented on a tabula rasa or social blank slate, in a fashion that is entirely unobstructed or unmediated. And there is no ideal type or institutional template against which hybrids can be singularly evaluated (Peck, 2013 p. 144, emphasis original)
The variegated path of neoliberalisations is therefore “not of manifest destiny but one
shaped by opportunistic moments, workarounds and on-the-hoof recalibrations, which
in practice often bear little resemblance to the lofty ideals expressed in neoliberal
theory” (Peck and Theodore, 2012, p. 179). In summing up, we can say that processes
of neoliberalisations remain forever incomplete, contradictory and unevenly realized in
an empirically observable world of “actually existing neoliberalism”.
Given all these calls for embracing locality, complexity and variegated nature of
neoliberalisations, one could easily forget about the cross-contextual patterns, strategies
and disciplines of neoliberal ideologies (Peck, 2013b; Castree, 2008; Harvey, 2005). In
observing neoliberalisations embedded in local relations we still need to remember the
importance of the extra-local contexts, which make neoliberalisations “more than the
sum of its local parts” (Peck and Theodore, 2012 p. 180). This resonates with Perreault
and Martin (2005, p. 194) who assert that “Neoliberalism is a multiple and locally
experienced process to be sure. It is also, crucially a broader phenomenon that connects
as well as differentiates, that globalizes even as it localizes“. Neoliberalisations
globalise within extra-local contexts that are shaped, here too not without their
contradictions, by a neoliberal ideology that has remained its capacity to evoke and
promote its utopian destination of specific socio-economic-cultural transformations
(Peck, 2013b p. 145; Castree, 2010; Harvey, 2005). Important to always remember, it
seems to me, is the fact that neoliberalism is but one historically specific form of
capitalism, which, as a mode of economic production and exchange, is subject to private
property, money-mediated markets, commodification (of labour power) and the need of
continuous growth for capital accumulation (Castree, 2008a; Harvey, 2011, 2005).
2.3.2 ‘Inclusive’ neoliberalism In global development policy the neoliberal ideology was particularly prevalent in the

49
Structural Adjustment Programmes of the Washington Consensus, which set out to
radically transform state-society relations in developing countries from the 1980s
onwards. Developing countries were practically forced, through conditioning finance, to
adopt key neoliberal ideas and policy programmes promoted by global finance and
development institutions including the World Bank, International Monetary Fund and
World Trade Organisation. Privatization, liberalisation, deregulation, a trust in free
markets and self-regulation became the key pillars of international development policy
at the time (Connell and Dados, 2014; Harvey, 2005; Murray, 2009; Simon, 2008). The
radical down-sizing of the state in favour of free trade and export-driven development to
serve global markets was presented as the best means to poverty eradication as
economic growth was to ‘trickle-down’ to the poorest members of the society (ibid).
With the turn of the millennium, the ideology of neoliberalism underwent an important
change within development policy and practice. In the millennium development goals,
poverty reduction strategies and world development reports one could see a kind of
realisation that unfettered market orthodoxy failed on its own terms (Craig and Porter,
2006; Hickey, 2010; Klak et al., 2011; Murray, 2009). Scholars observed an emerging
new thinking and practice of international development that some described as
‘inclusive’ neoliberalism (Craig and Porter, 2006), ‘advanced’ liberalism (Abrahamsen,
2004) or even postneoliberalism (Yates and Bakker, 2014).
This new form of neoliberal development policy still centred on promoting global
markets and free trade, as the best ways to increase overall welfare, but it also
incorporated social and political reforms to include more parts of society in wealth
accumulation (Abrahamsen, 2004; Ballard, 2013; Craig and Porter, 2006; Hickey,
2010). More specifically development policies and reforms were increasingly couched
in a language of good governance, democracy, participation, ownership, accountability
and so forth that signalled a promise of equitable and just distribution of growth (ibid).
The definition provided by Craig and Porter below neatly illustrates the character of
‘inclusive’ neoliberalism as the new basis for development policy:
While retaining core conservative neoliberal macroeconomic and pro-market policy settings, ‘inclusive’ neoliberalism adds ‘positive liberal’ approaches emphasizing ‘empowerment’ to enable participation (and ensure ‘inclusion’) of countries and people in global and local markets. These include: institution building and an enabling state ensuring global market

50
integration; building human capital via services (health, education); empowering and protecting the rights of the vulnerable though participatory voice and legal access; engendering moral obligations to community and work (Craig and Porter, 2006 p. 12).
One of the key strategies of ‘inclusive’ neoliberalism has been ‘to get the institutions
right’ to bring equitable growth: codified legal frameworks, pro-poor policy, devolved
governance, market mechanisms and participatory democracy were all highly
emphasised as necessary institutions to achieve poverty reduction (Ballard, 2013; Craig
and Porter, 2006; Golooba-Mutebi and Hickey, 2010). The most visible trends within
‘inclusive’ neoliberalism were the rise of non-governmental organisations and
participatory development approaches across the South (Bebbington et al., 2007;
Kamat, 2004). These trends clearly illustrated the idea of a more responsive state and
citizens, who were expected to “more actively engage in shaping their own futures”
(Hickey, 2010 p. 1141). In transforming themselves into rational and profit-driven
entrepreneurial agents, who also contribute to collective community well-being, the
poor were expected to participate in development initiatives through which they achieve
self empowerment (Hickey, 2010; Kamat, 2004). This, in return, has been criticised by
others to whom neoliberal participatory approaches caused more disempowerment and
exclusion as opposed to emancipatory development (Cooke and Kothari, 2001; Kamat,
2004). I will come back to the last point in more details shortly below, but before that I
will turn to the sphere of the environment for my analysis.
2.4 Neoliberalisation of nature Neoliberalism, as any other system of production and exchange, is necessarily an
environmental project (Castree, 2008a; McCarthy and Prudham, 2004). It was therefore
only a question of time until science would pay particular attention to the specific
linkages between neoliberalism and nature. In the early 2000s, this time had come, as a
growing number of scholars began to argue that over the last decades neoliberal ideas
increasingly penetrated the ‘environment’, from carbon trading to fisheries, water,
forests, ecosystem services and so on (Castree, 2010; Heynen et al., 2007; Liverman and
Vilas, 2006; McCarthy and Prudham, 2004). In key publications such as McCarthy and
Prudham (2004), Heynen and Robbins (2005), Heynen et al. (2007) and Castree (2008)
scholars made use of case study analysis to illustrate how policies and politics
transformed society-environment relations along the lines of neoliberal ideas. This and

51
other research demonstrated how, in the pursuit of capitalist growth, markets and
private companies became more and deeper involved in the management and
governance of nature (Bakker, 2010).
In the early years it was especially Noel Castree’s parsing of geographical research on
neoliberal nature that contributed much to a more comprehensive understanding of how
and why environments have been neoliberalised (Castree, 2008a, 2008b). Drawing on
Marxist philosophy Castree elucidated that within a capitalist economy processes of
neoliberalisations of natures offer firms, state bodies and other stakeholders
‘environmental fixes’ to the endemic problem of requiring sustained economic growth.
In presenting the logics behind his four identified ‘environmental fixes’ he also pointed
at the important role states play in sanctioning and assisting ‘fractions of capital’ to
“gain commercial advantage in and through the domain of the physical environment”
(Castree, 2008a p. 146).
In brief, Castree’s environmental fixes are as follows (Castree, 2008a). Environmental
fix one (1) describes the belief that the private sector can and should actively solve
environmental problems. The assumption hereby goes that in bringing the objectives of
resource conservation deeper into the logics of capital accumulation, allowing resources
and ecosystems to be privatised and marketised, the inherent contradiction of capitalist
environment-society relations shall be reduced or even overcome. His environmental
fixes two and three denote actions by private capital to further capital accumulation
through resource use/extraction either (2) via opening up the non-human world from
hindering government regulation to market rationality or (3) via discursive and
institutional actions that allow them actively to degrade hitherto protected or proscribed
environments. The last and fourth environmental fix (4) describes state actions, either
the restructuring of historical state-society relations to achieve the transfer of
environmental responsibilities to the private sector or the pursuit of “market-mimicking
ways” by state bodies to foster capital accumulation in the real of environmental
conservation.
Subsequent intellectual work that applies, refers, responds, critiques and constructively
improves the analytical premises laid out by Castree on the neoliberalisation of nature
has been abundant since then (Arsel and Büscher, 2012; Bakker, 2010; Brockington et
al., 2008; Bumpus and Liverman, 2008; Büscher et al., 2012; Corbera, 2012; Fletcher,

52
2010; Igoe and Brockington, 2007; Mansfield, 2007; Roth and Dressler, 2012).
Consequently the debates and arguments around the neoliberalisation of nature and the
nature of neoliberalisation have grown exponentially, making it practically impossible
to discuss all aspects of them in this chapter. Instead, I will focus on the specific
theoretical developments provided by scholars within this epistemic community that I
consider pertinent to my study of REDD+ in rural Tanzania. Specifically, I will draw on
recent work on ‘neoliberal conservation’ or ‘market-oriented conservation’ to further
inform my own analysis.
2.5 Neoliberal conservation Alongside many other domains of environmental governance, neoliberalisation has also
penetrated the field of conservation policy and practice (Igoe and Brockington, 2007;
Brockington et al., 2008; Büscher et al., 2012; Arsel and Büscher, 2012; Roth and
Dressler, 2012). Although conservation and capitalism have always been closely
intertwined (Brockington et al., 2008), the advent of neoliberalism has led to an increase
“in the intensity and variety of forms of capitalist conservation” (Brockington and
Duffy, 2010 p. 470). This was brought to the fore by Igoe and Brockington (2007) who,
consolidating empirical evidence from research on international biodiversity
conservation in a special issue of Conservation and Society, argued that new types of
‘neoliberal conservation’ have emerged across, particularly the poorer areas of, the
world. Packed in rhetoric of win-win promises, neoliberal conservation was seen to
restructure and reregulate relations with nature through processes of commodification
and territorialisation and via new governance networks with public and private
stakeholders (ibid).
Many of the common elements of neoliberal conservation early outlined by Igoe and
Brockington (2007) and Brockington et al. (2008) help us to make sense of
contemporary conservation policies including REDD+ or payments for ecosystem
schemes. I will now present and discuss the most relevant of their arguments drawing
on their original as well as on additional contributions by other scholars.
2.5.1 Win-win rhetoric A major point of their argument is that neoliberal conservation comes with a package of
win-win rhetoric. Conservation organisations and state entities, that design and
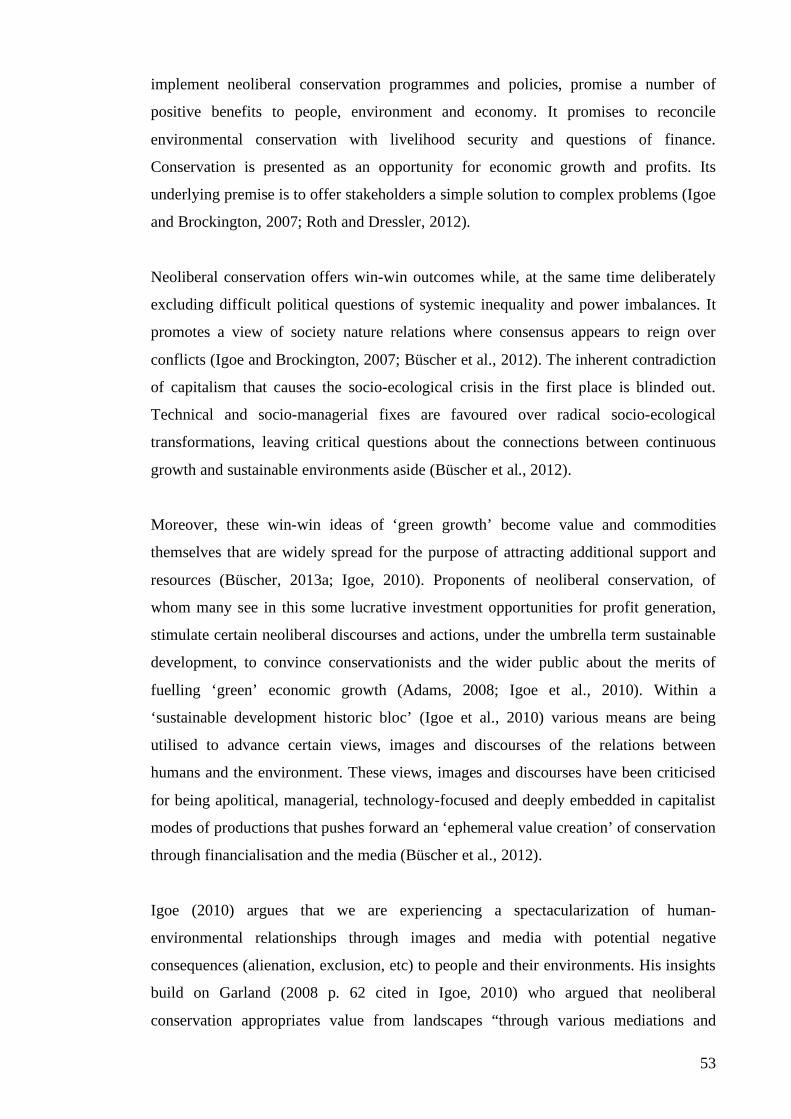
53
implement neoliberal conservation programmes and policies, promise a number of
positive benefits to people, environment and economy. It promises to reconcile
environmental conservation with livelihood security and questions of finance.
Conservation is presented as an opportunity for economic growth and profits. Its
underlying premise is to offer stakeholders a simple solution to complex problems (Igoe
and Brockington, 2007; Roth and Dressler, 2012).
Neoliberal conservation offers win-win outcomes while, at the same time deliberately
excluding difficult political questions of systemic inequality and power imbalances. It
promotes a view of society nature relations where consensus appears to reign over
conflicts (Igoe and Brockington, 2007; Büscher et al., 2012). The inherent contradiction
of capitalism that causes the socio-ecological crisis in the first place is blinded out.
Technical and socio-managerial fixes are favoured over radical socio-ecological
transformations, leaving critical questions about the connections between continuous
growth and sustainable environments aside (Büscher et al., 2012).
Moreover, these win-win ideas of ‘green growth’ become value and commodities
themselves that are widely spread for the purpose of attracting additional support and
resources (Büscher, 2013a; Igoe, 2010). Proponents of neoliberal conservation, of
whom many see in this some lucrative investment opportunities for profit generation,
stimulate certain neoliberal discourses and actions, under the umbrella term sustainable
development, to convince conservationists and the wider public about the merits of
fuelling ‘green’ economic growth (Adams, 2008; Igoe et al., 2010). Within a
‘sustainable development historic bloc’ (Igoe et al., 2010) various means are being
utilised to advance certain views, images and discourses of the relations between
humans and the environment. These views, images and discourses have been criticised
for being apolitical, managerial, technology-focused and deeply embedded in capitalist
modes of productions that pushes forward an ‘ephemeral value creation’ of conservation
through financialisation and the media (Büscher et al., 2012).
Igoe (2010) argues that we are experiencing a spectacularization of human-
environmental relationships through images and media with potential negative
consequences (alienation, exclusion, etc) to people and their environments. His insights
build on Garland (2008 p. 62 cited in Igoe, 2010) who argued that neoliberal
conservation appropriates value from landscapes “through various mediations and

54
ultimately transforms it into a capital of a more convertible and globally ramifying
kind.” Moreover, Igoe (2010 p. 376) draws on writings of Debord to highlight that
“images are not merely representations of late capitalist realities, they are an
indispensable part of those realities. They are not different and separate from the
conditions that they portray, they are produced by them and, in turn, define and
reproduce them.“ What Igoe points out is that neoliberal conservation uses images,
videos and other media in the Debordian sense of spectacle to fetishize the mediations
between people and their environments, influencing and limiting people’s conceptions
of themselves and nature to certain consumerist and capitalist-dominated perspectives
while excluding other alternatives.
All this creates a ‘discursive blur’ (Büscher and Dressler, 2012) of win-win
conservation that, empirical evidence shows, is untenable in practice (Igoe and
Brockington, 2007; Roth and Dressler, 2012). Trade-offs are the norm of neoliberal
conservation, and indeed in conservation in general (Hirsch et al., 2011), resulting in
winners and losers of enacted interventions. Counter to its rhetoric, neoliberal
conservation cannot, therefore, proclaim automatically to benefit everyone. Instead,
careful analysis is required to examine who benefits and why, likewise who loses and
why, and what does this mean to stakeholders in conservation and development (ibid).
2.5.2 Reregulation and territorialisation Another critical argument is the observation that neoliberal conservation encourages
reregulation of state-society relations resulting in increased processes of
territorialisation. Territorialisation under neoliberalisation is understood as a “new type
of state making” that produces “new types of neoliberalised state forms”. Building on
insights from Vandergeest and Peluso (1995), who defined territorialisation as “the
demarcation of territories within states for the purposes of controlling people and
resources”, Igoe and Brockington (2007) argue that neoliberal territorialisation projects
promote decentralised forms of governance with the objective to privatise and
commodify nature. This process is often driven by powerful conservation or
international finance agencies, who, because of their financial resources, technology and
expertise, are more likely to succeed in enabling these transformations of power to a
more local level within a discourse of sustainable development or in today’s words of
‘green growth’ (Igoe and Brockington, 2007). Through their active participation in the
process of territorialisation non-state actors obtain the power to claim authority over the

55
boundaries, restrictions and uses of natural resources (Corson, 2011; Peluso and Lund,
2011).
Peluso and Lund (2011 p. 673) point out that territorialisation as a process is part of
both governance and disciplining of practice associated with Foucault’s concept of
governmentality; it “produces and maintains power relations among governed
environmental subjects and between subjects and authorities”. Inspired by Foucoult’s
governmentality concept they argue that territorialisation is a governmentalisation of
space, which enables individual or collective entities control over territory and land.
Territorialization is a claim; not always a state claim, but a collaborative claim. It is in some way a bundle of rights – as one says for other kinds of property – but it produces a ‘collectivity’ in some sense, even though it would not be incorrect to say that landed property held by an individual is also a territory. Because our use of the term territory has a collective aspect, it can be seen as an explicit move to ‘governmentalize’ space (Foucault 2007) – or as we are saying in this collection, ‘to control’ by claiming the power to govern territorially. In other words, governance or control of territory constitutes a form of land control (Peluso and Lund, 2011p. 673).
Because this form of territorialisation assists the commodification of natural resources
and spaces, in order for external actors to capture them (Igoe and Brockington, 2007),
Ferguson (2006) argued that we should think of these newly demarcated territories as
‘transnational spaces’.
2.5.3 Commodification of nature Territorialisation allows property right holders over land to, in McAfee’s famous words
(1999), ‘sell nature to save it’. Neoliberal conservation intensifies market-based
conservation policies and practices on the assumption that the environmental problems
can be solved by bringing them deeper into the capital accumulation circuit of private
entities. This intensified incorporation into capitalist accumulation is achieved through
the ever-expanding commodification of acts of ‘nature saving’. Through
commodification conservation, in the past often understood as the frontier to capital
expansion, has under neoliberalism become intensively about opening-up new spaces
for surplus generation while positing the preservation of ecosystems (Büscher et al.
2012; Brockington et al., 2008; Igoe and Brockington, 2007).

56
Commodification is here understood as the process of making new things to be sold
(Castree, 2003). In contrast to real commodities such as coffee, timber or tables,
payments for ecosystem services schemes create fictitious commodities (Brockington,
2011). Other examples of these are land, money and labour. Fictitious commodities
were not produced to be sold and they do not physically exchange hands when they are
sold. Instead what people exchange, with respect to land for instance, are title deeds.
Freeing ecosystem services from their social and ecological contexts in order to become
commodities, that are ready for market exchange, requires complex social engineering
including measuring, valuing and titling exercises. At the same time commodities
always remain socially and ecologically embedded in their sites of production. The
effects market exchange has on people and environments can therefore be substantial
(ibid).
Kosoy and Corbera (2010) portray how Marx’s concept of commodity fetishism may
inform what payments for ecosystem services within the realm of capitalist conservation
could mean to us. They illustrate how the commodification of ecosystem services
involves three important stages: the framing of ecological functions as a commodity
subject to trade (separating it from the whole ecosystem), the establishment and
assigning of a standard unit of exchange for this commodity and linking providers and
users of this commodity in a market or market-like exchange. Due to the immense
complexity of ecosystems, the processes of commodification and itemisation are very
problematic as they aim to simplify and split ecosystems into independent, bounded
units. Resistance stems from the materiality of ecosystems that do not allow to be easily
split up into independent units for trade. In addition local producers of ecosystem
services face power imbalances at the extra-local level that could impact on their
incomes and thus make their situation worse.
To commodify and value nature based on their ‘ecosystem services’ in purely monetary
terms, brings forth a number of contradictions related to the representativeness of its
natural materiality (Büscher, 2013b) and ignores the existence of multiple languages of
valuation practised by different stakeholders located in multiple settings (Kosoy and
Corbera, 2010). Moral, aesthetic and ethical dimensions of nature are sidelined, which
could eventually undermine other logics of conservation, such as environmental
stewardship and collective obligations, and could end up being counterproductive in the

57
long-term if, for instance, payments cease (Swart, 2003).
Vatn (Vatn, 2010, 2005) argues that the incorporation of market logics into
conservation could modify behavioural patterns and motivations in a way that
individualism and competitions is prioritised over community and reciprocity values.
Aside from this, treating nature as a commodity entails the risk of transforming it purely
according to profit-making motives, which could result for instance in the use of
bioengineering to create more efficient ‘nature’ such as large-scale monoculture
plantations of carbon-rich trees at the expense of biodiversity (Heynen et al., 2007).
2.5.4 Hybrid governance The neoliberalisation of conservation is generally embedded in hybrid governance
regimes that encourage the increased involvement of private for-profit and not-for-profit
actors. This results in more and more conservation-business partnerships in which state
officials become highly dependent on the financial resources outsiders bring (Igoe and
Brockington, 2007). The resulting decentralised and fragmented sovereignty had earlier
been described by Ferguson (2006) as the ‘privatisation of sovereignty’ and by Mbembe
(Mbembe, 2001) as ‘private indirect government’. Sovereignty then becomes a
commodity used by state officials to enter alliances with private investors and donors,
who get to finance forms of territorialisation over land and resources for the purpose of
conservation (Peluso and Lund, 2011).
Networks of thoughts and actions are created across public and private actors from the
local to the global level. There are no easy boundaries anymore to be drawn between
‘community’, ‘state’ or ‘NGO’. They are all heterogeneous entities with connections
across spatial scales (Agrawal and Gibson, 1999). At the same time they remain highly
exclusive when it comes to money flows – money spent usually stays within these
networks (Igoe and Brockington, 2007). Governance reforms that resulted in
decentralised and community-based approaches to conservation have been particularly
favoured by private and international actors as ways to insert markets and facilitate
commodification in conservation (Büscher and Dressler, 2012; Dressler et al., 2010).
It is important to remember that scholars critical of the neoliberalisation of nature
commonly understand environmental governance “not as the ‘governance of nature’ but
as ‘governance through nature’ – that is, as the reflection and projection of economic
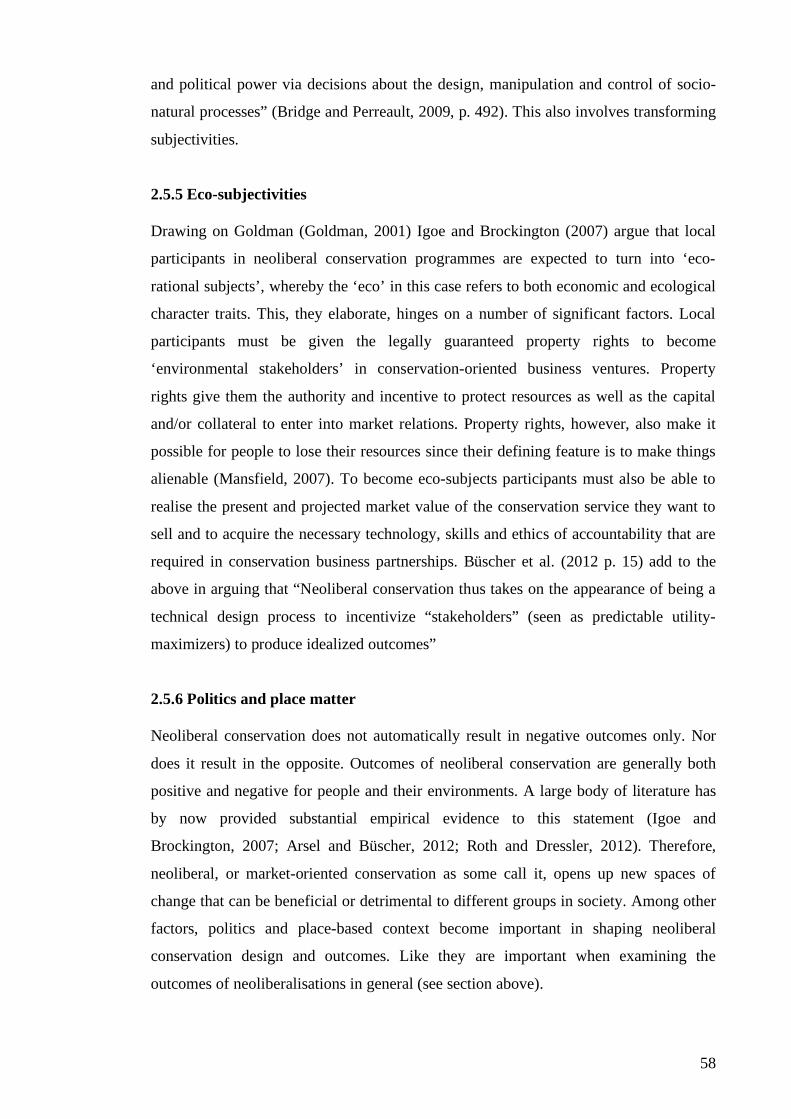
58
and political power via decisions about the design, manipulation and control of socio-
natural processes” (Bridge and Perreault, 2009, p. 492). This also involves transforming
subjectivities.
2.5.5 Eco-subjectivities Drawing on Goldman (Goldman, 2001) Igoe and Brockington (2007) argue that local
participants in neoliberal conservation programmes are expected to turn into ‘eco-
rational subjects’, whereby the ‘eco’ in this case refers to both economic and ecological
character traits. This, they elaborate, hinges on a number of significant factors. Local
participants must be given the legally guaranteed property rights to become
‘environmental stakeholders’ in conservation-oriented business ventures. Property
rights give them the authority and incentive to protect resources as well as the capital
and/or collateral to enter into market relations. Property rights, however, also make it
possible for people to lose their resources since their defining feature is to make things
alienable (Mansfield, 2007). To become eco-subjects participants must also be able to
realise the present and projected market value of the conservation service they want to
sell and to acquire the necessary technology, skills and ethics of accountability that are
required in conservation business partnerships. Büscher et al. (2012 p. 15) add to the
above in arguing that “Neoliberal conservation thus takes on the appearance of being a
technical design process to incentivize “stakeholders” (seen as predictable utility-
maximizers) to produce idealized outcomes”
2.5.6 Politics and place matter Neoliberal conservation does not automatically result in negative outcomes only. Nor
does it result in the opposite. Outcomes of neoliberal conservation are generally both
positive and negative for people and their environments. A large body of literature has
by now provided substantial empirical evidence to this statement (Igoe and
Brockington, 2007; Arsel and Büscher, 2012; Roth and Dressler, 2012). Therefore,
neoliberal, or market-oriented conservation as some call it, opens up new spaces of
change that can be beneficial or detrimental to different groups in society. Among other
factors, politics and place-based context become important in shaping neoliberal
conservation design and outcomes. Like they are important when examining the
outcomes of neoliberalisations in general (see section above).

59
Roth and Dressler (2012) recently pointed at the ‘particularities of place’ to highlight
the need for scholars to examine in detail how locally embedded social relations and
institutions shape processes of neoliberalisation or, in their own terms, market-oriented
conservation. In doing so researchers are encouraged to look at the continuities as much
as they look at change when studying market-oriented conservation practices. Often,
they argue, neoliberal conservation programmes are transformed to such an extent on
the ground that they are no longer recognisable as such. Local actors and relations
transform neoliberal conservation programmes to make them fit to the local socio-
economic context and politics.
Their arguments about the importance of local politics and context in market-oriented
conservation is clearly supported by studies, published in their special issue, that
provided empirical details of how and why PES and other neoliberal initiatives were
transformed on the ground. Similarly, Milne and Adams (2012) examined PES schemes
in Cambodia and argued that they are masqueraded as markets despite not being market
per se.
2.6 Neoliberal conservation and the commodification of forest carbon Neoliberal conservation has occurred in many spheres of conservation policy and
practice including eco-tourism, certification schemes, payments for ecosystem services,
biodiversity offsetting and so forth. One key arena of neoliberal conservation practices
has been (forest) carbon trading. Since the birth of the carbon commodity much has
been written about the ethics, politics, economics and social effects of the
commodification of carbon (Böhm et al., 2012; Bumpus and Liverman, 2008;
Lohmann, 2009; Newell and Paterson, 2010). What I will discuss in this section is the
literature that applied the theoretical underpinnings of the neoliberalisation of nature
framework to empirical findings about forest carbon conservation.
Research on the commodification of forest carbon has provided crucial insights into the
benefit distribution of such projects. Corbera and Brown (2010) make use of Ribot and
Peluso’s ‘theory of access’ (Ribot and Peluso, 2003) to analyse the social processes
underlying and influencing the distribution of benefits from three forest-carbon offset
projects. They argued that several factors – that go beyond the often mentioned aspect
of holding legal property rights over land and trees – influence who can access benefits
from the commodification of forest-carbon and why. Besides land tenure project

60
participants benefit through structural and relational mechanisms such as capital, labour,
expertise and technology from the commodification of forest carbon. These enable
certain project stakeholders such as project developers or carbon brokers to benefit from
forest carbon offset schemes despite the fact that they do not hold any property rights
over trees or land.
While several processes influence who benefits from forest carbon, current research on
the commodification of forest carbon still puts much emphasis on examining issues of
property rights over forests (Mahanty et al., 2013a). Looking at Cambodia, the
Philippines and Papua New Guinea it was found that the commodification of forest
carbon faces complications due to complex and ambiguous property rights over forested
land. Because forest carbon represent new channels of money making several entities
including states, intermediaries such as NGOs, customary owners and other local forest
users exert power to claim their stakes. This further complicates property claims on the
ground with the potential to alter the power relations among stakeholders, potentially
resulting in forms of exclusion to other benefits from the forest. This, in return, creates
forms of conflict that could threaten the effectiveness of the mechanism to protect
forests (Mahanty et al., 2013).
One long neglected aspect of forest carbon – the politics of modelling and monitoring –
was recently examined by Leach and Scoones (2013) in the context of Sierra Leone and
Ghana. They illustrate how the commodification of forest carbon, almost by default,
leads to certain path dependencies pushing projects in the direction of ‘fortress’ forms
of conservation or uniform plantations under clear state or private control. They argue
that the carbon accounting methodologies, protocols and requirements construct certain
landscape pathways promoting stability and control and one-way deforestation
narratives that threaten the livelihoods of poorer and already marginalised land and
forest users.
As outlined earlier, the particularities of place (Roth and Dressler, 2012) matter a great
deal when payments for ecosystem services schemes are implemented on the ground.
Lansing (2013) illustrates this in the context of Costa Rica where a payment scheme
targeted at incentivising reforestation results in an indirect state subsidy for large
agribusiness. This, however, did not come about because of neoliberal features
(commodification and privatization) of the policy. Instead, long standing patterns of

61
land use and agricultural production transformed the PES schemes to fit existing socio-
economic hierarchies.
Similarly, Osborne (2011) studied a carbon forestry project in Chiapas, Mexico using an
agrarian political ecology approach to highlight the historical continuities of
neoliberalisations in place. She argues that carbon producers experience mixed results
including loss of some short-term benefits of land because of the labour and land
requirements of the project. In her case especially the labour requirements constrained
the production of subsistence and annual cash crops. Despite this peasants continued
their participation in order to strengthen their formal claims on land, which they saw
under threat from neoliberal agrarian policies.
2.7 ‘Inclusive’ neoliberal conservation 2.7.1 Rise of community conservation Earlier I pointed out that scholars of international development have argued that
neoliberalism has taken on an ‘inclusive’ turn in recent years, which has also meant a
stronger focus on good governance and participatory forms of development (Ballard,
2013; Kamat, 2004; Hickey, 2010; Craig and Porter, 2006). Although the same trends
have also been observed within conservation policy and practice of the last decades
(Büscher and Dressler, 2012; Dressler et al., 2010; Brockington et al., 2008) it seems to
me that these two epistemic communities have not sufficiently taken note of the
similarities and differences of their accounts7. In this section I will therefore try to
synthesise their arguments under the label ‘inclusive neoliberal conservation’.
As mentioned above, the most visible trends within ‘inclusive’ neoliberalism were the
rise of non-governmental organisations and participatory development approaches
across the South (Bebbington et al., 2007; Kamat, 2004). Participatory approaches to
development particularly advanced the idea of a responsive state and citizens who
actively shape their own future to achieve self-empowerment (Hickey, 2010 p. 1141;
Kamat, 2004). This resonates with changes in conservation policy and management
where exclusionary models of protected areas, labelled as ‘fortress conservation’
approaches (Brockington, 2002), were increasingly critiqued for their social injustices
7 Exceptions are McAfee (2012) and McAfee and Shapiro (2010), who mention the relevance of
‚inclusive’ neoliberalism to the neoliberalisation of nature debate. However, they do not expand on their insight.

62
and ecological ineffectiveness and more and more replaced with participatory
approaches to biodiversity conservation (Dressler et al., 2010; Lele et al., 2010). During
the latter period of 1990s a ‘new conservation era’ (Hulme and Murphree, 1999)
emerged in which people were no longer seen as conservation adversaries or threats but
as allies and winners in this endeavour. By including local communities in a democratic
and participatory manner into the project design, implementation and benefit
distribution, proponents promised to meet the dual objective of social and ecological
sustainability (Cernea and Schmidt-Soltau, 2006).
This new ‘inclusive’ understanding of conservation has had an immense outlet in so-
called community-based conservation schemes, which called for participatory
engagement, indigenous knowledge and community needs in achieving equitable forms
of conservation (Adams, 2008; Brockington et al., 2008; Dressler et al., 2010).
Community-based conservation schemes aim to enable local communities to participate
in the management of natural resources in ways that are beneficial to their livelihoods.
Advocates of this approach suggest that under certain conditions local authorities are
able to manage natural resources in a more sustainable, efficient and equitable way
compared to centrally controlled approaches (Dressler et al. 2010; Ostrom & Nagendra
2006). Moreover, decentralized management systems are also understood as a way to
promote a broader democratisation process in developing countries, with positive
outcomes for the performance of local governance institutions (Ribot, 2004; Wily,
2001).
In the course of community conservation approaches local stakeholders have
increasingly been connected to global markets for conservation (Hulme and Murphee,
1999; McAffee, 1999) and thus incorporated into transnational networks of
international NGOs, finance institutions and donors, where external actors have played
a significant role in shaping conservation outcomes, or at least how outcomes have been
presented (Brockington et al., 2008). Some have therefore argued that community
conservation has been succumbing, at least partly, to the neoliberal ideology of
development in general (Büscher and Dressler, 2012; Dressler et al., 2010; McCarthy,
2005). From another perspective one could say that devolved and community centred
approaches to conservation and natural resource management seem to have played an
important role in enabling the expansion of neoliberalisations into more and more
predominantly rural areas to further capital accumulation (Büscher and Dressler, 2012).

63
In a way this evokes Castree’s (2008) insights that neoliberalism is necessarily an
environmental project.
To many the objective of community-based natural resource management turned from
an empowerment and social justice agenda to promoting markets, commodification and
privatisation of resources under neoliberalism (Dressler et al., 2010). As a consequence
of this incorporation into more complex and hybrid governance regimes, it was
suggested that principles of social justice and equity have rarely been attained. Scholars
have argued that in some cases this neoliberal approach to participatory conservation
has led to a disempowerment of the very communities they were meant to support
(Dressler et al. 2010; Brockington et al., 2008).
These critiques of participatory conservation approaches resemble wider critiques of
participatory development under neoliberalism. Scholars from both epistemic
communities have argued that under neoliberalism participatory approaches have hardly
ever achieved the suggested win-win outcomes in practice (Cooke and Kothari, 2001;
Dressler et al., 2010; Kamat, 2004; Mitlin et al., 2007). Participatory and community-
based approaches have come under criticism as empirical research revealed the deeply
entrenched conflicts and power imbalances within communities and between them. In
several cases this resulted in inequitable benefit sharing across local stakeholders of
decentralised management regimes (Brockington et al., 2008).
A key critique brought the notion of ‘community’ into question, as scholars emphasised
that they are heterogeneous as opposed to homogenous entities, shaped by a particular
set of historical circumstances. They are not bounded entities but permeable and
connected to actors, operating at different scales, who can be fractured along lines such
as ethnicity, kinship, class, race and gender (Agrawal and Gibson, 1999). Local
corruption and elite capture have been commonly highlighted as features of
participatory conservation approaches, which resulted in wider socio-economic
inequalities and hardship to some (Brockington et al., 2008).
With the rise of non-governmental organisations in development and conservation,
scholars found fault with their lack of accountability in participatory approaches
(Bebbington et al., 2008). Some argued that non-governmental organisations primarily
served donor requirements when pursuing participation rather than trying to build up

64
genuine partnerships with local stakeholders (Kamat, 2004). Questions of power and
politics were often sideline in favour of concrete and measurable intervention outcomes
(Kamat, 2004). As a consequence they reinforced clientelistic and exclusive relations
through participatory initiatives (Cooke and Kothari, 2001; O’Reilly, 2010).
2.7.2 Recognising progressive change: citizenship and politics As we have seen there have been many parallel trends in conservation and development
policies of recent years. Both experienced a shift towards participatory approaches
linked with neoliberal ideas of deregulated global markets couched in rhetoric of good
governance. Both have been criticised for essentially being ‘anti-politics’ where
participation offered little more than a technical exercise to achieve pre-determined
project goals or, even worse, contributed to further exclusion and disempowerment of
the poor (Dressler et al., 2010; Hickey, 2010).
More recently, however, this perspective has been challenged in international
development research for being too pessimistic and for ignoring potential spaces of
change, progressive politics and existing forms of participatory citizenship (Hickey,
2010; Lazar, 2012). This insight, I feel, is pertinent to studies on ‘inclusive’ neoliberal
conservation. Responding to wide spread and generalised critiques of participatory
approaches to development, Hickey and Mohan (2005) pointed out that some
participatory approaches did result in genuine transformations of societal relations.
They proposed critically to investigate the normative and theoretical underpinnings of
participation and development and called for relocating participation within a radical
politics of development in order for it to achieve social justice and empowerment.
Furthermore they suggested thinking of participation in terms of an expanded and
radicalised understanding of citizenship as a social practice that transforms the political
process of inclusion and exclusion. People, who are part of a particular political
community, should express agency as citizens to claim their status and rights in
influencing the allocation and distribution of resources that go beyond the immediate
project intervention. They should therefore actively engage in political debate and
decision-making processes and become involved in ‘transformative forms of politics’
(Hickey and Mohan, 2005; cf Lazar, 2012). Citizenship is hereby understood from a
civic republican angle as a set of practices that is centred on participating in politics.
Even if participatory citizenship occurs in less radical projects or if participatory

65
approaches are being conducted in predominantly technical forms, the inclusion of local
stakeholders in project interventions can have long-term benefits to citizen formation
(Hickey, 2010; O’Reilly, 2010). “On the positive side even the most problematic
interventions have made some identifiable material improvements in terms of
challenging problems of poverty and under-development”, claims Hickey (2010 p.
1147). Therefore one has to be very heedful when criticising citizenship-approaches
within ‘inclusive’ neoliberalism. At the same time citizenship alone is hardly ever
enough to challenge the underlying power relations responsible for uneven development
and poverty (Hickey, 2010). Additional measures are required that recognise and tackle
the politics and political economy of poverty production and reduction if substantial
developmental gains are to be made (ibid).
Indeed, analysts and practitioners working in the field of international development
have increasingly argued that research into the politics of development has become one
of the most important aspects of contemporary development studies (Hickey, 2013).
Similarly, the importance of politics has also been highlighted in recent accounts of
neoliberal conservation (Roth and Dressler, 2012; Milne and Adams, 2012). From
research in international development we learn that alongside researching the processes
and effects of ‘good governance’ reforms in developing countries, contemporary
analysis of politics should aim to understand the actual politics driving development and
under-development. This particularly comes as a response to voiced critiques about the
failure of exporting Western style institutions through good governance reforms that
proved to be inappropriate in developing country contexts (Evans, 2004; Hickey,
2012b). Key findings of latest research have been to highlight the major shortcomings
of mainstream research into development politics. In brief, scholars critique the
“Weberian assumptions regarding the negative role of informal modes of politics, a
related and exaggerated emphasis on the role of ‘evidence’ in policy making, and a bias
towards rational-actor readings of political behaviour” in mainstream research into
development politics. Opposed to the push of good governance reforms as technical
fixes to political problems, critical research into the politics of development emphasises
the highly contextualised nature of politics and development, their informal character
and the possibility of accepting ‘good enough governance’ in the short to medium term
(Hickey, 2013).
Contemporary research on development therefore focuses on how power and politics

66
shape the functioning of institutions and importantly, they do so from a relational point
of view that considers poverty and development to be the outcome of ‘the workings of
societies’ rather than the ‘characteristics of particular groups’ (Hickey, 2013 p. 4).
Specific analytical focus is laid on state capacity and the commitment of elites to
inclusive development (Bukenya and Yanguas, 2013). Hereby it is again emphasised
that state capacity is centrally a political process rather than a technical problem and
depends on society’s ability to reach political settlement (ibid).
2.8 Conclusion In this chapter I presented the theoretical framework that underlies my study. I first
outlined the concept of payments for ecosystem services, which is the most common
conceptualisation of conservation mechanisms like REDD+. I presented the logic and
inherent assumptions of the payments for ecosystem services approach and highlighted
some of the debates surrounding its applicability in practice.
I then placed REDD+ and payments for ecosystem services within wider debates of
neoliberalism and neoliberalisation of nature. I started off by discussing neoliberalism
and neoliberalisations within international development to make the reader aware of the
common and variegated forms of neoliberalisations. In this section I also highlighted
the recent ‘inclusive’ turn of neoliberalism, which I found is largely missing within the
debates of neoliberalisation of nature.
The core of my theoretical framework hinges on the neoliberalisation of nature or more
specifically on neoliberal conservation. I draw on theories of neoliberal conservation to
make sense of the neoliberal processes inherent in implementing payments for
ecosystem services. Findings from this literature are relevant to my study as some of the
most common elements of neoliberal conservation will likely be present also in the
design and implementation of REDD+ projects in Tanzania. These elements include the
use of win-win rhetoric, reregulation and territorialisation processes, the
commodification of nature, hybrid governance regimes and the creation of eco-
subjectivities.
After briefly discussing some of the findings from research that has applied the
neoliberalisation of nature framework to explain the commodification of forest carbon, I
end with a section on ‘inclusive’ neoliberal conservation. In this last section I synthesise

67
findings from both bodies of literature on neoliberalism to critically examine
participatory approaches to conservation and development under ‘inclusive’
neoliberalism. I end with recent arguments made by scholars from international
development about the role of politics and citizenship in creating spaces of change.
68
Chapter 3: Methods 3.1 Introduction In this chapter I describe the methods I employed to collect and analyse the data for this
study. The next section presents the overall research approach of my dissertation. It
discusses some ontological and epistemological considerations, my ethnographic
research strategy and the justification, selection and characteristics of my case study
sites. In the third section I present the schedule of my fieldwork in Tanzania and I
briefly discuss challenges with local language during field research and how I went
about them. After that I explain in detail the qualitative and quantitative methods used
to collect data. The fourth section explains the logic, assumptions and methods used to
analyse the data. The fifth and final section discusses the aspects of reflexivity and
ethics of my field research.
3.2 Research approach 3.2.1 Ontological and epistemological assumptions The essence of research is to understand and make sense of the world (Williams, 2003).
This quest is deeply interlinked with philosophical debates about what is reality
(ontology) and what can we know about it (epistemology). In this section I want to
briefly outline my personal position to these fundamental knowledge questions.
I am influenced by the ideology of critical realism for my understanding of the
philosophy of science. As a critical realist I believe that there is a real, material world
out there, independent of the researcher, containing power and structures. As Bhaskar
(2008[1978]) suggested, this world can be defined as the ‘real’. The ‘real’ is not directly
observable. Yet once the powers and structures that it contains are activated they
become ‘the actual’, which is then observed in ‘the empirical’ (Bhaskar, 2008[1978];
Sayer, 2000). Therefore, despite the existence of one real and actual world, people know
this world differently (Sayer, 2000). “Multiple constructed realities” (Denzin and
Lincoln, 1998, pp. 24–28) are produced because of people’s different experiences,
conditions and relationships with social and material structures. For the researcher it
becomes important to study these different interpretations of one material world, aiming
to understand which historical and contemporary factors have shaped them (Sayer,
2000). Critical realism does not, in contrast to social constructivist approaches, view all

69
interpretations as equally true representations of ‘the real’ or ‘the actual’. Indeed, one
statement can be more ‘true’ than another. The researcher’s quest is thus to critically
examine representations and interpretations of reality and investigate the factors such as
power, structure and social networks, shaping them (Sayer, 2000).
Critical realists assert that objects such as people have causal powers, but because of
structural mechanisms and social contexts these powers are realised differently (Sayer,
2000). When scientific knowledge is produced, researchers must be seen as social actors
and co-producers of this knowledge, which is derived from the interaction between the
researcher, the researched and the material world. Critical realism thus recognises that
knowledge is always fallible, embedded and incomplete (Sayer, 2000). These
assumptions distinguish critical realism from positivist philosophy to science that
proclaims researcher’s detached position to one objective truth that needs to be
identified in generalisable laws designating relationships between different variables
(Creswell, 2008; Sayer, 2000; Williams, 2003). Because the researcher can’t be seen as
detached from the material world he/she co-creates through researching, it becomes
essential to reflect on one’s positionality in knowledge production (will be discussed in
section five of this chapter).
3.2.2 Ethnographic approach Using critical realism as the common ontological and epistemological position in this
study supports my decision to use an ethnographic approach, employing a combination
of qualitative and quantitative methods for data collection, as my overarching research
strategy (McEvoy and Richards, 2006). Ethnography does not have a strict definition,
but it belongs to open-ended ways of approaching the world and producing
predominantly qualitative data (Brockington and Sullivan, 2003; Creswell, 2008;
Hammersley and Atkinson, 2007; Spradley, 1980).
Ethnography usually involves the researcher participating, overtly or covertly, in people’s daily lives for an extended period of time, watching what happens, listening to what is said, and/or asking questions through informal and formal interviews, collecting documents and artefacts – in fact, gathering whatever data are available to throw light on the issues that are the emerging focus of inquiry. Generally speaking ethnographers draw on a range of sources of data, though they may sometimes rely primarily on one” (Atkinson and Hammersley, 2007 p. 3).

70
As a research strategy, ethnography is usually exploratory in nature. Ethnographers
enter a ‘natural field’ in order to study, in Malinowski’s words, ‘foreshadowed
problems’ of people in their every day life (Atkinson and Hammersley, 2007). The
strength of this approach lies in the researcher’s extended immersion in the field to
collect close observations full of depth and details of people’s accounts and actions.
Usually only one or a few cases are examined and during the fieldwork the researcher
learns from the interpretations used by actors to analyse their connections to local and
wider social structures (Brockington and Sullivan, 2003; Atkinson and Hammersley,
2007).
An ethnographic approach was deemed ideal to study the emergence and potential
effects of forest carbon commodification in Lindi, Tanzania. Ethnographic methods
were employed to research in detail how economic and socio-political processes
including power and politics shape the conservation actions and discourses of different
actors at the village level. Ethnography, as my point of departure, allowed me to enter
the two case study villages with an open mind and the objective to really listen to
people to obtain their stories and opinions of conservation and development. It
encouraged me to go beyond listening and to participate in daily activities for an
extended period of time and thus experience first-hand and in-depth what poverty,
exclusion and governance means in rural Tanzania. Living in the villages and
participating in public life also meant that I could be present to observe events
whenever they emerged. Ethnography also taught me to remain flexible and open to
unforeseen findings during the fieldwork, which led to continuously revisiting my
research strategy, questions and findings and ultimately to writing a whole chapter on
Conservation Agriculture for this dissertation.
Ethnography as a research approach is not without controversy. It has been criticised by
others for being unscientific, unreliable, wholly subjective and dependent on the
orientation of the ethnographer. Because of the small number of cases investigated the
data collected are thought to lack generalizable propositions. A key critique relates to
the ‘anecdotal’ representations provided in ethnographies and how they are influenced
by the actions of ethnographers in the field (Herbert, 2000; Milne, 2009). Rengert
(1997, p. 469) brings the critical stance towards ethnographic research to a point:

71
Ethnographic research is the least scientific of the research approaches since, by definition, it involves a small sample size, is difficult to replicate, and contains a great deal of subjectivity and interpretation on the part of the researcher. Ethnographic research needs to be supplemented with carefully designed research projects in which the ideas developed are subjected to scientific rigor.
In the light of these heavy critiques it is important to defend the reliability and validity
of my ethnographic findings. In order to address the above-mentioned criticism, and to
generate robust data, I carefully considered the processes of data management and
analysis including documenting transparently the procedures of collecting and analysing
findings, and treating all the data comprehensively (not selectively) during the analysis
(Milne, 2009). This means that before making generalisations I considered all the
components of my data and not only selective pieces. In addition I made use of
triangulation to overcome weaknesses inherent in every method. Throughout this
dissertation but especially in this chapter I openly communicate the research process of
my study, from data collection to interpretation, to ensure transparency and traceability
(Altheide and Johnson, 1998; Milne, 2009). In the ethics section of this chapter I
discuss questions about my own position in the field and how this affected the
knowledge I produced.
Within this broader ethnographic research strategy I mainly used qualitative methods
such as participant observations, ethnographic interviewing, semi-structured interviews,
focus group discussion and document analysis. For these methods I purposefully
selected research participants. In addition to that I conducted a small-scale household
survey at the end of my fieldwork in both villages to complement and triangulate some
of my qualitative findings with quantitative data. For the survey I used random
sampling to select participants. I decided to embed this mixed-method approach into my
larger qualitative research framework to counteract some of the critique posed to
ethnography and to harness the strength of each method to derive at more reliable,
complete and robust data (Bryman, 2004; Creswell, 2008).
3.2.3 Case Study 3.2.3.1 Justification Because ethnographic enquiries aim to produce rich and in-depth data they usually
focus on one or a few cases as the “unit of analysis”. Specificity, complexity and
context are recognised and appreciated as researchers investigate the particulars of

72
certain phenomena (Denscombe, 2007; Mabry, 2009; Yin, 2003). At the same time
ethnographers should produce knowledge that is important to populations beyond the
geographical boundaries of the selected cases. Generalisations generated by case studies
are different to quantitative studies, where statistical sampling procedures are followed.
In qualitative studies cases are purposefully selected to enable the researcher to gain
insights of wider significance (Denscombe, 2007; Yin, 2003). By gaining a detailed
insight into the particular, the case-study approach reveals important knowledge on the
complex set of relations, processes and features that help us to better understand the
general phenomenon (ibid).
For this dissertation I decided to conduct ethnographic methods in two case study
villages in Lindi, Tanzania. I limited myself to two villages to be able to spend as much
time as possible in each village to achieve a rich ethnographic enquiry. At the same time
I chose not to stay in one village only in order to obtain comparative data and more
diverse findings to my research questions.
3.2.3.2 Selection of and gaining access to case studies
I chose Tanzania as the country of my
fieldwork because of the relevance and
significant progress that REDD+ had
made there. Tanzania has vast forest
resources that are significant to its
largely poor population in the rural
areas. The country experiences rapid
socio-economic changes such as
economic growth and urbanisation, and
considerable rates of deforestation and
forest degradation have been observed in the past few decades (URT, 2013). From the
beginning REDD+ has enjoyed much support from government sectors (Burgess et al.,
2010) and several NGOs in the country, which have started to implement pilot projects
(United Republic of Tanzania, 2010). The international community, the United Nations
REDD+ Programme, the Government of Norway and others have provided much
support for the design and implementation of REDD+ in Tanzania (Burgess et al.,
2010). At a time when REDD+ was still very new and in its infant phase, Tanzania
Figure 3.1 Globe showing Tanzania in Africa

73
presented itself as an inviting case for in-depth research.
Alongside the significance of Tanzania for my research subject, I regarded this country
as a good choice because of my personal experience in East Africa. I stayed in Kenya
from July 2005 to September 2006 as a volunteer in a Don Bosco street children project
where I was able to meet many different people from East Africa and to visit some
places in this region. During this time I also travelled to Tanzania for a short period of
time. I was familiar with the very basics of the national language Swahili and had an
idea of what to expect from East African cultures and lifestyles.
Within Tanzania I selected two villages – Mihumo/Darajani and Ruhoma – in the Lindi
Region in the South-eastern part of the country as my case study sites. That I ended up
in these two villages for my ethnographic fieldwork was a combination of purpose,
coincidence and luck. Despite my experience in Eastern Africa I did not have any
contacts to people engaged in REDD+ projects, conservation organisations, scholars or
other institutions in Tanzania that could have helped me to enter potential case study
sites. I, with the assistance of my supervisors, had to search for potential case study
sites, using the Internet as my point of departure.
Through the Internet I got to know Dr. Irmeli Mustalahti, then postdoctoral researcher at
the University of Helsinki in Finland, and her research project called “The role of
Participatory Forest Management in Mitigation of and Adaptation to Climate Change:
Opportunities and Constraints”, which aimed to “analyse how the communities could
benefit from improved forest management through international funding for reduced
emissions from deforestation and forest degradation (REDD+)” (Mustalahti, 2009). I
arranged to meet Dr. Mustalahti at a workshop organised by herself in May 2011 at the
University of Helsinki where we discussed my research project. We agreed that I would
accompany her on a field trip to Tanzania in August 2011 to look for research
opportunities in ongoing REDD+ projects.
Together with Dr. Zahabu, a well-respected Tanzanian scholar in the field of carbon
monitoring and forestry, we travelled to Kilwa, Lindi Region and Liwale to meet people
from various non-governmental organisations (TFCG, Mjumita, Mpingo), from the
official Finnish development aid programme LIMAS (Lindi and Mtwara Agribusiness
Support), from local district councils and last but not least village residents who were

74
involved in REDD+ projects. During this trip we also travelled to Liwale district, where
Dr. Mustalahti and Dr. Zahabu had carried out participatory forest-carbon assessments
in three villages, Mihumo/Darajani, Ngunja and Ngongowele. In these three villages I
observed how they presented their findings from the carbon assessments to the village
council and members of the village natural resource committee.
After some observations and contemplation I decided to select Mihumo/Darajani as one
of my case study sites. Mihumo/Darajani was bigger than the other two villages, in size,
in population and in forest resources. From all three villages it was Mihumo/Darajani
that expected the greatest benefits from selling forest carbon. The village was also much
closer located to Liwale town (16 km away), which was important to me for practical
and safety reasons. In the field I primarily used a simple bicycle to commute between
places. Sometimes I made use of the local motorcycle taxis, but because of the high
risks involved, I tried to avoid them. Being situated closely to Liwale town I knew that I
could ride with my bike to town every two or three weeks for a day or two to
communicate with my family, check emails, save data on my laptop, do internet
research and have better food. If I had selected one of the other two villages I would
have spent considerably more time travelling from the village to town. The proximity of
Mihumo/Darajani to Liwale town’s hospital and road infrastructure was also comforting
with regard to health issues, as I could get treatment for any kind of sickness more
easily.
The other case study village, Ruhoma, was selected later during fieldwork, after Dr.
Mustalahti had left the country and I travelled on my own to Lindi town in November
2011. At that time I had obtained my research permit, which allowed me to conduct
research and hold interviews with district officials and project staff from
Mjumita/TFCG project. Upon consultation with local field coordinators I decided to
conduct research in Ruhoma village, because of the significant progress that REDD+
had made there. While most other villages were still in the very first phase of project
implementation, Ruhoma was about to receive REDD+ trial payments. I selected
Ruhoma to have as much exposure as possible to the process and challenges of
implementing REDD+ on the ground.
In summary I can thus say that in a context shaped by personal relationships I followed
purposive or theoretical sampling procedures to select the two case study villages. As

75
explained above within pre-determined choices I selected these two specific villages
because they had certain characteristics that I wanted to examine (Denscombe, 2007;
Yin, 2003). In the following section I will briefly present my two case study villages. I
will also discuss some of the characteristics that make these two villages relevant to my
research project.
3.2.3.3 Characteristics of case study villages The two villages – Mihumo/Darajani and Ruhoma – are both located in Lindi Region,
in the South-eastern part of Tanzania. Lindi Region is the fourth largest of Tanzania’s
30 regions. It covers around 67,000 km2 and borders the Pwani Region to the north, the
Morogoro Region to the west, the Indian Ocean to the east and the Mtwara and Ruvuma
regions to the south. The region is divided into 6 districts: Kilwa, Lindi rural, Lindi
urban, Ruangwa, Nachingwea and Liwale. Across the region Islam is the most widely
practiced religion. In both case study villages almost everybody was a Muslim.
The climate of Lindi is influenced by the Southern-eastern trade winds in mid-year and
Northern-eastern trade winds during the turn of the year. These winds influence onset
and the amount of precipitation in the study areas. The temperature ranges between 20
and 30 degrees Celsius averaging to 25 degrees Celsius (Mukama, 2010; TFCG, 2012).
Although the rainfall pattern is unimodel, with the rainfall season lasting from
December to April (TFCG, 2012), this area has also been described as bi-model because
of a dry spell experienced in February (Mukama, 2010). Often village residents talk of
two rainfall periods. The short rains last from late November to January whereas the
long rains last from March to May. The average rainfall amounts to between 600 and
1000 mm (Mukama, 2010).

76
Figure 3.2 Map of regional boundaries in Tanzania Source: NBS (2013c)
The villages of Mihumo/Darajani and Ruhoma are located in Liwale and Lindi rural
districts respectively. The village of Mihumo/Darajani is located 16 km South of Liwale
town in Mihumo ward, division of Mihumo, in Liwale district. The second case study
village – Ruhoma – is located around 63 km west of Lindi town, in Rutamba ward,
division of Milola, in Lindi rural district.

77
Figure: 3.3 Lindi Region with district boundaries and forest reserves adapted from: Wdpa (2014)8
8 Blue areas are nature, wildlife and forest reserves. I redrew the regional boundaries and drew up the
district boundaries as best as I could by hand. A more accurate representation of the district boundaries can be found in map 3.4 below.

78
Figure 3.4 Map of Lindi showing districts and population size Source: NBS (2013c)
Among the six districts in Lindi Region Liwale is the largest one covering an area of
3,838,000 hectares. In 2012 the district had a total population of 91,380. With an
average population density of 2 people per sq km, Liwale is among the most sparsely
populated districts in the country (Sundström, 2010). The predominant ethnic group are
Ngindo people. Other local ethnic groups include Mwera, Yao, Ndonde, Makonde and
Ngoni (Johansson, 2008). The protected Selous Game Reserve occupies an area of
2,558,600 hectares, which is two thirds of the entire district (Mukama, 2010).

79
Liwale has a mostly flat landscape that is covered by sandy soils, which are deep and
poor in nutrient contents (Mukama, 2010). The district is part of the Eastern African
Miombo Woodlands ecoregion and it is estimated that it contains 1,736,100 ha of
forests (Taku Tassa, 2010). The village of Mihumo/Darajani has more than 3,000
inhabitants and spans across an area of 29,555 hectares that include large patches of dry
miombo, closed dense forests, riverine and wet miombo forests with some high valuable
timber species including Brachystegia sp., Julbernardia globiflora, Dalbergia
melanoxylon and Pterocarpus angolensis (Taku-tassa, 2010). In 2004 more than 133
tree species were identified in this area (S. Dondeyne, 2004).
Liwale district has two forest reserves, which are Kiperere and Angai village land forest
reserve (AVLFR). Kiperere is a registered forest reserve under the central government
covering an area of 87,000 ha. The AVLFR covers a total area of 139,420 ha and is
managed and owned by 24 villages (previously 13 villages) surrounding the Angai
forest. The village of Mihumo/Darajani set aside 11,792 ha as forest reserve and thus it
contains about 8.45% of the total AVLFR.

80
Figure 3.5 Vegetation cover and forest reserves in Liwale Source: Johansson, 2008

81
Figure 3.6 Map of Angai village land forest reserve in 2009 Source: CCI, 2009
The village of Ruhoma is situated in the Lindi Plateaux and Valleys landscape that
covers most of the 753,800 hectares in Lindi rural district. The predominant soil types
in the district are sands, loamy sands and sandy loams whereas valleys are characterised
with clay soils while sandy-loamy soils are found in the upland areas (TFCG, 2012).
Ruhoma is located on the Noto plateau, which is predominantly covered by dry
evergreen forests that include the canopy species Pteleopsis myrtifolia, Afzelia
quanzensis, Zanthoxylum deremense and Grewia conocarpa (TFCG, 2009b). According
to recent surveys elephants, buffalos and several near endemic and threatened vertebrate
species were found in the Noto plateau forests (ibid). Before the REDD+ intervention
there were three forest reserves in the district: Litipo forest reserve, Chitoa forest
reserve and Mkangala forest reserve.

82
Figure 3.7: Map of Noto and Chitoa Plateau Source: TFCG (2009b)
In 2012 the total population in the district was 194,143. Some of the most prevalent
ethnic groups are Mwera, Makonde and Maraba. The village of Ruhoma is considerably
smaller than Mihumo/Darajani both in size and population. The 475 residents living in
169 households live across a village area of 3,817 hectares. Despite its smaller size,
forests play a significant role in Ruhoma too since they cover a total area of 2,830
hectares in the village. About 88% of this area, which is equivalent to 2,488 hectares,
was set aside as forest reserve in the course of TFCG/Mjumita’s REDD+ intervention.
3.3 Data collection 3.3.1 Research schedule and language My research strategy involved mainly ethnographic fieldwork in the two case study
villages. In total I lived more than 11 months in Tanzania, from August 2011 to July

83
2012. However the first three months were spent organising my field research including
learning Swahili and obtaining the necessary research permits from Tanzania and the
University of Manchester. Of the remaining 8 months I spent about 7 months in the
villages in three fieldwork phases. The other month was used up travelling between the
villages or in urban areas such as Dar es Salaam, Liwale town and Lindi town for the
purpose of preparing the different fieldwork phases (meeting district authorities or
project staff, printing of documents, organising journeys, etc), or recovering from
sickness and regaining energy. A detailed fieldwork schedule can be found as Appendix
I.
Before presenting the specific methods used to gather the information and findings of
this dissertation, I will discuss language challenges during the fieldwork. As outlined
above, one of the reasons for selecting Tanzania as my case study site was related to my
experience in Kenya, where I had learnt some of the basics in Swahili. Yet when I
arrived in Tanzania I realised that my basic Swahili skills had largely disappeared. It
was therefore a necessary decision to attend a basic and medium Swahili language
course offered by KIU, a private education centre based in Dar es Salaam. Because of
the importance of the language to my fieldwork I decided to study at least two extra
hours every day after a four-hour class with KIU.
After a 5 weeks course I was able to engage in simple conversations about day-to-day
activities. This was just enough to navigate through the introductory phase of my
fieldwork. I was able to introduce myself at relevant regional, district and village
authorities and to project staff members, to present my research objectives and methods
to them, and to have simple conversations about Europe, Austria and Manchester
among others. However, when I started my fieldwork in November 2011 I struggled to
engage in satisfactory conversations with villagers about forest management, agriculture
and development. This was certainly one of the most frustrating and challenging
experiences I had in the field. After discussing this problem with my supervisors I was
advised to keep on trying, learning, improving and persevering. When Prof.
Brockington visited me in the field he encouraged me to keep talking and listening to
Swahili every day. At the same time he advised me to use a digital tape recorder when
interviewing villagers. The recorded conversations did not only serve as data for my
thesis but they allowed me to listen to the conversation again and again to improve my
language skills.

84
I put a great deal of effort into learning Swahili as this was the only way to get to know
what villagers think about the research issues. With time my language skills improved. I
learnt phrases, sentences and words that were relevant to my topic by heart. I listened to
the recorded interviews and looked up almost every word I did not understand to write it
down in a vocabulary list. I spent hours and hours in public places in the village to talk
about anything with whoever was around in order to keep practicing. At the end of the
day this strategy paid off and the longer I spent in the field the better I could converse in
Swahili. Especially in the last few months of my fieldwork I was able to engage in most
discussion I wanted albeit not without minor and not so minor grammatical mistakes.
Nevertheless, I was able to ask more critical questions and engage in long and
meaningful discussions around village politics, development and social dynamics
between people. The quality of my interviews thus increased a lot in the latter phases
once my language skills were more developed. The same applies to data gathered
through participant observation. In the beginning of my fieldwork I mainly observed
others and tried to have very simple conversations, but after a few months I was able to
meaningfully engage in people’s daily activities.
3.3.2 Participant observation Participant observation is the primary research method for ethnography and denotes
watching, listening, interacting with and recording actions and discourses of people as
they carry out day-to-day activities (Drury et al., 2011; Hammersley and Atkinson,
2007; Spradley, 1980). Often a distinction is made between participant observer and
observing participant depending on the degree of participation. Throughout my
fieldwork I took on the role of a participant observer. As a PhD researcher I spent my
time in the field observing what other people did as opposed to actively trying to
participate in development activities. I disclosed my research aim and objectives from
the beginning, which meant that I overtly conducted participant observation among
villagers unless they were not comfortable with it.
From the beginning of my stay in the villages, I conducted participant observation in
different settings to obtain a better understanding of the life of villagers. I participated in
village meetings, discussions among people in open spaces, development events with
district or other authorities, in the market place, at farms, at the soccer field or at
somebody’s home if I got invited. Due to my research interest I also spent much time

85
accompanying cultivators to their farms. While assisting them in farming activities I
tried to have conversations with them about agriculture, forests, village politics and
development. Researching villagers in their ‘natural environment’ was vital for me to
get a sense of the challenges and opportunities REDD+ offers. But it also allowed me to
spend much time with one person, which led to many different conversations ranging
from particular subjects to life in general.
In many instances I could take note of my observations openly using my pen and a
small notepad. I usually wrote down my observations in German, because this was the
quickest option to me. Sometimes I found myself in sensitive situations where note
taking would have been inappropriate. Whenever this happened I would make mental
notes during observations and wrote them down in the evening from my memory. In
addition to these notes I also took ‘theoretical notes’ or ‘analytic memos’ (Bryman and
Burgess, 1994) to make sense of the observations I made in the field.
3.3.3 Ethnographic and semi-structured interviews During participant observation I conducted ethnographic interviewing with people
around me. Ethnographic interviewing is different to typical semi-structured interviews,
where the participant is removed from his daily activities to a constructed setting
(Bryman, 2004). Ethnographic interviewing is done in the natural context of the
participant, during daily activities, at home, on the farm, in the market place and so
forth. This type of interviewing is thus characterised by a higher degree of informality
achieved by maintaining context (Schensul and LeCompte, 1999). Ethnographic
interviews often move between unstructured, structured, semi-structured and narrative
interview experience.
I conducted ethnographic interviewing throughout my fieldwork in the case study
villages. Usually when I found myself around other people I aimed to ethnographically
interview them about their livelihoods, village politics, forest management, climate
change mitigation, forest-carbon and so forth. Other times I asked them broader
questions about life in general from which a rich conversation would emerge where we
would all interview each other. Ethnographic interviews could last for hours or a few
minutes depending on the relationship between me and the researched, the availability
of the interviewee, the context and other factors.

86
This method provided me with rich and deeper insights into the social relations in the
village and personal opinions, feelings and experiences of individual villagers.
Ethnographic interviewing allowed me to ask questions to groups of people, who would
then engage in lively discussions. At other times I could interview individual farmers,
villagers, committee members or other persons in a private, comfortable setting, which
allowed me to obtain otherwise maybe censored data. Ethnographic interviewing
enabled the interviewee to take agency and co-structure the interview, determine its
direction, stop short at certain questions or start talking about completely different
topics.
Alongside ethnographic interviewing I conducted semi-structured interviews with
villagers, district officials, development agents and researchers. These interviews differ
from ethnographic interviews in the sense that I arranged a time and place to meet
before interviewing the person (Bryman, 2004). The second big difference is that I
recorded these interviews using a digital tape recorder after obtaining consent. The
interviews usually took place in the village at the person’s home in the late afternoon or
evening after the working day was over. The interviews were also more structured
compared to the ethnographic interviews.
For different groups of interviewees such as committee members, sub-village chairman,
conservation agriculture group members, ordinary villagers or district officials I created
different guiding questions that I asked during the interview. However, I always
remained flexible during the interview and adapted to the individual’s special
knowledge on certain topics, his/her willingness to talk about certain things and not
others, and contextual factors while making sure the conversation was overall useful to
my research. In total I conducted and recorded 116 semi-structured interviews in both
villages. Of these 116 interviews I conducted 66 with stakeholders of Mihumo/Darajani
village and 50 interviews with stakeholders of Ruhoma village. For a detailed list of all
recorded interviews see Appendix II.

87
Table 3.1 Recorded interviews
Interviewee type Amount of interviews Main content
Mihumo/Darajani Ruhoma
Conservation
Agriculture farmers
18 (7 M, 11 F) 7 (3 M, 4 F) Conservation agriculture
technology; farmer field schools
District and ward
officials
3 (3 M) 6 (6 M) Development initiatives (REDD,
farming) & village politics
Village elders 6 (5 M, 1 F) 2 (2 M) Village politics, livelihoods
Sub-village chairman 7 (7 M) 0 Local governance; village
development
Village committees 14 (7 M, 7 F) 14 (6 M, 8 F) CBFM institutions and practices
Village council 4 (4 M) 0 Local governance, development
Community
development (teacher,
health, Vicoba, village
leader)
4 (4 M) 4 (4 M) Village development initiatives,
village politics
Ordinary villagers 8 (6 M, 2 F) 14 (9 M, 5 F) Livelihoods, agriculture, forest,
village politics
Researcher & project
staff
2 (1 M, 1 F) 3 (3 M) REDD & CBFM
It was my aim to interview more district officials in both villages, but in order to
organise interviews with them I would have had to spend considerably more time in
Liwale and Lindi towns, which would have reduced my time in the villages. Similarly, I
wanted to interview people in Dar es Salaam from national ministries, international
organisations and project organisations. However, this was not possible in the time
available and to achieve it would have meant a significant restructuring of my fieldwork
phases and research schedules. I would have spent much more time trying to gain access
to these stakeholders and organise meetings with them. Instead I decided to focus on
interviewing actors in the two villages to create good village ethnographies.
Complementary information about the projects was sourced from official documents in
order to close potential information gaps.
3.3.4 Focus group discussion A focus group discussion allows interviewing a small group of people on a specific
topic in a short period of time. It allows participants to engage in discussions and the
researcher to learn from the various views and opinions on a certain theme (Bryman,

88
2004; Liamputtong, 2011).
I conducted one focus group discussion in Ruhoma, because I spent relatively little time
in that village. I decided to arrange for a focus group discussion with members from the
village council, village natural resource committee, village land use planning
committee, REDD+ committee and ordinary villagers. I invited a key villager of the
Mihumo/Darajani village to Ruhoma to take part and facilitate with me the focus group
discussion. This villager was the former secretary of the village natural resource
committee and then a member of the participatory forest carbon assessment group.
From the beginning he participated in many forestry related activities in
Mihumo/Darajani and had substantial knowledge of REDD+ and community based
forest management. I invited him to Ruhoma to organise and facilitate with me the
focus group discussion on REDD+ and Conservation Agriculture in the village. His
help, insights, participation and organisational skills were of great help and I obtained
rich information about forest conservation and development in both villages.
However, his trip to Ruhoma was not only beneficial to me. He expressed his
appreciation and gratitude a number of times saying that he had learned a lot from this
journey and stay in Ruhoma. It was our agreement, from the beginning, that he will
communicate his experiences to other villagers in Mihumo/Darajani. Besides him also
villagers in Ruhoma benefited greatly from his visit. During and after the focus group
discussion I could witness vivid exchanges between him and the villagers on topics that
were of great importance to all of them. Without him I would have certainly struggled
to facilitate a focus group discussion. My Swahili skills were good but not sufficient to
understand, lead and direct a group of participants in stimulating discussions.
3.3.5 Document analysis Formal and informal documents provided important data for my dissertation (Bryman,
2004; Denscombe, 2007). I collected documents throughout my studies prior, during
and after the fieldwork. I collected information concerning the study site, project
documentation and progress reports, institutional frameworks, agricultural land use and
interventions, land use planning, forest-carbon assessments, project brochures and info
material, newspaper articles, etc. From these documents I learnt much about project
goals, challenges and opportunities with regard to forest conservation and agriculture.

89
Most of these documents were sourced from the Internet. Others were given to me by
Dr. Mustalahti and TFCG/Mjumita project staff. Among the most valuable written
sources were draft land use plans, forest management plans, by-laws and other ‘village-
centred’ documents. From these documents I could source important data about the
specificity of intended institutional frameworks, management systems and distribution
of costs and benefits in the project sites. Most of the documents sourced were written in
English, but some of them were written in Swahili. I gathered documents written in
Swahili more towards the end of and after my fieldwork when my language skills had
improved substantially. I was able to read and understand them, although I regularly
used English-Swahili dictionaries in book format and from online sources.
3.3.6 Household survey The main objective of my household survey was to numerically describe differences in
the two villages with regard to household’s land use, specifically crop cultivation, and
perceptions of Conservation Agriculture and forest governance. In addition I wanted to
compare wealth groups within and across the two villages on the same dimensions to
obtain a picture of the extent of local inequality. I designed the questionnaire prior to
and during my fieldwork in Tanzania (questionnaire in Swahili and English attached as
Appendix III). Before commencing my fieldwork I created a preliminary questionnaire
based on discussions with former PhD colleagues, especially Sumana Datta and Ashish
Aggarwal, and my supervisors. At that time I already knew that I wanted to finalise the
survey design only closer to the end of my fieldwork after getting to know the context
of my study sites. This helped me to specify and formulate my questions in a way to
ensure validity and reliability of responses (Drury et al., 2011; Creswell, 2009).
Therefore, I only arrived at the exact sections and questions of the survey in May/June
2012. These were influenced by my observations in the field and a quick online
literature review conducted while staying in Lindi town.
After creating a first English version of the survey I obtained feedback from my
supervisors and local staff of TFCG/Mjumita project, who pointed at some necessary
clarifications. I translated the survey questionnaire from English to Swahili with the
assistance of a TFCG/Mjumita staff member from the office in Kinyope. She also
helped me in piloting the survey with four residents of the neighbouring Kinyope
village, which resulted in reducing the length of the survey and reformulating certain
questions. The final questionnaire had 6 different sections: a background section about

90
the interview, a section about the household structure, two sections about the economic
assets and income and expenditures of the household, a section on agricultural activity
and Conservation Agriculture, and a final section on forest governance and REDD+.
Unfortunately, in the time of preparing my household survey I fell sick twice, once
suffering from a foot injury and another time I got malaria. I spent around two weeks in
Lindi town to recover. It was at that point that I decided to limit the scope of my survey
because of the time constraints. I reduced the sample size and aimed for at least 30
participants in Ruhoma. In Mihumo/Darajani I aimed for at least 60 respondents. I
recognised that because of a lower sample size the ability to generalise to the wider
population is compromised. Nevertheless, I used a random sampling procedure to derive
at my sample. For the sampling procedure I obtained an up-dated list of all permanent
residents in the villages. See Appendix IV for a detailed description of the sampling
procedure.
I used the same questionnaire in Ruhoma and Mihumo/Darajani. The last question,
which was related to the usage of trial carbon payments, was not posed to respondents
in Mihumo/Darajani as they had not received any payments. In total I interviewed 39
households in Ruhoma and 79 in Mihumo/Darajani. The time of interviewing varied
depending on the participant’s level of understanding, education and subject knowledge.
The average time was 47 minutes. I tried to interview household heads but this was not
always possible. In Ruhoma I interviewed 33 household heads (11 female and 22 males)
and 6 wives. In Mihumo/Darajani I interviewed 57 household heads (6 females and 51
males) and 22 wives. In both villages around 65% of the interviewees finished primary
school (Standard 7), around 5 percent had continued schooling after Standard 7 and
around 30% had never gone to school or left school before Standard 7.
When implementing the survey I used two assistants in each village. In Ruhoma I
requested the invited guest villager from Mihumo/Darajani to assist me in conducting
the survey. In addition I asked a young, male villager from Ruhoma, to whom I had
built a good relationship, for help. In Mihumo/Darajani I requested the assistance from a
young male friend and from a middle-aged man, who was referred to me by the local
nurse due to his competencies. The assistants were of great help to me, as without them
some participants would have struggled to clearly understand my questions.
Occasionally we interviewed elder people to whom my research assistants translated

91
some of the questions into the local language Kimwera or Kingindo.
The main challenges faced when implementing the survey were related to the questions
about the farm size, amount of crop harvested and income and expenditures. No farm
had ever been professionally measured in any of the two villages. Therefore, villagers
did not have precise data on the sizes of their farm. However, the interviewees were
aware of the measurement – acre – and could estimate the size of their farms. Because
villagers employ casual labour on their farms, who are paid according to how much land
they work, it is common for farm owners to know the sizes of their farms in acres. If the
interviewee did not know how big one acre is we took the local demonstration plot,
which was one acre big, as a reference.
With regard to the questions related to the harvest we encountered similar problems.
With the exception of the crops sold, villagers did not have exact measurements of the
harvest. However, because of the importance of crop to the livelihoods, everybody
could tell us how many sacks (gunia), buckets (debe) or baskets (tenga) he/she obtained
from each crop. These are common measurements used also in other areas of Tanzania
(Sachedina, 2008).
Another challenge related to obtaining incomes and expenditures of the households. It
was difficult for interviewees to remember the amount of money obtained in the
different categories. I tried to make it easier for respondents in reducing the recall times
to months or weeks and request average amounts for this period. This helped to derive
at meaningful estimates but still care needs to be taken when interpreting this data. In
some instances I could also feel hesitation by the interviewee to reveal sensitive data
such as income and expenditures. I aimed to reassure to the respondent the anonymity
and confidentiality of the data and highlighted the purpose of my research. In cases of
doubtful responses the research assistants and I tried to confirm the correctness of the
information during or after the interview.
3.4 Data Analysis 3.4.1 Qualitative data Qualitative data from interviews and focus group discussions were translated and
transcribed from Swahili to English in MS Word and then coded using MS Excel. I used
online and offline dictionaries for the translations/transcriptions, which took me several

92
months. To confirm the correctness of the process underlying my transcriptions my
supervisor crosschecked the quality of a few randomly selected documents. Under the
codes I also made references to participant observations that I recorded in my journal
using the date as identifier. I combined the codes into themes that cut across all data
sources to make sense of the information. Documents, newspapers and other written
sources were analysed without any software programme.
3.4.2 Quantitative data The quantitative data were analysed in MS Excel and SPSS 20 for Mac. Data cleaning
was performed manually in MS Excel. As mentioned earlier I performed the household
survey with 79 respondents in Mihumo/Darajani. However, I decided to remove three
respondents D25, D33 and M15 from the analysis, as I did not trust in the validity of
their responses. My analysis of Mihumo/Darajani is thus based on 76 respondents. In
the following text I first describe the procedures used to group households into different
wealth classes. This is followed by briefly discussing the assumptions and calculations
used in my analysis.
3.4.3 Wealth ranking Poverty and wealth are complex, multidimensional and fuzzy concepts that defy easy
measurements (Bevan and Joireman, 1997; Campenhout, 2007; Williams, 1999). They
differ in specific contexts. Thus, alongside quantitative indicators, qualitative
approaches and insider assessments have become popular to distinguish and define
relative wealth within a social setting (Campenhout, 2007).
In this study I grouped households into wealth groups after I returned from the field. I
derived at my indicators of wealth after a brief analysis of the survey data. The selection
of wealth indicators was also informed by my personal observations and informal
conversations with villagers about wealth during my field research. This means there is
a personal bias involved in the ranking procedures, as the selection of criteria influences
how individual households are perceived. However, some of the indicators that I used
have featured also in other studies because of their usefulness (Campenhout, 2007).
In both villages I decided to conceptualise wealth as a combination of annual cash
income and the extent of assets that households possess. However, in the two villages I

93
used different combinations of variables to measure these criteria as I found them more
appropriate in each context. For both villages I ran a two-step cluster analysis in SPSS
to obtain a preliminary grouping, which I then improved manually. See Appendix V for
detailed information on the wealth ranking procedure.
In Ruhoma I used housing structure, assets value, amount of bicycles and total
cultivated land to measure the assets of the households. I used total annual income as
my variable for generated cash income. Besides income, housing structure emerged as
the most significant wealth variable for classifying households, but I used the amount of
bicycles to move some poorer households into the middle group.
In Mihumo/Darajani I used housing structure, amount of bicycles and mobiles, total
cultivated land and number of chickens to measure the assets of the households. I used
total annual income and cashew nut yields as indicators for generated income. In this
village besides income the amount of bicycles and the total cultivated land emerged as
the most significant wealth variables for classifying households, but I used housing
structure to move poorer households into middle group. I used cashew nut yields to
complement information on annual income as cashew nuts are the major cash crop in
Mihumo/Darajani and wealthier farmers generally possess larger cashew nut fields and
generate higher outputs for sale.
3.4.4 Reference adult equivalent I calculated a reference adult equivalent for each household using the information about
age and sex from the household survey. I used calculations outlined by (Brockington,
1998) who refers to Grandin (1998) and Little (1980) to arrive at following estimates:
adult male = 1 RAE; adult female = 0.86 RAE; children 0 – 5 = 0.52; children 6 – 10 =
0.85 RAE and teenagers 11 – 15 = 0.96 RAE.
3.4.5 Agricultural harvests and incomes To convert the agricultural harvests from local measurements to kilograms I used the
following assumptions. Generally harvests were measured in sacks (gunia). One sack
weighs 120 kg and is equivalent to six buckets (debe) (20 kg each). Also, one basket
(tenga) is equivalent to half a bucket (10 kg). There are two exceptions. One sack of
cashew nuts generally weighs 80 kg and contains 4 buckets of 20 kg. One sack of
sesame weighs 100 kg and contains six buckets of 17 kg each. In terms of crop prices I

94
consulted shop owners and farmers in the villages to obtain average prices in the time of
conducting the survey. The prices per kg were as follows: maize 500 TShs,
millet/sorghum 350 TShs, pigeon peas 500 TShs, cowpeas 500 TShs, cassava 150 TShs,
groundnut 500 TShs, vegetables 1000 TShs, cashew nut 1200 TShs, sesame 1500 Tshs
and rice 500 TShs.
3.4.6 Opportunity costs calculations in Ruhoma To derive at the opportunity costs of forest carbon conservation in Ruhoma I used the
following calculations. For each household I calculated the total value of annual crops
produced, which I used to derive at mean crops value per hectare temporary farm for
each wealth class. I performed a net present value calculation for a period of 25 years
using a discount rate of 10% and assuming that mean crops value remain the same over
the entire period. It was assumed that one hectare land is used for the production of
annual crops for 3 years, followed by 10 years of fallow, followed by another 2 years of
cultivation, followed by 10 years of fallow. My NPV calculation does not include other
forest uses such as charcoal production or timber extraction. However it includes the net
present value of forest protection of USD 75 per hectare as suggested by Merger et al.
(2012). Information about carbon stocks, deforestation rates, were taken from Merger et
al. (2012) who calculated that the mean natural forest carbon stock in the Lindi project
site of TFCG/Mjumita amounts to 158.8 tCO2 per hectare and the deforestation of one
hectare of forest results in emissions of 105 tCO2.
3.5 Reflexivity and ethical considerations 3.5.1 Reflexivity As researchers we influence our surroundings and therefore the data we produce. It is
impossible to remain neutral or uninvolved (Bryman, 2004; Denzin and Lincoln, 1998).
Furthermore, we come with our personal cultural lens to the field, which influences how
our experiences, perspectives and position in the social structure are shaped
(Hammersley and Atkinson, 2007). It thus becomes important to reflect on our role and
identity as researchers and how this affects the knowledge we disseminate.
During the field research I saw myself as a young Austrian who is conducting fieldwork
in rural Tanzania for his PhD studies at the University of Manchester. This, however,
was not always how villagers perceived me. At times I was perceived as a member of
foreign development organisations or the Finnish LIMAS programme. At other times I

95
was thought to be member of REDD+ project who is promoting forest protection among
the villagers. Often I was seen simply as a student, a very old student for that matter,
who lives in the villages to learn about rural Tanzania. In some rare instances I was
mistaken for being a Christian missionary who is looking for the right places to build
churches and promote conversion. Problematic perceptions of my role and identity in
the field certainly influenced what information participants were willing to share with
me.
To rectify wrong perceptions, and for that matter to obtain better information, was a
continuous process that required thought and deliberate actions. Especially because of
the existing relationships between the development actors and myself, it was not always
easy to position myself as a student. However, during my extended stay in the villages I
could clarify my positionality by explaining it to people and by doing what I claimed: to
conduct research for my PhD. I did not facilitate any development activities or forest
protection activities and I did not engage in church building or anything similar that
would have sent conflicting messages. I did not unnecessarily hang around with district
officials, development partners or priests in the region. I paid for my own
accommodation, transport, food and always remained the master of my daily activities.
In doing so I succeeded to build trust among the community. By talking, answering
questions, living respectfully and making clear the purpose of my stay I could change
problematic perceptions. As a consequence villagers increasingly believed in my
honesty and the sincerity of my claims. They got to see my as a PhD student doing
research in their communities on the emergence of REDD+. This contributed to
villagers’ willingness to share more interesting and confidential information with me.
Unfortunately, some villagers remained sceptical until the very end of my stay. Their
scepticism meant that it was not easy, and sometimes impossible, to obtain their
opinions and knowledge to my subject questions. My identity as a Christian certainly
created a barrier to some religious believers, who did not feel very comfortable in
having me around and participating in information exchange. It seems that they
remained doubtful of my real intentions. Living in the villages for an extended period of
time automatically meant that I created better friendships with some and not others.
Some of my friends were involved in local party politics and openly showed their
affiliation to certain political parties. A few villagers therefore linked my identity to
certain political ideologies. I tried to counter this by not supporting specific parties
96
during political discussions and by deliberately talking and creating relationships with
people from all parties and backgrounds during my fieldwork period.
3.5.2 Ethical issues Ethical considerations are vital to any research as the rights and interests of research
participants must be respected and protected throughout the research period (Creswell,
2009; Bryman, 2004). In my research the main ethical concerns related to participants
providing informed consent, offering a guarantee of confidentiality and anonymity,
right to opt out at any time, transparency of the research objectives and being aware of
power relations between myself and the participants.
Prior to commencing my field research in the villages I obtained all legal requirements
and permits from my host institution the University of Manchester and the Tanzanian
government to conduct research for my PhD studies. I obtained letters of introduction
from the Regional Administrative Office in Lindi and from Lindi rural and Liwale
districts for my two case study villages. In introduced myself at the districts and in the
villages officially and openly presented my research purpose, aim and objectives. I
explained my research methods and the anticipated use of the data collected. I then
requested and obtained official permission from the village council to carry out research
in the villages.
Throughout my research period I ensured confidentiality and anonymity to all research
participants. I explained to them that no formal relationship with any government or
other organisation exists and that all information collected will be used for my PhD
studies. However, I also explained that the results of my studies will be published and
disseminated in the form of a dissertation, journal articles, conferences and perhaps of a
book in order to create more awareness among the public about the challenges villagers
face with forest carbon conservation. Whenever I interviewed people or conducted
participant observation I explained to villagers that they have the right to withdraw, skip
questions or not participate at all. I made sure not to introduce private spaces of
individuals and if in certain cases the majority of people did not want my presence I
changed location. When recording interviews using my digital tape recorder I paid
particular attention to obtaining informed consent from the participant. I ensured full
anonymity and confidentiality and explained to him/her the reason for recording our
conversation, which was related to language challenges as explained in section 2.3.
97
Living for extended periods in my research sites enabled me to build rapport and
relationships based on trust and mutual respect with research participants. For sure, in
both villages there were people I had better relations with than others. In rare instances I
felt hostility towards my presence. At all times I tried my best to remain professional
and respectful to anybody around me.
3.6 Conclusion In this chapter I presented ethnography as my overall research approach after outlining
briefly critical realism as my perspective to ontological and epistemological debates
within science. This dissertation is based on an ethnographic enquiry into the emergence
and potential effects of the commodification of forest carbon in two case study villages
in South-eastern Tanzania. I immersed myself into the local context of Lindi Region in
Tanzania to collect close observations of people’s own accounts, actions and social
relations shaping the emergence of neoliberal conservation, forest carbon
commodification and REDD+. Making use of qualitative (participant observation,
ethnographic and semi-structured interviews, focus group discussion and document
analysis) and quantitative methods (household survey) I could gather and triangulate
robust, reliable and holistic findings. In researching the emergence of REDD+ and its
processes of neoliberalisation and commodification in an ethnographic fashion, I
remained flexible and open to all kinds of data from the field while maintaining a
theoretical focus. The following chapters will now present the findings of my study.

98
Chapter 4: Livelihoods in rural Lindi 4.1 Introduction In this chapter I discuss the livelihoods in my two case study sites. This is important in
order to assess the emergence and potential effects of REDD+, which will be carried out
in the next chapter (Chapter 5). The data presented here are largely drawn from my
quantitative survey, whose conceptualisation and implemention I described in the
methods chapter (Chapter 3). It is important to recall that because of the low sample
size and the resulting high standard error around my survey results I do not claim
statistical representativeness of my findings to the wider village population.
Nevertheless, the collected quantitative data form part of wider ethnographic findings,
which in their entirety confirm the usefulness of the survey results in contributing to a
better understanding of the qualitatively observed economic activities in the villages and
their intricate relationship with land. More specifically, the quantitative data enables us
to examine and express numerically the differences and similarities between a sample of
poor, middle and wealthy9 households in the villages. Throughout the chapter I
incorporate insights from my qualitative methods to substantiate and illustrate the
quantitative survey results.
The main purpose of this chapter is to discuss the livelihoods of villagers in Ruhoma
and Mihumo/Darajani, specifically with regard to their reliance on land for the
production of crops for food and income. This chaper therefore contributes to answering
research question 1 “How do REDD+ initiatives interact with local livelihood strategies
in Lindi, Tanzania?” Moreover, it responds to the sub-questions concerning the
economics of livelihoods in the villages, how they are linked to land use and what this
means to the emergence of REDD+ in this particular context.
4.2 A brief introduction of the region and case study villages 4.2.1 Poverty and development in Lindi, Tanzania Villagers in Ruhoma and Mihumo/Darajani live in one of the poorest regions in the
country and the world (Sundström, 2010). In Tanzania, and indeed the rest of the world,
wealth is geographically unequally distributed and concentrated in urban areas. Rural
9 Households are grouped into poor, middle-income and wealthy categories in the two villages on the basis of a conceptualisation of wealth as a combindation of income and assets. I explain the process underlying the wealth ranking in my methods chapter in more details.

99
residents across the country are generally worse off than urban citizens (Covarrubias, et
al., 2012; NBS, 2013a). According to the Household Budget Survey 2011/1210 less than
two percent of poor population live in Dar es Salaam, 14.4 percent live in other urban
areas and about 85 percent of the poor population live in rural areas. Moreover, rural
households are deeper in poverty as they experience larger poverty gaps, i.e. the average
shortfall of per capita consumption in the population relative to the poverty line (NBS,
2013a, p. 5). While the overall povery gap index for Mainland Tanzania is 6.7 percent,
the gap for people living in Dar es Salaam is 0.8 percent and 7.9 percent for people in
rural areas (NBS, 2013a). Probably one of the most serious characteristics of being poor
is a lack of sufficient food. Residents of Lindi Region are part of a geographical band of
food insecurity in the country that ranges from Mtwara and Lindi Regions through the
central regions up to Arusha and Manyara. According to the World Food Programme
about 23% of all households in rural mainland Tanzania experienced food insecurity11
between November 2009 and January 2010 (Research and Analysis Working Group,
2011).
An important factor contributing to poverty in the region is a lack of investments in
infrastructure. Infrastructure development in Lindi Region faces challenges with regard
to both quality and quantity (NBS, 2013b). Despite efforts being made to improve the
situation, road networks are still underdeveloped and grid connectivity is basically non-
existent in rural parts of Lindi Region. Even nationwide only 4% of all households
living in rural areas are connected to the national power grid. Therefore, Tanzanias’
rural residents still have to use firewood and kerosene/paraffin as their main energy
sources for cooking and lightning. No running water is available to households, thus
villagers use protected and unprotected water sources such as wells, rivers and streams
to obtain water for cooking and washing (Covarrubias, et al., 2012; NBS, 2013b).
In our two case study sites houses were commonly built of wooden poles, grass, or
thatch but more modern material such as iron sheets, metals, stones, cement bricks or
sundried and baked bricks have become more widespread. This trend has been noticed
10 The Household Budget Survey uses the basic needs approach to measure absolute poverty in Mainland Tanzania. This means that a definition of the absolute minimum resources necessary for long-term physical well-being in terms of consumption of goods is attempted. The basic needs poverty line was estimated to be 36,482 TShs per adult equivalent per month (NBS, 2013a, p. 3). 11 Food insecurity was understood as having poor (mainly cereal-based diet with almost no animal diet and very little of any other food item consumed (vegetables just 3 days per week and pulses 2 days)) or borderline (marginally better diet, eating pulses, vegetables, and fruits approximately one day more per week than poor consumption households) food consumption.

100
across the country as housing conditions improved between 2007 and 2011/12 (NBS,
2013b). However, as Table 4.1 shows, residents of Ruhoma and Mihumo/Darajani are
far behind the national average where nearly 66% of all households had modern roofs
and 73% had modern walls in 2011/12 (NBS, 2013b).
Table 4.1 Housing structure 1
Grass/wooden walls Bricks Mihumo/Darajani (76) 67 9 Percentages 88% 12% Ruhoma (39) 29 10
Percentages 74% 26%
Similarly, the large majority of interview respondents in the two villages used
grass/thatch as roofing material. Among the interviewees only around a quarter in
Ruhoma and about a third in Mihumo/Darajani used modern material such as
corrugated iron sheets.
Table 4.2 Housing structure 2
Grass/thatch Iron sheets Mihumo/Darajani (76) 52 24 Percentages 68% 32% Ruhoma (39) 29 10
Percentages 74% 26%
Another feature of poverty in the region is the low education level among villagers
(URT, 2012a). Primary education generally represented the educational ceiling for
people in the villages and a considerable amount of residents dropped out even before
that. None of the households had members with university or other tertiary education.
Table 4.3 Education level
No or below STD 7 Primary School (STD 7) Secondary School Mihumo/Darajani (76) 24 47 5 Percentages 32% 62% 6% Ruhoma (39) 14 24 1 Percentages 35% 62% 3%
Poverty and development also expresses itself in the posessions of consumer items. In
the Household Budget Survey of 2011/12 it was found that transport assets (bicycles)
and communication assets (mobiles) were the most prevalent possession among the
Tanzanian population. Around half of the rural population now owns at least one mobile
phone (NBS, 2013b). Similar results were observed in the two case study villages. In

101
Mihumo/Darajani 56% of the interviewed households had one bicycle, 61% had one
radio and 29% had one mobile. In Ruhoma much less interviewed households had one
bicycle (38%), the same percentage (62%) had one radio and almost half of the
households had one mobile. As mentioned in the methods chapter I used the amount of
bicycles and mobiles among other factors for the categorisation of farmers into wealth
groups.
4.2.2 The role of agriculture The agricultural sector, which includes crops, livestock, hunting and gathering, fisheries
and forest, is the largest sector in the economy of rural Tanzania. It employs about 75
percent of the entire workforce in the country, making the large majority of the
population dependent on land and natural resources. At the same time this sector only
contributes about 25% to the national gross domestic product (GDP). While the annual
GDP growth rate recorded for the entire economy was quite high at 7% over the period
2000 to 2010, the agricultural sector grew by 4.3% only, which is significantly lower
than the MKUKUTA12 target of 10% by 2010 (Research and Analysis Working Group,
2011).
While livestock grazing and pastoralism is extensively practiced in other areas of
Tanzania, especially in Northern and Western regions, residents in Lindi Region mainly
practice crop production as their major agricultural activity (Covarrubias, et al., 2012;
URT, 2012a, 2012b). As we can see from the Graph 4.1 below, Lindi Region ranks
second last in terms of livestock numbers and units.
12 MKUKUTA (Mpango wa Kukuza Uchumi na Kupunguza Umaskini Tanzania) is a Kiswahili acronym for the National Strategy for Growth and Reduction of Poverty, which was the national development framework for 2005-2010 in the country.
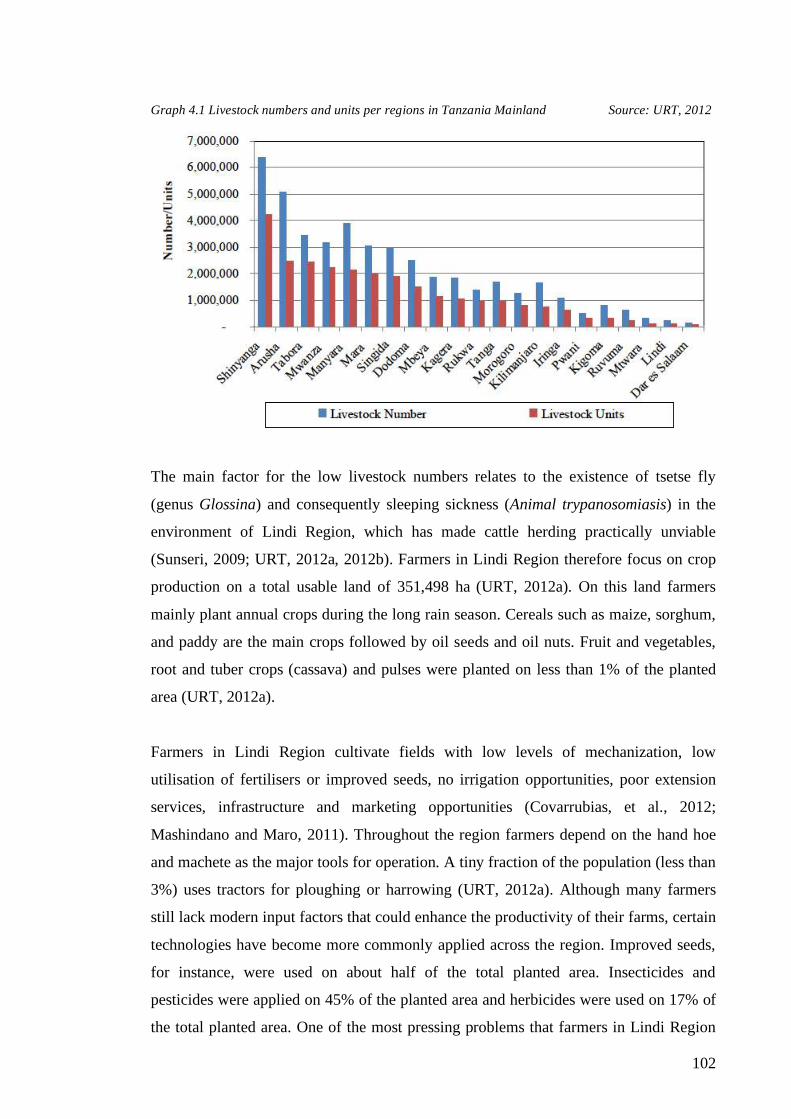
102
Graph 4.1 Livestock numbers and units per regions in Tanzania Mainland Source: URT, 2012
The main factor for the low livestock numbers relates to the existence of tsetse fly
(genus Glossina) and consequently sleeping sickness (Animal trypanosomiasis) in the
environment of Lindi Region, which has made cattle herding practically unviable
(Sunseri, 2009; URT, 2012a, 2012b). Farmers in Lindi Region therefore focus on crop
production on a total usable land of 351,498 ha (URT, 2012a). On this land farmers
mainly plant annual crops during the long rain season. Cereals such as maize, sorghum,
and paddy are the main crops followed by oil seeds and oil nuts. Fruit and vegetables,
root and tuber crops (cassava) and pulses were planted on less than 1% of the planted
area (URT, 2012a).
Farmers in Lindi Region cultivate fields with low levels of mechanization, low
utilisation of fertilisers or improved seeds, no irrigation opportunities, poor extension
services, infrastructure and marketing opportunities (Covarrubias, et al., 2012;
Mashindano and Maro, 2011). Throughout the region farmers depend on the hand hoe
and machete as the major tools for operation. A tiny fraction of the population (less than
3%) uses tractors for ploughing or harrowing (URT, 2012a). Although many farmers
still lack modern input factors that could enhance the productivity of their farms, certain
technologies have become more commonly applied across the region. Improved seeds,
for instance, were used on about half of the total planted area. Insecticides and
pesticides were applied on 45% of the planted area and herbicides were used on 17% of
the total planted area. One of the most pressing problems that farmers in Lindi Region

103
face is the dependence on rain. Statistics show that the area planted under irrigation still
amounts to less than 1% of the total planted area (URT, 2012a).
Farming in the Lindi province is often described as ‘shifting cultivation’ (Bolin, 2010;
Forrester-Kibuga and Samweli, 2010; Johansson, 2008; LIMAS, 2010; Mukama, 2010;
Mustalahti and Tassa, 2012; TFCG, 2012), which suggests that farmers cultivate one
piece of land for a few years and then abandon it for the purpose of regeneration. It is
suggested that farmers move to other areas to look for more fertile lands after
experiencing declining soil fertility and increased weed infestation on their farms. New
farms are preferably opend up in the fertile lands of primary or secondary forests (ibid).
Although it is remarked that shifting cultivation does not necessarily lead to long-term
deforestation and forest degradation (Dove and Carpenter, 2008), recent changes in
population growth, market access and commercialisation of agricultural crops have been
highlighted as the main reaons for making this form of agriculture unsustainable and
detrimental to the environment (TFCG, 2012). In popular discourse population growth
and local slash-and-burn practices are often mentioned as the driving factors behind
deforestation and forest degradation (Adams, 2008; Holmgren, 2013; Leach, 1996). It is
therefore interesting to note that, according to the latest population and household
census, the average annual growth rate in Lindi Region decreased from 1.4% between
1988-2002 to 0.9% from 2002-2012. Lindi Region recorded the second lowest rate in
the whole country. The observed reduction in the annual growth rate corresponds with
the national trend where annual population growth declined from 3.3% in 1967 to 2.7%
in 2012 (NBS, 2013c).
The majority of households in Lindi Region produce crops for subsistence needs and
markets. In Liwale district 73% of all households sold crops, which was the highest rate
recorded in the region (URT, 2012a). Major cash crops in Lindi Region are cashew
nuts, sesame, groundnut, cowpeas and pigeon peas. Crops are consumed or sold to the
local market, private traders and local cooperative. As we can see from the graphs
below, private traders play a bigger role in Ruhoma than in Mihumo/Darajani, where
the local cooperative is the most important buyer.

104
Graph 4.2 Utilisation of harvest by crop in Ruhoma
Ru homa: Ut ilis at i on of the har ves t b y crop ( n=39)
0%
10%
20%
30%
40%
50%
60%
70%
80%
90%
100%
Mai
z e
Mill
et/ S
orgh
um
Pige
on P
eas
Cow
peas
C assa
va
Gro
undn ut
Vege
tabl
es
C ash
ew N
ut
Ses a
me
R ice
S ubsi ste nce
C oo pera ti ve
Priv a te Tr ade rs
L oca l ma rket
Graph 4.3 Utilisation of harvest by crop in Mihumo/Darajani
Mihum o/Darajan i: Utilisation of the harvest by c rop (n=76)
0%
10%
20%
30%
40%
50%
60%
70%
80%
90%
100%
Maiz
e
Mil le
t/Sor
ghum
Pig eo
n Pe
as
Cowpe
as
Cass
ava
Groun
dnut
Vege
tab les
Cash
ew N
ut
Sesa
me
Rice
Subsi ste nce
Cooperati vePrivate Traders
Local market
In Lindi Region more than 90% of the area planted with oil seed and oil nut crops was
under sesame cultivation, which also represents the main cash crop in Ruhoma. Cashew
nut, the major cash crop in Mihumo/Darajani, was planted on 66% of the area planted
with perennial crops in the region (URT, 2012a). Cashew nuts are sold to the local
cooperative and from there purchased and transported by international buyers for
processing in India. As we can see from the graph below, the production of cashew nuts
in Tanzania peaked in 1973/74 at 145 million tonnes and then collapsed falling to 16
million tonnes in 1989/90. Since then it has experienced growth reaching 122 million

105
tonnes in 2000. After several years of lower volumes the production has crossed the 120
million tonnes mark again in 2011. Higher volumes in recent years were due to better
prices in the world market according to traders (UNIDO, 2011).
Graph 4.4 Production of raw cashew nuts in Tanzania (1945 – 2012)
Source (Nkonya and Barreiro-Hurle, 2013)

106
Graph 4.5 Export volume in TShs. Billion of major export crops Source (NBS, 2013b)
Graph 4.6 Farm gate prices for cashew nuts in Tanzania (2005-2011)
Source: Nkonya & Barreiro-Hurle, 2013
In Liwale the sale of cashew nuts is the major income source for most farmers. Yet
households face problems with uncertainty about payments and prices in the open
market, government regulations, ineffective and costly cooperatives, weak partnerships
among stakeholders, poor market access, high transportation, transaction costs and
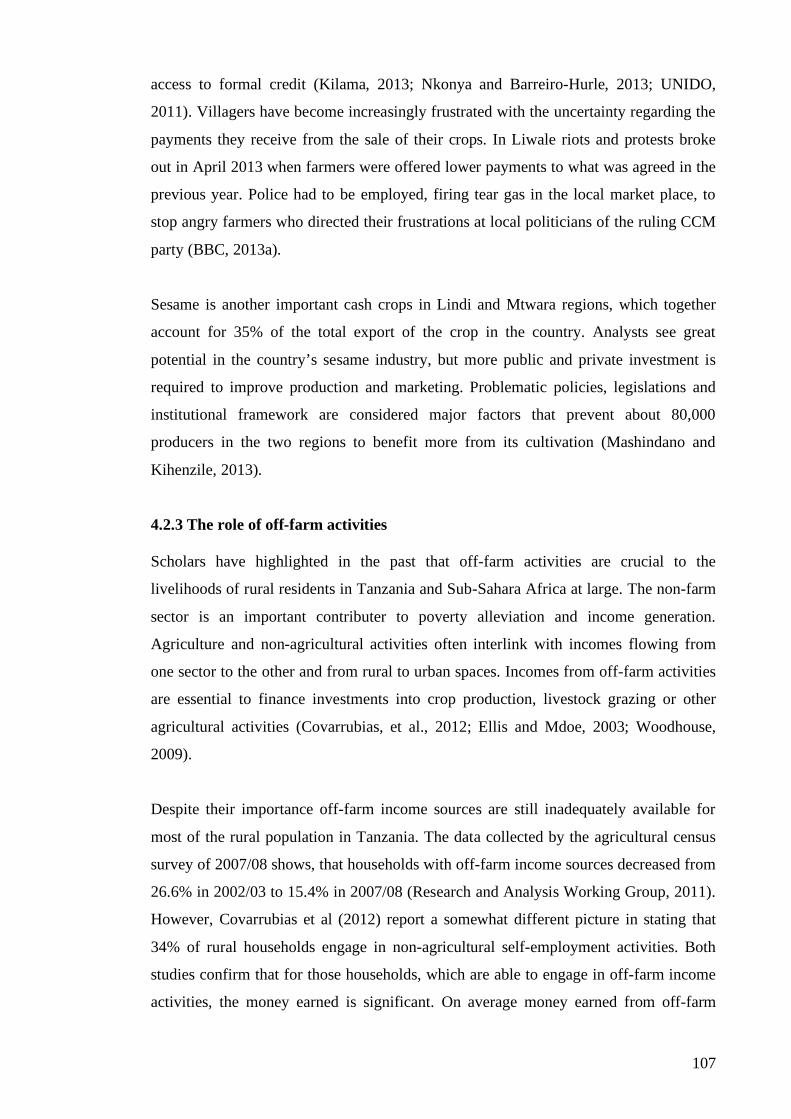
107
access to formal credit (Kilama, 2013; Nkonya and Barreiro-Hurle, 2013; UNIDO,
2011). Villagers have become increasingly frustrated with the uncertainty regarding the
payments they receive from the sale of their crops. In Liwale riots and protests broke
out in April 2013 when farmers were offered lower payments to what was agreed in the
previous year. Police had to be employed, firing tear gas in the local market place, to
stop angry farmers who directed their frustrations at local politicians of the ruling CCM
party (BBC, 2013a).
Sesame is another important cash crops in Lindi and Mtwara regions, which together
account for 35% of the total export of the crop in the country. Analysts see great
potential in the country’s sesame industry, but more public and private investment is
required to improve production and marketing. Problematic policies, legislations and
institutional framework are considered major factors that prevent about 80,000
producers in the two regions to benefit more from its cultivation (Mashindano and
Kihenzile, 2013).
4.2.3 The role of off-farm activities Scholars have highlighted in the past that off-farm activities are crucial to the
livelihoods of rural residents in Tanzania and Sub-Sahara Africa at large. The non-farm
sector is an important contributer to poverty alleviation and income generation.
Agriculture and non-agricultural activities often interlink with incomes flowing from
one sector to the other and from rural to urban spaces. Incomes from off-farm activities
are essential to finance investments into crop production, livestock grazing or other
agricultural activities (Covarrubias, et al., 2012; Ellis and Mdoe, 2003; Woodhouse,
2009).
Despite their importance off-farm income sources are still inadequately available for
most of the rural population in Tanzania. The data collected by the agricultural census
survey of 2007/08 shows, that households with off-farm income sources decreased from
26.6% in 2002/03 to 15.4% in 2007/08 (Research and Analysis Working Group, 2011).
However, Covarrubias et al (2012) report a somewhat different picture in stating that
34% of rural households engage in non-agricultural self-employment activities. Both
studies confirm that for those households, which are able to engage in off-farm income
activities, the money earned is significant. On average money earned from off-farm

108
sources makes up 30 to 50% of the total income of rural households (Covarrubias et al.,
2012; Research and Analysis Working Group, 2011).
Off-farm income sources include wage labour, petty trade, craftsmanship and many
more activities, of which the vast majority is conducted informally. Formal employment
opportunities are almost non-existent. Data of the latest employment and earnings
survey show that Lindi Region contributes only 1.3% of the total amount of employees
in the country. This is the second lowest rate after Rukwa (NBS, 2013d).
4.3 The economics of livelihoods in Ruhoma and Mihumo/Darajani 4.3.1 Income levels Lindi Region belongs to the poorest regions in the world. Consequently, the income
levels of its households are generally very low. In Ruhoma the 39 interviewed
households generated an estimated total income (income is here understood as cash
income minus loans) of 26,001,880 TShs (16,460 USD13) over a period of 12 months.
This means that households generated on average around 420 USD cash income per
year. If converted to adult equivalents this results in cash income of mere 503 TShs (0.3
USD) per day. This is similar to Mihumo/Darajani where the mean cash income per
household and adult equivalent is 626,112 TShs (396 USD) and 395 TShs (0.25 USD)
respectively.
Table 4.4 Mean household and adult equivalent cash income
Total Total HH Cash
Income
Mean HH
Cash Income
Mean Cash
Income per
AE
Mean Cash
Income per
AE per day
Ruhoma 39 26,001,880 TShs
(16,457 USD)
666,715 TShs
(422 USD)
183,501 TShs
(116 USD)
503 TShs
(0.3 USD)
Standard Deviation 756,711 TShs
(479 USD)
208,271 TShs
(132 USD)
571 TShs
(0.4 USD)
Mihumo/Darajani 76 47,584,490 TShs
(30,117 USD)
626,112 TShs
(396 USD)
144,279 TShs
(91 USD)
395 TShs
(0.25 USD)
Standard Deviation 548,632 TShs
(347 USD)
126,425 TShs
(80 USD)
346 TShs
(0.22 USD)
13 To increase readability I rounded large (over 1,000) dollar figures to the nearest ten throughout the document.

109
It is clear from these data that households in both villages are very poor when it comes
to generating cash income. On average an adult equivalent lives from 100 USD cash
income for a period of a whole year. The mean cash income per day is around 0.3 USD.
In both villages we see significant variations between the wealth classes though (Table
4.5). In Ruhoma wealthy adults generate cash incomes that are eight and four times
higher than that of adults coming from poor and middle-income households
respectively. In Mihumo/Darajani wealthy adults obtain cash incomes that are four and
two times higher than that of poor and middle-income households.
Table 4.5 Mean cash income per household and per adult equivalent
Wealth class Mean Household
Income
Standard
Deviation
RAE Mean
Income per
RAE per
day
Poor
(n=12)
188,240 TShs
(119 USD)
167,918 TShs
(106 USD)
3.5392 146 TShs
(0.1 USD)
Middle
(n=14)
404,428 TShs
(256 USD)
309,385 TShs
(196 USD)
3.9950 277 TShs
(0.17 USD) Ruhoma
Wealthy
(n=13)
1,457,308 TShs
(922 USD)
838,318 TShs
(531 USD)
3.3308 1,198 TShs
(0.76 USD)
Poor
(n=11)
311,005 TShs
(197 USD)
302,021 TShs
(191 USD)
4.5055 189 TShs
(0.12 USD)
Middle
(n=53)
492,331 TShs
(312 USD)
310,279 TShs
(196 USD)
4.0974 329 TShs
(0.21 USD) Mihumo/Darajani
Wealthy
(n=12)
1,505,825 TShs
(953 USD)
696,024 TShs
(441 USD)
5.2575 785 TShs
(0.5 USD)

110
Graph 4.7 Household annual mean cash income in USD
All wealth classes record mean incomes per adult equivalent per day of less than 1
USD. Poor adults live on an estimated mean cash income of 0.1 USD per day, which is
much lower compared to 0.76 USD and 0.5 USD for wealthy adults in Ruhoma and
Mihumo/Darajani respectively.
4.3.2 Relevance of sectors Although households obtain cash incomes from various sources, the sale of crops
represents the single most important income source to all wealth classes in both
villages. With the exception of the wealthy in Ruhoma the sale of crops generated
between 55% and 62% of the total cash income of all other wealth groups. In Ruhoma
poor and middle-income households depend more on crop production14 for cash income
compared to wealthy households, who managed to generate already more than 50% of
their cash income from off-farm sources. Despite the high importance of crop sales to
all groups, every wealth group generates considerable amounts of cash in other ways.
14 In this section only crops that are sold and converted to cash are considered as income. I will discuss the total value of crop production in the last section of this document.

111
Table 4.6 Relevance of sectors to total income
Crop Prod. Livest. Forest
Farm wage
Off-farm wage Season Business Craftsm. Remitt. Other
Poor (12) 59% 8% 8% 13% 1% 0% 0% 0% 0% 11% Middle (14) 55% 9% 0% 5% 20% 0% 2% 2% 3% 4%
Ruhoma
Wealthy (13) 43% 5% 0% 0% 17% 1% 20% 8% 3% 3% Poor (11) 62% 1% 1% 4% 16% 2% 0% 0% 5% 7% Middle (53) 59% 5% 3% 3% 2% 1% 7% 16% 0% 3%
Mihumo/D
Wealthy (12) 62% 5% 0% 0% 8% 0% 0% 17% 2% 6%
Graph 4.8 Relevance of cash income sources to wealth groups
Relevance of cash income sources to wealth groups
0%
10%
20%
30%
40%
50%
60%
70%
80%
90%
100%
Ruhom
a Po
or
Ruhom
a Mid
dle
Ruho
ma Wea
lthy
Mihum
o/Dar
aj. P
oor
Mihum
o/Dar
aj. M
iddle
Mihum
o/Dar
aj. W
ealth
y
Other
Remitta nces
Craftsmanship
Busi ness
Seasonal
Off-farm wage
Farm wage
Forest
Livesto ck
Crop Producti on
Poor households in Ruhoma largely depend on cash income from agriculture, which
includes crop production (59%), livestock (8%) and forest (8%) incomes. In addition
they generate almost 13% of their cash by working as casual wage labourers on village
farms and about 11% comes from other sources. In Mihumo/Darajani the poor too
depend much on agriculture but mostly on crop production, which brings more than
62% of their income. Other important sources are farm wage labour (4%), remittances
(5%) and ‘other’ sources (7%). Also off-farm labour recores a high share of about 17%,
but this is solely the result of household D27, who distorts the average in this case.

112
Middle-income households in Ruhoma generate much income from livestock (9%), off-
farm wage labour (20%) and farm wage labour (5%) in addition to crop production
(55%). As we can see they managed to tap into the off-farm wage labour source that
usually brings good amounts of money. In Mihumo/Darajani the middle-income
households generate much from craftsmanship (16%), which includes carpentry and
logging, and business (7%) besides the obvious agriculture-related sources that together
amount to 67%. Here too, they managed to diversify their income sources to include
off-farm activities.
The wealthy in Ruhoma obtain much from their income from business (20%), off-farm
labour (17%) and craftsmanship (8%). They managed best to diversify their income
sources and already generate more than 50% of their cash income from off-farm
activities. In contrast, wealthy in Mihumo/Darajani still generate more than 60% from
crop production, but here too off-farm wage labour (8%) and craftsmanship (17%) play
important roles in their income portfolio.
According to my findings crop sales remain the most significant source of income for
all households but in Ruhoma the wealthy and middle-income households managed
better to diversify their livelihoods and generated about half and a quarter respectively
of their income from off-farm activities. In contrast, poor households still largely
depend on agriculture or farm-wage labour for their livelihoods. In Mihumo/Darajani
middle and wealthy households generate large amounts of cash from craftsmanship
besides crop production. I will now explain the various income sources in more details
in the next section.
4.3.3 Income from crop sales In contrast to common understandings that villagers in Mihumo/Darajani and Ruhoma
practice ‘shifting cultivation’ my research shows that they combine temporary with
permanent farms and to a lesser extent vegetable farms. On temporary farms villagers
cultivate annual crops such as maize, sorghum, groundnuts, sesame, pigeon peas and
cowpeas. On permanent farms villagers grow perennial crops such as cashew nuts,
bananas or coconuts. Sometimes temporary farms, where annual crops are grown first,
become permanent farms in the long-term. Farmers mix annual and perennial crops
during the first or second year of cultivation and once the perennial trees are three or
four years old they replace the annual crops. As planting trees is culturally accepted as a

113
form of claiming ownership over land, the permanent farms move from the communal
property to the property of individual households.
It is possible for someone to farm for three years, when the cashew nut tree starts to bear fruit, he moves and farms somewhere else. So you find a lot of areas with cashewnut trees and people have moved (M Interview 14) You farm and you get food for the first year, in the second year, in the third year. In the fourth year, the cashew nut trees have grown. And there you don't use any fertilizers. And the soil is depleted. After 5 or 6 years, you make another plan. (M Interview 10)
I will elaborate on the uses of land in later sections. In this section I will discuss the
income generate from these land uses. In Ruhoma almost every households obtained
income from crop sales. Wealthy households derived considerably more than middle-
income and poor households from the sale of crops. They achieved around 3.7 and 2.8
times the amount compared to poor and middle-income households respectively.
However, this results from the performance of some wealthy households, who generated
very large amounts exceeding 1,000,000 TShs (633 USD), while others obtained very
little in this category. In Mihumo/Darajani as well the wealthy have a much higher
mean income from crop sales than poor and middle-income households. Their average
income is 6.7 and 3.2 times higher than that of the poor and middle-income households
respectively.
Table 4.7 Income from crop sales
Sum Mean StdDev
Poor 1,330,880 TShs
(842 USD)
168,040 TShs
(106 USD)
120,495 TShs
(76 USD)
Middle 3,111,000 TShs
(1,969 USD)
222,214 TShs
(141 USD)
210,160 TShs
(133 USD) Ruhoma
Wealthy 8,162,000 TShs
(5,166 USD)
627,846 TShs
(397 USD)
426,535 TShs
(270 USD)
Poor 1,517,050 TShs
(960 USD)
137,914 TShs
(87 USD)
127,801 TShs
(81 USD)
Middle 15,509,540 TShs
(9,816 USD)
292,633 TShs
(185 USD)
245,617 TShs
(155 USD) Mihumo/Darajani
Wealthy 11,154,900 TShs
(7,060 USD)
929,575 TShs
(588 USD)
447,653 TShs
(283 USD)
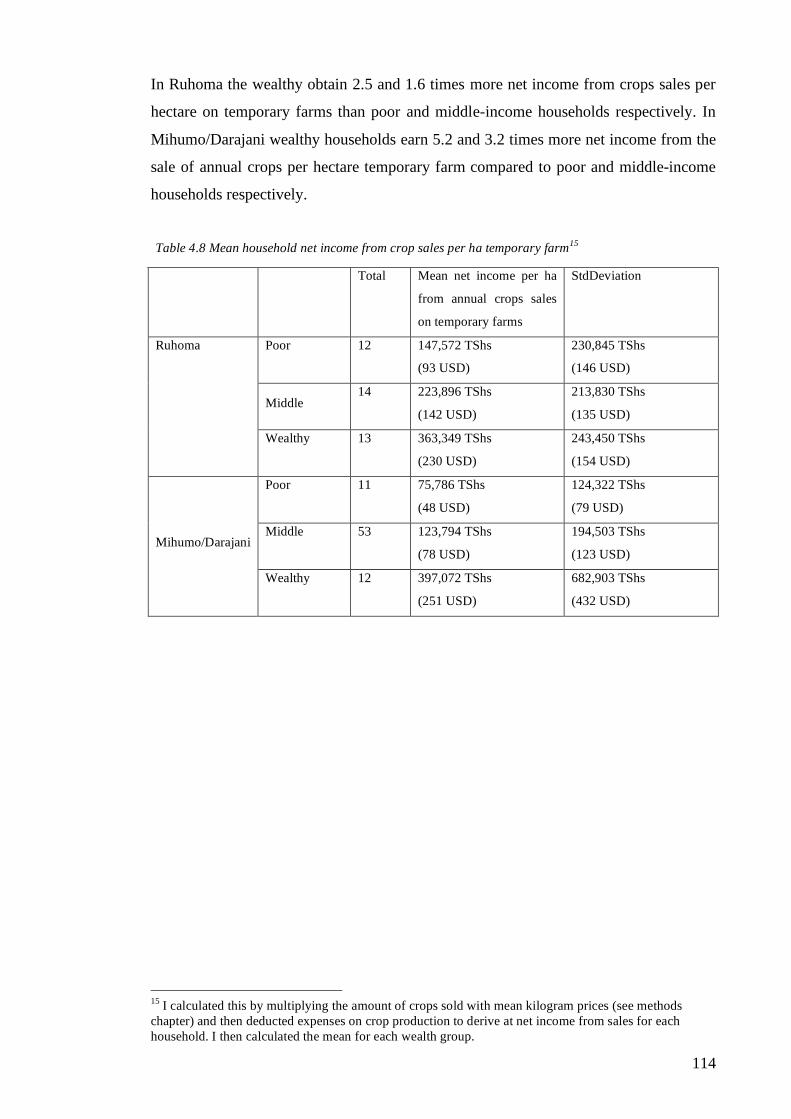
114
In Ruhoma the wealthy obtain 2.5 and 1.6 times more net income from crops sales per
hectare on temporary farms than poor and middle-income households respectively. In
Mihumo/Darajani wealthy households earn 5.2 and 3.2 times more net income from the
sale of annual crops per hectare temporary farm compared to poor and middle-income
households respectively.
Table 4.8 Mean household net income from crop sales per ha temporary farm15
Total Mean net income per ha
from annual crops sales
on temporary farms
StdDeviation
Poor 12 147,572 TShs
(93 USD)
230,845 TShs
(146 USD)
Middle 14 223,896 TShs
(142 USD)
213,830 TShs
(135 USD)
Ruhoma
Wealthy 13 363,349 TShs
(230 USD)
243,450 TShs
(154 USD)
Poor 11 75,786 TShs
(48 USD)
124,322 TShs
(79 USD)
Middle 53 123,794 TShs
(78 USD)
194,503 TShs
(123 USD) Mihumo/Darajani
Wealthy 12 397,072 TShs
(251 USD)
682,903 TShs
(432 USD)
15 I calculated this by multiplying the amount of crops sold with mean kilogram prices (see methods chapter) and then deducted expenses on crop production to derive at net income from sales for each household. I then calculated the mean for each wealth group.

115
Graph 4.9: Household mean income from crop sales
In Mihumo/Darajani I also calculated the mean net income from the sale of cashew nuts
per hectare on permanent farms. On permanent farms wealthy households earn 3.5
times more than poor households per hectare. According to my data there was no
difference between the performance of middle-income and wealthy households with
regard to the net income from cashew nut sales per hectare on permanent farms.
Table 4.9 Mean net income from cashew nut sales in M/D
Total Net mean
income/ha on
permanent farms
StdDeviation
Poor 11 28,148 TShs
(18 USD)
33,920 TShs
(21 USD)
Middle 53 100,481 TShs
(64 USD)
109,960 TShs
(70 USD)
Wealthy 12 99,501 TShs
(63 USD)
81,189 TShs
(51 USD)

116
Graph 4.10: Household mean net income from cashew sales
4.3.4 Livestock grazing As is typical for this region villagers in Mihumo/Darajani and Ruhoma are not big
herders. They keep very small amounts of livestock, mostly limited to chickens and
goats (cf. Sundstrom, 2010). There was not a single cattle herder in either village. A
look at the number of livestock possessed by survey respondents illustrates the
subordinated role that herding continues to play compared to crop production.
Table 4.10 Livestock holdings in Ruhoma and Mihumo/Darajani
N Chicken Goats Sheep Pigeons Ducks Poor 12 32 25 2 0 0 Middle 14 47 21 0 0 0
Wealthy 13 74 29 0 0 0 Ruhoma
Total 39 153 75 2 0 0 Poor 11 11 0 0 12 0 Middle 53 432 11 25 133 22 Wealthy 12 254 3 0 5 19
Mihumo/ Darajani
Total 76 697 14 25 150 41
As we can see from the above table (4.10) chickens were the most prevalent livestock
among the interviewed households in both villages. Chickens are easy to keep and
affordable to most of the population. In Ruhoma wealthy households keep on average
more chicken than the middle-income households and poorer households. In
Mihumo/Darajani middle-income and wealthy households keep much larger numbers of

117
chickens than households in Ruhoma. The high standard deviations point at the
considerable differences even within the wealth classes. Because Mihumo/Darajani is
around 16 km away from Liwale town and thus in relative close proximity to a growing
urban market, some wealthy and middle-income villagers keep chickens for sale to
urban restaurants, guesthouses or residents. Goats were commonly held in Ruhoma but
not in Mihumo/Darajani. Around one-quarter of the survey respondents in Ruhoma
claimed to keep goats. Some of them kept larger numbers starting from six goats and
more.
Table 4.11 Mean holdings of chicken and goats per wealth class
Ruhoma Mihumo/Darajani Wealth Class Mean
Chicken StdDev Mean
Goats StdDev Mean
Chicken StdDev
Poor 2.7 3.9 2.1 4.0 1 1 Middle 3.4 4.5 1.5 4.1 8.2 9.2 Wealthy 5.7 7.8 2.2 4.4 21.2 16.2
Livestock sales represent an important income category to some households in both
villages. The 39 interviewed households in Ruhoma sold on average 42,282 TShs (27
USD) per household. In Mihumo/Darajani the 76 interviewed households sold livestock
at an average of 29,000 TShs (18 USD) per household. The average is lower compared
to Ruhoma because of the lower number of goats possessed by the villagers.
Between the wealth classes we can notice some differences. Despite the fact that
livestock sales are an important contributor to poor and middle-income household’s
annual cash incomes in Ruhoma, the poor obtained only about half of the cash income
from livestock sales than the middle-income households and wealthy households
generated double the amount of middle-income households. In Mihumo/Darajani the
wealthy obtained more than 3 times the amount of cash from livestock sales compared
to middle-income groups.

118
Table 4.12 Income from livestock sales
Total Sum Mean StdDev Max
Poor 12 190,000 TShs
(120 USD)
15,833 TShs
(10 USD)
32,039 TShs
(20 USD)
110,000 TShs
(70 USD)
Middle 14 514,000 TShs
(325 USD)
36,714 TShs
(23 USD)
67,456 TShs
(43 USD)
240,000 TShs
(152 USD)
Ruhoma
Wealthy 13 945,000 TShs
(598 USD)
72,692 TShs
(46 USD)
129,044 TShs
(82 USD)
400,000 TShs
(253 USD)
Poor 11 18,000 TShs
(11 USD)
1,636 TShs
(1 USD)
5, 427 TShs
(3 USD)
18,000 TShs
(11 USD)
Middle 53 1,239,000 TShs
(784 USD)
23,377 TShs
(15 USD)
37,329 TShs
(24 USD)
180,000 TShs
(114 USD)
Mihumo/
D.
Wealthy 12 947,000 TShs
(599 USD)
78,916 TShs
(50 USD)
143,544 TShs
(91 USD)
480,000 TShs
(304 USD)
4.3.5 Forest resources Residents of the two villages use timber and non-timber forest products from their
village land mostly for subsistence purposes. Small amounts of non-timber forest
products such as mushrooms, honey, fruits, berries and medical plants are collected in
forests located in the open area. Because in Mihumo/Darajani the forest reserve is 10
kilometers away from the settlement area villagers rarely find their way into the reserve
for these products. The most common fruits collected were hangadi16 and ming’oko.
Usually women collect these fruits, which they then sell in small amounts in the local
market. In Ruhoma non-timber forest products are collected in small amounts in forests
that are located in and outside the protected area for subsistence needs. Beekeeping
activities take place in both villages, but some residents also collect wild honey from the
forests. Since it takes special knowledge to collect honey only a handful of villagers
pursue this activity. The most important non-timber forest product is firewood, which is
used for daily cooking. In both villages residents collect firewood from areas nearby
their farms on village land outside the forest reserve.
Hunting and fishing activities are common in Mihumo/Darajani but less so in Ruhoma.
Villagers in the Liwale district are known for their traditionally good hunting skills and
16 Hangadi, hangai, ruangai and ming’oko are the local names for root tubers of the Dioscorea species (CSC and FAO, 1993; Neuwinger, 1996). They are poisonous roots that are found in the forest. The Angai forest takes its name from the hangai root tuber, which is collected, washed, dried and pounded into flour during times of food shortages (Akatama, 2013).

119
their use of game as an important source of protein (Johansson, 2008). However,
because these activities are deemed illegal they are not overtly conducted or reported to
the general public. Nevertheless, during my fieldwork period I was offered small
amount of wild meat on a number of occasions. One of the persons who hunted and sold
wild meat to local villagers was a member of the village natural resource committee.
The harvesting of timber and poles is not a major cause of deforestation or degradation
in both villages as it predominantly serves to meet local construction needs for the
creation of houses, beds, tables, chair and so on. In both villages I could not observe
large-scale timber harvesting for commercial purposes. In Mihumo/Darajani, where
timber harvesting in the forest reserve is prohibited, villagers obtain the timber from the
large area outside the reserve, which is called “open area”. However, as Taku-Tassa
(2010 p. 59) also noticed, according to some residents harvesting of high value tree
species takes also place inside the forest reserve (Journal 17.8.2011).
In Ruhoma only 4 out of 39 interviewed households claimed to have obtained income
from the sale of forest products. Three of the four belonged to the poor households and
one to the wealthy category. The three poor households claimed to have obtained
130,000 TShs (82 USD), 52,000 TShs (33 USD) and 1,000 TShs (0.6 USD) over a
period of one year. The one wealthy household stated an income from 10,000 TShs (6
USD) from the sale of forest products.
In Mihumo/Darajani we see similar results. Only a handful of villagers, namely nine out
of 76 interviewed households, claimed to derive income from the sale of forest
products. The amount differs considerably ranging from 6,000 TShs (4 USD) to
260,000 TShs (165 USD).
4.3.6 Wage work In both villages people pursued wage work to earn income. Different categories of wage
work exist in the two villages. They can be broadly defined as on-farm wage work, off-
farm wage work and seasonal work.
On-farm casual wage work is an important source of cash income for some villagers.
Farmers work on the farms of other farmers to earn money to pay for the most basic
needs such as food, inputs and schooling equipment. The mean on-farm wage labour
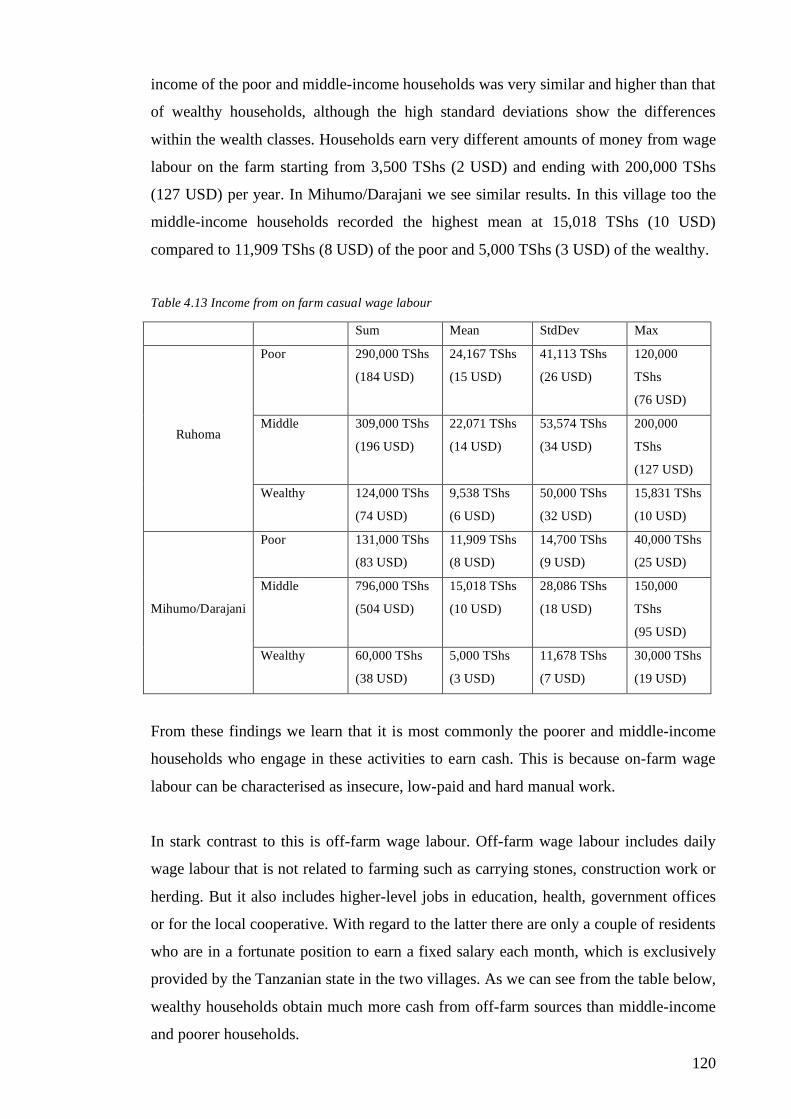
120
income of the poor and middle-income households was very similar and higher than that
of wealthy households, although the high standard deviations show the differences
within the wealth classes. Households earn very different amounts of money from wage
labour on the farm starting from 3,500 TShs (2 USD) and ending with 200,000 TShs
(127 USD) per year. In Mihumo/Darajani we see similar results. In this village too the
middle-income households recorded the highest mean at 15,018 TShs (10 USD)
compared to 11,909 TShs (8 USD) of the poor and 5,000 TShs (3 USD) of the wealthy.
Table 4.13 Income from on farm casual wage labour
Sum Mean StdDev Max
Poor 290,000 TShs
(184 USD)
24,167 TShs
(15 USD)
41,113 TShs
(26 USD)
120,000
TShs
(76 USD)
Middle 309,000 TShs
(196 USD)
22,071 TShs
(14 USD)
53,574 TShs
(34 USD)
200,000
TShs
(127 USD)
Ruhoma
Wealthy 124,000 TShs
(74 USD)
9,538 TShs
(6 USD)
50,000 TShs
(32 USD)
15,831 TShs
(10 USD)
Poor 131,000 TShs
(83 USD)
11,909 TShs
(8 USD)
14,700 TShs
(9 USD)
40,000 TShs
(25 USD)
Middle 796,000 TShs
(504 USD)
15,018 TShs
(10 USD)
28,086 TShs
(18 USD)
150,000
TShs
(95 USD)
Mihumo/Darajani
Wealthy 60,000 TShs
(38 USD)
5,000 TShs
(3 USD)
11,678 TShs
(7 USD)
30,000 TShs
(19 USD)
From these findings we learn that it is most commonly the poorer and middle-income
households who engage in these activities to earn cash. This is because on-farm wage
labour can be characterised as insecure, low-paid and hard manual work.
In stark contrast to this is off-farm wage labour. Off-farm wage labour includes daily
wage labour that is not related to farming such as carrying stones, construction work or
herding. But it also includes higher-level jobs in education, health, government offices
or for the local cooperative. With regard to the latter there are only a couple of residents
who are in a fortunate position to earn a fixed salary each month, which is exclusively
provided by the Tanzanian state in the two villages. As we can see from the table below,
wealthy households obtain much more cash from off-farm sources than middle-income
and poorer households.

121
Table 4.14 Income from off-farm wage labour
Sum Mean StdDev Max
Poor 20,000 TShs
(13 USD)
1,667 TShs
(1 USD)
4,438 TShs
(3 USD)
15,000 TShs
(9 USD)
Middle 1,106,000 TShs
(700 USD)
79,000 TShs
(50 USD)
253,924 TShs
(161 USD)
960,000 TShs
(608 USD) Ruhoma
Wealthy 3,180,000 TShs
(2,012 USD)
244,615 TShs
(155 USD)
796,164 TShs
(504 USD)
2,880,000 TShs
(1,823 USD)
Poor 395,000 TShs
(250 USD)
35,905 TShs
(23 USD)
108,000 TShs
(68 USD)
360,000 TShs
(228 USD)
Middle 684,000 TShs
(433 USD)
12,905 TShs
(8 USD)
54,545 TShs
(35 USD)
360,000 TShs
(228 USD) Mihumo/Darajani
Wealthy 1,400,000 TShs
(886 USD)
116,667 TShs
(74 USD)
345,972 TShs
(219 USD)
1,200,000 TShs
(759 USD)
Occassionally young adults leave the village in search for income. Among the few
opportunities is to practice artisanal mining. Tanzania is rich in precious minerals,
which are mined for the export market. During my fieldwork I was told that people
sometimes go to neighbouring areas where mining takes place to try their luck. It is a
very dangerous and taxing work that often remains unrewarded. Therefore only a few
villagers pursue this as an income opportunity. Yet once in a while villagers who do go
away for the search of season work return with considerable amounts of cash in their
pockets.
In Ruhoma only two wealthy households reported income from seasonal work. One
claimed to have obtained 100,000 TShs (63 USD), the other one stated to have earned
30,000 TShs (19 USD) over the past one year. In Mihumo/Darajani only three out of 76
interviewed households reported this source of income. Among them are one poor
household, earning 50,000 TShs (32 USD), and two middle-income households, earning
10,000 TShs (6 USD) and 200,000 TShs (127 USD) respectively.
4.3.7 Business and services There are a few villagers who offer business services such as petty trade, milling
cereals, maintenance and repair, transportation, etc to earn additional income. In
Ruhoma only five out of 39 interviewed households claimed to derive income from
business. Four of the five belong to the wealthy category with the remaining one being

122
middle-income. In Mihumo/Darajani eight households derived business-related income.
Two of them belong to poor and six to the middle-income categories. Craftsmanship
such as carpentry, construction, bricklaying, etc also provided income to several
households among the survey respondents. In Ruhoma two middle-income and three
wealthy households derived money from this category. In Mihumo/Darajani one poor,
11 middle-income and six wealthy households obtained income from craftsmanship.
Table 4.15 Income from business and services
Sum Mean StdDev Max
Poor 0 TShs
(0 USD)
0 TShs
(0 USD)
0 TShs
(0 USD)
0 TShs
(0 USD)
Middle 252,000 TShs
(159 USD)
18,000 TShs
(11 USD)
37,874 TShs
(24 USD)
120,000 TShs
(76 USD) Ruhoma
Wealthy 5,374,000 TShs
(3,401 USD)
413,385 TShs
(262 USD)
523,860 TShs
(332 USD)
1,380,000 TShs
(873 USD)
Poor 963,000 TShs
(609 USD)
87,545 TShs
(55 USD)
289,361 TShs
(183 USD)
960,000 TShs
(608 USD)
Middle 6,014,000 TShs
(3,806 USD)
113,472 TShs
(72 USD)
204,563 TShs
(129 USD)
780,000 TShs
(494 USD) Mihumo/Darajani
Wealthy 3,040,000 TShs
(1,924 USD)
253,333 TShs
(160 USD)
349,788 TShs
(221 USD)
1,080,000 TShs
(684 USD)
Business in Ruhoma can be seen as an important contributor to income of wealthy
households while in Mihumo/Darajani it is important to middle-income households.
Craftsmanship, which includes carpentry and timber harvesting, is an important income
source for middle-income and wealthy households in Ruhoma and Mihumo/Darajani.
Especially in the latter village middle and wealthy households generate substantial
amounts from it during the year.
4.3.8 Remittances, loans and other income sources Remittances include money that households receive from family members or friends
who live outside the village. In Ruhoma seven households obtained income from
remittances. Among them are three middle and four wealthy households. The amounts
received differ but the wealthy households obtained larger amounts ranging from
30,000 TShs (19 USD) to 200,000 TShs (127 USD).

123
Also in Mihumo/Darajani some households received remittances. In total ten
households stated this income source. Among them are two poor, six middle-income
and two wealthy households. The amounts received differ widely ranging from 5,000
TShs (3 USD) to 300,000 TShs (190 USD). Remittances are important to all wealth
classes as they provide meaningful support to households particularly when they find
themselves in difficult times.
Loans are generally hard to get. Especially from official institutions like banks, which
are reluctant to hand out credit due to the high risks involved. Rural residents generally
fail to obtain loans as they don not possess enough value assets that could serve as
securities for the banks. This, however, does not imply that loans do not exist in rural
Tanzania. Villagers succeed in obtaining loans from family, friends or local saving
groups such as Vicoba. In Ruhoma two middle and four wealthy households received
loans. One wealthy household received a large loan to the amount of 400,000 TShs (253
USD). None of the poor households interviewed stated to have been provided with a
loan. In Mihumo/Darajani only one wealthy household received a loan. The wealthy
household stated to have received an extraordinary large sum of 10,000,000 TShs
(6,329 USD) as a loan from the local bank. Of this large amount he claimed that
5,000,000 TShs (3,164 USD) were still outstanding.
Several households in Ruhoma and Mihumo/Darajani stated to have obtained money
from “other income sources”. In Ruhoma all wealth classes derived this kind of income.
The amounts range from 10,000 TShs (6 USD) to 400,000 TShs (253 USD). As
mentioned above it is likely that some of the interviewees did not want to reveal all of
their income sources. Therefore, we can assume that some of the money stated under
‘other’ income sources comes from illegal activities. In Mihumo/Darajani too all wealth
classes derived money from other income sources. Here the amounts range from 8,000
TShs (5 USD) to 700,000 TShs (443 USD).
4.4 Linking wealth and land use As illustrated earlier, the production and sale of crops is the most important livelihood
activity in the villages. The production of crop provides households with food and cash
income both necessary for economic and human development. At the same time,
agriculture is the most significant driver of land use change in the villages and the
region at large. In this context it is pivotal to discuss in more details the performances of

124
different village groups concerning the use of village land for the producation and sale
of crops.
As discussed in section 2.2, the form of agriculture practised in the two villages is often
described as ‘shifting cultivation’. Labelling agriculture in rural Lindi as ‘shifting
cultivation’ conveys a certain image of farmers. The risk exists that one thinks of them
as farmers who constantly move from one place to another in the pursuit of fertile land.
In this section of this chapter my aim is to illustrate that farmers in both villages
practice a more complex form of agriculture, as they make use of a system of fallow
rotation together with longer-term perennial crops and intensive cultivation of lower-
lying wetland areas. This is important to recognise as it influences the way farmers may
respond to REDD+ interventions.
4.4.1 Using land for crop production 4.4.1.1 Temporary and permanent farms Villagers cultivate crops for subsistence and commercial purposes. Among the survey
respondents (n=115) all claimed to farm and with the exception of six households (4 in
Ruhoma and 2 in Mihumo/Darajani) all obtained cash income from the sale of crops.
Villagers in Mihumo/Darajani and Ruhoma cultivate temporary, permanent and to a
lesser extent vegetable farms. Due to a lack of capital and labour constraints households
cultivate small areas of temporary farms.
In Mihumo/Darajani poor and middle-income households cultivate on average 2.2
(StdDev: 1.4) and 2.5 (StdDev: 1.7) acres respectively. In contrast the mean size of
temporary farms of wealthy households is 5.6 acres (StdDev: 5). However, two wealthy
households claimed to have extraordinarily large farms, amounting to 15 and 16 acres,
which considerable increases the average, as the high standard deviation shows. If we
remove these two households from the calculation the mean size reduces to 3.7 acres,
which is more accurate based on my observations during the fieldwork. Similar results
to Mihumo/Darajani can be found among the survey respondents in Ruhoma. The mean
size of temporary farms amounts to around 2 acres but it increases with the wealth class.

125
Table 4.16 Household mean size of temporary farms per wealth group
Poor Middle Wealthy
Ruhoma 2.2 2.5 3.1
Standard Deviation 1.6 1.2 1.9
Mihumo/Darajani 2.2 2.5 5.6
Standard Deviation 1.4 1.7 5
Although permanent farms can be found also in Ruhoma, they were much more
important to villagers in Mihumo/Darajani. In Ruhoma one may find isolated plots of
coconut or cashew nut trees in the village area. In contrast, households in
Mihumo/Darajani cultivated large areas of cashew nut trees all around their farms. In
the past cashew nut trees were very relevant to the livelihoods in Ruhoma too, but
unfavourable prices and problems with pests and diseases resulted in a steep decline of
their numbers. Instead other crops such as sesame and cowpeas replaced the cashew nut
as the most dominant source of agricultural cash income in this region (see also
TFCG/Mjumita, 2012).
This divergence between the villages with regard to the importance of perennial crops
becomes visible when we look at the extent of the area under permanent farms. In
Ruhoma 28 of 39 interviewed households do not have any permanent farm, and the
remaining 12 farmers cultivate less than 5 acres. In Mihumo/Darajani only 5 out of 76
households did not have permanent farms. The remaining 71 villagers owned permanent
farms of different sizes. We find remarkable differences within the village between the
wealth groups with regard to the size of permanent farms. While poorer and middle-
income households own permanent farms of around 4 acres, the wealthy households
own more than double this area.
Table 4.17 Mean size of permanent farms per wealth group in M/D
Poor Middle Wealthy
Mihumo/Darajani 4.2 3.8 10.9
Standard Deviation 2.1 2.8 4.1
4.4.1.2 Fallow land and vegetable gardens Besides permanent and temporary farms, households designated land for vegetable
farming and as fallow land. Farmers of both villages kept land under fallow for different

126
periods for the purpose of regeneration. In Mihumo/Darajani 36 of 76 interviewees
claimed to have fallow land at the time of interviewing. In Ruhoma the same applied to
25 of 39 interviewed households.
Vegetable farming is not much practiced in Mihumo/Darajani. The main factor for this
is the lack of irrigation opportunities. Nevertheless there were some households who
cultivated vegetables on designated fields along the local rivers. Among the survey
respondents 11 of 76 interviewed households had a vegetable garden. While none of 11
interviewed poor households cultivated vegetables, around 15% of middle-income and
three of twelve wealthy households cultivated between 0.5 and 2 acres of vegetables for
sale in the village. The cultivation of vegetables requires a lot of labour, as daily
watering is needed. Therefore, only some middle-income and wealthier households can
afford to grow vegetables.
Table 4.18 Distribution of vegetable farms in Mihumo/Darajani
Wealth Group
Poor Middle Wealthy
Total
0 acre 11 45 9 65
.25 acre 0 4 0 4
.50 acre 0 3 1 4
1.00 acre 0 0 2 2
Size
2.00 acres 0 1 0 1
Total 11 53 12 76
In Ruhoma a greater number – 14 of 39 interviewed households – had vegetable
gardens. Ten of the 14 plots amounted to 0.25 acre in size. Ruhoma’s village land
included some parts of the wetland located mainly in the neighbouring village Kinyope.
This made it easier for villagers of middle-income and wealthy classes to do some
vegetable farming at affordable costs. Only two poorer households cultivated 0.25 acres
maximum, but several middle and wealthier households managed large areas of up to 1
acre.
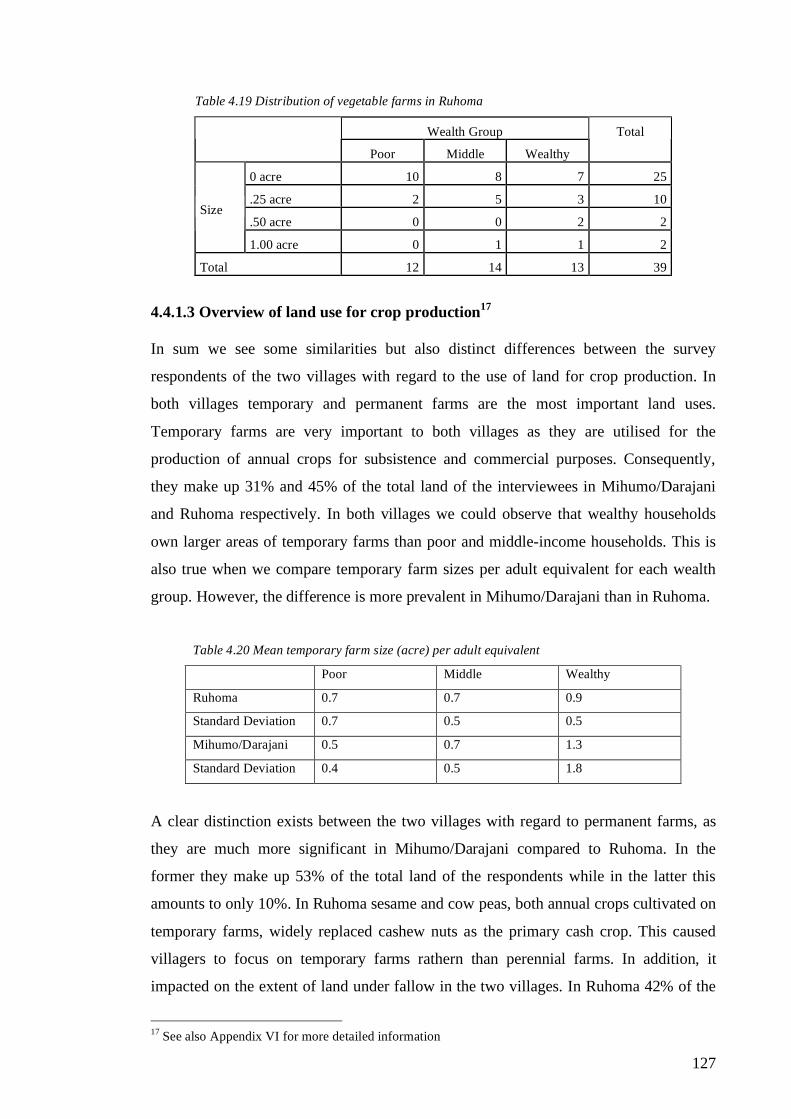
127
Table 4.19 Distribution of vegetable farms in Ruhoma
Wealth Group
Poor Middle Wealthy
Total
0 acre 10 8 7 25
.25 acre 2 5 3 10
.50 acre 0 0 2 2 Size
1.00 acre 0 1 1 2
Total 12 14 13 39
4.4.1.3 Overview of land use for crop production17 In sum we see some similarities but also distinct differences between the survey
respondents of the two villages with regard to the use of land for crop production. In
both villages temporary and permanent farms are the most important land uses.
Temporary farms are very important to both villages as they are utilised for the
production of annual crops for subsistence and commercial purposes. Consequently,
they make up 31% and 45% of the total land of the interviewees in Mihumo/Darajani
and Ruhoma respectively. In both villages we could observe that wealthy households
own larger areas of temporary farms than poor and middle-income households. This is
also true when we compare temporary farm sizes per adult equivalent for each wealth
group. However, the difference is more prevalent in Mihumo/Darajani than in Ruhoma.
Table 4.20 Mean temporary farm size (acre) per adult equivalent
Poor Middle Wealthy
Ruhoma 0.7 0.7 0.9
Standard Deviation 0.7 0.5 0.5
Mihumo/Darajani 0.5 0.7 1.3
Standard Deviation 0.4 0.5 1.8
A clear distinction exists between the two villages with regard to permanent farms, as
they are much more significant in Mihumo/Darajani compared to Ruhoma. In the
former they make up 53% of the total land of the respondents while in the latter this
amounts to only 10%. In Ruhoma sesame and cow peas, both annual crops cultivated on
temporary farms, widely replaced cashew nuts as the primary cash crop. This caused
villagers to focus on temporary farms rathern than perennial farms. In addition, it
impacted on the extent of land under fallow in the two villages. In Ruhoma 42% of the
17 See also Appendix VI for more detailed information

128
land of the respondents was under fallow. In contrast, only 14% of the land was fallow
in Mihumo/Darajani. Interviewees in Ruhoma kept relatively large amounts of land
fallow while residents in Mihumo/Darajani tend to convert their temporary farms into
permanent farms instead. The survey data also shows that wealthy households own
much larger permanent farms (on average more than 10 acres) than poorer and middle-
income households. This can also be illustrated in terms of permanent farm sizes per
adult equivalent.
Table 4.21 Mean permanent farm size per adult equivalent
Poor Middle Wealthy
Mihumo/Darajani 1 1 2.5
Standard Deviation 0.5 0.8 1.5
Table 4.22 Overview of land uses for crop production
Mihumo/Darajani Ruhoma
Temporary farm 223 31 % 100 45 %
Permanent farm 377 53 % 23 10 %
Fallow land 103 15 % 94 42 % Type
Vegetable garden 7 1 % 6 3 %
Total 710 100 % 223 100 %
Across the three wealth groups temporary farms made up around 30% of the total land
in Mihumo/Darajani. However, wealthier households held more permanent farms than
middle-income and poorer households. The opposite is true for fallow land. Fallow
makes up 22% of the total land of poor households, 16% of the total land of middle-
income households and only 9% of the total land of wealthy households. This suggests
that wealthy households are in a better position to use their land to cultivate crops.
Poorer households fail to mobilise enough resources, which results in having almost a
quarter of the land lying fallow. Also in Ruhoma wealthy households hold more land
under temporary and permanent farms compared to poorer and middle-income
households, who have more of their land under fallow. This again seems to suggest that
wealthier households managed to put more of their land under productive use than
poorer and middle households.

129
4.4.2 Productivity and production volumes In earlier sections I described how much land the interviewed villagers in Ruhoma and
Mihumo/Darajani cultivate for the production of annual and perennial crops. Now I will
present their estimations of the amount of crops produced. Analysing the production
volumes will give us a better understanding of the productivity of smallholder farming
in the two villages.
Table 4.23 Overview of production volumes of survey respondents
Mihumo/Darajani Ruhoma
Total cultivated land 607 acres 129 acres
Total amount of crops produced 83,117 kg 34,881 kg
Crops produced/acre/hectare 137 kg / 339 kg 271 kg / 670 kg
Annual crops on temporary farms 68,565 kg on 223 acres 32,520 kg on 100 acres
Annual crops/acre/hectare 307 kg / 759 kg 325 kg / 801 kg
In Ruhoma and Mihumo/Darajani the interviewees produced on average 801 kg and 759
kg of annual crops per hectare respectively. These results support other studies, which
find that the productivity of smallholder agriculture in Sub-Sahara Africa is close to one
tonne per hectare. The data collected for the latest agricultural census in Lindi region in
2007/08 by the National Bureau of Statistics (2012:178-181) confirms this statement.
Their census recorded average hectare yields in Liwale and Lindi rural of 0.8 t for
maize, 0.9 - 1 t for paddy, 0.7 t for sorghum, 0.8 – 0.9 t for finger millet, and 0.4 – 0.6 t
for cowpeas.
If we examine the production volumes and productivity levels per wealth class we can
identify some interesting differences between and within villages. In Ruhoma the
survey data suggests that the outputs of annual crops achieved per hectare temporary
land increases with the wealth status. Per hectare temporary land wealthy households
harvest on average 1.4 times the amount of annual crops than poor households.
Table 4.24 Output and productivity per wealth class in Ruhoma
Annual crops
Wealth Group Total output Mean output per household Max
Mean output/acre Mean output/hectare
Poor 6,700 558 2,360 258 637 Middle 11,058 790 2,343 325 804 Wealthy 14,762 1,136 3,032 369 912
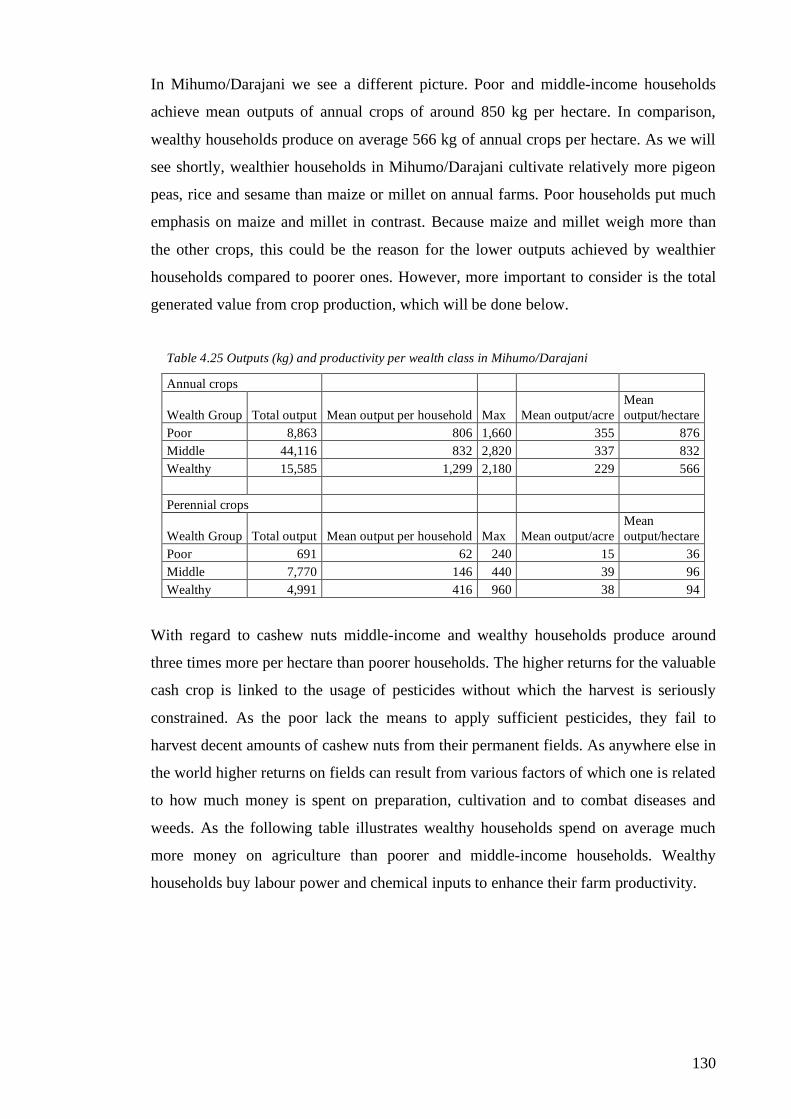
130
In Mihumo/Darajani we see a different picture. Poor and middle-income households
achieve mean outputs of annual crops of around 850 kg per hectare. In comparison,
wealthy households produce on average 566 kg of annual crops per hectare. As we will
see shortly, wealthier households in Mihumo/Darajani cultivate relatively more pigeon
peas, rice and sesame than maize or millet on annual farms. Poor households put much
emphasis on maize and millet in contrast. Because maize and millet weigh more than
the other crops, this could be the reason for the lower outputs achieved by wealthier
households compared to poorer ones. However, more important to consider is the total
generated value from crop production, which will be done below.
Table 4.25 Outputs (kg) and productivity per wealth class in Mihumo/Darajani
Annual crops
Wealth Group Total output Mean output per household Max Mean output/acre Mean output/hectare
Poor 8,863 806 1,660 355 876 Middle 44,116 832 2,820 337 832 Wealthy 15,585 1,299 2,180 229 566 Perennial crops
Wealth Group Total output Mean output per household Max Mean output/acre Mean output/hectare
Poor 691 62 240 15 36 Middle 7,770 146 440 39 96 Wealthy 4,991 416 960 38 94
With regard to cashew nuts middle-income and wealthy households produce around
three times more per hectare than poorer households. The higher returns for the valuable
cash crop is linked to the usage of pesticides without which the harvest is seriously
constrained. As the poor lack the means to apply sufficient pesticides, they fail to
harvest decent amounts of cashew nuts from their permanent fields. As anywhere else in
the world higher returns on fields can result from various factors of which one is related
to how much money is spent on preparation, cultivation and to combat diseases and
weeds. As the following table illustrates wealthy households spend on average much
more money on agriculture than poorer and middle-income households. Wealthy
households buy labour power and chemical inputs to enhance their farm productivity.

131
Table 4.26 Mean household spending on agriculture per wealth group
Poor Middle Wealthy
Mihumo/Darajani 22,455 TShs
(14 USD)
59,505 TShs
(38 USD)
274,667 TShs
(174 USD)
Standard Deviation 40,116 TShs
(25 USD)
61,662 TShs
(39 USD)
272, 832 TShs
(173 USD)
Ruhoma 8,791 TShs
(6 USD)
30,300 TShs
(19 USD)
150,077 TShs
(95 USD)
Standard Deviation 18,632 TShs
(12 USD)
53,591 TShs
(34 USD)
206,115 TShs
(130 USD)
In order to understand potential gains and losses from REDD+ interventions it is
important to analyse the value of crops produced per hectare agricultural land. As
mentioned above, farmers in Ruhoma and Mihumo/Darajani cultivate various crops of
different monetary values on their fields. In general maize, millet/sorghum, peas and
rice are the most important crops in both villages as together they make up more than
two thirds of all the crops produced.
Graph 4.11 Share of individual crops in total production in Ruhoma
R uhoma: S hare of crops in total product ion vo lu me (n=3 9)
Maize26%
Millet/Sorgh um23%
Pigeon Peas5%
Cowpea s8%
Cassa va8%
Gro undn ut0%
Vegetables3%
Cashew Nu t4%
Sesa me15%
Rice8%
Mai zeMil let/ Sorghu m
Pigeon Peas
Cowpeas
Cassa vaGroundn u t
Vege tables
Cash ew NutSesame
Rice

132
Graph 4.12 Share of individual crops in total production in Mihumo/Darajani
Mihum o/Darajan i: Sh are of crops in total produc tion v olu me (n=76)
Mai z e
22%
Mi lle t/ Sorgh um
30%
Pi geon Peas
11%
C ow pe as
1%
C assa va
3%
G r ou ndn ut
0%
Vege tabl es
1%
Ca sh ew N u t
16%
S esa me
6%
R ice
10%
The most important difference between the villages relates to the primary cash crop. In
Mihumo/Darajani cashew nuts make up 16% of the production volume, but sesame
accounts for only 6%. This is different to Ruhoma where sesame makes up 15% of the
volume, while cashew nuts account for 4% only.
In both villages there are important differences between the wealth classes in terms of
what crops they produce, which influences the total value produced per hectare.
Wealthier households produce larger amounts of higher value (cash) crops such as
cashew nuts, sesame, rice or pigeon peas. In contrast, poor households focus much more
on maize and millet/sorghum as food crops. In Ruhoma maize and millet/sorghum,
which is used for staple food, together make up around 60% of the entire harvest among
the poor and middle-income households, but only a third among the wealthy
households. Also in Mihumo/Darajani we see stark differences between the wealth
groups. For the poor households millet/sorghum and maize make up 71% of the total
production volume, but for the wealthy the same crops account for 29% only. Detailed
information about amounts of crops produced per wealth group can be found in
Appendix VI.

133
Graph 4.13 Share of crops in total production for poor and wealthy in Ruhoma R uhoma Poor : Share of c rops in tota l production vo lume (n= 12)
Mai ze33%
Millet/Sorgh um28%
Pige on Pea s8%
Cowpeas6%
Cassa va7%
Gro undn ut0%
Vegetabl es1%
Cashew Nu t4% Sesame
10%
Rice3%
Share of crops in total production among poor (n=12) Ru hom a W ea l thy : S hare of c rops in tota l p roduc tion v o lume (n=3 9)
Mai ze18%
Millet/Sorghum15%
Pige on Peas5%
Cowpeas8%Cassa va
10%
Vege tables4%
Cashew Nut8%
Sesame23%
Rice9%
Share of crops in total production among wealthy (n=13)
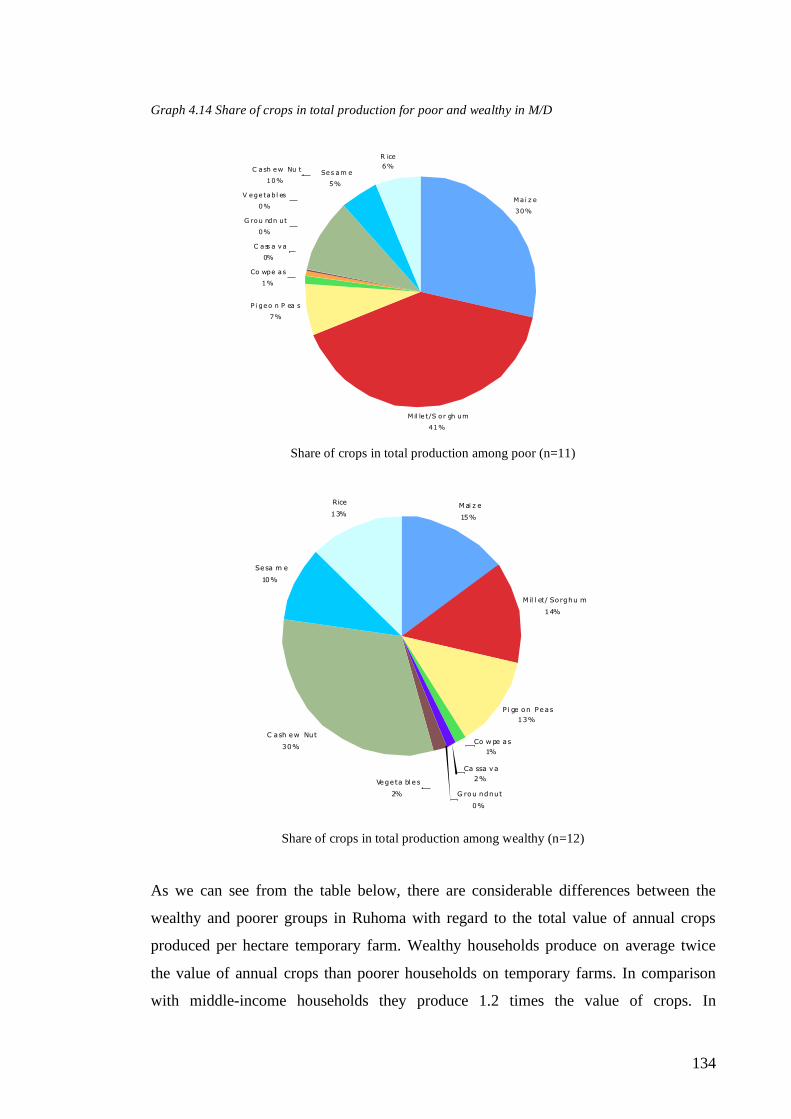
134
Graph 4.14 Share of crops in total production for poor and wealthy in M/D M ihum o/Darajan i: Shar e of crops in total production v olu me (n=1 1)
Mai z e
30%
Mil le t/S or gh um
41%
Pi geo n P ea s
7%
Co wpe as
1%
C ass a va
0%
G rou ndn ut
0%
V ege tabl es
0%
C ash ew Nu t
10%Ses am e
5%
R ice6%
Share of crops in total production among poor (n=11)
M ihumo/Dara jani: Share of crops in total produ ction v o lum e (n =1 2)
Mai z e
15%
Mil l et/ Sorghu m
14%
Pi ge on Peas13%
Co w pe as1%
Ca ssa va2%
G rou ndnut
0%
C ash ew Nut
30%
Sesa m e
10%
Rice
13%
Vege ta bl es
2%
Share of crops in total production among wealthy (n=12)
As we can see from the table below, there are considerable differences between the
wealthy and poorer groups in Ruhoma with regard to the total value of annual crops
produced per hectare temporary farm. Wealthy households produce on average twice
the value of annual crops than poorer households on temporary farms. In comparison
with middle-income households they produce 1.2 times the value of crops. In

135
Mihumo/Darajani poorer and middle-income households produce the same value of
annual crops, which is considerably less than what wealthy households produce.
Table 4.27 Household mean value of crop production per ha on temporary farm18
Total Mean value of crops
produced per ha on
temporary farms
StdDeviation
Poor 12 338,684 TShs
(214 USD)
369,383 TShs
(234 USD)
Middle 14 511,713 TShs
(324 USD)
321,493 TShs
(203 USD)
Ruhoma
Wealthy 13 628,790 TShs
(398 USD)
344,474 TShs
(218 USD)
Poor 11 401,003 TShs
(254 USD)
204,075 TShs
(129 USD)
Middle 53 404,812 TShs
(256 USD)
427,749 TShs
(271 USD) Mihumo/Darajani
Wealthy 12 628,838 TShs
(398 USD)
687,135 TShs
(435 USD)
If we analyse the value of cashew nuts produced per hectare land on permanent farms,
we record again differences between the wealth classes. However, middle-income
households seem to achiever higher values of cashew nuts per hectare than wealthy
households. Poor households generate much lower values compared to other wealth
groups.
Table 4.28 Household mean cashew value in Mihumo/Darajani
Total Mean value of
cashews produced
per ha on
permanent farms
StdDeviation
Poor 11 37,855
(24 USD)
37,453 TShs
(24 USD)
Middle 53 135,754 TShs
(86 USD)
107,950 TShs
(68 USD)
Wealthy 12 121,289 TShs
(77 USD)
103,364 TShs
(65 USD)
18 I calculated this by multiplying the amount of crops produced with mean kilogram prices (see methods chapter). To derive at per hectare values I divided the total value of crops produced by the size of temporary farm in hectare for each household.

136
4.5 Conclusion In this chapter I set out to discuss the livelihoods of villagers in my two case-study sites.
In doing so I aim to answer in part research question 1 “How do REDD+ initiatives
interact with local livelihood strategies in Lindi, Tanzania?” The information in this
chapter provides, so to say, the foundation to subsequent chapters, especially chapter 5,
which aims to assess impacts of REDD+ on livelihoods.
From this chapter it became apparent that villagers in Lindi Region belong to the
poorest people in the world. There is widespread poverty in the region, which expresses
itself in poor infrastructure (water, electricity, houses), low consumption rates, food
insecurity, lack of assets, low education levels, low income levels and low levels of
mechanization in agriculture. From my household survey we learnt that cash income
levels in both villages are very low, suggesting that the mean cash income per adult
equivalent per day amounts to mere 0.3 USD. Against this background of rural poverty
combined with villagers’ high dependence on land for crop production, I argue that
REDD+ initiatives must grapple with the urgent need for inclusive economic
development if they want to gain popular support among the rural population.
Otherwise the risk of them contributing to social and environmental injustices and
human impoverishment are real and potent.
As part of the need to promote inclusive economic development, it will be important for
REDD+ interventions to address local inequality in the villages. According to a recent
study by Andersson and Agrawal (2011) economic inequalities within and between
groups negatively affect forest conditions. My data show that inequalities exist between
different wealth groups in both villages. One reason is that wealthy households
managed to diversify their livelihoods into more profitable activities such as business,
services and off-farm wage labour, which provide them with significant cash to
supplement crop sales. Hence, in order to address local inequality it may not enough to
focus on strong collective forest governance institutions as suggested by Andersson and
Agrawal (2011). Instead, both farm and off-farm livelihood strategies should be
considered by REDD+ interventions to make wealth distribution more equal, and forest
conservation more likely, in the villages.

137
Although livelihood diversification is an important strategy noticeable among all wealth
groups, my findings illustrate that poor households still rely much on agriculture (crop
production, livestock, forests and farm wage labour) for cash income. At the same time
crop sales remain by far the single most important cash source to all wealth groups in
both villages. The production and sale of crops, as the most important economic activity
for villagers in Lindi Region, manifests the continuous dependence on land for human
and economic development. This dependence cannot be, as popular discourse does,
described as ‘shifting cultivation’. Instead, I argue farmers practice a more complex
form of agriculture that makes use of fallow rotation, and intensive cultivation of
temporary and permanent farms.
In illustrating that land use is influenced by the type of integration of villagers into the
global economy, expressed in what cash crops are produced for international markets, I
also emphasise the need to look beyond the local context to understand and address land
use drivers. The main purpose of all this is to highlight that in competition over fertile
village land, REDD+ interventions must carefully consider how global and local
processes effect agricultural land use strategies of villagers, as they influence the
willingness of farmers to set aside land for protection. More specifically, I argue that
REDD+ must consider how different wealth groups within the village use village land
for their livelihoods, if a broad consensus over forest protection is to be established.
In this light I analysed in detail the usage of village land for the production and sale of
crops by different wealth groups. I showed that in both villages wealthy groups cultivate
larger temporary and permanent farms than their fellow residents, they keep less land
fallow compared to poorer and middle-income households, and they generate higher
values per hectare farmland. This has important consequences with regard to the
opportunity costs of REDD+, which will be discussed in the next chapter.

138
Chapter 5: Material and discursive effects of REDD+ 5.1 Introduction We learnt from the previous chapter that villagers in Ruhoma and Mihumo/Darajani
depend on land for crop production as their main livelihood and income activity. As
poor, resource constrained farmers they cultivate annual and perennial crops on
temporary and permanent fields for subsistence and commercial purposes. Their
practices also entail the clearing of primary and secondary forests in order to open up
agricultural plots for cultivation. It is this land use that is in direct conflict with the
objective of protecting forests for biodiversity and carbon sequestration purposes.
Nevertheless, in both villages considerable amounts of forests have been put under
protection. In Ruhoma villagers set aside 2,488 hectares of forest under the village land
forest reserve, which covers around 65% of the entire village land (3,817 ha) and 88%
of all forests in the village. In Mihumo/Darajani 11,792 hectares of forests were set
aside under the village land forest reserve, which covers around 40% of the entire
village land (29,555 ha).
Building on the insights from chapter four, this chapter will continue to answer research
question 1 “How do REDD+ initiatives interact with local livelihood strategies in Lindi,
Tanzania?” It will specifically aim to assess observed and potential impacts of REDD+
to local livelihoods of different village groups. In addition I will offer insights into the
discursive effects of REDD+ to address research question 3 “How do REDD+
initiatives aim to address the drivers of land use change in Lindi, Tanzania?” in the
latter part of the chapter.
The chapter begins by discussing the perceived losses and benefits from the decision to
protect forests on village lands. Drawing on survey and interview data I provide insights
from villager’s own accounts about the positives and negative consequences of setting
land aside for protection. I will then analyse the potential of carbon payments,
specifically referring to REDD+ trial payments in Ruhoma and contrast them to
foregone benefits from crop production. This is followed with a discussion of villagers’
fears over potential losses from forest protection including decreased agricultural
outputs, wildlife damage and displacement.

139
In the second section I will show how forest conservation was introduced in the two
villages as a path to green development, promising villagers to economically benefit
from forest resources in a sustainable way. A certain discourse was promoted that
highlighted the economic and environmental benefits from forest carbon
commodification while simultaneously downplaying its costs to some stakeholders.
This was enhanced by the development actors’ efforts to create a certain crisis narrative
of the currently practiced forms of agriculture ultimately aiming to change villager’s
perceptions of themselves and the landscapes they inhabit.
5.2 Perceived benefits and losses from forest protection 5.2.1 General perceptions
Whether we continue to protect the forest or not will depend on the benefits we get from it. If we don't benefit from it we will farm again there in the forest to get a lot of food (R Interview 17).
As part of my household survey I asked respondents two questions about the collective
and individual benefits of forest protection. I obtained very different results in the two
villages.
Graph 5.1 Perceptions of collective benefits from forest protection
The vast majority of respondents in Ruhoma believed that the village benefited from the
protection of the forest. Only about 10% of the interviewees responded with “no” or “I
Did the village benefit from the protection of the forest?
0,00%
10,00%
20,00%
30,00%
40,00%
50,00%
60,00%
70,00%
80,00%
90,00%
100,00%
Yes No I don't know
Ruhoma (n=39) Mihumo/Dar ajani (n=76)

140
don’t know” to the question. This is different to Mihumo/Darajani where less than 50%
stated that the village benefited from forest protection. These opposing views over the
benefits of forest protection become even more striking when we look at the individual
level.
Graph 5.2 Perceptions of individual benefits from forest protection
In Ruhoma more than 80% of the respondents claimed that they individually benefited
from forest protection. Yet in Mihumo/Darajani less than 30% of all interviewees felt
this way. There is at least one easy answer to it.
In Mihumo/Darajani there was a general feeling of deep disappointment with the way
development activities regarding forests have been carried out. From the early 90s
onwards residents have been advised to protect the forest in order to reap significant
monetary and non-monetary benefits. However, so far the general consensus among the
rural population in this village expresses a sense of betrayal by the district and
development actors. Many times the experts come, people from Europe, from the
national capital or the local district office, to visit the villages, to talk about the
importance of forest protection, and to raise expectations of future incomes. However,
so far very little has materialised of what was promised. Frustrations, anger and
disappointment about the lack of benefits have become dominant feelings in the village.
Villagers in Mihumo/Darajani have not been allowed to harvest timber from the reserve,
Did you individually benefit from the protection of the forest?
0,00%
10,00%
20,00%
30,00%
40,00%
50,00%
60,00%
70,00%
80,00%
90,00%
100,00%
Yes No I don't know
Ruhoma (n=39) Mihumo/Dar ajani (n= 76)

141
which they could sell to raise income. At the same time no REDD+ trial payments have
been dispersed among the population. The only income that the village receives from
the forest reserve are fees from foreign researchers to obtain the permit to enter the
reserve.
There is nobody here in the village who has got benefits from the forest. People enter the forest, they leave, and we don't know anything about what he did, and what he harvested. We ordinary villagers don't benefit from the forest. (M Interview 21) Since we started to protect the forest the community hasn’t benefited at all. It is the situation of destitute that drives them to enter. And they don’t understand how they will benefit. (M Interview 54) Yeah, we haven't got any answers yet from the Europeans. But they can come, and they say, people we want that you protect the forest, don't cut the forest. We are being told this. Don't cut the forest. We must not practice shifting cultivation. But that they come to bring some kind of support, we don’t see it. He can come overnight, he inspects and then he leaves. We don't understand. They come to take what? We don't understand. If they come to dig our trees, they dig and leave with them. But we haven't got any amount of money. Maybe tax, it can be that they pay tax 10,000. That's it. (M Interview 16)
In Ruhoma the opposite was the case. During my stay in this village I could witness a
general sense of satisfaction with the decision to protect the forest. Villagers expressed
happiness about the monetary and non-monetary benefits they have received so far from
the REDD+ project. These include trial carbon payments for every villagers as well as
training provided in the form of workshops, progress in decentralisation reform (legal
tenure over forest resources) and knowledge about improved agricultural techniques. In
the course of the project the village was also assisted in building a new office.
Especially because of the REDD+ trial payments villagers in Ruhoma felt that they
benefited individually from the decision to protect the forest. In total an amount of
21,081,960 TShs (12,730 USD) was provided by the REDD+ project to the village. A
sum of 2,973,560 TShs (1,900 USD) was kept and spent on community development
projects and the remaining 18,108,400 TShs (11,570 USD) were distributed
transparently and with the help of TFCG/Mjumita project staff to all ordinary

142
residents19 of the village. Each registered adult in the village received an amount of
39,000 TShs (25 USD). For every registered minor (up to 14 years) an amount of
20,600 TShs (13 USD) was paid.
We get benefits from carbon, we villagers. Like they brought us money. Every person got money. Children got money. And with the money, every person used it the best way according to his knowledge. Some bought food to help him/her together with his/her family. Others used it for farming, so that he could have more afterwards for his family (R Interview 26)
These differences in the perceptions of the benefits from forest protection also
contributed to contrasting views over the condition of protected forests. In my
livelihood survey I asked interviewees whether they thought that the condition of the
forest has improved compared to the past. In Ruhoma a clear majority of the
respondents claimed that it has, while in Mihumo/Darajani less than 40% thought so.
Because of the benefits that Ruhoma and its residents received from forest protection,
villagers claimed that no illegal destruction is taking place anymore within the forest.
Therefore, more than 80% of the interviewees believed that the quality of the forest is
increasing. In Mihumo/Darajani people were generally uncertain and sceptical about the
condition of the forest due to the lack of benefits received. Around 40% of the
respondents either believed that no effective protection is in place or they did not know
what the condition of the forest currently looks like.
19
Residents were defined as people who were born and live in the village or who migrated into the village to reside there permanently (Source: Ruhoma bylaws)

143
Graph 5.3 Perception of the condition of forest reserve
5.2.2 Distribution of benefits It is a well-known challenge for any development project to ensure the equitable
distribution of benefits among project participants. As mentioned in the previous
chapter local inequality often negatively affects forest conditions (Andersson and
Agrawal, 2011), therefore equitable benefit distribution should be an important
objective of any REDD+ initiative. In our case study sites I asked interviewees whether
they believed that certain groups in the village (leaders, members of the village natural
resource committee or others) benefited more than the rest of the village from the
protection of the forest. In Ruhoma a large percentage of the interviewees (80%)
believed that some groups benefited more than others. In Mihumo/Darajani about 40%
of the interviewees answered with ‘yes’ while another 40% claimed to not know.
Especially in Ruhoma many residents felt that benefits were unequally distributed as
village leaders and committee members received additional benefits in the form of
training, allowances, permits and income from forest carbon assessment exercises.
While the trial payments were equally distributed among all villagers, certain groups
benefited from the many activities that were conducted in the villages by development
actors.
Did the condition of the protected forest improve compared to the past?
0,00%
10,00%
20,00%
30,00%
40,00%
50,00%
60,00%
70,00%
80,00%
90,00%
100,00%
Yes No I don't know
Ruhoma Mihumo/Dar ajani

144
Graph 5.4 Perceptions of elite capture of benefits
This sentiment about the unequal distribution of benefits is also mirrored in some semi-
structured interviews that I conducted in Mihumo/Darajani. Ordinary residents
complained about the lack of transparency and that elites in the village obtain money by
taking researchers into the forest, from permits, tax or other forest related activities.
This part, I don't understand. The ones who arrive there as tourists, they don't have money or they arrive to do sightseeing (kutalii) by which system? Because often they arrive there to do sightseeing (kutalii). Many times. I haven't got the answer yet about what share the village receives from that. Not yet. And if anything is available, then it is small. And it is not to build productivity (tija) for here. The leaders just eat it. The ones who take them there and bring them back. They go there, they bring them back. These are the ones who get allowances to get some food (M Interview 16)
5.2.3 Prospect of carbon payments in Mihumo/Darajani In both villages participatory forest carbon assessments were carried out in order to
establish potential amounts that villagers could receive in future from the sale of forest
carbon. In Mihumo/Darajani participatory rural appraisal methods were employed by
district officials and researchers, where members of the village natural resource
committee, village council, elders and farmers were invited to select villagers, who
should take part in the forest carbon assessment exercises (Mukama, 2010; Mukama et
al., 2011; Sundström, 2010). It was found that the village land forest reserve in
Mihumo/Darajani has similar carbon stocks to other forests in the region, which are
usually low with the exception of closed forests, which make up a small area of the
Did leaders, VNRC members or other few people benefit more than all villagers from the protection of the forest?
0,00%
10,00%
20,00%
30,00%
40,00%
50,00%
60,00%
70,00%
80,00%
90,00%
100,00%
Yes No I don't know
Ruhoma (n=39) Mihumo/Dar ajani (n= 76)

145
entire forest reserve. However, because of the large area of the reserve the total amount
of carbon stored is still significant. It was established that the carbon stocks in dry
miombo, wet miombo and closed forests amount to 17.24 tC, 16.75 tC and 84.89 tC per
hectare respectively (Mukama et al., 2011).
Figure 5.1 Total carbon stock in Mihumo/Darajani VLFR Source: Mukama, 2010
After a second round of participatory forest carbon assessments in the Angai forest, it
was established that in the Mihumo/Darajani village land forest reserve the dry
miombo20 (dominated by Brachystegia spp) and wet miombo forests (miombo forest
located in wetland) experienced an annual increase of 3.8 tCO2 and 0.5 tCO2 per
hectare. In contrast the carbon stock of closed forests (dominated by Brachystegia
microphylla) decreased by 0.3 tCO2 per hectare. Scholars pointed at the community-
based forest management initiatives and the large distance of the reserve to the
settlement area as contributing factors to the annual increase in carbon stocks. With
regard to the decrease in carbon stocks in closed forests they highlight the role of
elephants as the main driver (Personal communication, 2013).
20
Stratification of the forest into dry miombo, wet miombo and closed forests was performed by the village forest assessment team prior and during participatory forest carbon assessment activities. Stratification was based on vegetation type, disturbances, stocking and topography (Mukama, 2010). Miombo woodlands are often rather arbitrarily divided into dry and wet types depending on rainfall, canopy and species content (Chidumayo et al., 2010).
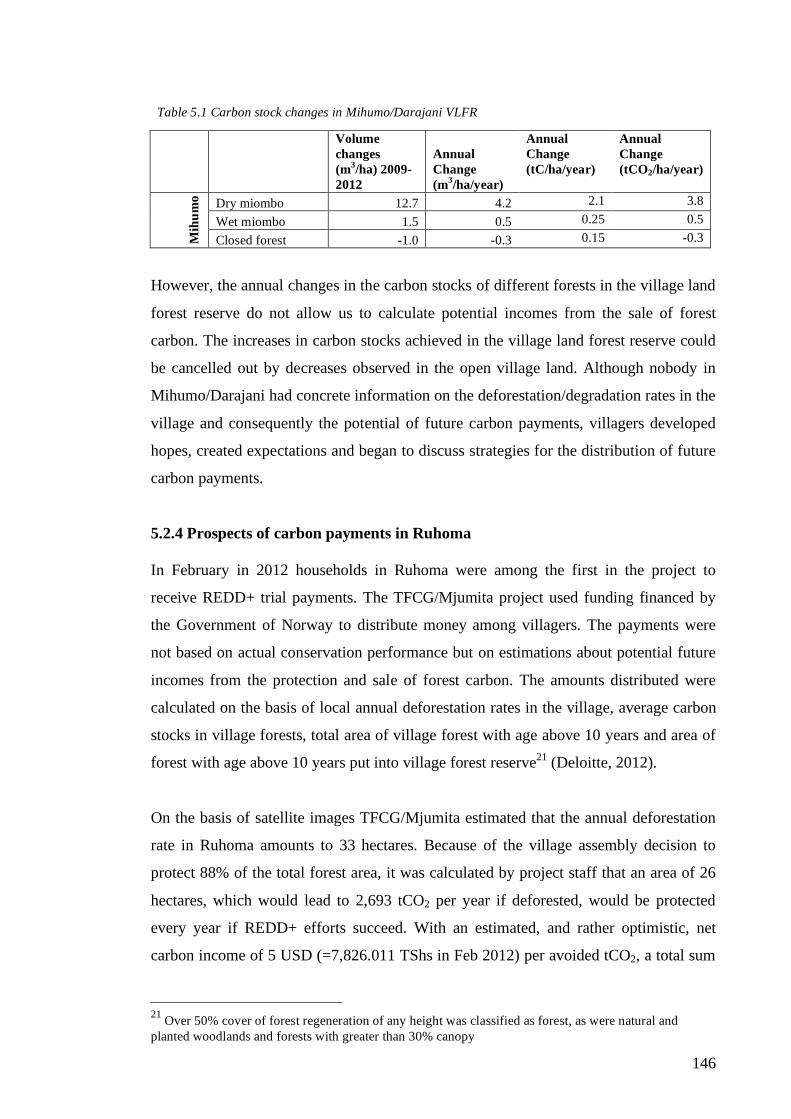
146
Table 5.1 Carbon stock changes in Mihumo/Darajani VLFR
Volume changes (m3/ha) 2009-2012
Annual Change (m3/ha/year)
Annual Change (tC/ha/year)
Annual Change (tCO2/ha/year)
Dry miombo 12.7 4.2 2.1 3.8
Wet miombo 1.5 0.5 0.25 0.5
Mih
um
o
Closed forest -1.0 -0.3 0.15 -0.3
However, the annual changes in the carbon stocks of different forests in the village land
forest reserve do not allow us to calculate potential incomes from the sale of forest
carbon. The increases in carbon stocks achieved in the village land forest reserve could
be cancelled out by decreases observed in the open village land. Although nobody in
Mihumo/Darajani had concrete information on the deforestation/degradation rates in the
village and consequently the potential of future carbon payments, villagers developed
hopes, created expectations and began to discuss strategies for the distribution of future
carbon payments.
5.2.4 Prospects of carbon payments in Ruhoma In February in 2012 households in Ruhoma were among the first in the project to
receive REDD+ trial payments. The TFCG/Mjumita project used funding financed by
the Government of Norway to distribute money among villagers. The payments were
not based on actual conservation performance but on estimations about potential future
incomes from the protection and sale of forest carbon. The amounts distributed were
calculated on the basis of local annual deforestation rates in the village, average carbon
stocks in village forests, total area of village forest with age above 10 years and area of
forest with age above 10 years put into village forest reserve21 (Deloitte, 2012).
On the basis of satellite images TFCG/Mjumita estimated that the annual deforestation
rate in Ruhoma amounts to 33 hectares. Because of the village assembly decision to
protect 88% of the total forest area, it was calculated by project staff that an area of 26
hectares, which would lead to 2,693 tCO2 per year if deforested, would be protected
every year if REDD+ efforts succeed. With an estimated, and rather optimistic, net
carbon income of 5 USD (=7,826.011 TShs in Feb 2012) per avoided tCO2, a total sum
21
Over 50% cover of forest regeneration of any height was classified as forest, as were natural and planted woodlands and forests with greater than 30% canopy
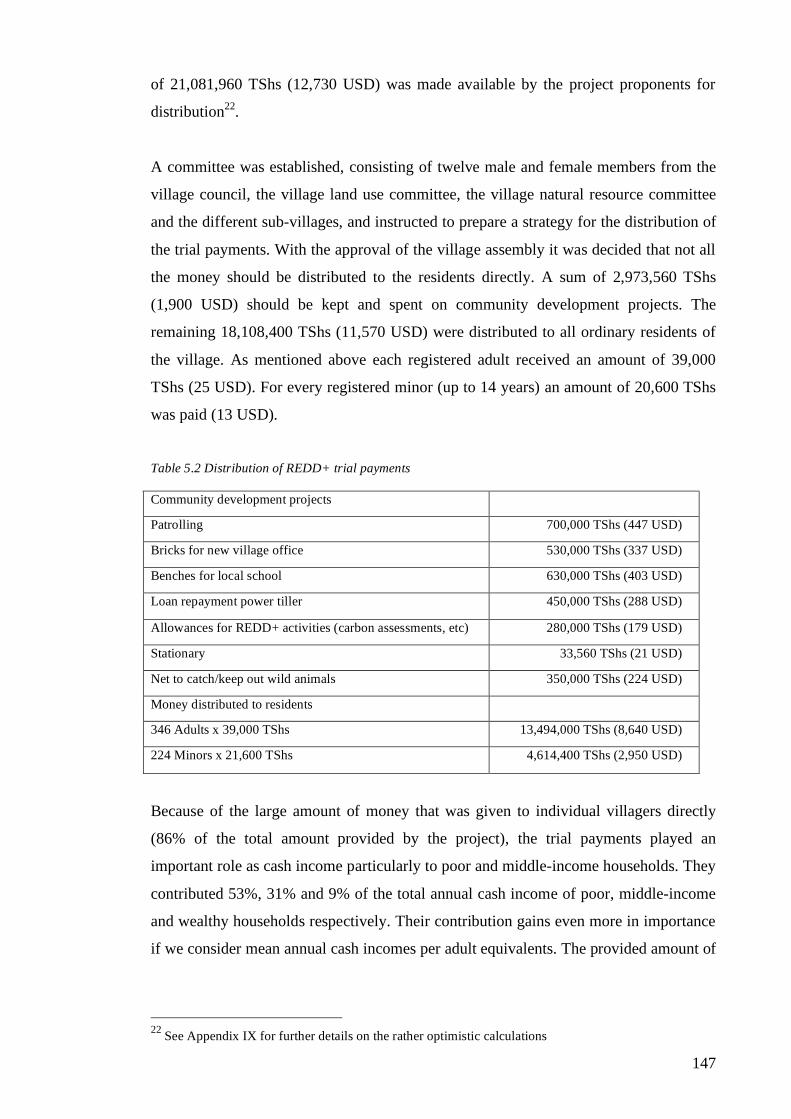
147
of 21,081,960 TShs (12,730 USD) was made available by the project proponents for
distribution22.
A committee was established, consisting of twelve male and female members from the
village council, the village land use committee, the village natural resource committee
and the different sub-villages, and instructed to prepare a strategy for the distribution of
the trial payments. With the approval of the village assembly it was decided that not all
the money should be distributed to the residents directly. A sum of 2,973,560 TShs
(1,900 USD) should be kept and spent on community development projects. The
remaining 18,108,400 TShs (11,570 USD) were distributed to all ordinary residents of
the village. As mentioned above each registered adult received an amount of 39,000
TShs (25 USD). For every registered minor (up to 14 years) an amount of 20,600 TShs
was paid (13 USD).
Table 5.2 Distribution of REDD+ trial payments
Community development projects
Patrolling 700,000 TShs (447 USD)
Bricks for new village office 530,000 TShs (337 USD)
Benches for local school 630,000 TShs (403 USD)
Loan repayment power tiller 450,000 TShs (288 USD)
Allowances for REDD+ activities (carbon assessments, etc) 280,000 TShs (179 USD)
Stationary 33,560 TShs (21 USD)
Net to catch/keep out wild animals 350,000 TShs (224 USD)
Money distributed to residents
346 Adults x 39,000 TShs 13,494,000 TShs (8,640 USD)
224 Minors x 21,600 TShs 4,614,400 TShs (2,950 USD)
Because of the large amount of money that was given to individual villagers directly
(86% of the total amount provided by the project), the trial payments played an
important role as cash income particularly to poor and middle-income households. They
contributed 53%, 31% and 9% of the total annual cash income of poor, middle-income
and wealthy households respectively. Their contribution gains even more in importance
if we consider mean annual cash incomes per adult equivalents. The provided amount of
22
See Appendix IX for further details on the rather optimistic calculations
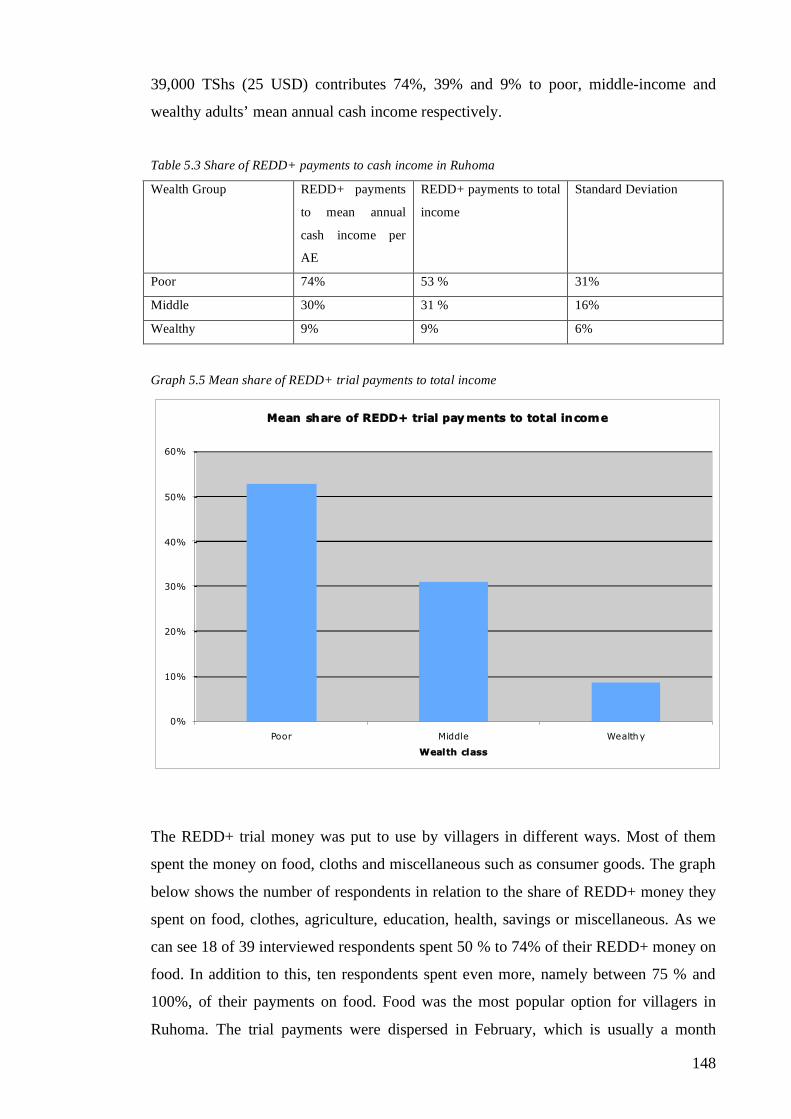
148
39,000 TShs (25 USD) contributes 74%, 39% and 9% to poor, middle-income and
wealthy adults’ mean annual cash income respectively.
Table 5.3 Share of REDD+ payments to cash income in Ruhoma
Wealth Group REDD+ payments
to mean annual
cash income per
AE
REDD+ payments to total
income
Standard Deviation
Poor 74% 53 % 31%
Middle 30% 31 % 16%
Wealthy 9% 9% 6%
Graph 5.5 Mean share of REDD+ trial payments to total income
The REDD+ trial money was put to use by villagers in different ways. Most of them
spent the money on food, cloths and miscellaneous such as consumer goods. The graph
below shows the number of respondents in relation to the share of REDD+ money they
spent on food, clothes, agriculture, education, health, savings or miscellaneous. As we
can see 18 of 39 interviewed respondents spent 50 % to 74% of their REDD+ money on
food. In addition to this, ten respondents spent even more, namely between 75 % and
100%, of their payments on food. Food was the most popular option for villagers in
Ruhoma. The trial payments were dispersed in February, which is usually a month
Mean share of REDD+ trial pay ments to total income
0%
10%
20%
30%
40%
50%
60%
Poor Middle Wealthy
Wealth class

149
characterised by food insecurity. Another important category is spending on clothes.
Nine respondents claimed to spend 25 % to 49% of their money on clothes while six
respondents claimed to spend 50 % to 74% on clothes.
Graph 5.6 Spending of REDD+ trial money
5.2.5 Potential losses Villagers also expressed concern over potential losses from forest protection. In
Mihumo/Darajani large areas of village land were kept outside of the reserve to provide
villagers with ample land for agricultural and forestry activities. In contrast, most of the
fertile forestland in Ruhoma was put under protection. Several farmers were therefore
afraid of the potential negative consequences this could have on the production of crops
for food and income. In the forest farmers could clear land and harvest large amounts of
crops due to the high fertility of the soil combined with no or little weed infestation.
Since everybody is now required to farm in the designated agricultural fields that are
located outside of the reserve, villagers claimed that more resources are required to
achieve similar returns or alternatively they end up with lower agricultural outputs. This
could lead to increased food insecurity especially among poorer households.
I think that it is possible that we will get worse off (tutashuka chini) because of REDD. Because these days we depend on good harvests, and we went to forest and farmed sesame. But now we
Spending of REDD+ money
0
5
10
15
20
25
30
35
40
0 0.1 - 0.24 0.25 - 0.49 0.5 - 0.74 0.75 - 1
Food
Clothes
Agriculture
Education
Health
Savings
Miscellaneous

150
are not allowed to go there anymore. So now it is possible that the economy worsens a bit (R Interview 33) They entered the forest because they ran away from the weeds. Now we fight the weeds, because we decided to protect the forest. We are told to improve our farming. Maybe they will bring us inputs, pesticides to fight weeds. But they told us there is no guarantee that we get these things (R Interview 21) But this year hunger will come. This year people are forced to farm in the village land. Small farms, small farms. You see. In September we will have food shortage. From that time onwards people will start to fight. You agreed to protect the forest. This will be a big challenge. (R Interview 6)
Related to the fear of facing lower agricultural outputs due to less fertile lands is the
threat of increased crop damage from wildlife. In both case study sites forests are
inhabited by wild animals such as elephants, buffalos, monkeys and wild pigs, who
cause damage on fields (cf Johansson, 2008). Some residents worried that due to the
protection of the forest the population of wildlife will increase, which could lead to
more damage of crops on their farms.
The wild pigs are the real nuisance these days. I don’t know if it is the case because we decided to protect the forest. But three years ago there weren’t much problems with wild pigs. People used dogs to chase away monkeys and wild pigs (R Interview 6)
Another key concern related to the fear of becoming economically and physically
displaced from the forest. In the beginning, when the idea of forest conservation was
introduced in the villages, many residents were sceptical, as they feared of becoming
displaced from village forests. They worried of having to accept the loss of access and
use rights of forest resources (economic displacement) or the physical removal from
forestland (physical displacement) as a result of the protection of forests (Agrawal and
Redford, 2009). These fears appeared to be one of the main reasons for locating the
village land forest reserve far into the forest in Mihumo/Darajani, leaving much land
outside the reserve unprotected. However, due to the lack of benefits that villagers
received from the protected forests, some started to argue that they have practically
been displaced from the reserve. Especially, among those residents who were not part of
any committee or the village council, many believed that the Angai forest was sold to
Europeans. They believe that they are not allowed to enter the forest anymore, because
outsiders protect it. They conclude that the forest was sold by corrupt village leaders or

151
by the district council to outsiders, who want it to be protected.
Europeans bought it, together with the chairmen of the village. And the village government reflected and then asked the villagers about the forest to be sold to the Europeans. Then they agreed. Let's sell the forest. Afterwards the Europeans left. The villagers were informed that the forest has been sold. The forest has been sold. They went via the chairmen and the village government. There wasn't any meeting. The chairman and his village government discussed the issues. Afterwards the people were just informed that this forest is not yours anymore. It was sold many years ago. Maybe 6 years ago. (M Interview 8) But because of the delays in the problems it is hard and villagers believe that the forest has been sold because what they have been told and implemented has not benefited them. (M Interview 63)
In Ruhoma fears over economic and physical displacement prevailed too in the
beginning. Villagers first decided to put smaller areas of the forest under protection, but
because of efforts by TFCG/Mjumita project staff they then brought most of their forest
into the reserve. In doing so they transformed a previously open-access forest into
common property, which had negative impacts to some stakeholders. According to
interviews conducted in Ruhoma, conflicts emerged after the initiation of the reserve
with farmers from other villages, who had been farming in Ruhoma’s forests for years
on a customary basis. Because of the restrictions imposed by the newly created forest
management plans and bylaws, these farmers were no longer tolerated anymore and
faced threats of physical displacement. In addition, one interviewed farmer in Ruhoma
complained about the inclusion of his coconut farms into the forest reserve, which
restricted his user and access rights to an important income source to him. As he was no
longer allowed to make use of fire to clear the undergrowth on his permanent farm, he
claimed to face economic displacement from his coconut farm due to the establishment
of the forest reserve.
5.2.6.3 Foregone benefits from agriculture in Ruhoma It is often remarked that payments for ecosystem services schemes must cover
opportunity costs of alternative land uses to incentivise resource owners to change
towards more conservation friendly practices. In this section I will attempt a simple
opportunity cost analysis to estimate the foregone benefits that villagers in Ruhoma
incur as a result of protecting fertile forestland. Merger et al. (2012) estimated the net

152
present value of agricultural land use in the TFCG/Mjumita REDD+ project site in
Lindi at 1,023 USD per hectare. They assumed that the land is used for two years for the
production of sesame followed by ten years of fallow. On this basis they argue that
large mitigation potentials exist from avoiding the expansion of shifting cultivation into
the forests and unsustainable charcoal production. They calculate that avoiding the
expansion of shifting cultivation incurs opportunity costs of USD 8.9 per tCO2. Given
an income of 5 USD per tCO2, project participants forego benefits of USD 3.9 per tCO2
if they continue protecting the forest as opposed to using it for agricultural expansion.
For my own calculations of the incurred opportunity costs for crop production among
the survey respondents in Ruhoma, I refer back to the mean crop values produced by
different wealth groups on temporary farms, as outlined in chapter four. It was
established that poor, middle and wealthy households obtain mean crop values per
hectare temporary farm of 214 USD, 324 USD and 398 USD respectively. On the basis
of these findings, poor, middle-income and wealthy households forego benefits to the
value of USD 0.2, USD 3.3 and USD 5.4 per tCO2 respectively, given an estimated
carbon income of USD 5 per tCO2. Or, in other words, poor, middle and wealthy
households forego benefits of USD 21, USD 350 and USD 572 respectively per hectare
protected forestland. This calculation concerns the opportunity costs for using one
hectare of forestland for the production of annual crops for 3 years, followed by 10
years of fallow, followed by another 2 years of cultivation, followed by 10 years of
fallow. It does not include other forest uses such as charcoal production or timber
extraction. However it includes the net present value of forest protection of USD 75 per
hectare as suggested by Merger et al. (2012).

153
Graph 5.7 Opportunity costs of agricultural land use and REDD+ in Ruhoma
Hence my data suggest that from a financial point of view, the commodification of
forest carbon is unlikely to cover the opportunity costs incurred for giving up annual
crop production, especially of middle-income and wealthy households. Wealthy
households forego considerably higher amounts of value from protecting forestland
compared to other wealth groups. However, my data also suggest that carbon payments
could cover the opportunity costs incurred by poorer households.
Villagers in Ruhoma did not perceive foregone benefits as losses as such. Trial
payments were dispersed in February 2012, at a time when farmers were waiting for
their harvests and households generally lack cash. Cash was therefore very valuable at
this time. The amount of 39,000 TShs was worth more in February than it would have
been after the harvest later in the year. Anyway, no calculations were made about the
opportunity costs of various land uses. Villagers were also promised that they can
evaluate and reconsider their decision of protecting the forest after five years, that
enough land would remain outside of the reserve to continue farming and that improved
agricultural techniques will be introduced in the village to increase productivity. Most
villagers were thus happy about the money and did not think about future losses. There
were a few villagers though who criticised that the amount was too small. In their view
the small amount does little to compensate them for their incurred losses from not

154
opening up farms in the forest.
The amount doesn’t suffice to convince people not to enter the forest for farming etc; for now it was accepted but it’s not enough. For 39,000 TShs to tell a person to not go into the forest, this is too little (R Interview 11) To lift our lives they brought 40,000 for every person. Really, does this lift your life? And we don't understand if it is every year. 40,000 is of no purpose. Better we farm our forest and we get maize. There you get maize hey. There is no weed there. For 40,000 I buy two portions of small fish (dagaa) and the money is gone. (R Interview 22) The money from REDD is not enough for me to continue farming in the agricultural area. Because even if you add them up, it doesn't compensate for one acre farming. … If the money is not enough, the villagers will enter into the forest because of the hard life. If you don't have 10 shilings in your pocket, and the farm needs to be cultivated, you think you get sufficient food from here? (R Interview 23)
5.3 Promoting REDD+ as green development In the light of the above findings, which questioned whether REDD+ payments will
cover the opportunity costs of crop production as the alternative land use, it is pertinent
to ask “Why do villagers, who significantly depend on agricultural land for food and the
generation of income, speak of forest conservation and voluntarily set aside a
considerable amount of productive village land as forest reserves?” This is a crucial
question, indeed, which I will address in this section.
For my analysis I use a broad definition of discourse as “shared and expressed ways of
understanding a phenomenon” (Benjaminsen and Overå, 2011). Similarly,
environmentalism is here defined as “a broad field of discursive constructions of nature
and human agency” (Brosius, 1999, p. 278). I draw on insights from Castree (2013),
who explains that nature can be understood and communicated in different ways
depending on the objectives of the beholder. He claims that different actors
conceptualise and communicate nature differently but because of power imbalances
certain realities of nature become more dominant than others.
In the following sections I will show that in our two villages development and
conservation actors promoted a view of forest landscapes as spaces of biodiversity and

155
carbon sequestration. At the same time the perception of forests as future agricultural
land has been denounced and reformulated in a crisis narrative (Roe, 1991) that
highlights the detrimental environmental effects of this particular land use. In this way
efforts to protect the forest and to commodify forest carbon have been hailed as the
rational path to green development, which shall bring economic and environmental
benefits to the entire community (cf. Lansing, 2011; Li, 2007). In doing so development
actors convinced villagers to set aside productive forestland for protection.
5.3.1 The promise of environmental benefits 5.3.1.1 Climate change mitigation When introducing forest protection and forest carbon commodification to villagers,
development actors highlighted the role of forests to global environmental change. They
depicted farmers and forests in rural Lindi as stakeholders in a global world that is
threatened by dangerous climate change. In creating a form of global crisis
environmentalism, development actors communicated to the villagers a certain
responsibility in stabilising global greenhouse gas emissions. For that reason I could
observe villagers talking about carbon dioxide, greenhouse gas emissions and climate
change mitigation when embarking on my fieldwork in these two remote areas of
Tanzania. Farmers had been told that their agricultural practices are tied to people in
other corners of the world. They directly impact either positively or negatively to the
state of the global climate.
She [Dr. Irmeli] drew a map of the world and she said that the world is one. There are not two worlds. The world is one. This means that the loss/problems that result from Tanzania, they can, it is possible that also they reach Europe. And the losses/problems from Europe, it is possible that they also come here Tanzania. And there you find many problems due to the many industries. The many industries release a lot of smoke. The smoke takes the air up. It can enable a change in the weather. The rain does not come in time. And also other things can be different. There the industries, they agreed to reduce but they disagreed. And here, the laying of fire in the bush needs to be reduced so that the reason for carbon (hewa ukaa) does not result. So she talked about that and drew a map of the world. It is necessary that we communicate in order to reduce carbon. To reduce the losses that we get from the change in weather. She tried to educate us until we understood. (M Interview 10)
This year we planted trees. Trees for timber. We planted around 50. Afterwards they will help us to improve the weather situation. You know the issue of the weather. The pollution of the climate

156
because of the many industries. The pollution of the climate as a consequence of people cutting trees arbitrarily. There is no rain. So when we plant trees, we care for rain and better climate. Here we can produce good air. If you want to cut a tree, you need to plant another one. (R Interview 35)
5.3.1.2 Promising local sustainability In addition to the contribution of forests to global climate regulation, villagers spoke
about local environmental conditions. It was a particularly common experience for me
to hear people talking about the forest’s ability to influence the local weather.
Specifically the notion that trees could ‘drag or pull in’ clouds and therefore attract rain
was widespread among the rural population (cf. Brockington, 2006; cf. Conte, 1999).
The argument that rain and good weather depends on a healthy forest was certainly one
of the most convincing reasons for villagers to protect their forests. For this to
recognise, one interviewee said, they don’t need the government. In addition to the rain,
forest conservation was also regarded to reduce heat levels, improve local air
conditions, particularly during dry seasons, and to help conserving local water sources.
But the main benefit from the forest is the rain. For this benefit we don't need support from the government. We can agree ourselves, if we protect the forest then we receive rain. If you protect the forest then you get a lot of clouds/mist and then you get a lot of rain. In the summer, it is very hot. But if you have a forest, then you also get good air. For this you don't need the government. (M Interview 4)
If you do something you must ask for what purpose. Now we protect the forest and ask for what purpose. Mostly for development. So for the rain for example that it will continue to come. Like the scientists say. If we protect the forest, the climate will change, rain will be a lot. A lot of rain means good harvest, which means development. This is how I see it. (R Interview 31)
At times, when it did rain, some villagers would even point out that because of their
hard efforts to protect the forest the rain comes now more regularly than it did in the
past. This raised their confidence in their decision to protect the forest. It also raised
their expectations of better future harvests. However, among the villagers many were
careful to not draw premature conclusions. While they would know of this tree-local
weather connection, which was seen to be a scientific claim, their strong belief in a God
given weather would not be easily shaken.

157
The way I see it. Often we depend on science to they tell us. When the scientists tell us that the weather situation has changed globally etc., others, who have studied, can continue to say, ah this is the plan of God. But also others say we have a forest, which brings us the rain. So every day we get used to the idea that having the forest brings the rain. So if we damage the forest than this is the challenge... But we don't understand if the increase causes more rain or what. But often we say that God has its own plans. Because we only started last year to protect the forest and this year we have continued, but just because we started to protect the forest the rain comes. Is this possible? (R Interview 31)
5.3.2 Promising economic benefits 5.3.2.1 Forest carbon payments Potential payments from the sale of forest carbon credits were certainly the most
important benefit promised by development actors to the villagers. It was indeed
fascinating to experience how villagers in remote rural Tanzania, who are in many other
respects excluded from the circulation of global commodities, learn of the carbon
commodity as a new way of making money. Due to workshops and meetings held by
researchers and district staff, villagers have begun to talk about carbon trade and related
markets as a new business opportunity resulting from the conservation of forests. They
were aware that there is a business to be made from ‘dirty air’ with rich countries. By
cleaning the air for the people with the dirty industries, villagers receive money that
they could use to finance infrastructure, schools, hospitals etc.
We were told that if we protect the forest, if you protect the carbon, to a big amount, then we will get money, because it will be analysed how many tonnes of air were protected. So the countries with the industries, they will pay us for taking care of the air. We protect the air and they produce dirty air and we protect. So we are going to be paid. If it goes like this, then it is a good plan. Because when we protect the forest, it is necessary that we don't cut...(M Interview 14) Our aim is to improve the forest. To protect the forest. If you protect the forest, you get carbon. If you take the carbon to the market, money will be available. From the money, a percentage we get. Another part we must use to improve the forest. In the village we will plan of how to use the money. The money must be divided to improve the forest, and another part to give to the villagers. Another part to build things for the forest. (R Interview 21)
The commodification of forest carbon as a means to protect forests has really taken
roots in the discourse of village leaders. Village leaders told me many times that without

158
money it is almost impossible to ‘force’ people not to clear forestland. But through
payments the farmers would see the benefits of forest protection and therefore change
their behaviour towards conservation friendly ways. It is a clear expression of what
Fletcher (2010) called ‘neoliberal environmentality’, which relates to forest
conservation in terms of cost-benefit considerations, as opposed to strong moral values
for the conservation of nature.
If the money (from forest carbon) comes here, the villagers would get a big challenge and they would see how the forest provides benefits. And also at the last meeting we told them that this is a fundamental issue. If the money from forest carbon comes, the money will help the villagers a lot and they will see how this area is now not to play around with. And also the security (ulinzi)... if you see somebody laying fire, it will be easier to report because people will now of the benefits of the forest. Because villagers like it a lot to see the results of what they do. And if you look, issues around the forest started a long time ago. We started 2002. People want to see, what are the benefits. Because we started 2002 and now we are in 2012, so it is ten years by now. We have been in the process of Angai forest. So it will be good if people see the benefits. (M Interview 11)
Because of the complexity of the matter, the low educational level and limited sources
of information available in the village, many villagers had a number of unanswered
questions and uncertainties about the nature of carbon trading. It was definitely hard for
everyone to fully comprehend the opportunities and costs involved in this new business
venture.
Forest carbon? Hmm… I have heard it but haven't understood it. Its meaning I haven't understood well yet. (M Interview 13) This is true. People don't know the meaning of carbon… Many of us, carbon we don't know. We haven't fully understood what carbon is. (R Interview 34)
From the graph below we obtain mixed results with regard to the understanding of
villagers of carbon. It shows that the two most common answers to the question “What
is carbon dioxide” were either “I don’t know” or “dirty air”. The latter was the common
signifier used by development actors to explain the concept behind carbon trade. It was
therefore chosen by 40% and 30% by interviewees in Ruhoma and Mihumo/Darajani
respectively. Quite a high percentage, namely about 40% and 55% in Ruhoma and
Mihumo/Darajani respectively, claimed to not know the correct answer. However, many

159
residents in both villages had a clear idea about the REDD+ projects. To them the
projects meant that they get paid for protecting the forest. They understood that forests
are important to Europeans because of climate change, and this is the reason why
villagers were offered money to protect them.
Graph 5.8 Perceptions on carbon dioxide
5.3.2.2 Legal ownership over forest resources In both villages the commodification of forest carbon was tied to community based
forest management approaches. Therefore, many villagers highlighted the benefit of
becoming the legal owners of the forest. They explained to me that until now outsiders
and the district have benefited most from the forest resources. With the launch of
community ownership over the forest, for the first time they will be legal owners of the
timber and non-timber products including medicine, mushrooms, vegetables, honey,
timber, poles, bush meat and firewood (R Interview 20, M Interview 11).
5.3.2.3 Improved agriculture and alternative incomes Understandably, lots of villagers had fears about the negative consequences of forest
protection to their livelihoods. Development actors assured villagers that they will be
allowed to extract forest resources to meet subsistence needs and they will be assisted in
improving their agricultural techniques in order to increase productivity and outputs on
their existing land. In addition alternative income generating projects will be launched
to cover the losses incurred by the protection of the forest. This assurance was a
significant contribution towards achieving consensus among the rural population in
What is carbon dioxide?
0%
10%
20%
30%
40%
50%
60%
70%
80%
Dirt y air Cold air Type of so il Type o f tree Clean Air Hot air Example o fgreenhouse
gas
I don't know
Meaning of carbon dioxide
Pe
rcen
tag
e o
f co
un
t s
Ruhoma (n= 39) Mihumo/Dar ajani (n= 76)

160
Ruhoma to protect considerable areas of forestland.
We agreed to this project because they told us they will bring better agriculture. We can farm in this area, and we will get good harvests. (R Interview 33) They tried hard to mobilise us…. We explained to them that for farming we depend on farming there (in the forest). So they told us to protect it. And they told us we will get better farming. Modern farming (R Interview 38)
5.3.3 Promoting crisis narrative In both case study villages development actors (district officials, project staff and
researchers) criticised the conversion of forests to agricultural land. They aimed to
influence how farmers view their long-standing agricultural practices, especially the
pursuit of slash-and-burn shifting cultivation, and the role of forests to livelihoods. In a
report (Forrester-Kibuga and Samweli, 2010, p. 15) of the TFCG/Mjumita project in
Lindi the perceived problem is clearly stated: “One of the most important contributions
to deforestation is people’s attitudes towards their forests […] There is a sort of
collective blindness about the state of the forests.” Consequently, as one of the
mitigation efforts, the authors of the report proposed (ibid, 2010:26) to “carry out
awareness raising about the negative impact of shifting cultivation on forests, building
on the current slight understanding that forests have a crucial role to play in water
supplies.” Similarly a project document prepared for the Limas project (LIMAS, 2010,
p. 42) lists “educate and communicate on the effects of shifting cultivation and use of
fire for fields preparation, including implementation of rules and regulations to deter
setting forest fires” among the proposed activities related to the forestry management
plan.
Some proponents of REDD+ in the study sites including agricultural extension officers,
project staff and district officials thought that farmers pursue shifting cultivation
because of a lack of knowledge or education. Project staff in Ruhoma, for instance,
mentioned a couple of times during my fieldwork that villagers need to be ‘educated’ on
improved farming techniques and the importance of forests. The project staff hoped that
with education the attitudes of farmers about agriculture and forests could be changed.
They tried to educate villagers on the many benefits they receive from forests in order to
promote protection. The clearing of trees for agricultural expansion was sometimes
called ‘arbitrary’ (holela), thus giving the impression that it was an illogical or irrational

161
action.
During my fieldwork I could observe that several village leaders co-opted a crisis
narrative that condemns agricultural expansion into the forests. They highlighted, as the
development actors too, the use of fire as particularly problematic. Cutting trees and
setting fire was equated with the destruction of the environment, leading to less rainfall,
droughts, less wild meat and global climate change. It was denounced by some as
creating wasteland, called ‘jangwa’ (cf Brockington, 2006; cf. Conte, 1999), which only
creates useless land with negative effects on local environmental conditions. The
following quotations, which illustrate negative opinions over shifting cultivation, were
taken from interviews with villagers who were well respected in the villages. One could
say they were informal leaders among the village population.
With shifting cultivation and setting fire you farm for a few years and then the fertility is gone. Then people need to move again to another place and if you do this you damage the environment. You clear the land, forest and set fire. When you set fire it means you have damaged the environment. (M Interview 26) Shifting cultivation doesn't have much productivity/benefits. It just continues to destroy the forest. So the farmers must be showed another phase of farming. Maybe with tractors, or projects. (R Interview 13)
5.3.4 Promoting green development discourse Development actors made use of various strategies to promote a green development
discourse of forest protection and the sale of forest carbon in the villages. In the
following section I will briefly illustrate the means utilised to convince villagers over
the benefits of protecting village forests.
5.3.4.1 Village assemblies and sub-village meetings Official meetings with the village council, village committees and village assemblies
were the primary forms sought by development actors to spread certain ideas among the
rural population. In official meetings matters are discussed formally, following a certain
procedure, which gives decisions legal legitimacy. In such meetings it was common for
district officials to accompany project staff to add another level of authority and
legitimacy to the claims made. In Liwale many meetings, specifically with the village
council, the village natural resource committee and the REDD+ committee had been

162
conducted since the idea of community based forest management was first introduced in
the early 1990s. However, during the time of my fieldwork very few meetings were
held because of political and religious conflicts in the village.
In Ruhoma, meetings were conducted in each sub-village in the first phase of the project
preparation in order to reach as many villagers as possible. The project staff paid
particular attention to sub-village and general meetings during project preparation. They
were guided by the free, prior and informed consent approach, which shall guarantee
that project participants fully decide voluntarily whether to accept or reject external
interventions (Forrester-Kibuga et al., 2011). As the quote below demonstrates, the idea
of establishing a village land forest reserve was at first foreign to the majority of the
villagers. However, through continuous meetings and the support of district officials
people started to listen and internalise what they were told by project proponents.
The first time Ray23 came to explain to us at a general meeting. To many of us this came as a surprise. People started thinking about it. Another meeting other people came from Lindi district. They also make us believe more, they knew about the issue. They increased our confidence that this forest is our wealth. So we said our capacity is small, we need some sort of help to pull us. They talked about carbon measurements and selling it. But we still don't know about how to sell it. We will get used to it more and more. (R Interview 31)
When the project came, they first met with the village government. They were told and then they told the villagers. At first we refused, we said we don't want it. But after we got knowledge, we were told that we could try it. In future if we don't understand, it is possible to leave it. Now we agreed and the project continues. (R Interview 33)
After that more village assemblies were held particularly when new information needed
to be spread, important decisions were to be made or when special guests arrived. The
arrival of guests from other parts of Tanzania, or in some cases even from far abroad,
too served the project proponents to support and legitimise their actions.
5.3.4.2 ‘Expert’ knowledge During my time in the villages I continued to ask villagers why they protect their
23
Ray was the local field coordinator in Lindi rural for the TFCG/Mjumita REDD+ project

163
forests. Often they replied by linking their decision to the arrival of experts ‘watalamu’
in the village, who advised them to do so. According to their understanding the experts
specifically came to hold assemblies to “educate” them on the benefits of improved
forest management. Until today villagers have not stopped to recognize the authority of
expert knowledge and they continue to recount certain narratives highlighting their
major role in shaping the local discourse.
We used to refuse. We refused a lot. But we were taught by people who studied. So something that you don't know, disturbs you. If you know about it, then you will agree to it yourself. You learn from other people and then believe. We study by doing not with a pen. We learn by looking (R Interview 15)
Especially the authority given by villagers to people who have studied enables
development actors, who were generally educated, to get their messages across
successfully.
So this document was given and the purpose was to give the forest a name. We are the ones who look at the experts only. Because as you know, the ones who studied are at the top and the ones who did not study are at the bottom. (M Interview 10)
We don't have education but if you explain it to us we understand its benefits. But the problem is that we don't have education. We have the knowledge from birth only. We know how to make things without education, we just have knowledge from birth. We haven't been taught in school. (M Interview 16)
Often villagers regard experts as people who have more knowledge than them. They
know more than them and therefore it is necessary to listen and learn from them.
Discussions are therefore not necessarily about different ideas and strategies. Instead, it
is about who knows more, who has understood and who has not yet understood.
Therefore, people who disagree are the ones who have not yet understood and they need
to be further educated about the right way of doing things.
Disagreements occurred but because we really educate one another they became less powerful as they came from people who did not understand what REDD+ is about. In future, day after day, they will understand more and more (R Interview 11).

164
5.3.4.3 The use of print media The use of print media was another tool to attempt the internalisation of certain norms
and values in favour of forest protection by villagers. Although there exist a number of
information brochures, specifically for the TFCG/Mjumita project, many of them were
written in English and therefore not found in the villages, since residents would simply
not understand them. But the project facilitators produced materials written in Swahili
to be disseminated in the villages. Because the majority of the villagers struggled to
read well, by which I mean to fully and quickly comprehend the content of an entire
text, brochures were deliberately written in an easier language and supported with
pictures and drawings. Much effort was put into the brochures to present often highly
complex matters in a way deemed appropriate for villagers. The Swahili leaflet shown
below was created in July 2011 by the TFCG/Mjumita REDD+ project. It uses
compelling texts and pictures of livelihoods and forests to highlight how local actions of
forest clearance are linked to both local threats of drought and the global concern of
climate change. Rural residents are connected to environmental degradation, whereby a
sense of responsibility and urgency is created to act in favour of forest protection.

165
The role of forests in climate change:
Right now the world is faced with the problem of climate change. These changes have
continued to bring various effects including changing patterns of rainfall and prolonged
periods of drought from global warming etc. These changes were caused by an increase
in emissions of greenhouse gases including carbon dioxide emissions that result from
the destruction of forests (TFCG/Mjumita 2011; own translation)
In training material produced by the TFCG/Mjumita REDD project for the use during
workshops and seminars with village representatives to introduce participatory forest
management and REDD the warnings of the dramatic negative effects of irresponsible
forest clearance (drought and agricultural losses through shifting cultivation and the use
of fire in the forest) were highlighted with the support of compelling drawings that can
be easily understood by rural populations.
Figure 5.1 Project leaflet TFCG/Mjumita REDD+

166
Figure 5.2 Images from training material used by TFCG/Mjumita REDD+
Drought Shifting cultivation
Fire in the forest
In cooperation with other non-governmental organisations in Tanzania pamphlets have
been produced, which tell a story of a young man who, after learning of REDD and the
dangers of unsustainable forest use, sets out to inform village leaders and other fellows
in his home village of the opportunities REDD offers. Especially from this pamphlet we
can clearly see how strategies to promote forest conservation were highly adapted to the
local cultural setting of rural Tanzania. By reading and looking at these kinds of
materials villagers were to be sensitised to changes in their behaviour and lifestyles.

167
Figure 5.3 Project leaflet 2 of TFCG/Mjumita REDD+

168
5.3.4.4 Extension services Extension services were among the most emphasised techniques to exercise power.
Especially the agricultural extension officers, both from the district and project
organisations, were instructed to mobilise people to change their farming behaviour. I
will talk more about the extension officer’s strategies to promote conservation
agriculture in chapter eight.
5.3.4.5 Multi-media events Sometimes development actors used video and audio media to illustrate the harmful
effects of traditional ways of living. They were effective tools in the pursuit of changing
people’s own perceptions of their lifestyles. A quote from a sub-village chairman in
Mihumo/Darajani reveals how his perceptions of farming were changed after seeing
pictures of environmental degradation on a video film.
In the beginning, the question about the forest was seen to be very difficult. As the Europeans came and when they brought the video camera to show how and which losses people get from destroying the forest. You get jangwa, and drought, the livestock dies and for people to get water they go 5 kilometer. So that we get touched and that if we don't take care of our forests we will end up like this. And they told us about the benefits of forests. If you protect the forest you get these benefits, timber, firewood, medicine, etc. honey,... They helped us a lot to give the villagers knowledge to know, if we do this then it will be bad, if we do that then it will be good.... So about the forests, people have understood it well. .... the forest is not a place to just use it.. to play around...to set fire.... (M Interview 11)
One day in Ruhoma I was lucky to attend a spectacular open-air cinema screening
organised by members from the TFCG organisation. In an environment where people
live a very humble lifestyle without access to power or running water the utilisation of
movie screening and sound can have a long-lasting effect on people’s memories. In two
cars the TFCG staff came along with the screening equipment that excited almost
everyone among the impatient crowd. After the installation of the equipment was
completed, a wildlife DVD, which presented the natural wonders of the Serengeti, was
shown. People were shown illustrative images of lions, buffalos, elephants etc. That the
language spoken in the movie was English did not matter to anyone as the images spoke
for themselves: protect wildlife. This entertainment continued with the next two movies,
particularly the last one. After showing scenes of ruthless forest destruction in the

169
Pwani Region of Tanzania, villagers got to know the final video, which was about
REDD+ in Tanzania as the solution to deforestation and forest degradation. When
villagers noticed that some of the actors shown in the movie were sitting right in front
of the screen (villagers of Ruhoma were interviewed and featured in the movie) the
enjoyment was taken to another level. People started laughing and talking loudly about
the video scenes. The ones shown in the video were clearly happy. It is likely that the
video created a sense of happiness about their participation and achievements among
the viewers this evening.
Figure 5.4 Photos of multi media evening in Ruhoma
5.4 Conclusion This chapter set out to answer research question 1 “How do REDD+ initiatives interact
with local livelihood strategies in Lindi, Tanzania?” and partly research question 3
“How do REDD+ initiatives aim to address the drivers of land use change in Lindi,
Tanzania?” Building on the insights from chapter four about the role of widespread
poverty, inequality and villagers’ dependence on land for crop production as the most
important livelihood activity, this chapter attempted to assess the material and
discursive effects of REDD+ initiatives in the two villages.
Concrete and equitable material benefits to villagers are vital if REDD+ initiatives want
to gain popular support among the rural population (Corbera et al., 2007). This chapter
shows that there exist stark differences over the benefits received from forest protection
in the two villages. Villagers in Ruhoma felt that they collectively and individually
benefited from protecting the forest, as they accessed monetary and non-monetary
benefits that contribute to inclusive development in the village. The exact opposite was
observed in Mihumo/Darajani, where forest protection has not generated meaningful

170
benefits to the local community and much uncertainty prevails of the potential of future
carbon payments. This contrasting experience about REDD+ contributed to villagers’
oppositional perceptions over the effectiveness of conservation and the condition of the
forest in the villages. While the benefits received in Ruhoma contributed to positive
attitudes towards conservation, the population in Mihumo/Darajani expressed general
dissatisfaction, frustration and disappointment about the forest reserve. These findings
reemphasise the need for REDD+ to promote inclusive economic development if forest
conservation is to succeed.
In this chapter I also highlighted some of the potential trade-offs of REDD+ (Hirsch et
al., 2011). Especially the villagers in Ruhoma expressed fears over lower agricultural
outputs, more wildlife damage and increased risk of food insecurity in future as a
consequence of establishing the forest reserve. Fears over economic and physical
displacement were prevalent in both villages and forms of displacement occurred on an
individual basis in Ruhoma. This shows that trade-offs are inherent features of forest
carbon protection. Whether REDD+ initiatives will be able to counteract these potential
losses is a crucial question that only time and more studies will answer.
Carbon payments are the primary means of REDD+ to balance incurred livelihood
losses. In both villages no carbon credits have been produced, let alone sold, from
which villagers could obtain income. In Ruhoma project proponents provided REDD+
trial payments, which contributed much to the satisfaction of villagers about their
decision to protect village forests. According to my data the trial payments contributed
significantly to cash incomes of poor and middle-income adults as they made up 74%
and 39% respectively of their mean annual cash income. Furthermore, cash payments
were worth a lot when dispersed in February as during this time households lack money
and food insecurity is most prevalent. As poor people depend much on casual farm
labour for supplementary income (see chapter 4), the significant contribution of trial
payments to their incomes may assist them in applying their labour power on their own
farm as opposed to selling it to other farmers. This could have positive effects towards
addressing local inequality and hence forest protection. It points at the need for further
research on REDD+ payments and their effects on local (in)equality.
Despite the fact that trial payments were calculated on the basis of optimistic
assumptions about potential future carbon payments (conservation success and carbon

171
price), some villagers criticised them for their low amounts and for the uncertainty that
remains over their future existence. Their sentiments were confirmed by my basic
opportunity cost calculations, which illustrated that poor, middle and wealthy
households forgo benefits of USD 21, USD 350 and USD 572 respectively per hectare
protected forestland. Hence, future carbon payments are unlikely to cover the
opportunity costs particularly of medium and wealthy village groups. This could lead to
increasing pressure from these groups to abandon conservation - something worth
researching in further studies. At the same time my findings show that payments
disproportionately benefit the poorest, as they almost cover their opportunity costs.
However, this only applies as long as they remain poor. The moment they become
richer their opportunity costs increase and carbon payments will become less beneficial.
While at the moment most villagers did not perceive losses from foregone benefits as
such, as they were happy about the additional cash they received, their attitudes towards
conservation could change in the longer term.
Given the heavy dependence on land for village livelihoods and the likely possibility
that REDD+ will not cover the opportunity costs incurred of forest protection I argue it
is pertinent to ask why villagers still decide to protect fertile forestland from agricultural
expansion. I then showed that state and non-state actors used a combination of crisis
narrative and green development discourse in the villages to present the
commodification of forest carbon as the optimal way of generating economic and
environmental benefits to rural residents. The clearing of forests for agricultural
purposes was presented as environmentally destructive although in Mihumo/Darajani,
for instance, no good and concrete data on land use change was available in the village
(cf. Bolin, 2010; CCI, 2011). As development actors used discourse to persuade
villagers to protect considerable areas of village forestland, we can conclude that, at
least in the short run, discursive effects of REDD+ can be as decisive as material effects
to influence villagers’ livelihood decisions and land use (cf. Castree, 2013).
After having analysed the material and discursive effects of REDD+ in the two case
study sites, I now turn to chapter six, which examines the political processes behind the
projects and the establishment of the village land forest reserve.

172
Chapter 6: The politics of territorialising village land forest reserves 6.1 Introduction In Tanzania all REDD+ pilot projects build on community-based forest management
(CBFM) institutions as the chosen forest governance framework. The same applies to
our case-study villages, where development actors aim to integrate the commodification
of forest carbon with community-based forest management. Community-based forest
management in Tanzania is a form of democratic decentralisation. If implemented
successfully, it decentralises power and authority over the management of forests to
local village institutions, who, it is expected, will manage forest resources sustainably
(Blomley and Iddi, 2009)24. In this process it establishes new boundaries around forests
and new regulations over their access, control and use. This makes it also a process of
state territorialisation (Vandergeest and Peluso, 1995), which is the “creation and
maintenance of spatialized zones within which certain practices are permitted based on
the explicit or implicit allocation of rights, controls and authority” (Peluso, 2005, p. 2).
State territorialisation under neoliberalism can be considerably shaped by non-state
actors (Corson, 2011). In implementing territorialisation, state and non-state actors
change the relations between people and their environments and between people
themselves. How these changes come to look really depends on the social relations
among actors, including non-human, which can include forms of cooperation,
contestation and resistance (Peluso and Lund, 2011; Poteete and Ribot, 2011).
In the following text I examine the decentralisation of forest management as a territorial
process that aims to shift power over forestland from the district and customary
institutions to village authorities. I will show that territorialisation under
decentralisation is a complex technical and political endeavour that highly depends on
state and non-state actors with limited room for villagers’ agency, despite donor claims
of ‘participatory’ development. Thus the outcomes of forest decentralisation largely
depend on the capacities and benevolence of powerful actors outside the village, who
often lack accountability for their actions (Ribot, 2006, 2004; Sundström, 2010).
24 See Appendix X for a brief description of the legal steps required to establish community-based forest management.

173
I will show how territorialisation is embedded in local politics and power struggles over
people, land and natural resources. It is politics that considerably shapes how
territorialisation unfolds on the ground. All this is particularly important as it illustrates
how the commodification of forest carbon is embedded in a local political context that
can either accelerate or hinder its implementation.
6.2 The long way to CBFM & REDD+ in Mihumo/Darajani 6.2.1 Initiating territorialisation of Angai forest As outlined in the introductory chapter, in 1993-94 the Liwale District council aimed to
territorialise the Angai forest, for it to become a local authority forest reserve to be
managed and owned by the district council. The intention was to demarcate boundaries
inside the forestland to separate the forest reserve from the village land and to transfer
authority and control over the access and use of the reserve to the district level
(Mustalahti, 2007).
However, the wish of the Finnish donor agents was to decentralise forest management
to the community level and to create a village land forest reserve. Because the Liwale
District Council knew of the valuable timber resources within the Angai forest, it
resisted from the beginning the plan of transferring all powers over control and access
of the resources to the villages (Mustalahti and Lund, 2010; Mustalahti, 2007). What
therefore followed is a long period of continuous negotiations between RIPS staff and
the district, which finally ended in 2000 when the district council agreed to the
establishment of a joint village land forest reserve across 13 Angai villages (ibid).
In September 2000 the 13 villages surrounding the Angai forest applied for the
demarcation of the forest reserve and for the issuing of village land certificates to obtain
legal ownership over their village land. Territorialisation of village and forestland is a
necessary requirement in Tanzania to establish community-based forest management.
Before the village can legally own and manage village land forest reserves, clear village
and forest boundaries must be demarcated followed by the creation and approval of
formal forest management plans and by-laws (Blomley and Iddi, 2009). The district
council approved their joint-application in December the same year. In 2001 the
territorialisation process in the Angai forest began and until the year 2004 remained the
focus of the RIPS development programme (Mustalahti, 2007).

174
Given the size and dangerous nature of the Angai forest, demarcating village and forest
boundaries was not an easy procedure. Due to a lack of resources and the significant
difficulties of working in the vast forest area the team consisting of villagers, district
officials and external experts struggled to complete this task. It took more time and
additional help from the Ministry of Land, Ministry of Natural Resources and Tourism
and the National Forest Programme’s Coordination Unit Support Project to carry out the
survey and mapping, which were finally completed in the year 2004 (Mustalahi, 2007).
The survey and mapping exercises resulted in a reorganisation of forestland and
strengthened a certain understanding of the relations between people and forests.
Through the demarcation of boundaries between and within villages, spatial areas were
formally assigned to different villages, which strengthened a sense of ownership and
control.
They take some people and go with them into the forest, in order to know the boundaries. To show them the boundaries of the different areas. This is ours, yours is here, here and here. If you cross over here, this is not yours. Then they return. And they go to Lilombe, and there they explain the villagers the same. The end is here, here and here. This is not yours. And they go with the chairman of the village and his Europeans and draw the boundaries (M Interview 8).
At the same time the demarcation of forestland also caused conflict between villages.
While the boundaries of the farming areas were clear to the villagers, the boundaries in
the forests were a matter of contestation (Mustalahti, 2007 p. 176). Between the villages
of Mihumo, Likombora and Kipule conflict over traditional boundaries emerged during
the demarcation process25. Villagers from Likombora and Kipule complained that
Mihumo’s village land and their forest share are too big. Discussions among village
elders, village council, VNRC and community members were held to settle the dispute.
After rounds of negotiations an agreement was reached, then beacons were placed and
trees were coloured to mark the village borders.
While the task of demarcating boundaries was conflict-laden and depended on local
participation and knowledge of traditional boundaries, district officials and foreign
donor agencies with their ‘expert’ knowledge played an important role in the entire
25 M Interview 53; M Interview 49; M Interview 54; M Interview 10; M Interview 56

175
territorialisation process.
These leaders, the experts, these Europeans. They did it [put the boundaries]. Because this work was done since 2002. They cooperated with villagers themselves. And the villagers agreed (M Interview 10). The white men [Europeans] who come to study in the forest and to put stones there for demarcation. They put them starting from Majuni, if you go, then again another beacon. There is open area, where villagers can farm and the area of the forest. From here to there it is 10 miles. There they started to put stones. And also they put another stone in between the borders of villages. Village of Ngongowele and village of Ngunja and village of Mihumo. They put stones. And they put stones between Likombora and Mihumo. People from the government in cooperation with the experts (M Interview 10)
At the end of the demarcation exercise a total land area of 479,131 ha was secured for
13 villages, and 139,420 h were set aside as the Angai village land forest reserve. In
Mihumo 11,792 h out of 29,555 h total village land were set aside as a forest reserve
(Mukama, 2010). Mihumo villagers decided to put the forest reserve 10 miles away
from the village centre in order to keep enough land for agricultural expansion and for
the collection of forest products. Villagers were clearly concerned about their livelihood
needs; therefore they left a large area outside the forest reserve. Nevertheless, the area
under protection still remained very big as it spans across more than 11,000 h of land.
The area of the forest is very big. Very big. Between the forest area and the area for farming, the protected area is very big. The area is very big compared to there… But also the area that we set aside is big. The area will help, if people have children, move, give birth to more children and move and even there, the government can take the chance and increase the farming area and decrease [the forest area] a little (M Interview 13).
After demarcating the forest boundaries, the village natural resource committee of
Mihumo increased the reserve by putting up a fence around 1 km in front of the forest
boundary as a kind of buffer zone. The committee members communicated to the
villagers that the crossing of the fence was an illegal activity, which would be
prosecuted by the village council. The fence signalled the end of the ‘open area’ and the
beginning of the reserve, where no ‘intruders’ would be permitted. Despite a lack of
approved forest management plans and bylaws the village natural resource committee

176
took on the role of the protector of the forest reserve and threatened villagers with arrest
if they enter the protected area.
The process of territorialisation was legalised in 2005 when each of the 13 villages was
finally given a village land certificate describing the village and the forest boundaries.
This resulted in the loss of the district and central government to income from levies on
forest products (Mustalahti 2007; Mukama, 2010). The issuing of village land
certificates to the chairmen of the 13 villages was celebrated in the form of a ceremony,
witnessed by the Ambassador of Finland who was invited to participate in handing over
bicycles to all VNRCs to facilitate patrolling activities (Mustalahti, 2007 in Sundström,
2010).
6.2.3 Territory without authority Territorialisation involves the allocation of rights, controls and authority over
spatialized zones (Peluso, 2005). After having received the village land certificates,
which made the villages the legal owner of the protected forests, all villages were
required to conduct forest resource assessments in order to create a management plan
and bylaws to obtain authority and control over the use and management of the forests.
This would then enable them to declare the forest reserve and eventually start timber or
other trade with the right to retain all revenues from the sale of forest products (Blomley
and Iddi 2009).
Since writing forest management plans and bylaws is a difficult task that requires
financial and human resources (Mustalahti and Lund, 2010), it is practically impossible
for villagers to establish management plans and bylaws on their own. This made them
once again dependent on external actors for assistance. However, the Liwale District
council made it clear from the beginning that no adequate resources exist to carry out
forest assessments and inventories. While negotiations on this subject continued, the
central and district government banned all logging activities in the Angai forest reserve.
Villagers were promised that once management plans and bylaws were approved, they
would be permitted to run sustainable timber harvesting (Mustalahi 2007; Mustalahti
and Lund, 2010).
Between 2007 and 2008, several institutions including the Tanzanian National Forest
Programme, the Danish development programme DANIDA and the Ministry of Foreign

177
Affairs in Finland provided technical and financial support to the Liwale District
council and the 13 villages to prepare workable forest management plans and bylaws
(Mustalahti and Lund, 2010). A facilitator from the Sokoine University of Agriculture
was hired to conduct participatory forest assessments with the help of selected villagers
and two district forest officers. Together they managed to create draft forest
management plans and bylaws for all 13 villages (MNRT, 2008). Villagers were
promised that they would obtain the finalised management plans and bylaws by July
2009 (Sundström, 2010).
However, in August 2009, Dr. Mustalahti and other researchers from the University of
Sokoine wrote a letter to the Forestry and Beekeeping Division (FBD) requesting advice
and input from the national FBD as they felt the management plans, created by the
facilitator from the Sokoine University of Agriculture, were incomplete. Among the
many concerns held, they stated that the forest inventory was not sufficiently and
estimated harvesting amounts and short rotation cycles could lead to over harvesting. In
their view the management plans did not consider biodiversity and water management
values (Personal communication, 2011). In short, more work, more negotiations and
more resources were needed to finalise and approve them. In 2009 and 2010 the forest
management plans and bylaws were regularly discussed among development actors
with the position that they represent the major stumbling block to formally start the
timber trade, and that concerted efforts were needed to finalise and approve them
(Bolin, 2010; Camco, 2009; Kaale, 2010; Mukama, 2010; Mustalahti and Lund, 2010;
Sundström, 2010).
Ten years after the territorialisation processes started in the Angai villages, and almost
twenty years after negotiations over decentralisation began, villagers still waited for the
transfer of authority over the forest reserve and its resources. From my ethnographic
experience I can say that many villagers blamed the Liwale District council for the
delay of forest decentralisation. In their view the unfinished forest management plans
and bylaws became the most important ‘repertoire of domination’ (Poteete and Ribot
2010) for the district council to prevent the local community from valuable timber
benefits (M Interview 20). Because the management plans and bylaws were never
finalised and approved, the formal ban on timber logging remained intact despite
villagers having obtained formal ownership over their village and forestland. Hence, in
this case legal ownership over the forest did not improve the economic situation of the
178
villagers at all.
We got the certificate. We were told that the harvest we will start after the verification. After putting these beacons. And we have already gone along the boundaries. This place we do this, that place we do that. This place is for this. But with regard to harvest, we are being told not yet. Yes the government restrains us (inatubana) because if we could harvest there and we got people, like Mr. Andrea, he wants trees, let him harvest there we would get money to buy paper for the office. But today we do not even have paper in the office. But the ones who hurt us are from the district. The national government empowers them. If they did not delay, also the ordinary villager would benefit today. (M Interview 20)
6.2.4 The District’s agenda: dividing villages, creating new territories In 2008 something pivotal happened in the Angai villages. District officials approached
village council members of all the 13 villages around the Angai forest to advise them to
divide their villages in order to make service provision from the government to the local
communities easier. Alongside this argument, district officials told villagers about a
national law and policy that suggested the division of villages larger than 250
households. The ward councillor confirms the emphasis on the 250 household mark in
deciding upon new village boundaries. He presents the issue as a clear case of a
necessary intervention to improve the lives of the rural population.
According to order/procedure a village should have 250 households. If it has more, then the service for the village becomes harder. It must be divided so that it becomes easier to offer services to the villagers […] It is not possible that more than 3,000 people use one school. If there is an increase again in future it will be divided again. So also in Darajani we plan to have a primary school. (M Interview 62)
The Village Chairman of Mihumo recalled the District’s decision to carry out a division
of the Mihumo village. However, in his view the idea came from district officials with
the aim to construct ‘certain political environments’. One older man in Mihumo framed
the division of the villages in a similar politicised way. The division of the village also
had to do with shifting administrative and electoral boundaries in order to increase votes
for the CCM party.
The division of the village, really, was basically initiated by politics. Because … the wish from the villagers to decide to divide did not exist. But what was constructed was a way/technique from

179
government leaders within the district council to produce certain political environments, to construct certain areas with many people etc. So they advised the community members about this and villagers agreed. They agreed and entered the phase of separation (M Interview 63). The village was divided because they saw that there are many parties. If they start to divide the village, they will get votes easier. Our party will get more votes. When there was only one party, it was only Mihumo. There was only one party. Only CCM. But today Chadema… The CCM lost a lot of strength. Many are for CUF here. (M Interview 49)
In 2009, when village leaders in cooperation with district officials began to divide the
village land they decided to put the new boundary behind the Southern goal post, so
between the football pitch and the market place. This was voted for as the best place for
the new village (Darajani) to begin, going southwards26. In a later interview the VC of
Mihumo revealed to me that the newly established borderline between the two villages
was accepted by many as the area to the North would remain a stronghold of CCM
(Chama Cha Mapinduzi) while the area to the South of the boundary would be
controlled by CUF (Civic United Front) voters. Through this division, CCM voters
would again have a chance to govern Mihumo village, while the many CUF voters were
to be constrained to Darajani as their new village.
But with this border, already politics was brought in. To start there going North and to start there going South, with the political system, CCM it will be that many people who they want them to govern will be in Mihumo compared to obtaining the chance in the part of Darajani. These political issues were hidden a lot. They were not openly communicated at the time when we conducted these activities of dividing the village. (M Interview 63)
When creating the new village boundaries they solely considered the settlement and
farming area, but not the forestland, which is the largest part of their entire village land.
Villagers thought that the division would only concern the settlement and farming area
but that the protected and unprotected forests would continue to be owned and managed
jointly. The VC of Mihumo explained to me in an interview that their understanding of
dividing the villages was about creating competition over better service provision but
26 In placing the boundary between the Southern end of the football pitch and the market place, villagers did not hear the complaints by the former head teacher who warned that the land of the school got accidentally divided. Some of the with cashew nut trees cultivated land was cut through by the new boundary. A part of Mihumo’s school property was transferred into the area of the Darajani village. Since then debates have emerged over the rightful ownership of this patch of land.

180
not to divide the natural resources so that somebody owns more than somebody else.
All the resources were considered to be the resources of all of them (M Interview 63).
The same opinion was voiced to me by the village executive officer and several sub-
village chairmen (Journal 25.11.11; 1.1.12).
After all the years of struggle to demarcate the previous forest boundaries and to obtain
the village land certificate, village leaders were understandably hesitant to repeat this
exercise. Fear existed among village leaders and ordinary villagers that dividing the
forest would take many years again, which would mean a continuation of restricted
access and no revenues from the valuable resources.
Because we said, if we start this issue of boundaries, it will be big activities. Because even to get the land certificate, for every village it will take maybe 5 years to get it. So we said we leave this, on the map it belongs to Mihumo but when it comes to any money from the forest we share all together. Because to divide would be a big task. And if you look at the area, one village would suffer. If you look at Mihumo, its area is very small. A big area has been taken by Darajani. So we said lets do it together. Let's not create problems So this is how it goes. (M Interview 11)
There is one border for the forest area and the wealth in the forest. We leave it this way. The income will be split half and half. To talk about (the borders) is easy, but the implementation is work. It can happen that even after 5 years the implementation hasn't been done. You can't do it in one day (M Interview 21).
6.2.5 Participatory land use planning under REDD+ In 2009 villagers of Mihumo/Darajani were introduced to the possibility of selling
forest carbon for their efforts to protect the forest. In the course of Dr. Mustalahti’s
research project participatory village land use planning was conducted to confirm forest
and other land use boundaries and to assess different options for livelihood
diversification. Through the facilitation of participatory land use mapping, which was
carried out in 2009, and of participatory forest carbon assessments in 2009 and 2012 the
prospect of forest-carbon money in addition to timber revenues got a lot of attention by
villagers (Sundström, 2010; Mukama, 2010; Mukama et al., 2011).
Further support for demonstrating REDD+ in Angai was acquired from the National
Forestry and Beekeeping Division, Liwale District council, the Clinton Climate

181
Initiative, the International Union for the Conservation of Nature and other
research/University partners. Among the most involved partners was The Clinton
Climate Initiative, which selected the Angai forest from a pool of 70 potential sites to
support community-based forest management linked with REDD+ based carbon
payments and FSC timber harvesting (CCI, 2011). A feasibility study was
commissioned to assess the potential of the Angai area to become a community REDD+
project site. The company who conducted the assessment, Camco Advisory Services (T)
Ltd, concluded in their draft report to CCI:
Given the above findings on the carbon stocks and existing institution set-up including template benefit sharing schemes in the area, the AVLFR provides a unique opportunity for the government as a site that can easily and cost effectively be developed and show cased as a REDD-Plus demonstration project Therefore it is recommended that a pilot project be established at Angai with funding sourced through REDD Readiness funds, the Government of Norway, the UN-REDD process and the World Bank Forest Carbon Partnership Facility. In addition, the Villages will need to be assisted to develop village land use management plans in order to enhance sustainable management of land and forest (Camco, 2009, p. 6).
In 2010 the Clinton Climate Initiative commissioned the NGO Mpingo Conservation &
Development Initiative to support the CBFM and REDD+ process in Liwale. They were
contracted to offer their expertise and resources regarding the redrafting and finalisation
of the previously created forest management plans and bylaws. With their help new
forest management plans and bylaws were drafted for 13 villages by the end of 2010.
Although villagers were informed in 2008 to divide their village land, this significant
rupture did not feature in some researchers’ accounts of the opportunities and
challenges of REDD+ activities in Mihumo/Darajani (Mukama, 2010; Sundström,
2010; Bolin 2010). Only Taku-Tassa (2010) mentioned in a footnote that “Mihumo in
this study refers to Mihumo village and the newly established Darajani village. Villages
have the ‘legal’ rights to split up when the number of households reaches or exceed 250.
Some observers attribute the splitting up of villages to political manipulation by some
political elites.” By ‘manipulation by some political elites’ he probably refers to the
above-described objective of increasing votes for the CCM party through changing
village boundaries.

182
Also in the feasibility assessment conducted by Camco Advisory Services there was no
mentioning of the village division and new village boundaries (Camco, 2009). In the
forest management plans created by Mpingo the village division was mentioned but the
NGO stated that both villages are still based on the village land certificate of Mihumo
and that in future the management plan and bylaws will be utilised for both villages. All
in all it appears as if there was confusion and a clear miscommunication between
development actors, researchers, district officials and villagers over the origins and
consequences of the village divisions.
6.2.6 A new wave of territorialisation under LIMAS Because the management plans and bylaws created by Mpingo did not consider the
division of the villages as instructed by the District, they were criticised and practically
ignored by the district council and LIMAS (Lindi and Mtwara Agribusiness Support;
the new development programme financed by Government of Tanzania and
Government of Finland from 2010 to 2014). The plans were further criticised for being
too simple and without clear scientific calculations based on forest inventory or land use
data (Mustalahti et al, forthcoming).
While the District Council informed the villages in 2008 about the need to divide
villages, only three to four years later did district officials communicate to village
council members of Mihumo/Darajani the need to resurvey village lands to obtain new
land certificates. The district did not organise the meetings to inform village leaders
independently but they were facilitated by the LIMAS programme.
All these plans were unknown to the vast majority of the villagers in Mihumo/Darajani.
It was only in a workshop in the village on 15 December 2011 that council members
were informed about the need to resurvey the village lands and to demarcate the new
boundaries. Many ordinary villagers remained uninformed about this new development
long into the year 2012. Some continued to hold onto the idea of jointly owning the
forest area, some thought the best is to put new boundaries but cooperate in managing
the forest and others proposed to hold a village assembly to obtain the opinions of the
villagers before doing anything. This uncertainty lingered in the village until the 31
March 2012, the day when the DNRO, the district land use officer and a staff member
of a GIS company arrived to hold a village council meeting. In this council meeting,
some villagers tried again to question the whole idea of dividing the forest but the

183
DNRO made it clear, once and for all, that each village requires its own boundaries,
including the ones that go through the forest, and each village will have its own village
government, committees and assembly.
6.3 Establishing CBFM/REDD+ in Ruhoma 6.3.1 Territorialising Ruhoma village land In Lindi rural district formal boundary demarcations of all villages was carried out in
the year 2007. However, at that time REDD+ ideas had not yet been introduced and
there were no serious conflicts about the exact size and shape of village land. Even the
boundary demarcation was not done in an inclusive and very participatory way. It was
at times carried out sluggishly or without the consultation of all affected parties (R
Interview 39; R Interview 40). District officials told me at that time villagers did not
know the value of land, therefore they did not care much about formal boundaries. Still
the staff from the district in cooperation with the National Ministry of Land recorded all
village land boundaries and issued village land certificates for all the villages.
So what they did. After they attended the seminar on how to lay the beacons, every village decided to lay the beacon without consulting the neighbouring village. This was a programme for the ministry. People from Dar es Salaam came to do this exercise. When you go to lay the beacon, you must agree with your neighbouring village (R Interview 40)
… sometimes they were agreeing to make the exercise go through. As I told you, you find that from the village centre up to where the beacon should be like, it is very far. So when the person facilitating the exercise, tell the people so carry the beacon we are going to look for the point to lay this beacon, they will walk maybe for three hours. Then they are tired. So they just tell him, because he doesn't know, the point is here. So that man lays the beacons, takes the coordinates then he is gone to use them (R Interview 39).
But with the advent of forest decentralisation and the prospects of forest carbon money,
boundaries became the subject of serious contestation. Territorial claims moved to the
centre of inter-community conflict. Villages started to fight over parts of forests, each
striving to increase their size and thus potential carbon income. When prior the REDD+
intervention farmers from different villages could move unhindered across areas, this
was no longer possible. With the advent of REDD+ villagers’ livelihood activities,
particularly farming, got tied to their residency. And their residency was tied to their

184
place of settlement. Therefore, moving across areas to open up new farms became more
problematic.
Before REDD there wasn’t any conflict about land. But with REDD and every village to become its land titling, conflicts started (R Interview 3). Actually that is what is bringing all this problems. You know every village is trying to make sure is conserving a very big forest. Even if the people in the village know actually our village size is very small. So they even encroach up to other parts of other villages. If you tell them that this is not part of your village, this is where the quarrel begins. Because they want to conserve an area as big as possible to get more money. But if you tell them, look here your boundary ends here. They say no, up to there is our boundary (R Interview 39). Yes many boundaries have changed due to REDD. Because people did not understand the value of land. Also the forest was just there but they did not know how to benefit from the forest. People did not know where their village ended. They just farmed. He didn't know whether he farmed in his village or in another village. So then we educated on the importance and value of land. As a consequence they started to defend their land and resources. They want to defend their claims to forestland not just for carbon but for other forest products too. So it is true that REDD brought this challenge (R Interview 48).
In Ruhoma one specific area has been the subject of fierce confrontation among
villagers. Kikumbi is a sub-village of Milola Magharibi, a village, which officially split
from Milola B in 2009 (LUP Milola Magharibi 2012). This new village Milola
Magharibi borders Ruhoma to the West as illustrated in the map27 below.
27 Unfortunately I do not know the scale of the map. The North point and the new borderline (red) are my own personal additions based on information from the Land Use Plans of Milola Magharibi.

185
Figure 6.1 Map of Ruhoma and surrounding villages Source: Lindi rural district office
Residents of Milola Magharibi’s sub-village Kikumbi live in the Northeastern part of
the village, as shown on the map in Appendix VII, on their farms near or close to the
Noto forest, which spans across several villages including Ruhoma. Before REDD+ was
launched, Kikumbi farmers crossed the border into the areas of Ruhoma, Mkumbamosi
and Muungano often without knowing it, to clear forestland for agricultural production.
Ruhoma citizens knew about the farmers but they did not mind and thus abstained from
voicing any concerns.
Since REDD+ was introduced and with it the agreement to protect the Noto forest on
village lands, the situation has changed dramatically. Ruhoma villagers (foremost the
elders and some village council members) in collaboration with district officials and
NGO staff have met several times with community representatives from the
neighbouring villages to resolve border conflicts. During the land use planning
exercises the village boundaries were discussed and confirmed with all the neighbouring
villages but conflicts over the boundaries with Milola Magharibi and Nangaro
remained. There have been several subsequent meetings between village leaders and
project staff where village boundaries were debated. Officially an agreement has been
reached, whereby some Ruhoma villagers claim that their negotiators were not strong
MILOLA MAGHARIBI
N

186
enough so that their village has lost some of its area to Milola Magharibi and Nangaro.
But Ruhoma and Milola there are still conflicts in the place of Kikumbi. But the goal of REDD is that all the REDD villages should not have any boundary disputes. We got the opportunity to take the elders from the different villages. We go to every beacon and explain to them, from this beacon to the next one, what do you say. Once they agreed we give them a form about I agree to this boundary. And they fill it and we go to another beacon to do the same. They filled the forms and we have their signatures. But still disputes emerge. Because of a lack of understanding (R Interview 42). And the ones that went have been 'swallowed'/beaten by the people from the neighbouring village. Here it was seen that they lost some strength and the others won. But the law from the past was different. They were given some land but this wasn't the law from the past (R Interview 10)
Despite the official agreement, which was confirmed in a letter signed by parties from
all villages, some residents of Milola Magharibi resisted the decision, which they see as
invalid. Especially the farmers in Kikumbi argue that the place where they farm
rightfully belongs to them. Their argument goes as follows.
When villagization was carried out in the 1970s, they were forcefully removed from
their homesteads that were located there, an area now shared by Milola Magharibi and
Ruhoma village. At the time of the eviction, they relocated to Milola village where they
lived and farmed for three decades. In recent years, the increasing scarcity of available
land in this village encouraged them to look for new places and so they decided to
return to their original home in the forest. Residents of Ruhoma village tolerated their
presence and their practice of agriculture during all the years until REDD+ began.
Because of the prospect of money from forest carbon, residents of Ruhoma have started
to emphasise the agreed-upon boundaries to argue for the removal of the ‘illegal
squatters’. To make their voices heard, they have started to explore different options to
move them and with them their farms. Members of the VNRC together with villagers
tried to chase the farmers away from their fields, but they were confronted with
resistance and threats of violence. Consequently, some Ruhoma villagers see
themselves unable to resolve the conflicts and therefore they call for assistance from the
district or police in their attempts to displace the Kikumbi farmers.

187
They met there from the different villages. Elders from Ruhoma and Milola, Namila and others. But there is a sub-village that ends in our area. There are some problems. They farm but still experts say we must use the law. The WEO was informed and explained to them no to return there (R Interview 3).
We don't have the power. If you want to chase them away, you need to use the force of police. It is needed that the police comes to displace them. First they damage the forest, because this year they farm here. Next year there. Then there. They damage our forest. But we can't displace them. Maybe the district commissioner, or the land officer (R Interview 13).
Hence, it emerges that the territorialisation process under REDD+ has resulted in
conflicts between villages and villagers over the rightful owners of forestland. While in
the past most forests were considered to be open access and villagers could move
unhindered between villages, this is no longer the case. Aside from Ruhoma many more
villages were affected. Between the villages Muungano and Milola Magharibi serious
conflicts over a parcel of about 50 ha land broke out after REDD was introduced. Their
story even made it into the newspaper as Yankami (2013) reported in The Guardian
(Tanzania) that villagers of Muungano and Milola Magharibi threatened to fight each
other over the benefits of REDD+ money from disputed forestland.
6.3.2 Territorialising forestland In order to establish community-based forest management in Ruhoma, the boundaries of
the protected forest had to be demarcated and village land use plans established. Despite
the fact that village land had been surveyed and legally recognised in 2007, no land use
plan was in place in Ruhoma prior to the REDD+ intervention. After the village
assembly had officially accepted and launched the REDD+ project, village level
meetings and participatory land use planning were carried out in February/March 2011
with NGO staff, district officials and the village land use committee comprising of
‘community representatives’, who were all residents elected from every sub-village and
two village council members. Over a six-day period a workshop was held in March
2011 in the village where a village land use plan was drafted and visualised in a
provisional land use map (Appendix VIII). This land use map was then taken to a
village assembly for approval.

188
During the process of establishing the forest reserve, villagers first set aside a smaller
size of their forests to prevent losing valuable land for agricultural cultivation or for the
use of forestry products. They were afraid of ‘selling off’ a large part of the forest to the
NGO and ‘their’ European financiers (R Interview 48; R Interview 19). Despite the
monetary incentives for forest protection and trust building exercises by project staff,
villagers remained clearly sceptical in the beginning. Many of them feared that their
forest could be taken over by the state or foreign donors.
They set aside a small area, because still they were afraid. They doubted whether the protected forest area is theirs. Some people did not trust/believe if the forest was theirs. So they thought that in order to not lose out on agricultural land, they set aside a small forest area […] Because many of the villagers are farmers, and their farming is shifting cultivation, they were afraid of protecting the whole forest area. They thought better to keep much forest outside, so that they can come and open up new farms there. Better to leave much forest outside of the reserve, so that we can continue to shift every day (R Interview 48). The ones who refused in the beginning were afraid, that later we would be chased away from the forest. You must go, you sold the forest. You must go to the neighbouring village. This is the problem. The only problem. Later we will be displaced (R Interview 19).
Large areas of the forests were thus left outside the reserve, much to the discontent of
the project staff, who, after a few months, embarked on a further education and
awareness raising campaign to convince the villagers to increase the protected forest
area. Their message was clear: The more you protect, the more carbon money you will
receive. With so little forest under protection, the project might not have gone ahead.
After drawing the map, we saw that a lot of the forest is outside the reserve. The time when you go to the forest, then you can't know how much is outside. But once you draw the map, then you see. There is a lot of forest outside. So we need to return. It seems that they haven't got enough knowledge yet, still they leave much outside. We need to go back and educate them further, to make them understand the loss of leaving much area outside the reserve. When we returned we explained that if you leave much forest outside, then you will clear the forest on that land, and you will struggle to reduce emissions. And you will lose out of income from REDD. Because the REDD project wants you to reduce the amount of cleared land (R Interview 48).

189
Villagers’ fears around deprivation of high agricultural incomes and forest products
were mitigated by ensuring continued access for subsistence needs and initiatives to
change their practices away from shifting cultivation to more productive permanent
farming, particularly in the form of conservation agriculture. Villagers were also told
that this agreement is only for the next five years. After this period they can either
continue protecting the forest or cease to do so. With regard to the size of the
agricultural area many villagers understood that its size could be enlarged in future if
the need arises.
They told us to give them reasons why we want to leave it out. So we gave them some reasons (go there to take things). If these are the reasons, they said, then you can protect it because you can continue doing this in the protected forest (R Interview 31). So we said that they should not be afraid, because they will be trained on farming. The farmer can stay on one plot and can increase his output. He can get more compared to shifting cultivation. They will be trained on farming, will increase their output, the forest will be protected and they receive money from REDD (R Interview 48). Yes, when they came the first time. They said let us protect the forest. We agreed. They put the marks. When they came the second time they said this part has been already protected. But now, if you harvest a lot you farm a big area. If it is possible, then increase the size of the forest to get more money. If the forest is big, the protected area big, then also we get a bigger share. More money. So people agreed. They move the marks on the trees (R Interview 15).
In contrast to the situation in Mihumo/Darajani, the villagers in Ruhoma faced a very
difficult decision with regard to the size of the village land forest reserve. They had to
strike the best balance between various land uses when demarcating the forest reserve.
On the one hand enough area for future agricultural expansion had to be secured, while
on the other hand the forest reserve had to be large enough to bring in a considerable
amount of carbon money. Villagers and development actors tried to resolve this conflict
through participatory land use planning and democratic decision-making in order to
foster on the ground ‘legitimacy’. In village assemblies the size and location of the
forest reserve were debated for many hours until a majority could be reached in favour
of an extension. Villagers agreed on the expansion of the forest reserve, which then
encompassed 88% of the total forest area. However, a majority does not include
everyone. There were some villagers who continued to feel unhappy about this decision.

190
They argued that the extension of the reserve into the secondary forests, or what they
called jangwa referring to regrown woodlands and bush on formerly used agricultural
land, was unnecessary and against what they had agreed when accepting the project.
Even here, it was a jangwa, but they also took it. Meetings are being held and we complain but they don't hear us. They listen to themselves. But they don't like our voices. All of Noto [refers to closed forest] we gave them. The others we wanted to do our thing. But they don't understand us, and they don't hear us (R Interview 28).
Most residents of Ruhoma supported the decision to extend the forest reserve also long
after the village assembly took place. The general opinion was that there still exists a lot
of forestland, which will be enough for their livelihood needs also for the next 20 years
or more.
Lot of agricultural land available for people in Ruhoma. For the next 10 to 20 years there won’t be any problems with farming also when we continue to have more and more children. Agricultural area is very big (R Interview 3). We are not many people but we have a lot of land. But we don’t use it wholly. We farm here, we leave, we farm there. And despite protecting the forest much land remains available (R Interview 6).
6.3.3 Decentralisation continues During the 6 days workshop in March 2011 participants did not only draft a village land
use plan but also bylaws for the management of the forest. One month later, on 25 April
2011, a draft forest management plan for Ruhoma village was ready. These bylaws and
the forest management plan were revised according to decisions and agreements made
in subsequent village and council meetings. Nevertheless, because of the ongoing
conflicts over the village and forest boundaries, project staff could not submit them to
the district for approval.
The by-laws haven't been passed because of the border conflicts. The boundaries that are on the map of the village. the village was surveyed in 2007. If the forest area followed the boundary of the village land that was surveyed in 2007, it would be easy to pass the land use plan. But because the border changed, it is required to draw another map to show the new boundaries on which the villages agreed upon. They must be passed by the land officer and then the by-laws can be approved. Because the by-laws regulate

191
the protected forest in a village area. But if the village area has conflicts that are yet unresolved, then the by-laws can't work (R Interview 48)
Despite the agreements between village leaders from Ruhoma and Milola Magharibi
over the location of the village boundaries, the district land officer holds onto the
boundaries surveyed in 2007 as they represent the legal boundaries as stated in the
village land certificates. He insists that new boundaries cannot just be agreed upon in
words but they need to be resurveyed by government officials. Then new village land
certificates can be applied for and reissued by the Ministry of Land. In holding onto the
importance of the legal process in changing boundaries, it seems he also wants to give
villagers a lesson about the seriousness of legal activities – such as boundary
demarcation – and the consequences of their actions.
… once a boundary is surveyed whether you don't agree with it or you agree with it that becomes the legal boundary until it is changed legally. And the change should involve the nullification of the existing boundaries and resurveying this one. So we don't change boundaries by words. We change by the legal process. So I use to tell them so. Because it is not me who made the mistakes. It is you villagers who did not see the importance of that exercise and you messed it up so you must bear its consequences. So when the next comes when you are involved in some society matters you become serious. Because the land is not yours it is still in Tanzania. If it goes to the next village it is still Tanzania. And by the way there is no boundary of the use of land. I am living in Ruhoma but I have been cultivating in Milola. This is not a big deal. This is what I have been telling you.
In addition, for efficiency considerations the project staff decided to collect as many
forest management plans and bylaws as possible from several villages first in order to
submit all of them at once. This was seen as better than submitting them one by one. As
a result during my entire fieldwork period the plans and laws had been kept at the
TFCG/Mjumita office and the district council without having been approved. Shortly
before I left Ruhoma at the end of June 2012, the district’s natural resource officer, who
is also the main local REDD+ person, explained to me that the forest management plans
and bylaws …
… are almost finished. What I was lacking here was some attachment which I am told is with the district lawyer. But the district lawyer has been transferred to Dar es Salaam recently and he did not hand over most of the documents. So what I am

192
planning in the next few days is to collect the attachment... So I just told those people in the project that we need to meet on Saturday so that we summarize all the documents. Then the coming meeting we sent them... Or even the management plans have to follow the same channel to be approved by the councillors. They are good. These management plans, the channels somehow different. After being approved by the councillors they are going to be implemented directly. But with regard to land use, they have to be approved by the ministry. The by-laws, if they have been approved by the district, then they can be approved by the district. But the by-laws of land use and even the land use plan itself have to be sent to the ministry (R Interview 42)
6.4. Conclusion In this chapter I analysed the politics underlying territorialisation processes in both
villages, which are necessary to establish community based forest management as the
governance framework for REDD+ initiatives. The findings of this chapter primarily
serve to answer research question 2 “How do REDD+ initiatives interact with local
forest governance in Lindi, Tanzania?” In tracing the history of decentralising forest
management and territorializing village land forest reserves in the two villages, I could
provide important insights into the technically complex and politically contested nature
of formalising ownership and authority over village land and forests.
As forestland is valuable to various local stakeholders, not only for its economic
benefits, but also as a political leverage in struggles over power, transfer of access and
ownership can be a cumbersome and long-lasting endeavour (cf. Sikor and Lund, 2009).
Struggles between villages or between the village and local district council over land,
natural resources and people considerably shaped the design and outcome of
territorialisation in Lindi, Tanzania. This neatly illustrates how the commodification of
forest carbon is embedded in local politics and power struggles that go beyond the
domain of natural resource benefits. Especially the experience in Mihumo/Darajani
highlights that contestations over land, and for that matter forests, are as much about
politics and power struggles over natural resources as they are about the governance of
people (represented by struggles over votes in our case) (cf. Hickey, 2008). From our
experience in Mihumo/Darajani the state capacity and political will of the Liwale
district council to empower local villagers to benefit from forest resources must be
thoroughly questioned (cf. Sundström, 2010).

193
From this chapter the limitations of local participation and citizenship became also
apparent (cf. Hickey and Mohan, 2005). Despite their continuous inclusion in
development activities, villagers’ possibilities to shape the process have been minimal.
Because of the highly technical nature of the process, they have always been dependent
on the knowledge and capacity of external actors – state, companies, researchers, NGOs
and donor agencies – to take the reform forward. Yet, this has repeatedly not happened
in Mihumo/Darajani (cf. Sundström, 2010). In contrast, due to the instruction of the
District to divide village lands, the villagers were, rather involuntarily, taken back to the
beginning of the decentralisation process. Miscommunication, confusion and hidden
politics accompanied the district’s decision to divide village lands in all Angai villages.
REDD+ initiatives, which introduced the promise of carbon payments to villages, added
another layer to disputes over forests. In transforming open-access forests to communal
property, a new understanding of boundaries, community and property is being created,
which changes the relations between people and forests, as well as between people
themselves. The seemingly technical activities, concerning the formalisation of village
and forest boundaries and participatory land use planning, are in fact inherently political
– they shape who gets to access what (cf. Berry, 2009). This was clearly visible in the
conflicts between Mihumo/Darajani and the local district council. But it was also
evident in Ruhoma where I could observe increasing conflicts over boundaries between
villages. I further saw villagers, who began to contest and threaten formerly tolerated
forest users by suddenly questioning their customary rights of access to forestland.
At the same time the technical activities of REDD+ in the villages resulted in positive
change including much attention and international efforts to take the decentralisation
process forward and to change the balance of power over natural resource governance.
They have assisted both villages to express their claims over the authority of village and
forestland. In the case of Mihumo/Darajani they did so in opposition to local district
interests, which were intent to prevent formal loss of power and control. In supporting
participatory land use planning exercises they helped to address boundary conflicts and
to organise village land according to different land uses. Although much more efforts
and political will are required to meet villagers’ development needs, the focus of
REDD+ on community based forest management has undoubtedly the potential to
contribute positively to the empowerment of local communities. In the next chapter I
will examine how villagers practiced community-based forest management institutions

194
and what this could mean to the development of the village and their forests.

195
Chapter 7: Practicing community-based forest management 7.1 Introduction This chapter examines how villagers put community based forest management
institutions into actual practice. It therefore contributes to answering research question
2: How do REDD+ initiatives interact with local forest governance in Lindi, Tanzania?”
It is structured as follows.
I first outline in detail the envisaged rules and regulations for the two village land forest
reserves by analysing the draft forest management plans and bylaws. I will discuss how
these institutions envisage the forest reserve to be governed: who holds which
responsibilities?; what is allowed in the reserve?; what is not allowed?; how is non
compliance punished? These are the questions I address in the first section.
Thereafter, I will present findings from my ethnographic fieldwork in the two villages
to discuss the actual performance of the community based forest management
institutions. On the basis of participant observation, interviewing and household surveys
I will highlight the convergences and divergences between the formal institutions and
their practices by villagers on the ground. In comparing the different performances of
very similar institutions in two village settings, I aim to highlight the challenges
villagers face in implementing community based forest management and the role of
REDD+ in mitigating these challenges.
7.2 Community-based forest management institutions 7.2.1 Forest management plans and bylaws The drafted forest management plans and bylaws for Mihumo/Darajani28 and Ruhoma
served to describe the proposed governance framework of the village land forest
reserves in the two villages. In both cases the documents present community based
forest management as the institutional framework that should achieve the dual objective
of sustainable forest management and community development. The documents contain
in detail the rules and regulations for managing the village land forest reserves, thereby
28
In Mihumo/Darajani the forest management plans and bylaws that were drafted by Mpingo Conservation and Development Initiative will be replaced with new documents under the LIMAS programme. However, in the past and during my time of research they remained the latest written artefact of many consultations between development actors and villagers about the way the forest should be managed. Thus they remained the basis to which actual practices can be compared with.

196
illustrating the donor’s objective of empowering local communities with the
management of their own resources. It is envisaged that in following these forest
management plans and bylaws villagers should succeed in protecting their forests,
which, in turn, would enable them to access forest carbon payments. In analysing the
information provided in the draft forest management plans and bylaws, despite the fact
that at the time of my research they were yet to be officially approved, we are in a good
situation to understand the envisaged institutions at the community level and how they
ought to function.
In both villages the management plans and bylaws distinguish between allowed and
prohibited uses of the forests, and uses for subsistence needs and for income generating
purposes. They also define ‘the community’ as all residents of the village, making
people from other areas outsiders. This is already a significant change as forests in
Mihumo/Darajani and Ruhoma were long considered to be open access. Farmers from
different villages could establish farms in forests based on customary rules of
governance. Yet this consequently becomes problematic as they are now considered
outsiders with fewer rights than residents.
7.2.2 Permitted uses of the forest We learn from the management plans and bylaws that residents of the villages may
freely conduct all activities that do not harm the forest. However, this does not mean
that they can just go and do these activities. Foreseen in the new institutional framework
of community based forest management is the formalisation of (almost) every activity
in the forest reserve. This is achieved through the issuing of permits. In Ruhoma, for
instance, residents need a permit for every activity that they want to conduct in the
forest reserve. In Mihumo/Darajani residents need a permit for everything except
holding a ritual, fetching water for subsistence use and walking on given paths to reach
other areas in the reserve. Non-residents need to pay fees for most of the activities in
addition to obtaining a permit. Therefore, the formalisation results in a clear distinction
and cost-benefit distribution between residents and non-residents, whereby the latter
faces financial barriers to forest access.
Permits are issued either for free or with payment. The forest management plans explain
that permits are issued with the objective of controlling resource extraction from the
forest. So even though villagers were not required to pay for every permit, the forest

197
management plans required villagers to request permits for almost every activity in
order for the village natural resource committee to control and monitor extraction rates
of forest resources. This should contribute to the sustainable use of forest products.
Among the activities that are free is the collection of non-timber forest products such as
traditional medicine, firewood, wild fruits and vegetables, mushrooms, honey, roots,
stones, grass, etc. In both villages residents are allowed to collect non-timber forest
products for subsistence and commercial use, whereby tax may apply for the latter.
Development actors hope that through this formalisation long-term sustainable
harvesting rates will be achieved.
Permits should also be issued for timber forest products such as logs and construction
poles. However, these resources cannot be harvested freely, neither by residents nor by
non-residents. Villagers from both areas need to pay to obtain a permit from the village
natural resource committee. In Ruhoma regulated amounts of timber forest products
may only be harvested for subsistence use or community development projects such as
construction of schools, hospitals, market place, etc. Residents of Ruhoma are required
to pay 20,000 TShs (13 USD) to obtain a permit for 2 months that allows them to
harvest up to 50 planks and 70 beams for subsistence use. In addition to the 20,000
TShs (13 USD) they must pay 200 TShs (0.13 USD) tax for every plank. No one in the
village is allowed to harvest timber products and sell them.
This is different to Mihumo/Darajani, where villagers may harvest timber also for
commercial use. Before any harvesting can take place, however, there must be a
participatory forest resource assessment to determine the permitted harvesting rates. The
rates and type of trees should be decided upon on the basis of guidelines from the
forestry and beekeeping division of the Tanzanian government. Unfortunately, from the
latest draft forest management plans and village bylaws I could not find any concrete
procedures or criteria for determining the harvesting rates in this village.
Differences between the two villages also exist with regard to the hunting of wildlife
and utilising the forest for educational/knowledge purposes. In Ruhoma no hunting is
allowed in the village forest reserve. In Mihumo/Darajani residents may hunt certain
animals after having obtained a permit from the village natural resource committee. Yet
the technique is also of importance. Using snares to trap animals, for instance, is
prohibited in both villages. With regard to utilising the forest for educational and

198
knowledge purposes, activities such as tourism, research and study tours require permits
in both villages. The amount non-residents need to pay differs substantially between the
two villages. In Ruhoma Tanzanian citizens and foreign citizens pay 5,000 TShs (3
USD) and 7,500 TShs (5 USD) per day respectively if they want to conduct research. In
Mihumo/Darajani the same activity would cost between 45,000 TShs (28 USD) and
100,000 TShs (63 USD) for Tanzanians and foreign citizens respectively. In both
villages the forest management plans and bylaws exclude people who contributed to
drafting the institutions from taxes or fees. This saves development actors from having
to pay fees or taxes when entering the village land forest reserves.
7.2.3 Prohibited uses of the forest The formalisation of use and access rights through the issuing of permits aims to
prevent unwanted activities in the reserve. A number of activities are prohibited, these
include farming in the forest, collecting fresh cut firewood, harvesting wild beehives,
trapping wildlife, digging minerals, soil and stones for business, harvesting in the area
set aside for rituals, herding livestock, settlement, harvesting trees that are not cleared
for harvesting, starting fires, and charcoal production. In Ruhoma it is strictly prohibited
to harvest timber for commercial purposes. In Mihumo/Darajani residents may not
harvest any timber at the moment since no harvesting plans have been prepared and
approved by the Liwale District Council.
People who misuse their powers by acting outside their rights and responsibilities are to
be treated as criminals who face legal prosecution. In the first instance the power of
prosecution lies with the village natural resource committee, which should try to settle
the offence in the village. In the case of any challenges, assistance from the village
council, ward or district level may be requested. In the last instance disputes can be
taken to court. In Ruhoma a detailed list exists, stating the fines for criminal offence,
including the following; being found in the protected forest without any permit, carries
a fine 2,000 TShs (1.3 USD); setting fire inside the forest will be penalised with 50,000
TShs (32 USD) or 6 months imprisonment; furthermore to farm, log timber, harvest
forest products without permit, or produce charcoal would cost any offender 50,000
TShs (32 USD). In Mihumo/Darajani prohibited activities are generally penalised with a
fine of 50,000 TShs (32 USD). If people enter the forest to conduct legal activities
without having obtained a permit first they will be fined with 10,000 TShs (6 USD).

199
7.2.4 Rights and responsibilities of stakeholders We learnt from the previous section that the new envisaged community based forest
management institutions aim to formalise the use and access of resources within the
village land forest reserve. As we know, institutions fundamentally depict the relations
among social actors; subsequently the process of institutionalisation changes the power
of different village groups. This new distribution of power is described in the forest
management plans and bylaws. The documents clearly outline the rights and
responsibilities of different village groups. In the following text I will discuss how it is
envisaged various village groups would be affected by the implementation of
community based forest management in the villages.
The village council would gain a significant degree of power, as it becomes the main
manager of the village land forest reserve. Its role should be to prepare forest
management plans and bylaws to determine how the forest reserve should be used and
managed. The council should control and debate the income and expenses of the forest
before they are reported to the villagers for further discussions. At the village
assemblies any damage, conflicts or changes in the forest should also be communicated
and discussed with the citizens. The council must work closely with the village natural
resource committee and approve all permits issued by them. In case criminal offences
occur they must be prosecuted. If conflicts arise that cannot be solved the village
council must collaborate with the district council to obtain assistance.
The village natural resource committee is the other central village institution that gains
power as the committee is responsible for coordinating all forest activities related to
protection, harvesting, improvement, assessments, education, record keeping and
reporting. Its role is to conduct forest resource assessments and to draft management
plans, harvesting plans and bylaws with the village council. It should meet each month
to discuss requests for permits and issues them on the basis of the management plan and
bylaws. Subsequently it needs to make sure permit holders adhere to the rules and
conditions. The village natural resource committee must ensure the protection of the
forest reserve by organising patrols, educating villagers on the importance of forest
protection and carrying out management activities such as preventing fire from entering
the reserve and maintaining forest boundary demarcations. It needs to prepare annual
forest activity plans and report monthly to the village council about the state of the
forest as well as income and expenses.

200
While the village natural resource committee of Mihumo/Darajani has the responsibility
of organising and conducting patrols to ensure the protection of the forest, a specific
patrol team was established in this village consisting of one patrol leader and six patrol
team members from the village natural resource committee. Every two weeks a patrol
should be carried out and there has to be at least one member of the village natural
resource committee and one ordinary citizen. It is envisaged that this would facilitate
accountability and better control of patrolling activities.
With the introduction of the potential sale of forest-carbon credits in the two villages, a
committee of people was established whose members participated in forest inventories,
specifically forest-carbon assessments, to determine the resource base in the forest
reserves. For the communities to access international forest-carbon markets they must
apply approved ways for measuring, reporting and verification of forest-related
emissions. Alongside technologically sophisticated systems at the national level,
development actors promote participatory forest carbon assessments to obtain local
forest inventories including forest-carbon stocks and changes. Based on the collected
inventories forest managements and harvesting plans should be developed.
Parallel to this group, a special REDD+ payments distribution committee was founded
in Ruhoma. A group of 12 people, half male and half female, were selected by sub-
village chairmen and other village leaders to manage the distribution of forest-carbon
payments among the villagers. Among the members are representatives from the village
council, village natural resource committee, land use planning committee and the wider
village community.
Community based forest management centres on the empowerment of local actors,
subsequently ordinary villagers are required to participate in the protection of the forest.
They are obliged to prevent and report any harmful activity to the village natural
resource committee and/or village council. In this way they would assist the patrol team
and the village natural resource committee to detect criminal offences to make sure all
villagers adhere to the law. Furthermore, citizens have an important role in controlling
the powers of village institutions through participating in village assemblies,
legitimizing village leaders through democratic elections and holding them accountable
for their actions.

201
The District council loses power over forest governance but it maintains the right to
receive regular reports about the state and management of the forest. It is also entitled to
inspect the income and expenses of the reserve. In case the reserve is not managed
according to the management plan and bylaws the district may intervene and take over
the management, thereby releasing the village from this responsibility. The District
council is further required to assist the village in the protection of the reserve in
providing knowledge and education, in finding markets for forest products and in
contributing to solving conflicts.
From the management plans and bylaws we also learn about the responsibilities of the
NGOs that assist villages in the protection of the forest. They are required to assist them
in finding markets for forest products, educating community members about good
governance and forest protection, facilitating assessments and providing assistance with
the management strategies.
7.3 Community based forest management in practice After outlining in detail the envisaged institutions that should govern the village land
forest reserves in the two villages, I will now proceed to discuss how villagers
themselves understood and performed community based forest management in practice.
I will begin by presenting the opinions and knowledge villagers have of the rules and
regulations that were drafted between ‘village representatives’ and development actors.
This is then followed by a discussion of the actual practices observed during my
fieldwork period.
7.3.1 Knowing and owning institutions 7.3.1.1 Forest management plans and bylaws The forest management plans and bylaws were drafted in a participatory manner with
village representatives and members of the village natural resource committee, with the
view that this would lead to better outcomes and effectiveness, since villagers are more
likely to adhere to new rules and regulations if they themselves created them (Ostrom,
1990). In this section I present findings that question how aware residents in both
villages were of the institutions. This will give us a better understanding of the everyday
practices of villagers that I will discuss in the next section.

202
During my fieldwork experience I observed that the ordinary villager has never studied
the forest management plan or bylaws to make him/ herself conversant with the new
community based forest management institutions. In fact, most of the people in the
villages have never seen these documents, and with them the whole breadth of rules and
regulations. Because of low literacy rates villagers heavily depend on oral
communication. Thus the new institutions geared to shape power relations in the village
were primarily communicated through village meetings, workshops and informal
conversations with development actors and each other. Unsurprisingly, in this process
the information is transformed and villagers create a new understanding of how the
forest should be managed.
In Mihumo/Darajani even members of the village natural resource committee were not
familiar with forest management plans and bylaws. For instance, the chairman of the
committee saw the details of community based forest management for the very first
time when I met with him to discuss them. Other members told me that they had either
never heard of bylaws or that the previous committees had prepared them and taken
them to the committee secretary and District council. Therefore they never got a chance
to fully understand them. Some were unsure of whether they had been written down at
all or if only verbal agreements existed.
In Ruhoma the situation looked more positive. A copy of the draft forest management
plan and bylaws were available in the office and the village natural resource committee
chairman and secretary could provide me with the relevant information. Yet also in
Ruhoma the ordinary villager did not know where and what to find in these documents.
Similar to people in Mihumo/Darajani they depended on the information provided in
village meetings and many (in)formal conversations between villagers and development
actors to learn about the nature and impact of community based forest management
institutions.
In order to find out how villagers in Mihumo/Darajani and Ruhoma understood their
role with regard to the village land forest reserves I asked them the questions “Who is
responsible for taking care of the protected forest” and “Who owns the protected
forest?” The results provided by the respondents are shown below.

203
7.3.1.2 Ownership and authority
Graph 7.1 Villagers’ perceptions of ownership of forest reserve
Who owns the protect ed forest ?
0%
10%
20%
30%
40%
50%
60%
70%
80%
Villagers VNRC Distr ict Gov PrivateOrganisation
National Gov. Europeans Private Person Unknow n
Owner
Perc
en
tag
e o
f co
un
tsRuhoma (n=39) Mihumo/Dar ajani (n= 76)
In both villages the majority of villagers regard themselves as the owners of the
protected forest. In Mihumo/Darajani and Ruhoma 67% and 59% of all respondents,
respectively, held this view. This clearly suggests that villagers see themselves at least
as de jure owners of the village land forest reserves. However, considerable parts of the
respondents claimed that the ownership of the protected forest lies in somebody else’s
hands. This is especially visible in the case of Mihumo/Darajani where 30% and 15% of
the respondents assigned ownership to the village natural resource committee or
Europeans respectively. I cannot say whether these respondents believe that the village
natural resource committee or Europeans have de jure or de facto rights, but this data
connects to findings from participant observation suggesting that due to the important
roles these two groups of people played in the last few years, some ordinary villagers
believe that they are the legal owners of the reserve.
In Ruhoma it is especially interesting to look at the much higher percentage of people,
compared to Mihumo/Darajani, who believe that the ownership lies with a private
organisation such as with TFCG/Mjumita. In both villages 15% or more do not know
the rightful owner of the protected forest. Similar to this are the villager’s opinions on
who is responsible for managing the protected forest.
Graph 7.2 Perceptions of management responsibilities of forest reserve

204
Who is responsible for tak ing care of the protected forest?
0%
10%
20%
30%
40%
50%
60%
70%
80%
Villagers VNRC Distr ictGovernment
PrivateOrganisa tion
Nationa lGovernment
Europeans Private Pe rson Unknow n
Person/Organisation responsible
Pe
rce
nta
ge
of
cou
nts
Ruhoma (n=39) Mihumo/Dar ajani (n= 76)
The large majority see the responsibility in the hands of the villagers and the village
natural resource committee, whereby the latter has a bigger role to play in
Mihumo/Darajani compared to Ruhoma. The fact that so many regard the villagers as
the rightful managers of the reserve is encouraging. It links to a quote from Ruhoma,
which neatly symbolises villagers’ feelings that they are capable of taking ownership
over the protection of their community resources.
There is the forest. If somebody cuts trees there in the forest, I know who was it. I will tell him, no, the forest is protected by us. We know the benefits we derive from the forest. Benefits for the whole community. Because the community things like office and school are very important for the community. It will help us all. If you see somebody cutting trees, you tell him, no, don't cut them. We are protecting this forest (R Interview 26).
Around 10% of the survey respondents believe that the district or non-governmental
agents – the private organisation in Ruhoma and the Europeans in Mihumo/Darajani –
are the managers of the forest. In addition, the same amount of people claimed that they
did not know the answer to the question of who is responsible. When we look at the
degree of participation of villagers in the decision to protect the forest, we get a very
different picture in the two villages.
Graph 7.3 Perceptions of villagers over participation in decision making

205
Did you participate in the decision to protect the forest?
0,00%
10,00%
20,00%
30,00%
40,00%
50,00%
60,00%
70,00%
80,00%
90,00%
100,00%
Yes No I don't know
Ruhoma (n=39) Mihumo/Dar ajani (n= 76)
While in Ruhoma around 75% of the respondents said that they participated in the
decision, almost the same percentage of people in Mihumo/Darajani claimed that they
did not partake. This is puzzling as the decision to protect the forest was made in
general village assemblies in both villages. One reason for this stark difference could be
related to the point of time when the decision to protect the forest was made. In Ruhoma
this was done fairly recently in 2011, only one year prior to my survey. In contrast,
villagers in Mihumo/Darajani decided more than ten years ago to establish a village
land forest reserve. Some of the respondents might have been absent from the village
assembly at that time or perhaps they felt that the decision was made without them.
7.3.1.3 Forest uses In order for community based forest management to succeed villagers must have
knowledge of the different uses that are allowed and not allowed in the forest reserve.
These rules and regulations are comprehensively described in the management plans
and bylaws. Despite the many similarities in the prohibited and permitted forest uses in
the two villages, people had very different understandings of what can be done and what
cannot be done under community based forest management. In short, villagers in
Ruhoma seemed to be much more aware of the meaning of community based forest
management in practice compared to the rural population of Mihumo/Darajani. This
fact is neatly illustrated in the graph below, which shows the responses I received from
villagers when I asked them ‘What is allowed in the protected forest?’

206
Graph 7.4 Perceptions of villagers of forest uses
What is allowed in the protected forest?
0%
10%
20%
30%
40%
50%
60%
70%
80%
Farming Hunting
ani mal s
Harvest
timber forsubsi stence
Collecti ng
fi rew ood
Walk ing Harvesting
timbe r forcommercial
Collecting
medi ci ne
Col lecti ng
honey usingfi re
Collecting
honey w ithoutusing fire
Permitted activity
Perc
en
tag
e o
f cou
nts
Ruhoma (n=39) Mihumo/Dar ajani (n= 76)
From the graph we learn that respondents of Mihumo/Darajani generally viewed the
reserve as a closed-off area, where they had no rights to conduct any activity. With the
exception of collecting honey without using fire, collecting medicine and walking, all
other activities were deemed prohibited by more than 90% of the respondents. These
include crucial livelihood activities such as hunting animals, collecting firewood and
harvesting timber for subsistence use. Despite the fact that the village had formally
obtained legal ownership of the village land and village land forest reserve, most
residents felt that they had no rights to enter the reserve. Instead, so their logic goes,
they must go to the ‘open area’, which is the uncultivated village land outside of the
reserve. There they are allowed to request a permit from the village natural resource
committee to harvest timber to meet subsistence needs.
This understanding of the forest reserve and the open area was primarily cultivated by
some members of the village natural resource committee and village council. Despite
the fact that no forest management plans and bylaws had been approved, some members
of the village natural resource committee took on the role of guarding the forest reserve
and issuing permits to residents for the harvesting of timber in the open area.
Sometimes members of the village council participated in issuing permits and they
received parts of the taxes paid. Two quotes from villagers in Mihumo/Darajani
illustrate the practices of arresting and issuing permits for the open area.

207
We don’t enter there. If you enter the forest then you are being arrested. You can’t enter the protected area. Also we as beekeepers we can’t go there and cut. We would be arrested (M Interview 31)
Yes, there is an area, which is called open area. The village council can give you the permit, for example if you need it for construction. You will be given the permit there. And then you go and lumber. This is in the case of construction. (M Interview 9)
In Ruhoma many more respondents seemed to be aware of their rights regarding the
access and use of the village land forest reserve. The permitted uses – harvesting timber
for subsistence use, collecting firewood, walking, collecting medicine and collecting
honey without fire – were all identified by 65% or more of the respondents. Yet this
also shows that roughly a third of the respondents did not consider these activities as
legal under community based forest management. This could mean that some villagers
will wrongly refrain from conducting them, therefore leaving the benefits to others.
Indeed, the process of formalising community based forest management seems to be
much more fruitful with regard to communicating the activities which villagers are not
allowed to conduct anymore. Setting fire, cutting trees arbitrarily and farming were not
only the three main responses I received whenever I asked villagers to explain to me the
prohibited activities in the forest reserve. The graph above also illustrates how farming,
setting fire and commercial harvesting were deemed illegal by the vast majority of
citizens in both villages.
Villagers can take medicine, firewood and min'goko [tuber root]. But to farm or to set fire is not allowed. They can use timber for construction but not for sale. For our subsistence use it is allowed. You get a permit and you go to the forest to take timber. (R Interview 10)
However, also here we discover incompleteness; from the graph we learn that around
20% of the respondents in Ruhoma thought that it was possible to do commercial timber
harvesting in the reserve. Yet this activity is strictly prohibited in the management plan
and the bylaws. Perhaps the response represents much more of a wish, which several
villagers also expressed to me during discussions about the potential benefits of the
forest reserve to the rural poor.
First, this is their forest and they will see its benefits later. Like trees. For now there is no harvesting there. But trees will be there. And after certain years, the trees will be ready to harvest and the

208
benefits will be theirs. (R Interview 35)
If they allow us then people from the village could do so. Commercial harvesting is good business but for that we would need permission to do so. (R Interview 8)
In short, from my findings it appears as if villagers know much more about the activities
that are not allowed under community based forest management compared to the ones
that continue to be possible. Especially in Mihumo/Darajani the understanding of
villagers of community based forest management is in stark contrast to the envisaged
institutional framework outlined in the forest management plans and bylaws.
7.3.1.4 Training in forest management Training, communication and dialogue about the community based forest management
institutions, the rights and responsibilities of the various village groups and the rules
over forest access and use become essential for the success of community based forest
management. They are important factors that shape the performance of institutions on
the ground. In Mihumo/Darajani village natural resource committee members
complained about the lack of training they received about forest governance. According
to their view they were insufficiently introduced to the management responsibilities and
tasks related to forest governance. None of the current committee members have ever
received any documentation outlining the tasks that need to be carried out. Therefore,
their knowledge on the formal rules and governance framework, as summed up in the
forest management plans and bylaws, has always been limited. Moreover, their capacity
to educate fellow citizens also remains limited. It is true that village natural resource
committee members learnt about their rights and responsibilities in short workshops or
meetings with district officials, but during these meetings most of the participants did
not bring the tools to make notes of important issues that were discussed by district
officials or donor agencies.
We did not go to any seminar. After we joined we just continued the work. We did a seminar once. It was here in Mihumo. I can’t remember who taught us. You need to write things down if you want to remember and we didn’t write anything down. (M Interview 51)
Training and education of the community based forest management institutions also
needs to be provided to the ordinary village population. From the graph below we learn
that among the ordinary citizens there exists a stark difference between Ruhoma and

209
Mihumo/Darajani. Much more people in Ruhoma compared to Mihumo/Darajani feel
that they received training and explanation about forest governance. It is striking that a
majority of more than 73% in Mihumo/Darajani said that they did not receive any
training. This difference is not surprising. Because REDD+ and community based forest
management were only recently introduced to Ruhoma, villagers benefited from the
training provided by TFCG/Mjumita in workshops or village assemblies. In
Mihumo/Darajani workshops and village assemblies were conducted more regularly
when decentralisation started, but in the recent past/ current period selected participants
and members of the committees receive training only on rare occasions when foreign
donor agencies or researchers enter the village to conduct participatory activities.
Graph 7.5 Perceptions of villagers of training in forest management
Did you receive training/explanations about forest management?
0,00%
10,00%
20,00%
30,00%
40,00%
50,00%
60,00%
70,00%
80,00%
90,00%
100,00%
Yes No I don't know
Ruhoma (n=39) Mihumo/Dar ajani (n= 76)
7.3.2 Forest management activities 7.3.2.1 Patrolling In terms of forest protection the village natural resource committee is the most
important institution within community based forest management. According to the
forest management plans the committee is responsible for forest management activities
including organising patrols and forest inventories, issuing permits, educating fellow
citizens, carrying out improvement and assessment activities and reporting to the village
and district council. But in practice the committees in both villages abstained from
many of these management tasks. Instead, they focussed mostly on two activities –
conducting patrols and issuing permits.

210
It appeared as if the village natural resource committee focussed on these two tasks
because they would get money from conducting them. Issuing permits brought money
because residents had to pay for them. The practice of patrolling brought money
because people doing prohibited activities without permits were fined. This motivated
members of the village natural resource committee to walk around in the open area or
protected forest in search of people, who harvest timber without possessing a permit. If
a person was found while logging or transporting trees without a valid permit, the
member(s) of the village natural resource committee who caught him/her would take
him to the village council to negotiate a fine. It also happened that the member(s) of the
village natural resource committee aimed to settle the penalty immediately by
requesting some form of compensation for letting the ‘illegal’ forest user go.
Village natural resource committee members highlighted the need to conduct regular
patrols. According to the management plan of Mihumo/Darajani, for instance, the patrol
team should go every two weeks to check the forest reserve. Yet in reality patrols were
not carried out as planned. Committee members told me that organised patrols into the
forest reserve have become rare. Apparently the last time they went was in February
2011. When they did go on patrols then only in the open area and usually after they had
heard about villagers who felled trees without having obtained a permit.
The people of the forest committee used to go every week. But these days they don't go. They have quit going. When they went in the past, they started there, walked and slept over. Then they made a mark that they passed here. If you catch somebody then it is necessary to pay a fine. (M Interview 5) We started the system of going into the forest. We went twice this year. Last year the secretary quit and another one joined. Since then we haven’t gone to do a survey in the forest. We do patrols in the open area. When we hear that they fell trees then we go. We hear people entered, then we go (M Interview 49).
The fact that committee members of Mihumo/Darajani conducted patrols in the open
area is a clear sign of a divergence between the formal rules and villagers adaptation of
them. Formally, no rights exist for the village natural resource committee to carry out
patrols outside of the forest reserve. Yet in this village the forests in the open area are
huge and they are the ones mostly used for the harvesting of timber and non-timber
forest products. For the committee to leave out this area would have meant considerable

211
loss of income and power over the use of forest resources within the village. It also
needs to be highlighted that committee members especially went on patrols after they
had heard about ‘illegal’ intruders. This too points to the assumption that patrols were
primarily conducted for functional reasons, namely to catch and fine people for the
committee’s and/or individual committee members’ benefit. Unfortunately it is not
possible for me to show where exactly the funds ended up, but a lack of transparency
and inconsistencies with regard to the budget and funds of the village natural resource
committee make it possible for individual members to misuse or misallocate them. I
will return to this point shortly below in the section on record keeping.
The reasons given by village committee members of Mihumo/Darajani regarding the
lack of regular patrolling into the forest reserve were related to insufficient resources to
cover the high operation costs. Members complained that with no proper uniforms, no
training, no equipment, no tent, no bush knives and insufficient money for food,
transport and allowances they are unable to perform this important but very challenging
management task. Because of the size and nature of the Angai forest, without adequate
funds it is not possible to do proper patrolling for several days that includes walking in
dangerous terrain full of wildlife. Requests by the village natural resource committee to
the village council to finance patrolling activities were not listened to. Their argument is
that the lack of commercial activities in the forest leads to insufficient tax revenues that
could be used to finance the patrolling task. Because members of a patrol generally
demand an allowance of a minimum of 1,000 (0.6 USD) or 2,000 TShs (1.3 USD) per
day, the missing financial support resulted in many of them being frustrated and
unwilling to perform the tasks at their own expenses.
We haven’t gone there again because in our cash register there is no money. Because it is far. You need to carry food and medicine. We struggle because we don’t have money (M Interview 50). But we are asking: Who will facilitate us? There is no money. If they had given us money, we would stay the whole time there. But you stay to your own loss (M Interview 29)
In Ruhoma the situation looked different. In conversations with ordinary villagers and
village natural resource committee members I was told that regular patrols have been
conducted. In the beginning it was done voluntarily but once the REDD+ trial money
arrived the amount of 700,000 TShs (450 USD) was set aside to finance patrolling four
times a month for a period of one year. Every week six members of the village natural

212
resource committee go into the forest reserve to assess the situation and check for any
criminal offences. Because of the small size of the forest reserve the patrolling only
takes three to four hours and there are no particular challenges. Nevertheless, sometimes
they don’t go all the way to the end of the reserve. At the end of the day each member
receives an allowance of 2,000 TShs (1.3 USD). The REDD+ trial payment had
noticeably positive effects on the capacity of the village natural resource committee to
carry out regular patrols. The money set aside for this task was maybe a small amount
for each member after every patrol, but it was high enough to cover the costs of the food
for the family at home during this day.
Nonetheless, the formal power granted to the village committees to conduct patrols and
penalise illegal activities does not automatically result in their actual power to perform
these tasks. Even if villagers go regularly on patrols to catch criminal offenders, they
may find themselves in a situation of weakness, when, for example, patrol members
carrying bush knives come upon better-armed counterparts. In this situation they must
let the offenders go without further prosecution.
We people from the village natural resource committee, if we decide to go into the forest, the ones that we can arrest, we arrest, and others where we struggle we don't arrest. If you go there, you meet people with weapons. We don't have weapons. We don't have uniforms. Whenever we go, we go with the clothes from home. And we wear sandals. We are weak. So also the people who meet us there, he can shoot at us. If we meet other weak person, we arrest him. If we see another person, eh, we run; because we don't have guns. No weapons. We just carry an axe or a knife (M Interview 16). Once we went to the protected area because we got the information that there are people who are destructing. We went there and found them. We failed because we did not have any weapon or uniform. We were not seen as guardians. We look the same. They think all of us are thieves. The one with more strength wins. We failed and we reported to the district that because of lack of equipment to go on patrols in the protected area is difficult. We don’t have uniforms or weapons. We are not seen as guardians (M Interview 54).
7.3.2.2 Issuing of permits Through the institutionalisation of community based forest management in the villages,
the collection of forest products, both timber and non-timber, should be formalised.
This is done through the issuing of permits. In both villages I could observe the

213
collection of non-timber forest products such as wild fruits, vegetables, honey and
firewood by villagers. Villagers generally collected non-timber forest products for
subsistence use, but some people also sold small amounts at the market place. Firewood
was the most important non-timber forest product, because all villagers used it for
cooking at home. In Mihumo/Darajani the ming’oko root was also among the most
prevalent products collected and sold by women.
In Mihumo/Darajani non-timber forest products were collected around the farmland or
in forests outside the village land forest reserve. Due to the great distance between the
village and the forest reserve – around 10 miles – villagers found everything they need
in areas much closer to the village. Everybody could go whenever he/she wanted to
enter the so-called ‘open area’ to collect leaves, fruits and berries for subsistence use or
small commercial activities. There were no permits issued and no tax was levied. While
there might have been cases where people went as far as the village land forest reserve
to collect such products, they were neither reprimanded nor penalised for this behaviour
by anyone. It was generally accepted as a legitimate livelihood activity that does not
need any further regulation. The same standards applied to hunting wildlife. People
could go anywhere without having to obtain any permit or paying taxes. Similarly, in
Ruhoma residents collected NTFP, especially firewood, for their subsistence needs.
They too sourced these products in areas close to their farms outside of the reserve. To
my knowledge no permits were ever requested for the harvesting of these kinds of forest
products.
Usually firewood is collected close to village not as far as the forest. When the forest was destroyed then to open up farms, not to collect firewood. Firewood we collect from close areas here. (R Interview 1)
From these findings it can therefore be said that villagers resisted the formalisation of
the collection of non-timber forest products. The formalisation of the collection of
timber forest products was much more present in the villages. Important to note first
though is that in both villages no large commercial timber harvesting was carried out at
the time of my fieldwork. Considerable timber harvesting for commercial purposes only
took place in the past where businessmen came and contracted local villagers as
labourers. In more recent times no influential businessmen entered the two villages to
initiate the felling of trees to transport them out of the village. Instead, trees were felled
for petty-trade, local construction or community development purposes.

214
Here it is only villagers. People from Dar es Salaam are not here. Because of the big costs to be allowed to harvest. You start at the regional office, then district and the district then decides in which village you must go to log. Or they start at the national level. They plan for you, which region are you allowed to go to log for timber […] They came many years ago, but not these days (M Interview 10) The money is not enough for other uses. There is nobody who goes to the forest and harvests 200 or 300 planks. It doesn’t happen. It is people from here. They harvest 10 or 20 planks. So you get 2500 or 5000 shillings. You share it with the government and then you get how much? Very little. You stay and then you arrest somebody (M Interview 55)
In the view of the ordinary resident in both villages, timber harvesting was subject to
having a valid permit, no matter where it takes place. The general understanding among
the population was that anyone who wanted to fell trees is required to request
permission from the village natural resource committee and village council first before
he/she can begin operations. Villagers claimed that the requests were first received by
the village natural resource committee and subsequently discussed among village
council members. Through the issuing of permits, the village natural resource
committee and the village council, or at least certain members thereof, had gained
power among the population and played an important formal role in granting access to
the communal resources of the village.
For example, if somebody wants to harvest timber he needs to go to the committee first. He sees the committee and then gets a licence. He is given somebody who takes him to the forest. This is the work of the committee. And if outsiders come who want to see the village natural resource committee then we assemble and we discuss how things go along. (M Interview 56) People must not just go into the forest and cut trees […] They must go to the office and ask for a permit. He needs to be asked what do you want to do with the timber? If he wants them for construction, 30 or 40, then he can get them. For business, he can’t get the permit (R Interview 11).
In Mihumo/Darajani the village natural resource committee and village council issued
permits for residents and people from neighbouring areas who wanted to harvest timber
in the open area. They claimed that they did not issue permits for the village land forest
reserve. This, again, is in stark contrast to the formal community based forest
management institutions, which do not allow the village natural resource committee to

215
issue permits for areas outside of the reserve. The task of the village natural resource
committee is to protect the village land forest reserve and not the uncultivated area –
whether forested or not – on communal village land. Because of the existing demand to
harvest timber products in the open area, the village natural resource committee and the
village council asserted their power of this territory to obtain financial income.
Because the committee often dealt with small-scale requests they issued permits to
almost every person that applied. There was one significant difference however. From
interviews with village natural resource committee members, I was surprised to hear
different opinions of the amounts of tax people had to pay per plank. One village natural
resource committee member, for instance, told me that for construction purposes no
taxes apply. Only if the timber is sold, then you have to pay a tax of 2,500 TShs (1.6
USD) per plank. Most of the other village natural resource committee members
explained to me that even for construction purposes tax applies, but to the amount of
250 TShs (0.16 USD) only. At the same time non-residents are required to pay 500
TShs (0.3 USD) a plank. Again others believed that independently whether you are a
resident or not you will be charged 500 TShs (0.3 USD) each. From the interviews I
conducted with village natural resource committee members it appears that there was
considerable confusion about the amount of tax. The tax on sawed planks seemed to be
negotiated on an individual basis where village natural resource committee members
often tried to levy 500 TShs (0.3 USD) tax on each plank in order to increase their own
share of benefits.
So what happens is that the price is 250. But we from the village natural resource committee we don’t have any salary. Maybe if there is somebody from there who comes here to get 10 planks for doors. If I meet him then I tell him 500 shillings. From the 500 shillings I take 250 shillings for soaps for the work I do and 250 I take to village (M Interview 54).
In Ruhoma permits for timber harvesting were issued for subsistence purposes only.
Also in this village some village natural resource committee members had a different
understanding of the amount of money required to obtain a permit. One member
explained to me that for 10,000 TShs (6.4 USD) you obtain a permit, which allows you
to harvest 50 planks and 40 beams, where you pay 200 TShs (0.1 USD) tax on each
plank. Another member spoke of 500 TShs tax per plank, and a third one told me that
20,000 TShs (10 USD) are required to obtain a permit for 100 planks and 300 TShs (0.2

216
USD) tax are levied on each plank. From the records I received from the village natural
resource committee secretary I learnt that people were usually charged with 200 TShs
(0.1 USD) tax per plank, but I also viewed a case where 300 TShs (0.2 USD) were
charged. What I could not ascertain from the records was whether any income was
received from the fees of 10,000 TShs (6.4 USD) or 20,000 Tshs (10 USD). required for
issuing the permits.
One issue that emerged from my conversations with villagers about the harvesting of
timber related to follow-ups of permits. I was told that craftsmen could easily log more
trees than they were permitted in order to produce more planks. Village natural resource
committee members seem to not rigorously follow-up on the amount of planks sawn.
Craftsmen were therefore easily tempted to apply for small amounts of timber and then
log much more than permitted.
7.3.2.3 Prosecution of illegal activities If institutions ought to work, violation of their rules must be penalised (Ostrom, 1990).
In the forest management plans and especially in the bylaws the fines and penalties for
various offences are declared. They are also known among the village natural resource
committee members although with a degree of confusion. Among the village natural
resource committee members in Mihumo/Darajani various opinions existed about the
scale of punishment for illegal timber harvesting, reaching from 50,000 (32 USD) to
300,000 TShs (192 USD) plus the confiscation of harvested timber. Nevertheless, in
practice, as a consequence of the lack of regular patrols, apparently very little money
was obtained from the prosecution of illegal activities in Mihumo/Darajani. The village
natural resource committee did not have records of anyone being arrested or taken to
court. Yet according to the views of some villagers illegal harvesting of timber products
takes place unreported and without prosecution.
Some people who fell trees in the open area don’t pay tax. They log timber and sell, but they claim to fell trees for construction. In the morning we see people who buy timber and go with it. If you ask him he says ah this is just to pay my debts with him. I rent from him and now he is taking my timber (M Interview 49). For some people who live on their farms it is easy to enter the forest, fell trees and we don’t know about it (M Interview 50).

217
In interviews I was told that few offenders were arrested during the past year and
charged with a penalty of 50,000 TShs (32 USD). Also their equipment was
confiscated. Yet all of them requested their fine to be removed, or at least reduced,
because of the difficult situation they find themselves in. After some time of negotiation
and consideration their fine was reduced and the confiscated tools returned to their
owners. Village natural resource committee and village council members claimed to
practice ‘brotherhood’ with their fellow villagers. They are sympathetic and show
understanding for the apparently dire situation of the criminal offenders.
Around three people got fined. But because they are our brothers, you know. If they arrive their they say people we don’t have 50,000. We did so because of poverty. So the 50,000 can be cancelled. He can pay 20,000 or 20 something. And others arrive there and say yes you caught me and my tools but I don’t have anything. He can complain and maybe pays 15,000. We just put the 50,000 as a law. If somebody gets caught he pays 50,000. But nobody has ever paid 50,000. (M Interview 50).
According to the law the fine is 50,000. But we practice brotherhood. It is not possible 50,000 if they are people from here. It is possible but then we are seen as bad people. So we explained to them that their amount is a quarter. But according to the law somebody who is arrested with his tools pays 50,000 then he can be given back his tools and he can continue to cut trees (M Interview 56) The first journey we went we found saws and pots. It was two years ago. Recently we went again and we found saws, pots, cutlery, flour. After that we didn’t go again. They took the equipment to the office. We gave them to the head of the patrol. Then they came on their own. They said these are their tools. So the committee met. We decided to forgive them but they must pay 15,000 shillings. (M Interview 57).
I was also told that often the village natural resource committee fails to arrest criminals,
because they know from other sources when patrols are being conducted. Thus,
whenever the village natural resource committee is busy carrying out patrols, the
criminals had already been warned and left the scene prior to their arrival. Nevertheless,
sometimes the tools of the offenders are left and village natural resource committee
members collect and confiscate them.
They investigate people, ask them, the forest committee when do they enter the forest? When they enter they already left. They logged timber maybe 50, 100. They take a bicycle and leave.

218
There are people who do it this way. They enter without permit, but they do it considering time. But to do this it needs to be somebody from here. Because strangers don't know when the forest committee enters the forest (M Interview 5). When we go on patrol, people know that today the committee is doing the patrol. So when we go then we don’t meet them but only their tools. So we take the saws to the office. Afterwards, when he comes to collect the tools, we fine him (M Interview 50).
Also in Ruhoma I came across cases where timber was harvested without the
permission of the village natural resource committee. It is small-scale logging for
construction purposes carried out by villagers. Obtaining a permit for a few planks to
produce stools, chairs or similar things seem to be an unnecessary obligation. This view
appears to be shared by villagers in general and the responsible authorities, as non-
compliance to the rules does not result in penalisation.
… I for myself I haven't been ready to get permits. If I get the timber illegally [michocholo] then the days continue as if nothing happened (siku zinakwenda). And if you go for permit, you are being robbed a lot.
Towards the end of my fieldwork period an incidence happened that had considerable
consequences for the village natural resource committee’s own understanding of the
prosecution of illegal activities. After a man was arrested by the district police, because
he had felled trees in the open area, the village natural resource committee intervened to
inform the district that they had given the man a permit to log timber. The district
office, however, replied that the activity of the village natural resource committee was
unlawful due to their lack of authority over the open area, resulted in a feeling of a
complete loss of the sense of ownership over the governance of village land.
But anyway, we understand that we don’t have any freedoms. Because the first time we got the knowledge that in the open area people get can timber for subsistence. But now we got the proposition that in the open area nobody must be allowed to harvest neither to build or anything […] We from the village natural resource committee followed up on that and apparently we don’t have any authority to allow people to harvest. They have the authority. I as the vice-secretary I followed up on that a lot, I asked them, so what is the importance of the village natural resource committee and of the open area. Because they said the importance of the open area is to benefit the community. For construction, to farm, for charcoal. Today you announce that villagers may also not harvest there for construction. What is the importance of the

219
village natural resource committee and the open area? […] At the district they just said you have no authority to give out permits. Permits come from the district. So I asked him, it is possible that somebody has built his house and he needs three planks for his door. Must he come to the district to ask for a permit for three planks. They told us even if he wants one plank he must ask the district for the permit (M Interview 54).
7.3.2.4 Reporting and recordkeeping The decentralisation of forest management to the community level enables the village to
retain 100% of all forest-related income. Important responsibilities for village natural
resource committee leaders are then the correct recordkeeping and reporting of all forest
related income and expenses to the village council. When income and expenses of the
forest are rightfully reported, the village council and subsequently the village assembly,
consisting of all adults in the village, can decide upon the allocation of the funds to
different development projects. To make this possible the VEO is required to obtain the
income and expenses from the village natural resource committee and discuss them with
the village finance committee and village council. After every three months reports
must be provided to the village assembly to debate the financial situation of the village
and decide upon future strategies.
In practice a great deal of confusion prevailed in Mihumo/Darajani in relation to the
annual total income and expenses of the forest committee. Throughout my fieldwork
period I heard complaints from villagers about the lack of knowledge and
communication of any village income and expenses. Because of political29 and
religious30 conflicts in the village, no village assemblies were held for many months,
which made it impossible for the public to know the financial situation of the village.
When I started to interview village natural resource committee members to find out
more about the income and expenses of this specific committee, most of them told me
that very little or no money is in their cash register. A few people went beyond that and
put a figure between 15,000 (9.6 USD) and 39,000 TShs (25 USD) to it. When I tried to
29
Political conflicts existed between the local CCM and CUF parties, especially between the village executive officer (CCM) on the one side and the village council and the village chairmen from Mihumo and Darajani (CUF) on the other side. They would rarely talk to each other and were involved in legal cases against each other. 30
Religious conflicts existed between more ‘conservative’ Muslims on the one side and more ‘progressive’ Muslims on the other side. Or, put differently, between Muslims, who had different understandings of how to practice Islam. One could also argue that these religious conflicts were, at least in part, also political as many ‘conservative’ Muslims, who were affiliated to the local CUF party, used their religious beliefs to express resistance to the politics of the ruling CCM party (cf. Becker, 2006).

220
find out the reasons for that I was told that most of the income obtained from the taxes
and fines gets used for patrolling and allowances. Other money was apparently provided
to the village council to solve some immediate problems.
All the money is used for the patrol. But if they have, if there is a problem here in the village, they come and ask for it and they are being given. At times we haven’t gone on patrol and money exists, but it is used for the village. They come to ask, and they are given (M Interview 56).
Whenever I asked for financial records I was directed to the secretary, chairman and
treasurer of the committee. Unfortunately, all of them were unable to provide me with
assistance. The same applied to my requests to the VEO, who too could not assist me
with any details. In fact all of my attempts to obtain relevant records failed and no
concrete information about the financial situation of the village could be provided. This
lack of proper recordkeeping was also criticised among other village natural resource
committee members and ordinary citizens.
The VEO hasn’t got a report from the committee for a long time. The chairman was called and asked by him: Where are your reports? Then the chairman called a meeting with the committee members to discuss this. We did not know that our chairman did not take the reports to the VEO. After the VEO complained we got the news that he doesn’t take the report to the VEO (M Interview 57). At the general assembly they are told about the income and expenses. These days they can’t know how the profit of the forest is being used. The people at home can’t know how the money is used (M Interview 55).
From the graph below the degree of this problem becomes clearer as we learn that more
than 85% of the people in Mihumo/Darajani admit that they do not know the income
and expenses of the village.

221
Graph 7.5 Perceptions of villagers of village income and expenses
Do you know the income and expenses of the villag e?
0,00%
10,00%
20,00%
30,00%
40,00%
50,00%
60,00%
70,00%
80,00%
90,00%
Yes No/I don't know
Ruhoma (n=39) Mihumo/Dar ajani (n= 76)
The situation in Ruhoma looks very similar, as around 80% of the villagers did not
know the income and expenses of the village. The reasons in Ruhoma appear to be quite
different though as they have less to do with a lack of communication by village leaders
but more with the non-attendance of most ordinary villagers in regular village
assemblies. Apparently ordinary village assemblies tend to be badly attended. In
contrast to Mihumo/Darajani, financial records of income and expenses of the village
namely existed and were given to me upon request. Records were kept of patrolling
activities, the issuing of permits and the income and expenses of the forest committee.
This information was obtained by the VEO to include it in the analysis of the financial
situation of the village at large. However, in interviews I was told that the ordinary
villager does not easily understand the village income and expenses even though they
are reported at village assemblies. Apparently, the way they are communicated to the
ordinary villagers is problematic as some find it confusing and non-transparent.
7.3.2.5 Accountability In Mihumo/Darajani the cooperation between the village natural resource committee,
VEO and the village council was minimal. Almost no communication, no transparency
and a complete lack of accountability caused a situation where nobody knew what the
other one was doing. Ordinary citizens then feel that there is enough opportunity for
corruption, which leaders are only too happy to make use of.

222
There are meetings with the council. We get informed, that’s it. Professionals come and inform leaders, but they don't take the message to the villagers. The people from the forest committee we only saw once together, at the day of election. Since then, they go separated ways. The day of election they were selected, then afterwards they left each other (M Interview 21) These days trees are there but people log them arbitrarily. They enter like thieves. The leaders themselves are thieves, they follow them and log. Without any reports. The timber passes through during the day and people see them (M Interview 41). For example me, I know that there is the protected area. I know that there are trees, I go and log them. I call the car and fill it up with logs (magogo) or poles (boriti) or planks (mbao). And I get money. Because from the government, we don't get anything when they harvest from there. You hear, we will go and log. We have gone and logged and put them here. Then they sell them and eat it themselves ... There are people from other areas who come. To steal, like from Lilombe (M Interview 18)
Often village natural resource committee members explained to me that their weak
performance results from the lack of resources, most importantly the lack of money.
Money is missing and therefore very little is possible. At the same time already given
equipment was sometimes not handed over from one committee to the next one, but was
kept privately by past committee members. This happened, for instance, with shoes and
uniforms that were provided by development actors to every committee member. A lack
of accountability characterises the relations between the committee, the village council
and ordinary villagers. Money and resources are consumed without a clear commitment
to accountability and transparency, which leaves the ordinary citizen unaware of
potential misuse and wastage.
But village leaders were also able to do this differently, for instance in Ruhoma the
income and expenses from the REDD+ trial payments were clear to all ordinary
villagers. The majority of the rural population in the village knew exactly how much
money was provided and how the amount was distributed. This is due to the work of the
REDD+ payments distribution committee, which met and decided upon suggestions for
the distribution of the trial payments. They practiced excellent leadership by adhering to
good governance principles. Their suggestions were openly presented, debated and
subsequently accepted in a well-attended village assembly. Consequently, no

223
accusations of corruption or bad governance were mentioned after the distribution of the
REDD+ money.
7.4. Conclusion In this chapter the actual practices of community-based forest management institutions
were analysed, therefore contributing to answering research question 2: “How do
REDD+ initiatives interact with local forest governance in Lindi, Tanzania?” The
findings of the chapter provide important insights into how rural villagers in Lindi,
Tanzania, interpret and implement community conservation, which is the preferred
governance framework among many REDD+ supporters across the globe. This is
crucial better to understand the actual workings of rural societies in Tanzania and how
this links to social justice of conservation objectives.
Community based forest management is an institutional framework for the governance
of forests that has been introduced in both villages as the best way to achieve
environmental sustainability and community development. In both cases similar
institutions were drafted to replace customary governance arrangements. In introducing
ideas of ‘good governance’ via these new institutions, rights, powers and
responsibilities over forest access and use were redistributed and transferred to formal
village institutions, assuming that the separation of powers under democratic
governance would lead to more equitable, efficient and effective conservation and
development outcomes. As with inclusive neoliberalism in general, the introduction of
‘good governance’ reforms is thought to fix environmental and societal problems (cf.
Hickey, 2012a, 2012b).
In introducing new institutions, however, open-access forests were transformed to
common property; new notions of community insiders and outsiders, legal and illegal
forest users and uses were created and formalised through a sophisticated ‘permits’
system. Non-residents suddenly found themselves outside of the ‘community’, eligible
only to limited forest uses and this often in return of payments. Village residents
confronted new complex rules and regulations that meticulously defined and
rationalised every prohibited and permitted activity in the forest reserve.
The development actors’ belief, or perhaps hope, that the drafted community-based
forest management institutions will be adopted by local villagers proved problematic.

224
This was the case much more so in Mihumo/Darajani than in Ruhoma. Surely, if new
institutions are to be adopted, villagers must know them. When I examined villagers’
knowledge of the rules and regulations set out in the forest management plans and
bylaws I found out that most villagers did not know the breadth and depth of the many
institutions. This lack of knowledge illustrates the problem of effective information
dissemination in a rural setting of Tanzania, where oral communication and limited
information channels are the norm (cf. Taku Tassa, 2010).
Nevertheless, in both villages most survey respondents assigned ownership and
responsibility to protect the forest reserve to villagers, which means that the community
has taken on the most foundational elements of community-based forest management.
In Ruhoma villagers even knew the basic rules regarding forest use and access, which
was mainly due to the recent introduction of the project and the many assemblies,
trainings and workshops provided to disseminate knowledge of forest governance.
Villagers in Mihumo/Darajani, who regarded the forest reserve as a close-off area where
no livelihood activities can be conducted, confirmed that continuous training,
workshops and education are required when new institutions are to be adopted.
However, the perception of the forest reserve as a closed-off area had other, probably
more important, roots. Interviews in Mihumo/Darajani attested that entering the reserve
would lead to arrest by the village natural resource committee. The committee therefore
took on the role of protecting the forest and communicating, together with the district,
that nobody is allowed to enter the reserve. At the same time they issued permits for and
conducted patrols in the forested land outside the reserve. In this way the committee in
Mihumo/Darajani reinterpreted the drafted institutions and used their formal powers to
accrue money for, at least partly, individual benefits. The confusion over the amount of
fines, stories about the handling of illegal forest users and secrecy over the income and
expenses of the committee provide much evidence to this assumption. This illustrates
the problem of corruption that has been acknowledged in studies of Mihumo/Darajani
before (Taku Tassa, 2010).
In Ruhoma, in contrast, recent REDD+ interventions resulted in regular patrolling and
more transparent forest management practices. The money from REDD+ certainly
contributed to that as payments were set aside for the activities of committee members.
It seems that they felt less of a need to obtain money by fraud. In a context of severe

225
lack of resources in Mihumo/Darajani, due to the restrictions imposed by the district
council, the implementation of community-based forest management institutions was
challenging from the beginning and ultimately led to personal enrichment. For that
matter the materiality of the forest plays an important role too. The smaller forest size
and fewer dangerous animals in Ruhoma made forest management activities much
easier than in the vast landscape of Mihumo/Darajani.
The stark differences between the villages in terms of the decentralisation process, their
relations with the district and development actors and the benefits accrued from forest
protection (see chapter five and six) certainly played their part in shaping the observed
practices outlined in this chapter. The politics and frustrations over failed
decentralisation, and linked to this about failed inclusive economic development, may
have also contributed to religious and political conflicts in Mihumo/Darajani, which
resulted in no village assemblies taking place, where residents, as citizens, could have
probed their leaders. The generated lack of accountability of village leaders made it
impossible for the public to know the income and expenses of the village. This, in
return, made it very difficult for them to engage in ‘transformative forms of politics’
and to practice ‘participatory citizenship’ to enable change (Hickey, 2010).

226
Chapter 8: Conservation Agriculture and farmer field schools 8.1. Introduction
I insist that you all visit those CA plots so that you can thoroughly understand and implement the technology back home. For the districts, try to assist the farmers as much as possible in adopting the technology for the benefit of our farmers. We have a challenge on climate change, and by adopting CA we can contribute towards mitigating the challenge. (Minister, Hon. Mathia Chikawe in LIMAS Newsletter, 2013)
The honorary Minister of Justice and Constitutional Affairs Mathias Chikawe made this
strong plea in his closing speech as the Guest of Honor at the Nanenane agricultural fair
in Ngongo, Lindi, in August 2013. Along with district officials, agricultural extension
officers, farmers and donor representatives he lobbied for the wide adoption of
Conservation Agriculture among the resource poor, small-scale farmers in Southeastern
Tanzania. He thereby joins a powerful alliance of development actors who have been
actively promoting Conservation Agriculture as the most promising solution to Africa’s
agricultural development challenge.
Against the background of rural poverty, environmental degradation and rising local
and global food demands, advocates argue that Conservation Agriculture should be
adopted to meet the needs of farmers and the environment, i.e. to “improve the
efficiency of inputs, increase farm income, improve or sustain crop yields, and protect
and revitalise soil, biodiversity and the natural resource base” (FAO, 2009:i). In the
midst of rising attention to sustainable agricultural development in Africa, this broad
and powerful network of national and international actors increasingly call for
Conservation Agriculture as the best option to the millions of small-scale African
farmers (Baudron et al., 2012; Kassam et al., 2009).
Conservation Agriculture also represents the chosen technology of development actors
to reconcile agricultural growth with forest protection. In promoting Conservation
Agriculture techniques LIMAS and TFCG project staff hope to convince villagers to
reduce opening up new farms in order to decrease the pressure on forests.
Simultaneously they promise that agricultural productivity still increases, allowing
farmers to meet future food demands and pursue economic development opportunities
(LIMAS, 2010; TFCG, 2012).

227
In this chapter I will argue that Conservation Agriculture is introduced to the villagers
in the form of an agricultural modernisation package that includes productivity-
enhancing practices, which are in fact unrelated to the concept of Conservation
Agriculture. This creates a dichotomy between ‘backward’ and ‘modern’ farming with
Conservation Agriculture representing the latter. Then I will discuss the approach
development actors selected to promote Conservation Agriculture in the villages. I will
examine the performance of farmer field schools in disseminating knowledge of this
new technology. I will explain the factors contributing to the functioning and failure of
these groups. This is followed by a discussion of the impacts these farmer field schools
had on the participants in terms of their perceptions of different aspects of Conservation
Agriculture. Barriers and possibilities of adopting Conservation Agriculture techniques
will be looked at and analysed on the basis of the opinions and socio-economic
conditions of the villagers.
8.2. Conservation Agriculture 8.2.1 Basic principles of Conservation Agriculture
[Conservation Agriculture] provides a truly sustainable production system, not only conserving but also enhancing the natural resources and increasing the variety of soil biota, fauna and flora (including wild life) in agricultural production systems without sacrificing yields on high production levels. As CA depends on biological processes to work, it enhances the biodiversity in an agricultural production system on a micro- as well as macro level (FAO, 2014).
Conservation Agriculture is not a single technology. It is a set of principles and
practices that are based on three fundamental aspects: (1) no-tillage or minimum
mechanical soil disturbance, (2) maintaining permanent soil cover with organic mulch
and (3) practicing of crop rotations and/or associations (FAO, 2014, 2009). In trying to
integrate the management of soil, water and biological resources, Conservation
Agriculture is similar to other ‘green agricultural technologies’ including organic
farming and agroforestry. In contrast to organic farming, however, Conservation
Agriculture does not abstain from chemical inputs (herbicides, pesticides, fertilizers); it
only aims to minimize their usage to the most efficient level, i.e. understood as ways
that do not interfere with, or disrupt, the biological processes (FAO, 2014).

228
Proponents of Conservation Agriculture emphasise the importance of soil structure and
soil organic matter to sustainable agriculture. Producing and maintaining a healthy soil
ecosystem, consisting of combined living and non-living fractions, constitute the basis
objective of this agricultural approach. This shall lead to the reversal of soil erosion and
degradation on African lands, thus creating a productive and resilient environment for
intensive crop production. In this way African farmers shall be empowered to adapt to
future climatic changes that are expected to bring more temperature increase, rainfall
variability, water stress, and extreme weather events (IPCC, 2007). Because the
production and improvement of soil organic matter is also linked to increased carbon
sequestration, Conservation Agriculture proponents point to the opportunities of climate
mitigation. Moreover, the claimed reduced need for tractors and other machinery
contribute to the reduction of greenhouse gases from agriculture (Kassam et al., 2009).
The most striking, and probably most debated aspect of Conservation Agriculture is its
emphasis on minimum or zero tillage. Ploughing, an agricultural method practiced for
thousand of years, is seen to damage the soil structure in the long-term, thus leading to
declining soil fertility and organic matter levels, ultimately culminating in soil erosion.
For this reason Conservation Agriculture proponents swear by the application of
permanent soil cover in combination with cereal-legume crop rotations to maintain soil
fertility and to combat weeds, pests and diseases. The organic mulch “protects the soil
from the physical impact of rain and wind but it also stabilizes the soil moisture and
temperature in the surface layers” (FAO, 2014). Through mulching the soil becomes a
lively habitat of diverse organisms, who begin with a process termed ‘biological tillage’
that transforms organic matter into humus, thus contributing to the stabilisation of soil
structure, which serves as a buffer for water and nutrients (FAO, 2014; Kassam et al.,
2009).
When Conservation Agriculture is followed correctly, farmers are told to expect
improved and sustained yields with less time required for weeding and less inputs
required for crop production. Proponents thus argue that Conservation Agriculture
reduces the production costs, reduces the workload and increases the output for the
farmer. All of this can be achieved while protecting or even enhancing the natural
resource base of our environment.
For the farmer, conservation farming is mostly attractive because it allows a reduction of the production costs, reduction of time and

229
labour, particularly at times of peak demand such as land preparation and planting and in mechanized systems it reduces the costs of investment and maintenance of machinery in the long term (FAO, 2012).
8.2.2 The challenges constraining adoption of CA in Africa At present Conservation Agriculture has been adopted on a project-basis in Africa
without any large-scale transformation of rural farming practices. In areas where it is
practiced, non-governmental organisations and donor agencies have had a major
influence in convincing farmers to adopt the techniques (Kassam et al., 2009). Often it
has been found that farmers do not adopt all principles and practices. Instead, they pick
the ones they find most suitable to their socio-economic and ecological conditions.
Critics claim that farmers only practice Conservation Agriculture during promotion and
donor programmes, but once support fades, they return to their ‘traditional’ way of land
cultivation (Giller et al., 2009).
Given the supporter’s claim of the many win-win benefits of Conservation Agriculture,
the low uptake does come as a surprise. However, several factors have been identified
that seem to hinder the dissemination of Conservation Agriculture related practices
among rural farm dwellers in Africa. Lack of awareness of soil erosion and
environmental degradation, lack of knowledge, limited access to inputs, credits and
technical information, labour constraints, lack of clear tenure and competing uses for
crop residues are among the most common. Critical scholars further highlight that some
of its techniques can be detrimental for the productivity and income of the farmer,
especially in the short-term, and that scientific evidence for its alleged benefits is
incomplete. Moreover, the socio-economic condition of smallholder farmers in Africa
often stands in clear conflict to Conservation Agriculture requirements. No-tillage, for
instance, can result in lower yields during the first years of adoption, thus causing
hardship for already income-stressed farmers. The increased need for herbicides and
fertilizers during the first years further represents real material obstacles for adoption
(Baudron et al., 2012; Giller et al., 2009; Knowler and Bradshaw, 2007).
8.2.3 Conservation Agriculture in Lindi, Tanzania In both case-study sites Conservation Agriculture is being promoted to farmers as the
best way to practice agriculture (LIMAS, 2011; TFCG, 2012). Especially under the
Finnish-Tanzanian development partnership LIMAS, which operates also in

230
Mihumo/Darajani, a lot of efforts and money have been directed towards the promotion
of Conservation Agriculture in South-eastern Tanzania. In total around 130
demonstration plots were initiated in Newala and Liwale districts. Ward extension
officers, their supervisors, Agriculture Training institute employees, primary school
teachers and some farmers have been trained to become facilitators for farmer field
schools (LIMAS Newsletter, 2011). In a flyer produced for the LIMAS programme the
hopes placed in this technology become apparent:
Conservation Agriculture is promoted to assist farmers get better yields from their land. Conservation agriculture improves productivity, cuts down the workload in land preparation, and helps adaptation to climate change. The average yields increase as a result of improved soil fertility and favorable soil structure, which helps plants to effectively utilise water and nutrients. The need for fertiliser is minimised by systematic use of legumes in crop rotation. Conservation agriculture is implemented by millions of small and large scale farmers all over the world (Limas, 2011).
Project proponents of TFCG and Mjumita promote Conservation Agriculture in
Ruhoma and other villages that take part in the REDD+ project. The agricultural
extension officer of TFCG is particularly active in promoting this technology to farmers
in the villages in order to assist them to reduce the pressure on forestland.
Conservation Agriculture is introduced in the two villages as an alternative to extensive
agriculture based on slash-and-burn practices, which is regarded to be detrimental to the
environment and forest protection. If we read the Limas project document their stated
objective of the intervention is for farmers to adopt “a rational utilisation of the already
well established fields” in order to “reduce the need to open new fields” (LIMAS,
2010). The District Agricultural Officer of Liwale resembles this view of Conservation
Agriculture as the solution to slash-and-burn agriculture:
More important, the approach of Conservation Agriculture focuses on friendly environmental management, [on] friendly use of environment. The farmer will no longer need to shift from one place to another. Because the cultivated land is treated with green manure, fertilizers, he doesn’t have a reason to say let me go to another area to open up a new farm. He cultivates on the same piece of land continuously while producing maximum. At the end of the day he gets good income (M Interview 61).

231
In both villages Conservation Agriculture is communicated in the form of a package
that includes non-Conservation Agriculture related techniques such as improved
planting and weeding, usage of agrochemicals, recordkeeping, etc. In the villages all
these agricultural techniques are summarized as Conservation Agriculture when being
presented to the farmers. This creates a dichotomy between ‘backward’ and ‘expert’
farming with Conservation Agriculture representing the latter. Conservation Agriculture
is thus viewed as the ‘modern’ or ‘expert’ way of farming, which puts it as the
alternative to the ‘traditional’ slash-and-burn agriculture. It is not surprising then that
villagers have high hopes in Conservation Agriculture, because they mistakenly link to
it the benefits of general improved farming techniques, which are, at least partly,
unrelated to this particular technology.
When we practice slash-and-burn agriculture (kilimo sensa31) and we use fire, the soil doesn’t have any fertility. But with Conservation Agriculture we leave the residues, we don’t use fire, we dig holes and put fertilizers. First lime then ‘planting fertilizer’ then we cover and then ‘growing fertilizer’. We then compare slash-and-burn agriculture and Conservation Agriculture. Conservation Agriculture will produce more crops because we farm professionally (kitalamu) (M Interview 33)
Conservation Agriculture is seen to be superior to other forms of cultivation in the sense
that farmers achieve better productivity per area, i.e. they use less input (labour and
capital) for more output on the same piece of land. Villagers are also told that
Conservation Agriculture can be followed without having to invest in capital-intensive
machinery like tractors or animals for ploughing. The transition to this technology can
be initiated even with minimal capacity building and with a hand-hoe as the only
possession. Alongside the low capital requirements, the second big advantage to small-
scale farmers refers to the reduced workload. Labour requirements, particularly in terms
of weeding, are suggested to become less and better spread across the season. Project
proponents argue that, when practiced correctly, Conservation Agriculture offers win-
win benefits to the farmer and the environment (Limas, 2010; TFCG, 2012).
Project proponents in both villages regularly referred to successes made by Zambian
farmers who practiced Conservation Agriculture. Zambia is presented as the prime
example where Conservation Agriculture served to reverse degraded soils and helped to
31
In Mihumo/Darajani villagers generally referred to slash-and-burn agriculture that involves cutting trees and/or removing crop residues from the field with the use of fire as kilimo sensa.

232
‘develop’ poverty-stricken peasants. In Mihumo/Darajani videos about the Zambian
success stories were shown to village council members and district leaders, encouraging
participants to believe in the positive short- and long-term effects. Some project staff
from both projects were taken to a study tour in Zambia to get a hands-on experience of
the application of Conservation Agriculture.
8.3. Farmer field schools 8.3.1 Farmer field schools and Conservation Agriculture Once development actors decide to promote a certain agricultural strategy to rural
farmers, they need to think about how they can disseminate the new technology. A very
popular approach is the farmer field school approach, which was used in both villages to
train farmers in Conservation Agriculture. No less than 130 farmer field schools were
initiated in Liwale and Newala districts as the main strategy of LIMAS. TFCG similarly
aimed to establish farmer field schools in all of its REDD+ villages.
Famer field schools consist of a group of farmers, who meet regularly (usually weekly)
with a facilitator/trainer on a collectively managed field, where farming methods are
practiced, analysed and debated according to its various socio-ecological benefits. In
farmer field schools active participation and group dialogue shall enhance the learning
process and knowledge dissemination, ultimately beyond the group members to all
households in the villages of the participants (Davis et al., 2012; Friis-Hansen and
Duveskog, 2012). The approach aims to facilitate participatory and experimental
learning in groups that encourage the farmers actively to engage with each other in
knowledge creation and exchange. The trainer becomes more of a facilitator rather than
an authorative instructor, who assists farmers in developing their technical, social and
management skills for the use of self-empowerment (Davis et al., 2012; Friis-Hansen
and Duveskog, 2012). Farmer field schools have been characterised as a “community-
based, demand-driven, non-formal education program that appears to stimulate both
empowerment and agricultural growth” (Friis-Hansen and Duveskog, 2012:415).
With these ideas in mind, Limas and TFCG/Mjumita established farmer field schools,
hoping that this approach results in the wide adoption of Conservation Agriculture
among villagers. They hoped that selected villagers would volunteer themselves to
practice Conservation Agriculture techniques weekly with a facilitator on a collective
field. Being given the knowledge and some limited inputs, the volunteers were expected

233
to work on the demonstration plots to learn about Conservation Agriculture and
ultimately become convinced of its benefits. Following this they will adopt the
techniques on their private farms, which then become more demonstration plots that
serve to convince fellow villagers. This was the intended plan, yet things turned out to
be quite different in reality.
In Ruhoma the cultivation of maize on the demonstration farm failed and the group
collapsed after a few months. Only four group members remained who decided to
replace the failed maize with sesame cultivation without any further consultation with
the facilitator. As a consequence of this disappointment, villagers generally claim that
they did not obtain many benefits from this farmer field school. Moreover, as the quote
below illustrates, some began to believe that Conservatin Agriculture would put them in
a worse position.
They put a demonstration farm and planted maize. They did not harvest. They did not harvest because this soil has lots of weeds. They failed to harvest based on their expertise (utalamu) to leave the weeds on the ground (kutandaza nyasi). […] this is not the place for this agriculture that they brought [CA]. Conservation Agriculture and leaving grass on the ground. That's why we think they and their expertise will put us in a worse situation in future (wanatuweka mabaya mbele) (R Interview 33).
Similarly, the farmer field school in Darajani practically lost 11 of its 15 members
within the first two months. The group was established at the end of November 2011
and in the middle of January most group members began to proclaim the breakdown of
the exercise. Within a short time the group got reduced to merely four members, who
continued to work alone on the farm with little consultation with the facilitator. One day
when I visited the four members on the demonstration plot, the group leader told me
that I am more interested in their activities than the facilitator, and that I come more
often than him. He complained that the facilitator has given up on them, that he neglects
them. Despite this they still managed to harvest maize, cowpeas, and pigeon peas but
they failed with soya cultivation. Soya did not grow at all and they did not know exactly
why it has failed so terribly. They suspected expired soya seeds to be the reason. Other
major challenges experienced on the plot were the lack of manure, pests that infested
cowpeas and rats and hares that damaged the maize. At the end the remaining group
members felt that they were left alone with the challenges. Given the objectives of the

234
farmer field school to facilitate experimental and participatory learning these outcomes
are clearly disappointing.
He [facilitator] is needed on the farm. But if you tell him then he says today is Friday. It is not the day of work. On the working days he is not available [...] He says he has been busy in other areas. He gives us reports on where he goes. The day after tomorrow I will come there, he says. He is not visible. We work long hours but he is not seen (M Interview 27)
In contrast the performance of the Mihumo group was better, especially with regard to
the sustainability of the group. All group members remained active and ultimately
achieved an average harvest from their one-acre plot. The group leader recorded the
harvest, which amounted to 100 kg of maize; 92.5 kg cowpeas and 80 kg pigeon peas.
In their field too soya did not prosper. In total they harvested 272.5 kg from their one-
acre large field. In comparison, the mean harvest of annual crops by survey respondents
amounted to 307kg/acre in Mihumo/Darajani. Major challenges were pest infestation on
cowpeas and the theft of maize by local residents. Their farm was located next to the
road just outside the village and therefore easily accessible; also for thiefs apparently.
To avoid this problem in future the group members bought another plot, which is
further away from the village. There they want to continue practicing Conservation
Agriculture.
Summing up, two of the three farmer field schools did not perform to the satisfaction of
villagers, group members and development actors. The third one could record better
results although group members hoped for more. However, from my research it
becomes apparent that group dynamics and socio-economic context play important roles
in influencing the performance of farmer field schools and Conservation Agriculture.
The two farmer field schools that considerably struggled with the application of
Conservation Agriculture had serious problems with intra-group conflicts, conflicts
among group members and the facilitator, high drop-out quotes, low participation, lack
of resources and low levels of empowerment.
Despite the many problems and challenges, the three farmer field schools also resulted
in some positive outcomes for the group members. Participants who attended activities
and/or seminars gained knowledge previously unknown to them. This included the
advice regarding improved planting techniques, mulching, selection of seeds and crops,

235
crop rotation and intercropping, the use of agrochemicals and natural fertilizers,
improved harvesting techniques and proper recordkeeping.
In Ruhoma, for instance, ten of the 20 farmers, who were selected to form the
agricultural group, were taken on a study tour to a few villages in Liwale district. In
these villages they were shown rice, maize and peas farm, where they met with the farm
owners to exchange experiences of crop cultivation. Unfortunately, many of the people
who went on this trip did not feel completely satisfied with the knowledge they got. The
majority felt that the farming presented to them wasn’t really different to that they
practice at home.
In Mihumo and Darajani both groups received 100 kg fertilizers (two types), 4 kg
maize, 3kg cow peas, 3 kg pigeon peas, 2kg soya, books, a measuring rod, one big hoe
and one record keeping book for the chairman for the start up. In contrast to farmers in
Ruhoma, group members in Mihumo/Darajani were not taken to the classroom or on a
study tour for lessons. Instead they were all given books to study for preparation. The
real lessons started on the first day of practice on the demonstration plot. The facilitator
explained to them how to dig planting basins, the spaces required in between the pits as
well as the rows, the length, width and depth of the pits, and how to use the measuring
rod correctly.
However, these positive effects should not let us forget that the performance of the
farmer field schools fell short of everyone’s expectations. We know from other studies
that the problems experienced by groups in Darajani and Ruhoma are common features
of farmer field schools and similar extension approaches (Islam et al., 2011). Islam et al.
(2011) argue that issues related to the long-term sustainability of such groups apparently
represent the major challenge. Often farmer field schools run as long as donor
assistance continues but collapse as soon as external support is withdrawn. This
phenomenon can have negative consequences such as creating a cycle of dependency
among farmers, wastage of significant amounts of public or donor money and causing
the decline of this approach due to its fiscial unsustainability (ibid).
According to Islam et al. (2011) five important aspects contribute to the sustainability of
farmer-led extension groups, which farmer field schools are part of; group savings-
credit performance, gender-based usefulness of FLE microcredit, group governance and

236
leadership, social capital among group members and social capital between the
members and the professional facilitators. I will now discuss the factors that have also
been important to the performance of the farmer field schools in our case-studies below.
8.3.2 Factors influencing farmer field schools performance in Lindi, Tanzania 8.3.2.1 Group savings-credit performance/economic benefits The weak performance of the farmer field schools in Ruhoma and Darajani can
certainly be linked to unfilled expectations of many group members to obtain
(immediate) economic benefits. While all of the three groups were told that group
members are expected to volunteer, that no individual renumeration will be provided,
and that the goal is that the collective harvest shall be distributed among all members,
many participants in Ruhoma and Darajani quit the exercise due to the lack of material
benefits. Development actors believed that group members would volunteer until they
receive the benefits from the harvest, but as the examples in Ruhoma and Darajani
show, this was not automatically the case. Many participants seemed to carry out a kind
of cost-benefit analysis with regard to their participation in the collective group
exercise. Many then concluded that participation was too much of a risk, as they
contrasted the amount of benefits they will get from the exercise with the labour they
are required to provide. Although the facilitator and project staff tried hard to convince
farmers of the value of the knowledge/traning they receive, for most this was just not
enough to justify continuing participation.
People understood that the demonstration farm is about learning. But some people thought that if you return with some money for cooking oil, it would have been good. Now it was seen that they went once to Liwale, and then afterwards everyday they go there and they don’t get anything. This broke their heart. This is why it has come to this situation. (R Interview 01) And also if you farm, you won’t be provided any help, money, to use for certain ways. It seems that we do this work like volunteers. There are no benefits at all. So the ones who started to farm, I haven’t seen the benefits for them (M Interview 41)
In the situation of Ruhoma this became striking after group members accused the
facilitator to delay the delivery of seeds. This caused many to give up on the project
thinking that they will certainly end up with a bad harvest of maize. In their view to
continue to provide free labour was counterproductive. In Darajani and Mihumo the
Conservation Agriculture project was introduced in late November in 2011. For the

237
group members of Darajani this delay meant that they would almost certainly get a bad
harvest. This caused some to leave the group immediately and others not long after the
first few meetings. While the delay affected both groups in Mihumo and Darajani, it
was much more of a factor to the newly established Darajani group, because, in contrast
to the group in Mihumo, they still had to find and prepare a plot for the demonstration
farm before they could begin the exercises. The late start of the project caused severe
labour constraints, as everybody was very busy working on his/her own fields, and
disillusionment as the planting season had begun a long time ago. With time it became
too risky for many to work on the collective farm with little prospects for success at the
cost of losing time on their private fields. Once they realised that no money will be
provided for their team efforts, most participants decided to leave.
We meet on the streets and ask: so did you go there today? I won’t go today because of work at home. There is a lot of work on my farm, I can’t do this work too. Better I quit. So every day some people quit and the number reduced in the group (M Interview 38)
Some people left before preparing the field. Some left when we were digging the holes. They started to leave. They thought that they would get money. (M Interview 27)
Alongside the requirement to provide labour for the group exercise, both groups were
confronted with the challenge to purchase inputs for the demonstration plot. Although
groups in Darajani and Mihumo were provided with some agricultural inputs they did
not receive poison or pesticides to combat pests and diseases. This became a problem
once the cowpeas on both plots got infested with pests and rats started to damage the
maize. Group members requested assistance but the facilitator and LIMAS project staff
argued that groups should cover these costs themselves. According to group members
the acquisition of external inputs represented a challenge for the Darajani group as no
group fund had been established and individual members hesitated to provide their own
money. Moreover, no loans were provided to them, which could have helped them to
acquire the inputs.
But now we always complain that we struggle with the rats. But they don’t listen and we only started the group recently. Where do we get the money to buy poison? Or to spray the pesticide? We don’t have the money. We just leave it. We don’t have salt at home, do you take money to buy pesticide for the demonstration farm? (M Interview 40)

238
While these factors were also problematic to the Mihumo group, they were in a better
position because they had the advantage of an already intact history of collective
farming, functioning group management and working system, which enabled them to
continue more easily with their collective exercise. Although group members also told
me that they do not have the capacity to obtain the necessary inputs, they managed to
get a loan from somebody to purchase and apply the pesticide on their farm.
8.3.2.2 Governance and Leadership Weak leadership and the lack of clear and agreed-upon rules definitely contributed to
the high drop out rates in Darajani and Ruhoma. The chairman of the farmer field
school group in Darajani did not follow up on the people who quit. He did not even
bother to ask why they left the group. While he continued to run the activities required
to keep the farm alive, he failed to sanction wrong behaviour and provide incentives for
members to stay with him. At the same time participants too did not bother to excuse
themselves for their absence. Every meeting less people than previously came to the
demonstration plot, the others simply did not show up. At the end he was left with only
three colleagues that stayed.
We did not follow up on those who left. But after we agreed that we would work on this day we visited all the people and said tomorrow is farming. Then tomorrow they did not come. We just left it. We planned another day. Every day we said: why do we follow up on them and they don’t want? We knew that they don’t want. We said if we go on certain days then it is only us who go. And there was nobody who came to ask how are you guys doing. People knew that they failed (M Interview 40) [Andreas: Has the chairman come to you yet to ask you?] No. He just sees us as lazy people. He hasn’t asked us yet. Maybe the others but not me. He hasn’t called a meeting yet too (M Interview 38)
Good governance and leadership also includes effective communication channels where
information can be disseminated to group members. Communication was a serious
problem. Information about group meetings, cancellations or changes, inputs and future
plans was not always communicated to all group members. Sometimes group members
obtained false information about the project, which in one case led to the dropout of one
member in Darajani, because he thought that the group had collapsed already.

239
In the Mihumo group better governance and leadership contributed to the sustainability
of the group. The leaders of the group were well respected and looked upon. Their
instructions were generally followed without much questioning. The group drafted a
constitution that penalises unexcused absence with 1,000 TShs (0.6 USD). While this
penalty was generally not executed, the agreement seemed to contribute to the practice
to excuse oneself if attendence is impossible. Some members told me that if people
become too lazy they are requested to leave the group or they are excluded from any
harvest.
8.3.2.3 Social capital among group members The existing social capital among the members of the Mihumo group was a major factor
contributing to the sustainability of their Conservation Agriculture project. The Mihumo
group was established in 2005 in the context of an income-generating project related to
crushing rocks. Since 2005, when they were more than 24 members, this group has also
experienced many dropouts, corruption and governance problems. But when the
Conservation Agriculture project arrived, this group had already gone through a
selection process that resulted in the most committed members to remain. Among these
members, who all are women except three men, a bond has been created. They enjoy a
sense of togetherness and responsibility of the group’s performance.
In this group we cooperate well. Many of them are women. We are only three men. The women have a sense of togetherness. Disputes are there. Everywhere with people you get conflicts. But not big ones. And they are very committed. We went there to clear the field and they all worked hard. They took axes and fell trees. But again we just clear the land. We don’t have a donor. They work hard but we haven’t got any financial assistance. (M Interview 35)
Among the group members in Darajani no strong social ties existed. One reason for that
is related to the selection process of the group members. All members were selected at a
village meeting that was organised by the agricultural extension office, who served as
the facilitator of the farmer field school. In this meeting the agricultural extension
officer presented the attendees with information about Conservation Agriculture as a
new development intervention. He further requested volunteers to enlist themselves in
farmer field schools to practice Conservation Agriculture. Apparently the village
assembly was so badly attended that all present women had to join in order to maintain

240
gender requirements in the group. Among them were women who had little babies to
take care of. For them participation represented a challenge from the outset.
In Ruhoma the existing social capital among the group members may have had negative
effects. In this village the members of the farmer field school were not asked to register
at a public meeting. Instead, the facilitator, the TFCG agricultural extension officer, sent
a letter to the village executive officer, requesting him to cooperate with the Mjumita
Network leaders and the village council members to establish a farming group. Twenty
farmers in total who live in different sub-villages were selected. Besides gender
considerations no clear criteria was provided to the village leaders on the mode of the
selection process. Under these circumstances, villagers argued that the group members
were selected based on kinship and patronage networks. Villagers had expectations to
gain benefits from this exercise, therefore they requested their ‘patrons’ to be included
in the project. Farmers, who would have been more competent and motivated to join the
group, were left behind and unable to participate.
People were chosen based on friendship etc. You take people close to you. To add them as group members. Because if take kind of people to a project of a group. You take him there because you think during the lessons he gets some small money. Maybe in future he will get some assistance (R Interview 06).
8.3.2.4 Social capital between the group members and the external facilitator A crucial factor influencing the performance of the farmer field schools relates to the
relationship between the group members and the external facilitator. The good
performance of the Mihumo group was certainly also due to their long and healthy
relationship with the agricultural extension officer (who served as the facilitator). Group
members commented that he cares about them. They respected his agricultural
knowledge and sense of responsibility. At the same time, the facilitator appreciated their
commitment.
He facilitates us well. We follow him. Every Monday we are together. If he fails to come we know that he went to another farm. But we cooperate well and he comes and educates us. After he goes to a seminar he tells us about what he learnt. So we benefit from his knowledge. He teaches us on the farm. (M Interview 33) AEO helped us well. The knowledge that I am talking about I got from the AEO. He came to the farm many times; until we planted

241
all the crops (M Interview 32)
The same agricultural extension officer was portrayed very differently by the group
members in Darajani. With time considerable problems emerged between him and the
group. The dissatisfaction about the lack of economic benefits, the high drop out rate
and little successes on the farm certainly contributed to the loss of motivation by the
facilitator to lead and facilitate the group. Some group members expressed
dissatisfaction with the entire mode of how this project was run and a sense of
envyness, because the facilitator was the one being taken to seminars and workshops.
The ordinary group members were not taken to any study tours, and they felt the
agricultural extension officer did not transfer the knowledge that he was provided with.
Some did not accept the facilitator as their partner and immediate authority. In their
view the donors should have come and cooperated with them directly. The fact that only
limited inputs and no payments were provided caused anger and frustrations among
some participants, who directed them towards the facilitator.
I think the AEOs have already gone to seminars three times. But we group members haven’t gone. Only the chairman. But they haven’t informed us about what did they learn. The AEO has returned but we did not get any training (M Interview 27) The seminars should be given to the group members. Not to the AEO. Who does the work there? I see it as a great loss. I do the work and you get the salary. Is it possible? So the seminar must be given to the group members not to the AEO. (M Interview 39)
At the same time the agricultural extension officer did not mobilise the group well
enough. He failed to follow up on the high dropout, the challenges participants face and
possible solutions. Participants generally mentioned the book as their source of
knowledge rather then referring to the facilitator. Whenever the agricultural extension
officer came to the demonstration farm his mode of learning resembled more of a one-
way information exchange. From my participant observation there wasn’t much
participatory learning, when group members of Darajani and the facilitator met on the
plot. While he encouraged them to ask questions, group members often remained silent
and followed what they were told. Some had the feeling that they were incapable to
understand what the facilitator explains to them. They had difficulties in learning new
knowledge. So they just copied the work of others without fully comprehending the
purpose of the tasks.

242
In Ruhoma too there was conflict between the facilitator and the group members, which
began with the issue of the delayed seeds. In the view of the facilitator, the failure of the
maize was due to the lack of timely planting rather than availability of seeds. He refers
to the lack of success as a consequence of ‘silent protest’, meaning that group members
refuse to commit themselves to the group work due to personal responsibilities. Instead
of officially leaving the group, they continue pretending to be interested and committed,
but in reality they are not. Therefore, he talks of ‘soft strike’ or ‘silent protest’.
They expected that when they attend training there must be payment again. So someone finds that already he is in the group. Going out abruptly is impossible. So what they are doing is just to have this so called soft strike 'ngomo baridi'. You know? It is a sort of strike but you cannot understand that one. They say, ja ja it is no problem we do this . If you come back you find that ah you know everybody was busy with his families. We are going to do this next week. Even sowing. Guys seeds are here. We plant this way and this way. Okay we are going to plant this very soon. If you go back, planting has not happened (R Interview 29)
Another issue with the facilitator caused more anger among some group members. One
day the facilitator arrived at the demonstration farm in the evening to apply herbicide
against a growing weed population. He had not informed any of the group members and
was only accidentally seen by one of them. Group members felt he should have
informed them in advance and taught them how to apply herbicides. His action
frustrated them and left them wondering about the nature of cooperation. On the other
hand, the facilitator told me that he was very busy at that time dealing with various
issues in several villages. He decided to act quickly to prevent any further weed
infestation without preparing and notifying the group in advance. He intended to discuss
the application of pesticides with the group members on a later date.
8.3.3 Farmer field schools and perceptions of ‘Conservation Agriculture’32 8.3.3.1 No- or minimum tillage In the context of introducing Conservation Agriculture principles and practices the
facilitators explained the negative effects of tilling the soil. Tillage causes the
destruction of the soil ecosystem and should therefore be prevented, except in some
32
I put Conservation Agriculture under quotation mark, because in the village this technology was introduced with other techniques and practices that are in fact unrelated to Conservation Agriculture. To increase readability I won’t use the quotation marks in the text that follows.

243
areas (for rice cultivation for instance). Nevertheless, some farmer field school
participants in Mihumo/Darajani and Ruhoma were of the opinion that ploughing the
land would be useful and practiced more widely if they had the means (tractor, oxen) to
do it. After removing the tree stumps from the fields, they would plough the land prior
to the preparation of the planting pits. Despite the emphasis of the facilitators to
promote zero or minimum tillage, these participants believed that ploughing should be
done at least in some areas to combat weeds and to increase soil fertility. Especially to
get rid of the nut grass weed (Cyperus rotundus), which is a very common problem in
their areas, you need to till the soil. They also pointed at the fact that tilling the land is
already being practiced in both villages but without tractor or animal draught. Farmers
use a large hand hoe to turn the soil upside down and in Mihumo/Darajani some people
got used to make ridges. So far only benefits have been observed from tilling the soil
since fertility increases and weeds are removed. However, because this activity is very
labour-intensive only wealthier families, who employ wage labourers, apply it to larger
areas.
Some farmers wondered why they are being told to farm without the plough while in
the rich countries this technology has been practiced for decades. They refer to the
heavy machinery used in America, Europe and Australia that brings big profits to the
farm owners. To them this advice of no or minimum tillage sounds a bit like a
conspiracy theory to keep the African farmer poor.
8.3.3.2 Mulching Generally all group members agreed to the advice that plant and crop residues should be
left on the field to become mulch. Instead of burning them, as it has been done
traditionally, farmers should practice mulching to increase soil fertility, to improve
water retention, create humus and contribute to the protection of the forest. In fact the
mulching aspect was the most known and appreciated aspect of the Conservation
Agriculture technology to the villagers. However, the development actors’ perception
that mulching was a new invention to the farmers should be questioned. Accounts of
Ruhoma group members speak of lessons they learnt at school about maintaining
permanent soil cover. They learnt about ‘Mdandasio hifadhi’ or ‘Mdandasio tambazi’
as the practice to leave crop residues on the ground and about ‘Mdandasio mabaki’ as
the practice to create compost in a separate place. Apparently at that time they only

244
learnt about it in the classroom while now they see it being practiced on the
(demonstration) farms.
Group members explained to me that traditionally it has been problematic to leave crop
residues on the field, because people were seen to have ‘dirty fields’. Farmers, who do
not clean their field from the residues, have been regarded as lazy. To the ordinary
farmer a clean seedbed represented the outcome of a good farm preparation. Therefore,
to convince farmers to leave their residues on the field will have to address these
cultural perceptions/attitudes. Another challenge is related to the fact that fire can easily
cross from one field to the other. Even if one decides to do without fire, in an
unfortunate situation his field could be burnt due to the practices of his neighbour.
These instances have happened and are usually forgiven without further consideration.
Yes we used fire. We farm and we set fire. They said there are losses and benefits to using fire. We used fire because we thought the farm is dirty. We did not know that it was natural fertilizers. (M Interview 33)
Another barrier to mulching in the past was related to wildlife. When crop residues are
left on the field villagers fear the attraction of animals like rats, which then cause
damage to their fields. They feed on crop residues and multiply in their numbers, which
causes further distress in the next season, as they like to raide farms for the crop seeds
during the time of planting.
In contrast to other areas in Tanzania mulching does not contribute to further conflicts
between livestock keepers and farmers. In some areas the grazing of crop residues by
livestock is a common practice. If farmers decided to exclude livestock keepers from
accessing their fields this would cause serious disruptions to longstanding cultural
practices and increase the challenges of obtaining livestock feed. In the Lindi region in
general there haven’t been conflicts because of the vast lands available and the
relatively few livestock keepers.
8.3.3.3 Crop rotation Also the advice regarding crop rotation was theoretically welcomed by many of the
group members. They agreed to its benefits with regard to soil fertility and combating
pests and diseases. Among the ordinary villagers this practice was apparently not well

245
known. Intercropping was practiced instead. Often when I questioned villagers on the
value of crop rotation they explained to me that they do not have the capacity to manage
several fields each having one or two crops only. To cultivate one acre of maize here,
one acre of peas there and another acre of millet somewhere else would be impossible
do to labour and capital constraints. When I replied that they could do crop rotation
even on a one-acre big field, as they are practicing on the demonstration plot, they first
seemed to be a bit surprised of this suggestion and then agreed to it.
And we learned that if you farm maize and it is harvested, don't go back there and plant maize again. You need to change. They told us about crop rotation. You put maize, you remove them, then you plant cow peas. If you continue many rotations you can plant tomatoes, and again maize, but don't just harvest maize and plant maize again (R Interview 17)
8.3.3.4 Output and costs Many group members confirmed the development actors’ view that Conservation
Agriculture would lead to increased outputs. It would lead to extraordinary outcomes,
nine times the current amount, according to some. At least theoretically, so they said,
because so far the intervention has come too recently only with no clear benefits to
show as of yet. It is clear that their positive judgement of Conservation Agriculture’s
improved productivity was infuenced by an image of Conservation Agriculture as a
package of modern agricultural techniques. This package includes productivity
improving technolgy such as better planting and the usage of external inputs that is not
directly related to the principles and practices of Conservation Agriculture. Yet to the
group members Conservation Agriculture represented ‘professional farming’ at large,
not a particular type of it. Given this situation it is unsurprising that group members
spoke highly of its potential outputs.
If you are determined you get a big harvest. If people are determined they get a lot of food. For us CA is new. They say from one acre you can get 27 sacks of maize. You can’t get this amount if you farm traditionally. You get 3 or 4 sacks. If you really follow the advice you can get (M Interview 36) If you farm one acre you get lots of crops, because you farm professionally. This means for example using measurements, to dig holes using measurements, to put fertilizers, lime to reduce the acidity ‘kali’ of the soil. You put soil and fertilizers. After you cover it the crop will grow well. And the farm can be used for a long time. You put the residues aside and plant in the same holes.

246
You put again fertilizers and continue to plant. You can use the farm for many years (M Interview 32)
Although villagers were generally optimistic about the productivity of ‘conservation
agriculture’, they were also aware of the considerable costs that this strategy involved.
In fact the costs for the external inputs were the single most discouraging factor to the
ordinary villager to follow their colleagues on the demonstration plot. People complain
that they do not have enough money; that they suffer from food shortage and struggle
with daily life expenses. To expect that they now invest in expensive fertilizers and
other inputs is unreasonable. On the other hand several group members told me that
even the ordinary villager can invest in external inputs if he/she manages his/her budget
well. If they start with a small area, something like ¼ of an acre, they should be capable
of purchasing the inputs necessary to follow conservation agriculture.
CA is good and it results in a lot of crops. But here we are not able. The problem is: for CA you need to spend a lot. You need fertilizers. If you just plant you won’t get anything. And here we use a lot of efforts to farm 4 or 5 acres but the harvests are little. With CA you can farm a small area if you use what is required then the income will be more compared to the big area. (M Interview 36) The work is good. But one thing for us here is the availability of fertilizers. Because fertilizers are very expensive. So this farming will be difficult for farmers. If you comply to get fertilizers then this farming is very easy to outperform other farming (M Interview 44)
Besides of the affordability also the availability of external inputs constitutes a problem
to some farmers, especially for those who live far away from the village centre. At
certain times of the year, the planting season for instance, everything must be available
on time within a short period. Given the inadequate communication and transportation
infrastructure farmers face big challenges in obtaining the inputs in due time. To this
come the challenges of the right application of inputs on the field.
8.3.3.5 Workload Unlike the development actors the group participants were a bit more cautious with the
statement that Conservation Agricultre reduces the workload for the farmer. Because in
both villages the technology was introduced in combination with the preparation of
planting pits, most group members felt that the workload increases during the

247
preparation of the field. To dig the holes based on exact measurements was something
new and took much longer than their traditional practices. This impression was also
widely spread among ordinary villagers, who had heard of the activities carried out in
the demonstration plot. However, group members also remarked that with time this new
labour task becomes easier and people will get used to the new mode of preparation.
Because the holes can be used every year, the task of digging them doesn’t have to be
repeated after every harvest. The crucial aspect regarding labour requirements is the
need to practice good time management, to prepare the field early and to plant and weed
at the right times.
You know, they say it is a lot of work, because they haven’t tried it yet. Also we, we said this is a lot of work. We dug the holes but we didn’t know exactly. The importance is that you start early, then it is not so much work. But if you start when the rain has come already, then it is hard work. You need to start early. In June or July. You dig holes until October. (M Interview 26)
On the first day we thought to dig holes is hard work. But by now we think it is an easy work. Because we got used to it. And to weed is also easy. It is very easy. (M Interview 33)
Some group members claimed that weeding becomes less due to Conservation
Agriculture. However, this was more the case because part of the Conservation
Agriculture package related to planting in rows, which enabled the farmer to weed
quicker between the crops. Because of the newness of the intervention in the village no
profound experiences that could show a decrease in weeding requirements have been
observed.
CA reduces the work for the farmer in terms of weeding if you cooperate well. With kilimo sensa you must weed three times. And with CA you don’t weed three times. And even if you do, the weeds won’t be a lot (M Interview 35) To weed is also easier because you follow the rows. The weeds stay in rows. And also to harvest is easier. You follow the rows. But our farming is very labour-intensive. (M Interview 36)
8.3.3.6 Conservation Agriculture protects the environment Group members understood the contribution of Conservation Agriculture to forest
protection. Given that under Conservation Agriculture farmers will be able to cultivate
one piece of land continuously, they are no longer required to open up new fields in the

248
forest. Although this assumption was widely spread and repeated regularly in meetings,
farmer field school sessions and informal conversations, it does not hold in practice
unless wider governance issues are addressed. This was also recognised by the TFCG
who state in their agricultural development strategy for the Lindi region:
We recognise that in Lindi improving agricultural productivity will not necessarily lead to reduced deforestation. Interventions that aim to increase productivity by shifting to more cash crop production, mechanization and increased capital may result in an increase in deforestation. As such, this strategy should not be viewed in isolation but as part of the project’s broader strategy to improve the sustainability of land and natural resources management within the project area. Other project initiatives, particularly village land use planning and community-based forest management, provide a critical ‘policy context’ within which this strategy will be implemented (TFCG, 2012 p. 6).
The notion that increased productivity may lead to agricultural expansion was observed
during some of my interviews with group members. When asked about what they would
do with the increased income from their harvests, some of them replied that they would
invest in labour to expand their farms for crop cultivation. Farmers find themselves in a
poverty-stricken situation where farming is their only source of income. It is easily
understandable that substantial income increases would be invested in expanding
agricultural production in order to meet future food and livelihood demands. The other
suggested environmental benefits such as water and soil protection were all recognised
by the group members. It made sense to them that mulching, crop rotation and
minimum tillage contributes to a healthy soil ecosystem.
Proponents of Conservation Agriculture often highlight the reduced need for external
inputs, which has positive effects on the environment. Less fertilizers, pesticides and
herbicides means less energy and resources needed to produce these items. Contrary to
these statements were the perceptions by the group members in Mihumo/Darajani who
claimed that to practice Conservation Agriculture you rely a lot on external inputs.
Fertilizers, lime, seeds, pesticides, organic manure need to be purchased to follow this
agricultural strategy. It would indeed be interesting to compare the environmental
destruction caused by contemporary forms of agriculture with the environmental costs
produced when introducing Conservation Agriculture in the villages. Due to the fact
that all external inputs are manufactured far away from the villages, some of them very

249
far indeed, the environmental damage caused by the production and transportation could
be substantial.
8.3.4 Spreading knowledge via farmer field schools to villagers 8.3.4.1 Awareness of Conservation Agriculture among villagers The stated aim of the farmer field schools was to disseminate knowledge about
Conservation Agriculture among all villagers. As a demonstration plot, the collective
farm should serve as an example of the methods and benefits Conservation Agriculture
apparently offers. Group members in both case-study sites were well aware of this
expectation. They knew that the objective was to become teachers for their fellow
villagers. Some had indeed high aspirations in their mission to educate their neighbours
in ‘professional farming’. Despite this, no group succeeded in creating a wave of
adoption of Conservation Agriculture principles and practices among all villagers. In
fact the objective to spread information about this new technology was only met in
Ruhoma but failed to materialise in Mihumo/Darajani. As the graph below shows, the
majority of the villagers (79%) in Mihumo/Darajani stated that they have not heard of
conservation agriculture. This sounds surprising but I experienced it several times
during my stay in the village that most ordinary farmers were unaware of Conservation
Agriculture as a new technology to improve farming.
Graph 8.1 Awareness of Conservation Agriculture in Mihumo/Darajani
When I discussed this problem with members of the farmer field schools in Mihumo
and Darajani their explanation was that people have not been mobilised as of yet.

250
Especially for those residents who live outside of the village centre there haven’t been
any well-planned strategies. While the group members did not have any concrete plans
to mobilise their fellow villagers, the facilitator and LIMAS staff were in the process of
preparing the farmer field day, which takes place every August. It was envisaged that on
this day villagers would visit the demonstration plots in the wards to learn about their
progress and challenges. In addition to the lack of mobilisation, people did not come by
themselves to the demonstration plot to enquire about the intervention and its progress.
Apparently, they did not see the value in doing so, at least not before the group had
achieved any substantial benefits.
You can’t force them. You can’t force my husband. The lessons I get I need to teach him. We need to educate villagers. We need to take 10 to 15 people and teach them CA. But they don’t agree. They think they waste time when they go there. If you have money then we come. If you don’t have posho we don’t have time to waste. Can you force him? (M Interview 31)
In Ruhoma most of the villagers (71%) knew about Conservation Agriculture. Ruhoma
is a much smaller village compared to Mihumo/Darajani and therefore information
spreads much more easily. In addition, much fewer people live on their farms and if so
the distance from the farm to the village centre is short and regular visits are common.
At the same time, because of REDD+ and the trial payments, the residents were much
more aware of all development interventions that were taking place. They were more
involved in decision-making processes and project implementation. At the same time it
seemed that especially in the beginning the TFCG put much efforts in initiating the
project. Ten members of the group were taken to Liwale on a study tour before all of the
twenty members received lessons during a three day long seminar in the village.

251
Graph 8.2 Awareness of Conservation Agriculture in Ruhoma
8.3.4.2 Perceptions of CA A follow up question was asked to those respondents, who stated that they have heard
of Conservation Agriculture. They amounted to 16 and 27 people in Mihumo/Darajani
and Ruhoma respectively. Among the respondents in Ruhoma a much more positive
picture about Conservation Agriculture can be observed compared to respondents in
Mihumo/Darajani. From the 27 respondents 21 and more believed that Conservation
Agriculture reduces the workload, increases the output, reduces the requirements for
inputs and is suitable for their farms.

252
Graph 8.3 Perceptions of Conservation Agriculture in Ruhoma
While the vast majority of the respondents in Mihumo/Darajani also believed that
Conservation Agriculture increases the output and is suitable to their farm, 11 out of 16
were unsure or negated the assumption that it reduces the workload, and 11 out of 16
were unsure or negated the statement that it reduces the requirements for inputs. In their
view Conservation Agriculture leads to better outputs but require more input of labour
and capital to achieve that. The technology was associated with the purchase of modern
inputs, predominantly seeds and fertilizers, because this happened at the demonstration
plot. This was different to Ruhoma where group members were provided with modern
seeds only. No fertilizers, no lime, no manure, etc. were provided. The herbicide, which
the facilitator used, was purchased from his own money and was of little amount.
(Ruhoma; n=27) Conservation agriculture...
0
5
10
15
20
25
30
Yes No I don't know
reduces the workloadincrease s the output
reduces requirements for inputsis suitable for your farm

253
Graph 8.4 Perceptions of Conservation Agriculture in Mihumo/Darajani
8.4 Conclusion In this chapter I examined development actors’ objective of promoting ‘Conservation
Agriculture’ in the study villages in order to reduce the pressure of agriculture to
forestland. This chapter therefore primarily addresses research question 3: “How do
REDD+ initiatives aim to address the drivers of land use change in Lindi, Tanzania?”
Indeed, it is logical for REDD+ projects to employ strategies that aim to address the
primary drivers of land use change in order to protect forests. In Lindi, Tanzania, and
across the whole of Sub-Sahara Africa, development actors have commonly promoted
the view that in applying ‘Conservation Agriculture’ techniques, villagers can increase
their agricultural outputs, thus pursuing economic development opportunities, without
having to extend their fields further into forests. In this way, I argue, development
actors introduce ‘Conservation Agriculture’ as a ‘green technological’ win-win solution
to ‘problems of environmental degradation’33, rising global food demand and economic
development. In analysing the various practices and techniques that development actors
include under the name ‘Conservation Agriculture’ I argue that Conservation
Agriculture is communicated to villagers in the form of an agricultural modernisation
package that includes aspects that are de facto unrelated to this technology. This makes
critical assessments over the costs and benefits of Conservation Agriculture to REDD+
initiatives difficult, if not impossible, leaving us with much uncertainty about the
33 I put this under quotation marks as it depends on the beholder whether certain land use changes are problematic and to be referred to as environmental degradation (see also chapter 5).

254
potential of this particular technology to address the drivers of land use change in Sub-
Sahara Africa (cf. Giller et al., 2009)
I then examined the performance of farmer field schools, which were established in
both villages to disseminate knowledge of Conservation Agriculture in a participatory
and community-driven way to villagers. My findings clearly illustrated the limited
success of this approach and they highlight the importance of socio-economic factors
and group dynamics in shaping the outcomes. Drawing on insights from Islam et al.
(2011) I specifically discussed how economic benefits, governance and leadership,
social capital among group members and social capital between group members and the
facilitator considerably influence the performance and outcome of this extension
approach in my case study sites.
In the third and last section of this chapter the perceptions of group members and
villagers of Conservation Agriculture were discussed. From my qualitative and
quantitative data it becomes apparent that villagers do not automatically support all
techniques and practices of this technology. Tilling the soil, for instance, remains
widely appreciated by villagers, and the assumption that Conservation Agriculture
reduces requirement of inputs has been questioned by many in Mihumo/Darajani (cf.
Giller et al., 2009).
All in all, this chapter illustrated how Conservation Agriculture and farmer field
schools, which have been promoted as the win-win technical solution to support
REDD+ and agricultural development, face significant socio-economic and political
challenges on the ground (cf. Baudron et al., 2012). These findings are important as
agricultural development, which is the primary driver of land use change in the villages,
is tightly linked to villagers’ possibilities to protect forestland. By looking at
Conservation Agriculture in this chapter I once again emphasised the role of socio-
economic and political processes in the village that shape the possibilities and
constraints of villagers concerning their livelihoods and different land use options.

255
Chapter 9: Conclusions 9.1 Introduction
UN-REDD provides an antidote to those who think that international climate negotiations are failing to bear fruit.34 (Achim Steiner, Executive Director of the United Nations Environment Programme)
Amid cheers and applause negotiators announced the completion of the REDD+ program design. We now have a complete definition of what the program is, how it works and how participants will be paid. This program is a fabulous example [of] the U.N. climate process in action. Parties came together, worked through the tough spots and negotiated a program that will effectively address climate change. REDD+ will save forests, benefit communities and reduce emissions.35 (Pipa Elias, REDD+ and agricultural expert for the Union of Concerned Scientists)
The above quotes echo the widespread praise for the alleged success achieved on
REDD+ at the latest Conference of the Parties under the United Nations Framework
Convention on Climate Change in Warsaw late 2013. At this summit a package of no
fewer than seven decisions was produced, which has become known as the “Warsaw
Framework on REDD-plus”. The efforts by the negotiators to finalise the rules for
REDD+ programmes and projects across the developing world were celebrated as the
“signature achievement” of the conference that drew to a close on 23 November 2013
(BBC, 2013b).
The achievements made on REDD+ apparently rescued an otherwise failed conference
that was broadly criticised for its extraordinary lack of progress and ambitions
(Economist, 2013). Only two days before the end of the negotiations more than 800
people from non-governmental organisations, social movements, trade unions,
indigenous people associations and other groups walked out from the talks, withdrawing
in protest from a conference that was delivering “virtually nothing” (Guardian, 2013).
Hosted at a time when the Philippines were ravaged by the devastating Typhoon
Haiyan, illustrating just how much damage extreme weather events can have on 34 http://allafrica.com/stories/201311250884.html 35 http://www.rtcc.org/2013/11/22/warsaw-climate-talks-final-day-live-blog/

256
developing countries, the conference’s lack of agreement on how to tackle rising
greenhouse gas emissions caused widespread anger and frustrations (ibid).
Amidst conflicts, blaming games and deadlocks over future commitments, the consenus
and dedication that international negotiators from all over the world showed in taking
REDD+ forward is therefore a clear sign of making the conservation, protection and
sustainable use of forests a key pillar in future climate agreements. This ambition was
further illustrated by the decisions of the governments of UK, US, Norway and
Germany to transfer 280m USD to the World Bank’s BioCarbon fund to promote the
sustainable use of land in developing countries (Guardian, 2013).
The outcome of the latest COP takes us further into a situation where governments
across the world push forward a certain approach to forest and land management in the
developing South under the banner of climate change mitigation efforts. The
governments are joined by a large network of global players, consisting of private
companies, international finance institutions, non-governmental organisations and
research institutions, who all show their willingness, capacity and financial readiness to
protect forests as they function as the “world’s lungs” in the fight of global climate
change.
This dissertation sought to contribute to the debates regarding REDD+ by critically
examining how this globally initiated and promoted approach of forest protection plays
out at the most local level in rural Southeastern Tanzania. As with any other global
policy or development intervention, the on-the-ground implementation of REDD+
initiatives confronts local realities and contexts that are shaped by specific and
historically produced social relations over forests and people. In launching more and
more REDD+ initiatives across the South, REDD+ proponents set out to change these
socio-natural relations. This makes REDD+ a governance project rather than a simple
mechanism of transferring money to the South for forest carbon protection and
enhancement (Corbera and Schroeder, 2011).
In the pursuit of forest protection for global climate mitigation benefits, REDD+
initiatives aim to transform local forest governance and land use strategies away from
business-as-usual towards conservation friendly practices. In doing so, however, they
confront counter processes that have the power significantly to shape REDD+ initiatives

257
on the ground, making them almost incognizable from their initial design (cf. McAfee
and Shapiro, 2010). The interactions between REDD+ initiatives and counter processes
determine the design and outcome of the REDD+ governance project and consequently
how costs and benefits to livelihoods are distributed among different stakeholders.
Against this background my dissertation aimed specifically to research how REDD+
initiatives interact with local forest governance and land use strategies, and how this
affects local livelihoods, by asking the following research questions in the context of
Lindi, Tanzania.
Research question 1: How do REDD+ initiatives interact with local livelihood strategies
in Lindi, Tanzania?
Research question 2: How do REDD+ initiatives interact with local forest governance in
Lindi, Tanzania?
Research question 3: How do REDD+ initiatives aim to address the drivers of land use
change in Lindi, Tanzania?
I also posed a fourth research question that builds on the findings from the previous
three:
Research question 4: What is the significance of my findings about REDD+ initiatives
in Lindi, Tanzania to broader debates on development theory and practice?
I will now present a summary of my thesis and its main findings in relation to my
research questions outlined above.
9.2 Thesis summary and main findings After an introductory chapter I outline the theoretical underpinnings of my research in
chapter two. In my theoretical framework I first present and then critique the
mainstream conceptualisation of REDD+ as a form of payments for ecosystem services
with insights from more critical bodies of literature on neoliberalism and the
neoliberalisation of nature. I draw on debates within international development and
neoliberalisation of nature to argue that REDD+ should be seen as processes promoting
‘inclusive’ neoliberal conservation. I decided to place REDD+ and payments for

258
ecoystem services into a wider discussion of neoliberalism and its relationship to nature
(conservation) to argue that it is but one of many prominent examples of how the
protection and conservation of nature has undergone dramatic shifts in recent decades,
which have been met with much scepticism by different scholars working in the field of
conservation (Büscher et al., 2012; Brockington et al., 2008; Roth and Dressler, 2012;
Fletcher, 2010; McAfee and Shapiro, 2010).
In discussing neoliberalisation of nature and conservation in depth, I offered important
insights into the underlying processes of REDD+ initiatives, thereby addressing
research questions two, three and four. In addition I emphasised that outcomes are
generally mixed resulting in losers and winners, which provided us with answers to
research question one and four. Research on neoliberal conservation has produced many
insights into the most dominant processes that can be observed when programmes such
as REDD+ meet local contexts. For instance, my theoretical chapter emphasises the
need to think of REDD+ projects not as ‘things’ but as processes of neoliberalisations
(thus my preference to talk of REDD+ initiatives) that never emerge on a tabula rasa or
on a blank sheet, which means that they are inevitably incomplete, contradictory,
unevenly realised and shaped by contextual factors and place-based processes (Peck and
Theodore, 2012; Castree, 2008). This is important as it explains the great variety we see
of REDD+ initiatives across the globe, and even across single villages, despite their
common ideological point of departure. At the same time I pointed out that despite this
variegated nature of REDD+ initiatives we can identify extra-local or almost universal
elements among them, which, drawing on insights from neoliberal conservation, I
argued are: win-win rhetoric, reregulation and territorialisations, commodification of
nature, hybrid governance and eco-subjectivities (Igoe and Brockington, 2007).
Recognising some of the limitations within the debates of neoliberalisation of nature I
decided to draw on international development literature to make the reader aware of the
‘inclusive’ turn of neoliberalism (Craig and Porter, 2006) and to highlight important
findings from current research into participatory approaches and the politics of
development. This was useful as it allowed me to view seemingly progressive elements
of REDD+, such as local participation, tenure security, good governance, and
democracy, as part and parcel of the ‘inclusive’ neoliberalisation process. These
welcome features do not refute the neoliberal character of REDD+ initiatives; instead
they illustrate their 21st century character as observed also in other areas (Ballard, 2013;

259
Hickey, 2010; Craig and Porter, 2006). Bringing these two bodies of literature together
helped me to shed light on the opportunities and constraints of participatory approaches
(Hickey and Mohan, 2005) under neoliberalism, and recognise the potential spaces of
empowerment and the role of power struggles and politics (Hickey, 2008) entailed in
‘inclusive’ neoliberal conservation.
For data collection I decided to make use of ethnography as my overall research
approach within a critical realist position to science. I considered an ethnographic
approach to be ideal to study how REDD+ initiatives interact with livelihoods,
governance and land use drivers in Lindi, Tanzania. Ethnography with its focus on close
and detailed observations of people and actions in their ‘natural settings’ (Atkinson and
Hammersley, 2007) allowed me to conduct an in-depth analysis of how livelihoods,
power and politics in two villages in Lindi Region of Tanzania shape the emergence of
REDD+, always taking into account people’s own views and opinions. In concentrating
on two case study sites only, I was able to employ a range of qualitative (participant
observation, ethnographic and semi-structured interviews, focus group discussion and
document analysis) and quantitative methods (household survey) over a period of 11
months, which resulted in rich and meaningful anwers to my research questions.
Within this overall ethnographic strategy I employed a mixed-methods approach to
triangulate findings and to harness the strength of each method, which contributed to
more reliable, complete and robust findings (Creswell, 2008). In researching the
emergence of REDD+ and its processes of neoliberalisation in an ethnographic fashion,
I could maintain the theoretical focus outlined above while simultaneously remaining
flexible and open to all kinds of data generated in the field. This openness resulted in
many surprises during the fieldwork of which one led to a whole chapter on
Conservation Agriculture. However, ethnography is not without challenges and I
discussed my personal experience of them and the coping strategies employed in that
chapter. To strengthen the validity and reliability of my ethnographic findings I also
openly discussed issues of reflexivity and ethics to ensure transparency throughout the
research process.
I explicitly begin to answer my research questions in chapter four, which presents
information on the livelihoods of villagers in the two case study sites, largely drawing
on the results from my quantitative survey. This chapter therefore contributes to

260
answering research question 1: “How do REDD+ initiatives interact with local
livelihood strategies in Lindi, Tanzania?” From this chapter we learn that Lindi Region
of Tanzania belongs to the poorest places in the world when we consider the cash
incomes generated over a year. In general there is widespread poverty in the region,
which expresses itself in poor infrastructure (water, electricity, houses), low
consumption rates, food insecurity, lack of assets, low education levels, low income
levels and low levels of mechanization in agriculture. At the same time my data
illustrate the existence of inequalities in these seemingly homogenous villages in
Southeastern Tanzania. In both villages wealthy households obtain several times the
annual cash income of poorer households. When we take a closer look at the sources of
annual cash incomes my data show that crop production remains the main income-
generating activity across all wealth classes, but off-farm income sources such as
business, services, craftsmanship and off-farm wage labour are of great importance to
generating wealth. Livelihood diversification is an important trend in both villages,
whereby wealthy households managed better to diversify their incomes, which makes
them less dependent on the production of crops on land for obtaining cash. The poor, in
contrast, derive much of their income from farm-related sources, which makes them
heavily dependent on fertile land and agricultural labour markets for generating money.
Against this background of rural poverty and inequality I argue that REDD+ initiatives
must grapple with the urgent need for inclusive economic development if they want to
gain popular support among the rural population. In other words they must offer
equitable and tangible material benefits to villagers, otherwise their risk of contributing
to social and environmental injustices and human impoverishment are real and potent.
As part of the need to promote inclusive economic development, it will be important for
REDD+ interventions to address local inequality in the villages. In saying so I join
Andersson and Agrawal (2011) who demonstrated that economic inequalities within
and between groups negatively affect forest conditions. Given my findings about the
importance of off-farm livelihood activities to generating wealth in the village, it may
not be enough for REDD+ to focus on strong collective forest governance institutions as
suggested by Andersson and Agrawal (2011). Off-farm income sources have been
crucial for wealthy households to generate wealth, whereas money is likely to flow back
and forth between off- and on-farm activities. In this context, I argue that both farm and
off-farm livelihood strategies must be considered by REDD+ interventions to make
wealth distribution more equal, and forest conservation more equitable in the villages.

261
Despite the visible trend of livelihood diversification in both villages, crop sales remain
by far the single most important cash source. The production and sale of crops, as the
most important livelihood activity for villagers in Lindi Region, manifests the
continuous dependence on land for human and economic development. This
dependence cannot be simply described as ‘shifting cultivation’ as project proponents
do in the case study sites. Instead, I argue farmers practice a more complex form of
agriculture that makes use of fallow rotation, and intensive cultivation of temporary and
permanent farms. Seeing livelihood practices for what they are is crucial to understand
local responses to conservation and development interventions, including Conservation
Agriculture as discussed in chapter eight.
In examining crop production in the villages I could also show that land use is
influenced by the type of integration of villagers into the global economy, expressed in
what cash crops they produce for international markets. Because villagers in
Mihumo/Darajani concentrate on cashew nuts, which grow on perennial trees, as their
main cash crops, they cultivate a much larger extent of permanent farms compared to
farmers in Ruhoma, who focus on sesame production on temporary farms to generate
cash income. This demonstrates that seemingly remote places such as villages in Lindi
Tanzania are firmly integrated into a globalised world of commodity production and
exchange, which influences the local livelihood choices of rural farmers. As REDD+
initiatives aim to introduce another commodity – the carbon credit – into this web of
connections they further complicate land use options on the ground. In competition over
fertile village land REDD+ initiatives are but one among many global and local
processes targeting local land use strategies of African farmers.
The proposition that REDD+ must consider how global and local processes shape
livelihood strategies is widely acknowledged (Corbera and Schroeder, 2011; Angelsen,
2009). On the basis of my analysis I add to it and argue that REDD+ initiatives must go
even further and consider how different wealth groups within the village use land for
their livelihoods, if a broad consensus is to be established. As wealth shapes how village
land is used for the production of crops (in both villages wealthy groups cultivate larger
temporary and permanent farms than their fellow residents, they keep less land fallow
compared to poorer and middle-income households, and they generate higher values per
hectare farmland), the opportunity costs of alternative land uses to forest protection

262
differ between wealth groups in the village, which influences the costs and benefits of
REDD+ to them.
Building on the insights from chapter four, I set out to examine the material and
discursive effects of REDD+ in chapter five. The fifth chapter therefore contributes to
answering research question 1 “How do REDD+ initiatives interact with local
livelihood strategies in Lindi, Tanzania?” and partly research question 3 “How do
REDD+ initiatives aim to address the drivers of land use change in Lindi, Tanzania?”
The chapter showed that villagers from the two case study sites experienced forest
protection very differently. While in Ruhoma villagers generally felt that they benefited
both collectively and individually from the protection of the forest, the opposite is true
in Mihumo/Darajani. I explained this divergence by drawing on interviews with
villagers, who illustrate the lack of material benefits residents of Mihumo/Darajani
obtained from the forest reserve. Although expectations of future carbon payments in
combination with timber harvesting were created among residents in Mihumo/Darajani,
participatory carbon assessment activities were still ongoing and therefore no clear
information or plan existed about the amount, modalities or possible date of payments.
In contrast, the disbursement of REDD+ trial payments in addition to other non-
monetary benefits in Ruhoma resulted in a sense of happiness about the decision to
protect the forest. The large sum distributed to individuals contributed considerably to
the annual cash income of poor and middle-income households making up 74% and
39% of their mean cash income per adult equivalent respectively.
This contrasting experience contributed to villagers’ oppositional perceptions over the
effectiveness of conservation and the condition of the forest in the villages. While the
benefits received in Ruhoma contributed to positive attitudes towards conservation, the
population in Mihumo/Darajani expressed general dissatisfaction, frustration and
disappointment about the forest reserve. These findings re-emphasise my argument that
REDD+ must offer tangible and equitable material benefits to communities and to
livelihoods of villagers directly if popular support and legitimacy for forest protection is
to be achieved. They further show that carbon payments, if distributed equitably, could
be very significant to poorer and middle-income groups of rural populations. The
payments were largely spent on food, alongside clothes, because when they were
disbursed in February many villagers found themselves in a situation of food shortage.
As February is usually a month characterised by low or no cash savings of villagers, the

263
disbursement of the payments made money worth a lot to villagers at that time. This
illustrates how not only the amount but also the time of payment is important to
villagers. As poor people depend much on casual farm labour for supplementary income
(see chapter 4), the significant contribution of trial payments to their incomes may assist
them in applying their labour power on their own farm as opposed to selling it to other
farmers. This could have positive effects towards addressing local inequality and hence
forest protection.
While project proponents and village leaders in Ruhoma ensured an equitable and
transparent distribution of REDD+ trial payments, other benefits were unequally
distributed according to survey respondents. It seems that wealthier village groups could
benefit more from additional benefits and development opportunities from REDD+
through workshops, allowances, permits and participation in activities. More than 80%
of survey respondents in Ruhoma felt that village leaders, committee members or other
few people benefited more than the rest of the community from the protection of the
forest. This result points at the considerable challenge of preventing elite capture within
communities as some benefits will automatically benefit some residents while excluding
others.
The fact that REDD+ trial payments were largely spent on food demonstrates the
existence of food insecurity as a real problem to villagers. This also explains why
villagers saw trade-offs of REDD+ primarily linked to food production. Some villagers
argued that protecting the fertile forested land makes farming more difficult as they
expect lower returns and more damage from wildlife. Fears over economic and physical
displacement were prevalent in both villages and forms of displacement occurred on an
individual basis in Ruhoma.
Although carbon payments are the primary means to balance trade-offs inherent in any
REDD+ project, some villagers criticised them for their low amounts and for the
uncertainty that remains over their future existence. Despite the fact that trial payments
were calculated on the basis of optimistic assumptions about potential future carbon
payments (conservation success and carbon price), my own calculations of the
opportunity costs showed that poor, middle and wealthy households forgo benefits of
USD 21, USD 350 and USD 572 respectively per hectare protected forestland. Hence,
future carbon payments are unlikely to cover the opportunity costs particularly of

264
medium and wealthy village groups. While they could cover the opportunity costs of
poor households, they only do so as long as they remain poor. Once households become
wealthier their opportunity costs increase and forest carbon payments become less
beneficial.
Although one could argue that in monetary terms villagers lose more from the
protection of forest land than they gain from REDD+ trial payments, many villagers did
not perceive these losses as such with the exception of a few who complained about the
smallness of the sum. While this could be the case because of the nature of payments, as
forest carbon money represents kind of immediate free cash with the consequences only
to be felt later, I argued that development actors’ way of introducing and promoting
REDD+ played a significant role too.
Especially given that both villages have not actually succeeded in producing and selling
carbon credits to buyers, making the REDD+ initiatives and their material benefits
dependent on state and donor funding from European governments, it is pertinent to ask
why villagers have decided to set aside considerable village land under forest reserves.
On the basis of qualitative interviews, document analysis and ethnographic data I
argued that state and non-state actors used a combination of crisis narratives and green
development discourse in the villages to present the commodification of forest carbon
as the optimal way of generating economic and environmental benefits to rural
residents. The clearing of forests for agricultural purposes was presented as
environmentally destructive although in Mihumo/Darajani, for instance, no concrete
data on land use change was available in the village. I therefore argue that REDD+
initiatives come with discursive strategies to persuade villagers to protect considerable
areas of village forestland. Furthermore, I argue that, at least in the short run, discursive
effects of REDD+ can be as decisive as material effects to influence villagers’
livelihood decisions and land use.
Closely linked to the received benefits and costs of REDD+ initiatives are the politics
over the establishment of the village land forest reserves, which I examined in chapter
six. This chapter contributed to answering research question 2: “How do REDD+
initiatives interact with local forest governance in Lindi, Tanzania?” I argued that the
establishment of community-based forest management, specifically the demarcation of
village and forested land, entail processes of territorialisation, which are technically

265
complicated and deeply embedded in local politics and power struggles. I illustrated
how specifically in Mihumo/Darajani the process of demarcating forest and village
boundaries was technically demanding, politically contested and villagers continuously
depended on external actors to take the process forward, who themselves were
insufficiently resourced and coordinated. Ultimately, this resulted in a long period of
incomplete territorialisation: although villagers received legal ownership over their
forest territory, authority over the use and control was never formally transferred due to
missing approved forest management plans and bylaws. Moreover, because of local
power struggles and politics over votes the village was recently divided resulting in
previously conducted territorialisation processes to become almost invalid.
In the second section I discuss the territorialisation process in Ruhoma that was
characterised by much more success. Despite this it still faced challenges with inter-
village conflicts over forest and village land boundaries. Because of the problematic
way previous boundaries were drawn, the implementation of REDD+ was not a smooth
process. As REDD+ interventions revalued forested land and villages were offered
money for protecting their forests, conflicts emerged over the exact size and location of
boundaries of village forests. In drawing on insights from Ruhoma I showed how the
process of boundary demarcation changes the relations between people as previously
tolerated customary rules of governance became contested.
The findings from chapter six highlight that REDD+ initiatives attempt to change local
forest governance in the villages towards formalised community-based conservation. In
doing so they introduce territorialisation processes, which are shaped by state and non-
state actors. In implementing territorialisation social and historical factors play an
important role. Territorialisation builds on existing notions of territories and boundaries
that have developed over time. In both villages the villagization programmes of the
early 1970s played a big role in creating village lands, but since then population growth
and new village establishments contributed to changing boundaries. This shows that
forests are dynamic landscapes where people continue to move around. The
territorialisation process under REDD+ transforms the landscape into something much
more static, strengthening the idea of assigning villages and livelihoods to specific
places with clear boundaries. While this may contribute to forest protection, it is also
problematic as it reduces flexibility of movement and causes hardship to some,
particularly less powerful, farmers.

266
In analysing the territorialisation processes in both villages my research illustrated that
forest- and village land is valuable to local stakeholders not only for its economic
benefits, but also as a political leverage in struggles over power. The struggles between
villages and district over the landscape and the people it inhabits make the transfer of
power contested on various grounds (beyond natural resource governance). This neatly
illustrates how the commodification of forest carbon is embedded in local politics and
power struggles that considerably shape its emergence and outcomes. The seemingly
technical activities, concerning the formalisation of village and forest boundaries and
participatory land use planning, are in fact inherently political – they shape who gets to
access what (Berry, 2009).
At the same time I argue that some of the technical activities of REDD+ in the villages
resulted in positive change including much attention and international efforts to take the
decentralisation process forward. It has assisted both villages to express their claims
over the authority of village and forestland, helped to address boundary conflicts,
organised village land use planning exercises, financed forest inventories, etc. Although
much more effort and political will are required to meet villagers’ development needs,
the focus of REDD+ on community based forest management has undoubtedly the
potential to contribute positively to the empowerment of local communities.
In chapter seven I examined how villagers actually practiced community based forest
management. It therefore contributes to answering research question 2: How do REDD+
initiatives interact with local forest governance in Lindi, Tanzania?” In both villages
similar community-based forest management institutions were drafted by development
actors, with the participation of village committees, to replace customary governance
arrangements. In introducing ideas of ‘good governance’ via these new institutions,
rights, powers and responsibilities over forest access and use were redistributed and
transferred to formal village institutions, assuming that the separation of powers under
democratic governance would lead to more equitable, efficient and effective
conservation and development outcomes. In the course of introducing these institutions
open-access forests were transformed to common property; new notions of community
insiders and outsiders, legal and illegal forest users and uses were created and
formalised through a sophisticated ‘permits’ system. Non-residents suddenly found
themselves outside of the ‘community’, eligible only to limited forest uses and this

267
often in return of payments. Village residents confronted new complex rules and
regulations that meticulously define and rationalise every prohibited and permitted
activity in the forest reserve.
In analysing actual practices of forest governance in the two villages I illustrate how the
drafted institutions were incompletely adopted by villagers. When examining villagers’
knowledge of the institutions I found out that particularly in Mihumo/Darajani most
villagers did not know the breadth and depth of the governance framework. This relates
to the problem of effective information dissemination in a rural setting of Tanzania.
Nevertheless, in both villages the majority of villagers regard themselves as the owners
and managers of the protected forest, which means that the community has taken on the
most foundational elements of community-based forest management.
Villagers in Mihumo/Darajani generally thought of the forest reserve as a closed-off
area. Interviews attested that entering the reserve would lead to arrest by the village
natural resource committee. The committee therefore took on the role of protecting the
forest while at the same time issuing permits for forested land outside the forest. It
appears that the committee in Mihumo/Darajani focussed on two tasks – issuing permits
and conducting patrols – to accrue money for, at least partly, individual benefits. While
forest management plans and bylaws prescribe rigorous recordkeeping to committee
members, much confusion prevailed in Mihumo/Darajani over the income and
expenses. The confusion over the amount of fines, stories about the handling of illegal
forest users and secrecy over the income and expenses of the committee provide
evidence to possible corruption.
In Ruhoma, in contrast, recent REDD+ interventions resulted in regular patrolling and
more transparent forest management practices. The money from REDD+ certainly
contributed to that as payments were set aside for the activities of committee members.
It seems that they felt less of a need to obtain money by fraud. In a context of severe
lack of resources in Mihumo/Darajani, due to the restrictions imposed by the district
council, the implementation of community-based forest management institutions was
challenging from the beginning and ultimately led to personal enrichment. For that
matter the materiality of the forest plays an important role too. The smaller forest size
and fewer dangerous animals in Ruhoma made forest management activities much
easier than in the vast landscape of Mihumo/Darajani.

268
In chapter eight I examined efforts by development actors to promote ‘Conservation
Agriculture’ in the study villages in order to reduce the pressure of agriculture to
forestland. I illustrated the dominant view that in applying ‘Conservation Agriculture’
techniques, villagers shall increase their agricultural outputs, thus pursuing economic
development opportunities, while protecting their environment. First I argued that
‘Conservation Agriculture’ is promoted in the study villages as a ‘green technological’
win-win solution to problems of environmental degradation, rising global food demand
and economic development in the form of an agricultural modernisation package that
includes aspects that are de facto unrelated to Conservation Agriculture. This is
problematic as farmers may get confused or misguided about cause and effects of
different agricultural practices and techniques.
I then examine the performance of farmer field schools to illustrate the importance of
socio-economic factors and group dynamics of participatory extension approaches.
Drawing on insights from another study I show how economic benefits, governance and
leadership, social capital among group members and social capital between group
members and the facilitator considerably influence the performance and outcome of this
extension approach.
In the third and last section of this chapter the perceptions of group members and
villagers of Conservation Agriculture are discussed. All in all this chapter highlighted
how the socio-economic context of villagers considerably influences the perceptions
and adoption of a new widely promoted technology that is regarded as the win-win
solution to sustainable agricultural development and forest protection in rural Africa.
The chapter is indeed important as forest protection in rural Lindi is tightly linked to
villager’s agricultural practices and technology. While some form of technological
change is absolutely necessary in order to increase agricultural outputs, my data suggest
that the introduction of a new technology in the villages requires a sophisticated
analysis of the socio-economic processes driving farmers’s livelihood decisions and
how they are compatible/in conflict with the technology.

269
9.3 Theoretical contributions Given that empirical research on REDD+ is still in its early phase, I regard my
ethnographic study of its emergence in Lindi, Tanzania, an important contribution to a
better understanding of how local processes shape its implementation and what this
could mean about its livelihood and developmental effects. While one can find several
studies that examine the neoliberalisation of nature from an ethnographic angle, many
of them concentrated on other subjects and not on REDD+ or forest carbon. My
ethnographic enquiry into REDD+ therefore adds to the theoretically informed literature
on neoliberal conservation by offering new empirical insights from forest carbon
commodification, which is a rapidly evolving field on the ground. In addition I
contributed to the literature on neoliberal conservation by incorporating theoretical
insights from international development at the start of this thesis. In bringing two bodies
of literature, each having separately discussed neoliberalism, neoliberalisations and
nature, closer to each other, I could synthesise some of their findings, which helped me
to conceptualise REDD+ initiatives as processes of ‘inclusive’ neoliberal conservation.
In this dissertation I illustrated how REDD+ initiatives, as processes of ‘inclusive’
neoliberal conservation, emerge in the form of a developmental strategy and as the
‘rational’ solution to a perceived problem of deforestation, against a background of rural
poverty, inequality and dependence on land for crop production (cf. Lansing, 2011).
This is crucial better to understand why natures, in our case forest carbon, become
neoliberalised around the world (Castree, 2008). In the context of poor farmers in rural
Southeastern Tanzania, ‘inclusive’ neoliberal conservation is being promoted as a path
to green development that allegedly offers environmental and economic benefits. My
findings thus speak to the win-win rhetoric of neoliberal conservation (Igoe and
Brockington, 2007). My ethnographic account illustrates in detail how development
actors promoted a crisis narrative and green development discourse through various
discursive means and participatory initiatives, in order for REDD+ initiatives to gain
popular support and legitimacy among the rural population. This understanding
provides us with important insights to why and how rural poor in Southeastern Tanzania
revalue their local forest-landscape towards new forms of global integration. Influenced
by development actors’ discursive efforts they re-imagine their forests as spaces of
carbon sequestration services that can be sold to international markets. Therefore, in
contrast to the economic focus of the payments for ecosystem services concept, which
postulates the significant role of monetary incentives (Muradian et al., 2010), I argue

270
that discursive effects can be as important as material effects, at least in the short run, to
influence people’s livelihoods and local land use strategies.
This does not mean that material effects are insignificant. In contrast, my findings
illustrate the importance of material benefits, specifically direct tangible benefits, to the
livelihoods of rural villagers (cf. Corbera et al., 2007). Whether villagers receive
tangible benefits from forest protection has important consequences for their
conservation support. In my dissertation I highlight, however, that the material-benefits-
conservation-support linkages differ even within the villages. My study thus adds to the
insight that neoliberal conservation produces mixed livelihood outcomes (Igoe and
Brockington, 2007; Roth and Dressler, 2012) by highlighting the importance of wealth
inequalities within communities and how they shape the effects of material benefits.
First, I highlighted that besides the amount of the payments also the time and mode of
distribution influence their effects. Second, I pointed out that the benefits of payments
depend on the wealth class of a household/individual. My findings demonstrate that
carbon payments are unlikely to cover the opportunity costs of middle and wealthy
households, which means they forego considerable benefits from forest protection. At
the same time, carbon payments could cover the opportunity costs of poorer households,
but only as long as they remain poor. The moment they become richer, their opportunity
costs increase, and the less beneficial become the carbon payments. This finding
therefore questions the progressive character of direct and equitable forest carbon
payments. While carbon payments played an important and positive role to create
support for conservation, their benefits to progressive and emancipatory development
must be critically questioned.
The fact that most survey respondents in Ruhoma spent the trial payments on food
illustrates the persistence of deep poverty and the intricate relationship between forest
protection and food production. Land in Lindi Rural provides the livelihood basis for its
residents from which farmers produce food and cash. If agricultural outputs decrease
when fertile forestland is taken away from agricultural production, farmers become
more dependent on agricultural markets for food. They can be volatile and higher prices
can considerably impact on, especially poorer, households’ access to food, which would
mean more insecurity and livelihood losses. REDD+ payments would therefore have to
incorporate these new trends in future and adapt accordingly to food availability and
271
prices as influenced by the working of agricultural markets in rural villages that are
characterised by stark wealth inequalities.
My dissertation demonstrates the incompleteness of the forest carbon commodification
process and its embeddedness in a local socio-political context. In both villages no
carbon credits have been produced, let alone sold. In chapter six I highlighted a major
aspect of this fact, namely the challenges of territorializing village and forestland.
Territorialisation, which forms part of a larger decentralisation process, is a key element
of all ongoing REDD+ initiatives in Tanzania and across the world. It has been
highlighted before that neoliberal conservation encompasses process of territorialisation
that are considerably influenced by state and non-state actors (Corson, 2011; Igoe and
Brockington, 2007). The latter offering much needed money, expertise and technology
to the former. My findings illustrate the dependence of villagers on these external actors
to design and take the process of territorialisation forward, but it also shows their
limitations. This relates to debates of participatory approaches to consevation and
development (cf Mohan and Hickey, 2005). My study shows that participation of
villagers has been much more instrumental than progressive in their character. Villagers
constantly struggled to practice participatory citizenship and engage in ‘transformative
politics’ (cf. Hickey, 2010). At the same time I argued that REDD+ initiatives resulted
in spaces of positive change as they took on local power struggles over land and people,
especially between the district and village, and introduced useful technical activities that
assisted in better land use planning. These technical activities contributed to
empowering villagers at the expense of the local district. They were therefore technical
and political at the same time. The focus of REDD+ initiatives in Tanzania on
community-based forest management certainly has the potential to empower local
villages and to promote more equitable and inclusive forms of benefit sharing from
forest resources.
Whether community-based forest management, as the preferred governance framework
for REDD+, will contribute to inclusive economic development will depend on how
villagers practice the institutions on the ground. Another contribution of my dissertation
is therefore to question simple assumptions of ‘good governance’ reforms and to point
at the discrepancy of envisaged community institutions and actual practices (cf. Hickey,
2013). The whole idea of REDD+ is deeply linked to the promise of community based
forest management in Tanzania. I first briefly outlined that the supposedly equitable and

272
democratic governance framework also results in exclusion as non-residents and
customary forest users face restrictions in the course of the formalisation process.
Secondly, from my research it became apparent that villagers understand and practice
institutions differently to what was envisaged, although the foundational elements were
adopted. A critical element is the dissemination of information and knowledge, which is
necessary to adopt institutions, in a rural setting of Tanzania. More importantly are the
actual practices of village institutions. My findings, based on two different experiences
in the villages, further point at the importance of accountability, transparency, capacity,
leadership and materiality of forests in establishing effective community institutions.
‘Inclusive’ neoliberal conservation entails the promotion of new technologies to
overcome complex problems. In our case Conservation Agriculture was promoted as the
win-win technological package that is suggested to assist farmers in raising agricultural
productivity while protecting their forestland. My dissertation brings to the fore the
importance of the socio-economic context when new technology is being transferred or
disseminated (Giller et al., 2009; Baudron et al., 2012). I illustrate how socio-economic
and political factors influence ways to disseminate knowledge of the technology and
how villagers think of its adoption. This shows that the introduction of new technology
is a process of socio-economic transformation and not just a simple case of giving it to
the people. Local material, political and cultural factors decisively shape the potentials
of different technologies, which means that technologies must be evaluated according to
their technical as well as social compatibilities.
9.4 Future research This dissertation only contributed a little to a better understanding of the emergence and
impacts of commodifying forest carbon under REDD+ in Lindi, Tanzania. More
research is required to broaden our understanding of the processes and outcomes of this
and other ‘inclusive’ neoliberal conservation approaches. Here are some of my
suggestions.
It will be important to study in more detail how REDD+ effects territorialisation
processes on the ground, how it transforms property rights over forests and land and
how they are shaped by political and power struggles in different contexts (Milne, 2012;
Mahanty et al., 2013). It is well known that forests in the South are often under unclear
tenure regimes (Naugthon-Treves and Wendland, 2014). There is also an intensive

273
debate whether REDD+ will lead to more decentralisation or centralisation of forest
governance (Phelps et al., 2010; Sandbrook et al., 2010; Wunder, 2010; Agrawal et al.,
2010). This research has shown that REDD+ interventions promoted decentralisation of
forest governance, but they have encountered considerable political and technical
challenges. More studies need to be conducted to examine whether REDD+ will bring
more tenure security to local stakeholders or if it will grant other institutions ownership
over valuable forestland. Furthermore, studies need critically to examine whether tenure
security actually increases the possibilities of local stakeholders to benefit from their
resources. As my data suggest, not only did one village receive legal ownership without
the authority to control access and use, but also both villages participated in the
decentralisation reform that was considerably shaped by non-state actors. This meant
that non-state actors had an important role in designing the institutional framework of
forest management once managed by communities.
There should be more studies on the livelihood impacts of forest carbon
commodification with specific consideration of existing wealth inequalities in
communities. It will be necessary to conduct longer-term studies to evaluate the
distribution of costs and benefits but contemporary research can lay the groundwork and
provide important insights into distributional issues. Future research could make use of
value chain analysis to derive at the distribution of benefits among various actors
located at different scales. Important will be enquries into the labour aspect of
conservation (cf. Sodikoff, 2012). Little is known to date about the labour input of
forest carbon commodification. What type of labour is involved? Who are the
labourers? How much do they benefit from doing conservation labour?
As important are studies into the procedural issues of REDD+ (Lawlor et al., 2013).
More work is needed into the type of participation of various stakeholders in the design
and implementation of REDD+, the role of discourse in shaping their participation and
how power imbalances contribute to the outcome of (democratically legitimised)
decisions. More studies need to look at the discursive tactics of development actors and
how this transforms the local understandings and perceptions of forests and their
benefits. As outlined in this study the neoliberalisation of conservation emerges as the
developmental solution to perceived problems of environmental degradation. In the era
of inclusive neoliberalism the participation of local stakeholders has become a common

274
feature. It is therefore critical to study more in depth the type of participation and the
role of community representatives in designing conservation agreements.
It will be critical better to link studies on REDD+ with research on agricultural
development in rural Africa or elsewhere. Since forest protection is tightly linked to
agricultural development, more studies are required that examine the potentials and
pitfalls of different agricultural intensification schemes and their contribution to
conservation. Farming practices need to be analysed and understood in more detail in
order to arrive at alternatives that are socio-economically and technologically
compatible. Conservation Agriculture as one possible technological alternative is being
promoted across Africa. There is more critical research needed that investigates the
claims of its proponents with the actual benefits and changes on the ground.
In arguing that REDD+ initiatives should be conceptualised as processes promoting
‘inclusive’ neoliberal conservation I also aimed to point at the contradictory nature of
these processes, in order to encourage further research in this field. REDD+ initiatives
aim to offer triple wins (society, environment and economy) but in practice, as we have
learnt from experience, trade-offs are the norm. Trade-offs occur because of the deep
contradictions in place between neoliberal market-oriented conservation on the one side
and inclusive development on the other side. Although REDD+ initiatives attempt to
bring these two sides together, they will never fully succeed, as there will always be
tensions between their different logics and objectives of governing forests and people.
Exactly how these tensions and contradictions play out on the ground, as I illustrated in
this dissertation, is a matter of power, politics and livelihood practices. I researched this
in the context of Southeastern Tanzania, but more studies from other areas are required
to further our knowledge of this important subject.

275
Appendix I: Fieldwork schedule Date/Duration Location Activities
Pre-fieldwork preparations
August 2011 Kilwa, Newala, Lindi, Liwale
Exploratory trip with Dr. Mustalahti and Dr. Zahabu to three REDD+ projects in Lindi Region and to head office of LIMAS programme in Newala
September to October 2011
Dar es Salaam Swahili language course (5 weeks) Preparations for fieldwork: research permits from University of Manchester and Tanzania Visit from family
First phase of fieldwork: November 2011 to January 2012
1st and 2nd week of November 2011
Lindi & Liwale town Meeting with officials at Regional Administrative Secretary and district councils to receive letters of introduction Meetings with project staff from TFCG/Mjumita Arrangements for stay in Mihumo/Darajani
20th November to 25th January
Mihumo/Darajani Introduction to village authorities and village residents Open and informal conversations Practicing and improving my Swahili skills Visit of my supervisor Prof. Dan Brockington Participant observation Recording of 18 interviews with villagers
25th January to 31st January
Liwale Recovery from health problems (stomach pain, loss of body weight, tiredness)
Break from fieldwork: February
February Dar es Salaam Visit from family for about three weeks One week spent for brief analysis of data gathered so far and preparing for the next phase of fieldwork
Second phase of fieldwork: March to April 2012
March (1st week) Lindi town Travel to Lindi town Meeting with district officials and project staff
March (2nd week) Ruhoma Introducing myself to Ruhoma village Informal conversations with individual households Participant observation Official visit of national REDD+ task force Recording of 9 interviews with villagers
13th March Liwale Travel to Liwale to reintroduce myself to district and village officials Arrangement for a new accommodation in the village
15th March to 30th
April Mihumo/Darajani Recording of 37 interviews with villagers
Participant observation of daily activities and of village council meeting with district natural resource officer Informal conversations with villagers
Third phase of fieldwork: May to June 2012
May (1st week) Lindi town Travel to Lindi and meeting with Saro, a Masters student co-supervised by Dr. Mustalahti, with similar research interests
May (2nd and 3rd week)
Ruhoma Participant observation Document analysis

276
Recording of 20 interviews May (4th week) Lindi town Discussion of findings with Saro
Preparation of household survey June (1st and 2nd week)
Ruhoma/Lindi town Return to Ruhoma to conduct interviews and household survey but severe health issues (infected left foot and malaria falciparum) forced me to return to Lindi town for treatment
June (3rd week) to July (1st week)
Ruhoma Finalisation, piloting and implementation of household survey with 39 respondents Focus Group Discussion Recording of interviews with villages and ward officials
Fourth phase of fieldwork: July 2012
July (1st to 3rd week)
Mihumo/Darajani Implementation of household survey with 79 households Recorded 9 interviews with village, district and ward officials
24th July Dar es Salaam Return to Dar es Salaam to leave Tanzania via airplane on 26th July

277
Appendix II: List of recorded interviews Interviews recorded in Mihumo/Darajani No. Type of interviewee Sex Place Date
M 1 Researcher M Liwale 17.08.2011 M 2 Researcher F Dar es Salaam 21.08.2011 M 3 Livestock owner M Darajani 19.12.2011 M 4 Village leader M Darajani 19.12.2011 M 5 Young villager M Darajani 19.12.2011 M 6 Sub-village Chairman M Darajani 24.12.2011 M 7 Elder M Darajani 26.12.2011 M 8 Elder M Darajani 29.12.2011 M 9 Sub-village Chairman M Darajani 30.12.2011
M 10 Sub-village Chairman M Darajani 30.12.2011 M 11 Sub-village Chairman M Darajani 31.12.2011 M 12 Vicoba M Mihumo 02.01.2012 M 13 Elder M Mihumo 02.01.2012 M 14 VNRC M Darajani 04.01.2012 M 15 Village outsider M Mihumo 12.01.2012 M 16 VNRC M Darajani 14.01.2012 M 17 CA Darajani M Darajani 19.01.2012 M 18 Young villager M Darajani 26.01.2012 M 19 Elder F Darajani 26.01.2012 M 20 Sub-village Chairman M Mihumo 27.01.2012 M 21 Young villagers Mihumo 23.03.2012 M 22 Female farmer F Mihumo 23.03.2012 M 23 Male farmer M Mihumo 23.03.2012 M 24 Single mother F Mihumo 24.03.2012 M 25 CA Darajani M Darajani 24.03.2012 M 26 CA Mihumo F Mihumo 26.03.2012 M 27 CA Darajani M Mihumo 27.03.2012 M 28 CA Mihumo & REDD F Mihumo 27.03.2012 M 29 REDD M Mihumo 28.03.2012 M 30 Sub-village Chairman M Mihumo 28.03.2012 M 31 CA Mihumo F Mihumo 04.04.2012 M 32 CA Mihumo F Mihumo 04.04.2012 M 33 CA Mihumo F Mihumo 05.04.2012 M 34 CA Mihumo F Mihumo 07.04.2012 M 35 CA Mihumo M Mihumo 09.04.2012 M 36 CA Mihumo F Mihumo 09.04.2012 M 37 Elder M Mihumo 10.04.2012 M 38 CA Darajani F Darajani 10.04.2012 M 39 CA Darajani M Darajani 10.04.2012 M 40 CA Darajani F Darajani 11.04.2012 M 41 CA Darajani M Mihumo 12.04.2012 M 42 CA Darajani F Darajani 12.04.2012 M 43 CA Darajani M Darajani 13.04.2012 M 44 CA Darajani F Mihumo 13.04.2012 M 45 REDD F Darajani 21.04.2012 M 46 Village council M Mihumo 22.04.2012 M 47 REDD M Darajani 22.04.2012 M 48 Elder M Mihumo 23.04.2012 M 49 VNRC M Mihumo 24.04.2012 M 50 VNRC F Mihumo 25.04.2012

278
M 51 VNRC F Mihumo 25.04.2012 M 52 Health/Dispensary M Mihumo 26.04.2012 M 53 VNRC F Darajani 26.04.2012 M 54 VNRC M Darajani 26.04.2012 M 55 VNRC F Darajani 26.04.2012 M 56 VNRC F Mihumo 27.04.2012 M 57 VNRC F Mihumo 27.04.2012 M 58 Teacher M Mihumo 11.07.2012 M 59 Sub-village Chairman M Mihumo 11.07.2012 M 60 District M Liwale 16.07.2012 M 61 District M Liwale 16.07.2012 M 62 Ward M Liwale 16.07.2012 M 63 Village council M Mihumo 20.07.2012 M 64 VNRC M Mihumo 20.07.2012 M 65 Village council M Darajani 20.07.2012 M 66 Village council M Mihumo 21.07.2012
Interviews recorded in Ruhoma No. Type of interviewee Sex Place Date
R 1 VNRC F Ruhoma 09.03.2012 R 2 VNRC M Ruhoma 09.03.2012 R 3 VNRC M Ruhoma 09.03.2012 R 4 VNRC F Ruhoma 10.03.2012 R 5 CA F Ruhoma 10.03.2012 R 6 CA M Ruhoma 11.03.2012 R 7 Village outsider M Ruhoma 11.03.2012 R 8 REDD F Ruhoma 11.03.2012 R 9 Elder M Ruhoma 12.03.2012
R 10 LUP M Ruhoma 08.05.2012 R 11 LUP M Ruhoma 09.05.2012 R 12 LUP F Ruhoma 09.05.2012 R 13 Village leader M Ruhoma 10.05.2012 R 14 CA F Ruhoma 11.05.2012 R 15 Ordinary villagers F Ruhoma 11.05.2012 R 16 Village outsider M Ruhoma 12.05.2012 R 17 CA M Ruhoma 13.05.2012 R 18 LUP F Ruhoma 14.05.2012 R 19 LUP F Ruhoma 14.05.2012 R 20 Committees F Ruhoma 15.05.2012 R 21 Committees M Ruhoma 15.05.2012 R 22 Ordinary villagers M Ruhoma 16.05.2012 R 23 Ordinary villagers M Ruhoma 16.05.2012 R 24 CA F Ruhoma 16.05.2012 R 25 LUP M Ruhoma 17.05.2012 R 26 CA F Ruhoma 17.05.2012 R 27 Teacher F Ruhoma 20.05.2012 R 28 Village leader M Ruhoma 20.05.2012 R 29 Project staff M Ruhoma 21.05.2012 R 30 Ordinary villagers M Ruhoma 02.06.2012 R 31 CA M Ruhoma 02.06.2012 R 32 Ordinary villagers M Ruhoma 02.06.2012 R 33 Ordinary villagers M Ruhoma 03.06.2012 R 34 REDD F Ruhoma 04.06.2012 R 35 Teacher M Ruhoma 04.06.2012 R 36 Ordinary villagers Ruhoma 06.06.2012

279
R 37 Ordinary villagers M Ruhoma 06.06.2012 R 38 Ordinary villagers M Ruhoma 06.06.2012 R 39 District M Lindi 13.06.2012 R 40 District M Lindi 13.06.2012 R 41 District M Lindi 14.06.2012 R 42 District M Lindi 14.06.2012 R 43 Project staff M Lindi 14.06.2012 R 44 Ordinary villagers F Ruhoma 20.06.2012 R 45 Ordinary villagers F Ruhoma 20.06.2012 R 46 Ordinary villagers F Ruhoma 20.06.2012 R 47 Elder M Ruhoma 21.06.2012 R 48 Project staff M Kinyope 22.06.2012 R 49 Ward M Rutamba 22.06.2012 R 50 Ward M Lindi 22.06.2012 R 51 Focus Group Discussion Ruhoma 26.06.2012

Appendix III: Household questionnaire
Andreas Scheba
Reducing emissions from deforestation and forest degradation: A study of its emergence and impacts in Tanzania
HOUSEHOLD SURVEY QUESTIONNAIRE A. BACKGROUND INFORMATION (I) Interview details 1. HH Code No.
2. Name of the Assistant (if any)
3 Date
4. Start Time
5. End Time
(II) General information about the Respondent 1. Gender ME MK
2 Level of education (highest grade)
3 Relation to the head of household
4 Period living in household

281
B. HOUSEHOLD STRUCTURE (I) Size/Type of household 1. Number of hh members
2. Adult members
3. Minors
4.a) Members in saving groups 4.b) Withdrawn
5.a) Members in farming groups 5.b) Withdrawn
6.a) Members in village committees 6.b) Withdrawn
7. Village-Sub-village
8. Household located on farm? Yes No
(II) Family details Code no
Family status
Education
Marital status
Place of birth
Place of living
Occupation

282
C. ECONOMIC ASSETS (I) Status of landholding (acre) Type of farm Size Major crops Place Establishe
d (year) Ownership
1 Permanent Farm
2 Temporary Farm
3 Fallow
4 Vegetable Farm
5 Total
(II) Livestock holdings (number) 1. Chicken
2. Goats
3. Sheep
4. Doves
5 Duck
6 Others
7 Others
(III) Type of house 1. Materials used for walls
2. Materials used for roof
3. No of. rooms
(IV) Ownership of assets Sl no
Type of assets Amount
1. Bicycle
2. Radio
3. Motorbike
4. Phone
5. Others

283
D. INCOME & EXPENDITURE (I) Sources of income Sl no
Source of income Time period
Income
1. Crop production yearly
2. Livestock yearly
3. Forest weekly
4. Wage employment on-farm yearly
5 Wage employment off-farm yearly
6 Seasonal migration yearly
7 Business monthly
8 Craftsmanship monthly
9 Remittances yearly
10 REDD+ yearly
11 Loan yearly
12 Others (monetary)
13 Others (non-monetary; food, services, etc)
(II) Expenditure pattern Sl no
Pattern of expenditure Time period
Expenditure
1. Food Weekly
2. Education of children Yearly
3. Transport monthly
4. Clothes Yearly
5 Water weekly
6 Health medication monthly
7 Agriculture: labour yearly
8 Agriculture: inputs yearly
9 Livestock monthly
10 Construction or repair of house yearly
11 Social occasion yearly
12 Acquiring new assets (including livestock)
yearly
13 Others

284
E. AGRICULTURAL HARVEST AND UTILISATION (I) Usage of main agricultural produce (gunia, debe) Sl no Type of crop Total harvest
(last 12 months) Sold local market
Sold Trader
Sold Cooperative
1. Maize
2. Millet/Sorghum
3. Pigeon Peas
4. Cow Peas
5 Cassava
6 Groundnut
7 Vegetables
8 Cashew nut
9 Sesame
10 Rice
11 Bananas
12 Coconuts
(II) Farming practice Which of the following techniques should a good farmer practice on his maize farm? Which ones are you practicing? Technique Good Bad Practiced Not pract. Main reason
a) Intercropping with peas ___________
b) Intercropping with millet or rice ___________
c) Plant trees in the farm ___________
d) To make ridges ___________
e) Plant in rows and equal spaces ___________
f) To dig wholes when planting ___________
g) Usage of industrial seeds ___________
h) Usage of industrial fertilisers ___________
i) Usage of natural fertilisers ___________
j) Usage of herbicides ___________
k) Usage of pesticides ___________
l) Leave grass and residues on field ___________
m) To till the soil ___________
n) Crop rotation ___________

285
(III) Conservation Agriculture Yes No I don’t
know
a) Is it possible to practice slash and burn cultivation sustainably (without damaging the environment)?
b) Have you heard of Conservation Agriculture?
c) Does Conservation Agriculture reduce the workload on the farm?
d) Does Conservation Agriculture increase the harvest of crops?
e) Does Conservation Agriculture reduce the requirements of inputs?
f) Is Conservation Agriculture suitable to your farm?
(IV) Farming knowledge Where did you get your knowledge about farming from? Family Farms of villagers Demonstration farm Classes
Village leaders Books Radio Other___________
Government extension officer NGO extension officer
(V) Other a) Does your household experience food shortage? No Yes, every year Yes, but not every year Yes, and it increased after protecting the forest b) b) Did you farm in the forest prior to REDD+? No Yes, every year Yes, but not every year

286
F. FOREST GOVERNANCE (I) Who owns the protected forest? Villagers VNRC District Gov. Private Org. National Gov. Europeans Private Person Unknown (II) Who is responsible for taking care of the protected forest? Villagers VNRC District Gov. Private Org. National Gov. Europeans Private Person Unknown (III) What is allowed in the protected forest? Farming Hunting animals Harvest timber for subsistence Collecting firewood Walking Harvest timber for commercial Collecting medicine Collecting honey using fire Collecting honey without using fire (IV) What is carbon dioxide? Dirty air Cold air Type of soil Type of tree Clean air Hot air Example of greenhouse gas I don’t know (V) Opinion about forest governance Yes No I don’t
know
a) Do you agree that to protect the forest is better than to open up new farms in the forest?
b) Did you participate in the decision to protect the forest?
c) Did you receive training/explanation about forest management?
d) Did you individually benefit from the protection of the forest?
e) Did the village benefit from the protection of the forest?
f) Did leaders, VNRC members or other few people benefit more than all other villagers from the protection of the forest?
g) Do you know the income and expenses of the village?
h) Did the condition of the protected forest improve compared to the past?
i) Did the governance of the village improve compared to the past? (VI) How often did you participate in village meetings in the last 12 months? ________________ (VII) How did you use the REDD+ trial payments?
Usage Percentage

287
University of Manchester School of Environment and Development
Andreas Scheba
Mpango wa Kupunguza Uzalishaji wa Hewa ya Ukaa kutokana na Ukataji miti ovyo na Uharibifu wa Misitu (MKUHUMI):
Utafiti juu ya kuzuka kwa mpango huu na matokeo yake katika nchi ya Tanzania
MASWALI YA WANAKAYA A. UTAMBOLISHO WA MAHOJIANO (I) Utambolisho wa mahojiano 1. Namba ya kaya
2. Jina la msaidizi (kama yupo)
3. Tarehe
4. Muda wa kuanza
5. Muda wa kumaliza
(II) Utambolisho wa mhojiwa 1. Jinsia ME MK
2. Kiwango cha elimu ulichomaliza
3. Je, una uhusiano gani na mkuu wa kaya
4. Je, umeishi muda gani ndani ya kaya hii

288
B. UTAMBOLISHO WA KAYA (I) Ukubwa/Aina ya kaya 1. Idadi ya wanakaya
2. Idadi ya watu wazima
3. Idadi ya watu wasiojiweza
4.a) Idadi ya wanakaya waliojiunga kwenye VICOBA
4.b) Waliojitoa:
5.a) Idadi ya wanakaya waliojiunga kwenye kikundi cha kilimo au mifugo
5.b) Waliojitoa:
6.a) Idadi ya wanakaya waliojiunga kwenye kamati ya kijiji
6.b) Waliojitoa:
7. Kijiji/kitongoji
8. Kaya hii ipo shambani? Ndiyo Hapana
(II) Wanakaya Namba ya mwanakaya
Uhusiano na mkuu wa kaya
Kiwango cha elimu
Hali ya ndoa
Mahali alipozaliwa
Mahali anapo kuishi
Kazi

289
C. RASILIMALI UCHUMI (HUDUMA NA MALI ZA KAYA) (I) Umilikaji wa ardhi Aina ya shamba Ukubwa
(ekari) Zao kuu Mahali (kijiji) Mwaka
uliyoanza kulima/ pumzisha
Umilikaji
1 Shamba la kudumu (minazi, korosho)
2 Shamba lisilo la kudumu
3 Shamba linalopumzika
4 Bustani
5 Jumla
(II) Idadi ya mifugo inayomilikiwa na kaya hii 1. Kuku
2. Mbuzi
3. Kondoo
4. Njiwa
5 Bata
6 Wengineo
7 Wengineo
(III) Aina ya nyumba 1. Aina ya kuta
2. Aina ya paa
3 Idadi ya vyumba
(IV) Umilikaji wa mali 1. Baiskeli
2. Redio
3. Pikipiki
4. Simu
5. Nyinginezo

290
D. MAPATO & MATUMIZI (I) Vyanzo vya mapato Sl no
Vyanzo vya mapato Wakati Kiasi
1. Mapato ya kilimo Mwaka
2. Uzalishaji wa mifugo Mwaka
3. Manufaa ya msitu Wiki
4. Malipo ya mshahara wa kazi za shambani (kibarua)
Mwaka
5. Malipo ya mshahara wa kazi isiofanika shambani
Mwaka
6. Kazi za msimu Mwaka
7. Biashara Mwezi
8. Ufundi Mwezi
9. Fedha uliopokea kutoka kwa ndugu yeyote aliyeko nje ya hapa
Mwaka
10. MKUHUMI Mwaka
11. Mkopo (VICOBA, benki) Mwaka
12. Mengineyo (fedha)
13. Mengineyo (yasio ya kifedha: chakula, manufaa ya msitu, )
(II) Matumizi Sl no
Matumizi Wakati Kiasi
1. Vyakula Wiki
2. Elimu kwa watoto (ada, daftari) Mwaka
3. Usafiri Mwezi
4. Nguo (mavaazi) Mwaka
5 Maji Wiki
6 Huduma ya afya Mwezi
7 Kilimo: (vibarua) Mwaka
8 Kilimo: (mbolea, dawa, …) Mwaka
9 Ufugaji Mwezi
10 Matengenezo au ukarabati wa nyumba
Mwaka
11 Mila, unyago au ndoa Mwaka
12 Kujipatia mali mpya (pamoja na ufugaji)
Mwaka
13 Mengineyo

291
E. UZALISHAJI WA KILIMO NA UTUNZAJI WA CHAKULA (I) Utumiaji wa mazao muhimu (gunia, debe, tenga, kg) Sl no Aina ya zao Jumla la mavuna
miezi 12 iliyopita Masoko ya kienyeji
Mfanya biashara
Chama
1. Mahindi
2. Mtama
3. Mbaazi
4. Kunde
5. Muhugo
6. Karanga
7. Mbogamboga
8. Korosho
9. Ufuta
10. Mpunga
11. Ndizi
12. Nazi
(II) Vitendo vya kilimo Katika shamba la Mahindi ni vitu gani vizuri vya kufuata? Kati ya hivi ni kipi unakitumia? Vitendo Kilimo bora Sio Kilimo bora Nafuata Sifuati Sababu kuu
a) Kuchanganya na kunde (mbaazi) ___________
b) Kuchanganya na mtama au mpunga ___________
c) Upandaji ya miti ndani ya shamba ___________
d) Kupiga matuta ___________
e) Upandaji kwa mistari na nafasi zinazofanana ___________
f) Kuchimba mashimo wakati wa kupanda ___________
g) Utumiaji wa mbegu za kiwandani ___________
h) Matumizi ya mbolea za kiwandani ___________
i) Matumizi ya mbolea za asili ___________
j) Matumizi ya dawa ya magugu ___________
k) Matumizi ya dawa ya wadudu waharibifu ___________
l) Kutandaza nyasi shambani ___________
m) Kutibua ardhi ___________
n) Mzunguko wa ubadilishaji wa mazao ___________

292
(III) Kilimo Hifadhi Ndiyo Hapana Sijui
a) Je, inawezekana kufuata kilimo cha kuhamahama kwa njia ya uendelevu (bila kuharibu mazingira)?
b) Je, umewahiona/sikia kanuni ya kilimo hifadhi?
c) Je, kilimo hifadhi kinapunguza muda wa kazi za shambani?
d) Je, kilimo hifadhi kinaongeza mapato ya mazao?
e) Je, kilimo hifadhi kinapunguza mahitaji ya pembejeo (dawa, mbolea)?
f) Je, kilimo hifadhi kinafaa kwa shamba lako?
(IV) Ufahamu kuhusu kilimo Elimu yako kuhusu kilimo ulipataje? Familia Mashamba ya wanakijiji Shamba darasa Mafunzo
Viongozi wa kijiji Vitabu Redio Mengineyo___________
Bwana shamba kutoka serikalini Bwana shamba kutoka mashirika binafsi
(V) Mengineyo a) Kaya yako ilikuwa na upungufu wa chakula? Hapana Ndiyo, kila mwaka Ndiyo, lakini sio kila mwaka Ndiyo, na umeongezeka kutokana na kuhifadhi msitu b) Wakati wa kabla ya MKUHUMI ulikuwa umelima msituni? Hapana Ndiyo, kila mwaka Ndiyo, lakini sio kila mwaka

293
F. UTAWALA NA USIMAMIZI WA MISITU (I) Nani ni mmiliki wa msitu uliohifadhiwa? Wanakijiji Kamati ya maliasili Serikali ya wilaya Mashirika binafsi Serikali kuu Wazungu Mtu binafsi Haijulikani (II) Nani anawajibika kutunza msitu uliohifadhiwa? Wanakijiji Kamati ya maliasili Serikali ya wilaya Mashirika binafsi Serikali kuu Wazungu Mtu binafsi Haijulikani (III) Kipi kati ya vifuatavyo vinaruhusiwa kufanya katika msitu uliohifadhiwa? Kulima Kuwinda wanyama Kupasua mbao za matumizi mengineyo Kukusanya kuni Kutembea ndani ya msitu Kupasua mbao za biashara Kukusanya dawa Kurina asali kutumia moto Kurina asali bila kutumia moto (IV) Je, hewa ukaa ni nini? Hewa chafu Hewa baridi Aina ya udongo Aina ya miti Hewa safi Hewa moto Mfano wa gesijoto Sijui (V) Maoni ya utawala wa msitu Ndiyo Hapana Sijui
a) Je, unakubali kwamba kuhifadhi msitu ni bora kuliku kufungua mashamba mapya msituni?
b) Je, umeshiriki kwenye uamuzi kuhifadhi misitu?
c) Je, umepata mafunzo/maelekezo ya utunzaji wa misitu?
d) Je, wewe binafsi umefaidika kutokana na utunzaji wa misitu?
e) Je, kijiji kimefaidika kutokana na utunzaji wa misitu?
f) Je, viongozi, wajumbe wa kamati wa kijiji au watu wachache wengine wamefaidika zaidi kuliku wanakijiji wote kutokana na utunzaji wa misitu?
g) Je, unafahamu mapato na matumizi ya kijiji?
h) Je, hali ya msitu uliohifadhiwa imeongezeka kuliko siku za nyuma?
i) Je, utawala bora wa kijiji umeongezeka kuliko siku za nyuma? (VI) Umeshiriki mara ngapi katika mkutano wa kijiji miezi 12 iliyopita? __________________ (VII) Je, fedha zilizotoka MKUHUMI ulizitumiaje?
Matumizi Asilimia

Appendix IV: Sampling procedure
In Ruhoma I was given a list of all registered villagers by the village executive officer,
who had prepared it for the distribution of the REDD+ trial payments. We went through
the list together and corrected a few changes. In Mihumo/Darajani it was a bit more
complicated. The village executive officer and the sub-village chairmen could not
provide me with an updated list. Luckily, I was told that the local dispensary was
carrying out a vaccination programme among all village residents. For this purpose they
created an updated list of all resident village households. My sample population
therefore contained all permanent resident in the two villages. It did not include
temporary visitors or farmers, who may have resided in the village for a short period of
time during my fieldwork.
After numbering all the households on the list I wrote down all the numbers on small
snippets, which I put into a plastic bag. In Ruhoma I asked two participants of the focus
group discussion to randomly pick 50 numbers. In Mihumo/Darajani I requested the
village chairman of Mihumo and village executive officer in Darajani to pick 50
numbers each. I both villages I asked the volunteers to pick 50 numbers in order to have
back-up households in case others won’t be available. In both villages I wrote down the
picked numbers, cross-checked them with the household list and started the survey
implementation.

295
Appendix V: Wealth ranking procedure The purpose of doing the wealth ranking exercise was to end up with distinct groups of villagers, who differ from each other with regard to their wealth. In my study I grouped households into three clusters – poor, middle and wealthy – in order to compare them with each other. Although the groups are not representative of the entire village, they provide important information about how households differ between each other in terms of income, income sources, assets, agricultural activities and land use practices. In comparing them with each other we learn more about the extent of their differences. The aim was to establish a ‘poor’ cluster that contains households from the village that have very few means (income, land, assets) to make a living and compare them to middle and wealthy groups. While the middle households are somewhat in between, the wealthy group consists of households who are clearly well off and endowed with many resources (income, assets and land). In order to arrive at these three categories I used different indicators in the two villages. I used the cluster-analysis in SPSS and set the number of clusters to three (poor, medium and wealthy). After the software grouped the households according to the indicators I moved some of the households manually (on the basis of one indicator) into another group to obtain a clearer distinction. After all I ended up with three groups that are clearly distinguishable in terms of their wealth, which is measured as a relationship between assets (land, housing, bicycles, mobiles) and income (total income, cashew nut output) Ruhoma I ran a two-step cluster analysis in SPSS. I specified three clusters in order to get poor, middle and wealthy categories. I selected the following variables: housing structure, total income, assets value and total cultivated land.

296
I obtained three clusters of which cluster 1 represented poor households, cluster 2 represented middle-income households and cluster 3 represented wealthy households. The software grouped many households in the poor category, because of their bad performance with regard to housing. However, among them were 5 households with bad housing but who possessed other valuable commodities such as radios, bicycles and mobiles. Because a bicycle is an expensive productive asset that can also be used to generate additional income, I decided to move the households who possess a bicycle into the middle category. Three of these five also had mobiles and four of them had radios. In this way I ended up with new groupings: A category ‘poor’ that contains households with bad housing, low or no assets, a low income and smaller areas of cultivated farms. The second category I ended up with is

297
‘middle’ that contains households with medium housing or bad housing but with some assets, low to medium income and medium land holdings. The third category is ‘wealthy’ that contains households with good to very good housing, high income, high asset values and large land holdings.
Report
Wealth Group Housing Total Total Cult
Land
Bicycles Mobiles Total
Income2
Mean ,00 2,60 ,00 ,08 179.448,33
N 12 12 12 12 12 Poor
Std. Deviation ,000 1,338 ,000 ,289 156.122,812
Mean ,64 3,13 ,50 ,79 382.700,00
N 14 14 14 14 14 Middle
Std. Deviation ,497 1,675 ,519 ,802 324.020,757
Mean 2,46 4,13 ,77 ,92 1.307.230,77
N 13 13 13 13 13 Wealthy
Std. Deviation ,519 2,824 ,599 ,641 782.759,376
Household
ID
Housing
Total
Assets
value
Total
Cult
Land
Total
Income
Bicycles Mobiles Radio
R01 0 25.000 5 9.500 0 0 1
R02 0 25.000 4 220.000 0 0 1
R06 0 25.000 2 334.780 0 0 1
R11 0 0 3 402.000 0 0 0
R18 0 25.000 2 352.000 0 0 1
R22 0 0 4 140.500 0 0 0
R24 0 25.000 2 343.600 0 0 1
R26 0 125.000 2 250.000 0 1 1
R32 0 0 1 6.000 0 0 0
R33 0 0 3 90.000 0 0 0
R34 0 25.000 4 0 0 0 1
POOR
R36 0 0 1 5.000 0 0 0
12 12 12 12 12 12 12 12
R05 1 200.000 1 210.000 1 1 0
R10 1 225.000 4 417.200 1 1 1
R12 1 100.000 5 10.500 0 1 0
R13 1 0 5 207.300 0 0 0
R14 1 350.000 4 625.000 0 3 2
R15 1 125.000 3 298.000 0 1 1
R17 0 250.000 3 1.256.000 1 1 2
MIDDLE
R20 0 150.000 2 161.000 1 0 1

298
R23 0 225.000 7 772.300 1 1 1
R27 1 25.000 1 55.000 0 0 1
R31 1 25.000 2 280.000 0 0 1
R35 0 275.000 2 433.000 1 1 1
R38 0 100.000 3 262.500 1 0 0
R39 1 100.000 3 370.000 0 1 0
14 14 14 14 14 14 14 14
R03 3 125.000 3 789.500 1 0 1
R04 2 375.000 4 680.000 1 2 1
R07 3 225.000 10 648.000 1 1 1
R08 2 125.000 1 729.000 0 1 1
R09 2 125.000 2 248.000 0 1 1
R16 3 100.000 0 2.880.000 0 1 0
R19 2 250.000 6 2.446.000 1 1 2
R21 2 0 3 988.000 0 0 0
R25 3 225.000 3 1.208.000 1 1 1
R28 2 125.000 2 1.500.000 1 0 1
R29 2 275.000 8 1.854.800 1 1 1
R30 3 425.000 7 2.010.200 2 2 1
WEALTHY
R37 3 225.000 5 1.012.500 1 1 1
13 13 13 13 13 13 13 13
39 39 39 39 39 39 39 39
Wealth Groups Ruhoma
Wealth Group Housing
Total
Assets value Bicycles Total Cult
Land
Total Income
Mean ,00 22.916,67 ,00 2,60 179.448,33
N 12 12 12 12 12 Poor
Std.
Deviation ,000 34.473,859 ,000 1,338 156.122,812
Mean ,64 153.571,43 ,50 3,13 382.700,00
N 14 14 14 14 14 Middle
Std.
Deviation ,497 104.171,245 ,519 1,675 324.020,757
Mean 2,46 200.000,00 ,77 4,13 1.307.230,77
N 13 13 13 13 13 Wealthy
Std.
Deviation ,519 116.815,381 ,599 2,824 782.759,376
Mihumo/Darajani In Mihumo/Darajani I selected slightly different indicators to determine wealth in the village: Total income, total cultivated land, bicycles, mobiles, cashew nut yields and

299
number of chickens. After running a two-step cluster analysis using these indicators in SPSS I obtained the following distribution of households: 24 households were grouped as poor, 40 were grouped as medium and 12 were grouped as wealthy. Then I made use of housing structure to move some poorer households into the middle category. I moved those ‘poor’ households with low assets (measured in bicycles and mobiles) but better housing structure into the middle group. I then ended up with three new clusters: 11 poor households, 53 middle-income households and 12 wealthy households.
The group of poor households has bad housing, no or low assets (bicycles and mobiles), low income, low to medium landholdings, small livestock and lower cashew nut outputs. The group of middle households has medium assets, medium stocks of chickens, and medium cashew nut outputs. The group of wealthy households has more assets, high total incomes, larger areas of cultivated land, larger numbers of livestock, and higher cashew nut outputs.

300
Report
WealthGroup Total
Cultivate
d Land
Housing
Total
Bicycles Mobiles Total Income Cashew
nut (kg)
Chicken
Mean 6,45 ,00 ,00 ,09 288.550,00 62,82 1,00 Poor
N 11 11 11 11 11 11 11

301
Std.
Deviatio
n
3,004 ,000 ,000 ,302 298.995,681 67,597 1,000
Mean 6,32 ,89 ,83 ,36 432.826,23 146,60 8,15
N 53 53 53 53 53 53 53
Middle Std.
Deviatio
n
3,291 1,103 ,580 ,558 276.683,600 116,143 9,164
Mean 16,75 1,17 ,83 ,75 1.231.158,33 415,92 21,17
N 12 12 12 12 12 12 12
Wealthy Std.
Deviatio
n
5,817 1,467 ,577 ,866 581.332,789 329,580 16,219
Household
ID
Housing
Total
Total
Cultivate
d Land
Bicycles Mobiles Total
Income
Cashew
nut
outpu(kg
)
Chicken
D03 0 9 0 0 395.000 80 1
D04 0 10 0 0 83.000 80 0
D08 0 4 0 0 545.250 80 0
D23 0 7 0 0 208.500 240 1
D24 0 8 0 1 78.000 80 1
D27 0 3 0 0 990.000 5 0
D34 0 7 0 0 511.500 40 0
D38 0 5 0 0 39.000 26 2
M20 0 2 0 0 71.000 0 3
M24 0 11 0 0 26.800 60 1
POOR
M31 0 6 0 0 226.000 0 2
11 11 11 11 11 11 11 11
D02 0 7 2 0 583.000 240 0
D05 0 5 1 1 525.000 400 15
D06 0 4 2 0 1.059.000 240 9
D07 0 8 1 0 114.000 5 0
D10 1 6 1 1 1.117.650 400 7
D11 2 5 0 0 417.000 280 10
D12 2 14 1 0 128.000 100 6
D13 1 6 1 1 605.000 235 9
D14 2 6 0 0 549.470 160 0
D15 0 6 1 1 610.400 220 10
D16 1 4 1 1 182.000 20 30
MIDDLE
D19 1 4 1 0 507.200 120 4

302
D20 0 3 1 0 140.400 60 9
D21 0 3 1 0 212.000 120 2
D22 3 9 1 0 531.000 280 11
D26 2 3 1 2 273.000 0 2
D29 2 8 1 1 562.800 60 2
D30 0 7 1 0 382.000 240 30
D31 3 11 0 1 690.000 400 0
D32 2 4 0 0 355.500 120 2
D36 0 9 2 0 823.000 100 3
D37 0 6 2 2 122.000 100 10
D39 3 5 0 1 131.000 80 7
M01 0 5 1 1 276.000 80 10
M02 3 7 0 0 367.500 60 2
M03 2 4 0 0 165.000 40 0
M04 2 1 0 1 320.000 0 0
M05 2 8 0 0 453.000 440 0
M06 2 8 0 1 80.000 60 0
M07 2 9 1 0 204.000 100 2
M08 0 3 1 0 813.000 400 0
M09 0 7 1 1 265.500 80 10
M10 2 8 1 0 241.070 80 16
M12 0 3 1 0 338.400 120 3
M13 0 6 1 0 259.400 120 30
M14 0 6 2 0 1.084.000 160 15
M17 0 9 1 0 299.500 240 12
M19 0 4 1 0 252.500 0 0
M21 0 2 1 0 92.400 0 2
M22 0 12 1 0 685.600 150 15
M23 0 9 1 0 457.000 160 10
M26 0 12 1 0 472.000 80 1
M27 0 14 1 0 560.000 40 17
M28 0 13 1 0 684.000 320 4
M29 0 8 1 0 323.000 240 12
M30 0 6 1 1 775.000 120 0
M32 2 4 0 0 36.000 80 1
M33 0 6 0 0 86.500 80 37
M35 0 4 1 0 425.000 160 0
M36 2 13 0 0 332.000 160 8
M37 0 1 1 0 897.000 60 5
M38 0 5 1 1 205.000 80 30
M39 3 1 0 1 870.000 80 12
53 53 53 53 53 53 53 53

303
D01 2 18 1 1 910.000 480 15
D09 0 22 2 0 340.400 233 40
D17 3 12 1 1 1.412.500 960 5
D18 3 22 1 0 584.000 0 10
D28 3 22 0 3 2.216.000 960 30
D35 0 12 1 0 734.500 500 36
M11 3 9 0 1 2.114.500 240 30
M16 0 15 1 0 1.283.000 640 18
M18 0 17 1 1 1.292.400 560 50
M25 0 10 0 1 1.556.000 320 0
M34 0 14 1 1 810.600 98 20
WEALTHY
M40 0 28 1 0 1.520.000 0 0
12 12 12 12 12 12 12 12
76 76 76 76 76 76 76 76
Wealth Groups Mihumo/Darajani
WealthGroup Housing Bicycles Mobiles Total
Cult
Land
Chicken Total Income Cashew
Yield(kg)
Mean ,00 ,00 ,09 6,45 1,00 288.550,00 62,82
N 11 11 11 11 11 11 11
Poor Std.
Deviatio
n
,000 ,000 ,302 3,004 1,000 298.995,681 67,597
Mean ,89 ,83 ,36 6,32 8,15 432.826,23 146,60
N 53 53 53 53 53 53 53
Middle Std.
Deviatio
n
1,103 ,580 ,558 3,291 9,164 276.683,600 116,143
Mean 1,17 ,83 ,75 16,75 21,17 1.231.158,33 415,92
N 12 12 12 12 12 12 12
Wealthy Std.
Deviatio
n
1,467 ,577 ,866 5,817 16,219 581.332,789 329,580

304
Appendix VI: Land utiliation and production of crops
Distribution of temporary farms per size and wealth group in
Mihumo/Darajani
Wealth Group Size of temporary farm
(rounded) Poor Middle Wealthy
Total
0 acres 1 6 0 7
1 acre 2 6 1 9
2 acres 3 16 3 22
3 acres 4 15 1 20
4 acres 0 4 1 5
5 acres 1 2 1 4
6 acres 0 3 3 6
8 acres 0 1 0 1
15 acres 0 0 1 1
16 acres 0 0 1 1
Total 11 53 12 76
Distribution of temporary farms per size and wealth group in Ruhoma
Wealth Group Size of temporary farm
(rounded) Poor Middle Wealthy
Total
0 acres 2 0 1 3
1 acre 2 3 1 6
2 acres 3 4 3 10
3 acres 1 5 3 9
4 acres 3 1 2 6
5 acres 1 1 1 3
6 acres 0 0 2 2
Total 12 14 13 39

305
Distribution of permanent farms per size and wealth group in Mihumo/Darajani
Wealth Group
Poor Middle Wealthy
Total
0 acres 1 4 0 5
1 acre 0 6 0 6
2 acres 0 5 0 5
3 acres 4 14 0 18
4 acres 1 11 1 13
5 acres 0 2 0 2
6 acres 4 4 1 9
7 acres 1 2 1 4
8 acres 0 2 1 3
10 acres 0 0 2 2
12 acres 0 3 2 5
14 - 17 acres 0 0 4 4
Total 11 53 12 76
Land utilisation among survey respondents
Land utilisation am ong survey re sponde nts in R uhom a (n=3 9)
10,33%
45,01%
42 ,20%
2,47% Permane nt farm
Temporary fa rm
Fallow land
Ve getable garden

306
L and utilisation am ong surve y spondents in M ihumo/Dar ajani ( n=76)
53,08%
31 ,48%
14,45%
0,99%
Perm anent farm
Temporary fa rm
Fallow land
Ve getable garden
Land utiilisation per wealth group
Type of land use Total Temporary "%" Permanent "%" Fallow "%" Vegetable "%"
Poor (n=11) 92 25 27% 47 51% 20 22% 0 0% Middle (n=53) 398 131 33% 199 50% 63 16% 5 1%
Mihumo/Darajani
Wealthy (n=12) 222 68 31% 131 59% 20 9% 3 1%
Total Temporary "%" Permanent "%" Fallow "%" Vegetable "%"
Poor (n=12) 57 26 46% 5 9% 25 44% 1 1% Middle (n=14) 83 34 41% 7 8% 40 48% 2 3%
Ruhoma
Wealthy (n=13) 84 40 48% 11 13% 30 36% 3 3%
Share of individual crops in total production volume Share of individual crops in production volume per wealth class in Ruhoma
Produce (kg) Total Maize Millet/S Pigeon Peas Cowp. Cass. Ground Veg. Cashew Sesame Rice
Poor (n=12) 6,930 2,366 2,020 554 420 500 20 50 180 620 200
100% 33% 28% 8% 6% 7% 0% 1% 4% 10% 3%
Middle (n=14) 11,384 3,710 3,460 305 870 325 0 290 186 1,318 920
100% 33% 29% 3% 7% 3% 0% 2% 2% 13% 8% Wealthy
(n=13) 16,417 3,190 2,660 940 1,380 1,800 0 710 945 3,232 1,560
100% 18% 15% 5% 8% 10% 0% 4% 8% 23% 9%

307
Share of individual crops in production volume per wealth class in Mihumo/Darajani
Produce (kg) Total Maize Millet/S Pigeon Peas Cowp. Cass. Ground Veg. Cashew Sesame Rice
Poor (n=11) 9,594 2,880 4,040 720 100 10 40 40 691 443 630
100% 30% 41% 7% 1% 0% 0% 0% 10% 5% 6%
Middle (n=53) 52,106 11,900 17,086 5,193 555 2020 67 600 7,690 2,275 4,720
100% 21% 31% 9% 1% 4% 1% 1% 20% 5% 8% Wealthy
(n=12) 21,036 3,620 3,240 3,000 280 360 20 460 4,991 1,985 3,080
100% 15% 14% 13% 1% 2% 0% 2% 30% 10% 13%

308
Appendix VII: Map of Milola Magharibi (Source: FMP Milola Magharibi 2012)

309
Appendix VIII: Provisional land use map Ruhoma Source (own photograph)

310
Appendix IX: REDD+ trial payments calculations
According to Merger et al. (2012) the mean natural forest carbon stock in the Lindi
project site of TFCG/Mjumita amounts to 158.8 tCO2 per hectare. This means that a
deforestation of one hectare of forest in Ruhoma results in emissions of 105 tCO2. On
the basis of satellite images TFCG/Mjumita estimated that the annual deforestation rate
in Ruhoma amounts to 33.16 hectares. For the Lindi project site the average
deforestation rate is estimated to be 1.55% per year (Merger et al., 2012).
After project proponents established that Ruhoma has a total area of 2,830.23 hectares
of forest it was decided in village assemblies, which took place as part of the REDD+
project, that 2,487.70 hectares should be protected. This is 88% of the total forest area.
Because of the decision to protect 88% of the total forest area, it was stated that 88% of
the annual deforestation rate should be avoided. This would mean that 29.18 (88% of
33.16) hectares of forest should be left standing instead of being cut down every year.
Of this amount 29.18 hectares, a share of 12% (100%-88%), can be cleared outside of
the forest reserve. This leads to an area of 25.6792 hectares that remains protected every
year due to REDD+ efforts.
Given a mitigation potential of 105 tCO2 per hectare forest, the protection of 25.6792
hectares leads to avoided emissions of 2,693.8 tCO2 per year. With an estimated carbon
income of 5 USD (=7,826 TShs at the time) per tCO2 a total sum of 21,081,960 TShs
was made available by the project proponents for distribution among the 346 registered
adults and 224 registered minors in the village. It is important to note here that a net
income of 5 USD per tCO2 presumes a minimum price of 9.8 USD per tCO2. This is
because the total costs of avoiding the release of one tCO2 amounts to 4.8 USD over a
period of 30 years in the project site. Total costs include implementation, transaction
and institutional costs of the project (see Merger et al., 2012).
It is important to note here that a net income of 5 USD per tCO2 presumes a minimum
price of 9.8 USD per tCO2. This is because the total costs of avoiding the release of one
tCO2 amounts to 4.8 USD over a period of 30 years in the project site. Total costs
include implementation, transaction and institutional costs of the project (Merger et al.,
2012).

311
Appendix X: Legal steps to CBFM In Tanzania the existing local government structures and institutions provide the legal
basis for community-based REDD+ projects (URT 2013). Democratic decentralisation
of forest management was introduced into Tanzanian law with the passing of the
National Forestry Policy (1998) and subsequently the Forest Act of 2002, which, in
combination with the Village Land Act (1999) and the Local Government Act (1982),
provides a clear legal basis for communities, groups or individuals across mainland
Tanzania to own, manage or co-manage forests under a wide range of conditions. Two
main approaches can be distinguished: Community Based Forest Management (CBFM)
and Joint Forest Management (JFM). JFM is a joint agreement between concerned
parties to manage national and local government forest reserves with adjacent
communities. Under CBFM, a village land forest reserve (VLFR) or a community forest
reserve (CFR) is established where village councils as corporate bodies obtain the rights
to own the forests as legal property, create their own legally binding by-laws, subject to
approval by the village assembly and district council, and to retain 100% of the revenue
acquired from sales of forest products. Village bylaws are important instruments for the
village to enforce their management regimes and penalise criminal offences. This
includes for instance levying fines on illegal forest use. Village natural resource
committees are accountable sub-committees to the village council and elected by the
village assembly. Their role is to perform forest management activities in the village
(Blomley and Iddi, 2009)
In order to establish a VLFR some minimum legal requirements must be fulfilled. First,
villages must have legal tenure over their land, which means their land must be
classified as “village land” and not “general land”. Second, a village natural resource
committee (VNRC) must be elected by the village assembly whereby gender
considerations must be taken into account. Third, the boundaries of the forest must be
described. If a village shares forestland with neighbouring villages the boundaries
within the forest owned by each village must be described too. Fourth, the village must
develop a forest management plan and bylaws describing how their forest is managed,
used and protected. The management plan and the bylaws must then be approved by the
village assembly and the district council. Following all this, the VLFR is declared and
managed in accordance with the forest management plan, bylaws and normal rules
governing local governments. The Forest Act also allows for a number of villages to
establish a joint village forest management committee and to own and manage a VLFR

312
together. After three years of successful management villages may apply for the formal
“gazettement” of the VLFR by the central government (Blomley and Iddi, 2009).

313
Bibliography
Abrahamsen, R., 2004. The Power of Partnerships in Global Governance. Third World Quarterly 25, 1453–1467.
Adams, B., 2008. Green Development: Environment and Sustainability in a Developing World, 3 edition. ed. Routledge, London ; New York.
Agrawal, A., Angelsen, A., 2009. Using community forest management to achieve REDD+ goals, in: Realising REDD+: National Strategy and Policy Options. CIFOR, Bogor, Indonesia, pp. 201–212.
Agrawal, A., Gibson, C.C., 1999. Enchantment and Disenchantment: The Role of Community in Natural Resource Conservation. World Development 27, 629–649. doi:16/S0305-750X(98)00161-2
Agrawal, A., Nelson, F., Adams, W.M., Sandbrook, C., 2010. Governance and REDD: A Reply to Wunder. Oryx 44, 337–338. doi:10.1017/S0030605310000700
Agrawal, A., Redford, K., 2009. Conservation and displacement: An overview. Conservation and Society 7, 1. doi:10.4103/0972-4923.54790
Ahrends, A., Burgess, N.D., Milledge, S.A.H., Bulling, M.T., Fisher, B., Smart, J.C.R., Clarke, G.P., Mhoro, B.E., Lewis, S.L., 2010. Predictable waves of sequential forest degradation and biodiversity loss spreading from an African city. Proc. Natl. Acad. Sci. U.S.A 107, 14556–14561. doi:10.1073/pnas.0914471107
Akatama, L., 2013. Reduced emissions from deforestation and forest degradation gender analysis of REDD+ and its potential impact on community resources system : case of Angai Villages Land Forest Reserve, Tanzania (Masters dissertation). University of Jyväskylä, Finland.
Altheide, D., Johnson, J., 1998. Criteria for assessing interpretive validity in qualitative research, in: Collecting and Interpreting Qualitative Materials. SAGE, London, pp. 283–312.
Andersson, K., Agrawal, A., 2011. Inequalities, institutions, and forest commons. Global Environmental Change, Symposium on Social Theory and the Environment in the New World (dis)Order 21, 866–875. doi:10.1016/j.gloenvcha.2011.03.004
Angelsen, A., 2008. Moving Ahead with REDD: Issues, Options and Implications. CIFOR.
Angelsen, A. (Ed.), 2009. Realising REDD+: National strategy and policy options. CIFOR, Bogor, Indonesia.
Arsel, M., Büscher, B., 2012. NatureTM Inc.: Changes and Continuities in Neoliberal Conservation and Market-based Environmental Policy. Development and Change 43, 53–78. doi:10.1111/j.1467-7660.2012.01752.x
Bakker, K., 2010. The limits of “neoliberal natures”: Debating green neoliberalism. Progress in Human Geography 34, 715 –735. doi:10.1177/0309132510376849
Balderas Torres, A., MacMillan, D.C., Skutsch, M., Lovett, J.C., 2013. Payments for ecosystem services and rural development: Landowners’ preferences and potential participation in western Mexico. Ecosystem Services 6, 72–81. doi:10.1016/j.ecoser.2013.03.002

314
Ballard, R., 2013. Geographies of development II Cash transfers and the reinvention of development for the poor. Prog Hum Geogr 37, 811–821. doi:10.1177/0309132512474739
Barnett, C., 2005. The consolations of “neoliberalism”. Geoforum, Themed Issue on Critical Geographies of the Caribbean and Latin America 36, 7–12. doi:10.1016/j.geoforum.2004.08.006
Baudron, F., Andersson, J.A., Corbeels, M., Giller, K.E., 2012. Failing to Yield? Ploughs, Conservation Agriculture and the Problem of Agricultural Intensification: An Example from the Zambezi Valley, Zimbabwe. Journal of Development Studies 48, 393–412. doi:10.1080/00220388.2011.587509
BBC, 2013a. Riots over cashew nuts in Tanzania. BBC.
BBC, 2013b. “Signature” deal to protect forests [WWW Document]. BBC News. URL http://www.bbc.com/news/science-environment-25060843 (accessed 3.28.14).
Bebbington, A.J., Hickey, S., Mitlin, D., 2007. Can NGOs Make a Difference? : The Challenge of Development Alternatives, illustrated edition edition. ed. Zed Books Ltd, London ; New York.
Becker, F., 2006. Rural Islamism during the “war on terror”: A Tanzanian case study. Afr Aff (Lond) 105, 583–603. doi:10.1093/afraf/adl003
Benjaminsen, T.A., Overå, R., 2011. Environmental Governance in the South – Discourses/Science/Policies. Forum for Development Studies 38, 235–238. doi:10.1080/08039410.2011.615489
Bernstein, H., Woodhouse, P., 2007. Africa: eco-populist utopias and (micro-)capitalist realities. Socialist Register 43.
Berry, S., 2009. Property, Authority and Citizenship: Land Claims, Politics and the Dynamics of Social Division in West Africa. Development and Change 40, 23–45. doi:10.1111/j.1467-7660.2009.01504.x
Bevan, P., Joireman, S., 1997. The Perils of Measuring Poverty: Identifying the Poor in Rural Ethiopia. Oxford Development Studies 25, 315–342.
Bhaskar, R., 2008. A Realist Theory of Science. Verso, London ; New York.
Bishop, J., Kapila, S., Hicks, F., Mitchell, P., Vorhies, F., 2008. New business models for biodiversity conservation. Journal of Sustainable Forestry 28, 285–303.
Blomley, T., Iddi, S., 2009. Participatory Forest Management in Tanzania: 1993-2009: Lessons learned and experiences to date. Ministry of Natural Resources and Tourism, Tanzania.
Böhm, S., Misoczky, M.C., Moog, S., 2012. Greening Capitalism? A Marxist Critique of Carbon Markets. Organization Studies 33, 1617–1638. doi:10.1177/0170840612463326
Bolin, A., 2010. REDD+ planning from a community perspective: linking the local context with national and global frameworks. A Tanzanian case study (Masters dissertation). University of Leeds, Leeds.
Bottazzi, P., Crespo, D., Soria, H., Dao, H., Serrudo, M., Benavides, J.P., Schwarzer, S., Rist, S., 2014. Carbon Sequestration in Community Forests: Trade-offs, Multiple Outcomes and Institutional Diversity in the Bolivian Amazon. Development and Change 45, 105–131. doi:10.1111/dech.12076

315
Brenner, N., Peck, J., Theodore, N., 2010. After Neoliberalization? Globalizations 7, 327–345. doi:10.1080/14747731003669669
Brenner, N., Theodore, N., 2002. Cities and the Geographies of “Actually Existing Neoliberalism”. Antipode 34, 349–379. doi:10.1111/1467-8330.00246
Bridge, G., Perreault, T., 2009. Chapter 28. Environmental Governance, in: A Companion to Environmental Geography. UK.
Brockhaus, M., Angelsen, A., 2012. Seeing REDD+ through 4Is. A political economy framework, in: Analysing REDD+: Challenges and Choices. CIFOR, Bogor, Indonesia.
Brockington, D., 1998. Land Loss and Livelihoods: The Effects of Eviction on Pastoralists Moved from the Mkomazi Game Reserve, Tanzania (Ph.D. dissertation). University College London, United Kingdom.
Brockington, D., 2002. Fortress Conservation: The Preservation of the Mkomazi Game Reserve, Tanzania. James Currey Publishers.
Brockington, D., 2006. The politics and ethnography of environmentalisms in Tanzania. Afr Aff (Lond) 105, 97–116. doi:10.1093/afraf/adi071
Brockington, D., 2011. Ecosystem services and fictitious commodities. Environmental Conservation 38, 367–369. doi:10.1017/S0376892911000531
Brockington, D., Duffy, R., 2010. Capitalism and Conservation: The Production and Reproduction of Biodiversity Conservation. Antipode 42, 469–484. doi:10.1111/j.1467-8330.2010.00760.x
Brockington, D., Duffy, R., Igoe, J., 2008. Nature Unbound: Conservation, Capitalism and the Future of Protected Areas. Earthscan, London.
Brockington, D., Sullivan, S., 2003. Meaning and Fieldwork - Lessons from Qualitative Research Methodologies, in: Field Work and Development Studies. A Rough Guide. SAGE, London.
Brosius, J.P., 1999. Analyses and Interventions: Anthropological Engagements with Environmentalism. Current Anthropology 40, 277–310. doi:10.1086/ca.1999.40.issue-3
Bryman, A., 2004. Social Research Methods. Oxford University Press, Incorporated.
Bryman, A., Burgess, B., 1994. Analyzing Qualitative Data. Routledge, London ; New York.
Buizer, M., Humphreys, D., de Jong, W., 2014. Climate change and deforestation: The evolution of an intersecting policy domain. Environmental Science & Policy, Climate change and deforestation: the evolution of an intersecting policy domain 35, 1–11. doi:10.1016/j.envsci.2013.06.001
Bukenya, B., Yanguas, P., 2013. Building State Capacity for Inclusive Development: The Politics of Public Sector Reform (SSRN Scholarly Paper No. ID 2386743). Social Science Research Network, Rochester, NY.
Bumpus, A.G., Liverman, D., 2008. Accumulation by Decarbonization and the Governance of Carbon Offsets. Economic Geography 84, 127–155. doi:10.1111/j.1944-8287.2008.tb00401.x
Burgess, N.D., Clairs, T., Danielsen, F., Dalsgaard, S., Funder, M., Hagelberg, N., Harrison, P., Haule, C., Kabalimu, K., Kilahama, F., Kilawe, E., Lewis, S.L., Lovett, J.C., Lyatuu, G., Marshall, A.R., Meshack, C., Miles, L., Milledge,

316
S.A.H., Munishi, P.K.T., Nashanda, E., Shirima, D., Swetnam, R.D., Willcock, S., Williams, A., Zahabu, E., Bahane, B., 2010. Getting ready for REDD plus in Tanzania: a case study of progress and challenges. Oryx 44, 339–351.
Büscher, B., 2013a. Nature 2.0. Geoforum, Global Production Networks, Labour and Development 44, 1–3. doi:10.1016/j.geoforum.2012.08.004
Büscher, B., 2013b. Nature on the Move: The Value and Circulation of Liquid Nature and the Emergence of Fictitious Conservation. New Proposals: Journal of Marxism and Interdisciplinary Inquiry 6, 20–36.
Büscher, B., Dressler, W., 2012. Commodity conservation: The restructuring of community conservation in South Africa and the Philippines. Geoforum, The Global Rise and Local Implications of Market-Oriented Conservation Governance 43, 367–376. doi:10.1016/j.geoforum.2010.06.010
Büscher, B., Sullivan, S., Neves, K., Igoe, J., Brockington, D., 2012. Towards a Synthesized Critique of Neoliberal Biodiversity Conservation. Capitalism Nature Socialism 23, 4–30. doi:10.1080/10455752.2012.674149
Camco, 2009. Feasibility Study to Assess the Potential of the Angai Village Land Forest Reserve to become a Community REDD Project. Camco Advisory Services (T) Limited, Dar es Salaam, Tanzania.
Campbell, B.M., Frost, P., Bryon, N., 1996. Miombo woodlands and their use: Overview of the key issues, in: The Miombo in Transion: Woodland and Welfare in Africa. (Edited by Campbell, B.). CIFOR, Bogor, Indonesia, pp. 1–10.
Campenhout, B.F.H.V., 2007. Locally Adapted Poverty Indicators Derived from Participatory Wealth Rankings: A Case of Four Villages in Rural Tanzania. J Afr Econ 16, 406–438. doi:10.1093/jae/ejl041
Castree, N., 2003. Commodifying what nature? Progress in Human Geography 27, 273 –297. doi:10.1191/0309132503ph428oa
Castree, N., 2008a. Neoliberalising nature: the logics of deregulation and reregulation. Environ. Plann. A 40, 131–152. doi:10.1068/a3999
Castree, N., 2008b. Neoliberalising nature: processes, effects, and evaluations. Environ. Plann. A 40, 153–173. doi:10.1068/a39100
Castree, N., 2010. Neoliberalism and the Biophysical Environment: A Synthesis and Evaluation of the Research. Environment and Society: Advances in Research 1, 5–40.
Castree, N., 2013. Making Sense of Nature. Routledge, Abingdon, Oxon.
CCI, 2011. Angai village forest reserve: Tanzania, Forestry project overview.
Cernea, M., Schmidt-Soltau, K., 2006. Poverty Risks and National Parks: Policy Issues in Conservation and Resettlement. World Development 34, 1808–1830. doi:10.1016/j.worlddev.2006.02.008
Chhatre, A., Agrawal, A., 2008. Forest commons and local enforcement. Proc Natl Acad Sci U S A 105, 13286–13291. doi:10.1073/pnas.0803399105
Chhatre, A., Agrawal, A., 2009. Trade-offs and synergies between carbon storage and livelihood benefits from forest commons. Proc Natl Acad Sci U S A 106, 17667–17670. doi:10.1073/pnas.0905308106

317
Chhatre, A., Lakhanpal, S., Larson, A.M., Nelson, F., Ojha, H., Rao, J., 2012. Social safeguards and co-benefits in REDD+: a review of the adjacent possible. Current Opinion in Environmental Sustainability 4, 654–660. doi:10.1016/j.cosust.2012.08.006
CIFOR, 2009. Realising REDD+: national strategy and policy options. Center for International Forestry Research, Bogor, Indonesia.
CIFOR, 2012. Analysing REDD+ challenges and choices. Center for International Forestry Research, Bogor, Indonesia.
Clements, T., 2010. Reduced Expectations: The Political and Institutional Challenges of REDD+. Oryx 44, 309–310. doi:10.1017/S0030605310000712
Connell, R., Dados, N., 2014. Where in the world does neoliberalism come from? Theor Soc 43, 117–138. doi:10.1007/s11186-014-9212-9
Conte, C.A., 1999. The forest becomes desert: forest use and environmental change in Tanzania’s West Usambara mountains. Land Degrad. Dev. 10, 291–309. doi:10.1002/(SICI)1099-145X(199907/08)10:4<291::AID-LDR363>3.0.CO;2-W
Cooke, B., Kothari, U., 2001. Participation: The New Tyranny? Zed Books Ltd, London ; New York.
Corbera, E., 2012. Problematizing REDD+ as an experiment in payments for ecosystem services. Current Opinion in Environmental Sustainability 4, 612–619. doi:10.1016/j.cosust.2012.09.010
Corbera, E., Brown, K., 2010. Offsetting benefits? Analyzing access to forest carbon. Environment and Planning A 42, 1739 – 1761. doi:10.1068/a42437
Corbera, E., Brown, K., Adger, W.N., 2007. The Equity and Legitimacy of Markets for Ecosystem Services. Development and Change 38, 587–613. doi:10.1111/j.1467-7660.2007.00425.x
Corbera, E., Brown, K., Estrada, M., 2010. Reducing greenhouse gas emissions from deforestation and forest degradation in developing countries: revisiting the assumptions. Climatic Change 100, 355–388. doi:10.1007/s10584-009-9773-1
Corbera, E., Pascual, U., 2012. Ecosystem Services: Heed Social Goals. Science 335, 655–656. doi:10.1126/science.335.6069.655-c
Corbera, E., Schroeder, H., 2011. Governing and implementing REDD. Environmental Science Policy 14, 89–99. doi:10.1016/j.envsci.2010.11.002
Corson, C., 2011. Territorialization, enclosure and neoliberalism: non-state influence in struggles over Madagascar’s forests. Journal of Peasant Studies 38, 703–726. doi:10.1080/03066150.2011.607696
Costanza, R., d’ Arge, R., Groot, R. de, Farber, S., Grasso, M., Hannon, B., Limburg, K., Naeem, S., O’Neill, R.V., Paruelo, J., Raskin, R.G., Sutton, P., Belt, M. van den, 1997. The value of the world’s ecosystem services and natural capital. , Published online: 15 May 1997; | doi:10.1038/387253a0 387, 253–260. doi:10.1038/387253a0
Cotula, L., Mayers, J., 2009. Tenure in REDD: Start-point or afterthought ( No. Natural Resource Issues No. 15). International Institute for Environment and Development, London, UK.
318
Covarrubias,, K., Nsiima, L., Zezza, A., 2012. Livestock and livelihoods in rural Tanzania. A descriptive analysis of the 2009 National Panel Survey. LSMS-ISA.
Craig, D., Porter, D., 2006. Development Beyond Neoliberalism?: Governance, Poverty Reduction and Political Economy. New York ; Routledge.
Creswell, J.W., 2008. Research Design: Qualitative, Quantitative, and Mixed Methods Approaches. Sage.
CSC, FAO, 1993. Non-Wood Forest Products - A Regional Expert Consultation for English-Speaking African Countries. Series Number CSC(94)AGR-21 Technical Paper 306 [WWW Document]. URL http://www.fao.org/docrep/x5325e/x5325e00.htm#Contents (accessed 3.22.14).
Davis, K., Nkonya, E., Kato, E., Mekonnen, D.A., Odendo, M., Miiro, R., Nkuba, J., 2012. Impact of Farmer Field Schools on Agricultural Productivity and Poverty in East Africa. World Development 40, 402–413. doi:10.1016/j.worlddev.2011.05.019
Deloitte, 2012. Mid-term review report of Nine NGO REDD+ Pilot Projects in Tanzania - Tanzania Forest Conservation Group (TFCG) – “Making REDD work for Communities and Forest Conservation in Tanzania”. Deloitte, Dar es Salaam, Tanzania.
Denscombe, M., 2007. The Good Research Guide for small-scale social research projects. McGraw-Hill, New York.
Denzin, N.K., Lincoln, Y.S. (Eds.), 1998. Collecting and interpreting qualitative materials. Sage Publications, Thousand Oaks, Calif.
Dove, M., Carpenter, C., 2008. Environmental anthropology: a historical reader, Blackwell anthologies in social & cultural anthropology. Blackwell Pub, Malden, MA.
Dressler, W., Buescher, B., SCHOON, M., BROCKINGTON, D., HAYES, T., KULL, C.A., MCCARTHY, J., SHRESTHA, K., 2010. From Hope to Crisis and Back Again? A Critical History of the Global CBNRM Narrative. Environmental Conservation 37, 5–15. doi:10.1017/S0376892910000044
Drury, R., Homewood, K., Randall, S., 2011. Less is more: the potential of qualitative approaches in conservation research. Animal Conservation 14, 18–24. doi:10.1111/j.1469-1795.2010.00375.x
Ebeling, J., Yasue, M., 2008. Generating carbon finance through avoided deforestation and its potential to create climatic, conservation and human development benefits.
Economist, 2013. Another shabby Warsaw Pact. The Economist.
Eliasch, J., 2008. Climate change: financing global forests: the Eliasch review. TSO, London.
Ellis, F., Mdoe, N., 2003. Livelihoods and Rural Poverty Reduction in Tanzania. World Development 31, 1367–1384. doi:10.1016/S0305-750X(03)00100-1
Engel, S., Pagiola, S., Wunder, S., 2008. Designing payments for environmental services in theory and practice: An overview of the issues. Ecological Economics 65, 663–674. doi:16/j.ecolecon.2008.03.011

319
Evans, K., Murphy, L., de Jong, W., 2014. Global versus local narratives of REDD: A case study from Peru’s Amazon. Environmental Science & Policy 35, 98–108. doi:10.1016/j.envsci.2012.12.013
Evans, P., 2004. Development as institutional change: The pitfalls of monocropping and the potentials of deliberation. St Comp Int Dev 38, 30–52. doi:10.1007/BF02686327
FAO, 2009. Scaling-up Conservation Agriculture in Africa: Strategy and Approaches. The FAO Subregional Office for Eastern Africa, Addis Ababa.
FAO, 2013. National forest assessments - country projects [WWW Document]. URL http://www.fao.org/forestry/17847/en/tza/ (accessed 4.15.14).
FAO, 2014. FAO:AG:Conservation agriculture [WWW Document]. URL http://www.fao.org/ag/ca/1a.html (accessed 5.8.14).
Ferguson, J., 2006. Global Shadows: Africa in the Neoliberal World Order. Duke University Press Books.
Ferguson, J., 2010. The Uses of Neoliberalism. Antipode 41, 166–184. doi:10.1111/j.1467-8330.2009.00721.x
Fletcher, R., 2010. Neoliberal environmentality: Towards a poststructuralist political ecology of the conservation debate. Conservation and Society 8, 171. doi:10.4103/0972-4923.73806
Forrester-Kibuga, K., Nguya, N., Chikira, H., Luwuge, B., Doggart, N., 2011. Integrating the principles of free, prior and informed consent in the establishment of REDD: a case study from Tanzania. TFCG Technical Report 27.
Forrester-Kibuga, K., Samweli, B., 2010. TFCG Technial Report 26: Analysis of the drivers of deforestation and stakeholders in the Lindi project site. TFCG.
Friis-Hansen, E., Duveskog, D., 2012. The Empowerment Route to Well-being: An Analysis of Farmer Field Schools in East Africa. World Development 40, 414–427. doi:10.1016/j.worlddev.2011.05.005
Frost, P., 1996. The ecology of Miombo woodlands, in: The Miombo in Transition: Woodlands and Welfare in Africa. (Edited by Campbell, B.). CIFOR, Bogor, Indonesia, pp. 11–57.
Gardner, T.A., Burgess, N.D., Aguilar-Amuchastegui, N., Barlow, J., Berenguer, E., Clements, T., Danielsen, F., Ferreira, J., Foden, W., Kapos, V., Khan, S.M., Lees, A.C., Parry, L., Roman-Cuesta, R.M., Schmitt, C.B., Strange, N., Theilade, I., Vieira, I.C.G., 2012. A framework for integrating biodiversity concerns into national REDD+ programmes. Biological Conservation, REDD+ and conservation 154, 61–71. doi:10.1016/j.biocon.2011.11.018
Geist, H.J., Lambin, E.F., 2001. What drives deforestation? A meta-analysis of proximate and underlying causes of deforestation based on subnational case study evidence ( No. LUCC Report Series No. 4). LUCC International Project Office, Louvain-la-Neuve.
Giller, K.E., Witter, E., Corbeels, M., Tittonell, P., 2009. Conservation agriculture and smallholder farming in Africa: The heretics’ view. Field Crops Research 114, 23–34. doi:10.1016/j.fcr.2009.06.017

320
Goldman, M., 2001. Constructing an environmental state: Eco-governmentality and other trans-national practices of a “green” World Bank. Social Problems 48, 499–523.
Golooba-Mutebi, F., Hickey, S., 2010. Governing Chronic Poverty under Inclusive Liberalism: The Case of the Northern Uganda Social Action Fund. Journal of Development Studies 46, 1216–1239. doi:10.1080/00220388.2010.487097
Gómez-Baggethun, E., de Groot, R., Lomas, P.L., Montes, C., 2010. The history of ecosystem services in economic theory and practice: From early notions to markets and payment schemes. Ecological Economics 69, 1209–1218. doi:10.1016/j.ecolecon.2009.11.007
Grainger, M., Geary, K., 2011. The New Forests Company and its Uganda plantations. Oxfam International.
Griffiths, T., 2009. Seeing “REDD”? Forests, climate change mitigation and the rights of indivenous peoples and local communities ( No. Updated Version). The Forest Peoples Programme, UK.
Guardian, 2013. Green groups walk out of UN climate talks. The Guardian.
Hammersley, M., Atkinson, P., 2007. Ethnography: Principles in Practice, 3Rev Ed edition. ed. Routledge, London ; New York.
Harvey, C.A., Dickson, B., Kormos, C., 2010. Opportunities for achieving biodiversity conservation through REDD. Conservation Letters 3, 53–61. doi:10.1111/j.1755-263X.2009.00086.x
Harvey, D., 2005. A Brief History of Neoliberalism. Oxford University Press, USA.
Harvey, D., 2011. The Enigma of Capital: And the Crises of Capitalism. Profile Books, London.
Herbert, S., 2000. For ethnography. Prog Hum Geogr 24, 550–568. doi:10.1191/030913200100189102
Heynen, N., McCarthy, J., Prudham, W.S., Robbins, P., 2007. Neoliberal Environments: False Promises and Unnatural Consequences. Routledge, London: New York.
Heynen, N., Robbins, P., 2005. The neoliberalization of nature: Governance, privatization, enclosure and valuation. Capitalism Nature Socialism 16, 5–8. doi:10.1080/1045575052000335339
Hickey, S., 2008. The return of politics in development studies I getting lost within the poverty agenda? Progress in Development Studies 8, 349–358. doi:10.1177/146499340800800405
Hickey, S., 2010. The Government of Chronic Poverty: From Exclusion to Citizenship? Journal of Development Studies 46, 1139–1155. doi:10.1080/00220388.2010.487100
Hickey, S., 2012a. Turning Governance Thinking Upside-down? Insights from “the politics of what works”. Third World Quarterly 33, 1231–1247. doi:10.1080/01436597.2012.695516
Hickey, S., 2012b. Beyond “Poverty Reduction through Good Governance”: The New Political Economy of Development in Africa. New Political Economy 17, 683–690. doi:DOI: 10.1080/13563467.2012.732274

321
Hickey, S., 2013. Thinking about the politics of inclusive development: towards a relational approach. ( No. ESID Working Paper Series (2013)). ESID, University of Manchester, Manchester.
Hickey, S., Mohan, G., 2005. Relocating Participation within a Radical Politics of Development. Development and Change 36, 237–262. doi:10.1111/j.0012-155X.2005.00410.x
Hilgers, M., 2013. Embodying neoliberalism: thoughts and responses to critics. Social Anthropology 21, 75–89. doi:10.1111/1469-8676.12010
Hirsch, ADAMS, W.M., BROSIUS, J.P., ZIA, A., BARIOLA, N., DAMMERT, J.L., 2011. Acknowledging Conservation Trade‐Offs and Embracing Complexity. Conservation Biology 25, 259–264. doi:10.1111/j.1523-1739.2010.01608.x
Hirsch, P.D., Adams, W.M., Brosius, J.P., Zia, A., Bariola, N., Dammert, J.L., 2011. Reconocimiento los Trade-offs de la Conservación y Atención a la Complejidad. Conservation Biology 25, 259–264. doi:10.1111/j.1523-1739.2010.01608.x
Holmgren, S., 2013. REDD+ in the making: Orders of knowledge in the climate–deforestation nexus. Environmental Science & Policy 33, 369–377. doi:10.1016/j.envsci.2013.04.007
HOUGHTON, R.A., 2003. Revised estimates of the annual net flux of carbon to the atmosphere from changes in land use and land management 1850–2000. Tellus B 55, 378–390. doi:10.1034/j.1600-0889.2003.01450.x
Hulme, D., Murphree, M., 1999. Communities, wildlife and the “new conservation” in Africa. Journal of International Development 11, 277–285. doi:10.1002/(SICI)1099-1328(199903/04)11:2<277::AID-JID582>3.0.CO;2-T
Igoe, J., 2010. The spectacle of nature in the global economy of appearances: Anthropological engagements with the spectacular mediations of transnational conservation. Critique of Anthropology 30, 375–397. doi:10.1177/0308275X10372468
Igoe, J., Brockington, D., 2007. Neoliberal Conservation: A Brief Introduction [WWW Document]. URL http://www.conservationandsociety.org/article.asp?issn=0972-4923;year=2007;volume=5;issue=4;spage=432;epage=449;aulast=Igoe (accessed 5.28.11).
Igoe, J., Neves, K., Brockington, D., 2010. A Spectacular Eco‐Tour around the Historic Bloc: Theorising the Convergence of Biodiversity Conservation and Capitalist Expansion. Antipode 42, 486–512. doi:10.1111/j.1467-8330.2010.00761.x
IPCC, 2007. Contribution of Working Groups I, II and III to the Fourth Assessment Report of the Intergovernmental Panel on Climate Change. IPCC, Geneva, Switzerland.
IPCC, 2014. Climate Change 2013: The Physical Science Basis (Fifth Assessment Report). IPCC, Geneva, Switzerland.
Islam, M.M., Gray, D., Reid, J., Kemp, P., 2011. Developing Sustainable Farmer-led Extension Groups: Lessons from a Bangladeshi Case Study. The Journal of Agricultural Education and Extension 17, 425–443. doi:10.1080/1389224X.2011.596658
Johansson, T., 2008. Beasts on Fields. Human-Wildlife Conflicts in Nature-Culture Borderlands. (Ph.D. dissertation). University of Helsinki, Helsinki.

322
Joshi, L., Karky, B.S., Poudel, K.C., Bhattarai, K., Dangi, R., Acharya, K., Uprety, B., Singh, V., Chand, N., Manandhar, U., 2013. Co-Benefits of REDD+ in Community Managed Forests in Nepal. Journal of Forest and Livelihood 11. doi:10.3126/jfl.v11i2.8623
Kaale, B., 2010. CAPACITY BUILDING OF MUHIMA ANGAI VILLAGE LAND FOREST RESERVE (AVLFR) IN LIWALE DISTRICT – LINDI REGION TANZANIA.
Kamat, S., 2004. The privatization of public interest: theorizing NGO discourse in a neoliberal era. Review of International Political Economy 11, 155–176. doi:10.1080/0969229042000179794
Kanninen, M., Murdiyarso, D., Seymour, F., Angelsen, A., Wunder, S., German, L., 2007. Do trees grow on money? The implications of deforestation research for policies to promote REDD. CIFOR, Bogor, Indonesia.
Kanowski, P.J., McDermott, C.L., Cashore, B.W., 2011. Implementing REDD+: lessons from analysis of forest governance. Environmental Science & Policy 14, 111–117. doi:10.1016/j.envsci.2010.11.007
Karsenty, A., 2008. Special Issue: REDD and the Evolution of an International Forest Regime - FOREWORD. International Forestry Review 10, 423–423. doi:10.1505/ifor.10.3.423
Kassam, A., Friedrich, T., Shaxson, F., Pretty, J., 2009. The spread of Conservation Agriculture: justification, sustainability and uptake<SUP>1</SUP> International Journal of Agricultural Sustainability 7, 292–320. doi:10.3763/ijas.2009.0477
Kilama, B., 2013. The diverging South : comparing the cashew sectors of Tanzania and Vietnam (Ph.D. dissertation). Leiden University, Netherlands.
Kinzig, A.P., Perrings, C., Chapin, F.S., Polasky, S., Smith, V.K., Tilman, D., Turner, B.L., 2011. Paying for Ecosystem Services—Promise and Peril. Science 334, 603–604. doi:10.1126/science.1210297
Klak, T., Wiley, J., Mullaney, E.G., Peteru, S., Regan, S., Merilus, J.-Y., 2011. Inclusive neoliberalism? Perspectives from Eastern Caribbean farmers. Progress in Development Studies 11, 33–61. doi:10.1177/146499341001100103
Knowler, D., Bradshaw, B., 2007. Farmers’ adoption of conservation agriculture: A review and synthesis of recent research. Food Policy 32, 25–48. doi:10.1016/j.foodpol.2006.01.003
Korhonen-Kurki, K., Sehring, J., Brockhaus, M., Di Gregorio, M., 2014. Enabling factors for establishing REDD+ in a context of weak governance. Climate Policy 14, 167–186. doi:10.1080/14693062.2014.852022
Kosoy, N., Corbera, E., 2010. Payments for ecosystem services as commodity fetishism. Ecological Economics 69, 1228–1236. doi:16/j.ecolecon.2009.11.002
Lansing, D.M., 2011. Realizing Carbon’s Value: Discourse and Calculation in the Production of Carbon Forestry Offsets in Costa Rica. Antipode 43, 731–753. doi:10.1111/j.1467-8330.2011.00886.x
Lansing, D.M., 2013. Understanding linkages between ecosystem service payments, forest plantations, and export agriculture. Geoforum 47, 103–112. doi:10.1016/j.geoforum.2013.03.009

323
Larson, A.M., Brockhaus, M., Sunderlin, W.D., Duchelle, A., Babon, A., Dokken, T., Pham, T.T., Resosudarmo, I.A.P., Selaya, G., Awono, A., Huynh, T.-B., 2013. Land tenure and REDD+: The good, the bad and the ugly. Global Environmental Change 23, 678–689. doi:10.1016/j.gloenvcha.2013.02.014
Larson, A.M., Petkova, E., 2011. An Introduction to Forest Governance, People and REDD+ in Latin America: Obstacles and Opportunities. Forests 2, 86–111. doi:10.3390/f2010086
Lawlor, K., Madeira, E.M., Blockhus, J., Ganz, D.J., 2013. Community Participation and Benefits in REDD+: A Review of Initial Outcomes and Lessons. Forests 4, 296–318. doi:10.3390/f4020296
Lazar, S., 2012. Citizenship Quality: A new agenda for development? Journal of Civil Society 8, 333–350.
Leach, M., 1996. The Lie of the Land: Challenging Received Wisdom on the African Environment. International African Institute.
Leach, M., Scoones, I., 2013. Carbon forestry in West Africa: The politics of models, measures and verification processes. Global Environmental Change 23, 957–967. doi:10.1016/j.gloenvcha.2013.07.008
Lederer, M., 2012. REDD+ governance. Wiley Interdisciplinary Reviews: Climate Change 3, 107–113. doi:10.1002/wcc.155
Leftwich, A., 2004. What is Politics?: The Activity and Its Study, New Ed edition. ed. Polity Press, Oxford.
Lele, S., Wilshusen, P., Brockington, D., Seidler, R., Bawa, K., 2010. Beyond exclusion: alternative approaches to biodiversity conservation in the developing tropics. Current Opinion in Environmental Sustainability 2, 94–100. doi:10.1016/j.cosust.2010.03.006
Li, T.M., 2007. The Will to Improve: Governmentality, Development, and the Practice of Politics. Duke University Press, Durham.
Liamputtong, P., 2011. Focus Group Methodology: Principle and Practice. SAGE.
LIMAS, 2010. Lindi & Mtwara Agri-Business Support: Project Document.
LIMAS, 2011. Searching for business opportunities.
LIMAS Newsletter, 2011. Extension agents learn Conservation Agriculture. Limas Newsletter, issue 1.
LIMAS Newsletter, 2013. “Go for Conservation Agriculture”, says Minister, Hon. Mathias Chikawe. LIMAS Newsletter, issue 10.
Lin, L., Pattanayek, S.K., Sills, E.O., Sunderlin, W.D., 2012. Site selection for forest carbon projects, in: Analysing REDD+: Challenges and Choices. CIFOR, Bogor, Indonesia.
Liverman, D.M., Vilas, S., 2006. Neoliberalism and the Environment in Latin America. Annu. Rev. Environ. Resourc. 31, 327–363. doi:10.1146/annurev.energy.29.102403.140729
Lohmann, L., 2009. Climate as Investment. Development and Change 40, 1063–1083. doi:10.1111/j.1467-7660.2009.01612.x

324
Lovera, S., 2009. REDD realities, in: Contours of Climate Justice: Ideas for Shaping New Climate And Energy Politics, Dag Hammarskjöld Foundation Occasional Paper No. 6. Dag Hammarskjöld Foundation, Uppsala, Sweden.
Mabry, L., 2009. Case Study in Social Research, in: Alasuutari, P., Bickman, L., Brannen, J. (Eds.), The Sage Handbook of Social Research Methods. Sage, London, UK.
Mahanty, S., Dressler, W., Milne, S., Filer, C., 2013a. Unravelling property relations around forest carbon. Singapore Journal of Tropical Geography 34, 188–205. doi:10.1111/sjtg.12024
Mahanty, S., Suich, H., Tacconi, L., 2013b. Access and benefits in payments for environmental services and implications for REDD+: Lessons from seven PES schemes. Land Use Policy 31, 38–47. doi:10.1016/j.landusepol.2011.10.009
Mansfield, B., 2007. Privatization: Property and the Remaking of Nature–Society Relations Introduction to the Special Issue. Antipode 39, 393–405. doi:10.1111/j.1467-8330.2007.00532.x
Mashindano, O., Kihenzile, P., 2013. ASSESSMENT OF PRACTICES OF AGRICULTURAL PRODUCTION, MARKETING AND DOMESTIC TRADE POLICIES IN TANZANIA. The Case of Sesame (ESRF Discussion Paper No. 45). ESRF, Dar es Salaam, Tanzania.
Mashindano, O., Maro, F., 2011. Growth without poverty reduction in Tanzania: Reasons for the mismatch. ESRF, Chronic Poverty Research Centre, Dar es Salaam, Tanzania.
Mayrand, K., Paquin, M., 2004. Payments for environmental services: A survey and assessment of current schemes (Working Paper). Unisféra International Centre for the Commission for Environmental Cooperation of North America, Montreal, Canada.
Mbembe, A., 2001. On the Postcolony. University of California Press, Berkeley.
McAfee, K., 1999. Selling nature to save it? Biodiversity and green developmentalism. Environment and Planning D: Society and Space 17, 133 – 154. doi:10.1068/d170133
McAfee, K., 2012. The Contradictory Logic of Global Ecosystem Services Markets. Development and Change 43, 105–131. doi:10.1111/j.1467-7660.2011.01745.x
McAfee, K., Shapiro, E.N., 2010. Payments for Ecosystem Services in Mexico: Nature, Neoliberalism, Social Movements, and the State. Annals of the Association of American Geographers 100, 579. doi:10.1080/00045601003794833
McCarthy, J., 2005. Devolution in the woods: community forestry as hybrid neoliberalism. Environment and Planning A 37, 995 – 1014. doi:10.1068/a36266
McCarthy, J., Prudham, S., 2004. Neoliberal nature and the nature of neoliberalism. Geoforum 35, 275–283. doi:16/j.geoforum.2003.07.003
McEvoy, P., Richards, D., 2006. A critical realist rationale for using a combination of quantitative and qualitative methods. Journal of Research in Nursing 11, 66–78. doi:10.1177/1744987106060192
MEA, 2005. Millennium Ecosystem Assessment: Ecosystems and Human Well-being: Synthesis. Island Press, Washington, D.C.

325
Melick, D., 2010. Credibility of REDD and Experiences from Papua New Guinea. Conservation Biology 24, 359–361. doi:10.1111/j.1523-1739.2010.01471.x
Merger, E., Held, C., Tennigkeit, T., Blomley, T., 2012. A bottom-up approach to estimating cost elements of REDD+ pilot projects in Tanzania. Carbon Balance and Management 7, 9. doi:10.1186/1750-0680-7-9
Milne, S., 2009. Global ideas, local realities: The political ecology of payments for biodiversity conservation services in Cambodia (PhD). University of Cambridge, Cambridge.
Milne, S., Adams, B., 2012. Market Masquerades: Uncovering the Politics of Community-level Payments for Environmental Services in Cambodia. Development and Change 43, 133–158. doi:10.1111/j.1467-7660.2011.01748.x
Mitlin, D., Hickey, S., Bebbington, A., 2007. Reclaiming Development? NGOs and the Challenge of Alternatives. World Development 35, 1699–1720. doi:10.1016/j.worlddev.2006.11.005
MNRT, 2008. PARTICIPATORY FOREST MANAGEMENT PLAN FOR ANGAI VILLAGES FOREST RESERVE IN LIWALE DISTRICT, LINDI REGION.
Mpingo, 2013. Reducing Drivers of Deforestation: Mpingo Conservation & Development Initiative [WWW Document]. URL http://www.mpingoconservation.org/redd/mcdis-redd-project/reducing-drivers-of-deforestation/ (accessed 4.15.14).
Mukama, K., 2010. PARTICIPATORY FOREST CARBON ASSESSMENT IN ANGAI VILLAGE LAND FOREST RESERVE IN LIWALE DISTRICT, LINDI REGION, TANZANIA. SOKOINE UNIVERSITY OF AGRICULTURE, Tanzania.
Mukama, K., Mustalahti, I., Zahabu, E., 2011. Participatory Forest Carbon Assessment and REDD. International Journal of Forestry Research 2012, e126454. doi:10.1155/2012/126454
Muradian, R., 2013. Payments for Ecosystem Services as Incentives for Collective Action. Society & Natural Resources 26, 1155–1169. doi:10.1080/08941920.2013.820816
Muradian, R., Arsel, M., Pellegrini, L., Adaman, F., Aguilar, B., Agarwal, B., Corbera, E., Ezzine de Blas, D., Farley, J., Froger, G., Garcia-Frapolli, E., Gómez-Baggethun, E., Gowdy, J., Kosoy, N., Le Coq, J. f., Leroy, P., May, P., Méral, P., Mibielli, P., Norgaard, R., Ozkaynak, B., Pascual, U., Pengue, W., Perez, M., Pesche, D., Pirard, R., Ramos-Martin, J., Rival, L., Saenz, F., Van Hecken, G., Vatn, A., Vira, B., Urama, K., 2013. Payments for ecosystem services and the fatal attraction of win-win solutions. Conservation Letters 6, 274–279. doi:10.1111/j.1755-263X.2012.00309.x
Muradian, R., Corbera, E., Pascual, U., Kosoy, N., May, P.H., 2010. Reconciling theory and practice: An alternative conceptual framework for understanding payments for environmental services. Ecological Economics, Special Section - Payments for Environmental Services: Reconciling Theory and Practice 69, 1202–1208. doi:10.1016/j.ecolecon.2009.11.006
Murray, W.E., 2009. Neoliberalism and Development, in: Kitchin, R., Thrift, N. (Eds.), International Encyclopedia of Human Geography. Elsevier, Oxford, pp. 379–384.

326
Mustalahti, I., 2007. Msitu wa Angai: haraka, haraka, haina baraka! why does handing over the Angai forest to local villages proceed so slowly?, in: Anomalies of Aid: A Festschrift for Juhani Koponen. University of Helsinki, Helsinki, pp. 168–186.
Mustalahti, I., 2009. Action Research in Angai Villages Land Forest Reserve in South-eastern Tanzania – Participatory Forest Management in REDD [WWW Document]. URL http://blogs.helsinki.fi/tzredd-actionresearch/?page_id=2 (accessed 4.7.14).
Mustalahti, I., Bolin, A., Boyd, E., Paavola, J., 2012. Can REDD+ Reconcile Local Priorities and Needs with Global Mitigation Benefits? Lessons from Angai Forest, Tanzania. Ecology and Society 17. doi:10.5751/ES-04498-170116
Mustalahti, I., Lund, J.F., 2010. Where and How Can Participatory Forest Management Succeed? Learning From Tanzania, Mozambique, and Laos. Society & Natural Resources: An International Journal 23, 31. doi:10.1080/08941920802213433
Mustalahti, I., Tassa, D.T., 2012. Analysis of three crucial elements of REDD+ in participatory forest management. Scandinavian Journal of Forest Research 27, 200–209. doi:10.1080/02827581.2011.635083
Naughton-Treves, L., Wendland, K., 2014. Land Tenure and Tropical Forest Carbon Management. World Development, Land Tenure and Forest Carbon Management 55, 1–6. doi:10.1016/j.worlddev.2013.01.010
NBS, 2013a. KEY FINDINGS. 2011/12 HOUSEHOLD BUDGET SURVEY TANZANIA MAINLAND. Ministry of Finance, National Bureau of Statistics, Tanzania, Dar es Salaam.
NBS, 2013b. Tanzania in figures 2012. Ministry of Finance, National Bureau of Statistics, Tanzania.
NBS, 2013c. 2012 Population and housing census. Population Distribution by Administrative Areas. National Bureau of Statistics, Ministry of Finance, Dar es Salaam, Tanzania.
NBS, 2013d. EMPLOYMENT AND EARNINGS SURVEY 2012. ANALYTICAL REPORT. National Bureau of Statistics, Ministry of Finance, Dar es Salaam, Tanzania.
Nelson, K.C., de Jong, B.H.J., 2003. Making global initiatives local realities: carbon mitigation projects in Chiapas, Mexico. Global Environmental Change 13, 19–30. doi:10.1016/S0959-3780(02)00088-2
Neuwinger, H.D., 1996. African ethnobotany: poisons and drugs : chemistry, pharmacology, toxicology. Chapman & Hall, London; New York.
Newell, P., Paterson, M., 2010. Climate Capitalism: Global Warming and the Transformation of the Global Economy. Cambridge University Press.
Nkonya, N., Barreiro-Hurle, J., 2013. Analysis of incentives and disincentives for cashew nuts in the United Republic of Tanzania, Technical note series. MAFAP, FAO, Rome.
No REDD, 2011. NO REDD Papers Volume One. Charles Overbeck/Eberhardt Press, Portland, Oregon USA.
O’Reilly, K., 2010. The Promise of Patronage: Adapting and Adopting Neoliberal Development. Antipode 42, 179–200. doi:10.1111/j.1467-8330.2009.00736.x

327
Osborne, T.M., 2011. Carbon forestry and agrarian change: access and land control in a Mexican rainforest. Journal of Peasant Studies 38, 859–883. doi:10.1080/03066150.2011.611281
Ostrom, E., 1990. Governing the Commons: The Evolution of Institutions for Collective Action. Cambridge University Press.
Ostrom, E., Nagendra, H., 2006. Insights on linking forests, trees, and people from the air, on the ground, and in the laboratory. Proceedings of the National Academy of Sciences 103, 19224 –19231. doi:10.1073/pnas.0607962103
Pagiola, S., Arcenas, A., Platais, G., 2005. Can Payments for Environmental Services Help Reduce Poverty? An Exploration of the Issues and the Evidence to Date from Latin America. World Development 33, 237–253. doi:10.1016/j.worlddev.2004.07.011
Palmer, C., Silber, T., 2012. Trade-offs between carbon sequestration and rural incomes in the N’hambita Community Carbon Project, Mozambique. Land Use Policy 29, 83–93. doi:10.1016/j.landusepol.2011.05.007
Palmer Fry, B., 2011. Community forest monitoring in REDD+: the “M” in MRV? Environmental Science & Policy, Governing and Implementing REDD+ 14, 181–187. doi:10.1016/j.envsci.2010.12.004
Peck, J., 2013a. Constructions of Neoliberal Reason, Reprint edition. ed. OUP Oxford, Oxford.
Peck, J., 2013b. Explaining (with) Neoliberalism. Territory, Politics, Governance 1, 132–157. doi:10.1080/21622671.2013.785365
Peck, J., Theodore, N., 2012. Reanimating neoliberalism: process geographies of neoliberalisation. Social Anthropology 20, 177–185. doi:10.1111/j.1469-8676.2012.00194.x
Peluso, N.L., 2005. Seeing Properties in Land Use: Local Territorializations in West Kalimantan, Indonesia. Geografisk Tidsskrift: Danish Journal of Geography 105.
Peluso, N.L., Lund, C., 2011. New frontiers of land control: Introduction. Journal of Peasant Studies 38, 667–681. doi:10.1080/03066150.2011.607692
Perreault, T., Martin, P., 2005. Guest EditorialGeographies of neoliberalism in Latin America. Environment and Planning A 37, 191 – 201. doi:10.1068/a37394
Peters-Stanley, M., Gonzalez, G., Yin, D., 2013. Covering New Ground: State of the Forest Carbon Markets 2013. Ecosystem Marketplace and Bloomberg New Energy Finance, Washington, DC and New York.
Peters-Stanley, M., Yin, D., 2013. Maneuvering the Mosaic: State of the Voluntary Carbon markets 2013. A Report by Forest Trends’ Ecosystem Marketplace & Bloomberg New Energy Finance. Ecosystem Marketplace and Bloomberg New Energy Finance, Washington, DC and New York.
Phelps, J., Webb, E.L., Adams, W.M., 2012. Biodiversity co-benefits of policies to reduce forest-carbon emissions. Nature Clim. Change 2, 497–503. doi:10.1038/nclimate1462
Phelps, J., Webb, E.L., Agrawal, A., 2010. Does REDD+ Threaten to Recentralize Forest Governance? Science 328, 312–313. doi:10.1126/science.1187774

328
Pistorius, T., 2012. From RED to REDD+: the evolution of a forest-based mitigation approach for developing countries. Current Opinion in Environmental Sustainability, 4/6 Climate systems 4, 638–645. doi:10.1016/j.cosust.2012.07.002
Poteete, A.R., Ribot, J.C., 2011. Repertoires of Domination: Decentralization as Process in Botswana and Senegal. World Development 39, 439–449.
Potts, M.D., Kelley, L.C., Doll, H.M., 2013. Maximizing biodiversity co-benefits under REDD+: a decoupled approach. Environ. Res. Lett. 8, 024019. doi:10.1088/1748-9326/8/2/024019
Poudyal, B.H., Paudel, G., Luintel, H., 2013. Enhancing REDD+ Outcomes through Improved Governance of Community Forest Groups. Journal of Forest and Livelihood 11, 14–26. doi:10.3126/jfl.v11i2.8618
Rengert, G., 1997. Review symposium. Urban Geography 18, 468–469.
Research and Analysis Working Group, 2011. Poverty and Human Development Report 2011. Research and Analysis Working Group, United Republic of Tanzania, Tanzania, Dar es Salaam.
Ribot, J., Larson, A.M., 2012. Reducing REDD risks: affirmative policy on an uneven playing field. International Journal of the Commons 6, 233–254.
Ribot, J.C., 2004. Waiting for democracy : the politics of choice in natural resource decentralization [WWW Document].
Ribot, J.C., 2006. Choose Democracy: Environmentalists’ Socio-political Responsibility. Global Environmental Change 16, 115–119.
Ribot, J.C., Lund, J.F., Treue, T., 2010. Democratic Decentralization in Sub-Saharan Africa: Its Contribution to Forest Management, Livelihoods, and Enfranchisement. Environmental Conservation 37, 35–44. doi:10.1017/S0376892910000329
Ribot, J.C., Peluso, N.L., 2003. A Theory of Access*. Rural Sociology 68, 153–181. doi:10.1111/j.1549-0831.2003.tb00133.x
Roe, E.M., 1991. Development narratives, or making the best of blueprint development. World Development 19, 287–300.
Roth, R.J., Dressler, W., 2012. Market-oriented conservation governance: The particularities of place. Geoforum 43, 363–366. doi:10.1016/j.geoforum.2012.01.006
S. Dondeyne, A.W., 2004. Soils and vegetation of Angai forest: ecological insights from a participatory survey in South Eastern Tanzania. African Journal of Ecology 42, 198 – 207. doi:10.1111/j.1365-2028.2004.00513.x
Sachedina, H., 2008. Wildlife is our oil: conservation, livelihoods and NGOs in the Tarangire ecosystem, Tanzania (Ph.D. dissertation). University of Oxford, United Kingdom.
Sandbrook, C., Nelson, F., Adams, W.M., Agrawal, A., 2010. Carbon, Forests and the REDD Paradox. Oryx 44, 330–334. doi:10.1017/S0030605310000475
Sayer, A., 2000. Realism and Social Science. SAGE.
Schensul, S., LeCompte, M., 1999. Essential Ethnographic Methods: Observations, Interviews, and Questionnaires. AltaMira Press.

329
Seppälä, P., Koda, B., 1998. The Making of a Periphery: Economic Development and Cultural Encounters in Southern Tanzania. Nordic Africa Institute.
Seymour, F., Forwand, E., 2010. Governing sustainable forest management in the new climate regime. Wiley Interdisciplinary Reviews: Climate Change 1, 803–810. doi:10.1002/wcc.70
Sikor, T., Lund, C., 2009. Access and Property: A Question of Power and Authority. Development and Change 40, 1–22. doi:10.1111/j.1467-7660.2009.01503.x
Simon, D., 2008. Neoliberalism, structural adjustment and poverty reduction strategies, in: The Companion to Development Studies. Routledge, Great Briton, pp. 86–91.
Sodikoff, G.M., 2012. Forest and Labor in Madagascar: From Colonial Concession to Global Biosphere. Indiana University Press, Bloomington.
Sommerville, M.M., Jones, J.P.G., Milner-Gulland, E.J., 2009. A revised conceptual framework for payments for environmental services. Ecology and Society 14, 34.
Spradley, J.P., 1980. Participant observation. Holt, Rinehart and Winston.
Stern, N., 2006. Stern review: the economics of climate change. HM Treasury UK Governmen, Cambridge.
Streck, C., Parker, C., 2012. Financing REDD+, in: Analysing REDD+: Challenges and Choices. Center for International Forestry Research, Bogor, Indonesia, pp. 111–128.
Sunderlin, W.D., Larson, A.M., Duchelle, A.E., Resosudarmo, I.A.P., Huynh, T.B., Awono, A., Dokken, T., 2014. How are REDD+ Proponents Addressing Tenure Problems? Evidence from Brazil, Cameroon, Tanzania, Indonesia, and Vietnam. World Development, Land Tenure and Forest Carbon Management 55, 37–52. doi:10.1016/j.worlddev.2013.01.013
Sundström, R., 2010. Making the forest carbon commons: Tracing measures to reduce emissions from deforestation and forest degradation (REDD) in Angai Village Land Forest Reserve (Masters dissertation). University of Helsinki, Helsinki.
Sunseri, T., 2009. Wielding the Ax: State Forestry and Social Conflic in Tanzania, 1820-2000. Ohio University Press, Ohio.
Swallow, B.M., Goddard, T.W., 2013. Value chains for bio-carbon sequestration services: Lessons from contrasting cases in Canada, Kenya and Mozambique. Land Use Policy, Themed Issue 1-Guest Editor Romy GreinerThemed Issue 2- Guest Editor Davide Viaggi 31, 81–89. doi:10.1016/j.landusepol.2012.02.002
Swart, J.A.A., 2003. Will Direct Payments Help Biodiversity? Science 299, 1981 –1982. doi:10.1126/science.299.5615.1981b
Taku Tassa, D., 2010. Benefit Sharing and Governance issues in Participatory Forest Management related to REDD: A Case Study of the Angai Villages Land Forest Reserve, Liwale District - Tanzania (Masters dissertation). UNIVERSITY OF PADUA FACULTY OF AGRICULTURE Departments of Land and Agro-forestry Systems, Padua.
TFCG, 2009a. Making REDD work for people and forest conservation in Tanzania.
TFCG, 2009b. The Arc Journal Issue 24.

330
TFCG, 2012. Improving agricultural practices in the context of REDD readiness in Lindi Rural district, Tanzania: a review of current agricultural practices and recommendations for project interventions. TFCG, Tanzania.
Thomas, S., Dargusch, P., Harrison, S., Herbohn, J., 2010. Why are there so few afforestation and reforestation Clean Development Mechanism projects? Land Use Policy 27, 880–887. doi:10.1016/j.landusepol.2009.12.002
Thompson, M.C., Baruah, M., Carr, E.R., 2011. Seeing REDD+ as a project of environmental governance. Environmental Science & Policy 14, 100–110. doi:16/j.envsci.2010.11.006
UN-REDD, 2009. -- UN-Redd Programme - About REDD -- [WWW Document]. URL http://www.un-redd.org/AboutREDD/tabid/582/Default.aspx (accessed 5.28.11).
UNFCCC, 2011. Report of the Conference of the Parties on its sixteenth session, held in Cancun from 29 November to 10 December 2010 ( No. FCCC/CP/2010/7/Add.1). UNFCCC, Bonn.
UNFCCC, 2013. Warsaw Climate Change Conference - November 2013 [WWW Document]. URL http://unfccc.int/meetings/warsaw_nov_2013/meeting/7649.php (accessed 4.14.14).
UNFCCC, 2014a. CDM: Project Activities [WWW Document]. URL http://cdm.unfccc.int/Projects/projsearch.html (accessed 4.14.14).
UNFCCC, 2014b. FCCC/CP/2013/10/Add.1 Report of the Conference of the Parties on its nineteenth session, held in Warsaw from 11 to 23 November 2013. Addendum.
UNFCCC, 2014c. FCCC/CP/2013/10. Report of the Conference of the Parties on its nineteenth session, held in Warsaw from 11 to 23 November 2013. Part one: Proceedings.
UNIDO, 2011. Tanzania’s Cashew Value Chain: A diagnostic. United Nations Industrial Development Organization, Vienna, Austria.
United Republic of Tanzania, 2010. National Strategy for Reduced Emissions from Deforestation and Forest Degradation (REDD+) ( No. 1st Draft). United Republic of Tanzania, Tanzania.
URT, nd. Piloting REDD in Tanzania.
URT, 2012a. NATIONAL SAMPLE CENSUS OF AGRICULTURE 2007/2008 Volume Vh REGIONAL REPORT – LINDI REGION. United Republic of Tanzania, Tanzania.
URT, 2012b. National Sample Census of Agriculture 2007/08. Small Holder Agriculture. Volume III Livestock Sector - National Report. National Bureau of Statistics, Ministry of Finance, Dar es Salaam, Tanzania.
URT, 2013. National Strategy for Reduced Emissions from Deforestation and Forest Degradation (REDD+).
Van der Werf, G.R., Morton, D.C., DeFries, R.S., Olivier, J.G.J., Kasibhatla, P.S., Jackson, R.B., Collatz, G.J., Randerson, J.T., 2009. CO2 emissions from forest loss. Nature Geosci 2, 737–738. doi:10.1038/ngeo671
Vandergeest, P., Peluso, N.L., 1995. Territorialization and state power in Thailand. Theor Soc 24, 385–426. doi:10.1007/BF00993352

331
Vatn, A., 2005. Rationality, institutions and environmental policy. Ecological Economics 55, 203–217. doi:16/j.ecolecon.2004.12.001
Vatn, A., 2010. An institutional analysis of payments for environmental services. Ecological Economics 69, 1245–1252. doi:16/j.ecolecon.2009.11.018
Venter, O., Watson, J.E.M., Meijaard, E., Laurance, W.F., Possingham, H.P., 2010. Avoiding Unintended Outcomes from REDD. Conservation Biology 24, 5–6. doi:10.1111/j.1523-1739.2009.01391.x
Visseren-Hamakers, I.J., Gupta, A., Herold, M., Peña-Claros, M., Vijge, M.J., 2012. Will REDD+ work? The need for interdisciplinary research to address key challenges. Current Opinion in Environmental Sustainability 4, 590–596. doi:10.1016/j.cosust.2012.10.006
WDPA, 2014. protectedplanet.net - Explore Protected Areas [WWW Document]. URL http://www.wdpa.org/#8_-9.25_38_0 (accessed 5.11.14).
Williams, G., 1999. Assessing Poverty and Poverty Alleviation: Evidence from West Bengal. Transactions of the Institute of British Geographers 24, 193–212. doi:10.1111/j.0020-2754.1999.00193.x
Williams, M., 2003. Making Sense of Social Research. SAGE.
Wily, L.A., 2001. Forest Management and Democracy in East and Southern Africa: Lessons From Tanzania ( No. Gatekeeper Series no. 95). International Institute for Environment and Development, London, UK.
Wily, L.A., Dewees, P.A., 2001. From users to custodians: changing relations between people and the state in forest management in Tanzania ( No. World Bank Policy Research Working Paper WPS 2569). Environment and Social Development Unit.
Wollenberg, E., Springate-Baginski, O., 2009. Incentives + How Can REDD Improve Well-being in Forest Communities? ( No. InfoBrief No. 21). CIFOR, Bogor, Indonesia.
Woodhouse, P., 2009. Technology, Environment and the Productivity Problem in African Agriculture: Comment on the World Development Report 2008. Journal of Agrarian Change 9, 263–276. doi:10.1111/j.1471-0366.2009.00205.x
World Bank, 2008. Putting Tanzania’s Hidden Economy to Work: Reform, Management and Protection of its Natural Resource Sector. The World Bank, Washington, D.C.
Wunder, S., 2005. Payments for environmental services: Some nuts and bolts ( No. CIFOR Occasional Paper No. 42). CIFOR, Bogor, Indonesia.
Wunder, S., Albán, M., 2008. Decentralized payments for environmental services: The cases of Pimampiro and PROFAFOR in Ecuador. Ecological Economics, Payments for Environmental Services in Developing and Developed Countries 65, 685–698. doi:10.1016/j.ecolecon.2007.11.004
Wunder, S., Wertz-Kanounnikoff, S., 2009. Payments for Ecosystem Services: A New Way of Conserving Biodiversity in Forests. Journal of Sustainable Forestry 28, 576. doi:10.1080/10549810902905669
WWF, 2014. Southeastern Africa: Tanzania and Mozambique | Ecoregions | WWF [WWW Document]. URL http://worldwildlife.org/ecoregions/at0706 (accessed 3.23.14).

332
Yankami, W., 2013. Lindi villagers threaten to fight over REDD money [WWW Document]. ippmedia. URL http://www.ippmedia.com/frontend/?l=55158 (accessed 5.8.14).
Yates, J.S., Bakker, K., 2014. Debating the “post-neoliberal turn” in Latin America. Prog Hum Geogr 38, 62–90. doi:10.1177/0309132513500372
Yin, R.K., 2003. Case Study Research: Design and Methods. SAGE Publications.