
The Social and Distributional Outcomes of Digitalisation in the ...
Upload
khangminh22Category
view
2download
0
econstorMake Your Publications Visible.
A Service of
zbwLeibniz-InformationszentrumWirtschaftLeibniz Information Centrefor Economics
Callan, Tim; Nolan, Brian; Keane, Claire; Savage, Michael; Walsh, John R.
Working Paper
Crisis, Response and Distributional Impact: TheCase of Ireland
IZA Discussion Papers, No. 7481
Provided in Cooperation with:IZA – Institute of Labor Economics
Suggested Citation: Callan, Tim; Nolan, Brian; Keane, Claire; Savage, Michael; Walsh, JohnR. (2013) : Crisis, Response and Distributional Impact: The Case of Ireland, IZA DiscussionPapers, No. 7481, Institute for the Study of Labor (IZA), Bonn
This Version is available at:http://hdl.handle.net/10419/80552
Standard-Nutzungsbedingungen:
Die Dokumente auf EconStor dürfen zu eigenen wissenschaftlichenZwecken und zum Privatgebrauch gespeichert und kopiert werden.
Sie dürfen die Dokumente nicht für öffentliche oder kommerzielleZwecke vervielfältigen, öffentlich ausstellen, öffentlich zugänglichmachen, vertreiben oder anderweitig nutzen.
Sofern die Verfasser die Dokumente unter Open-Content-Lizenzen(insbesondere CC-Lizenzen) zur Verfügung gestellt haben sollten,gelten abweichend von diesen Nutzungsbedingungen die in der dortgenannten Lizenz gewährten Nutzungsrechte.
Terms of use:
Documents in EconStor may be saved and copied for yourpersonal and scholarly purposes.
You are not to copy documents for public or commercialpurposes, to exhibit the documents publicly, to make thempublicly available on the internet, or to distribute or otherwiseuse the documents in public.
If the documents have been made available under an OpenContent Licence (especially Creative Commons Licences), youmay exercise further usage rights as specified in the indicatedlicence.
www.econstor.eu

DI
SC
US
SI
ON
P
AP
ER
S
ER
IE
S
Forschungsinstitut zur Zukunft der ArbeitInstitute for the Study of Labor
Crisis, Response and Distributional Impact:The Case of Ireland
IZA DP No. 7481
June 2013
Tim CallanBrian NolanClaire Keane
Michael SavageJohn R. Walsh

Crisis, Response and Distributional Impact:
The Case of Ireland
Tim Callan Economic and Social Research Institute,
TCD and IZA
Brian Nolan University College Dublin
Claire Keane
Economic and Social Research Institute and TCD
Michael Savage Economic and Social Research Institute
and TCD
John R. Walsh Economic and Social Research Institute
and TCD
Discussion Paper No. 7481 June 2013
IZA
P.O. Box 7240 53072 Bonn
Germany
Phone: +49-228-3894-0 Fax: +49-228-3894-180
E-mail: [email protected]
Any opinions expressed here are those of the author(s) and not those of IZA. Research published in this series may include views on policy, but the institute itself takes no institutional policy positions. The IZA research network is committed to the IZA Guiding Principles of Research Integrity. The Institute for the Study of Labor (IZA) in Bonn is a local and virtual international research center and a place of communication between science, politics and business. IZA is an independent nonprofit organization supported by Deutsche Post Foundation. The center is associated with the University of Bonn and offers a stimulating research environment through its international network, workshops and conferences, data service, project support, research visits and doctoral program. IZA engages in (i) original and internationally competitive research in all fields of labor economics, (ii) development of policy concepts, and (iii) dissemination of research results and concepts to the interested public. IZA Discussion Papers often represent preliminary work and are circulated to encourage discussion. Citation of such a paper should account for its provisional character. A revised version may be available directly from the author.

IZA Discussion Paper No. 7481 June 2013
ABSTRACT
Crisis, Response and Distributional Impact: The Case of Ireland
Ireland is one of the countries most severely affected by the Great Recession. National income fell by more than 10 per cent between 2007 and 2012, as a result of the bursting of a remarkable property bubble, an exceptionally severe banking crisis, and deep fiscal adjustment. This paper examines the income distribution consequences of the recession, and identifies the impact of a broad range of austerity policies on the income distribution. The overall fall in income was just under 8 per cent between 2008 and 2011, but the greatest losses were strongly concentrated on the bottom and top deciles. Tax, welfare and public sector pay changes over the 2008 to 2012 period gave rise to lower than average losses for the bottom decile. Thus, the larger than average losses observed overall are not due to these policy changes; instead, the main driving factors are the direct effects of the recession itself. Policy changes do contribute to the larger than average losses at high income levels. JEL Classification: D31, D78 Keywords: recession, income distribution, tax, welfare Corresponding author: Tim Callan Economic and Social Research Institute (ESRI) Whitaker Square Sir John Rogerson’s Quay Dublin 2 Ireland E-mail: [email protected]

2
Crisis, Response and Distributional Impact: The Case of Ireland
1. Introduction1
Ireland is one of the countries most severely affected by the Great Recession. National income fell by more than 10 per cent between 2007 and 2012, as a result of the bursting of a remarkable property bubble, an exceptionally severe banking crisis, and deep fiscal adjustment. The crisis culminated in a bail-out being required from the EU and IMF as the state’s borrowing costs on the financial markets became unsustainable. Ireland’s response to the crisis, as part of an Economic Adjustment Programme agreed at the time of the bail-out, is of particular interest, being widely seen as a “test case” for what is often described as the austerity approach. This paper focuses on the income distribution consequences of the crisis and of the state’s response, rather than on its merits or otherwise as a macroeconomic strategy: these consequences will be an important consideration in any overall assessment, and of relevance to other countries undergoing stagnation and fiscal ‘correction’. To analyse these income distribution effects, we make use of the latest available microdata, notably the 2011 round of the Survey on Income and Living Conditions (SILC)) and the SWITCH tax-benefit model (Callan et al., 2012)
The macroeconomic and labour market context in which income inequality trends have occurred, and central features of the fiscal policy response, are summarised in Section 2. Key elements include a rise in unemployment from about 4 per cent to 14 per cent; sharp rises in taxation; reductions and restrictions on welfare payments; and progressively structured reductions in public sector pay. Section 3 sets out the basic results on income distribution over the period 2008 to 2011, during which most of the fall in average incomes occurred. Our exploration of changes in inequality over this period has three main elements examined in the succeeding sections.
In Section 4, we consider some important issues concerning data and methods, which could have a bearing on the results. These include the treatment of lump-sum payments which became more common (especially in the public sector) due to early retirement and redundancy schemes. We also discuss the issue of representativeness of the survey data on income distribution, using the income distribution statistics as reported by the Revenue authorities as an external check.
Section 5 uses decompositions of inequality by income source and by population sub-group to identify some factors behind the observed changes, and to guide further investigation. Section 6 explores how much of the total change in inequality is due to changes in tax and transfer policy, and how much is due to changes in market incomes – including the loss of
1 We are grateful to the Central Statistics Office for access to the SILC data. Thanks also to conference
participants at IZA, Bonn and ESRI for helpful comments. The authors alone are responsible for the analysis and interpretation of these data.

3
income for those becoming unemployed. Finally, Section 7 sets out key conclusions and priorities for further analysis.
2. Macroeconomic Context and Policy Measures
The focus of this paper is on the impact of the Great Recession on Ireland’s income distribution – both directly and via the way policy has responded. In order to understand the context in which the recessionary forces were operating, it is necessary to keep in mind the broader backdrop. Over the years 1994 to 2007, economic growth in Ireland was among the highest in the OECD (see Figure 1 for the rise in GDP per capita). The period 1994 to 2000 saw an annual average growth rate in real GDP of over 7%. This growth was accompanied by sustained increases in the numbers in employment, rising from 1.2 million in 1994 to 2.1 million by 2007. Unemployment fell to just over 4% in 2000 and remained around this level until 2008 (Figure 1). Ireland had long been a country of net emigration, but this trend reversed as significant numbers of Irish emigrants returned and immigrants from other countries were attracted to Ireland.
Figure 1 : Unemployment Rates and GDP per Capita, 1995-2011
Source: Central Statistics Office Ireland’s economy entered recession in 2008, and by 2010 GDP per capita had fallen by more than 13 per cent, while unemployment soared to almost 14 per cent. This scale of economic deterioration was driven by three main factors:
• The effects of worldwide recession on a small and very open economy, compounded by
• a dramatic collapse in property prices and in activity and employment in the construction sector, upon which the Irish economy had become heavily reliant, and

4
• a banking crisis whereby the Irish government was required to come to the aid of banks which were deeply exposed by the extent of their property-related lending.
Each of these factors contributed to a fiscal crisis, with tax revenues collapsing while increased unemployment led to greater demands on the welfare system. The banking crisis resulted in the government guaranteeing both investors and bondholders and led to unsustainable yields on Irish bonds as government debt grew. These unsustainable yields led to the Irish government seeking a financial ‘bailout’ from the EU, the ECB and the IMF in 2010.
The nature of the recession, and in particular the severity of the downturn for the construction industry, has contributed to a sharp differential in the evolution of the male and female unemployment rates. Figure 2 shows that the unemployment rates for men and women were similar, at about 4 to 5 per cent, for the years 2003 to 2007. By 2011, the male unemployment rate had risen by 13 percentage points, while the female unemployment rate had risen by about half that much.
Figure 2: Male and Female Unemployment Rates, 2003 to 2011
Source: EUROSTAT What about developments in wages for those in employment? Table 1 shows that on average, there has been a small rise in hourly earnings over the 2008 to 2012 period, but there is a great deal of diversity across sectors. Sectors are ordered in the table from those with the largest negative change to those with the greatest increases. There were falls of 5 to 6 per cent in public administration and defence, and in finance and insurance; but increases of 7 to 8 per cent for those in industry. Wages in public sector organisations were reduced first by via a ‘Pension Related Deduction’ (PRD), introduced in 2009, whereby the first €15,000 of annual earnings were exempt, but a 5% levy was paid on the next €5,000 of earnings, 10% paid on earnings between €20,000 and €60,000 and 10.5% on earnings above €60,000. Later, in 2010, a straight pay cut for public sector workers was implemented, with a reduction of 5% on the first €30,000 of salary, 7.5% on the next €40,000 and 10% reduction

5
on the next €55,000. New entrants were also to be hired on salaries 10% lower than the level payable to current staff. The evolution of average wages in the public sector has also been affected by compositional shifts. For example, a policy of incentivized early retirement, made available to those aged over 50, may have removed from the payroll more of those with above average wages, thereby depressing average wages. A further complication is that the system of incremental pay scales means that the composition of the workforce as between those (typically older) at the top of their scale and those who would benefit from annual increments can affect the extent of observed increases in pay.
Table 1: Changes in Hourly Wages by Sector, 2008 to 2012
% change, 2008-2012*
Finance/insurance -4.6 Public administration & defence -4.4
Construction
-3.6 Health & social work -2.7 Transport & storage -1.8 Accommodation/food service -1.6
Electricity/water/waste -1.0 Arts/entertainment/recreation -0.6 Professional/scientific/technical 0.5 Administrative/support 1.2
Wholesale & retail 2.4 Education
3.1
Industry
3.5 Information/communication 4.4 Manufacturing
6.2
Mining
11.2
Private sector
1.6 Public sector
-0.2
All sectors 1.7
As well as the cuts to public sector pay, the deterioration in the economy and in the government’s fiscal position led to a variety of tax and benefit changes between 2008 and 2011. Looking first at the taxation side:
• income tax rates were held stable but other ways of increasing the direct tax ‘take’ were exploited:
o An income levy, payable on gross income (excluding social welfare payments) was introduced in 2009 at an initial rate of 1% on annual income up to €100,100 and 2% on income in excess of that. These income levy rates were subsequently doubled, as was the Health Levy. Both levies were then replaced in 2011 by a “Universal Social Charge” (USC) – a new form of income tax, with exemptions for

6
annual income below €4,004 and a progressive structure above this level with rates of 2%, 4% and 7%.
o The income ceiling above which no further social insurance contributions were payable was first raised substantially, and then abolished in 2011.
o In 2011 the standard rate band of income tax was reduced (from an annual €36,400 to €32,800) as were the main tax credits.
o A €200 per annum charge on non-principal private residences was introduced in 2009 as was a flat-rate ‘household charge’ or property tax of €100 in 2011, both payable by the owner of the property. This was the precursor to a full scale value-related property tax coming into force in mid-2013.
o Tax relief on pension contributions was also reduced, with the annual earnings limit for determining maximum tax-relievable contributions down to from €275,239 in 2008 to €115,000 by 2011, while employee pension contributions also became liable for PRSI and the USC.
• indirect taxes were increased, with a rise in the standard rate of VAT and a new carbon tax
On the social welfare side, income support rates were actually increased in 2009. The Budget for that year was brought forward from December to October 2008, and the full scale of the problems was not yet evident. However, the Budgets of 2010 and 2011 then reduced the rates of support provided by most social welfare schemes applicable to those of working age, and made deeper cuts in the universal Child Benefit payment. Payments to young unemployed people were reduced very substantially. Rates of payment for old age pensions, however, have remained unchanged to date.

7
3. Income Inequality, 2008 to 2011
We look first at overall trends in conventional measures of income inequality in Ireland over this turbulent crisis period. We focus, as is standard, on household income adjusted for the size and composition of its members – i.e. ‘equivalised’ – and on data from the main surveys capturing household incomes for large representative samples, carried out by the Central Statistics Office.2 Table 2 shows Gini coefficients for disposable income (per adult equivalent) for the years 2005 to 2010 derived from the SILC surveys carried out each year, together with the corresponding figures from the Household Budget Surveys (conducted only every 5 years) for 2004/5 and 2009/10.
Table 2: Gini Coefficient Equivalised Disposable Income Among Persons Ireland 2005-2010
SILC Household Budget Survey 2005 0.324 0.317 2006 0.324 2007 0.317 2008 0.307 2009 0.293 2010 0.316 0.316 2011 0.311 Sources: SILC: Survey on Income and Living Conditions, 2011 & revised 2010 results ISSN 2009-5937 and www.cso.ie HBS: 2004-2005 from CSO (2007) p. 19; 2009-2010 from CSO (2012) p. 29 Notes: The equivalence scale used here, and elsewhere unless otherwise stated, is 1 for the first adult, 0.66 for other adults (aged 14 or over) and 0.33 for each child (aged under 14). This is the scale used in the official measure of poverty in Ireland, and is close to that implied by the structure of social welfare payments
Notes: The equivalence scale used here, and elsewhere unless otherwise stated, is 1 for the first Whether taking 2007 or 2008 as the end of the bubble/start of the recession, the Gini coefficient is very similar at that point and at the latest available date, 2011 – a slight fall from the 2007 level, and a slight rise from the 2008 level. Indeed, over a longer period (1994 to 2009) which includes the strong growth of the Celtic Tiger era, Nolan et al. (2012) show that the Gini coefficient remains in the range 0.31 to 0.32 for almost all years. Against this backdrop, the fall in the Gini to 0.29 in 2009, the first year in which the full effects of the recession were felt, is quite striking: this is the lowest level the Gini has reached in Ireland, by some measure, over the years since 1980. Gini coefficients calculated from the Household Budget Survey remained constant between 2005 and the next time the HBS was undertaken in 2009/10, and are in line with the SILC findings.
2 The equivalence scale is the one used in Ireland’s official measures of poverty: 1 for the first adult, 0.66 for
other adults, and 0.33 for children aged under 14. This approximates the scale used in social welfare payments.
8
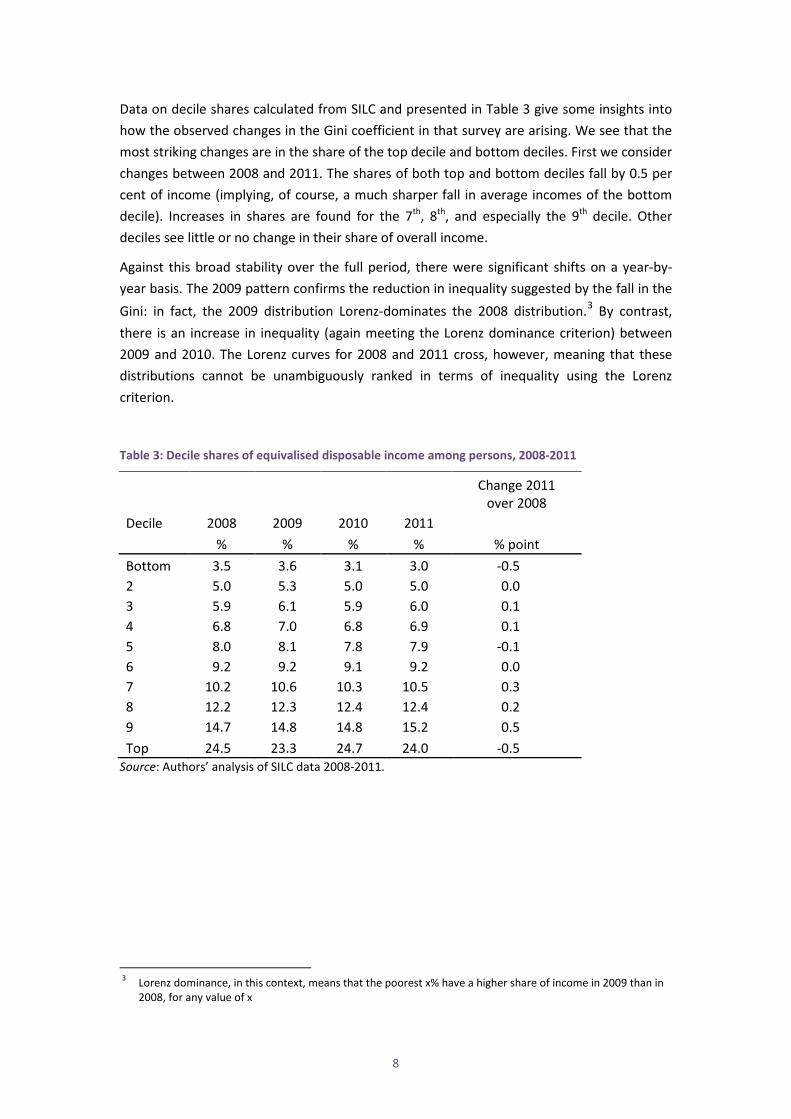
Data on decile shares calculated from SILC and presented in Table 3 give some insights into how the observed changes in the Gini coefficient in that survey are arising. We see that the most striking changes are in the share of the top decile and bottom deciles. First we consider changes between 2008 and 2011. The shares of both top and bottom deciles fall by 0.5 per cent of income (implying, of course, a much sharper fall in average incomes of the bottom decile). Increases in shares are found for the 7th, 8th, and especially the 9th decile. Other deciles see little or no change in their share of overall income.
Against this broad stability over the full period, there were significant shifts on a year-by-year basis. The 2009 pattern confirms the reduction in inequality suggested by the fall in the Gini: in fact, the 2009 distribution Lorenz-dominates the 2008 distribution.3 By contrast, there is an increase in inequality (again meeting the Lorenz dominance criterion) between 2009 and 2010. The Lorenz curves for 2008 and 2011 cross, however, meaning that these distributions cannot be unambiguously ranked in terms of inequality using the Lorenz criterion.
Table 3: Decile shares of equivalised disposable income among persons, 2008-2011
Change 2011 over 2008
Decile 2008 2009 2010 2011 % % % % % point Bottom 3.5 3.6 3.1 3.0 -0.5 2 5.0 5.3 5.0 5.0 0.0 3 5.9 6.1 5.9 6.0 0.1 4 6.8 7.0 6.8 6.9 0.1 5 8.0 8.1 7.8 7.9 -0.1 6 9.2 9.2 9.1 9.2 0.0 7 10.2 10.6 10.3 10.5 0.3 8 12.2 12.3 12.4 12.4 0.2 9 14.7 14.8 14.8 15.2 0.5 Top 24.5 23.3 24.7 24.0 -0.5
Source: Authors’ analysis of SILC data 2008-2011.
3 Lorenz dominance, in this context, means that the poorest x% have a higher share of income in 2009 than in
2008, for any value of x

9
Table 4 shows changes in average real incomes by decile. 4 The overall fall in income was just under 8 per cent between 2008 and 2011, but the greatest losses were strongly concentrated on the bottom and top deciles. On average, the real income of the lowest income decile in 2011 was 18 per cent lower than in 2008, while the average income of the top decile was 11 per cent lower. Changes in deciles 2 to 9 were less severe, ranging between 4 and 7 per cent – below the average percentage loss. These results reflect the impact of all factors, including the recession itself, on incomes. Section 6 will show that tax, welfare and public sector pay changes over the 2008 to 2012 period gave rise to lower than average losses for the bottom decile. Thus, the larger than average losses observed here are not due to these policy changes; instead, the main driving factors are the direct effects of the recession itself. Policy changes do contribute to the larger than average losses at high income levels. Table 4: Average real incomes by decile of disposable income per adult equivalent, 2008 and 2011
Decile 2008 2011 % Change from 2008 – 2011
Bottom 8,106 6,613 -18.4 2 11,978 11,099 -7.3 3 14,032 13,275 -5.4 4 15,931 15,217 -4.5 5 18,600 17,444 -6.2 6 21,429 20,260 -5.5 7 24,502 23,238 -5.2 8 28,686 27,421 -4.4 9 34,906 33,480 -4.1 Top 59,805 52,992 -11.4 Total 23,258 21,449 -7.8
Source: Authors’ analysis of SILC data 2008 and 2011.
A further point to be borne in mind in interpreting these results is that comparisons of corresponding deciles in different years are not comparing the incomes of the same people, but are instead comparing what might be termed “income positions” e.g., the incomes of the poorest 10% in each year. Changes in composition (e.g., more of the bottom decile being unemployed, or self-employed with very low incomes in the recession) can also affect the observed patterns, and further research is needed to identify the contribution of such compositional factors.
The picture of changes in the income distribution can be complemented by a brief summary of changes in measures of poverty (Figure 3 and Table 5) . The percentage of individuals
4 Nominal disposable income in 2011 is adjusted to 2008 levels using the Consumer Price Index, which fell by
2.9 per cent between 2008 and 2011.

10
falling below 60% of median equivalised income (the Laeken indicator for “at risk of poverty”) fell from 2005 to 2009, rising thereafter but with a net fall overall. The elderly (aged 65 plus) were the main exception to this pattern, with a substantial net fall in the risk of poverty over the full period 2005 to 2011.
Table 5 shows how average real incomes declined sharply over the recession. The EU’s “anchored” poverty measures examine poverty lines which are set in the usual way (60% of median income) for a base year, and then simply increased in real time. This is of particular interest in the present context, where real incomes in 2004 and 2011 are very close to each other (within about 1%). Analysis on this basis, with a poverty line anchored in 2004 – and then almost coinciding with the standard 2011 poverty line – shows risk of poverty on this anchored basis initially falling more sharply than the poverty risk based on relative income thresholds recalculated each year, and then rising sharply, with a net fall overall.
Figure 3: Percentage of Persons Below 60% of Median Relative Income Poverty Line, Ireland 2005-2011
Source: CSO SILC Reports, 2005-2011.

11
Table 5: Measures of Income and Risk of Poverty, Ireland 2004-2011
2004 2005 2006 2007 2008 2009 2010 2011
Income € € € € € € € € Mean real equivalised disposable income (per individual, base 2004, CPI deflator)
18,773 19,286 19,929 21,130 20,962 20,998 20,125 19,003
% % % % % % % %
At risk of poverty rate (60% median income in each year) 19.4 18.5 17.1 16.5 14.4 14.1 14.7 16.0
At risk of poverty rate anchored at 2004 (60% of 2004 median income, in real terms) 19.4 18.0 15.7 11.5 10.4 11.0 13.2 16.1
Consistent poverty rate 6.6 7.0 6.6 5.1 4.2 5.5 6.3 6.9
Deprivation rate (enforced deprivation of 2 or more items from a set of 11 basic deprivation indicators)
14.1 14.8 14.0 11.8 13.8 17.1 22.6 24.5
Source: CSO Statistical Release Feb 2013- SILC 2011 and revised 2010

12
4. Methodological Issues
We highlight here two methodological issues which could potentially have a significant impact on the results. The first relates to the treatment of retirement and redundancy lump sum payments; the second concerns the representativeness of the samples.
Treatment of Lump-Sum Receipts
Abramovici (2006) notes that EU-SILC variable definitions sometimes include lump-sum benefits explicitly, and sometimes not. He also states that since the beginning of SILC the treatment of lump sum has been extensively discussed, with several proposals being made “to adapt lump sum to the concept of standard of living”. The Irish experience in the years 2009 and 2010 brings these issues into sharp relief. Reduction in the size of the public sector workforce was a major goal in the programme agreed with the Troika. One of the key aspects of policy towards this goal was a major programme of early retirement, under specially incentivised terms. This had the effect of bringing forward many public sector retirements, effectively telescoping them into a shorter period of time, and increasing the numbers receiving lump sum retirement payments. Sharp increases in unemployment also boosted the numbers receiving redundancy payments. Overall lump sum payments amounted to 0.8 per cent of total disposable income in 2008. This rose to 1.3 per cent of income in 2009 and peaked at 2.2 per cent of income in 2010, before returning to 1.4 per cent in 2011.
Our understanding is that, where possible, SILC results across Europe include lump sum payments such as retirement and redundancy as part of income. This is certainly the case for Irish results published by the Central Statistics Office. The appropriate treatment for income distribution purposes is a matter of debate. For example, the Canberra Group (2012) treats lump sum retirement payments as capital transfers, which are excluded from the definition of income. Redundancy lump sums, however, appear to be included as part of income in the Canberra Group’s preferred treatment.
In the absence of a clear consensus position, and given the sharply increased importance of lump sum payments in the Irish situation, we proceed as follows. The results reported in this paper analyse the data including lump-sum receipts, in line with the SILC approach and CSO practice. However, at a number of points we have also analysed an income construct which excludes both retirement lump sums and redundancy lump sums. We find that inclusion of these lump sums plays a role in the increase in the Gini between 2009 and 2010, raising it by about 0.005, but has little impact over the full period.
Sample representativeness
A second methodological issue is whether changes in the degree to which the SILC surveys represent the national situation could have had an impact on the observed increase in income inequality. The construction of weights for SILC in Ireland, as in most EU countries, tends to use demographic information. While this ensures representativeness on such

13
dimensions as age and sex, it does not guarantee that the income distribution will be well represented. Callan et al. (2012) show that in 2010, SILC tends to underrepresent the number of families with high incomes, as compared with the revenue authorities’ Income Distribution Statistics. The key issue here is whether such underrepresentation has increased or decreased – if the representation of higher income households improved between 2008 and 2010, this could contribute to a measured increase in inequality, purely because of changes in the success of the sample in capturing the extent of high incomes. We have examined this issue more closely using the SWITCH tax benefit model, which constructs a distribution of gross income from SILC 2008 and 2010 on a tax-unit basis, and Revenue’s Income Distribution Statistics. We find no evidence to suggest that SILC, with the weights constructed using demographic information, has become more representative of high income tax units.
5. Decomposing Inequality Levels and Trends
Analyses of changes in income inequality typically make use of a number of decomposition methods. In this section, we consider four broad approaches:
• First we examine how the pattern of changes in decile shares set out in the previous section is broken down in terms of changes in major income components.
• We then turn to results from Shorrocks (1982a) decomposition of inequality by income source. This is one of the standard approaches in the literature.
• The results from the Shorrocks income-source decomposition on the relative impact of taxes and benefits on income inequality contrast strongly with those obtained using another standard approach in the literature, based on the transition from market income to gross income (via the addition of benefits) and thence to disposable income (via the subtraction of direct taxes on income). Results based on these alternative measures of redistributive impact (on which the Reynolds-Smolensky index is based) are also reported, and the sources of the contrast are discussed.
• A decomposition by population sub-group, differentiating between households on the basis of the number of earners they contain, is also reported here: this is based on the approach of Shorrocks (1984).
A different question – the extent to which changes in inequality are due to changes in market income or in tax/transfer policy – is addressed in the following section, using an alternative approach.
Before considering formal decomposition results, it is useful to examine how the pattern of changes in decile shares seen above is broken down in terms of the major income components. Table 6 shows the changes in shares of total equivalised disposable income by decile, and the contributions of each of the main income sources to these changes. For most deciles, falls in income shares due to employee income and self-employment income are partly offset by increases in transfers. Higher taxes are paid by those in the upper half of the income distribution, especially those in the 9th and 10th deciles. The top decile is exceptional

14
in that employee income contributes strongly to a sharp rise in the share of the decile in total income, offset by a reduction arising from lower self-employment income.
Table 6: Composition of changes in decile shares of income, 2008-2011
of which: Decile Change in
share of total equivalised disposable
income
Employee income
Self-emp’t
income
Other direct
Transfers Taxes
Bottom -0.5 -0.3 -0.2 -0.1 0.1 0.0 2nd 0.0 -0.3 0.0 -0.1 0.3 0.0 3rd 0.1 -0.2 -0.2 -0.1 0.6 0.1 4th 0.1 -1.3 -0.3 -0.1 1.5 0.2 5th -0.1 -0.3 -0.5 0.0 0.8 -0.1 6th 0.0 -0.6 -0.4 -0.1 1.3 0.0 7th 0.3 0.2 -0.3 0.0 0.7 -0.4 8th 0.2 0.7 -0.7 0.0 0.9 -0.6 9th 0.5 0.4 0.8 0.0 0.5 -1.3 10th -0.5 4.8 -2.9 -0.7 1.3 -3.0 All 0.0 3.0 -4.7 -0.9 7.9 -5.2
The pattern of the contribution of transfers warrants closer investigation. Much of the increase occurs in middle income deciles (4 to 7). The changes for lower income deciles are more limited. This may reflect the fact that the major change in transfers was the rise in unemployment compensation. Given that an annual income concept is used, such transfers will often be received by individuals with some employment income for part of the year. Households containing these individuals are less likely to be in the lowest income deciles, compared with those depending wholly on social security payments. Furthermore, there may now be greater numbers of self-employed in the bottom decile, and they would have limited entitlements to benefits: this is a matter for further investigation. The contribution of transfer payments to the rise in the income share of the top decile is unusual, and arises in part from the inclusion of retirement and redundancy lump sum payments, as these can boost income to levels which bring the recipients into the top decile.
We now turn to results based on the Shorrocks (1982a) decomposition of inequality by income source.5 Table 7 shows that in 2008, the share of inequality accounted for by employee income was 63 per cent, while the share of self-employed income was 48 per cent. Tax and social insurance contributions had an equalising impact which increased over
5 This has been implemented in Stata by Jenkins (2009).

15
time. In 2011, the disequalising impact of employee income was much greater – but there was a fall in the disequalising impact of self-employed income.
Table 7: Decomposition of Income Inequality by Income Source
Employee income
Tax on income and social
contributions
Self-Employed
Income Private
Pensions Benefits Other
Income Total 2008 63.3 -30.7 48.2 0.5 1.0 17.7 100.0 2009 94.2 -41.0 28.1 1.5 8.6 8.6 100.0 2010 90.5 -51.3 36.0 3.0 14.6 7.2 100.0 2011 114.6 -53.3 19.6 0.6 7.4 11.0 100.0
The disequalising impact of benefits in 2010 arises from the lump-sum payments (pensions and redundancy) referred to earlier. When these are excluded, benefits had a small equalising impact – but far less so than taxes. This result contrasts strongly with the findings of what Fuest et al. (2010) term the “standard approach”: an examination of how inequality indices change in moving from market income to gross income (via the addition of benefits) and then to disposable income (with the deduction of taxes and social insurance contributions).
Table 8 shows how decile shares and summary inequality indices change through these “stages of redistribution”. These results suggest that both benefits and taxes play a strong role in the reduction of inequality. Market incomes collapsed for the bottom 3 deciles, their share of market income falling from just under 3 per cent to 0.5 per cent. This was moderated by transfers, where the fall in share was about 1 percentage point. When taxes are also taken into account the share fell by 0.5 percentage points. The share of top income deciles in market incomes rose, but again this was moderated both by benefits and taxes.
Table 8: Income inequality measures for Market, Gross and Disposable Incomes, 2008 to 2011
Market Gross Disposable
Decile 2008 2011 2008 2011 2008 2011
Bottom 0.0 0.0 3.0 2.5 3.5 3.0 2 0.4 0.0 4.4 4.1 5.0 5.0 3 2.5 0.5 5.2 5.0 5.9 6.0 4 4.5 2.8 6.2 5.8 6.8 6.9 5 6.8 5.2 7.2 6.9 8.0 7.9 6 9.0 7.9 8.7 8.3 9.2 9.2 7 11.2 11.3 10.0 10.1 10.2 10.5 8 13.9 15.0 12.5 12.5 12.2 12.4 9 18.3 20.5 15.3 16.1 14.7 15.2 Top 33.5 36.8 27.6 28.6 24.5 24.0
Gini 0.519 0.586 0.357 0.380 0.309 0.311 Theil 0.344 0.371 0.233 0.249 0.178 0.165

16
The Reynolds-Smolensky indices of redistribution by taxes and benefits (Table 9) help to summarise these findings. They suggest that the impact of the transfer system is about 3 times larger than that of the tax system.
Table 9: Reynolds-Smolensky Indices of Redistribution, 2008-2011
Reynolds-Smolensky indices 2008 2009 2010 2011 Transfer system 0.16 0.19 0.20 0.21 Tax system 0.05 0.06 0.06 0.07 Taxes and transfers 0.21 0.25 0.27 0.28
Paul (2004) points to the major reason why the Shorrocks (1982a) factor source decomposition attributes a lower role for benefits in reducing inequality. One of the axioms underlying the decomposition is that “a given income source makes no contribution to aggregate inequality if every household receives equal income from that source”. Paul argues that this requirement is at odds with the idea that “if each household receives a constant positive income from a source, then the aggregate inequality declines”.
Fuest et al. (2010) expand on this, in the context of a strong contrast between the “standard” approach and the Shorrocks factor decomposition across all 27 EU countries. They note that within the standard approach “equally distributed transfers imply an inequality reduction. In the decomposition approach, such transfers have a zero inequality contribution because their correlation with disposable income is zero. Therefore, these two different normative foundations of the two approaches are to some extent responsible for the differing results”.
Table 10: Decomposition by Population Sub-Group - number of earners in household
Number of Earners in Household
Population share Mean Income
(€'000 per year) 2008 2009 2010 2011 2008 2009 2010 2011 0 17% 21% 25% 25% 14.4 14.3 14.0 13.5 1 29% 33% 36% 33% 22.4 21.0 19.9 19.5 2 36% 33% 31% 34% 28.0 29.5 29.2 28.3 3+ 18% 13% 9% 8% 25.9 28.5 29.2 25.5
Income share Gini
2008 2009 2010 2011 2008 2009 2010 2011
0 11% 13% 16% 16% 0.23 0.22 0.27 0.27 1 28% 30% 32% 30% 0.34 0.27 0.29 0.28 2 43% 42% 41% 45% 0.28 0.26 0.27 0.27 3+ 19% 15% 12% 10% 0.22 0.21 0.22 0.21 All households
0.31 0.29 0.32 0.31
2008 2009 2010 2011 Within-Group
Inequality 0.25 0.16 0.21 0.17 Between Group
Inequality 0.02 0.03 0.04 0.04

17
Table 10 decomposes contributions to total inequality by the number of earners per household. The proportion of households with no earner rises sharply between 2008 and 2010, from 17 per cent to 25 per cent. The balance between within-group inequality and between-group inequality also changes. Within-group inequality falls, but between-group inequality (based on number of earners) rises. Mean incomes rise for households with 2 or more earners, but fall for those with no earner or one earner.
To what extent are these results driven by changes in the earnings distribution? We examine this issue using the distribution of employee income for those who are employed for the full year, and are not therefore affected by unemployment. Table 11 shows the distribution of employee income for those individuals who worked for the full 52 weeks in the year. Overall, the inequality levels in employee income for those who worked for the full year remain stable from 2008 to 2011, whether measured by the Gini or the Theil Index. There were, however, some significant changes in decile shares, particularly in the top half of this earnings distribution (shares for the bottom 5 deciles were constant or fell marginally). Deciles 6 to 9 all experienced increases in the share of employee income, while the share of the top decile fell more sharply.
Table 11: Decile Share and Inequality Measures –Individual Employee Incomes of those in full-year employment
Decile 2008 2009 2010 2011 Change 2008-
2011 Bottom 1.6 1.7 1.6 1.5 -0.1 2 3.1 3.2 3.1 3.0 -0.1 3 4.3 4.5 4.5 4.2 -0.1 4 5.6 5.9 5.7 5.6 0.0 5 7.0 7.4 7.0 7.0 0.0 6 8.4 8.5 8.7 8.8 0.4 7 10.3 10.5 10.2 10.9 0.6 8 12.8 12.9 12.9 13.3 0.5 9 16.7 16.7 16.9 16.8 0.2 Top 30.3 28.7 29.4 29.0 -1.3
Gini 0.421 0.404 0.414 0.417 0.00 Theil 0.305 0.280 0.296 0.297 -0.01

18
6. The Role of Taxes, Transfers and Public Sector Pay Policies
There is strong interest in many countries in assessing the distributional impact of austerity measures. Traditional decomposition methods focus on changes between observed outcomes in a base year, with its associated tax/transfer policy, and an end-year, with its associated policy. Such approaches may, for example, identify an increase in social assistance income, but cannot say if this arises from increased generosity of benefit payments or from an automatic increase in the incidence of transfers as unemployment rises. Bargain and Callan (2010) propose a decomposition which has particular advantages in addressing such questions. The decomposition partitions the total change into a part which reflects changes in policy, and all other sources of change. A counterfactual policy designed to be distributionally neutral plays a key role: this is simply the base year policy, indexed by the growth or decline in a broad measure of income.6 The impact of policy change is then measured by estimating inequality measures under this counterfactual “distributionally neutral” policy and under actual policy, as simulated using a tax benefit model. Where possible this is done for both base year and end year data: the average of the two can be interpreted as a Shapley value decomposition.
Work along these lines is currently under way (Bargain et al., 2013). Figure 4 gives a broader picture of the impact of policy over the full 2008 to 2012 period. Here the analysis is based on 2010 data, and on a “distributionally neutral” policy which indexes 2008 policy in line with a fall (1.8 per cent) in average weekly earnings over the period. The analysis includes the main changes in income tax, social insurance contributions and the introduction of income levies as well as changes in benefit payment rates. In addition, the modelling includes the impact of reductions in public sector pay, which were progressively structured.
Figure 4: Impact of Income Tax, Welfare and Public Sector Pay Policy Changes, 2008-2012 - percentage change by decile of equivalised disposable income
6 When data for base year and end year are available, the change in gross income provides a natural indexing
factor; where income growth must be based on forward looking estimates, changes in weekly earnings are often used.

19
Policy changes led to falls of 11 per cent for the top decile, and 10 per cent for the ninth decile. The next 3 deciles lost between close to8 per cent of equivalised disposable income, while the fifth decile lost just above 6 per cent. The pattern in the lower end of the distribution is more mixed. The bottom decile lost just below 5 per cent of equivalised disposable income, while the fourth decile lost 7 per cent. The second and third deciles lost between 2 and 4 per cent. A key factor in the lower losses for deciles 2 and 3 is that payment rates for pensioners were held constant, while there were explicit cuts in payment rates for those of working age, and deeper cuts in Child Benefit.
7. Conclusions
Summary measures of inequality have been broadly stable in Ireland over a long period, from the early 1990s through to the start of the current recession. There were, however, some significant shifts on a year-by-year basis in the years 2008 to 2011, during which average incomes fell sharply as Ireland experienced the full force of a major recession. The year by year pattern shows a fall in inequality in 2009, reversed in the following years. Some of this is directly attributable to the timing of policy changes, with an increase in welfare payments in 2009, while taxes and levies were sharply increased. Later years saw more emphasis on expenditure cuts, and less on income-based taxes. Over the full period 2008 to 2011 the major changes have involved losses for both bottom and top deciles, with gains in income shares focused on the rest of the upper half of the distribution.
Decomposition analyses find that employment income acted to increase inequality, while changes in self-employment income partially offset this. The large rise in unemployment was a major factor in increasing concentration of employment income, but there was also an increase in employment income in the top decile relative to others. This was partly offset by falls in self-employment income for the top decile.
What of the impact of policy changes in the areas of direct tax, welfare and public sector pay? The SWITCH model permits analysis of this issue to be extended to cover the 2008 to 2012 period, and finds that policy changes tended to reduce incomes by more at the top of the distribution than in the bottom half. Furthermore, within the top half of the distribution, percentage losses were greater for those with higher incomes. The pattern of losses in the bottom half of the distribution reflected the fact that payment rates for benefits to those of working age were reduced over the period, whereas payment rates for pension benefits were increased in 2009 and then held constant. Thus, losses were lowest in the 2nd and 3rd deciles, which contained higher proportions of pensioners than other deciles.

20
References Abramovici, G., 2006. “Attempt of reconciliation between ESSPROS social protection
statistics and EU-SILC”, Eurostat and Statistics Finland Methodological Workshop on EU-SILC, Helsinki, 7-8 November.
Atkinson, A.B. 1970. “On the measurement of inequality”. Journal of Economic Theory 2: 244-63.
Bargain, O. and T. Callan, 2010. "Analysing the effects of tax-benefit reforms on income distribution: a decomposition approach," Journal of Economic Inequality, Springer, vol. 8(1), pages 1-21, March.
Barrett, A. and S. McGuinness 2012 "The Irish Labour Market and the Great Recession" CESifo DICE Report 2/2012, pp.27-33
Bergin, Adele, Elish Kelly and Seamus McGuinness 2012 “Explaining Changes in Earnings and Labour Costs During the Recession” ESRI Economic Renewal Series Paper 9
Brewer, M. and L. Wren-Lewis 2012 “Accounting for changes in income inequality: Decomposition analyses for Great Britain, 1968-2009” ISER Working Paper Series 2012-17
Callan, T., K. Coleman and . and J.R. Walsh, 2006 “"Assessing the Impact of Tax/Transfer Policy Changes on Poverty: Methodological Issues and Some European Evidence" Research in Labor Economics, Vol 25
Duclos, J.-Y. and A. Araar 2006 Poverty and Equity: Measurement, Policy and Estimation with DAD, Volume 2 of Economic Studies in Inequality, Social Exclusion and Well-Being, Economic Inequality and Poverty Series
Fuest, C., J. Niehues, and A. Peichl (2010), ‘The Redistributive Effects of Tax Benefit Systems in the Enlarged EU’, Public Finance Review 38(4): 473-500.
Jenkins, S., 2009. “INEQFAC: Stata module to calculate inequality decomposition by factor components”, http://ideas.repec.org/c/boc/bocode/s366003.html
Nolan, B., B. Maitre, S. Voitchovsky and C.T. Whelan 2012 “Inequality and Poverty in Boom and Bust: Ireland as a Case Study”, GINI Discussion Paper 70.
Paul, S. (2004), ‘Income sources effects on inequality’, Journal of Development Economics 73:435-451.
Shorrocks, A.F. 1982a. “Inequality Decomposition by Factor Components”. Econometrica 50: 193-212
Shorrocks, A.F. 1982b. “The Impact of Income Components on the Distribution of Family Incomes”, Quarterly Journal of Economics 98: 311-326.
Shorrocks, A.F., 1984 “Inequality Decompositions by Population Subgroups”, Econometrica, Vol. 52, No. 6., November.
Copyright © 2022 FDOKUMEN