Crisis maps validation and User Requirements: an experience in SAFER project
6
CRISIS MAPS VALIDATION AND USER REQUIREMENTS: AN EXPERIENCE IN SAFER PROJECT D. Carrion a, *, C. Corbane a , M. Judex b , M. Broglia a a Institute for the Protection and Security of the Citizen - Joint Research Centre of the European Commission, Ispra (Varese), Italy – (daniela.carrion, christina.corban, marco.broglia)@jrc.ec.europa.eu b German Federal Office of Civil Protection and Disaster Assistance, Bonn, Germany - [email protected] Commission VIII, WG 1 KEY WORDS: user requirements, validation, emergency, map ABSTRACT: The European Commission is putting a relevant effort in developing earth observation based Emergency Response Services (ERS), through the Global Monitoring for Environment and Security initiative and several FP7 projects, such as SAFER (Services and Applications For Emergency Response). The validation process developed in SAFER aims at measuring the effectiveness, reliability and usability of the ERS against users’ requirements. The JRC (Joint Research Centre of the European Commission) and the BBK (German Federal Office of Civil Protection and Disaster Assistance) are working together bridging the different perspectives. After a two year SAFER experience, a diversity of products are published whereas the user’s requirements and feedback are still incomplete. The definition of validation criteria is therefore a challenge. In some cases the independent validation raised problems that did not represent critical issues for the users, in some others it gave technical reference for the final users evaluation. A variety of users, with differing needs, is involved. Their feedback has been collected through a survey: the results indicate that some users are highly satisfied with the service and products whereas others point to some major issues. For example in some cases the phenomena in the maps were far from what had been found in the emergency area, and in some other cases the final users did not use or used partially the provided information during the response operations. This paper presents the JRC and BBK experience in SAFER project about validation against user requirements and users’ satisfaction. * Corresponding author. 1. INTRODUCTION One of the main pillars to realise the European space policy is the Global Monitoring for Environment and Security initiative (GMES) jointly established by the European Commission and the European Space Agency. The goal is the provision of reliable data from space as well as from in-situ measurements to support the public stakeholders in their environment and security related tasks. Several projects under the 7th Framework program develop such services that will eventually become operational under the Commission’s responsibility. The actors targeted by the Emergency Response Services (ERS) include not only decision makers from civil protection and from the Directorates General of the European Commission, e.g. DG ECHO or EEAS (European External Action Service), who require an overall assessment of the crisis situation but also United Nations’ agencies, and Non Governmental Organizations which deliver aid; in this context the community of field operators needs to know precisely the location of crises/disasters, the affected people, the transport network and interruptions to it. The SAFER project (Services and Applications For Emergency Response, http://safer.emergencyresponse.eu) is dedicated to provide a rapid mapping service to support crisis management inside as well as outside the EU. Most of the products of the ERS are based on Earth Observation (EO) technologies. Thanks to the continuous monitoring of the earth by a vast number of satellites and due to improved capabilities in processing and extracting information from satellite imagery, it is possible to have an effective overview of the areas affected by natural or man made disasters through maps, quickly and without visiting the field. Apart from rapidly providing satellite based products, such as damage assessment maps, a central benefit of the SAFER’s ERS is the validation of its products. This will be a major added value with respect to the already existing services in this area, such as the “International Charter on Space and major disasters” (Bessis et al., 2003). To assess the general usefulness of the proposed services and the reliability of the delivered products, they must be compared with users’ requirements. The validation effort should bring the evidence that ERS is delivering the right products at the right time with respect to users needs. Crisis maps are produced in a very short time as the ultimate goal is to deliver as fast as possible the products to the responsible users. Therefore it is not possible to carry out an in- depth assessment of the reliability for each product. Instead, the service providers have to rely on their algorithms, tested, tuned and validated during the Research and Development (R&D) phase. For products issued during the emergency phase, a critical accuracy versus timeliness trade-off must be reached, often in favour of timeliness, because for users it can be more crucial than accuracy. However, the higher the general (measured) reliability of such products in terms of accuracy, usability and efficiency the higher the added value for the users. A sound validation concept of crisis maps could provide the users the needed reliability for ready-to-use high quality products. It is for these reasons that the validation of crisis maps and the
-
Upload
independent -
Category
Documents
-
view
0 -
download
0
Transcript of Crisis maps validation and User Requirements: an experience in SAFER project
CRISIS MAPS VALIDATION AND USER REQUIREMENTS: AN EXPERIENCE IN
SAFER PROJECT
D. Carrion a, *, C. Corbane a, M. Judexb, M. Broglia a
a Institute for the Protection and Security of the Citizen - Joint Research Centre of the European Commission, Ispra
(Varese), Italy – (daniela.carrion, christina.corban, marco.broglia)@jrc.ec.europa.eu b German Federal Office of Civil Protection and Disaster Assistance, Bonn, Germany - [email protected]
Commission VIII, WG 1
KEY WORDS: user requirements, validation, emergency, map
ABSTRACT:
The European Commission is putting a relevant effort in developing earth observation based Emergency Response Services (ERS),
through the Global Monitoring for Environment and Security initiative and several FP7 projects, such as SAFER (Services and
Applications For Emergency Response). The validation process developed in SAFER aims at measuring the effectiveness, reliability
and usability of the ERS against users’ requirements. The JRC (Joint Research Centre of the European Commission) and the BBK
(German Federal Office of Civil Protection and Disaster Assistance) are working together bridging the different perspectives. After a
two year SAFER experience, a diversity of products are published whereas the user’s requirements and feedback are still
incomplete. The definition of validation criteria is therefore a challenge. In some cases the independent validation raised problems
that did not represent critical issues for the users, in some others it gave technical reference for the final users evaluation. A variety
of users, with differing needs, is involved. Their feedback has been collected through a survey: the results indicate that some users
are highly satisfied with the service and products whereas others point to some major issues. For example in some cases the
phenomena in the maps were far from what had been found in the emergency area, and in some other cases the final users did not
use or used partially the provided information during the response operations. This paper presents the JRC and BBK experience in
SAFER project about validation against user requirements and users’ satisfaction.
* Corresponding author.
1. INTRODUCTION
One of the main pillars to realise the European space policy is
the Global Monitoring for Environment and Security initiative
(GMES) jointly established by the European Commission and
the European Space Agency. The goal is the provision of
reliable data from space as well as from in-situ measurements to
support the public stakeholders in their environment and
security related tasks. Several projects under the 7th Framework
program develop such services that will eventually become
operational under the Commission’s responsibility. The actors
targeted by the Emergency Response Services (ERS) include
not only decision makers from civil protection and from the
Directorates General of the European Commission, e.g. DG
ECHO or EEAS (European External Action Service), who
require an overall assessment of the crisis situation but also
United Nations’ agencies, and Non Governmental
Organizations which deliver aid; in this context the community
of field operators needs to know precisely the location of
crises/disasters, the affected people, the transport network and
interruptions to it.
The SAFER project (Services and Applications For Emergency
Response, http://safer.emergencyresponse.eu) is dedicated to
provide a rapid mapping service to support crisis management
inside as well as outside the EU.
Most of the products of the ERS are based on Earth Observation
(EO) technologies. Thanks to the continuous monitoring of the
earth by a vast number of satellites and due to improved
capabilities in processing and extracting information from
satellite imagery, it is possible to have an effective overview of
the areas affected by natural or man made disasters through
maps, quickly and without visiting the field.
Apart from rapidly providing satellite based products, such as
damage assessment maps, a central benefit of the SAFER’s
ERS is the validation of its products. This will be a major added
value with respect to the already existing services in this area,
such as the “International Charter on Space and major disasters”
(Bessis et al., 2003). To assess the general usefulness of the
proposed services and the reliability of the delivered products,
they must be compared with users’ requirements. The validation
effort should bring the evidence that ERS is delivering the right
products at the right time with respect to users needs.
Crisis maps are produced in a very short time as the ultimate
goal is to deliver as fast as possible the products to the
responsible users. Therefore it is not possible to carry out an in-
depth assessment of the reliability for each product. Instead, the
service providers have to rely on their algorithms, tested, tuned
and validated during the Research and Development (R&D)
phase.
For products issued during the emergency phase, a critical
accuracy versus timeliness trade-off must be reached, often in
favour of timeliness, because for users it can be more crucial
than accuracy. However, the higher the general (measured)
reliability of such products in terms of accuracy, usability and
efficiency the higher the added value for the users. A sound
validation concept of crisis maps could provide the users the
needed reliability for ready-to-use high quality products. It is
for these reasons that the validation of crisis maps and the
measure of their usefulness for the operators working during
and after the emergency are very important.
The objective of this paper is to discuss the crisis products
validation issues, in particular regarding the users’ requirements
reference and availability, and the first results of the users’
satisfaction of SAFER products.
1.1 SAFER project
The big attention that the European Commission is giving to
ERS, in the frame of the GMES initiative, thanks to the huge
financing of the Framework Programs, is helping the
development and the implementation of Services that can
support the response to emergency situations, such as fires,
floods, earthquakes, volcanic eruptions, landslides or
humanitarian crisis etc..
SAFER is an FP7 project that aims at implementing
preoperational versions of the ERS; it has been started in 2009
and it will be concluded by the end of 2011. The project
activities are meant to improve the existing services, in
particular in terms of response time during the crisis, to validate
and to submit them to quality control, to extend the services
support in the phases before and after the crisis, and to support
the development and implementation of new services, including
activities of R&D.
A key role is given to the users within SAFER to assure that the
developed products and procedures fit as close as possible to
their needs. Within SAFER the Project User Board (PUB) is
responsible for definition of requirements and operational
validation of the results. This is done by using the internal
knowledge but also by collecting feedback from external users.
Partners of the PUB are the Italian, French and German civil
protection as well as UN World Food Program and UNOSAT.
SAFER established a mechanism that connects the users with
the rapid mapping service providers and the data providers
through a “Service Focal Point”. Registered users can activate
the service after real crisis events or for civil protection
exercises. In this way the whole chain from data acquisition
through data delivery and usage can be checked by validation
and quality control processes. Other service providers develop
new and innovative complementary products. If they pass
several checks of maturity the proposed services and products
can be implemented in the pre-operational service.
2. VALIDATION OF EMERGENCY MAPS
In the pre-operational phase of the implementation of the ERS it
is fundamental to be able to check the reliability and usability
of the services and of the products supporting the emergency
response. The central concept of validation is the comparison of
products with user’s requirements to assess if user needs are
met. In the framework of SAFER, specific validation roles are
given to a user’s federation group, represented in SAFER by the
PUB, and to “independent validation”, assigned to a team of
cartography and remote sensing experts from the JRC (Joint
Research Centre of the European Commission), not involved in
the crisis operations nor in the emergency map production. The
two validation parts of the project are complementary: PUB’s
validation is focusing on the usefulness of the products during
real crisis events, in particular evaluating users’ satisfaction,
whereas JRC’s independent validation is focusing on the
technical analysis of the products, according to the principles
described in the following paragraph. Besides, validation is
complementary to quality control activities, which in SAFER
are led by the Centre national d’études spatiales (CNES). The
areas of interest of validation and quality control can be
distinguished: validation explores in depth (e.g. evaluating the
accuracy with respect to ground truth) a few products,
during/right after the R&D phase. If main changes affect the
methodologies, validation will take place also during the
production phase. Quality control performs a continuous check
of certain aspects during the life cycle of the production chain.
The essential input for the PUB validation is the feedback of
end-users that used the products. This information is collected
with a survey comprising 23 questions on e.g. the general
usability of the product to support the response operations,
suitability of the analysis or readability of the maps. Generally,
the questions cover service and product related aspects. Most of
the questions in the User Feedback Form (UFF) have
predefined answers where the users need to state their opinion
on the delivered product(s).
For the independent validation activity a specific protocol for
Emergency Maps and Services has been developed at JRC
(Broglia et al., 2010; Corbane et al., in press).
The main characteristics of the protocol are presented in the
following paragraph.
2.1 Validation protocol
The validation protocol elaborated by JRC is meant to
summarise and describe within an organised structure the
parameters that must be controlled on a map together with the
description of the methods used to measure them. The
parameters have been defined considering the good practice of
map production and scientific literature regarding validation,
e.g. refer to (Congalton, 2009). The protocol is based on four
validation categories:
Reliability of the information content
Consistency of the information support
Usability of the product
Efficiency of the service.
These categories are explored and, where possible, “measured”
through 45 parameters that have been collected in a validation
template, which shows, in the form of a table, the validation
results.
Some of these parameters are more critical with respect to the
map content, such as thematic and positional accuracy and are
more difficult to be checked, because they need good reference
such as in-situ data.
Some others can be affected by subjectivity, for example in the
case of the evaluation of the quality of contrast between the
background and the thematic entities, or of the ease in the map
symbols differentiation. The subjectivity should be partially get
over thanks to the operator experience.
All these aspects together aim at giving a comprehensive
overview of the map features.
2.2 Reference data
There are many sources of reference that can be considered to
assess the accuracy of the data shown on the maps under
validation such as: ground truth data (reference coordinates, in-
situ measurements and field maps), reference topographic maps;
reference imagery from satellites / aerial photos (better or same
spatial/temporal resolution as initially used data set); public and
private geo-databases; previously validated geo-information
products. The availability of reference data represents one of
the main problems in validation. The most reliable source of
information that can be used as a reference is ground truth. To
be able to acquire ground truth it is necessary to plan a field
mission or to be in contact with local organizations surveying
the territory. Due to the fact that in this case validation is
dealing with crisis events, field mission organisation can be in
many cases very problematic, due to accessibility restrictions of
the disaster area. For the validation of some crisis events it is
necessary to observe the situation during the event, e.g. in case
of floods: sometimes it is possible to find traces of the flood
even after the event, but the most reliable way to check the
presence of water is during the flood, or even better during the
acquisition of the satellite image used to produce the map.
It is for the difficulties in exploring the field during crisis events
that the availability of satellite based maps is very important for
the emergency operations, since they can provide a fast
overview of the disaster without the need of visiting the field.
Nevertheless to assess the reliability of these maps it is
necessary to perform extensive and deep validation of the
products.
3. VALIDATION AND USER REQUIREMENTS IN
SAFER
In SAFER validation is intended as an evaluation process
driven with respect to users’ requirements. The availability of
users’ requirements is an important issue that can be often
encountered during the validation activities; in particular in the
framework of SAFER project. A specific list of users’
requirements for each kind of product and for each validation
parameter of the JRC validation protocol is not available. The
PUB has provided his requirements to the Service Providers and
they have been included in the service and product portfolio of
SAFER, which contains description and characteristics of the
products and services implemented at the pre-operational level.
Analysing the portfolio it is possible to single out only few
indications (mainly related to the thematic accuracy) to be used
as reference in the validation protocol template.
This issue has been discussed with the PUB and the validation
protocol has been submitted to the PUB analysis to ask for a list
of requirements to be taken as a reference in the validation
process. This is a complex and sensitive task, considering that
the validation protocol contains 45 parameters and the users’
requirements can vary with respect to the kind of event and to
the kind of emergency task to be supported.
In some cases, what could be more useful is the direct contact
with the end-users of each specific product and, possibly, to
involve them directly in the validation process. This is rarely
feasible. In most of the cases it is very difficult to obtain the
availability of the end-users even after the emergency
operations.
To face this lack of reference, in the framework of SAFER
validation activities, the following strategy has been applied.
When available, the users’ requirements have been taken into
account. Anyway, even when available, this information
concerns only very few parameters, such as the thematic
accuracy and the need of showing clearly on the map its
shortcomings, or, for some cases, very specific requirement, e.g
a certain map projection: this means two or three items out of
the 45 parameters of the validation protocol. All the other
parameters, even if they do not have a specific correspondence
among the available users’requirements, are nevertheless
important to be checked, to be able to assess the map reliability,
readability and usability. A reference for the evaluation of those
parameters can be found, in scientific literature (American
Society for Photogrammetry and Remote Sensing (ASPRS)
Specifications Standards Committee, 1990; Congalton, 1991;
Strahler et al., 2006), in the validation team experience and in
common sense.
3.1 Some examples of validation exercises and users’
feedback
During the first two years of SAFER independent validation
activities 17 maps have been validated. For some of them the
user’s feedback has been available. In some cases the issues
found as a result of the independent validation were confirmed
by the users, in some others they were in disagreement. In the
following a few examples are presented, for which the
independent validation has been performed and the users’
feedback was available.
Corsica fires
In July 2009 SAFER has been activated by French civil
protection for forest fires in Corsica. Crisis maps of affected
areas were produced for this event based on High Resolution
satellite images (ALOS AVNIR with a spatial resolution of 10
m). The produced maps have been validated with data acquired
during a field mission and additional analyses made on Very
High Resolution satellite images. It has been found an
incoherency between the map scale and the resolution of the
image used to extract the thematic information and used as map
background as well. Indeed, according to scientific literature
(Amhar and Ade Komara, 2009; Uchiyama et al., 2008), the
image resolution (ALOS AVNIR, 10 m) did not allow to reach
the positional accuracy required at the map scale (1:15000) by
cartographic standards (American Society for Photogrammetry
and Remote Sensing (ASPRS) Specifications Standards
Committee, 1990). Anyway the users that have been contacted
after the event, ONF (Office National des Forêts, Corsica), were
satisfied about the map positional accuracy, because they did
not need more than 100 m as positional accuracy and its
inconsistency with the map scale was not important for them.
More details on this validation case can be found in (Corbane et
al., in press). From the validation point of view the possible
cartographic inconsistencies are to be taken into serious account
because the message communicated by the map should be
unambiguous, independently from the specific needs of one
user, since the map can reach other users, with different needs.
Yushu, China, Earthquake
In April 2010 a serious earthquake hit China and in the
framework of SAFER a few maps have been produced,
including a damage assessment (DA) based on the analysis of
optical satellite images (QuickBird-2 and GeoEye-1). The
validation has been performed considering, as a reference, the
detailed damage assessment of collapsed and non collapsed
buildings (Guo H. et al., 2010) based on aerial imagery, with
0.33 m spatial resolution provided by the Center for Earth
Observation and Digital Earth (CEODE), of the Chinese
Academy of Sciences. On the map the DA was based on
polygons, three levels of damage (vast damage, medium
damage and no visible damage). On the same polygon base and
reconstructing the DA class definition of the map, the
percentage of collapsed buildings per polygon has been counted
on the aerial based damage assessment. A certain disagreement
has been found (Agreement: 46% for the vast damage class;
16% class medium damage class and 66% where no damage
was shown on the map). For this product the User Feedback
Form provided by the users was available and their judgment on
the map has been very positive: they found the map very useful
and they did not report any incoherence.
Floods in France
In June 2010 SAFER has been activated for the flood that
affected the South of France, in the Var region. The map with
the potentially affected area extension has been validated with
respect to the data provided by a private company specialised in
flood risk management. The reference data consisted of the
extension of the flooded area obtained with the analysis of
stereoscopic aerial and satellite images and complemented by
the analysis of other sources, such as videos, photos and
meteorological data, and by a field campaign. The overall
thematic accuracy of the provided product turned out to be
85%, but the user’s accuracy (Congalton, 2009) was only 30%.
This is due to a substantial overestimation of the flooded area in
the map. The users are interested in particular in the user’s
accuracy (as discussed with the SAFER PUB), because it
represents the probability that the thematic data read on the map
actually match the ground truth; for the user’ accuracy, in
SAFER, the PUB defined a threshold of 80%. The feedback
from the French Civil Protection and a filled questionnaire from
the administration of one of the affected communes were
available. They affirm that even if the map itself is clear and
well done, it has not been used or considered useful for field
operations. Main reason was the time delay of the data delivery
and the mismatch of the analysis received and requested. The
Commune administration found also a big difference between
the affected area shown on the map and the one that they
observed in the field.
Flood in Slovenia
In September 2010 a flood affected Slovenia; within SAFER,
around 20 maps have been produced by different service
providers. One of these, representing the flood over Ljubljana,
based on the analysis of SAR (Synthetic Aperture Radar)
imagery (acquired two days after the flood peak), has been
validated after a field mission that was useful to explore the
flood extension. The field mission has focused only on critical
situations, so it was not possible to obtain extensive data. About
23 locations, corresponding to areas of about 20m x 20m, have
been explored, among these, half of them have been correctly
classified on the map and half of them have not. Despite the
field mission has been performed ten days after the flood peak,
information about the water level both at the peak time and at
the SAR imagery acquisition time have been collected by
interviewing the local population. Problems of misclassification
were mainly related to the limitations in processing of SAR data
especially in urban areas and in the presence of dense
vegetation cover. Moreover the produced map could not
represent the peak of the flood because of the satellite image
acquisition timing. From the Feedback Form provided by the
local users, it is clearly visible that the limitations due to the
SAR image processing and the acquisition date affected the
detection of the flooded area in a way that for them the map
could not be as useful as expected.
4. USERS‘ FEEDBACK: FIRST STATISTICS ON
USERS‘ SATISFACTION IN SAFER
After each service activation the requesting user is asked to fill
out the User Feedback Form (UFF). Since the beginning of
SAFER in 2009 68 activations have been accepted until the end
of 2010 but only 18 UFF returned to the project. It is a major
difficulty to receive a filled out questionaire from operational
users that are busy with day-to-day tasks in crisis management.
One promising way seems to be the direct contact by a phone
call where the relevant questions of the UFF can be discussed.
The statistics of the sent back UFFs were analysed to reveal the
general opinion of the users regarding the usability and support
of such crisis maps. One third of the activations is related to
floods and one third to wild fires which are the biggest threads,
at least in Europe. The rest is related to other disaster types.
Nearly all reported cases are for disasters within Europe.
Generally, the users indicate that the service – accessing the
service, communication, data retrieval etc. – is working well:
72% state that the focal point is accessible without delay and
support capacity is good. Also the reception of products and the
handling of the interface is easy (83% and 72% agreement).
The products (in most cases maps) are rated to have a high
quality and are easy to use. There are nearly no negative
comments on the legend of the map, wording and terminology.
Generally, the geographic information is helpful and the
positional accuracy (which has been qualitatively evaluated,
and not systematically measured like in independent validation)
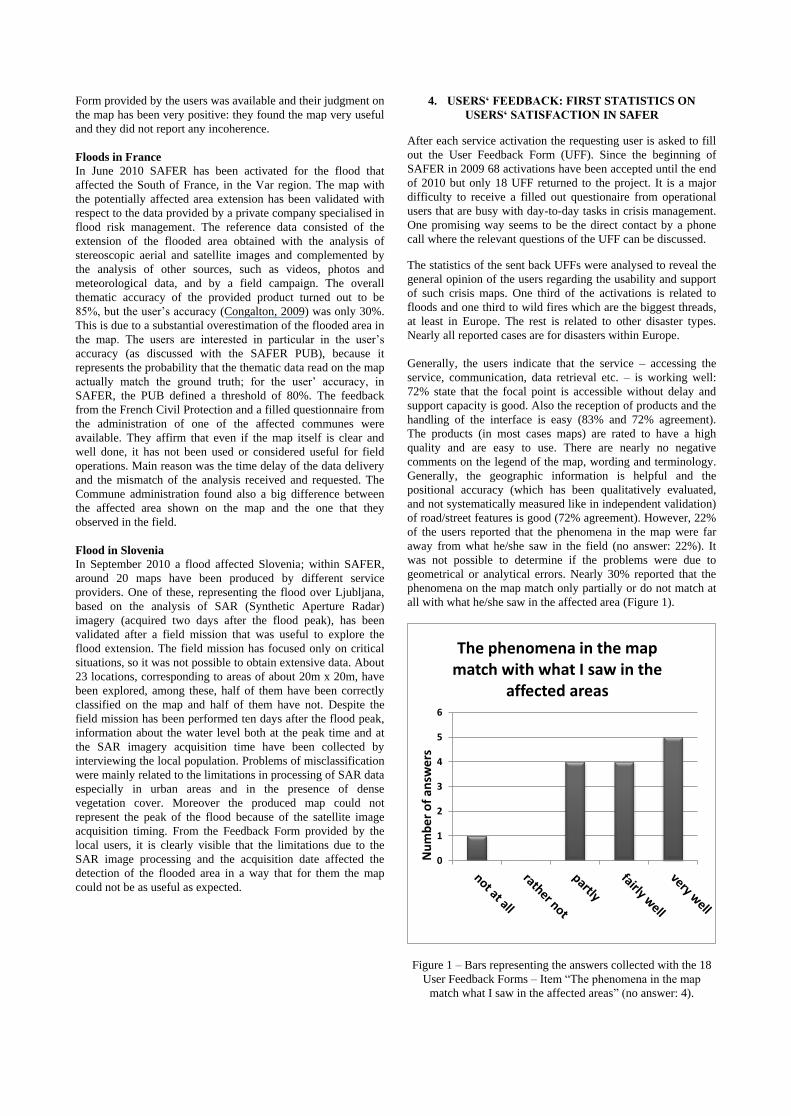
of road/street features is good (72% agreement). However, 22%
of the users reported that the phenomena in the map were far
away from what he/she saw in the field (no answer: 22%). It
was not possible to determine if the problems were due to
geometrical or analytical errors. Nearly 30% reported that the
phenomena on the map match only partially or do not match at
all with what he/she saw in the affected area (Figure 1).
0
1
2
3
4
5
6
Nu
mb
er
of
answ
ers
The phenomena in the map match with what I saw in the
affected areas
Figure 1 – Bars representing the answers collected with the 18
User Feedback Forms – Item “The phenomena in the map
match what I saw in the affected areas” (no answer: 4).
So there might be some problems with the correct detection of
the affected area or damage within the short time frame of the
rapid mapping service. An example was already described in
the previous section.
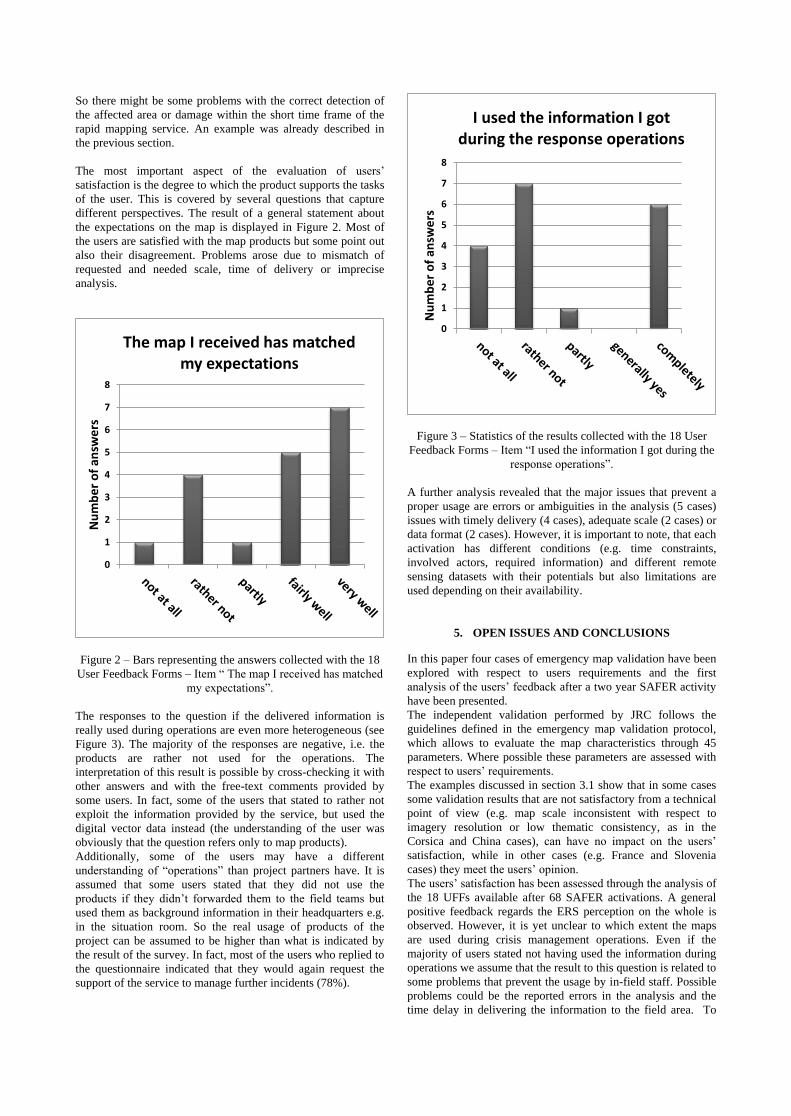
The most important aspect of the evaluation of users’
satisfaction is the degree to which the product supports the tasks
of the user. This is covered by several questions that capture
different perspectives. The result of a general statement about
the expectations on the map is displayed in Figure 2. Most of
the users are satisfied with the map products but some point out
also their disagreement. Problems arose due to mismatch of
requested and needed scale, time of delivery or imprecise
analysis.
0
1
2
3
4
5
6
7
8
Nu
mb
er
of
answ
ers
The map I received has matched my expectations
Figure 2 – Bars representing the answers collected with the 18
User Feedback Forms – Item “ The map I received has matched
my expectations”.
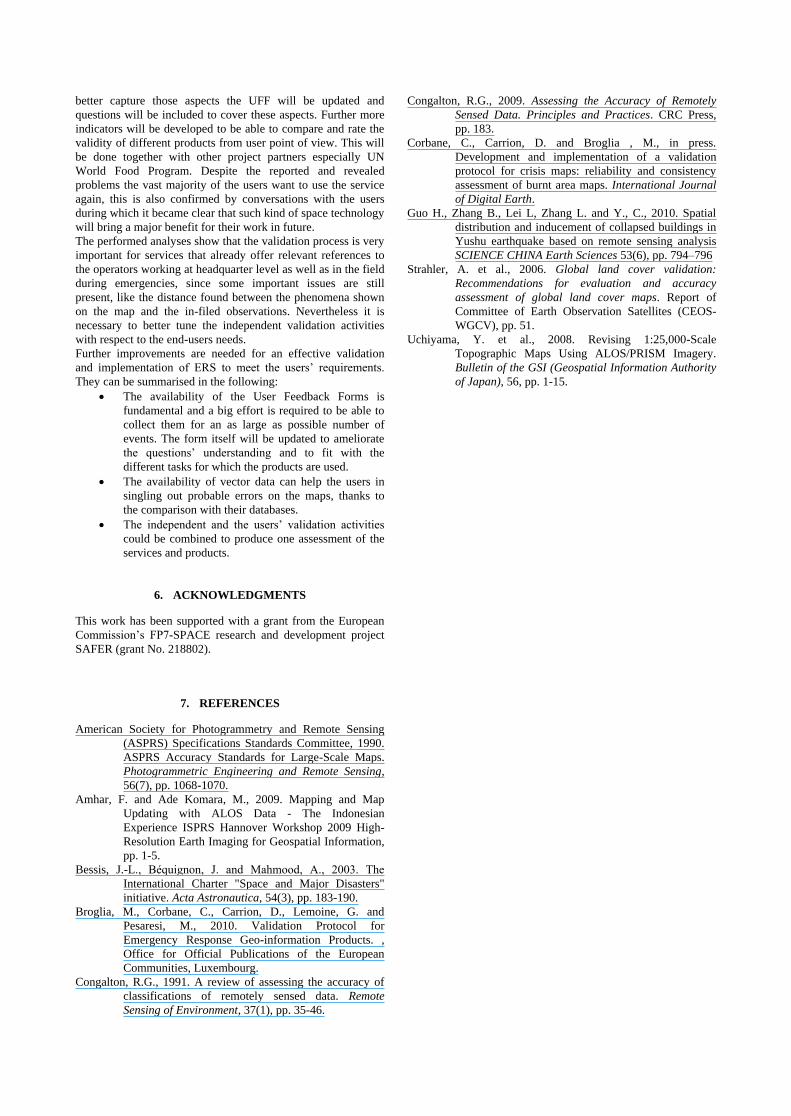
The responses to the question if the delivered information is
really used during operations are even more heterogeneous (see
Figure 3). The majority of the responses are negative, i.e. the
products are rather not used for the operations. The
interpretation of this result is possible by cross-checking it with
other answers and with the free-text comments provided by
some users. In fact, some of the users that stated to rather not
exploit the information provided by the service, but used the
digital vector data instead (the understanding of the user was
obviously that the question refers only to map products).
Additionally, some of the users may have a different
understanding of “operations” than project partners have. It is
assumed that some users stated that they did not use the
products if they didn’t forwarded them to the field teams but
used them as background information in their headquarters e.g.
in the situation room. So the real usage of products of the
project can be assumed to be higher than what is indicated by
the result of the survey. In fact, most of the users who replied to
the questionnaire indicated that they would again request the
support of the service to manage further incidents (78%).
0
1
2
3
4
5
6
7
8
Nu
mb
er
of
answ
ers
I used the information I got during the response operations
Figure 3 – Statistics of the results collected with the 18 User
Feedback Forms – Item “I used the information I got during the
response operations”.
A further analysis revealed that the major issues that prevent a
proper usage are errors or ambiguities in the analysis (5 cases)
issues with timely delivery (4 cases), adequate scale (2 cases) or
data format (2 cases). However, it is important to note, that each
activation has different conditions (e.g. time constraints,
involved actors, required information) and different remote
sensing datasets with their potentials but also limitations are
used depending on their availability.
5. OPEN ISSUES AND CONCLUSIONS
In this paper four cases of emergency map validation have been
explored with respect to users requirements and the first
analysis of the users’ feedback after a two year SAFER activity
have been presented.
The independent validation performed by JRC follows the
guidelines defined in the emergency map validation protocol,
which allows to evaluate the map characteristics through 45
parameters. Where possible these parameters are assessed with
respect to users’ requirements.
The examples discussed in section 3.1 show that in some cases
some validation results that are not satisfactory from a technical
point of view (e.g. map scale inconsistent with respect to
imagery resolution or low thematic consistency, as in the
Corsica and China cases), can have no impact on the users’
satisfaction, while in other cases (e.g. France and Slovenia
cases) they meet the users’ opinion.
The users’ satisfaction has been assessed through the analysis of
the 18 UFFs available after 68 SAFER activations. A general
positive feedback regards the ERS perception on the whole is
observed. However, it is yet unclear to which extent the maps
are used during crisis management operations. Even if the
majority of users stated not having used the information during
operations we assume that the result to this question is related to
some problems that prevent the usage by in-field staff. Possible
problems could be the reported errors in the analysis and the
time delay in delivering the information to the field area. To
better capture those aspects the UFF will be updated and
questions will be included to cover these aspects. Further more
indicators will be developed to be able to compare and rate the
validity of different products from user point of view. This will
be done together with other project partners especially UN
World Food Program. Despite the reported and revealed
problems the vast majority of the users want to use the service
again, this is also confirmed by conversations with the users
during which it became clear that such kind of space technology
will bring a major benefit for their work in future.
The performed analyses show that the validation process is very
important for services that already offer relevant references to
the operators working at headquarter level as well as in the field
during emergencies, since some important issues are still
present, like the distance found between the phenomena shown
on the map and the in-filed observations. Nevertheless it is
necessary to better tune the independent validation activities
with respect to the end-users needs.
Further improvements are needed for an effective validation
and implementation of ERS to meet the users’ requirements.
They can be summarised in the following:
The availability of the User Feedback Forms is
fundamental and a big effort is required to be able to
collect them for an as large as possible number of
events. The form itself will be updated to ameliorate
the questions’ understanding and to fit with the
different tasks for which the products are used.
The availability of vector data can help the users in
singling out probable errors on the maps, thanks to
the comparison with their databases.
The independent and the users’ validation activities
could be combined to produce one assessment of the
services and products.
6. ACKNOWLEDGMENTS
This work has been supported with a grant from the European
Commission’s FP7-SPACE research and development project
SAFER (grant No. 218802).
7. REFERENCES
American Society for Photogrammetry and Remote Sensing
(ASPRS) Specifications Standards Committee, 1990.
ASPRS Accuracy Standards for Large-Scale Maps.
Photogrammetric Engineering and Remote Sensing,
56(7), pp. 1068-1070.
Amhar, F. and Ade Komara, M., 2009. Mapping and Map
Updating with ALOS Data - The Indonesian
Experience ISPRS Hannover Workshop 2009 High-
Resolution Earth Imaging for Geospatial Information,
pp. 1-5.
Bessis, J.-L., Béquignon, J. and Mahmood, A., 2003. The
International Charter "Space and Major Disasters"
initiative. Acta Astronautica, 54(3), pp. 183-190.
Broglia, M., Corbane, C., Carrion, D., Lemoine, G. and
Pesaresi, M., 2010. Validation Protocol for
Emergency Response Geo-information Products. ,
Office for Official Publications of the European
Communities, Luxembourg.
Congalton, R.G., 1991. A review of assessing the accuracy of
classifications of remotely sensed data. Remote
Sensing of Environment, 37(1), pp. 35-46.
Congalton, R.G., 2009. Assessing the Accuracy of Remotely
Sensed Data. Principles and Practices. CRC Press,
pp. 183.
Corbane, C., Carrion, D. and Broglia , M., in press.
Development and implementation of a validation
protocol for crisis maps: reliability and consistency
assessment of burnt area maps. International Journal
of Digital Earth.
Guo H., Zhang B., Lei L, Zhang L. and Y., C., 2010. Spatial
distribution and inducement of collapsed buildings in
Yushu earthquake based on remote sensing analysis
SCIENCE CHINA Earth Sciences 53(6), pp. 794–796
Strahler, A. et al., 2006. Global land cover validation:
Recommendations for evaluation and accuracy
assessment of global land cover maps. Report of
Committee of Earth Observation Satellites (CEOS-
WGCV), pp. 51.
Uchiyama, Y. et al., 2008. Revising 1:25,000-Scale
Topographic Maps Using ALOS/PRISM Imagery.
Bulletin of the GSI (Geospatial Information Authority
of Japan), 56, pp. 1-15.