El Programa Nacional de Empleo por Hora: Permanente y más sencillo

1
Crisis de empleo y riesgo de pobreza en el Sur de Europa
Rodolfo Gutiérrez (University of Oviedo)
Congreso CABISE’14
“Presente y futuro del Estado de Bienestar en España”
Universidad de Oviedo, 4-5 de junio de 2014
Resumen
La Gran Recesión ha supuesto una nueva etapa en los debates sobre la singularidad
de la variante “mediterránea” de capitalismo de bienestar. En este periodo, la combinación
de una intensísima crisis de empleo y una débil prestación del sistema de protección social
han dado lugar a nuevas y crecientes preocupaciones sobre los principales resultados de
este modelo de bienestar, tanto en términos de eficiencia, en los que afecta a la
participación en el mercado de trabajo, como de equidad, en lo que tiene que ver con su
capacidad para reducir los riesgos de pobreza.
Este paper analiza la evolución de esos dos rasgos durante la Gran Recesión en
cuatro países del Sur de Europa (España, Grecia, Italia y Portugal) y si esa evolución se ha
producido en direcciones de convergencia o de divergencia entre estos países. En primer
lugar, se describe la magnitud y los perfiles comparados de la crisis de empleo. En segundo
lugar, se estudian las principales reformas llevadas a cabo en las políticas de empleo y de
protección por desempleo en ese periodo. En tercer lugar, se describen los principales
cambios en la desigualdad de rentas y en los riesgos de pobreza, principalmente los que
tiene que ver con la participación laboral. Finalmente, se proporciona una interpretación de
los perfiles comparados de esos cuatro países en cuanto a cambios en los patrones de
empleo y en los riesgos de pobreza, identificando los principales factores que explican sus
diferentes trayectorias durante este periodo.

2
The Great Recession has given rise to a new stage in the discussion on the
distinctiveness of a possible “Mediterranean” variant of welfare capitalism. Since the
opening of this discussion, in the mid 90s of the last century (Ferrara 1996), to the
beginning of this stage of the Recession, the four countries of this cluster of Southern
Europe (Spain, Greece, Italy and Portugal), had gradually shortened the distance with the
wealthiest European countries. The dual influence of the European integration and of the
globalisation of their economies had urged reforms in their labour markets and their social
protection systems, which, with differing intensities and nuances in each country, took
away part of the singularity of the Mediterranean variant (Karamessini 2008, Ferrara 2010,
Mari-Klose and Moreno-Fuentes 2013). In the central part of the economic growth cycle,
although unevenly, theses countries had increased their labour participation levels a great
deal, especially those of women, and had undergone relevant growths in terms of their
social expenditure levels.
The economic crisis has had a deep impact on employment levels and on social
protection performance. These four countries have lost 6 million paid jobs, 3.7 million of
which in Spain alone, between the last quarters of 2007 and 2013. The two countries that
have most suffered the employment crisis, Greece and Spain, have lost almost one job out
of five. In Portugal, the loss has been lower, around 14%. And notably lower in Italy, with
a drop in employment of only 2.5%. The crisis has also resulted in a sudden increase in
pressure on social expenditure. In the four countries, social expenditure in GDP percentage
rocketed during the first years of the crisis (2008 and 2009) and has become more stable in
recent years; in Spain to a great extent, as expenditure went from 21.3% in 2007 to 26.3%
in 2012; in Greece the shift was from 21.6 to 23.1; in Portugal from 22.7 to 25.0; and in
Italy from 24.7 to 28.1. However, their income inequality and poverty risks levels have
increased.
Inevitably, there has been renewed an growing concern that, regardless of all the
changes occurred during this Europeanisation and growth phase, about main achievements
in terms of their welfare capitalism; both in terms of efficiency, with their low levels of
labour market participation, and in terms of equity, with their low capacity to reduce
poverty risks. That weak performance would result from very specific institutional traits;
on the one hand, two traits of the labour market: the predominance of the male as the major
household breadwinner, and a low and secondary labour participation of young people of
both genders, and of adult women; and some form of “insider/outsider” dualism induced
by a high level of employment protection and a weak level of unemployment

3
protection(Sapir 2006). On the other hand, in terms of equity (Ferrera 2005, Petmesidou
and Papatheodorou 2006; Nolan and Marx 2009), there are four main traits: the low
distributive effect of social transfers and taxes; the bias of the social transfer system
towards the risks of elderly people as opposed to the risks of infancy and youth; the high
levels of poverty risks, with high mobility patterns in these situations, and the low
development of minimum income schemes.
This paper analyses the evolution of these traits during the Great Recession in the
four countries of Southern Europe and to what extent they have evolved in a divergent or
convergent manner. Firstly, it describes the magnitude and comparative profiles of the
employment crisis in these four countries. Secondly, the paper looks into the main reforms
in terms of employment protection during the crisis and their potential effects on
flexibilisation of labour markets. Thirdly, it portrays main changes in poverty risks and
income inequality. And finally, it attempts to provide a comparative profile for each
country in terms of employment and poverty risks, discussing the main potential factors
and explaining their singular trajectories during that period.
1. The Employment Crisis
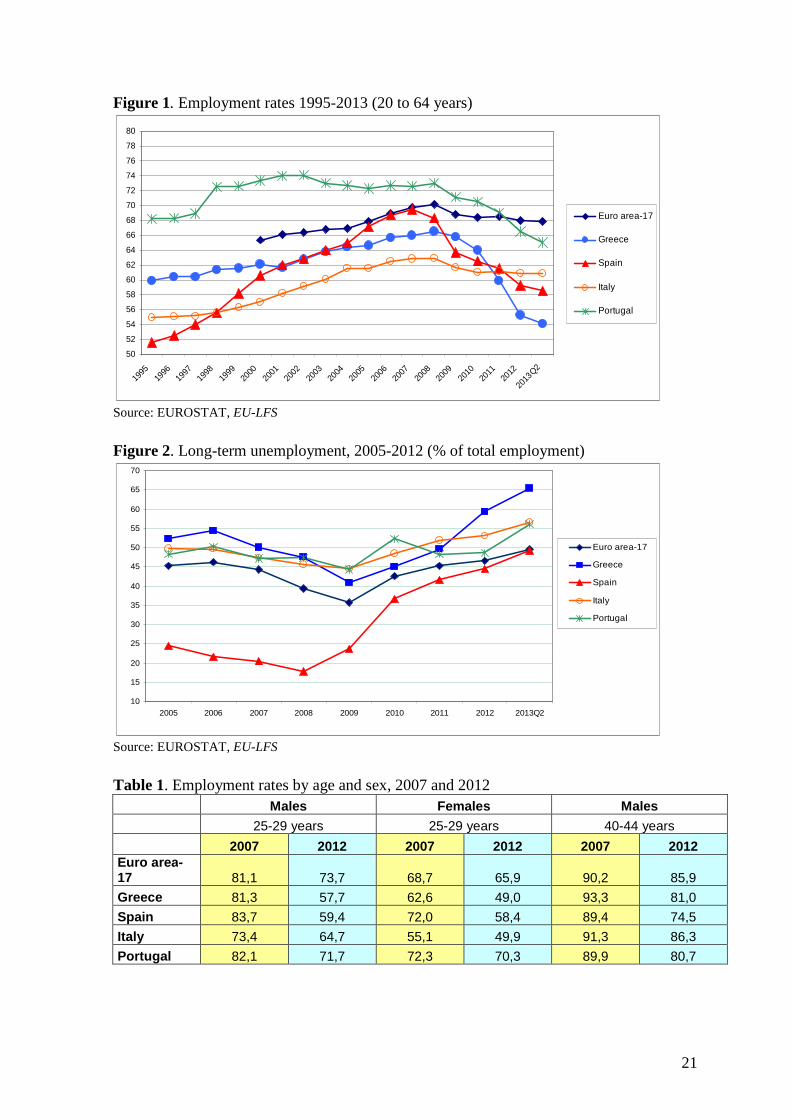
The fact that a low level of labour participation was attributed to these countries
was not totally accurate at the end of the growth cycle before the Great Recession (Figure
1). The employment achievements were very different in the four countries: Portugal had
faced a slight increase during that growth phase, but still maintaining high employment
levels, well above those of the Euro-area (EU-17); Spain had increased its employment rate
by almost 18 points since 1995 and had shortened its historical distance with reference to
the EU-17; Italy and Greece had also substantially improved their employment levels,
although they were not able to shorten distances with regard to the EU-17, nor the
differences between them, favourable for Greece until very recently.
The Great Recession has caused an uneven employment crisis in each of these
countries. Greece and Portugal have not only lost all employment improvements
accumulated during the growth cycle, but they have also clearly worsened in terms of
employment level in comparison with the situation in 1995. Spain has lost 11 points in
terms of employment rate, although it still maintains 7 points of the total gained during the
growth cycle. Italy has lost only 2.8 employment points during the crisis, but its
employment level is still low due to the scarce improvement achieved during the previous
cycle. The four countries remain far below the average employment levels of the Euro-area,

4
although distances are not even. Due to these facts, they remain very uneven in terms of
unemployment although their relative positions have changed slightly.
FIGURE 1 HERE
Such huge employment losses will have consequences in the long run. It is very
unlikely that these four countries will be able to achieve the Europe 2020 objectives
(European Commission 2013b). Starting with the 2012 scenario, Greece and Spain would
have a 14.7 point gap to reach the employment rates established as national targets by
Europe 2020, the widest gap among all EU-27 countries; to reach that target these
countries would have to increase those rates at an annual average growth rate of 2.9 points.
Italy and Portugal would have narrower gaps, 7.0 and 8.5 points respectively, but they are
also among the highest in the EU-27 –only surpassed by Bulgaria and Hungary – and
which would also demand high annual average rates, of 1.5 and 1.7 points, respectively.
Due to these employment losses, the four countries have reached two digit
unemployment rates, when the three countries facing the deepest employment crisis
(Greece, Spain and Portugal) had evened out the EU-17 levels before the crisis. At the end
of 2013, two countries had tripled their unemployment figures, Greece 27.2 and Spain 26.1,
Portugal (16.3) had doubled it and Italy (11.4) had had an increase of more than four points.
Although there has been an important unemployment increase, the relative weight
of long-term unemployment (at least 12 months) has hardly varied in the three countries
(Greece, Italy and Portugal), where it had already affected half of the unemployed before
the crisis. This type of unemployment has taken a different course in Spain; starting from a
very low long-term unemployment rate during the crisis, the most recent phase of the crisis
has made it rocket to almost half the total unemployed.
FIGURE 2 HERE
These differences in terms of long-term unemployment are related to another
important factor: the mobility levels between employment and unemployment situations.
Greater mobility in both directions means, on the one hand, more unemployment chances
but fewer risks of it being long-term unemployment; but, on the other hand, it also means
that labour incomes are more volatile. In this regard, Spain clearly differs from the other
countries, at least from Italy and Greece, as Spain has higher levels of this kind of mobility
(European Commission 2013a, chapter 1.4). During the growth phase, Spain enjoyed a
particularly high labour market entry and exit mobility rate; both flows were among the
highest in the EU. As a consequence of the crisis, the flows from employment to
unemployment doubled and those from unemployment to employment decreased slightly,

5
but they still enjoyed moderate levels. Half of the Spanish unemployed in 2006 were
employed in 2007; between 2010 and 2011 that flow amounted to only 30%. Italy and
Greece, in comparison, have had labour markets with a lower rotation in terms of accessing
and exiting the labour market; with the crisis, Italy has hardly modified its mobility
patterns, and Greece has gone down to the lowest EU levels in terms of transitions towards
employment and has tripled the transitions towards unemployment, which started from a
very low level before the crisis.
The Great Recession has not only reduced the employment level in these countries
but it has also changed its composition. A singular trait of this employment crisis is the fact
that it has affected all age, gender, education and wage groups, although quite unevenly in
terms of intensity. This could have altered the more traditional patterns of employment
participation in Southern Europe, namely, the typical predominance of male employment
in detriment of female employment, particularly in the central part of the life cycle, typical
of the “male breadwinner” model.
In terms of age and gender, to better understand this important shift caused by the
crisis, employment rates of three five-year age groups are taken into consideration. They
are representative of three phases of the working span cycle for each gender (table 1).
These employment rates clearly show the persistence of that traditional pattern during the
growth phase, above all during the mid and final stages of the working life. Before the
crisis, the four countries showed situations close to full employment among prime-age
male workers (40-44 years), quite higher from the employment of women at that age;
employment rates of both genders were even more ditant in the pre-retirement age group
(50-59 years). However, the trait of a low participation in the labour market by the youth
was not very characteristic of these countries: Spain and Portugal could reach the end of
their growth cycle with very high youth employment rates (25-29 years) in comparative
terms, as in 2007 they were above those of the EU-17, both in male and female jobs.
TABLE 1 HERE
The employment crisis has been much harsher for the groups facing job-insertion
(25-29 working age), and even more so in the case of males if compared with females, and
especially in young males from Greece and Spain who have lost circa 25 points in their
employment rates. The lower impact of the employment crisis in young women has led to
the fact that in 2012, employment rates of males and females were already similar in Spain
and Portugal, closer to Italian rates, and still far from those in Greece.

6
The fall of employment has also been important in the core ages of working life
(40-44 years), and especially among males in Spain, Greece and Portugal with a loss of 15,
12 and 9 points in terms of employment rates, respectively. Therefore, in these three
countries, the crisis has seriously harmed the labour positions of the traditional
breadwinners of the Mediterranean model. In Greece and Spain, women in this age group,
too, faced job losses, and therefore, the weakening of the position of the male breadwinner
households could not be mitigated by the female employment rate in this age group.
Even older males, close to retirement (55-59 years), have lost a great amount of
employment, except for Italian males who have improved the extremely low employment
rate they had before the crisis. It has been very different for older women: they have
maintained their employment levels in Greece and Portugal, being very low, comparatively,
in the first one country and quite high in the second one; whereas Spain and Italy have
significantly improved previously low labour participation for this group despite the crisis.
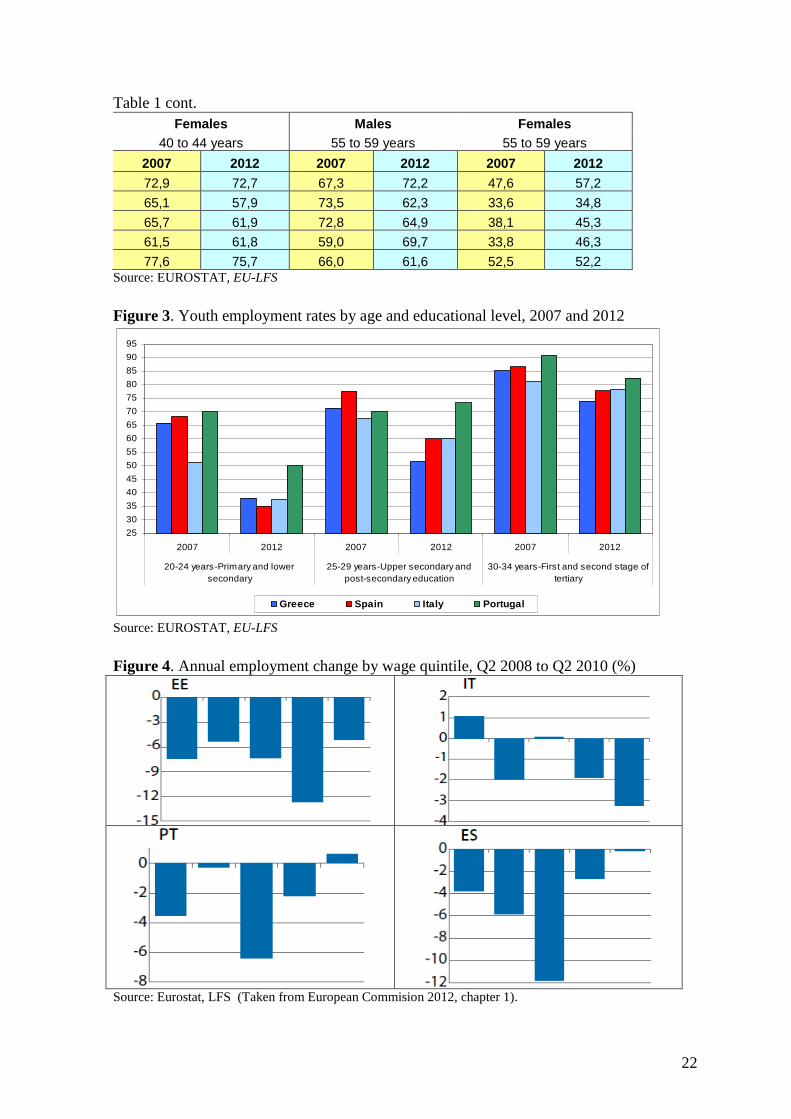
Even though the crisis is having a considerable youth bias, the intensity of this
effect has been very uneven depending on the education level. To analyse this fact, three
groups of young people have been taken into account, one for each education level, and in
the age group with respect to which sufficient labour integration time has elapsed since
leaving the education system: 20-24 years for those who have just finished compulsory
education (Isced97 0-2); 25-29 for those at post-compulsory secondary level (Isced97 3-4);
and 30-35 for those included in the tertiary level (Isced97 5-6). These data clearly stress
the huge negative impact of the crisis on youth employment with the lowest qualification
level in the four countries. Among the youth aged between 20-24 that have not completed
compulsory secondary education, in 2012, only approximately 1 out of 3 were employed in
Greece, Spain and Italy, and 1 out of 2 in Portugal; in Spain this group has decreased its
employment rate by almost half with respect to the 2005 rate. But the youth with mid-
educational levels have also lost participation (except for Portugal), and to a lesser extent
the youth with higher education who, in 2012, maintained employment rates of above 70%
in the 30-34 age group, in all the countries.
FIGURE 3 HERE
The non-occupation of non-qualified youth is not a problem caused by the crisis.
During the economic boom, none of these countries managed to employ more than two
thirds of these young people, and only half of them in Italy. In the case of Spain, where this
group was the most affected by the crisis, each crisis since the 80s of the last century
gradually aggravated the uneven impact on the employment rates of the unqualified and

7
qualified groups. The former group is the hardest hit by each crisis, and every subsequent
growth period allows them a lower recovery rate than the lost employment (Garrido and
Gutiérrez 2011). This gradual “chronification” of unemployment of the unqualified may be
the most common problem shared by the labour markets in the four countries, a problem
aggravated by the last recession but not caused by it.
Regarding employment composition by wage levels, during the growth period the
main trends were upgrading. Against expectations that, in the traditional Southern Europe ,
the labour markets in these countries would tend either towards polarisation or
downgrading, none of these four countries was characterised by these trends during the
1995-2006 period (Fernández-Macias, Hurley and Eurofound 2008). Greece modified its
employment structure towards a growth in the middle profile, with greater increases in
medium-paid jobs; Italy and Spain underwent changes that increased the weight of medium
and high-paid jobs, being therefore characterised as hybrid upgrading/growth in the
middle; and Portugal faced a clearer upgrading transformation.
However, the evidence available for the crisis period shows predominant trends
towards polarisation (Figure 4). At least during the first phase of the crisis (2008-2010),
this trend is very clear in the case of Spain, with relative employment losses that are highly
concentrated in medium-paid jobs, in the third and fourth quintile, and in Portugal with
higher employment losses in the third quintile. In Greece and Italy the changes present a
different profile; in both cases there is a downgrading trend, much more obvious in the
case of Italy, as the greatest employment losses occur in the highest area of the salary
distribution, in the second quintile in Greece and in the first quintile in Italy. During the
second and deepest phase of the crisis, and based still on sparse data (only for the year
between 2011/Q2 and 2012/Q2), these trends are confirmed (European Commission
2013b). Spain, Greece and Portugal evolved towards a clearer polarisation in terms of
employment, although with a slight upgrading tendency, losing employment above all in
the central quintile, but also reducing employment at the ends, although more in the fourth
and fifth quintiles than in the first and second ones. Italy reinforced its downgrading trend
even more, increasing its employment in the two lower quintiles and decreasing it in the
three higher ones, above all in the second quintile.
FIGURE 4 HERE
In summary, at the end of the growth cycle, these countries had been able to
mitigate (Italy to a lesser extent) the most typical problem of their welfare capitalism
model: the low employment level of youth and women, even notably improving the

8
employment of women in the mid-age group, whilst, at the same time, the traditional
pattern of high employment of men in this age group was preserved. The Great Recession
has had three effects very much shared by the Southern European countries: firstly, with a
deep anti-youth bias, it has done away with one of the two historical achievements;
secondly, as adult male employment was so hard hit, it has weakened one its most
characteristic traits, namely, in the sense of the male breadwinner; and finally, the problem
of unqualified unemployment has been aggravated, a problem that could be the most
persistent and common trait in Southern Europe.
However, other aspects of employment composition by age and gender have shown
different changes in each country. In Greece, which already started with low employment
rates, the losses have affected all age groups in both genders; in Spain, the job losses have
only respected older women, who have even faced an improvement; in Portugal, the crisis
has had a clear male bias, as the female employment level has hardly varied in the three
age groups; in Italy, the crisis has aggravated the anti-youth bias that was already typical in
this country, only weakly hitting male employment in the mid-age groups, with relevant
employment improvements for both older males and females.
Trend of changes in employment structure by salary levels has also changed during
recession. During the growth phase these countries advanced towards a greater global
employment quality, upgrading or growth in the middle; now most of them have moved
towards polarisation, even downgrading in the case of Italy.
2. Labour market reforms
The Great Recession has caused a greater flexibilisation of the labour markets in
Southern Europe. Atribuiting to Southern nations a common pattern of high employment
protection with low unemployment protection would no longer be so appropriate. All the
countries have undergone deep reforms in terms of deregulation in the field of legal
protection to employment and they no longer share the trait of very weak unemployment
protection. However, these reforms do not seem to have been able to reduce the dualism,
also very prominent in at least some of these countries. Undoubtedly, in these four
countries, the crisis has been a catalyst of the job market reforms, in most of the cases
forced by the conditions linked to financial assistance from supranational agencies.
The range of reforms has been wide and intense (OECD 2013b, chapter 2). In
Greece, a reform in 2010, followed by an additional adjustment in 2012, significantly
reduced notice periods and severance pay, along with measures to boost temporary

9
employment by increasing the maximum work time under temporary work agencies. In
Spain, the reform of 2012, which followed a previous one in 2010, halved notice periods,
significantly curbed monetary compensation for unfair dismissal and greatly simplified
procedures for collective redundancy, by suppressing administrative authorisation and
shortening delays before notice can start. In Portugal, three main reforms were undertaken
in 2009, 2011 and 2012, which significantly shortened notice periods and reduced the
generosity of severance pay; In Italy, one of the main changes introduced by the reform of
2012 consisted in restricting the number of cases in which reinstatement can be ordered by
a court because of unlawful dismissal. Both reforms in Greece and Spain included
measures to enhance flexibility in wage determination such as easing the conditions for
firms to opt out from higher-level collective bargaining agreements.
As a result of these reforms, the four countries have positioned themselves among
those that have most reduced the levels of employment protection. According to the 2013
OECD update in terms of their synthetic indicators of employment protection, the four
countries have reduced those indicators in at least two of their three dimensions (Table 2):
one measuring the strictness of the regulation on the individual dismissal of employees
with regular/indefinite contracts (9 items); another one that measures additional costs and
procedures involved in dismissing more than one worker at a time , compared with the cost
of individual dismissal (4 items); a third one measuring the strictness of the regulation on
the use of fixed-term and temporary work agency contracts (8 items). Spain has faced
larger (in the three dimensions) and deeper reforms (with greater decreases in each
indicator).
TABLE 2 HERE
However, it should be noted that the four countries still have higher comparative
levels of employment protection than the average of the OECD countries, as the majority
of countries had faced reforms in the same direction in previous years. Italy and Greece
still show higher levels than the OECD average in terms of employment protection
according to those three indicators; and Spain and Portugal only have lower protection
levels with respect to that average in one of those dimensions, individual and collective
dismissals, respectively.
These countries show more important differences in terms of unemployment
protection, a factor with obvious potential consequences on poverty risks and income
inequality. Reforms have been much softer than those in the employment protection field,
probably because the severity of the crisis itself does not recommend decreases in this

10
protection mechanism. Only Portugal has introduced important reforms to reduce the
unemployment benefit and duration. To broaden the protection, Greece Spain and Portugal
have introduced means-tested unemployment assistance or they have increased the
populations covered by this assistance, for situations of need once the unemployment
benefits had been used up.
But the starting situations were different in each country. Spain and Portugal share
a similar unemployment protection system with moderate coverage levels, both respect to
unemployment and other social assistance benefits: between 40% and 50% of short and
long-term unemployment (STU and LTU) and 25% if it is very long-term unemployment
(VLTU). Greece also has a moderate level although with lower STU protection, an even
lower LTU and a minimum level of VLTU. Italy is at the bottom with respect to other
European countries, with the lowest protection level regarding any of the unemployment
modalities (European Commission 2013a, p. 93).
They differ even more in another aspect of unemployment protection: protection
intensity, which is usually measured on the basis of net replacement rates (NRRs) (Figure
5). This indicator refers to the median salary percentage that is replaced in the form of
unemployment benefits and other social benefits after taxes. The indicator is a mean for
different types of households, salary levels and unemployment terms. This indicator shows
the two variants of unemployment protection in these countries much more clearly
(European Commission 2013a, p. 91). On the one hand, Spain and Portugal with average
levels of salary replacement, between 50% (Spain) and 60% (Portugal). These levels,
furthermore, have not decreased during the crisis. On the other hand, Greece and Italy with
much lower replacement levels that do not exceed 25% in Greece and 10% in Italy, where
there has even been a slight decrease during the crisis.
FIGURE 5 HERE
It is still too early to assess the reforms implemented in the labour market by these
countries. They are too recent and, above all, they are not very likely to obtain the goals set
when they are still under recession conditions and facing a very weak economic demand.
The proper evaluation should focus on the jobs they were able not to destroy instead of on
the jobs created. In the Spanish case, the country that has faced greater reforms, the initial
evaluations clearly point towards a strong effect of wage moderation, which allows setting
jobs in times of crisis, and also weak effects of increasing new permanent jobs and reducing the
duration of unemployment spells (OECD 2013b).

11
Whether or not these reforms are sufficient to transform the Southern labour markets into
ones that lower dualism and combine flexibility with fairness and worker security remains to be
seen. So far, little has changed in terms of employment composition. The most wide-spread
types of atypical employment, both temporary employment (Figure 6) and part-time
employment (Figure 7), have hardly modified their levels in these countries, starting from
very uneven levels among them. Temporary employment is a very relevant trait, above all
in the Spanish labour market, and also in Portugal, but not in Greece or Italy. In Spain,
temporary employment was maintained throughout the entire growth cycle as the almost
universal form of labour participation and reached one third of the total employment. After
the crisis, its weight has decreased up to one fourth of the total employment, but this fact is
not due to a relative increase in recruitment with open-ended contracts, but rather to the
fact that the bulk of the jobs lost are of temporary nature and therefore their relative weight
with respect to the whole has decreased. In Portugal, employment loss has not decreased
the weight of temporary employment, which continues affecting one out of five people
employed.
The part-time employment levels have slightly increased in these four countries,
with a similar trend to the one in the whole of Europe. Although there are large differences
between the countries in this regard, all of them are still using this type of employment
much below the European average levels. And what is even more relevant, in Southern
Europe part-time employment embraces a very high percentage of workers who do so
involuntarily, namely, they work part time because they could not find a full-time job: In
2012 this figure was estimated at 65 per cent in Greece, 61 in Spain, 59 in Italy and 48 in
Portugal, whereas in the EU-17 it was 29. It is obvious that the main corpus of these types
of jobs does not satisfy the flexisecurity condition as they do not adjust to the employment
expectations of workers.
FIGURE 6 AND 7 HERE
3. Poverty and Income Inequality
A review of literature on the relationship between the economic cycle and
inequality is not conclusive (Ayala 2013). A strong decrease in employment usually affects
households in the lower income distribution segment more than households in the mid and
high segments. There are still few studies that have thoroughly analysed the effects of
Great Recession (Jenkins et al 2012; Callan et al. 2011; Avram et al. 2012), bearing in

12
mind, moreover, that the duration of the crisis may result in its severest effects only being
felt in more recent years, with no data available yet.
The intensity and the profiles of the employment crisis in these countries hardly
have affected aggregate indicators of poverty risk and income inequality. These countries
used to share high levels of poverty risk and they still share them, as well as they share
mid-level of income inequality (Figures 8 and ).
However, the recent evolution of these indicators differs by slight but relevant
degrees. Spain and Greece have pursued pathways in which poverty and inequality follow
opposite directions to those of the economic cycle: they have decreased, although very
slightly, during growth and increased during the crisis. Italy and Portugal pursue pathways
that are less parallel to the economic cycle: Portugal shows a decreasing trend in poverty
and inequality from 2005 to 2010, although this has shifted in 2011; Italy, on the other
hand, shows a similar trend to that of Portugal in terms of Gini coefficient and more
parallel to the economic cycle regarding poverty risk.
As in the case of the poverty indicator, the Gini coefficient illustrates that these
countries have become slightly more similar in terms of income distribution. This is the
result, above all, of the different evolution of that coefficient in Portugal and Spain, which
were the countries, respectively, with the highest and lowest levels of income inequality. In
Spain that inequality had increased since 2009 and in Portugal it had decreased until 2010
to start a slight rise in the two most recent years.
FIGURES 8 AND 9 HERE
The poverty risks with a fixed threshold at the beginning of the crisis provides
another useful reference, as it allows us to identify the potential change of poverty risk if
the whole income distribution had not changed. It confirms the current increases in the
poverty risk in the four countries if the threshold were maintained at the beginning of the
crisis (2008). This increase is being comparably higher in Greece, where the poverty risk
rate would double, and where somewhat more that two out of three people would be poor
in 2012 with the 2008 threshold. In the other countries, the poverty risk increases are
continuous but much less intense, in such a way that this indicator only increases by 4-6
points with reference to the one based on a mobile threshold. This fact shows that in
Greece the income decrease in households in the lowest part of the distribution is being far
higher than the one in the other three countries.
FIGURE 10 HERE

13
It could be stated that the crisis phase has made them much more similar than they
use to be in terms of their capacity to protect poverty risks in the different activity status
(Figure 10). Before the crisis, differences in that feature between Italy and the other three
countries were much more important than now. Italy showed, and still shows, to a pattern
of greater capacity to protect people from the poverty risk, especially the retired and also
the employed, as opposed to a much lower capacity to avoid that risk among the
unemployed. The other three countries were very similar regarding their respective poverty
risks for each of those groups; low among the unemployed and high among the employed
and retired. During the crisis, this pattern has not undergone significant modification, but
some trends have been identified whereby the poverty risk rates have got closer to the three
groups. The most prominent trends in that direction have been the poverty risk increase of
the unemployed in the four countries, at a faster pace in the three countries where it was
lower (Greece, Spain and Portugal), as well as the decrease in the poverty risk of the
retired, also in all the countries, but especially relevant in Spain.
FIGURE 11 HERE
However, when the poverty risk is measured on the basis of the indicators
addressing its most concerning aspects, persistence and material privation, the relative
scenario of these countries is very different. Only households with children are observed,
to focus on situations in which these poverty risks would have potentially more negative
consequences due to the presence of dependent minors (Figures 12 and 13). In Spain,
regardless of the employment crisis intensity and the relevant deterioration of low incomes,
its low levels of persistent poverty and severe material privation have hardly worsened. In
Greece, however, persistent poverty increased constantly since 2007 until it affected one
out of five households with children in 2011; during this time, there was also an important
increase of severe material privation in this country. In Portugal, persistent poverty also
rocketed in 2010 and 2011, although it was able to maintain its normally high level of
material privation. In Italy, the trend to decrease its high persistent poverty was halted; and
severe material privation rocketed since 2011 until it affected more than one out of ten
households with children.
FIGURES 12 AND 13 HERE
The weak poverty reduction effect produced by social transfers was one of the
typical characteristics of the social protection system in these countries, particularly when
pensions are excluded; namely, taking into account only social transfers, targeting
potentially active population and households. This poverty risk protection effect is one of

14
the basic functions of the social protection system. The risks prompted by employment
crisis periods are one of the main proofs of its efficacy. In this sense, the crisis has shown
that the ability to reduce the poverty risks by means of social transfers, starting from low
comparative levels, became much more uneven in these countries, even more uneven in
terms of the most severe poverty risk (Figure 13).
FIGURE 13 HERE
This reduction effect was very low in Greece and Italy and is still very similar
during the crisis: it did not reach the 20 percent reduction, for a 60 percent poverty
threshold, and slightly surpassed the 25 percent of the most severe poverty (at 40 percent
threshold); in 2011 the reduction rates of both poverty levels have hardly varied in either
country. However, Portugal and Spain, with a slight risk reduction before the crisis, faced a
greater reduction in 2011, especially in the case of severe poverty risk (40 percent
threshold). This risk was reduced by more than 40 percent in Spain and 50 percent in
Portugal as a consequence of social transfers.
It is interesting to note that, despite slight variations in Gini coefficient, relevant
changes in the different areas of income distribution are observed (Figure 15). Spain was
the Southern country with the least unequal income distribution before the crisis. In 2007,
Spain was the country where people at the top of the income scale (fifth quintile) received
a lower income fraction and people in the middle area (third quintile) received a greater
fraction; those in the lower area (first quintile) received a part equivalent to that in the
other three countries. With this situation before the crisis, Spain is the only country
showing a significant increase in income inequality during the crisis. Furthermore, Spain
has a clear pattern of greater inequality between the top and bottom in the distribution, as
the relative income participation in the lowest area has decreased by almost two points
(first quintile), whereas the middle area (third quintile) preserved the same income
participation and the lowest had a 1.6 point increase between 2008 and 2011. In Portugal,
the income distribution has followed the opposite direction: the highest income quintile
lost almost 3 points in 2010, and meanwhile the people in the middle and low positions
improved their participation by approximately 1 point. Although the latest annual data
available, corresponding to 2011, points towards a change of behaviour, the changes affect
middle and high incomes, and so far this does not seem to be in detriment of a significant
income reduction. In Greece and Italy, the participation of each income level has been
stable. In both countries, the lowest incomes have lost a maximum of one point, a loss only
observed between 2010 and 2011.

15
FIGURE 15 HERE
Such an extreme evolution of income inequality in Spain is partly due to the fact
that out of the four countries, Spain, unlike what happened in terms of poverty risk, enjoys
the lowest redistributive effect of the total transfers and taxes (pensions excluded). This is
the case, at least, in terms of income inequalities between the first and fifth quintile; in fact
it is one of the lowest in the EU. However, the Spanish redistributive effect is not so
different from that in the other countries so as to explain such an uneven result regarding
the recent evolution of income inequality. It is very possible that such a differential
characteristic of Spain is due to the fact that the crisis intensity has further worsened the
position of those who had the lowest primary incomes, or in other words, those who held
and have lost low salary jobs.
In short, regardless of the slight variation in the synthetic poverty and income
inequality indicators during the crisis, there have been significant changes in both
dimensions. In terms of poverty risk, some shifts have followed a similar direction in the
four countries: on the one hand, poverty increases did not represent an important fall of
poverty thresholds, which have only started to drop gradually during the second or third
year of the crisis; on the other hand, until well into the crisis (2010), the four countries
maintained their trends from the growth stage, towards slight poverty increases of the
employed, sharp poverty falls of the retired and moderate poverty increases of the
unemployed.
Other changes in poverty risk have followed different paths. Firstly, the increase in
poverty risk comes parallel to the employment crisis intensity, thus, it is significantly
higher in Greece and Spain: the poverty rate evolution, both at variable and fixed
thresholds, and the poverty threshold illustrate this trend. Secondly, and very significant, is
the uneven capacity of each country to reduce poverty by means of social transfers, clearly
higher in Spain and Portugal. This capacity had not been worsened by the crisis and it
should be mainly attributed to their unemployment protection systems. The third aspect,
which is more exclusive of Spain, is the fact that Spain has prevented the crisis from
increasing the levels of persistent poverty and severe material privation, two of the most
harmful aspects in terms of poverty risk.
In terms of income inequality, there is no doubt that Greece and Italy have enjoyed
the most stable evolution within the median inequality levels. Spain and Portugal started
from very differing situations, a high level in Portugal and a mid-low level in Spain, and
have also followed different trends: Spain towards a greater distribution polarisation,

16
Portugal towards a relative improvement of middle and low incomes. This evolution is
mainly attributed to the behaviour of primary incomes, as the four countries share low
redistributive effects.
4. Conclusion: A Great Recession but with Different National Profiles
Southern European countries have shared a great recession, but consequences on
employment structure, poverty and income inequality have been uneven; in a double sense,
with different intensities and not always in the same direction in terms of inequality. This
variety depends not only on the crisis intensity but also on other factors. Reviewing the
results of research that looks into those effects in comparative studies (Jenkins et al. 2012;
Callan et al. 2011; Avram, et al. 2012) or in specific studies for each country (for Spain,
Laparra and Pérez Eransus 2012, Fundación Alternativas 2013, Ayala 2013; for Greece,
Matsaganis and Leventi 2013, and for Italy, Brandolini, Amuri and Faiella 2012), three
factors that could best explain the variety of national profiles. The first factor is
undoubtedly the composition of those affected by the employment crisis and how the
potential income losses harm them and other groups. Secondly, the poverty or income
inequality dimensions that are taken into account. And thirdly, and more significantly, how
the specificities of the national system of social benefits and taxes interact with those
profiles of income and employment losses; this factor also includes the impact of austerity
measures in those countries.
FIGURE 16 AND TABLE 3 HERE
Taking in considerations these factors, a synthetic picture of the specific profiles for
each county is provided in Figure 16 and Table 3. Spain has experienced the deepest
employment crisis. The crisis has been intensely felt by the youngest employed but also by
the middle-aged employed. The non-occupation of unqualified is also leading the ranking.
Spain is also the country with a greater increase in the three inequality dimensions taken
into account: poverty risk, even more so the one resulting from the application of fixed
thresholds, Gini coefficient and inequality in top and bottom of income distribution
(quintiles 80 and 20). Nevertheless, Spain shows two traits that indicate smoother crisis
impacts: on the one hand, the poverty risk of the unemployed is still comparatively low; on
the other hand, the persistent poverty and the severe material privation were already low
and have hardly deteriorated.
The Spanish profile could probably be explained by the following factors. Firstly,
the concentration of employment loss among the least qualified persons has impacted the
17
labour incomes at the end of the distribution to a greater extent. Secondly, the income loss
in that area has not been translated into major leaps of unemployed persons or into
persistent poverty, as in Greece or Italy. This is mainly due to two reasons: the high
rotation in its labour market, which has decreased the long-term unemployment weight,
and the relative generosity of the unemployment protection of long-term unemployment.
This aspect is consistent with another observed fact: the system of social transfers
(excluding pensions) has maintained a moderate poverty reduction effect, even in the case
of the deepest poverty risk (40 per cent threshold). The stability of this poverty risk
reduction effect may be related to a third factor, the fiscal consolidation measures
implemented during the crisis, for which the available simulations point towards a gradual
joint effect in Spain, with the richest groups contributing with greater relative reductions of
income. This consequence is linked to the strongly gradual nature of the three components
of fiscal consolidation: two of them to a strong redistributive effect, changes in income
taxes and in social contributions, and the salary cuts in the public sector; another one, with
a weaker progressive effect, changes in social benefits, excluding pensions, which are
mainly non-contributory unemployment subsidies. On the contrary, the pension cuts and
VAT modifications have had a clearly regressive effect on income distribution.
In the case of Greece, the employment crisis has enjoyed a similar profile to that in
Spain. But Greece has a specific characteristic with distributive consequences: the decline
in employment in Greece has had a deeper impact on the middle-aged and older population,
as well as the employed with mid and high education levels. Therefore, the losses in labour
income had to be shared out to any income level. Although the poverty and inequality
indicators do not show large variations, the risks of poverty of the unemployed, of
persistent poverty and of material privation have become especially high.
In the case of Greece, its more concerning poverty pattern (due to the poverty of the
unemployed and persistence) could be mainly linked to protection of mid and long-term
unemployment schemes, which have a very weak impact on poverty reduction. Two
further factors may explain the stability of inequality indicators. On the one hand, the loss
of labour income in all the distribution segments, and on the other hand, due to the joint
effect of austerity measures, as in Greece, those affecting taxes and wage cuts in the public
sector have a strong progressive impact, and the measures on pensions are also progressive,
although their impact is lower. This progressive effect has only been compensated by the
regressive impact of VAT and other social benefits (excluding pensions).

18
In the Portuguese case, the employment crisis has been deep, but the country has
been able to maintain its normally high employment rates. This is mainly due to the fact
that females have hardly suffered of higher non-occupation, although the middle aged and
young males have suffered unemployment the most, as the least qualified workers.
Because of that, the percentage of households with low labour intensity has remained
stable. Portugal had, and still has, a high long-term unemployment rate, but the
combination of this greater labour participation of households and the generosity of its
long-term unemployment protection system have allowed the preservation of a good
redistributive effect by social transfers. Thus, the poverty risk has not increased, not even
among the unemployed. The income inequality has even decreased, and the highest
quintile has suffered the greatest relative income loss. To a great extent, this is also
explained by the fact that in Portugal, the adjustments that deeply affect all incomes
enclosed two adjustment measures with marked progressive effects, the ones that affected
pensions and the cuts on public workers’ earnings.
Finally, in Italy the changes have been more moderate in terms of job losses and
effects on inequality. The job loss has been concentrated in the youth and, as the high
employment levels among middle aged and older adults have remained stable, the level
and distribution of labour income have been maintained. Its poverty and inequality levels
have been very stable in almost all the indicators, except for the unemployed poverty rate,
which has increased by one point, being already high before the crisis. The protective
weakness of unemployment benefits explains that fact, and probably also, the recent leap
of the severe material privation. Furthermore, the adjustment measures have had quite a
flat effect: the changes in income taxes have had the deepest impact but they have also
resulted in a very similar income loss in all the areas of the scale. Changes in pensions and
salaries of the public sector, with a more progressive impact, have compensated the flat
effect on taxes, which per se would have harmed the households with lowest incomes even
more, and subsequently, would have increased the poverty risk.
References Avram S. et al. (2012) ‘The distributional effects of fiscal consolidation in nine EU
countries’, Research note 01/2012 European Observatory on the Social Situation
and Demography, European Commission.

19
Ayala, L. (2013), ‘Crisis económica y distribución de la renta: una perspectiva comparada’,
Papeles de Economía Española, vol. 135, pp. 2-19.
Brandolina, A., D’Amuri, F. and Faiella I. (2012) ‘Country case study – Italy’, in The
Great Recession and the Distribution of Household Income, eds S Jenkins, A.
Brandolini, J. Micklewright and B. Nolan, B. Oxford University Press, Oxford.
Callan T et al. (2011) ‘The distributional effects of austerity measures: a comparison of six
EU countries’, Research Note 2/2011 of the European Observatory on the Social
Situation and Demography, European Commission.
European Commission. (2012) Employment and Social Developments in Europe 2011,
Publications Office of the European Union, Luxembourg.
European Commission. (2013a) Employment and Social Developments in Europe 2012,
Publications Office of the European Union, Luxembourg.
European Commission. (2013b) EU Employment and Social Situation-Quarterly Review,
September 2013. Publications Office of the European Union, Luxembourg.
Fernández-Macías, E. Hurley, J. and Eurofound. (2008) More and better jobs? Patterns of
employment expansion in Europe – ERM report 2008, Publications Office of the
European Union, Luxembourg.
Ferrera, M. (1996) ‘The ‘‘Southern Model’’ of welfare in social Europe’, Journal of European
Social Policy, vol 6, no 1, pp. 17-37
Ferrera, M. (ed.) (2005) Welfare State Reform in Southern Europe. Fighting Poverty and
Social Exclusion in Italy, Spain, Portugal and Greece. Routledge, London
Ferrera, M. (2010) ‘The South European Countries’ in The Oxford Handbook of the
Welfare State, eds F.G. Castles et al, Oxford University Press, Oxford, pp. 616-629.
Fraser, N.; Gutiérrez, R., and Peña-Casas, R. (eds.) (2011) Working Poverty in Europe: A
Comparative Approach, Palgrave Macmillan, Bakingstoke.
Fundación Alternativas (2013) Primer Informe sobre la Desigualdad en España 2013,
Fundación Alternativas, Madrid.
Garrido, L. and Gutiérrez, R. (2011) ‘La reforma ineludible. Regularidades e inercias del
mercado de trabajo en España’, Panorama Social, vol. 13, pp. 37-54.
Jenkins, S et al. (eds.) (2012) The Great Recession and the Distribution of Household
Income, Oxford University Press, Oxford.
Karamessini, M. (2008) ‘Continuity and change in the Southern European social model’,
International Labour Review , vol 147, no 1, pp. 44-69.

20
Laparra, M. and Pérez-Eransus, B. (cords) (2012) Crisis y fractura social en Europa.
Causas y efectos en España, Obra Social La Caixa, Barcelona.
Marí-Klose, P. & Moreno-Fuentes F. J. (2013) ‘The Southern European Welfare model in
the post-industrial order’, European Societies, vol 15, no 4, pp. 475-492
Matsaganis, M. and Leventi, CH. (2013) ‘The Distributional Impact of the Greek Crisis in
2010’, Fiscal Studies, vol 34, no 1, pp. 83-108.
Nolan, B. and MARX, I. (2009) ‘Economic Inequality, Poverty and Social Exlusion’, in
The Oxford Handbook of Economic Inequality, eds O. W. Salverda, B. Noland and
T. Smeeding, Oxford University Press, Oxford, pp. 315-341.
OECD. (2013a) ‘Employment Outlook 2013’ avalaible online:
ww.oecd.org/about/publishing/Corrigendum_oecd-employment-outlook-2013.pdf
OECD. (2013b) ‘The 2012 Spanish Labour Market Reform of Labour. A Preliminary
Assesment’, available online:
http://www.oecd.org/els/emp/SpainLabourMarketReform-Report.pdf
Petmesidou, M. and Papatheodorou, C. (eds) (2006) Poverty and social deprivation in the
Mediterranean: trends, policies and welfare prospects in the new millenium, Zed
Books, London.
Sapir, A. (2006) ‘Globalisation and the Reform of European Social Models’, Journal of
Common Market Studies, vol. 44, no 2, pp. 369–390.
21
Figure 1. Employment rates 1995-2013 (20 to 64 years)
50
52
54
56
58
60
62
64
66
68
70
72
74
76
78
80
1995
1996
1997
1998
1999
2000
2001
2002
2003
2004
2005
2006
2007
2008
2009
2010
2011
2012
2013
Q2
Euro area-17
Greece
Spain
Italy
Portugal
Source: EUROSTAT, EU-LFS
Figure 2. Long-term unemployment, 2005-2012 (% of total employment)
10
15
20
25
30
35
40
45
50
55
60
65
70
2005 2006 2007 2008 2009 2010 2011 2012 2013Q2
Euro area-17
Greece
Spain
Italy
Portugal
Source: EUROSTAT, EU-LFS
Table 1. Employment rates by age and sex, 2007 and 2012 Males Females Males
25-29 years 25-29 years 40-44 years
2007 2012 2007 2012 2007 2012 Euro area-17 81,1 73,7 68,7 65,9 90,2 85,9
Greece 81,3 57,7 62,6 49,0 93,3 81,0
Spain 83,7 59,4 72,0 58,4 89,4 74,5
Italy 73,4 64,7 55,1 49,9 91,3 86,3
Portugal 82,1 71,7 72,3 70,3 89,9 80,7
22
Table 1 cont. Females Males Females
40 to 44 years 55 to 59 years 55 to 59 years
2007 2012 2007 2012 2007 2012
72,9 72,7 67,3 72,2 47,6 57,2
65,1 57,9 73,5 62,3 33,6 34,8
65,7 61,9 72,8 64,9 38,1 45,3
61,5 61,8 59,0 69,7 33,8 46,3
77,6 75,7 66,0 61,6 52,5 52,2 Source: EUROSTAT, EU-LFS
Figure 3. Youth employment rates by age and educational level, 2007 and 2012
25
30
35
40
45
50
55
60
65
70
75
80
85
90
95
2007 2012 2007 2012 2007 2012
20-24 years-Primary and lowersecondary
25-29 years-Upper secondary andpost-secondary education
30-34 years-First and second stage oftertiary
Greece Spain Italy Portugal
Source: EUROSTAT, EU-LFS
Figure 4. Annual employment change by wage quintile, Q2 2008 to Q2 2010 (%)
Source: Eurostat, LFS (Taken from European Commision 2012, chapter 1).

23
Table 2. Indicators of strictness of employment protection, 2008-2013 Years Greece Spain Italy Portugal OECD
Individual dismissals 2008 2013
2,690 2,075
2,224 1,948
2,595 2,412
4,167 3,010
2,150 2,041
Collective dismissals 2008 2013
3,250 3,250
3,750 3,125
4,125 3,750
1,875 1,875
2,903 2,909
Temporary employment 2008 2013
3,167 2,917
3,500 3,167
2,708 2,708
2,292 2,333
2,059 2,083
Source: OECD Indicators of Employment Protection: http://www.oecd.org/employment/emp/oecdindicatorsofemploymentprotection.htm Figure 5. Net replacement rates by employment benefits/assistance, 2007 and 2010
Source: OECD, Tax-benefit model (European commission 2012, p. 91)
Figure 6. Percentage of temporary employment, 2005-2013
4
6
8
10
12
14
16
18
20
22
24
26
28
30
32
34
36
2005 2006 2007 2008 2009 2010 2011 2012 2012Q3
Euro area-17
Greece
Spain
Italy
Portugal
Source: EUROSTAT, EU-LFS

24
Figure 7. Percentage of part-time employment, 2005-2013
0
2
4
6
8
10
12
14
16
18
20
22
24
2005 2006 2007 2008 2009 2010 2011 2012 2013Q3
Euro area-17
Greece
Spain
Italy
Portugal
Source: EUROSTAT, EU-LFS Figure 8. Risk of poverty rates, 2005-2012 (Total population; 60% of median equivalised income)
12
13
14
15
16
17
18
19
20
21
22
23
24
2005 2006 2007 2008 2009 2010 2011 2012
Euro area 17
Greece
Spain
Italy
Portugal
Source: EUROSTAT, EU-SILC Figure 9. Gini coefficient, 2005-2012 (scale from 0 to 100)
25
26
27
28
29
30
31
32
33
34
35
36
37
38
39
40
2005 2006 2007 2008 2009 2010 2011 2012
Euro area-17
Greece
Spain
Italy
Portugal
Source: EUROSTAT, EU-SILC

25
Figure 10. Risk of poverty rate anchored at a fixed moment in time (2008), 2008-2012
12
14
16
18
20
22
24
26
28
30
32
34
36
38
2008 2009 2010 2011 2012
Euro area-17
Greece
Spain
Italy
Portugal
Source: EUROSTAT, EU-SILC Figure 11. Risk of poverty rates by most frequent activity status, 2005-2012 (60% of median equivalised income)
Employed persons
6
7
8
9
10
11
12
13
14
15
16
2005 2006 2007 2008 2009 2010 2011 2012
Euro area-17
Greece
Spain
Italy
Portugal
Unemployed persons
26
28
30
32
34
36
38
40
42
44
46
48
50
2005 2006 2007 2008 2009 2010 2011 2012
Euro area-17
Greece
Spain
Italy
Portugal

26
Retired persons
1011121314151617181920212223242526
2005 2006 2007 2008 2009 2010 2011 2012
Euro area-17
Greece
Spain
Italy
Portugal
Source: EUROSTAT, EU-SILC Figure 12. At persistent* risk of poverty (households with dependent children), 2005-2011
56789
10111213141516171819202122
2007 2008 2009 2010 2011
Euro area-17
Greece
Spain
Italy
Portugal
* At-risk-of-poverty for the current year and at least two out of the preceding three years. Source: EUROSTAT, EU-SILC Figure 13. Severe material deprivation* rate (households with dependent children), 2005-2012
0
2
4
6
8
10
12
14
16
18
20
22
2005 2006 2007 2008 2009 2010 2011 2012
Euro area-17
Greece
Spain
Italy
Portugal
Inability to pay for at least four of nine deprivation items. Source: EUROSTAT, EU-SILC

27
Figure 15. Percentage reduction of poverty rates before and after social transfers (pensions excluded), 2007 and 2011
0
5
10
15
20
25
30
35
40
45
50
55
60
2007 2011 2.007 2.011
Risk of poverty threshold 60% Risk of poverty threshold 40%
Euro area-17 Greece Spain Italy Portugal
Source: EUROSTAT, EU-SILC Figure 16. Share of national equivalised income, 2007-2012
First quintile
5,0
5,5
6,0
6,5
7,0
7,5
8,0
8,5
9,0
9,5
10,0
2007 2008 2009 2010 2011 2012
Euro area-17
Greece
Spain
Italy
Portugal
Fifth quintile
37,0
37,5
38,0
38,5
39,0
39,5
40,0
40,5
41,0
41,5
42,0
42,5
43,0
43,5
44,0
44,5
45,0
2007 2008 2009 2010 2011 2012
Euro area-17
Greece
Spain
Italy
Portugal
Source: EUROSTAT, EU-SILC

28
Figure 3. Southern European countries profiles on employment crisis and poverty reduction during Great Recession
Table 3. Southern European countries profiles on social protection changes during Great Recession Spain
� Moderate and slightly increasing protection effect of social transfers. � Generous coverage and NRRs for ST and LT unemployment benefits. � Weak minimum income schemes, but effective to protect against poverty persistence
and severe material deprivation. � Smooth progressive effect of austerity measures.
Grecee � Weak and stable protection effect of social transfers � Weak LT unemployment benefits � Deep and low progressive impact of AP, specially income tax measures
Portugal � High and not declining protection effect of social transfers � Generous coverage and NRRs for ST and LT unemployment benefits � High progressive impact of public sector wage and pensions cuts
Italy � Low and stable protection effect of social transfers � Very weak unemployment protection � Flat net effect of AP; taxes with regressive impact, pensions a public sector wages with
regressive impact
Copyright © 2022 FDOKUMEN