CR8 - Baseline Soil Survey and Assessment Report - Grizzly ...
87
Suite 208 4207 – 98 Street Edmonton AB Canada T6E 5R7 Tel: 780.496.9048 Fax: 780.496.9049 Email: [email protected] www.mems.ca Baseline Soil Survey and Assessment Report for the Grizzly Oil Sands ULC Algar Lake SAGD Project Prepared for: Grizzly Oil Sands ULC Life Plaza 410, 734 7 Ave. SW Calgary, AB Prepared by: Millennium EMS Solutions Ltd. #208, 4207 – 98 St Edmonton, Alberta T6E 5R7 January 2010 File #07-099
-
Upload
khangminh22 -
Category
Documents
-
view
1 -
download
0
Transcript of CR8 - Baseline Soil Survey and Assessment Report - Grizzly ...
Suite 208 4207 – 98 Street Edmonton AB Canada T6E 5R7 Tel: 780.496.9048 Fax: 780.496.9049 Email: [email protected] www.mems.ca
Baseline Soil Survey and Assessment Report for the
Grizzly Oil Sands ULC Algar Lake SAGD Project
Prepared for: Grizzly Oil Sands ULC
Life Plaza 410, 734 7 Ave. SW
Calgary, AB
Prepared by: Millennium EMS Solutions Ltd.
#208, 4207 – 98 St Edmonton, Alberta
T6E 5R7
January 2010 File #07-099
Grizzly Oil Sands ULC Algar Lake SAGD Project Millennium EMS Solutions Ltd. January 2010
07-099 Page i
Table of Contents
Page Table of Contents .................................................................................................................................... i List of Tables .......................................................................................................................................... ii List of Figures ......................................................................................................................................... ii List of Appendices .................................................................................................................................. ii
1.0 INTRODUCTION ........................................................................................................................ 1 2.0 STUDY AREA ............................................................................................................................. 1
2.1 Project Study Area .................................................................................................................. 1 2.2 Project Footprint ...................................................................................................................... 1
3.0 METHODS .................................................................................................................................. 2 3.1 Survey Design ......................................................................................................................... 2 3.2 Soil Investigation Methods ...................................................................................................... 2 3.3 Soil Sampling .......................................................................................................................... 3 3.4 Soil Classification .................................................................................................................... 3 3.5 Terrain Classification .............................................................................................................. 4 3.6 Data Analysis .......................................................................................................................... 4 3.7 Soil Map Units ......................................................................................................................... 5
4.0 BASELINE MAPPING RESULTS .............................................................................................. 6 4.1 Soil Map Units – Project Study Area ....................................................................................... 6 4.2 Soil Map Units - Project Footprint ........................................................................................... 9
5.0 BASELINE SOIL INTERPRETATIONS AND RATINGS ........................................................... 9 5.1 Soil Layer Thickness ............................................................................................................. 10 5.2 Reclamation Suitability .......................................................................................................... 11 5.3 Forest Soil Capability Classification ...................................................................................... 13
5.3.1 Baseline Forest Soil Capability Classification ............................................................... 13 5.3.2 Reclaimed Forest Soil Capability Classification ............................................................ 14
5.4 Baseline Erosion Risk Assessment ...................................................................................... 16 6.0 BASELINE SUMMARY ............................................................................................................ 17 7.0 POTENTIAL IMPACTS ............................................................................................................ 18
7.1 Loss of Diversity .................................................................................................................... 18 7.2 Admixing of Soil .................................................................................................................... 18 7.3 Reclamation and Land Capability ......................................................................................... 19 7.4 Erosion of Reclaimed Soils ................................................................................................... 19
8.0 MITIGATION AND MONITORING ............................................................................................ 20 9.0 CLOSURE ................................................................................................................................ 20 10.0 REFERENCES ......................................................................................................................... 21
Grizzly Oil Sands ULC Algar Lake SAGD Project Millennium EMS Solutions Ltd. January 2010
07-099 Page ii
List of Tables
Table 1 Summary of Soil Map Units, Terrain Types, Drainage Characteristics and Distribution of Soils within in the Project Study Area .................................................................................. 6
Table 2 Summary of Soil Units and Terrain Types, within the Project Footprint ............................... 9 Table 3 Soil Layer Thickness for Soil Units within the Project Footprint ......................................... 11 Table 4 Reclamation Suitability Ratings for Soil Units in the Project Study Area ........................... 13 Table 5 Baseline Forest Land Capability by Soil Map Unit within the Project Study Area and
Reclaimed ratings for the Project Footprint ........................................................................ 15 Table 6 Extent of Baseline Land Capability in the Project Footprint ............................................... 16
List of Figures
Figure 1 Project Study Area and Proposed Footprint Figure 2 Soil Inspection Site Locations in the Project Study Area Figure 3 Soil Units in the Project Study Area Figure 4 Soil Units in the Project Footprint Area Figure 5 Soil Thickness of Map Units in the Project Footprint Figure 6a Reclamation Suitability in the Project Study Area - Topsoil Figure 6b Reclamation Suitability in the Project Study Area – Upper Subsoil Figure 7 Baseline Forest Capability Ratings for Soil Map Units of the Project Study Area
List of Appendices
Appendix A Summary of Soil Inspection Sites Appendix B Laboratory Results Appendix C Reclamation Suitability Calculations Appendix D Land Capability Calculations
Grizzly Oil Sands ULC Algar Lake SAGD Project Millennium EMS Solutions Ltd. January 2010
Page 1 07-099
1.0 INTRODUCTION
Grizzly Oil Sands ULC (Grizzly) retained Millennium EMS Solutions Ltd. (MEMS) to compile a report describing the baseline soil conditions at their Algar Lake property near Mariana Lake, Alberta. Grizzly plans to develop the Algar Lake SAGD Project (the “Project”) in two Stages, each of nominally 900 cubic meters per day capacity. Grizzly’s bitumen resources are located west of Highway 63 on three oil sands leases (OSL #7406080047, OSL #7406080049 and OSL #7407050182) within Township 85, Ranges 11&12-W4M. In 2007, Northwind Land Resources (Northwind) conducted a baseline soil survey in the project area (Northwind 2008). In the following report, MEMS will present the baseline soil survey information collected by Northwind and utilize this information to complete an assessment of the Algar Lake SAGD Project. The objectives of the baseline soil survey and assessment were to:
• map the soil resources in the proposed study area at a survey intensity that is sufficient for baseline interpretation;
• evaluate soil and terrain inventory data and provide detailed baseline soil conditions in relation to: • reclamation suitability of representative soils; • land capability of the soils for forest ecosystems; • soil profile thicknesses; • erosion potential of soils within the study area; and
• discuss potential impacts of the Project on soil and terrain.
2.0 STUDY AREA
2.1 Project Study Area
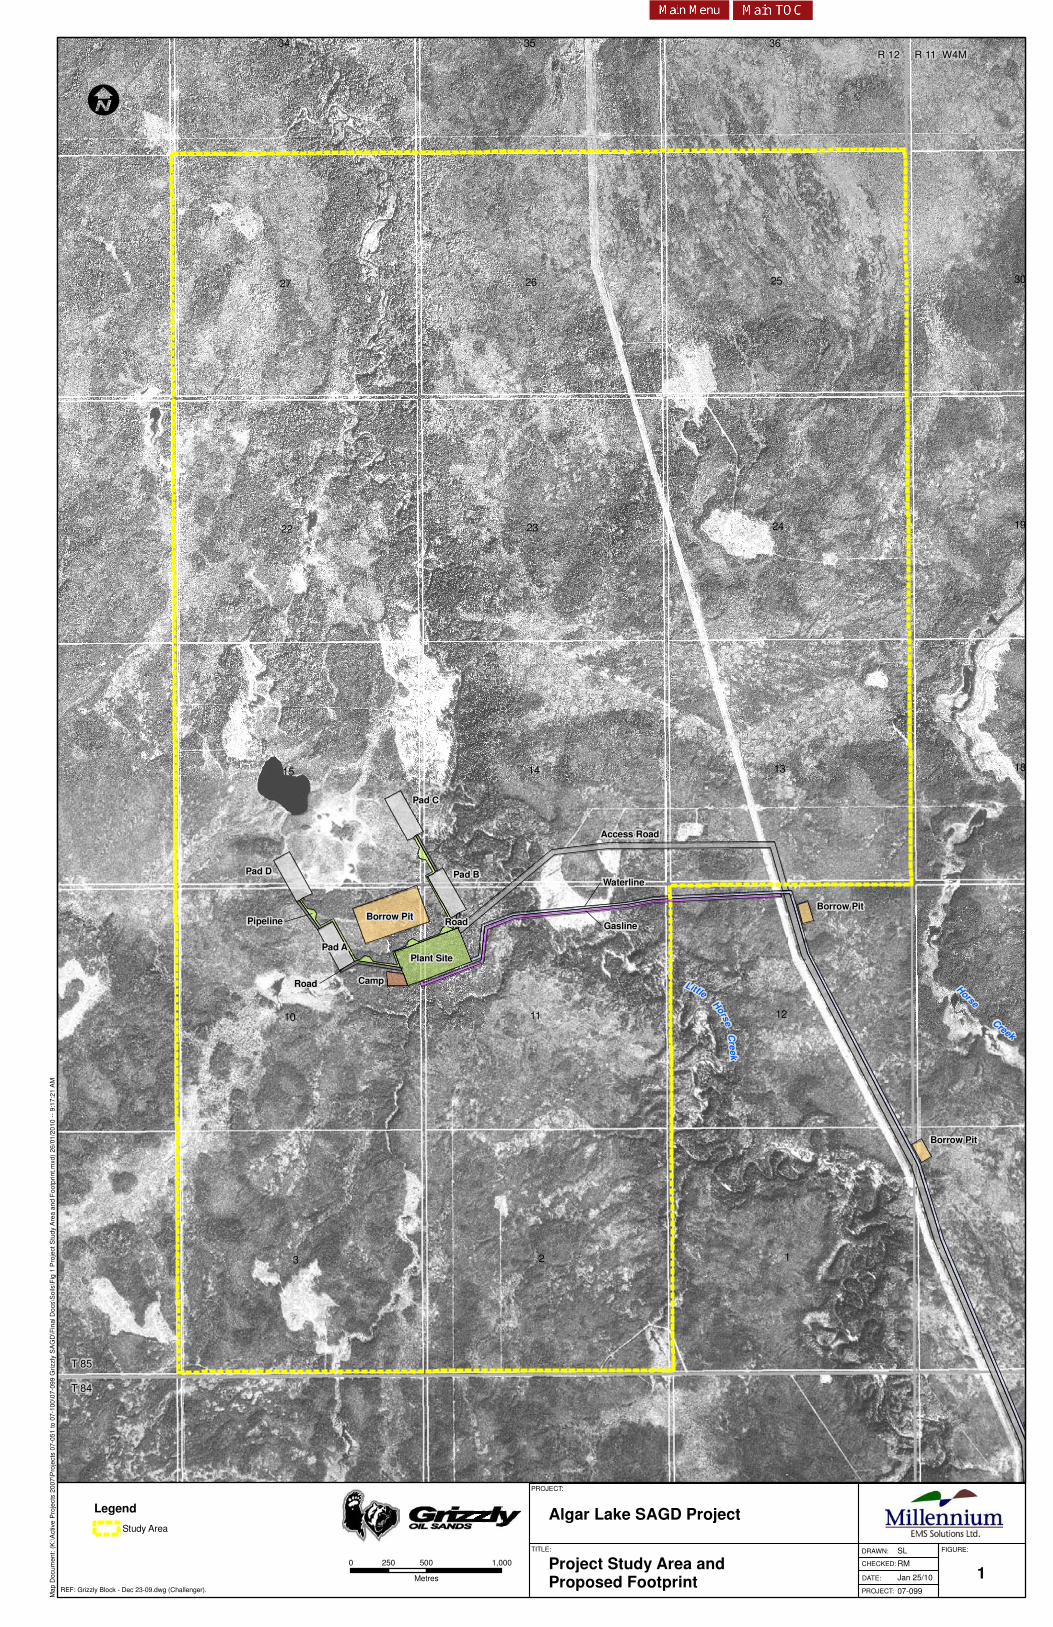
The Project is located in northeastern Alberta, about 45 km southwest of Fort McMurray. The Project study area is located in Sections 2, 3 10, 11, 13, 14, 15, 22, 23, 24, 25, 26, and 27 of Township 85, Range 12 West of the Fourth Meridian. The approximate size of the Project study area is 3,422 ha (Figure 1).
2.2 Project Footprint
The proposed Project footprint is located within Sections 10, 11, 14, and 15 of Township 85, Range 12, West of the Fourth Meridian and is an estimated 43 ha in size. Components of the Project footprint are shown on Figure 1 and include the following:
• Plant Site (10.8 ha); • four well pads (A, B, C and D; 14.3 ha); • one borrow pit (11.3 ha);

Grizzly Oil Sands ULC Algar Lake SAGD Project Millennium EMS Solutions Ltd. January 2010
Page 2 07-099
• internal access (2.0 ha); • a campsite (1.1 ha) and • a pipeline (3.7 ha).
3.0 METHODS
3.1 Survey Design
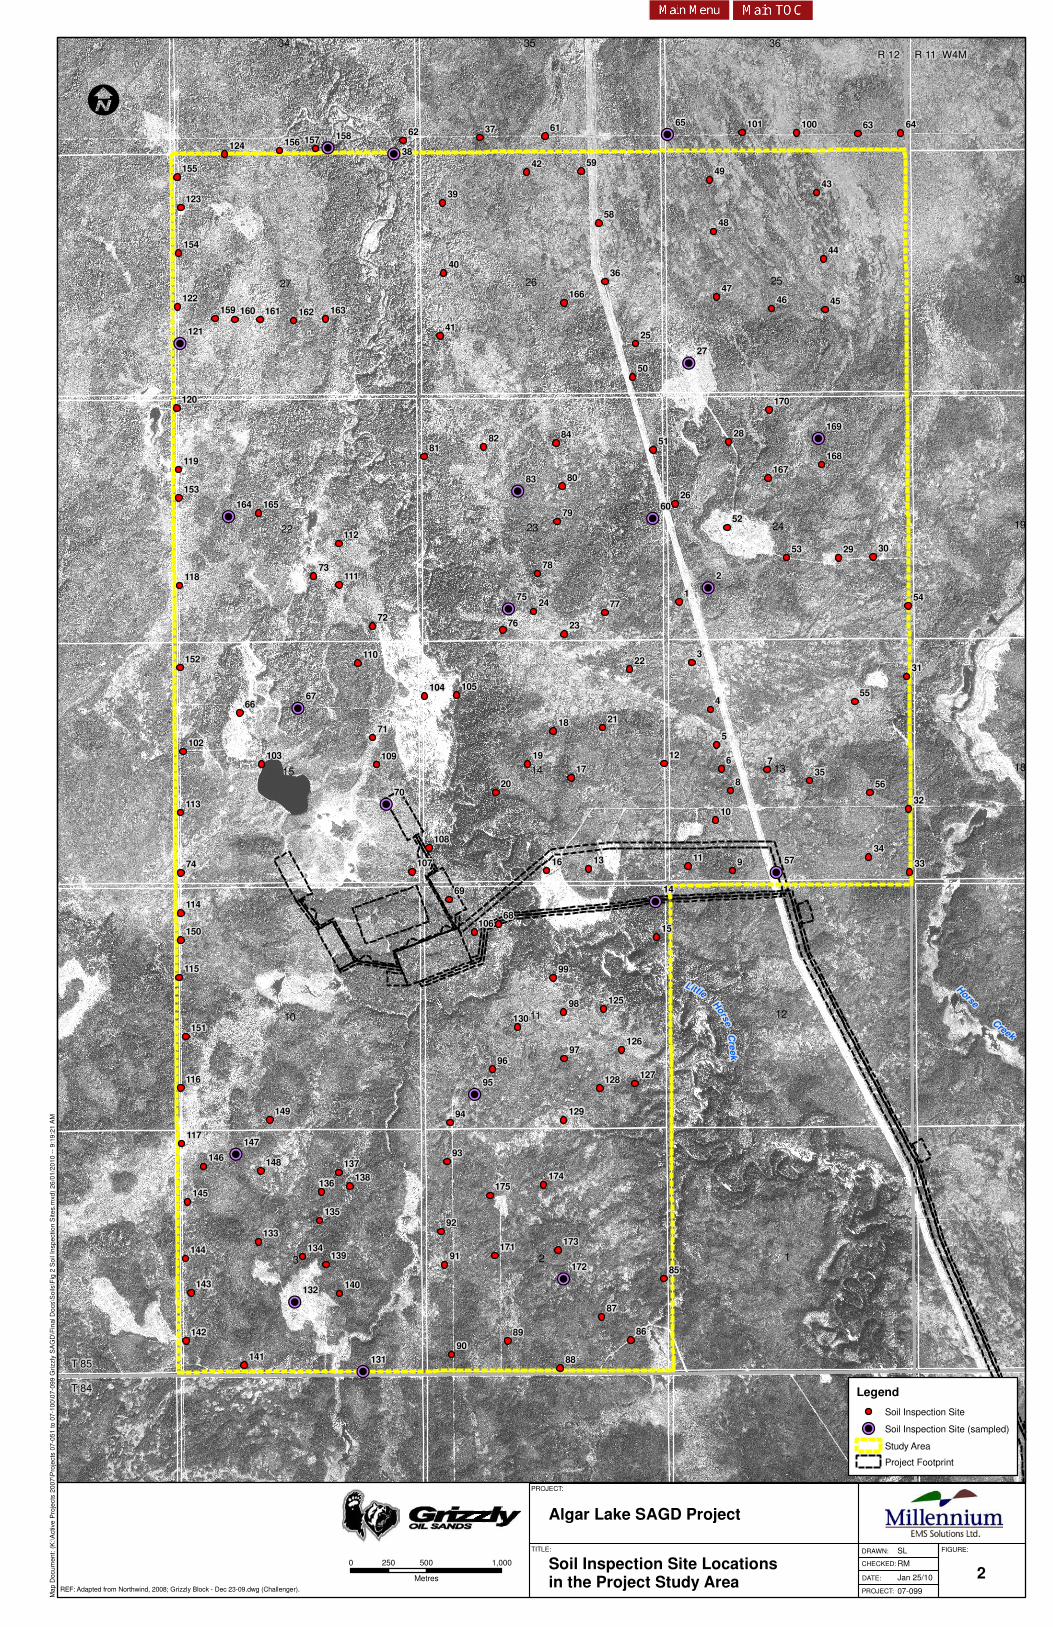
A baseline soil survey was conducted by Northwind in October 2007 within the Project study area. In total 175 soil inspections were advanced, which included 21 soil sample locations, spread over approximately 3,422 ha (Figure 2). The survey intensity achieved was approximately one inspection per 19 ha, adequate for mapping at a 1:20,000 production scale.
A Project footprint was finalized in December 2009 and is within portions of Sections 11, 14, 23 and 24 in Township 85, Range 12 West of the 4th Meridian. A SIL 1 baseline soil survey of the Project footprint will be completed prior to development. In the interim, MEMS has extrapolated baseline interpretations and capability ratings based on the information collected by Northwind during the October 2007 survey.
3.2 Soil Investigation Methods
At each inspection site, a Dutch auger and shovel were used to examine the soil profile to a minimum depth of 100 cm for all upland soils and to a minimum depth of 120 cm for organic soils (maximum depth of investigation for organic soils was 220 cm). The following soil and landscape sampling parameters were collected:
• horizon designation and depth; • surficial parent material (i.e. till or glaciofluvial); • color identification using Munsell color charts; • structure and consistence; • manual hand texture and coarse fragment content (% volume); • slope class, position and aspect; • drainage and water table, if present within the sampling depth of the soil profile; and • additional soil attributes, if evident, that aid in soil classification and/or description.
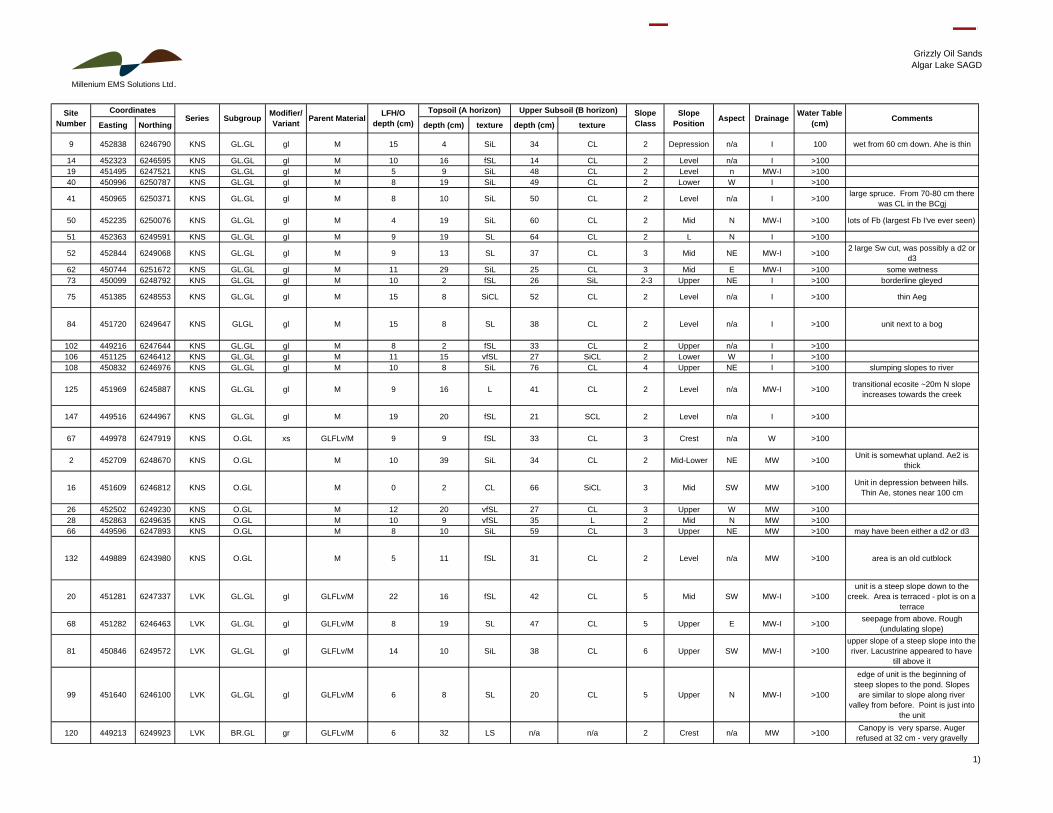
Soil inspection sites were marked on airphotos and UTM (NAD 83) coordinates were recorded from hand-held GPS units. A summary of the soil inspection data for each site is provided in Appendix A (data is adapted from the NorthWind 2008 baseline soil report).
Grizzly Oil Sands ULC Algar Lake SAGD Project Millennium EMS Solutions Ltd. January 2010
Page 3 07-099
3.3 Soil Sampling
A sampling intensity of approximately 1 per 8 inspection sites was conducted by Northwind (2008). Soil samples from each of the dominant or representative soil types within the Project study area were discretely collected, labelled and stored in plastic bags and sealed for transport to ALS Laboratories. Methods used by ALS Laboratories were cross-referenced with acceptable analytical methods outlined in the Land Capability Classification System for Forest Ecosystems in the Oil Sands (CEMA 2006), as well as soil suitability ratings for reclamation as per Soil Quality Criteria Relative to Disturbance and Reclamation (SQWG 1987).
3.4 Soil Classification
Soil classification to the series level (required for mapping) involved three steps:
• classification of each profile (inspection site) to the soil subgroup level (SCWG 1998) based on morphological features (e.g. types and arrangement of identified horizons, degree of gleying presence and/or thickness of organic layers, etc.);
• classification of soil parent materials according to mode of deposition plus textural characteristics (i.e. coarse textured material over medium textured till); and
• merging the two classifications to define soil series level taxa based on the AGRASID name file; (ASIC 2001, Brierley et al. 2006). Soil names were derived from Soil Correlation Area (SCA) 20, in which the Project study area occurs (ASIC 2001, Brierley et al. 2006).
Soil Variants
Soil variants define soil entities that are sufficiently different from established soil series to warrant recognition, but do not justify a new soil name due to limited geographic extent. Variants are applied as two lower case letters preceding the series name.
The following soil series variants were used in this study:
• not modal (aa) to SCA 20; • gleyed phase (gl) – increased soil moisture (imperfectly drained) within 100 cm; • peaty phase (pt) – soils having a 15 to <40 cm accumulation of surface peat; • fine textured phase (xc) - fine textured material within 100 cm; • coarse textured phase (xs) - coarse textured material within 100 cm; and • medium textured phase (xt) – medium textured material within 100 cm.
Grizzly Oil Sands ULC Algar Lake SAGD Project Millennium EMS Solutions Ltd. January 2010
Page 4 07-099
3.5 Terrain Classification
Terrain within the Project study area was determined based on estimated slopes of the landforms collected during the field investigation coupled with Light Detection and Ranging (LiDAR) imagery of the Project area. Terrain identification is linked to the soils types recorded in various landscapes. Drier upland soil (Luvisols, Brunisols) were recorded on landforms with noticeable relief (>2% slopes) whereas poorly drained soils were located in landforms with little to no surface relief. Terrain types have been identified based on the parent materials associated with the formation of the landform and the steepness of the representative slopes. For example, a majority of the drier upland soils have formed on terrain with noticeable relief that is a result of glacial till material or veneer of glaciofluvial material over glacial till. Terrain types include:
• Glacial till (till) – slopes form 0.5-5%, landforms described as low and high relief undulating. • Glaciofluvial veneer over lying till – slopes form 0.5-30%, landforms range from undulating to
hummocky to hummocky ridged. • Glaciofluvial (water laid deposits) – slopes from 0.5-2.5%, low relief nearly level landforms. • Organic – slopes form 0-2.5%, nearly level landforms covered by an accumulation of peat
material (parent materials underlying peat are predominantly water laid deposits). • Fluvial – slopes from 0-2.5%, relatively recent fluvial deposits, located adjacent to active
stream channels and are often comprised of former floodplains.
Table 1 summarizes the terrain types and associated slopes expected to occur with each dominant soil type in the Project study area.
3.6 Data Analysis
A variety of mapping tools were used collectively to interpret soil and landscape data and develop the soil map for the Project study area. These tools included:
• satellite image of the study area enlarged to 1:20,000; • cursory AVI data collected within the Project area; • LiDAR images of the Project area; • Agricultural Region of Alberta Soil Inventory Database ((AGRASID), Alberta Soil Names and
Layers files (ASIC, 2001); and • soils maps and data available from previous soil surveys in the region.
Enlarged laser prints of satellite imagery were used to plan field survey activities, estimate the potential aerial extent of soils and plot inspection sites during the survey.
Mapping was completed through layering the cursory AVI vegetation data over the three dimensional like LiDAR and/or satellite images of the Project study area. Additionally, all inspection points were
Grizzly Oil Sands ULC Algar Lake SAGD Project Millennium EMS Solutions Ltd. January 2010
Page 5 07-099
placed on the images to assist in determining soil attributes within the Project study area. Soil and terrain mapping was completed by depicting distinct soil, vegetation, and landscape patterns to determine appropriate soil map units of the Project study area. AVI map polygons were generally maintained as soil and terrain map polygons, but in some instances were edited to separate complex soil units. This was generally confined to the Little Horse Creek valley.
3.7 Soil Map Units
Differences in soil patterns between Organic and mineral soils resulted in unique soil map symbols for each. Mineral soil map units were named on the dominant series/variants expected to occur in that soil landscape pattern. Organic soil map units are described using the appropriate soil series name (i.e. MUS or MLD) and numbering system to represent estimated peat thickness. The numerical portion of the map unit symbol indicates depth of peat as follows:
1 Average peat depth 40-100 cm. 2 Average peat depth 100-200 cm. 3 Average peat depth >200 cm.
In instances of deep peat deposits no variant code was listed as mineral material may not have been encountered in these areas (i.e. MLD3 – represents a peat deposit >200 cm and no mineral material was recorded for a majority of the inspection sites in the map unit).
The soil inspections were extrapolated using the principles of geomorphology and surficial geology in concert with the vegetation patterns to delineate the individual soil units. Since soils are a continuum, soil map units are defined as having a certain range of properties.
Soil map units have been broken into three “description” categories based on overall internal drainage to assist in displaying summary information of the study area and footprint. The description categories include:
1. Upland soils – soils with moderately well to imperfect drainage that consist of Luvisols (and gleyed variants) and Brunisols. These soils typically have sub surface water at >100 cm from surface. Upland soils are considered mineral soils.
2. Transitional soils – soils that occur between uplands soils and organic soils. These soils are usually Gleysols, occur in lower slope to depressional positions, often have a peaty surface layer >15 cm but <40 cm and display evidence of a fluctuating water table (mottles and gleying). Transitional soils are considered mineral soils.
3. Organic soils – soils that contain >40 cm of surface peat and occur in poorly drained depressional or level areas, organic material is considered either bog or fen peat. In many instances the depth of peat to mineral contact exceeds 200 cm.

Grizzly Oil Sands ULC Algar Lake SAGD Project Millennium EMS Solutions Ltd. January 2010
Page 6 07-099
4.0 BASELINE MAPPING RESULTS
4.1 Soil Map Units – Project Study Area
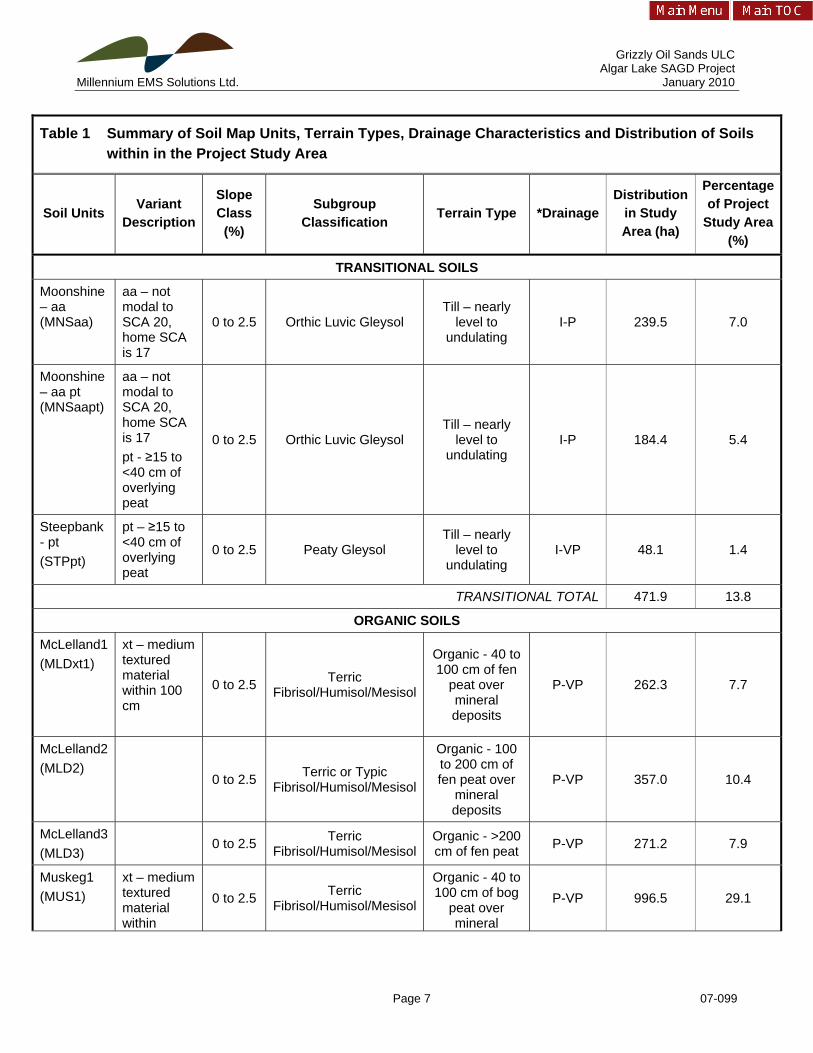
Soil series, associated variants and, terrain types identified in the Project study area and map unit distribution within the Project study area and the footprint are provided in Table 1. A soil map of the survey study area is provided in Figure 3.
Table 1 Summary of Soil Map Units, Terrain Types, Drainage Characteristics and Distribution of Soils within in the Project Study Area
Soil Units Variant Description
Slope Class
(%)
Subgroup Classification Terrain Type *Drainage
Distribution in Study Area (ha)
Percentage of Project
Study Area (%)
UPLAND SOILS
Kinosis (KNS) 0.5 to 5 Orthic Gray Luvisol Till - undulating W-MW 120.9 3.5
Kinosis gl (glKNS)
gl – profile displays evidence of gleyed conditions
0.5 to 5 Gleyed Gray Luvisol Till - undulating MW-I 186.4 5.4
Livock (LVK)
0.5 to 30
Orthic Gray Luvisol/Brunisolic Gray
Luvisol
Glaciofluvial veneer over till
or glaciolacustrine – undulating to
steep hummocky
MW-W 81.9 2.4
Livock – gl (glLVK) gl – profile
displays evidence of gleyed conditions
0.5 to 30
Gleyed Gray Luvisol/Gleyed
Brunisolic Gray Luvisol
Glaciofluvial veneer over till
or glaciolacustrine - undulating to
steep hummocky
MW-I 225.4 6.6
McMurray – gl (glMMY)
gl – profile displays evidence of gleyed conditions
0.5 to 2.5
Gleyed Cumulic Regosol/Gleyed
Cumulic Humic Regosol
Fluvial – nearly level to
undulating I 15.0 0.4
UPLAND TOTAL 629.6 18.4
Grizzly Oil Sands ULC Algar Lake SAGD Project Millennium EMS Solutions Ltd. January 2010
Page 7 07-099
Table 1 Summary of Soil Map Units, Terrain Types, Drainage Characteristics and Distribution of Soils within in the Project Study Area
Soil Units Variant Description
Slope Class
(%)
Subgroup Classification Terrain Type *Drainage
Distribution in Study Area (ha)
Percentage of Project
Study Area (%)
TRANSITIONAL SOILS
Moonshine – aa (MNSaa)
aa – not modal to SCA 20, home SCA is 17
0 to 2.5 Orthic Luvic Gleysol Till – nearly
level to undulating
I-P 239.5 7.0
Moonshine – aa pt (MNSaapt)
aa – not modal to SCA 20, home SCA is 17 pt - ≥15 to <40 cm of overlying peat
0 to 2.5 Orthic Luvic Gleysol Till – nearly
level to undulating
I-P 184.4 5.4
Steepbank - pt (STPpt)
pt – ≥15 to <40 cm of overlying peat
0 to 2.5 Peaty Gleysol Till – nearly
level to undulating
I-VP 48.1 1.4
TRANSITIONAL TOTAL 471.9 13.8
ORGANIC SOILS
McLelland1 (MLDxt1)
xt – medium textured material within 100 cm
0 to 2.5 Terric Fibrisol/Humisol/Mesisol
Organic - 40 to 100 cm of fen
peat over mineral deposits
P-VP 262.3 7.7
McLelland2 (MLD2)
0 to 2.5 Terric or Typic Fibrisol/Humisol/Mesisol
Organic - 100 to 200 cm of fen peat over
mineral deposits
P-VP 357.0 10.4
McLelland3 (MLD3)
0 to 2.5 Terric Fibrisol/Humisol/Mesisol
Organic - >200 cm of fen peat P-VP 271.2 7.9
Muskeg1 (MUS1)
xt – medium textured material within
0 to 2.5 Terric Fibrisol/Humisol/Mesisol
Organic - 40 to 100 cm of bog
peat over mineral
P-VP 996.5 29.1

Grizzly Oil Sands ULC Algar Lake SAGD Project Millennium EMS Solutions Ltd. January 2010
Page 8 07-099
Table 1 Summary of Soil Map Units, Terrain Types, Drainage Characteristics and Distribution of Soils within in the Project Study Area
Soil Units Variant Description
Slope Class
(%)
Subgroup Classification Terrain Type *Drainage
Distribution in Study Area (ha)
Percentage of Project
Study Area (%)
100 cm deposits
Muskeg2 (MUS2)
0 to 2.5 Terric or Typic Fibrisol/Humisol/Mesisol
Organic - 100 to 200 cm of
bog peat over mineral deposits
P-VP 196.2 5.7
Muskeg3 (MUS3)
0 to 0.5 Typic Fibrisol/Humisol Mesisol
Organic - >200 cm of bog peat P-VP 148.9 4.4
ORGANIC TOTAL 2,232.2 65.2
NON-SOIL UNITS
Alluvium (AV)
N/A Regosols/Rego Gleysols
Active floodplains or
portions of creeks/rivers
N/A 53.0 1.5
Disturbed Land (DL)
Variable Disturbed soil profiles Variable – wellsites and access roads
N/A 25.6 0.7
Open Water (ZWA)
N/A N/A Water body N/A 9.2 0.3
NON SOIL TOTAL 87.8 2.5
TOTALS 3421.5 100 *Drainage: W – Well, MW – Moderately well, I – Imperfect, P – Poor, VP – Very poor N/A – Not applicable
The dominant upland soil map unit within the Project study area is the LVKgl which accounts for approximately 225 ha (7%) of the Project Study area. The dominant transitional and organic map units are MNSaa and MUS1 comprising 240 ha (7%) and 997 ha (29%) respectively. The dominant upland terrain type is low relief undulating which accounts for approximately 794 ha of the Project study area. Organic landscapes cover an estimated 2,232 ha (65%) of the Project study area.
Grizzly Oil Sands ULC Algar Lake SAGD Project Millennium EMS Solutions Ltd. January 2010
Page 9 07-099
4.2 Soil Map Units - Project Footprint
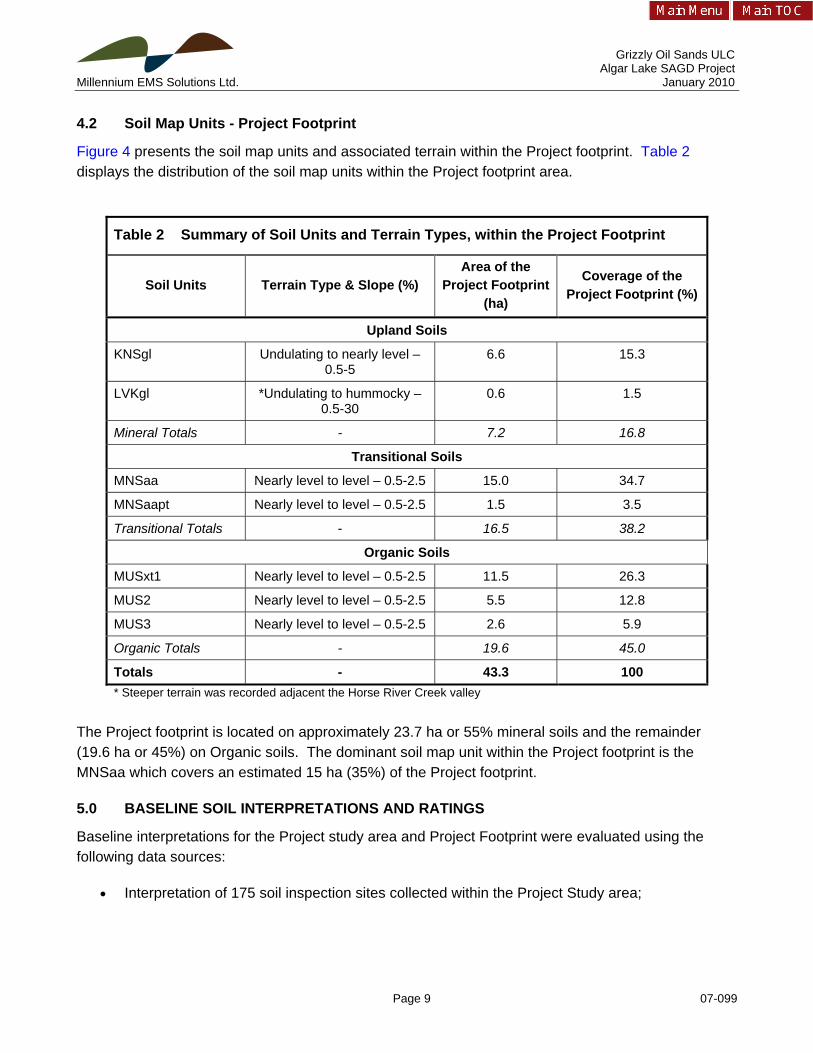
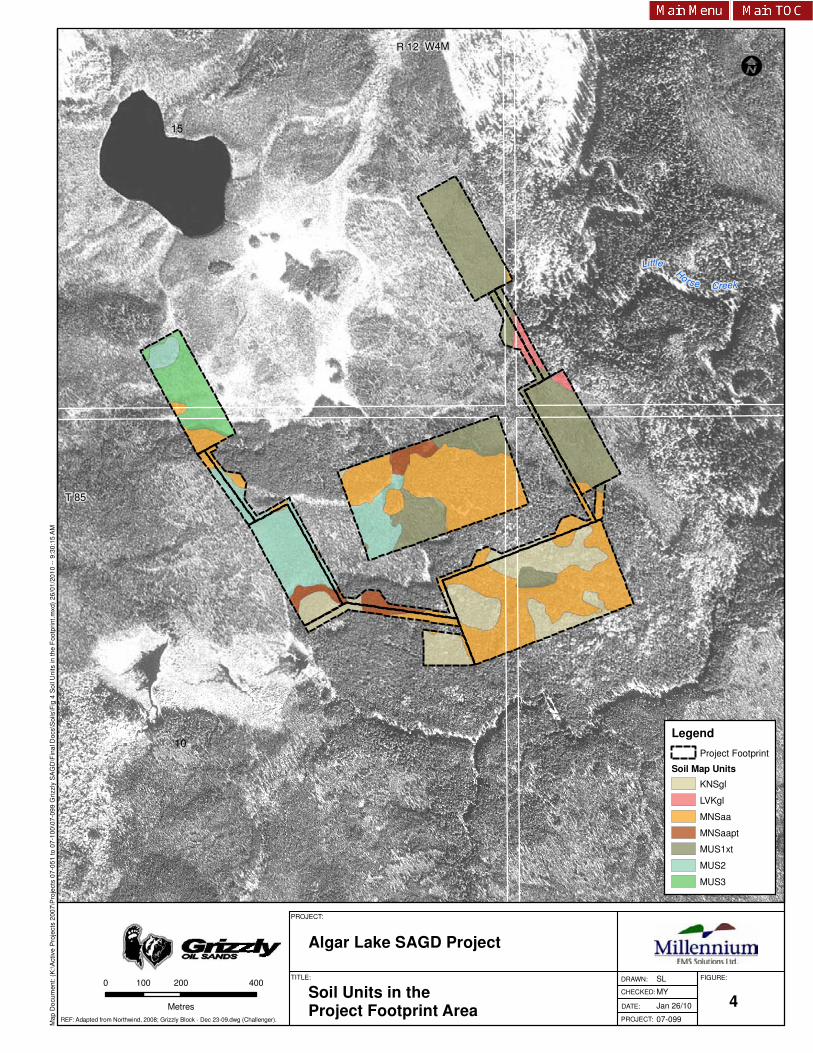
Figure 4 presents the soil map units and associated terrain within the Project footprint. Table 2 displays the distribution of the soil map units within the Project footprint area.
Table 2 Summary of Soil Units and Terrain Types, within the Project Footprint
Soil Units Terrain Type & Slope (%) Area of the
Project Footprint (ha)
Coverage of the Project Footprint (%)
Upland Soils
KNSgl Undulating to nearly level – 0.5-5
6.6 15.3
LVKgl *Undulating to hummocky – 0.5-30
0.6 1.5
Mineral Totals - 7.2 16.8
Transitional Soils
MNSaa Nearly level to level – 0.5-2.5 15.0 34.7
MNSaapt Nearly level to level – 0.5-2.5 1.5 3.5
Transitional Totals - 16.5 38.2
Organic Soils
MUSxt1 Nearly level to level – 0.5-2.5 11.5 26.3
MUS2 Nearly level to level – 0.5-2.5 5.5 12.8
MUS3 Nearly level to level – 0.5-2.5 2.6 5.9
Organic Totals - 19.6 45.0
Totals - 43.3 100 * Steeper terrain was recorded adjacent the Horse River Creek valley
The Project footprint is located on approximately 23.7 ha or 55% mineral soils and the remainder (19.6 ha or 45%) on Organic soils. The dominant soil map unit within the Project footprint is the MNSaa which covers an estimated 15 ha (35%) of the Project footprint.
5.0 BASELINE SOIL INTERPRETATIONS AND RATINGS
Baseline interpretations for the Project study area and Project Footprint were evaluated using the following data sources:
• Interpretation of 175 soil inspection sites collected within the Project Study area;
Grizzly Oil Sands ULC Algar Lake SAGD Project Millennium EMS Solutions Ltd. January 2010
Page 10 07-099
• Soil physical and chemical analytical results from a total of 21 sampled soil profiles (Appendix B);
• AGRASID, Alberta Soil Names and Layers files (ASIC, 2001); and • soils maps and data available from previous soil surveys in the region.
5.1 Soil Layer Thickness
Soil layer thickness was determined for the following horizons:
• Surface litter/Shallow Peat deposits – this includes the LFH layer and surface peat deposits <40 cm thick that constitute a peaty variant in an upland or transitional soil profile.
• A horizon – includes all Ah, AB, Ahe, and Ae horizons, including gleyed, weakly gleyed, carbonated, and disturbed (u) versions of these horizons.
• Deep Peat Deposits – includes surface peat layers thicker than 40 cm prior to mineral soil contact. Typically the range of peat thickness varies from 40 - >220 cm and is comprised of fen or bog peat materials.
• Upper subsoil – all types of B horizons (Bm, Bt, Btg, Bnt), plus gleyed (g) and juvenile (j) versions were considered to be part of the upper subsoil for depth calculations. BA horizons were also included. Where B or BA horizons were absent, the uppermost BC horizon was considered to be upper subsoil.
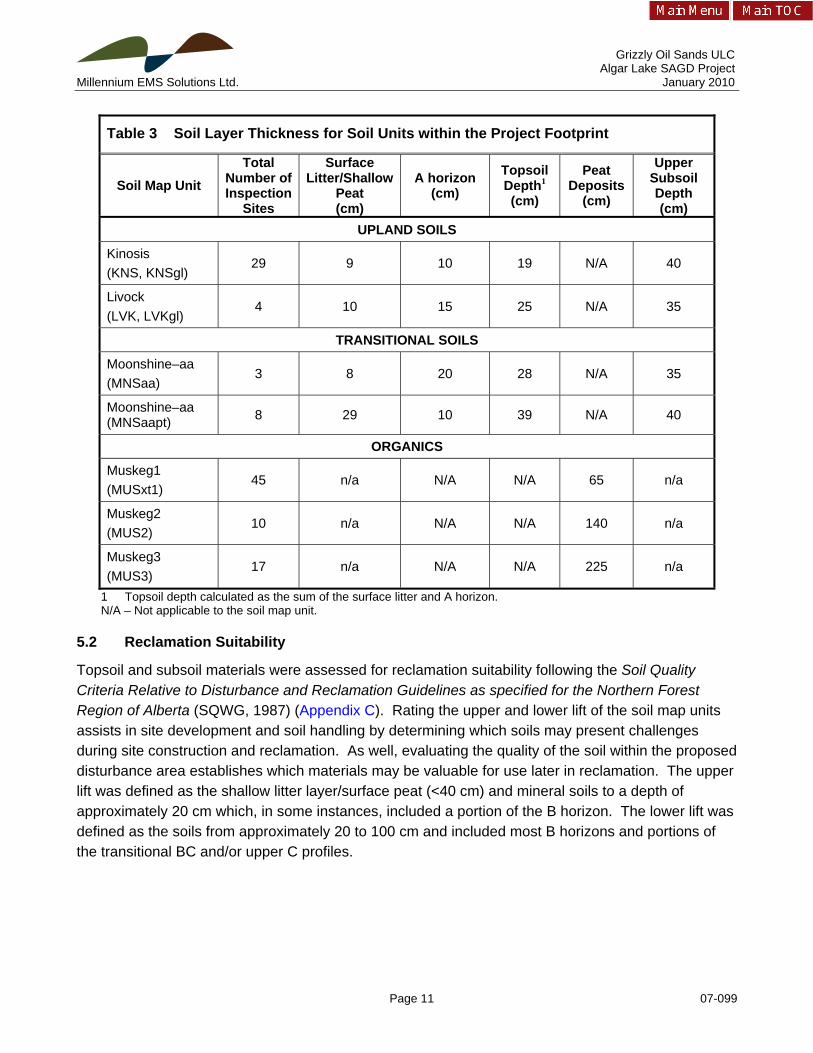
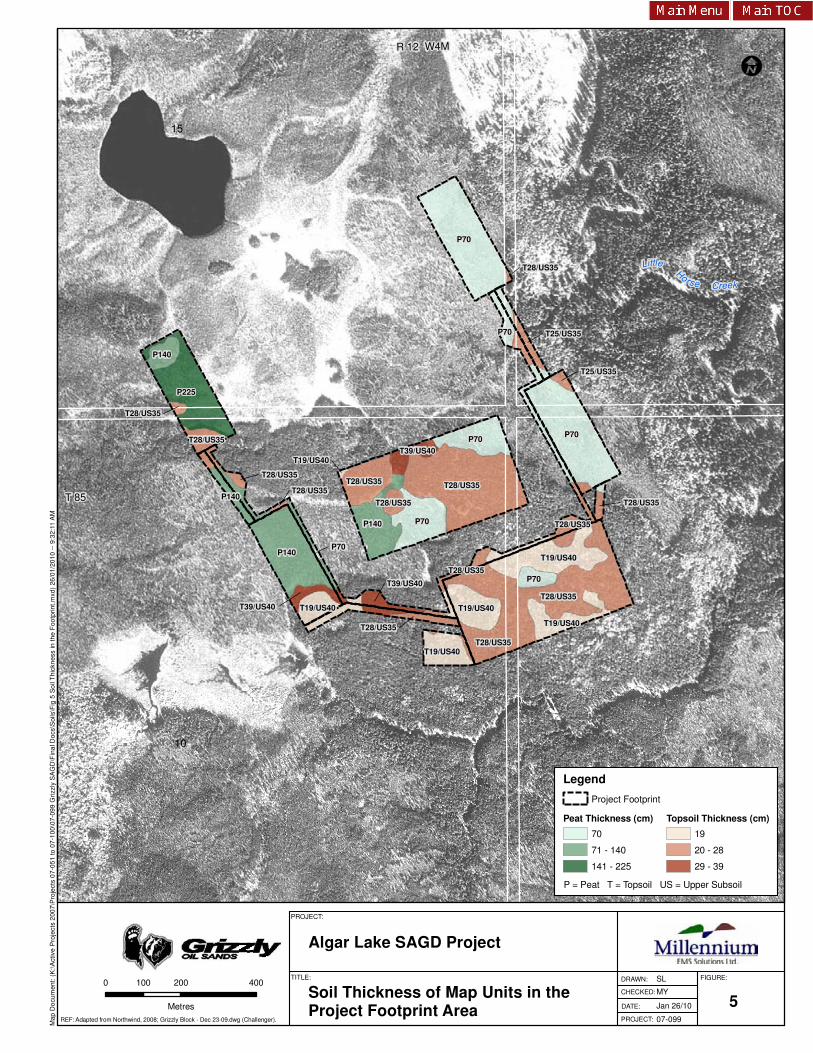
All soil data collected within the Project study area (175 inspections points) was utilized to determine representative layer thicknesses for the soil map units recorded within the Project footprint. This was determined by averaging all inspection points of the same series to determine average layer thicknesses to apply to a map unit (e.g. STPpt) located within the Project footprint. For example, all STPpt site inspections within the Project study area were averaged; the reported averages for each appropriate layer have been applied to all map units labelled STPpt. Table 3 summarizes the estimated soil layer thickness values for soil map units and Figure 5 displays the soil thickness averages for the Project footprint. Sites deemed to be outliers were excluded from the averaging calculation.
Averages for litter layers were not rounded; all other depth averages were rounded to the nearest 5 cm to account for variability. Non-soil map units were not included in the determination of soil thickness (DL, ZWA, or AV).
Grizzly Oil Sands ULC Algar Lake SAGD Project Millennium EMS Solutions Ltd. January 2010
Page 11 07-099
Table 3 Soil Layer Thickness for Soil Units within the Project Footprint
Soil Map Unit Total
Number of Inspection
Sites
Surface Litter/Shallow
Peat (cm)
A horizon (cm)
Topsoil Depth1 (cm)
Peat Deposits
(cm)
Upper Subsoil Depth (cm)
UPLAND SOILS
Kinosis (KNS, KNSgl)
29 9 10 19 N/A 40
Livock (LVK, LVKgl)
4 10 15 25 N/A 35
TRANSITIONAL SOILS
Moonshine–aa (MNSaa)
3 8 20 28 N/A 35
Moonshine–aa (MNSaapt) 8 29 10 39 N/A 40
ORGANICS
Muskeg1 (MUSxt1)
45 n/a N/A N/A 65 n/a
Muskeg2 (MUS2)
10 n/a N/A N/A 140 n/a
Muskeg3 (MUS3)
17 n/a N/A N/A 225 n/a
1 Topsoil depth calculated as the sum of the surface litter and A horizon. N/A – Not applicable to the soil map unit.
5.2 Reclamation Suitability
Topsoil and subsoil materials were assessed for reclamation suitability following the Soil Quality Criteria Relative to Disturbance and Reclamation Guidelines as specified for the Northern Forest Region of Alberta (SQWG, 1987) (Appendix C). Rating the upper and lower lift of the soil map units assists in site development and soil handling by determining which soils may present challenges during site construction and reclamation. As well, evaluating the quality of the soil within the proposed disturbance area establishes which materials may be valuable for use later in reclamation. The upper lift was defined as the shallow litter layer/surface peat (<40 cm) and mineral soils to a depth of approximately 20 cm which, in some instances, included a portion of the B horizon. The lower lift was defined as the soils from approximately 20 to 100 cm and included most B horizons and portions of the transitional BC and/or upper C profiles.
Grizzly Oil Sands ULC Algar Lake SAGD Project Millennium EMS Solutions Ltd. January 2010
Page 12 07-099
The four reclamation suitability classes are as follows:
• Good (G) - No to slight limitations that affect use as a reclamation medium; • Fair (F) - Moderate soil limitations that affect reclamation, but which can be overcome by
proper planning and good soil management; • Poor (P) - Severe soil limitations that make reclamation more challenging. These soils can be
used for reclamation, but require proper planning and very good soil management; and • Unsuitable (U) - Chemical or physical properties of the soils are so severe, reclamation might
not be economically feasible or in some cases impossible.
The reclamation suitability rating for each soil map unit was established through laboratory analysis of their primary soil horizons. The laboratory report is provided in Appendix B. Soil horizons collected for analysis were compared only to their corresponding rating depth (e.g., A horizons compared to upper lift). In cases where a horizon may be present in both the upper and lower lift (i.e., B horizons), they were rated for both depths.
The guidelines are specific to mineral soil horizons and thus do not include ratings criteria for organic (Of, Om and Oh) and surface litter (LFH) horizons. However, the guidelines suggest that organic and surface litter materials should be salvaged and utilized for use in reclamation as an amendment (SQWG 1987).
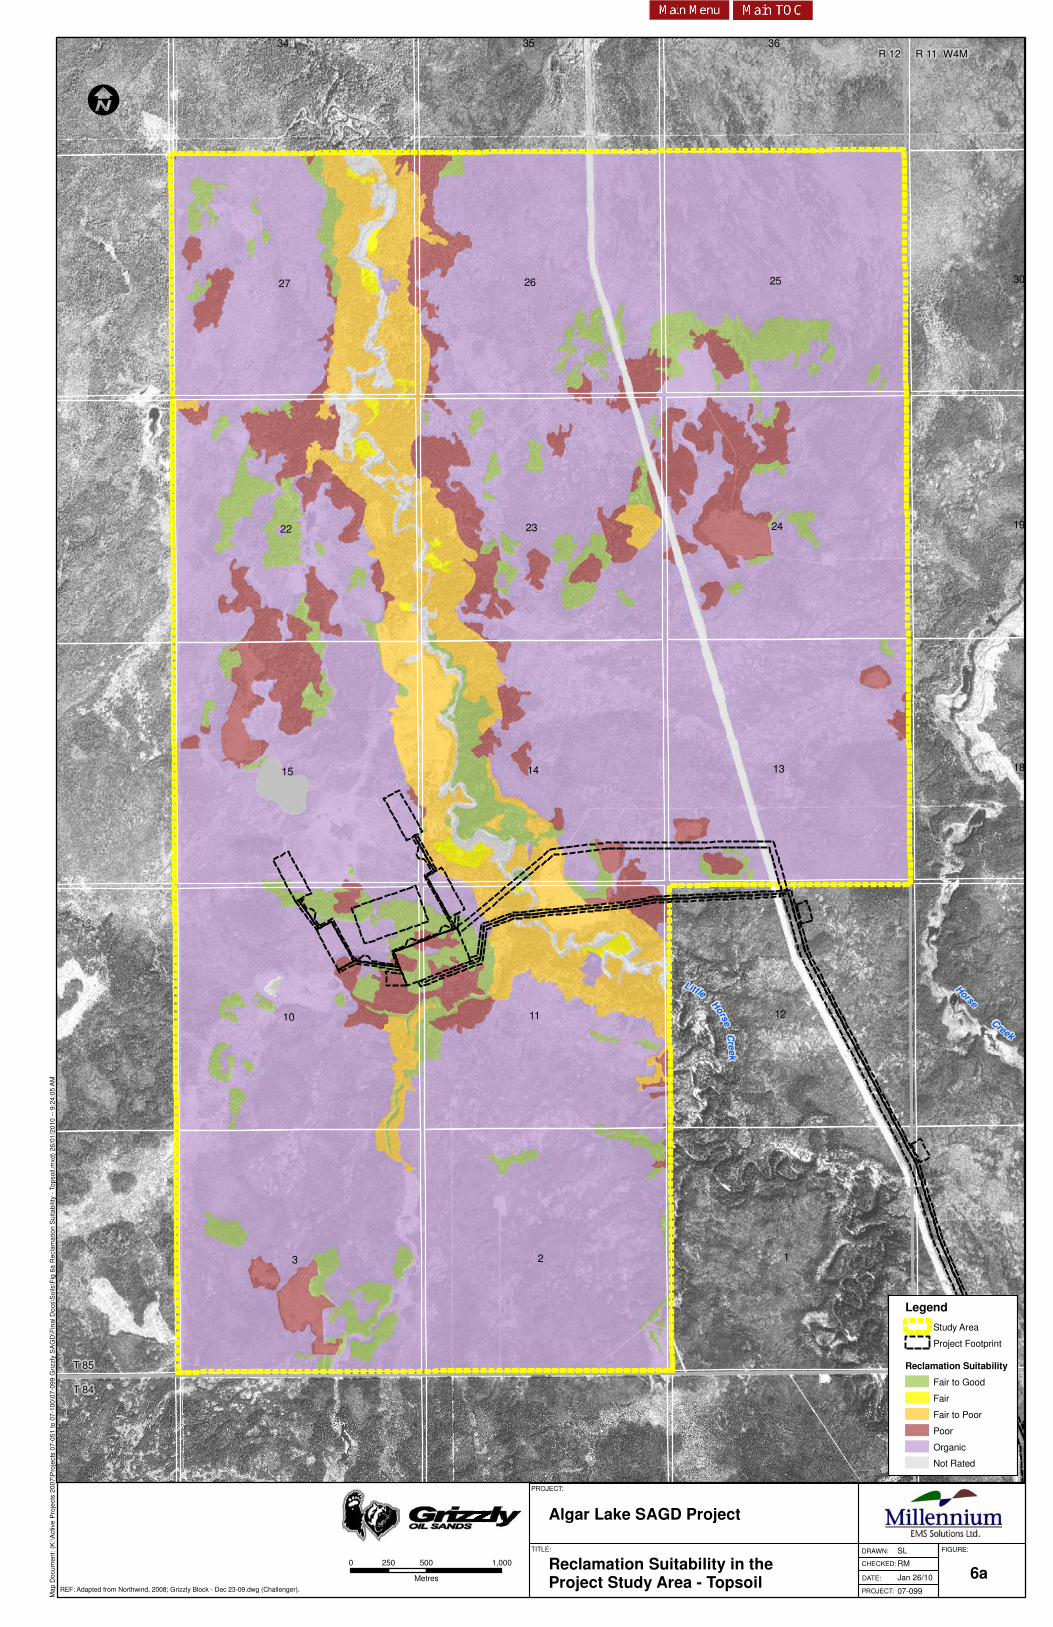
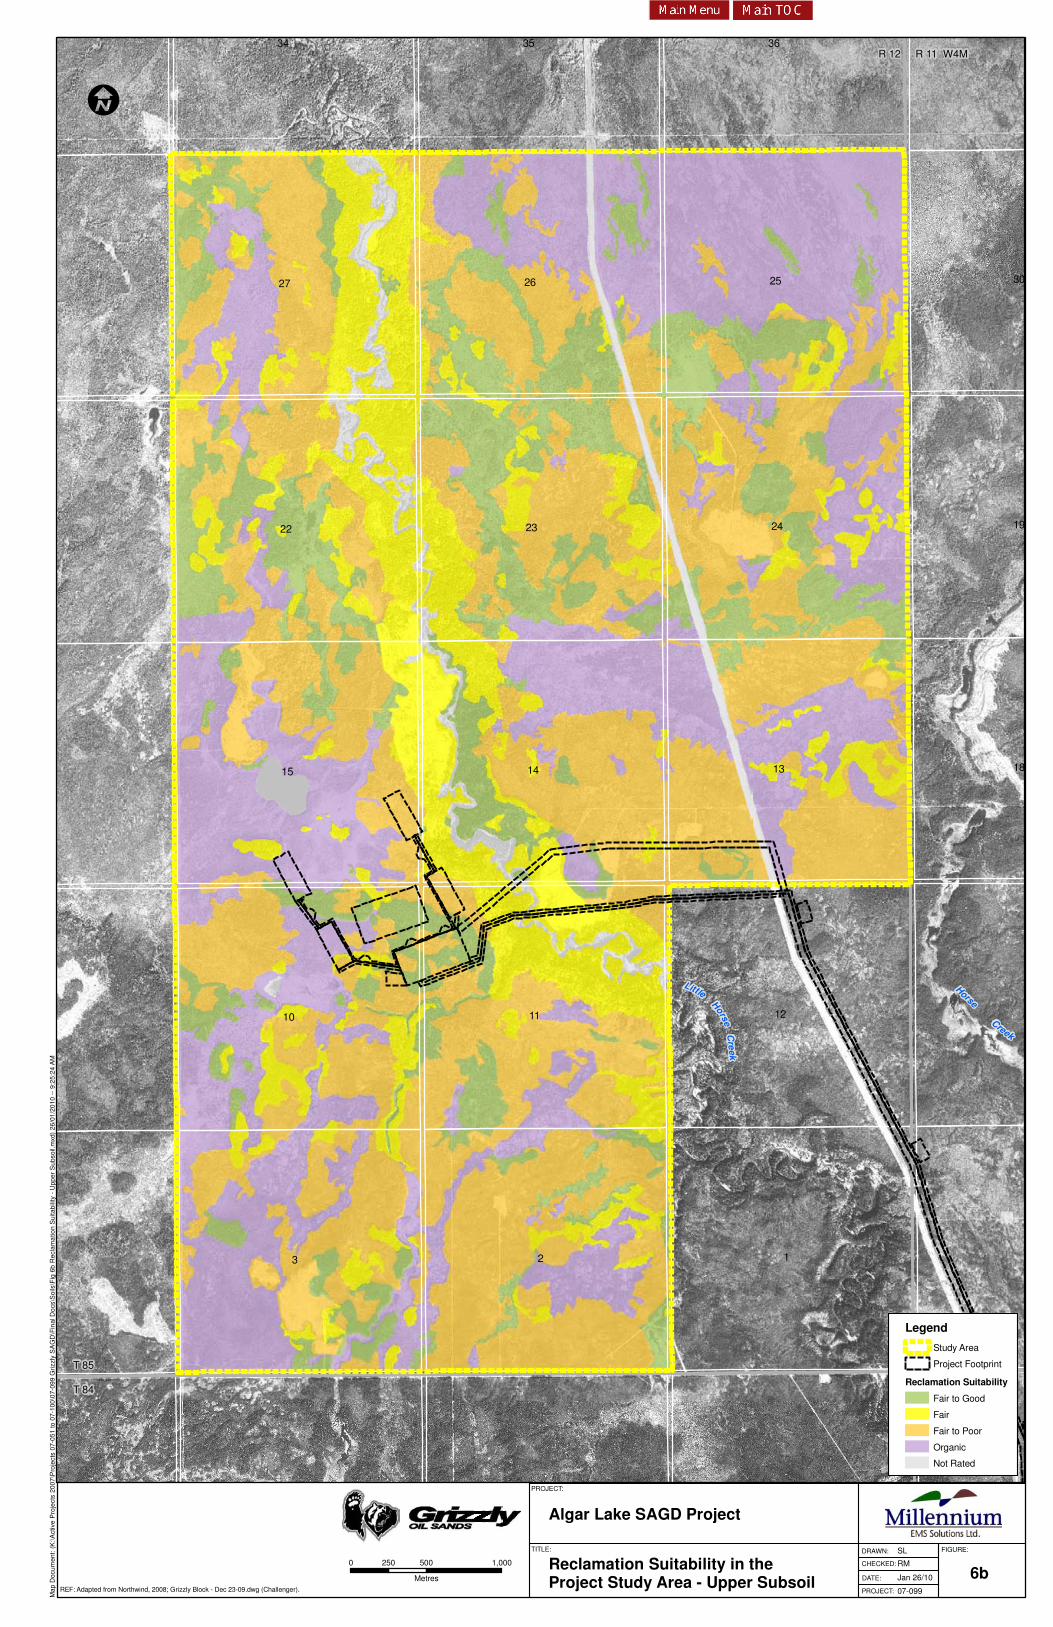
The reclamation suitability ratings of the soil map units of the Project study area are presented in Table 4, the ratings summary for sampled sites is located in Appendix C (Table C3). Figures 6a and 6b display the reclamation suitability ratings for the topsoil (upper lift) and upper subsoil (lower lift) within the Project Study area.
Overall suitability ratings for mineral soils are generally Fair with inclusions of Good, Poor and Unsuitable soils. Generally, the greatest limitations to topsoil horizons (mineral A horizons) are soil pH (acidic) and fine textures. Subsoil horizons were generally rated as Fair to Good with limitations associated with fine textures and soil pH (acidic or basic). With respect to organic soils, all surface peat material is considered to be suitable for reclamation and the underlying subsoil material ranged from Good to Poor with limitations associated with fine texture and acidic or basic soil pH.

Grizzly Oil Sands ULC Algar Lake SAGD Project Millennium EMS Solutions Ltd. January 2010
Page 13 07-099
Table 4 Reclamation Suitability Ratings for Soil Units in the Project Study Area
Soil Map Unit Topsoil Upper Subsoil
Rating Limitations Rating Limitations
KNS P* Acidic pH recorded at various sites F Fine textured material and
slightly acidic pH
KNSgl P* Acidic pH recorded at various sites F Fine textured material and
slightly acidic or basic pH
LVK F-P Slightly acidic to slightly basic pH F Fine textured material and
slightly acidic or basic pH
LVKgl F-P Slightly acidic to slightly basic pH F Fine textured material and
slightly acidic or basic pH
MMYgl F Slightly acidic pH and low saturation percentage F Fine textured material and
slightly acidic pH
MNSaapt O Organic material, to be used as a reclamation amendment F Slightly acid to basic pH and
fine textured material
MNSaa F-G Slightly basic pH and low saturation percentage F-G Fine textured material and
slightly basic pH
STPpt O Organic material, to be used as a reclamation amendment F-G Fine textured material and
slightly acidic or basic pH
MLDxt O Organic material, to be used as a reclamation amendment F-G Fine textured material and
slightly basic pH
MLD2 O Organic material, to be used as a reclamation amendment O Organic material, to be used as
a reclamation amendment
MLD3 O Organic material, to be used as a reclamation amendment O Organic material, to be used as
a reclamation amendment
MUSxt1 O Organic material, to be used as a reclamation amendment F-P Fine textured material and
slightly basic pH
MUS2 O Organic material, to be used as a reclamation amendment O Organic material, to be used as
a reclamation amendment
MUS3 O Organic material, to be used as a reclamation amendment O Organic material, to be used as
a reclamation amendment * pH values ranged from Fair (F) to Unsuitable (U), a Poor (P) rating was used to represent the overall suitability of the topsoil for the KNS soil map units. O – Indicates that the horizon is dominated by organic material (peat or litter) and was not rated for reclamation suitability.
5.3 Forest Soil Capability Classification
5.3.1 Baseline Forest Soil Capability Classification
Forest soil capability was determined using the Land Capability Classification System (LCCS) for Forest Ecosystems in the Oil Sands (CEMA 2006). The classification system relies on a soil moisture regime index and a soil nutrient regime index to obtain a base rating of the soil capability. The base rating is adjusted by “limiting factors” as determined by the classification system. Limiting factors are
Grizzly Oil Sands ULC Algar Lake SAGD Project Millennium EMS Solutions Ltd. January 2010
Page 14 07-099
ratings that create reductions to the soil capability dependent on soil structure and consistence, pH, salinity, sodicity, soil moisture, soil fertility, and stoniness (CEMA 2006).
Baseline forest soil capability ratings were calculated for the representative soils identified in the Project study area based on laboratory results of collected samples, collected field data (slopes, water table etc.), and soil landscape relationships in the area. Calculations for soil series and variants were facilitated by use of the “LCCS Calculator 2006” program, which is an MS Excel application designed to automatically calculate index points (rating), class, and subclasses based on inputted soil profile data.
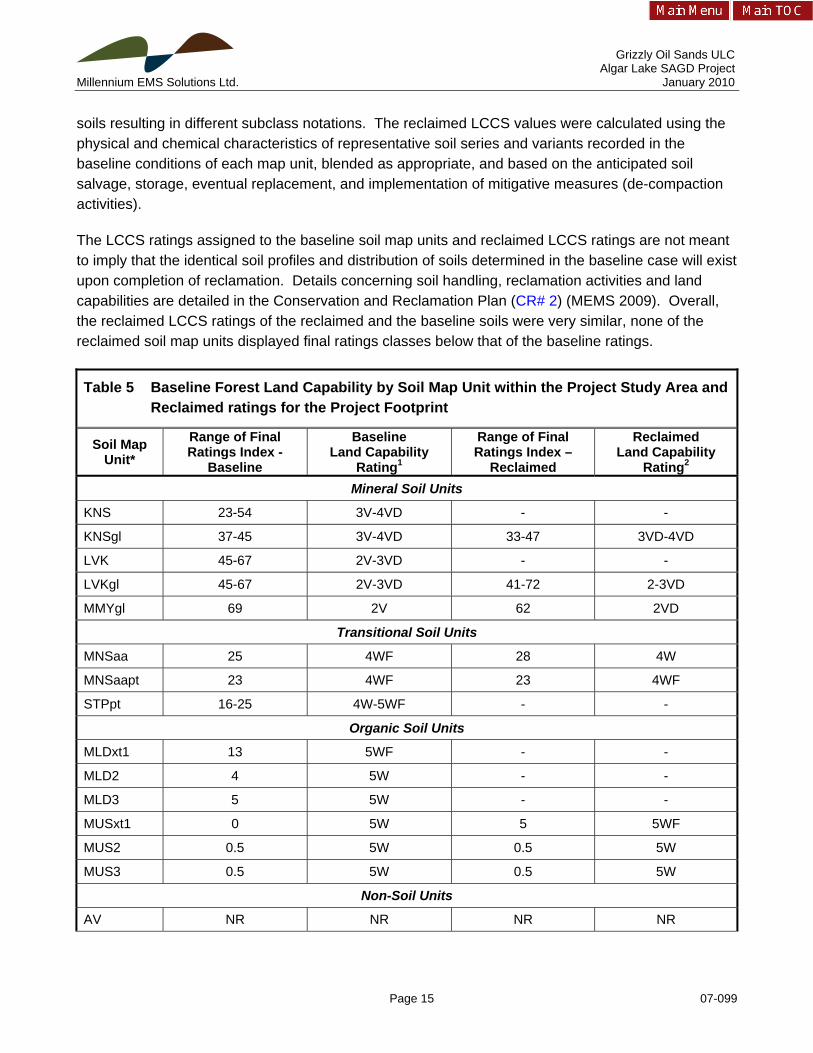
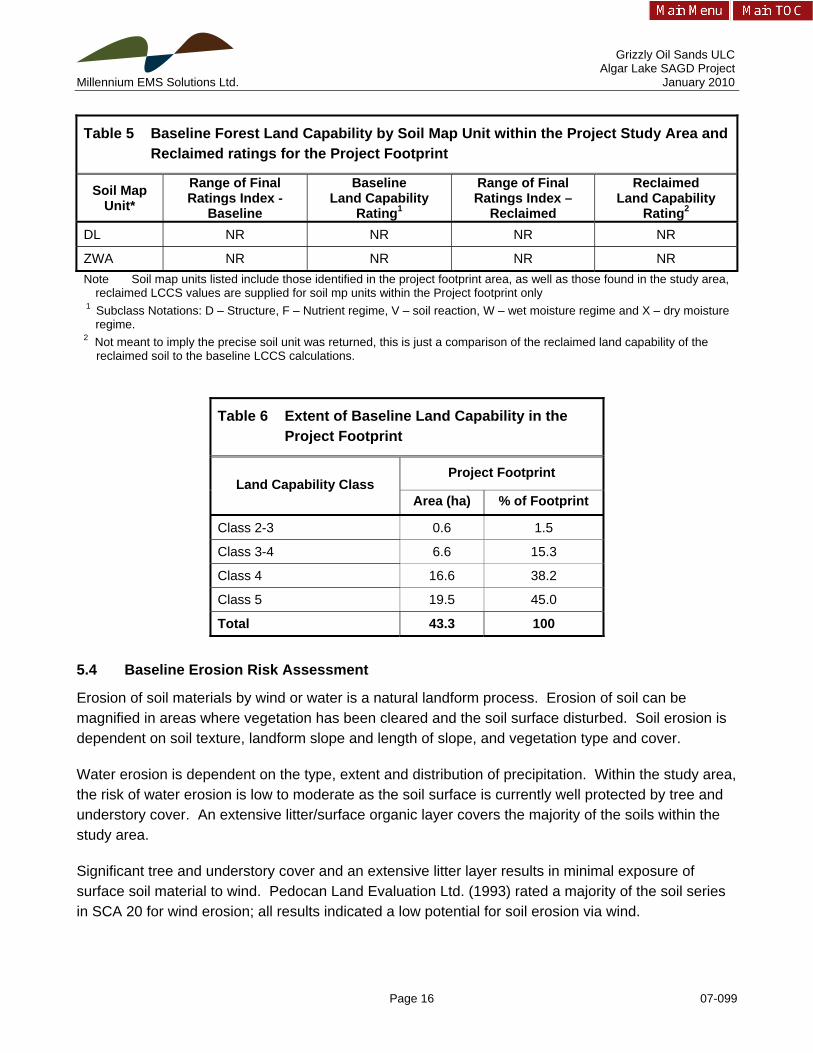
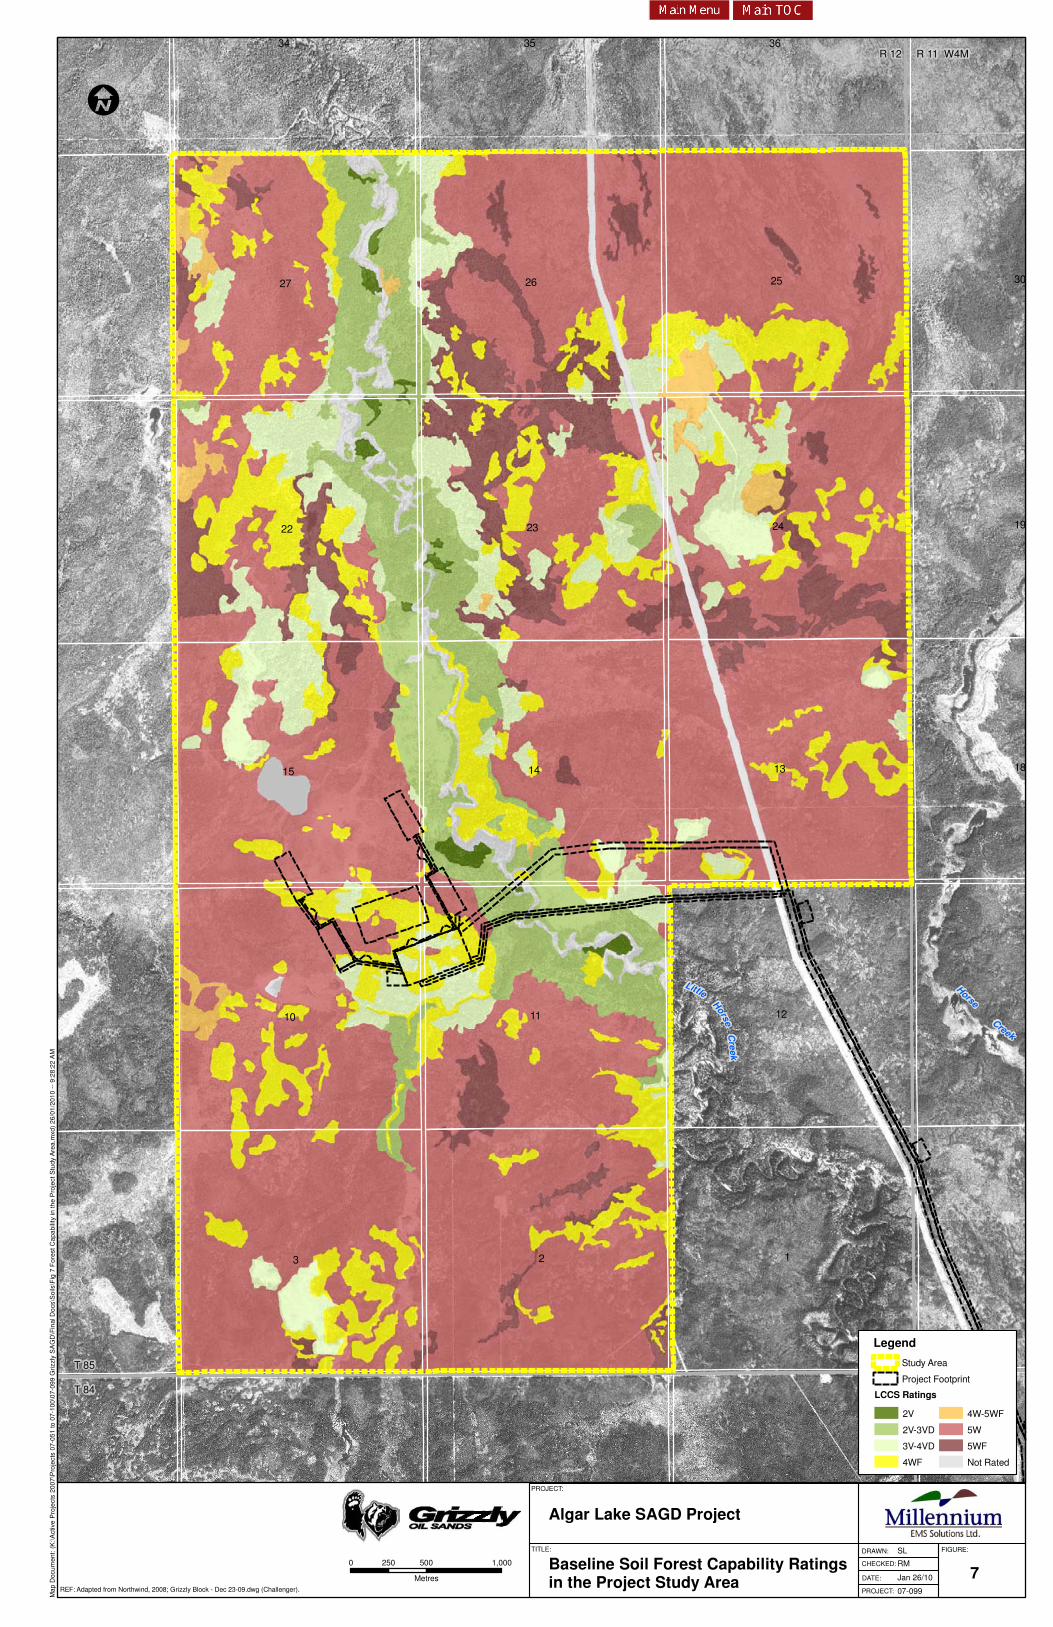
The baseline forest soil capabilities for soil map units of the Project study area are listed in Table 5 and are shown on Figure 7. Distribution of baseline capability classes within the Project footprint are provided in Table 6. The LCCS summary output tables for the baseline soil profiles are located in Appendix D.
Within the proposed footprint area, the map units with the highest land rating were a combination of Class 2-3 and 3-4 soils containing the LVkgl and KNSgl soil series, respectively. The range in the ratings class is due to the variability in pH values recorded within the soil profiles sampled within the Project study area (Appendix D). These particular map units were located in the driest portions of the Project footprint and contained predominantly medium textured soils with limitations associated with acidic pH and/or soil structure. The remainder of the project footprint area was found to be unsuitable (Class 4 and 5) for commercial forest production due to drainage restrictions, which is typical in the Gleysolic (MNSaa) and bog and fen peat map units (MUS series).
5.3.2 Reclaimed Forest Soil Capability Classification
The main goal for the reclamation program is to achieve equivalent capability to pre-disturbance conditions. The reclaimed capability ratings are calculated based on projected soil conditions upon completion of site reclamation. With respect to the reclaimed land capability ratings, it was assumed that the LFH and A horizon material would be mixed during salvage and reclamation, resulting in a peat-mineral-mix topsoil horizon. During the salvage and reclamation operations it was conservatively assumed that there would be a 10% loss of total organic carbon and total nitrogen. In addition, it was also assumed that a downgrade of one structure size class for the subsoil horizons would occur in some of the reclaimed soils.
Only soil map units located in the proposed footprint that are expected to be disturbed over the life of the Project were evaluated for post reclamation suitability. Table 5 displays the reclaimed LCCS ratings for soil map units located in the Project footprint and the summary output data for the reclaimed soil map units is located in Appendix D.
There were no differences in overall capability classes between baseline and reclaimed map units. There are, however, differences in final calculated index point ratings between baseline and reclaimed
Grizzly Oil Sands ULC Algar Lake SAGD Project Millennium EMS Solutions Ltd. January 2010
Page 15 07-099
soils resulting in different subclass notations. The reclaimed LCCS values were calculated using the physical and chemical characteristics of representative soil series and variants recorded in the baseline conditions of each map unit, blended as appropriate, and based on the anticipated soil salvage, storage, eventual replacement, and implementation of mitigative measures (de-compaction activities).
The LCCS ratings assigned to the baseline soil map units and reclaimed LCCS ratings are not meant to imply that the identical soil profiles and distribution of soils determined in the baseline case will exist upon completion of reclamation. Details concerning soil handling, reclamation activities and land capabilities are detailed in the Conservation and Reclamation Plan (CR# 2) (MEMS 2009). Overall, the reclaimed LCCS ratings of the reclaimed and the baseline soils were very similar, none of the reclaimed soil map units displayed final ratings classes below that of the baseline ratings.
Table 5 Baseline Forest Land Capability by Soil Map Unit within the Project Study Area and Reclaimed ratings for the Project Footprint
Soil Map Unit*
Range of Final Ratings Index -
Baseline
Baseline Land Capability
Rating1
Range of Final Ratings Index –
Reclaimed
Reclaimed Land Capability
Rating2 Mineral Soil Units
KNS 23-54 3V-4VD - -
KNSgl 37-45 3V-4VD 33-47 3VD-4VD
LVK 45-67 2V-3VD - -
LVKgl 45-67 2V-3VD 41-72 2-3VD
MMYgl 69 2V 62 2VD
Transitional Soil Units
MNSaa 25 4WF 28 4W
MNSaapt 23 4WF 23 4WF
STPpt 16-25 4W-5WF - -
Organic Soil Units
MLDxt1 13 5WF - -
MLD2 4 5W - -
MLD3 5 5W - -
MUSxt1 0 5W 5 5WF
MUS2 0.5 5W 0.5 5W
MUS3 0.5 5W 0.5 5W
Non-Soil Units
AV NR NR NR NR
Grizzly Oil Sands ULC Algar Lake SAGD Project Millennium EMS Solutions Ltd. January 2010
Page 16 07-099
Table 5 Baseline Forest Land Capability by Soil Map Unit within the Project Study Area and Reclaimed ratings for the Project Footprint
Soil Map Unit*
Range of Final Ratings Index -
Baseline
Baseline Land Capability
Rating1
Range of Final Ratings Index –
Reclaimed
Reclaimed Land Capability
Rating2 DL NR NR NR NR
ZWA NR NR NR NR Note Soil map units listed include those identified in the project footprint area, as well as those found in the study area,
reclaimed LCCS values are supplied for soil mp units within the Project footprint only 1 Subclass Notations: D – Structure, F – Nutrient regime, V – soil reaction, W – wet moisture regime and X – dry moisture
regime. 2 Not meant to imply the precise soil unit was returned, this is just a comparison of the reclaimed land capability of the
reclaimed soil to the baseline LCCS calculations.
Table 6 Extent of Baseline Land Capability in the Project Footprint
Land Capability Class Project Footprint
Area (ha) % of Footprint
Class 2-3 0.6 1.5
Class 3-4 6.6 15.3
Class 4 16.6 38.2
Class 5 19.5 45.0
Total 43.3 100
5.4 Baseline Erosion Risk Assessment
Erosion of soil materials by wind or water is a natural landform process. Erosion of soil can be magnified in areas where vegetation has been cleared and the soil surface disturbed. Soil erosion is dependent on soil texture, landform slope and length of slope, and vegetation type and cover.
Water erosion is dependent on the type, extent and distribution of precipitation. Within the study area, the risk of water erosion is low to moderate as the soil surface is currently well protected by tree and understory cover. An extensive litter/surface organic layer covers the majority of the soils within the study area.
Significant tree and understory cover and an extensive litter layer results in minimal exposure of surface soil material to wind. Pedocan Land Evaluation Ltd. (1993) rated a majority of the soil series in SCA 20 for wind erosion; all results indicated a low potential for soil erosion via wind.
Grizzly Oil Sands ULC Algar Lake SAGD Project Millennium EMS Solutions Ltd. January 2010
Page 17 07-099
Currently organic soils of the study area have a low risk of water or wind erosion as most organic map units are covered by water for a portion of the year, have significant vegetative cover and occur in level terrain with minimal slopes (<2.5%).
6.0 BASELINE SUMMARY
A total of 175 soil inspection points were completed within the Project study area (3,122 ha) in 2007, and 21 of the inspection sites were sampled for laboratory analysis
Soils of the Project study area are comprised of:
• Luvisols of the Kinosis and Livock series; • Gleysols of the Moonshine and Steepbank series; ]\Regosols of the McMurray series; • Organics of the Muskeg and McLelland series; and • undifferentiated alluvium deposits located in active stream channels.
A total of 14 soil map units were used to describe the soils and terrain within the Project study area and three map units were used to describe non-soil areas (water, disturbed lands and undifferentiated active stream channels). The distribution of soils within the Project study areas are as follows:
• upland soils – account for 630 ha (18%) of the study area; • transitional soils – account for 472 ha (14%) of the study area; • organic soils – account for 2,232 ha (65%) of the study area; and • non-soil units account for approximately 88 ha (3%) of the study area.
The proposed footprint is located predominantly on Organic soils (45%) of varying thickness or transitional soils (38%). Upland soils account for approximately 17% of the Project footprint.
Baseline data interpretation was completed for profile thickness, LCCS ratings, reclamation suitability, and baseline erosion potential.
Soil thickness was calculated for the proposed Project footprint. Within the Project footprint topsoil layers (including surface peat and litter layers) ranged from 20 to 40 cm, and upper subsoil ranged from 35 to 40 cm. In Organic soils, the depth of peat ranged from 65 to 225 cm.
Topsoil and subsoil materials were assessed for reclamation suitability following the SQWG guidelines (SQWG 1987). Overall suitability ratings for mineral topsoil horizons range from Poor to Fair to Good. Topsoil limitations are predominantly associated with acidic and basic pH. Upper subsoil horizons (generally B horizons) ranged from Fair to Poor too Far to Good. Upper subsoil limitations were predominantly associated with fine textures and a significant portion also associated with slightly acidic or basic pH.
Grizzly Oil Sands ULC Algar Lake SAGD Project Millennium EMS Solutions Ltd. January 2010
Page 18 07-099
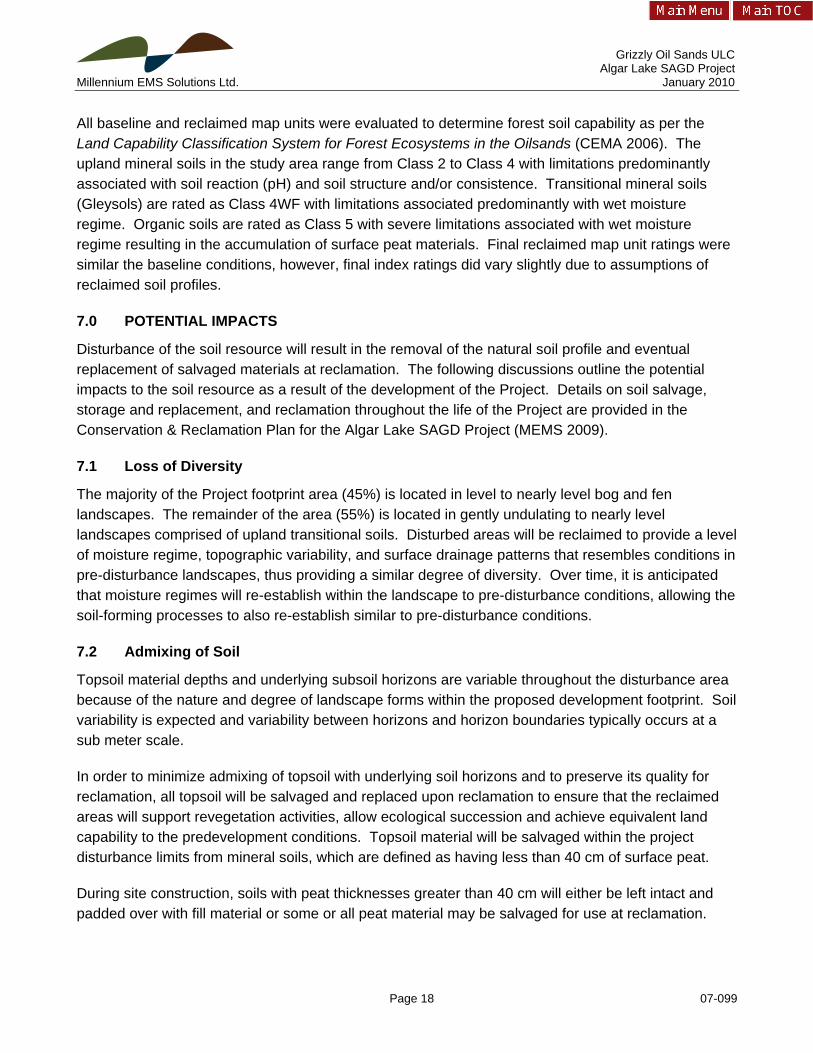
All baseline and reclaimed map units were evaluated to determine forest soil capability as per the Land Capability Classification System for Forest Ecosystems in the Oilsands (CEMA 2006). The upland mineral soils in the study area range from Class 2 to Class 4 with limitations predominantly associated with soil reaction (pH) and soil structure and/or consistence. Transitional mineral soils (Gleysols) are rated as Class 4WF with limitations associated predominantly with wet moisture regime. Organic soils are rated as Class 5 with severe limitations associated with wet moisture regime resulting in the accumulation of surface peat materials. Final reclaimed map unit ratings were similar the baseline conditions, however, final index ratings did vary slightly due to assumptions of reclaimed soil profiles.
7.0 POTENTIAL IMPACTS
Disturbance of the soil resource will result in the removal of the natural soil profile and eventual replacement of salvaged materials at reclamation. The following discussions outline the potential impacts to the soil resource as a result of the development of the Project. Details on soil salvage, storage and replacement, and reclamation throughout the life of the Project are provided in the Conservation & Reclamation Plan for the Algar Lake SAGD Project (MEMS 2009).
7.1 Loss of Diversity
The majority of the Project footprint area (45%) is located in level to nearly level bog and fen landscapes. The remainder of the area (55%) is located in gently undulating to nearly level landscapes comprised of upland transitional soils. Disturbed areas will be reclaimed to provide a level of moisture regime, topographic variability, and surface drainage patterns that resembles conditions in pre-disturbance landscapes, thus providing a similar degree of diversity. Over time, it is anticipated that moisture regimes will re-establish within the landscape to pre-disturbance conditions, allowing the soil-forming processes to also re-establish similar to pre-disturbance conditions.
7.2 Admixing of Soil
Topsoil material depths and underlying subsoil horizons are variable throughout the disturbance area because of the nature and degree of landscape forms within the proposed development footprint. Soil variability is expected and variability between horizons and horizon boundaries typically occurs at a sub meter scale.
In order to minimize admixing of topsoil with underlying soil horizons and to preserve its quality for reclamation, all topsoil will be salvaged and replaced upon reclamation to ensure that the reclaimed areas will support revegetation activities, allow ecological succession and achieve equivalent land capability to the predevelopment conditions. Topsoil material will be salvaged within the project disturbance limits from mineral soils, which are defined as having less than 40 cm of surface peat.
During site construction, soils with peat thicknesses greater than 40 cm will either be left intact and padded over with fill material or some or all peat material may be salvaged for use at reclamation.

Grizzly Oil Sands ULC Algar Lake SAGD Project Millennium EMS Solutions Ltd. January 2010
Page 19 07-099
Organic areas padded over will not have the soil profile physically removed, and admixing is expected to be minimal. In situations where the peat material is to be salvaged, mixing of some of the underlying mineral material into the peat is not seen as detrimental to the quality of the salvaged material. Qualified professional will oversee soil handling act ivies during site construction and reclamation.
Overall, utilization of proper soil salvage, storage and replacement techniques throughout the life of the Project will minimize the loss of topsoil material.
7.3 Reclamation and Land Capability
The main goal for the reclamation program is to achieve equivalent capability of pre-disturbance conditions. As mentioned in Section 5.3.1 Reclaimed Forest Soil Capability Classification, it was conservatively assumed that a loss of total organic carbon and total nitrogen, as well as an increase in subsoil structure class would be incurred by reclaimed upland and transitional soils. As a result of these assumptions, a decrease in index points was recorded for various reclaimed map units. Conversely, a few of the reclaimed map units ended up with a final rating slightly higher than the baseline ratings (2-5 index points), this is due to the blending of the litter/surface peat layer with the mineral A horizon which, in some cases, resulted in a higher soil nutrient regime. None of the reclaimed map units displayed a decrease in LCCS classes.
All reclaimed LCCS ratings were created assuming that mitigation activities have been implemented (e.g., ripping potentially compacted areas). Utilization of proper soil salvage, handling, storage and replacement activities throughout the life of the Project will result in reclaimed landscapes equivalent to pre-disturbance.
7.4 Erosion of Reclaimed Soils
Erosion is of concern on all areas where bare mineral soil is exposed. This includes disturbed areas cleared of vegetation prior to soil salvage operations and areas where coversoil materials have been replaced, but revegetation activities have not been completed.
The likelihood of soil erosion increases the longer mineral soil is exposed and is void of vegetative cover. Implementation of mitigative measures such as timely revegetation of disturbed areas and establishing sediment traps (e.g., ditch blocks, silt fencing) will minimize erosional impacts. Through proper soil management techniques and timing of clearing, soil salvage and revegetation operations, the impact of soil erosion will be minimal.
Grizzly Oil Sands ULC Algar Lake SAGD Project Millennium EMS Solutions Ltd. January 2010
Page 20 07-099
8.0 MITIGATION AND MONITORING
Detailed mitigations and monitoring activities to be implemented throughout the life of the Project are discussed in the Conservation and Reclamation Plan ((CR#2) MEMS 2009).
9.0 CLOSURE
We trust that the contents of this report meet your current requirements. Should you have any questions or require further information, please contact the undersigned at (780) 496-9048.
Respectfully, Millennium EMS Solutions Ltd.
Ryan Muri, B.Sc., P.Ag. Soil Scientist
Grizzly Oil Sands ULC Algar Lake SAGD Project Millennium EMS Solutions Ltd. January 2010
Page 21 07-099
10.0 REFERENCES
ASIC (Alberta Soil Information Centre). 2001. AGRASID 3.0: Agricultural Region of Alberta Soil Inventory Database (Version 3.0). Edited by J.A. Brierley, T.C. Martin, and D.J. Spiess. Agriculture and Agri-Food Canada, Research Branch; Alberta Agriculture, Food and Rural Development, Conservation and Development Branch. Available at URL: www1.agric.gov.ab.ca/$department/deptdocs.nsf/all/sag3249.
Brierley, J.A., B.D. Walker, C.J. Thomas, P.E. Smith, and M.D. Bock. 2006. Alberta soil names file (Generation 3) user’s handbook. Agriculture and Agri-Food Canada, Research Branch, Edmonton. 140 pp. Available at URL: www1.agric.gov.ab.ca/$department/deptdocs.nsf/all/sag10989.
CEMA (Cumulative Environmental Management Association). 2006. Land Capability Classification System for Forest Ecosystems in the Oil Sands. Volume 1: Filed Manual for Land Capability Determination, Third Edition. June 2006. 53 pp.
MEMS (Millennium EMS Solutions Ltd.). 2009. Algar Lake SAGD Project Conservation and Reclamation Plan. Consultant Report #2 (CR#2) in the Grizzly Oil Sands ULC Algar Lake SAGD Project Application for Approval to the Alberta Energy Resources Conservation Board and Alberta Environment, January 2010.
MSWG (Mapping Systems Working Group). 1981. A Soil Mapping System for Canada: Revised. Agriculture Canada, Research Branch, Ottawa. L.R.R.I. Contribution No. 142: 94 pp.
Northwind (Northwind Land Resources Inc.). 2008. Baseline Soil Survey and Assessment Report for the Grizzly Oil sands Algar Lake Project. Prepared for Millennium EMS Solutions on behalf of Grizzly Oil Sands ULC. 34 pp. plus appendices.
Pedocan Land Evaluation Ltd. 1993. Soil Series Information for Reclamation Planning in Alberta. Alberta Conservation and Reclamation Council Report No. RRTAC 93-7. ISBN 0-7732-6041-2. Various pagings.
SCWG (Soil Classification Working Group). 1998. The Canadian System of Soil Classification. Agriculture and Agri-Food Canada Publication 1646 (Revised, Third Edition). 187 pp.
SQWG (Soil Quality Criteria Working Group). 1987. Soil Quality Criteria Relative to Disturbance and Reclamation (Revised). Alberta Agriculture, Food and Rural Development, Edmonton. 56 pp.
Ma
p D
ocu
me
nt:
(K
:\A
ctive
Pro
jects
20
07
\Pro
jects
07
-05
1 t
o 0
7-1
00
\07
-09
9 G
rizzly
SA
GD
\Fin
al D
ocs\S
oils
\Fig
1 P
roje
ct
Stu
dy A
rea
an
d F
oo
tpri
nt.
mxd
) 2
6/0
1/2
01
0 -
- 9
:17
:21
AM
0 500 1,000250
Metres
PROJECT:
TITLE:
R 12 R 11 W4M
T 85
T 84
Hors
e Creek
Little Hors
e C
reek
Road
Plant Site
Borrow Pit
Waterline
Access Road
Gasline
Pad BPad D
Pad C
Pad A
Pipeline
CampRoad
Borrow Pit
Borrow Pit
3 2 1
30
19
18
363534
27 26 25
242322
15 14 13
121110
1
FIGURE:
I
Legend
Study Area
Algar Lake SAGD Project
Project Study Area andProposed Footprint
SL
RM
Jan 25/10
07-099PROJECT:
DATE:
CHECKED:
DRAWN:
REF: Grizzly Block - Dec 23-09.dwg (Challenger).
Ma
p D
ocu
me
nt:
(K
:\A
ctive
Pro
jects
20
07
\Pro
jects
07
-05
1 t
o 0
7-1
00
\07
-09
9 G
rizzly
SA
GD
\Fin
al D
ocs\S
oils
\Fig
2 S
oil
Insp
ectio
n S
ite
s.m
xd
) 2
6/0
1/2
01
0 -
- 9
:19
:21
AM
0 500 1,000250
Metres
PROJECT:
TITLE:
!P
!P
!P
!P
!P
!P
!P
!P
!P
!P
!P
!P
!P
!P
!P
!P
!P
!P
!P
!P
R 12 R 11 W4M
T 85
T 84
Hors
e Creek
Little Hors
e C
reek
3 2 1
30
19
18
363534
27 26 25
242322
15 14 13
121110
9
8
76
5
4
3
2
1
99
98
9796
95
94
93
92
91
90
89
88
87
86
85
84
83
8281
80
79
78
77
76
75
74
73
72
71
70
69
68
6766
65 646362 61
60
59
58
57
56
55
54
53
52
51
50
49
48
47
46 45
44
43
42
41
40
39
38
37
36
35
34
33
32
31
3029
28
27
26
25
24
23
22
21
20
19
18
17
16
15
14
13
12
11
10
175174
173
172
171
170
169
168
167
166
165164
163162161160159
158157156
155
154
153
152
151
150
149
148
147
146
145
144
143
142
141
140
139
138
137
136
135
134
133
132
131
130
129
128127
126
125
124
123
122
121
120
119
118
117
116
115
114
113
112
111
110
109
108
107
106
105104
103
102
101 100
2
FIGURE:
I
Legend
Soil Inspection Site
!P Soil Inspection Site (sampled)
Study Area
Project Footprint
Algar Lake SAGD Project
Soil Inspection Site Locationsin the Project Study Area
SL
RM
Jan 25/10
07-099PROJECT:
DATE:
CHECKED:
DRAWN:
REF: Adapted from Northwind, 2008; Grizzly Block - Dec 23-09.dwg (Challenger).

0 500 1,000250
Metres
R 12 R 11 W4M
T 85
T 84
Hors
e Creek
Little Hors
e C
reek
3 2 1
30
19
18
363534
27 26 25
242322
15 14 13
121110
3
Algar Lake SAGD Project
Baseline Soil Units in theProject Study Area
SL
RM
Jan 25/10
07-099PROJECT:
DATE:
CHECKED:
DRAWN: FIGURE:
PROJECT:
TITLE:
I
Ma
p D
ocu
me
nt:
(K
:\A
ctive
Pro
jects
20
07
\Pro
jects
07
-05
1 t
o 0
7-1
00
\07
-09
9 G
rizzly
SA
GD
\Fin
al D
ocs\S
oils
\Fig
3 S
oil
Un
its in
th
e P
roje
ct
Stu
dy A
rea
.mxd
) 2
6/0
1/2
01
0 -
- 9
:22
:28
AM
Legend
Study Area
Project Footprint
Soil Map Units
KNS
KNSgl
LVKgl
LVK
MMYgl
MNSaa
MNSaapt
STPpt
MLD1xt
MLD2
MLD3
MUS1xt
MUS2
MUS3
DL
AV
ZWA
REF: Adapted from Northwind, 2008; Grizzly Block - Dec 23-09.dwg (Challenger).
R 12 W4M
T 85
Little Horse Creek
15
10
4
Algar Lake SAGD Project
Soil Units in theProject Footprint Area
SL
MY
Jan 26/10
07-099PROJECT:
DATE:
CHECKED:
DRAWN: FIGURE:
PROJECT:
TITLE:
I
Legend
Project Footprint
Soil Map Units
KNSgl
LVKgl
MNSaa
MNSaapt
MUS1xt
MUS2
MUS3
Ma
p D
ocu
me
nt:
(K
:\A
ctive
Pro
jects
20
07
\Pro
jects
07
-05
1 t
o 0
7-1
00
\07
-09
9 G
rizzly
SA
GD
\Fin
al D
ocs\S
oils
\Fig
4 S
oil
Un
its in
th
e F
oo
tpri
nt.
mxd
) 2
6/0
1/2
01
0 -
- 9
:30
:15
AM
0 200 400100
Metres
REF: Adapted from Northwind, 2008; Grizzly Block - Dec 23-09.dwg (Challenger).
R 12 W4M
T 85
Little Horse Creek
P70
P70
P225
P140
P70
P70
P140
P70
P140
P70
P140
P70
T28/US35
T28/US35
T19/US40
T28/US35
T19/US40
T19/US40
T19/US40
T19/US40
T39/US40
T28/US35
T28/US35
T39/US40
T39/US40
T25/US35
T28/US35
T28/US35
T28/US35 T28/US35
T25/US35
T28/US35
T28/US35
T28/US35
T28/US35
T28/US35
T19/US40
15
10
5
Algar Lake SAGD Project
Soil Thickness of Map Units in theProject Footprint Area
SL
MY
Jan 26/10
07-099PROJECT:
DATE:
CHECKED:
DRAWN: FIGURE:
PROJECT:
TITLE:
IM
ap
Do
cu
me
nt:
(K
:\A
ctive
Pro
jects
20
07
\Pro
jects
07
-05
1 t
o 0
7-1
00
\07
-09
9 G
rizzly
SA
GD
\Fin
al D
ocs\S
oils
\Fig
5 S
oil
Th
ickn
ess in
th
e F
oo
tpri
nt.
mxd
) 2
6/0
1/2
01
0 -
- 9
:32
:11
AM
0 200 400100
Metres
Peat Thickness (cm)
70
71 - 140
141 - 225
Topsoil Thickness (cm)
19
20 - 28
29 - 39
Legend
Project Footprint
P = Peat T = Topsoil US = Upper Subsoil
REF: Adapted from Northwind, 2008; Grizzly Block - Dec 23-09.dwg (Challenger).
0 500 1,000250
Metres
R 12 R 11 W4M
T 85
T 84
Hors
e Creek
Little Hors
e C
reek
3 2 1
30
19
18
363534
27 26 25
242322
15 14 13
121110
6a
Algar Lake SAGD Project
Reclamation Suitability in theProject Study Area - Topsoil
SL
RM
Jan 26/10
07-099PROJECT:
DATE:
CHECKED:
DRAWN: FIGURE:
PROJECT:
TITLE:
I
Ma
p D
ocu
me
nt:
(K
:\A
ctive
Pro
jects
20
07
\Pro
jects
07
-05
1 t
o 0
7-1
00
\07
-09
9 G
rizzly
SA
GD
\Fin
al D
ocs\S
oils
\Fig
6a
Re
cla
ma
tio
n S
uita
bili
ty -
To
pso
il.m
xd
) 2
6/0
1/2
01
0 -
- 9
:24
:05
AM
Legend
Study Area
Project Footprint
Reclamation Suitability
Fair to Good
Fair
Fair to Poor
Poor
Organic
Not Rated
REF: Adapted from Northwind, 2008; Grizzly Block - Dec 23-09.dwg (Challenger).
0 500 1,000250
Metres
R 12 R 11 W4M
T 85
T 84
Hors
e Creek
Little Hors
e C
reek
3 2 1
30
19
18
363534
27 26 25
242322
15 14 13
121110
6b
Algar Lake SAGD Project
Reclamation Suitability in theProject Study Area - Upper Subsoil
SL
RM
Jan 26/10
07-099PROJECT:
DATE:
CHECKED:
DRAWN: FIGURE:
PROJECT:
TITLE:
I
Ma
p D
ocu
me
nt:
(K
:\A
ctive
Pro
jects
20
07
\Pro
jects
07
-05
1 t
o 0
7-1
00
\07
-09
9 G
rizzly
SA
GD
\Fin
al D
ocs\S
oils
\Fig
6b
Re
cla
ma
tio
n S
uita
bili
ty -
Up
pe
r S
ub
so
il.m
xd
) 2
6/0
1/2
01
0 -
- 9
:25
:24
AM
Legend
Study Area
Project Footprint
Reclamation Suitability
Fair to Good
Fair
Fair to Poor
Organic
Not Rated
REF: Adapted from Northwind, 2008; Grizzly Block - Dec 23-09.dwg (Challenger).
0 500 1,000250
Metres
R 12 R 11 W4M
T 85
T 84
Hors
e Creek
Little Hors
e C
reek
3 2 1
30
19
18
363534
27 26 25
242322
15 14 13
121110
7
Algar Lake SAGD Project
Baseline Soil Forest Capability Ratingsin the Project Study Area
SL
RM
Jan 26/10
07-099PROJECT:
DATE:
CHECKED:
DRAWN: FIGURE:
PROJECT:
TITLE:
I
Ma
p D
ocu
me
nt:
(K
:\A
ctive
Pro
jects
20
07
\Pro
jects
07
-05
1 t
o 0
7-1
00
\07
-09
9 G
rizzly
SA
GD
\Fin
al D
ocs\S
oils
\Fig
7 F
ore
st
Ca
pa
bili
ty in
th
e P
roje
ct
Stu
dy A
rea
.mxd
) 2
6/0
1/2
01
0 -
- 9
:28
:22
AM
Legend
Study Area
Project Footprint
LCCS Ratings
2V
2V-3VD
3V-4VD
4WF
4W-5WF
5W
5WF
Not Rated
REF: Adapted from Northwind, 2008; Grizzly Block - Dec 23-09.dwg (Challenger).
Grizzly Oil Sands Algar Lake SAGD Project Millennium EMS Solutions Ltd. January 2010
07-099
APPENDIX A: SUMMARY OF SOIL INSPECTION SITES
Millenium EMS Solutions Ltd.
Grizzly Oil SandsAlgar Lake SAGD
Easting Northing depth (cm) texture depth (cm) texture
9 452838 6246790 KNS GL.GL gl M 15 4 SiL 34 CL 2 Depression n/a I 100 wet from 60 cm down. Ahe is thin
14 452323 6246595 KNS GL.GL gl M 10 16 fSL 14 CL 2 Level n/a I >10019 451495 6247521 KNS GL.GL gl M 5 9 SiL 48 CL 2 Level n MW-I >10040 450996 6250787 KNS GL.GL gl M 8 19 SiL 49 CL 2 Lower W I >100
41 450965 6250371 KNS GL.GL gl M 8 10 SiL 50 CL 2 Level n/a I >100 large spruce. From 70-80 cm there was CL in the BCgj
50 452235 6250076 KNS GL.GL gl M 4 19 SiL 60 CL 2 Mid N MW-I >100 lots of Fb (largest Fb I've ever seen)
51 452363 6249591 KNS GL.GL gl M 9 19 SL 64 CL 2 L N I >100
52 452844 6249068 KNS GL.GL gl M 9 13 SL 37 CL 3 Mid NE MW-I >100 2 large Sw cut, was possibly a d2 or d3
62 450744 6251672 KNS GL.GL gl M 11 29 SiL 25 CL 3 Mid E MW-I >100 some wetness73 450099 6248792 KNS GL.GL gl M 10 2 fSL 26 SiL 2-3 Upper NE I >100 borderline gleyed
75 451385 6248553 KNS GL.GL gl M 15 8 SiCL 52 CL 2 Level n/a I >100 thin Aeg
84 451720 6249647 KNS GLGL gl M 15 8 SL 38 CL 2 Level n/a I >100 unit next to a bog
102 449216 6247644 KNS GL.GL gl M 8 2 fSL 33 CL 2 Upper n/a I >100106 451125 6246412 KNS GL.GL gl M 11 15 vfSL 27 SiCL 2 Lower W I >100108 450832 6246976 KNS GL.GL gl M 10 8 SiL 76 CL 4 Upper NE I >100 slumping slopes to river
125 451969 6245887 KNS GL.GL gl M 9 16 L 41 CL 2 Level n/a MW-I >100 transitional ecosite ~20m N slope increases towards the creek
147 449516 6244967 KNS GL.GL gl M 19 20 fSL 21 SCL 2 Level n/a I >100
67 449978 6247919 KNS O.GL xs GLFLv/M 9 9 fSL 33 CL 3 Crest n/a W >100
2 452709 6248670 KNS O.GL M 10 39 SiL 34 CL 2 Mid-Lower NE MW >100 Unit is somewhat upland. Ae2 is thick
16 451609 6246812 KNS O.GL M 0 2 CL 66 SiCL 3 Mid SW MW >100 Unit in depression between hills. Thin Ae, stones near 100 cm
26 452502 6249230 KNS O.GL M 12 20 vfSL 27 CL 3 Upper W MW >10028 452863 6249635 KNS O.GL M 10 9 vfSL 35 L 2 Mid N MW >10066 449596 6247893 KNS O.GL M 8 10 SiL 59 CL 3 Upper NE MW >100 may have been either a d2 or d3
132 449889 6243980 KNS O.GL M 5 11 fSL 31 CL 2 Level n/a MW >100 area is an old cutblock
20 451281 6247337 LVK GL.GL gl GLFLv/M 22 16 fSL 42 CL 5 Mid SW MW-I >100unit is a steep slope down to the
creek. Area is terraced - plot is on a terrace
68 451282 6246463 LVK GL.GL gl GLFLv/M 8 19 SL 47 CL 5 Upper E MW-I >100 seepage from above. Rough (undulating slope)
81 450846 6249572 LVK GL.GL gl GLFLv/M 14 10 SiL 38 CL 6 Upper SW MW-I >100upper slope of a steep slope into the river. Lacustrine appeared to have
till above it
99 451640 6246100 LVK GL.GL gl GLFLv/M 6 8 SL 20 CL 5 Upper N MW-I >100
edge of unit is the beginning of steep slopes to the pond. Slopes
are similar to slope along river valley from before. Point is just into
the unit
120 449213 6249923 LVK BR.GL gr GLFLv/M 6 32 LS n/a n/a 2 Crest n/a MW >100 Canopy is very sparse. Auger refused at 32 cm - very gravelly
CommentsLFH/O depth (cm)
Topsoil (A horizon) Slope Class
Slope Position Aspect Drainage Water Table
(cm)Site
Number Series Subgroup Parent MaterialCoordinates Modifier/
VariantUpper Subsoil (B horizon)
1)
Millenium EMS Solutions Ltd.
Grizzly Oil SandsAlgar Lake SAGD
Easting Northing depth (cm) texture depth (cm) textureCommentsLFH/O
depth (cm)Topsoil (A horizon) Slope
ClassSlope
Position Aspect Drainage Water Table (cm)
Site Number Series Subgroup Parent Material
Coordinates Modifier/ Variant
Upper Subsoil (B horizon)
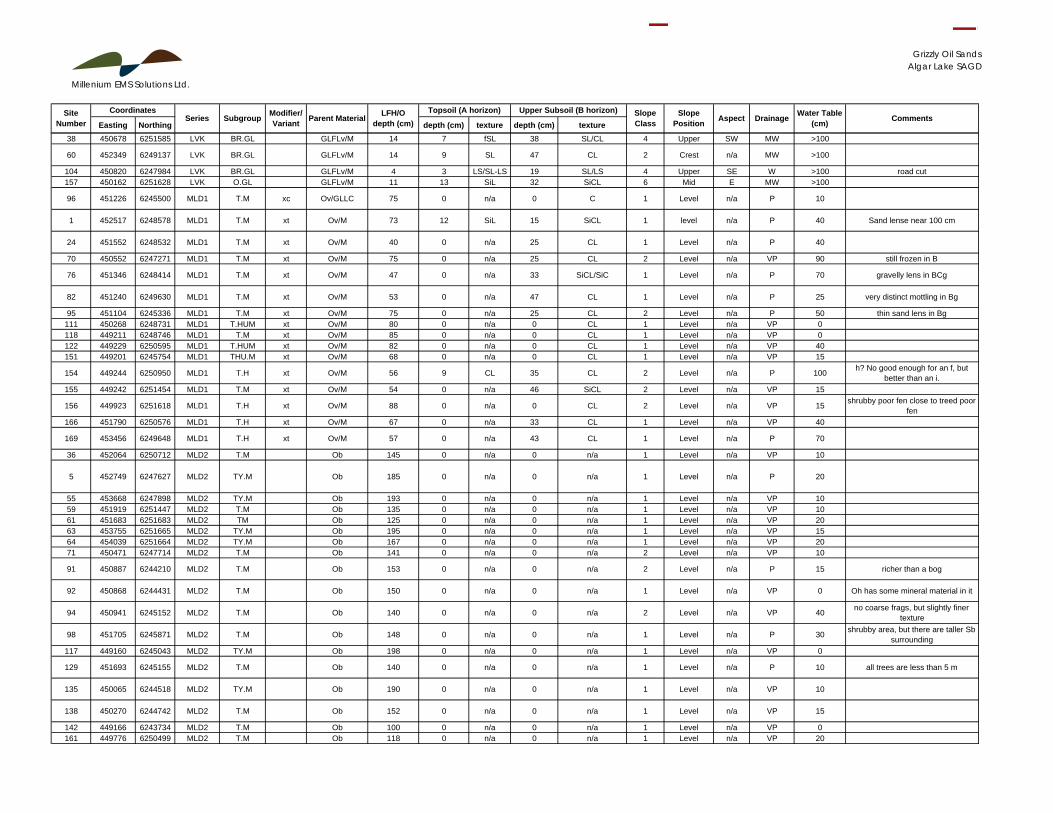
38 450678 6251585 LVK BR.GL GLFLv/M 14 7 fSL 38 SL/CL 4 Upper SW MW >100
60 452349 6249137 LVK BR.GL GLFLv/M 14 9 SL 47 CL 2 Crest n/a MW >100
104 450820 6247984 LVK BR.GL GLFLv/M 4 3 LS/SL-LS 19 SL/LS 4 Upper SE W >100 road cut157 450162 6251628 LVK O.GL GLFLv/M 11 13 SiL 32 SiCL 6 Mid E MW >100
96 451226 6245500 MLD1 T.M xc Ov/GLLC 75 0 n/a 0 C 1 Level n/a P 10
1 452517 6248578 MLD1 T.M xt Ov/M 73 12 SiL 15 SiCL 1 level n/a P 40 Sand lense near 100 cm
24 451552 6248532 MLD1 T.M xt Ov/M 40 0 n/a 25 CL 1 Level n/a P 40
70 450552 6247271 MLD1 T.M xt Ov/M 75 0 n/a 25 CL 2 Level n/a VP 90 still frozen in B
76 451346 6248414 MLD1 T.M xt Ov/M 47 0 n/a 33 SiCL/SiC 1 Level n/a P 70 gravelly lens in BCg
82 451240 6249630 MLD1 T.M xt Ov/M 53 0 n/a 47 CL 1 Level n/a P 25 very distinct mottling in Bg
95 451104 6245336 MLD1 T.M xt Ov/M 75 0 n/a 25 CL 2 Level n/a P 50 thin sand lens in Bg111 450268 6248731 MLD1 T.HUM xt Ov/M 80 0 n/a 0 CL 1 Level n/a VP 0118 449211 6248746 MLD1 T.M xt Ov/M 85 0 n/a 0 CL 1 Level n/a VP 0122 449229 6250595 MLD1 T.HUM xt Ov/M 82 0 n/a 0 CL 1 Level n/a VP 40151 449201 6245754 MLD1 THU.M xt Ov/M 68 0 n/a 0 CL 1 Level n/a VP 15
154 449244 6250950 MLD1 T.H xt Ov/M 56 9 CL 35 CL 2 Level n/a P 100 h? No good enough for an f, but better than an i.
155 449242 6251454 MLD1 T.M xt Ov/M 54 0 n/a 46 SiCL 2 Level n/a VP 15
156 449923 6251618 MLD1 T.H xt Ov/M 88 0 n/a 0 CL 2 Level n/a VP 15 shrubby poor fen close to treed poor fen
166 451790 6250576 MLD1 T.H xt Ov/M 67 0 n/a 33 CL 1 Level n/a VP 40
169 453456 6249648 MLD1 T.H xt Ov/M 57 0 n/a 43 CL 1 Level n/a P 70
36 452064 6250712 MLD2 T.M Ob 145 0 n/a 0 n/a 1 Level n/a VP 10
5 452749 6247627 MLD2 TY.M Ob 185 0 n/a 0 n/a 1 Level n/a P 20
55 453668 6247898 MLD2 TY.M Ob 193 0 n/a 0 n/a 1 Level n/a VP 1059 451919 6251447 MLD2 T.M Ob 135 0 n/a 0 n/a 1 Level n/a VP 1061 451683 6251683 MLD2 TM Ob 125 0 n/a 0 n/a 1 Level n/a VP 2063 453755 6251665 MLD2 TY.M Ob 195 0 n/a 0 n/a 1 Level n/a VP 1564 454039 6251664 MLD2 TY.M Ob 167 0 n/a 0 n/a 1 Level n/a VP 2071 450471 6247714 MLD2 T.M Ob 141 0 n/a 0 n/a 2 Level n/a VP 10
91 450887 6244210 MLD2 T.M Ob 153 0 n/a 0 n/a 2 Level n/a P 15 richer than a bog
92 450868 6244431 MLD2 T.M Ob 150 0 n/a 0 n/a 1 Level n/a VP 0 Oh has some mineral material in it
94 450941 6245152 MLD2 T.M Ob 140 0 n/a 0 n/a 2 Level n/a VP 40 no coarse frags, but slightly finer texture
98 451705 6245871 MLD2 T.M Ob 148 0 n/a 0 n/a 1 Level n/a P 30 shrubby area, but there are taller Sb surrounding
117 449160 6245043 MLD2 TY.M Ob 198 0 n/a 0 n/a 1 Level n/a VP 0
129 451693 6245155 MLD2 T.M Ob 140 0 n/a 0 n/a 1 Level n/a P 10 all trees are less than 5 m
135 450065 6244518 MLD2 TY.M Ob 190 0 n/a 0 n/a 1 Level n/a VP 10
138 450270 6244742 MLD2 T.M Ob 152 0 n/a 0 n/a 1 Level n/a VP 15
142 449166 6243734 MLD2 T.M Ob 100 0 n/a 0 n/a 1 Level n/a VP 0161 449776 6250499 MLD2 T.M Ob 118 0 n/a 0 n/a 1 Level n/a VP 20
Millenium EMS Solutions Ltd.
Grizzly Oil SandsAlgar Lake SAGD
Easting Northing depth (cm) texture depth (cm) textureCommentsLFH/O
depth (cm)Topsoil (A horizon) Slope
ClassSlope
Position Aspect Drainage Water Table (cm)
Site Number Series Subgroup Parent Material
Coordinates Modifier/ Variant
Upper Subsoil (B horizon)
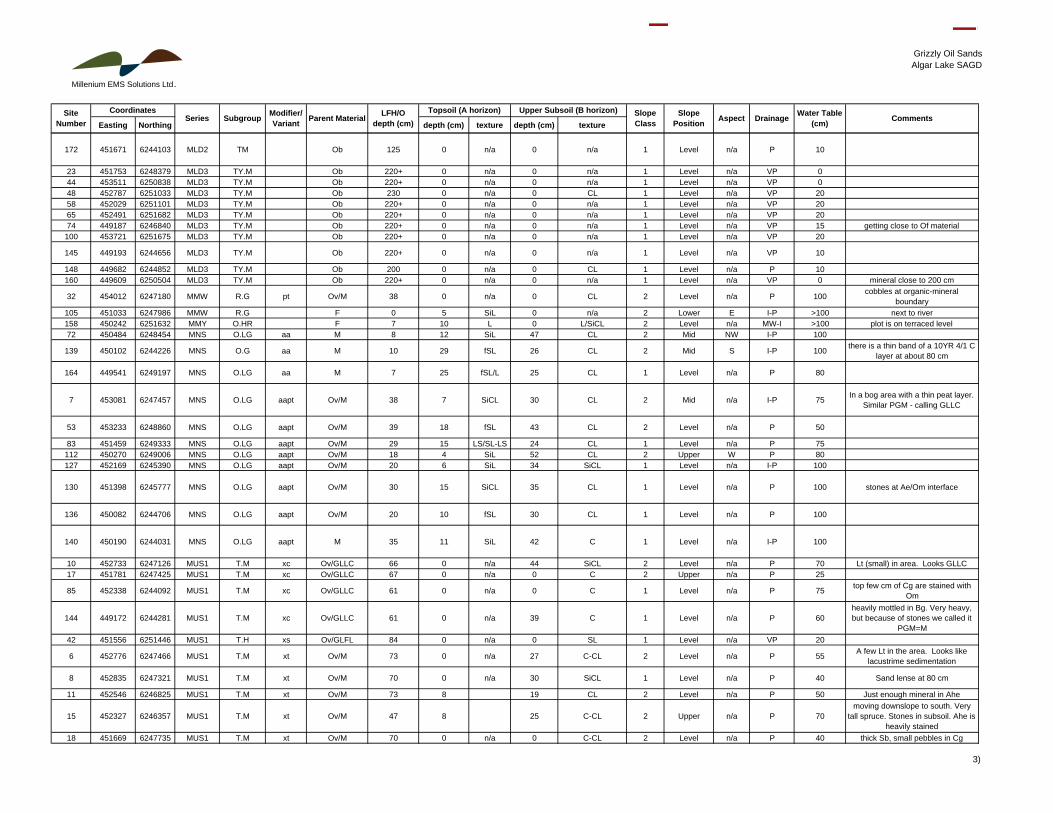
172 451671 6244103 MLD2 TM Ob 125 0 n/a 0 n/a 1 Level n/a P 10
23 451753 6248379 MLD3 TY.M Ob 220+ 0 n/a 0 n/a 1 Level n/a VP 044 453511 6250838 MLD3 TY.M Ob 220+ 0 n/a 0 n/a 1 Level n/a VP 048 452787 6251033 MLD3 TY.M Ob 230 0 n/a 0 CL 1 Level n/a VP 2058 452029 6251101 MLD3 TY.M Ob 220+ 0 n/a 0 n/a 1 Level n/a VP 2065 452491 6251682 MLD3 TY.M Ob 220+ 0 n/a 0 n/a 1 Level n/a VP 2074 449187 6246840 MLD3 TY.M Ob 220+ 0 n/a 0 n/a 1 Level n/a VP 15 getting close to Of material
100 453721 6251675 MLD3 TY.M Ob 220+ 0 n/a 0 n/a 1 Level n/a VP 20
145 449193 6244656 MLD3 TY.M Ob 220+ 0 n/a 0 n/a 1 Level n/a VP 10
148 449682 6244852 MLD3 TY.M Ob 200 0 n/a 0 CL 1 Level n/a P 10160 449609 6250504 MLD3 TY.M Ob 220+ 0 n/a 0 n/a 1 Level n/a VP 0 mineral close to 200 cm
32 454012 6247180 MMW R.G pt Ov/M 38 0 n/a 0 CL 2 Level n/a P 100 cobbles at organic-mineral boundary
105 451033 6247986 MMW R.G F 0 5 SiL 0 n/a 2 Lower E I-P >100 next to river158 450242 6251632 MMY O.HR F 7 10 L 0 L/SiCL 2 Level n/a MW-I >100 plot is on terraced level72 450484 6248454 MNS O.LG aa M 8 12 SiL 47 CL 2 Mid NW I-P 100
139 450102 6244226 MNS O.G aa M 10 29 fSL 26 CL 2 Mid S I-P 100 there is a thin band of a 10YR 4/1 C layer at about 80 cm
164 449541 6249197 MNS O.LG aa M 7 25 fSL/L 25 CL 1 Level n/a P 80
7 453081 6247457 MNS O.LG aapt Ov/M 38 7 SiCL 30 CL 2 Mid n/a I-P 75 In a bog area with a thin peat layer. Similar PGM - calling GLLC
53 453233 6248860 MNS O.LG aapt Ov/M 39 18 fSL 43 CL 2 Level n/a P 50
83 451459 6249333 MNS O.LG aapt Ov/M 29 15 LS/SL-LS 24 CL 1 Level n/a P 75112 450270 6249006 MNS O.LG aapt Ov/M 18 4 SiL 52 CL 2 Upper W P 80127 452169 6245390 MNS O.LG aapt Ov/M 20 6 SiL 34 SiCL 1 Level n/a I-P 100
130 451398 6245777 MNS O.LG aapt Ov/M 30 15 SiCL 35 CL 1 Level n/a P 100 stones at Ae/Om interface
136 450082 6244706 MNS O.LG aapt Ov/M 20 10 fSL 30 CL 1 Level n/a P 100
140 450190 6244031 MNS O.LG aapt M 35 11 SiL 42 C 1 Level n/a I-P 100
10 452733 6247126 MUS1 T.M xc Ov/GLLC 66 0 n/a 44 SiCL 2 Level n/a P 70 Lt (small) in area. Looks GLLC17 451781 6247425 MUS1 T.M xc Ov/GLLC 67 0 n/a 0 C 2 Upper n/a P 25
85 452338 6244092 MUS1 T.M xc Ov/GLLC 61 0 n/a 0 C 1 Level n/a P 75 top few cm of Cg are stained with Om
144 449172 6244281 MUS1 T.M xc Ov/GLLC 61 0 n/a 39 C 1 Level n/a P 60heavily mottled in Bg. Very heavy, but because of stones we called it
PGM=M42 451556 6251446 MUS1 T.H xs Ov/GLFL 84 0 n/a 0 SL 1 Level n/a VP 20
6 452776 6247466 MUS1 T.M xt Ov/M 73 0 n/a 27 C-CL 2 Level n/a P 55 A few Lt in the area. Looks like lacustrime sedimentation
8 452835 6247321 MUS1 T.M xt Ov/M 70 0 n/a 30 SiCL 1 Level n/a P 40 Sand lense at 80 cm
11 452546 6246825 MUS1 T.M xt Ov/M 73 8 19 CL 2 Level n/a P 50 Just enough mineral in Ahe
15 452327 6246357 MUS1 T.M xt Ov/M 47 8 25 C-CL 2 Upper n/a P 70moving downslope to south. Very
tall spruce. Stones in subsoil. Ahe is heavily stained
18 451669 6247735 MUS1 T.M xt Ov/M 70 0 n/a 0 C-CL 2 Level n/a P 40 thick Sb, small pebbles in Cg
3)
Millenium EMS Solutions Ltd.
Grizzly Oil SandsAlgar Lake SAGD
Easting Northing depth (cm) texture depth (cm) textureCommentsLFH/O
depth (cm)Topsoil (A horizon) Slope
ClassSlope
Position Aspect Drainage Water Table (cm)
Site Number Series Subgroup Parent Material
Coordinates Modifier/ Variant
Upper Subsoil (B horizon)
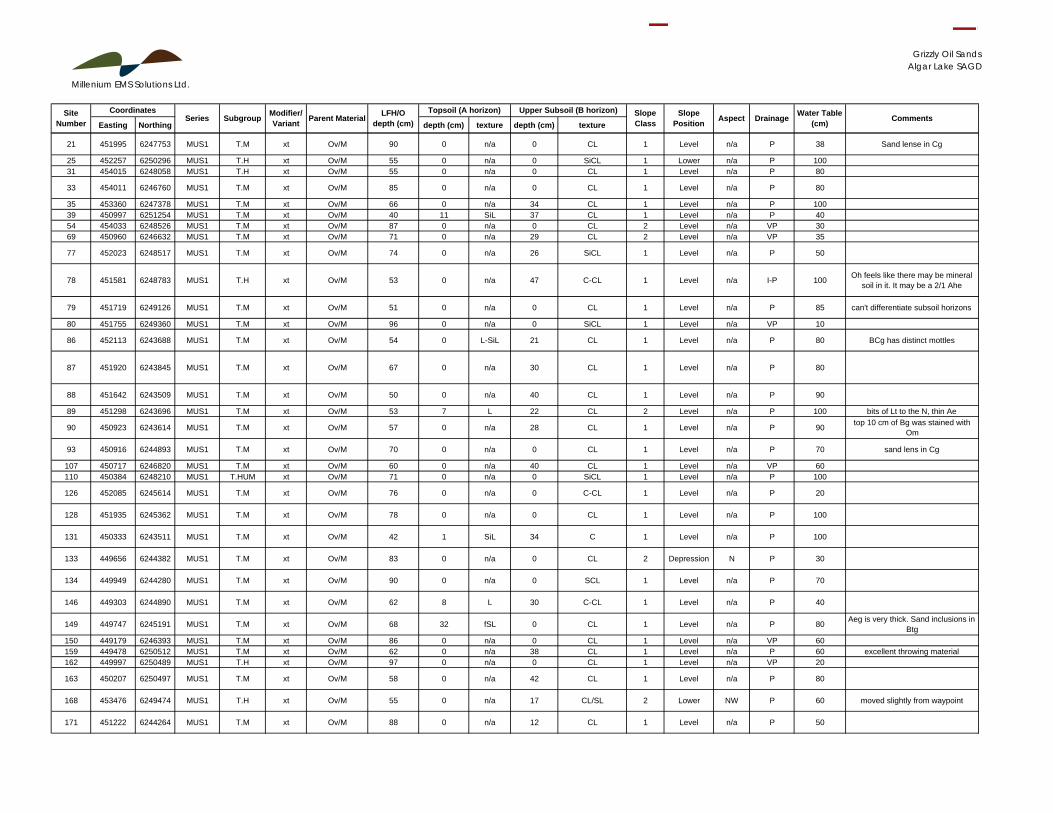
21 451995 6247753 MUS1 T.M xt Ov/M 90 0 n/a 0 CL 1 Level n/a P 38 Sand lense in Cg
25 452257 6250296 MUS1 T.H xt Ov/M 55 0 n/a 0 SiCL 1 Lower n/a P 10031 454015 6248058 MUS1 T.H xt Ov/M 55 0 n/a 0 CL 1 Level n/a P 80
33 454011 6246760 MUS1 T.M xt Ov/M 85 0 n/a 0 CL 1 Level n/a P 80
35 453360 6247378 MUS1 T.M xt Ov/M 66 0 n/a 34 CL 1 Level n/a P 10039 450997 6251254 MUS1 T.M xt Ov/M 40 11 SiL 37 CL 1 Level n/a P 4054 454033 6248526 MUS1 T.M xt Ov/M 87 0 n/a 0 CL 2 Level n/a VP 3069 450960 6246632 MUS1 T.M xt Ov/M 71 0 n/a 29 CL 2 Level n/a VP 35
77 452023 6248517 MUS1 T.M xt Ov/M 74 0 n/a 26 SiCL 1 Level n/a P 50
78 451581 6248783 MUS1 T.H xt Ov/M 53 0 n/a 47 C-CL 1 Level n/a I-P 100 Oh feels like there may be mineral soil in it. It may be a 2/1 Ahe
79 451719 6249126 MUS1 T.M xt Ov/M 51 0 n/a 0 CL 1 Level n/a P 85 can't differentiate subsoil horizons
80 451755 6249360 MUS1 T.M xt Ov/M 96 0 n/a 0 SiCL 1 Level n/a VP 10
86 452113 6243688 MUS1 T.M xt Ov/M 54 0 L-SiL 21 CL 1 Level n/a P 80 BCg has distinct mottles
87 451920 6243845 MUS1 T.M xt Ov/M 67 0 n/a 30 CL 1 Level n/a P 80
88 451642 6243509 MUS1 T.M xt Ov/M 50 0 n/a 40 CL 1 Level n/a P 90
89 451298 6243696 MUS1 T.M xt Ov/M 53 7 L 22 CL 2 Level n/a P 100 bits of Lt to the N, thin Ae
90 450923 6243614 MUS1 T.M xt Ov/M 57 0 n/a 28 CL 1 Level n/a P 90 top 10 cm of Bg was stained with Om
93 450916 6244893 MUS1 T.M xt Ov/M 70 0 n/a 0 CL 1 Level n/a P 70 sand lens in Cg
107 450717 6246820 MUS1 T.M xt Ov/M 60 0 n/a 40 CL 1 Level n/a VP 60110 450384 6248210 MUS1 T.HUM xt Ov/M 71 0 n/a 0 SiCL 1 Level n/a P 100
126 452085 6245614 MUS1 T.M xt Ov/M 76 0 n/a 0 C-CL 1 Level n/a P 20
128 451935 6245362 MUS1 T.M xt Ov/M 78 0 n/a 0 CL 1 Level n/a P 100
131 450333 6243511 MUS1 T.M xt Ov/M 42 1 SiL 34 C 1 Level n/a P 100
133 449656 6244382 MUS1 T.M xt Ov/M 83 0 n/a 0 CL 2 Depression N P 30
134 449949 6244280 MUS1 T.M xt Ov/M 90 0 n/a 0 SCL 1 Level n/a P 70
146 449303 6244890 MUS1 T.M xt Ov/M 62 8 L 30 C-CL 1 Level n/a P 40
149 449747 6245191 MUS1 T.M xt Ov/M 68 32 fSL 0 CL 1 Level n/a P 80 Aeg is very thick. Sand inclusions in Btg
150 449179 6246393 MUS1 T.M xt Ov/M 86 0 n/a 0 CL 1 Level n/a VP 60159 449478 6250512 MUS1 T.M xt Ov/M 62 0 n/a 38 CL 1 Level n/a P 60 excellent throwing material162 449997 6250489 MUS1 T.H xt Ov/M 97 0 n/a 0 CL 1 Level n/a VP 20
163 450207 6250497 MUS1 T.M xt Ov/M 58 0 n/a 42 CL 1 Level n/a P 80
168 453476 6249474 MUS1 T.H xt Ov/M 55 0 n/a 17 CL/SL 2 Lower NW P 60 moved slightly from waypoint
171 451222 6244264 MUS1 T.M xt Ov/M 88 0 n/a 12 CL 1 Level n/a P 50
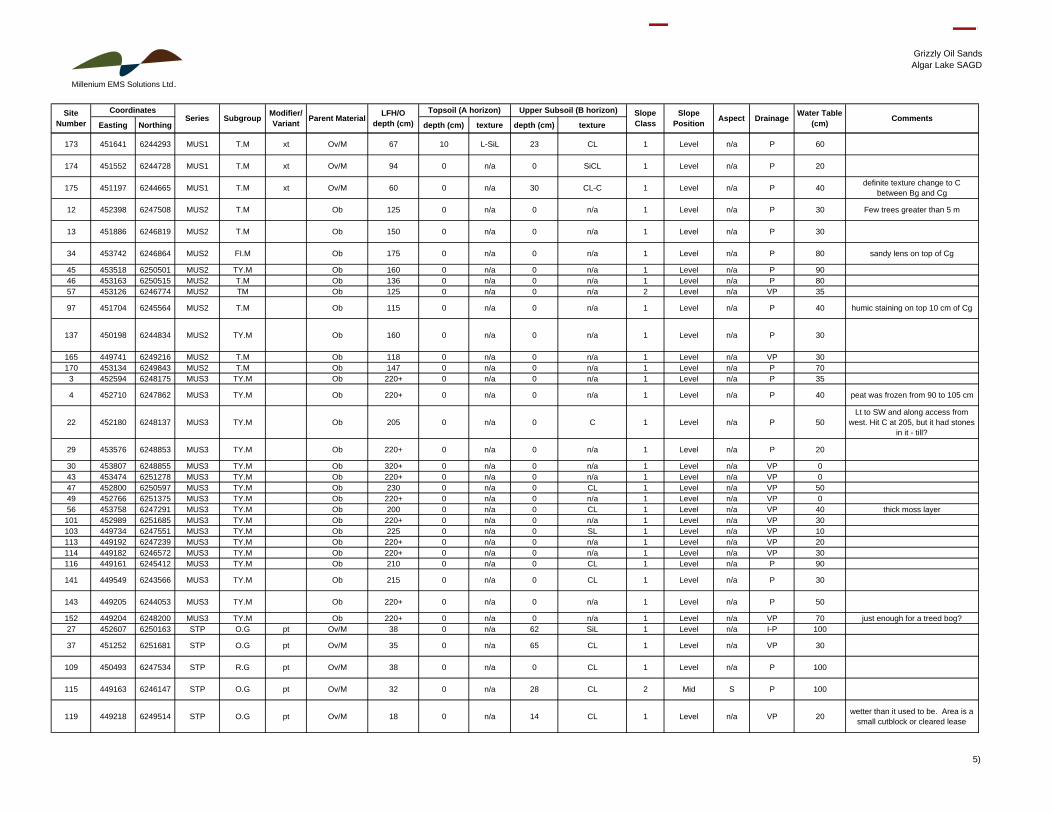
Millenium EMS Solutions Ltd.
Grizzly Oil SandsAlgar Lake SAGD
Easting Northing depth (cm) texture depth (cm) textureCommentsLFH/O
depth (cm)Topsoil (A horizon) Slope
ClassSlope
Position Aspect Drainage Water Table (cm)
Site Number Series Subgroup Parent Material
Coordinates Modifier/ Variant
Upper Subsoil (B horizon)
173 451641 6244293 MUS1 T.M xt Ov/M 67 10 L-SiL 23 CL 1 Level n/a P 60
174 451552 6244728 MUS1 T.M xt Ov/M 94 0 n/a 0 SiCL 1 Level n/a P 20
175 451197 6244665 MUS1 T.M xt Ov/M 60 0 n/a 30 CL-C 1 Level n/a P 40 definite texture change to C between Bg and Cg
12 452398 6247508 MUS2 T.M Ob 125 0 n/a 0 n/a 1 Level n/a P 30 Few trees greater than 5 m
13 451886 6246819 MUS2 T.M Ob 150 0 n/a 0 n/a 1 Level n/a P 30
34 453742 6246864 MUS2 FI.M Ob 175 0 n/a 0 n/a 1 Level n/a P 80 sandy lens on top of Cg
45 453518 6250501 MUS2 TY.M Ob 160 0 n/a 0 n/a 1 Level n/a P 9046 453163 6250515 MUS2 T.M Ob 136 0 n/a 0 n/a 1 Level n/a P 8057 453126 6246774 MUS2 TM Ob 125 0 n/a 0 n/a 2 Level n/a VP 35
97 451704 6245564 MUS2 T.M Ob 115 0 n/a 0 n/a 1 Level n/a P 40 humic staining on top 10 cm of Cg
137 450198 6244834 MUS2 TY.M Ob 160 0 n/a 0 n/a 1 Level n/a P 30
165 449741 6249216 MUS2 T.M Ob 118 0 n/a 0 n/a 1 Level n/a VP 30170 453134 6249843 MUS2 T.M Ob 147 0 n/a 0 n/a 1 Level n/a P 70
3 452594 6248175 MUS3 TY.M Ob 220+ 0 n/a 0 n/a 1 Level n/a P 35
4 452710 6247862 MUS3 TY.M Ob 220+ 0 n/a 0 n/a 1 Level n/a P 40 peat was frozen from 90 to 105 cm
22 452180 6248137 MUS3 TY.M Ob 205 0 n/a 0 C 1 Level n/a P 50Lt to SW and along access from
west. Hit C at 205, but it had stones in it - till?
29 453576 6248853 MUS3 TY.M Ob 220+ 0 n/a 0 n/a 1 Level n/a P 20
30 453807 6248855 MUS3 TY.M Ob 320+ 0 n/a 0 n/a 1 Level n/a VP 043 453474 6251278 MUS3 TY.M Ob 220+ 0 n/a 0 n/a 1 Level n/a VP 047 452800 6250597 MUS3 TY.M Ob 230 0 n/a 0 CL 1 Level n/a VP 5049 452766 6251375 MUS3 TY.M Ob 220+ 0 n/a 0 n/a 1 Level n/a VP 056 453758 6247291 MUS3 TY.M Ob 200 0 n/a 0 CL 1 Level n/a VP 40 thick moss layer
101 452989 6251685 MUS3 TY.M Ob 220+ 0 n/a 0 n/a 1 Level n/a VP 30103 449734 6247551 MUS3 TY.M Ob 225 0 n/a 0 SL 1 Level n/a VP 10113 449192 6247239 MUS3 TY.M Ob 220+ 0 n/a 0 n/a 1 Level n/a VP 20114 449182 6246572 MUS3 TY.M Ob 220+ 0 n/a 0 n/a 1 Level n/a VP 30116 449161 6245412 MUS3 TY.M Ob 210 0 n/a 0 CL 1 Level n/a P 90
141 449549 6243566 MUS3 TY.M Ob 215 0 n/a 0 CL 1 Level n/a P 30
143 449205 6244053 MUS3 TY.M Ob 220+ 0 n/a 0 n/a 1 Level n/a P 50
152 449204 6248200 MUS3 TY.M Ob 220+ 0 n/a 0 n/a 1 Level n/a VP 70 just enough for a treed bog?27 452607 6250163 STP O.G pt Ov/M 38 0 n/a 62 SiL 1 Level n/a I-P 100
37 451252 6251681 STP O.G pt Ov/M 35 0 n/a 65 CL 1 Level n/a VP 30
109 450493 6247534 STP R.G pt Ov/M 38 0 n/a 0 CL 1 Level n/a P 100
115 449163 6246147 STP O.G pt Ov/M 32 0 n/a 28 CL 2 Mid S P 100
119 449218 6249514 STP O.G pt Ov/M 18 0 n/a 14 CL 1 Level n/a VP 20 wetter than it used to be. Area is a small cutblock or cleared lease
5)
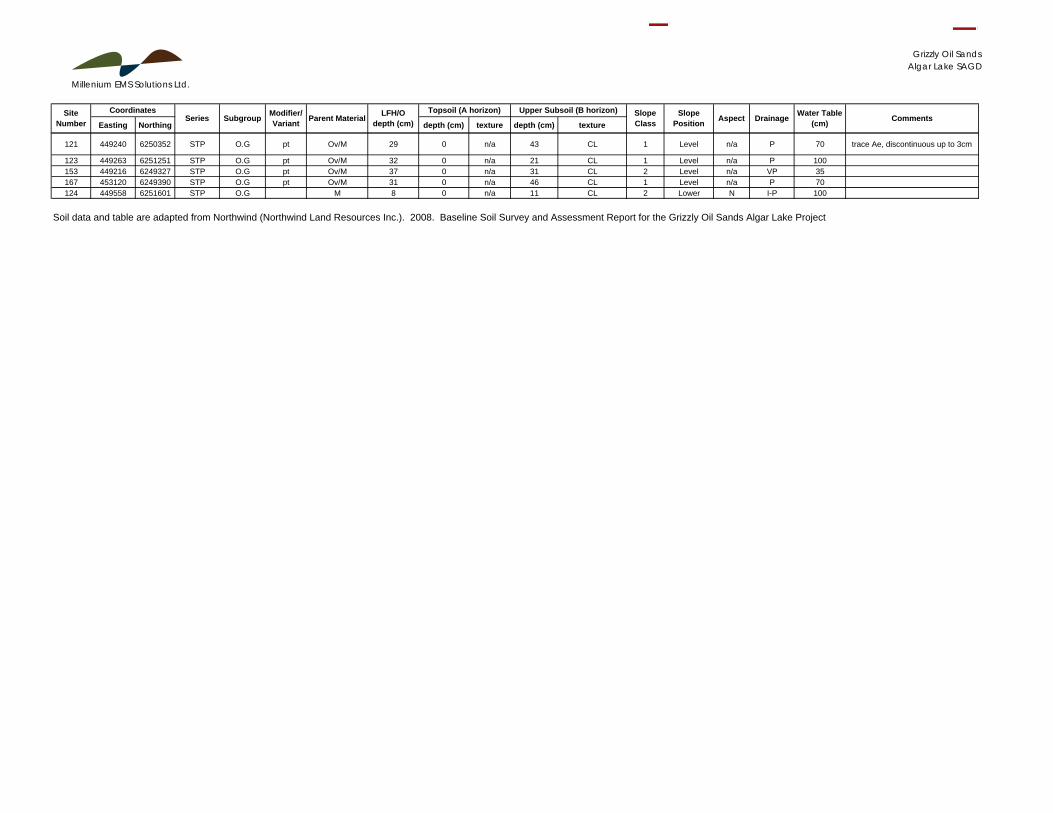
Millenium EMS Solutions Ltd.
Grizzly Oil SandsAlgar Lake SAGD
Easting Northing depth (cm) texture depth (cm) textureCommentsLFH/O
depth (cm)Topsoil (A horizon) Slope
ClassSlope
Position Aspect Drainage Water Table (cm)
Site Number Series Subgroup Parent Material
Coordinates Modifier/ Variant
Upper Subsoil (B horizon)
121 449240 6250352 STP O.G pt Ov/M 29 0 n/a 43 CL 1 Level n/a P 70 trace Ae, discontinuous up to 3cm
123 449263 6251251 STP O.G pt Ov/M 32 0 n/a 21 CL 1 Level n/a P 100153 449216 6249327 STP O.G pt Ov/M 37 0 n/a 31 CL 2 Level n/a VP 35167 453120 6249390 STP O.G pt Ov/M 31 0 n/a 46 CL 1 Level n/a P 70124 449558 6251601 STP O.G M 8 0 n/a 11 CL 2 Lower N I-P 100
Soil data and table are adapted from Northwind (Northwind Land Resources Inc.). 2008. Baseline Soil Survey and Assessment Report for the Grizzly Oil Sands Algar Lake Project
Grizzly Oil Sands Algar Lake SAGD Project Millennium EMS Solutions Ltd. January 2010
07-099
APPENDIX B: LABORATORY RESULTS
ADDITIONAL 08-JAN-08 15:59ADDITIONAL 29-OCT-07 07:50
ANALYTICAL REPORT
Reported On: 21-JAN-08 02:39 PM
THIS REPORT SHALL NOT BE REPRODUCED EXCEPT IN FULL WITHOUT THE WRITTEN AUTHORITY OF THE LABORATORY.ALL SAMPLES WILL BE DISPOSED OF AFTER 30 DAYS FOLLOWING ANALYSIS. PLEASE CONTACT THE LAB IF YOUREQUIRE ADDITIONAL SAMPLE STORAGE TIME.
CHARLES LEBLANCGeneral Manager, Edmonton
07-265 GRIZZLYNOT SUBMITTED
Comments:
Job Reference: Project P.O. #:
Other Information:
Legal Site Desc: 279913, 279914, 279915, 279943, 279944, 279945, 279946, 284017CofC Numbers:
9936-67 Avenue, Edmonton, AB T6E 0P5Phone: +1 780 413 5227 Fax: +1 780 437 2311 www.alsglobal.com
A Campbell Brothers Limited Company
16-OCT-07Lab Work Order #: L566818 Date Received:
NORTHWIND LAND RESOURCES
10368C 60 AVENUE
EDMONTON AB T6H 1G9
ATTN: MARTY YARMUCH
For any questions about this report please contact your Account Manager:
JESSICA SPIRA
Revision: 3
____________________________________________
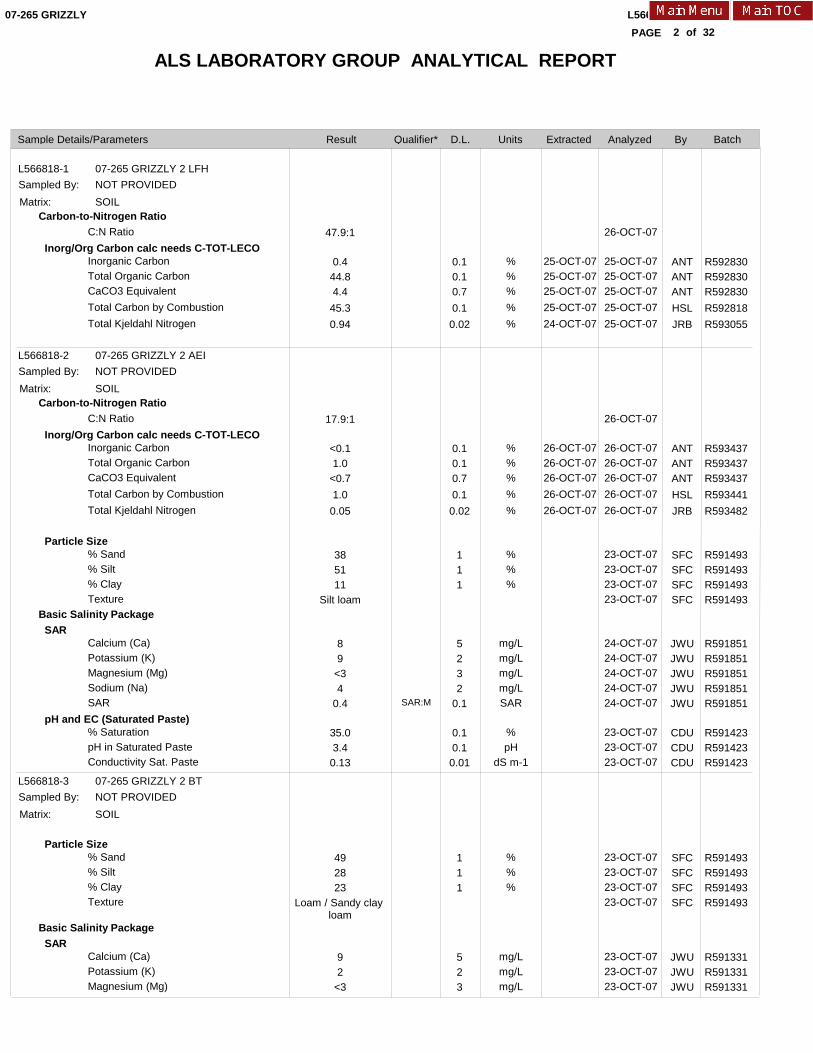
ALS LABORATORY GROUP ANALYTICAL REPORT
L566818 CONTD....
2PAGE
Result D.L. Units Extracted Analyzed BySample Details/Parameters
of
07-265 GRIZZLY
Qualifier* Batch
32
L566818-1
L566818-2
L566818-3
07-265 GRIZZLY 2 LFH
07-265 GRIZZLY 2 AEI
07-265 GRIZZLY 2 BT
NOT PROVIDED
NOT PROVIDED
NOT PROVIDED
Sampled By:
Sampled By:
Sampled By:
SOIL
SOIL
SOIL
Carbon-to-Nitrogen Ratio
Carbon-to-Nitrogen Ratio
Basic Salinity Package
Basic Salinity Package
C:N Ratio
Inorganic CarbonTotal Organic CarbonCaCO3 EquivalentTotal Carbon by CombustionTotal Kjeldahl Nitrogen
C:N Ratio
Inorganic CarbonTotal Organic CarbonCaCO3 EquivalentTotal Carbon by CombustionTotal Kjeldahl Nitrogen
% Sand% Silt% ClayTexture
Calcium (Ca)Potassium (K)Magnesium (Mg)Sodium (Na)SAR
% SaturationpH in Saturated PasteConductivity Sat. Paste
% Sand% Silt% ClayTexture
Calcium (Ca)Potassium (K)Magnesium (Mg)
%%%%%
%%%%%
%%%
mg/Lmg/Lmg/Lmg/LSAR
%pH
dS m-1
%%%
mg/Lmg/Lmg/L
25-OCT-0725-OCT-0725-OCT-0725-OCT-0724-OCT-07
26-OCT-0726-OCT-0726-OCT-0726-OCT-0726-OCT-07
26-OCT-07
25-OCT-0725-OCT-0725-OCT-0725-OCT-0725-OCT-07
26-OCT-07
26-OCT-0726-OCT-0726-OCT-0726-OCT-0726-OCT-07
23-OCT-0723-OCT-0723-OCT-0723-OCT-07
24-OCT-0724-OCT-0724-OCT-0724-OCT-0724-OCT-07
23-OCT-0723-OCT-0723-OCT-07
23-OCT-0723-OCT-0723-OCT-0723-OCT-07
23-OCT-0723-OCT-0723-OCT-07
ANTANTANTHSLJRB
ANTANTANTHSLJRB
SFCSFCSFCSFC
JWUJWUJWUJWUJWU
CDUCDUCDU
SFCSFCSFCSFC
JWUJWUJWU
47.9:1
0.444.84.445.30.94
17.9:1
<0.11.0
<0.71.00.05
385111
Silt loam
89
<34
0.4
35.03.40.13
492823
Loam / Sandy clay loam
92
<3
Inorg/Org Carbon calc needs C-TOT-LECO
Inorg/Org Carbon calc needs C-TOT-LECO
Particle Size
SAR
pH and EC (Saturated Paste)
Particle Size
SAR
0.10.10.70.10.02
0.10.10.70.10.02
111
5232
0.1
0.10.10.01
111
523
Matrix:
Matrix:
Matrix:
SAR:M
R592830R592830R592830R592818R593055
R593437R593437R593437R593441R593482
R591493R591493R591493R591493
R591851R591851R591851R591851R591851
R591423R591423R591423
R591493R591493R591493R591493
R591331R591331R591331

ALS LABORATORY GROUP ANALYTICAL REPORT
L566818 CONTD....
3PAGE
Result D.L. Units Extracted Analyzed BySample Details/Parameters
of
07-265 GRIZZLY
Qualifier* Batch
32
L566818-3
L566818-4
L566818-5
L566818-6
07-265 GRIZZLY 2 BT
07-265 GRIZZLY 2 BC
07-265 GRIZZLY 14 LFH
07-265 GRIZZLY 14 AEGJ
NOT PROVIDED
NOT PROVIDED
NOT PROVIDED
NOT PROVIDED
Sampled By:
Sampled By:
Sampled By:
Sampled By:
SOIL
SOIL
SOIL
SOIL
Basic Salinity Package
Basic Salinity Package
Carbon-to-Nitrogen Ratio
Carbon-to-Nitrogen Ratio
Sodium (Na)SAR
% SaturationpH in Saturated PasteConductivity Sat. Paste
% Sand% Silt% ClayTexture
Calcium (Ca)Potassium (K)Magnesium (Mg)Sodium (Na)SAR
% SaturationpH in Saturated PasteConductivity Sat. Paste
C:N Ratio
Inorganic CarbonTotal Organic CarbonCaCO3 EquivalentTotal Carbon by CombustionTotal Kjeldahl Nitrogen
C:N Ratio
Inorganic CarbonTotal Organic CarbonCaCO3 EquivalentTotal Carbon by Combustion
mg/LSAR
%pH
dS m-1
%%%
mg/Lmg/Lmg/Lmg/LSAR
%pH
dS m-1
%%%%%
%%%%
25-OCT-0725-OCT-0725-OCT-0725-OCT-0724-OCT-07
26-OCT-0726-OCT-0726-OCT-0726-OCT-07
23-OCT-0723-OCT-07
23-OCT-0723-OCT-0723-OCT-07
23-OCT-0723-OCT-0723-OCT-0723-OCT-07
23-OCT-0723-OCT-0723-OCT-0723-OCT-0723-OCT-07
23-OCT-0723-OCT-0723-OCT-07
26-OCT-07
25-OCT-0725-OCT-0725-OCT-0725-OCT-0725-OCT-07
26-OCT-07
26-OCT-0726-OCT-0726-OCT-0726-OCT-07
JWUJWU
CDUCDUCDU
SFCSFCSFCSFC
JWUJWUJWUJWUJWU
CDUCDUCDU
ANTANTANTHSLJRB
ANTANTANTHSL
60.5
30.94.50.10
512821
Loam / Sandy clay loam
143
<39
0.7
30.94.80.13
49.8:1
0.132.11.532.20.65
14.1:1
<0.10.5
<0.70.5
SAR
pH and EC (Saturated Paste)
Particle Size
SAR
pH and EC (Saturated Paste)
Inorg/Org Carbon calc needs C-TOT-LECO
Inorg/Org Carbon calc needs C-TOT-LECO
20.1
0.10.10.01
111
5232
0.1
0.10.10.01
0.10.10.70.10.02
0.10.10.70.1
Matrix:
Matrix:
Matrix:
Matrix:
SAR:M
SAR:M
R591331R591331
R591423R591423R591423
R591493R591493R591493R591493
R591331R591331R591331R591331R591331
R591423R591423R591423
R592830R592830R592830R592818R593055
R593437R593437R593437R593441

ALS LABORATORY GROUP ANALYTICAL REPORT
L566818 CONTD....
4PAGE
Result D.L. Units Extracted Analyzed BySample Details/Parameters
of
07-265 GRIZZLY
Qualifier* Batch
32
L566818-6
L566818-7
L566818-8
07-265 GRIZZLY 14 AEGJ
07-265 GRIZZLY 14 BTGJ
07-265 GRIZZLY 14 CKGJ
NOT PROVIDED
NOT PROVIDED
NOT PROVIDED
Sampled By:
Sampled By:
Sampled By:
SOIL
SOIL
SOIL
Carbon-to-Nitrogen Ratio
Basic Salinity Package
Basic Salinity Package
Basic Salinity Package
Total Kjeldahl Nitrogen
% Sand% Silt% ClayTexture
Calcium (Ca)Potassium (K)Magnesium (Mg)Sodium (Na)SAR
% SaturationpH in Saturated PasteConductivity Sat. Paste
% Sand% Silt% ClayTexture
Calcium (Ca)Potassium (K)Magnesium (Mg)Sodium (Na)SAR
% SaturationpH in Saturated PasteConductivity Sat. Paste
% Sand% Silt% ClayTexture
Calcium (Ca)Potassium (K)
%
%%%
mg/Lmg/Lmg/Lmg/LSAR
%pH
dS m-1
%%%
mg/Lmg/Lmg/Lmg/LSAR
%pH
dS m-1
%%%
mg/Lmg/L
26-OCT-07 26-OCT-07
23-OCT-0723-OCT-0723-OCT-0723-OCT-07
23-OCT-0723-OCT-0723-OCT-0723-OCT-0723-OCT-07
23-OCT-0723-OCT-0723-OCT-07
23-OCT-0723-OCT-0723-OCT-0723-OCT-07
23-OCT-0723-OCT-0723-OCT-0723-OCT-0723-OCT-07
23-OCT-0723-OCT-0723-OCT-07
23-OCT-0723-OCT-0723-OCT-0723-OCT-07
23-OCT-0723-OCT-07
JRB
SFCSFCSFCSFC
JWUJWUJWUJWUJWU
CDUCDUCDU
NNKNNKNNKNNK
JWUJWUJWUJWUJWU
CDUCDUCDU
NNKNNKNNKNNK
JWUJWU
0.03
374716
Loam
18578
0.4
26.14.10.19
392239
Clay loam
12339
0.6
37.94.70.14
432433
Clay loam
50<2
Particle Size
SAR
pH and EC (Saturated Paste)
Particle Size
SAR
pH and EC (Saturated Paste)
Particle Size
SAR
0.02
111
5232
0.1
0.10.10.01
111
5232
0.1
0.10.10.01
111
52
Matrix:
Matrix:
Matrix:
R593482
R591493R591493R591493R591493
R591331R591331R591331R591331R591331
R591423R591423R591423
R591527R591527R591527R591527
R591331R591331R591331R591331R591331
R591423R591423R591423
R591527R591527R591527R591527
R591331R591331
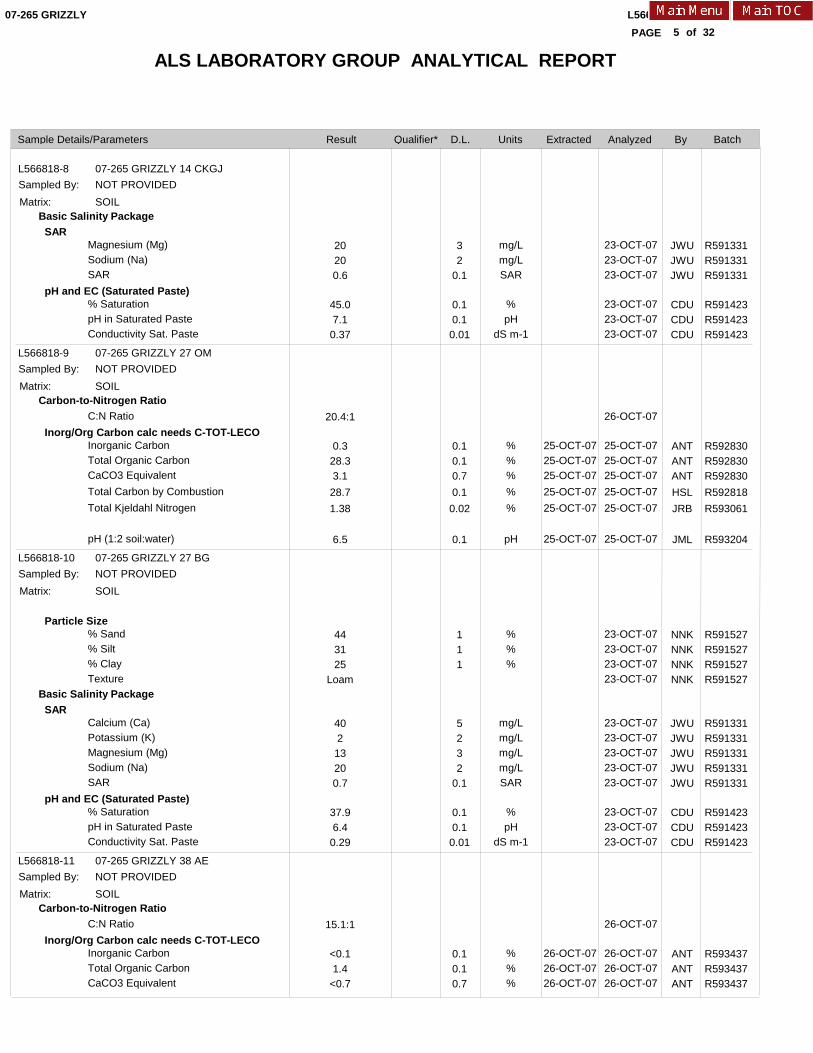
ALS LABORATORY GROUP ANALYTICAL REPORT
L566818 CONTD....
5PAGE
Result D.L. Units Extracted Analyzed BySample Details/Parameters
of
07-265 GRIZZLY
Qualifier* Batch
32
L566818-8
L566818-9
L566818-10
L566818-11
07-265 GRIZZLY 14 CKGJ
07-265 GRIZZLY 27 OM
07-265 GRIZZLY 27 BG
07-265 GRIZZLY 38 AE
NOT PROVIDED
NOT PROVIDED
NOT PROVIDED
NOT PROVIDED
Sampled By:
Sampled By:
Sampled By:
Sampled By:
SOIL
SOIL
SOIL
SOIL
Basic Salinity Package
Carbon-to-Nitrogen Ratio
Basic Salinity Package
Carbon-to-Nitrogen Ratio
Magnesium (Mg)Sodium (Na)SAR
% SaturationpH in Saturated PasteConductivity Sat. Paste
C:N Ratio
Inorganic CarbonTotal Organic CarbonCaCO3 EquivalentTotal Carbon by CombustionTotal Kjeldahl Nitrogen
pH (1:2 soil:water)
% Sand% Silt% ClayTexture
Calcium (Ca)Potassium (K)Magnesium (Mg)Sodium (Na)SAR
% SaturationpH in Saturated PasteConductivity Sat. Paste
C:N Ratio
Inorganic CarbonTotal Organic CarbonCaCO3 Equivalent
mg/Lmg/LSAR
%pH
dS m-1
%%%%%
pH
%%%
mg/Lmg/Lmg/Lmg/LSAR
%pH
dS m-1
%%%
25-OCT-0725-OCT-0725-OCT-0725-OCT-0725-OCT-07
25-OCT-07
26-OCT-0726-OCT-0726-OCT-07
23-OCT-0723-OCT-0723-OCT-07
23-OCT-0723-OCT-0723-OCT-07
26-OCT-07
25-OCT-0725-OCT-0725-OCT-0725-OCT-0725-OCT-07
25-OCT-07
23-OCT-0723-OCT-0723-OCT-0723-OCT-07
23-OCT-0723-OCT-0723-OCT-0723-OCT-0723-OCT-07
23-OCT-0723-OCT-0723-OCT-07
26-OCT-07
26-OCT-0726-OCT-0726-OCT-07
JWUJWUJWU
CDUCDUCDU
ANTANTANTHSLJRB
JML
NNKNNKNNKNNK
JWUJWUJWUJWUJWU
CDUCDUCDU
ANTANTANT
20200.6
45.07.10.37
20.4:1
0.328.33.128.71.38
6.5
443125
Loam
40213200.7
37.96.40.29
15.1:1
<0.11.4
<0.7
SAR
pH and EC (Saturated Paste)
Inorg/Org Carbon calc needs C-TOT-LECO
Particle Size
SAR
pH and EC (Saturated Paste)
Inorg/Org Carbon calc needs C-TOT-LECO
32
0.1
0.10.10.01
0.10.10.70.10.02
0.1
111
5232
0.1
0.10.10.01
0.10.10.7
Matrix:
Matrix:
Matrix:
Matrix:
R591331R591331R591331
R591423R591423R591423
R592830R592830R592830R592818R593061
R593204
R591527R591527R591527R591527
R591331R591331R591331R591331R591331
R591423R591423R591423
R593437R593437R593437
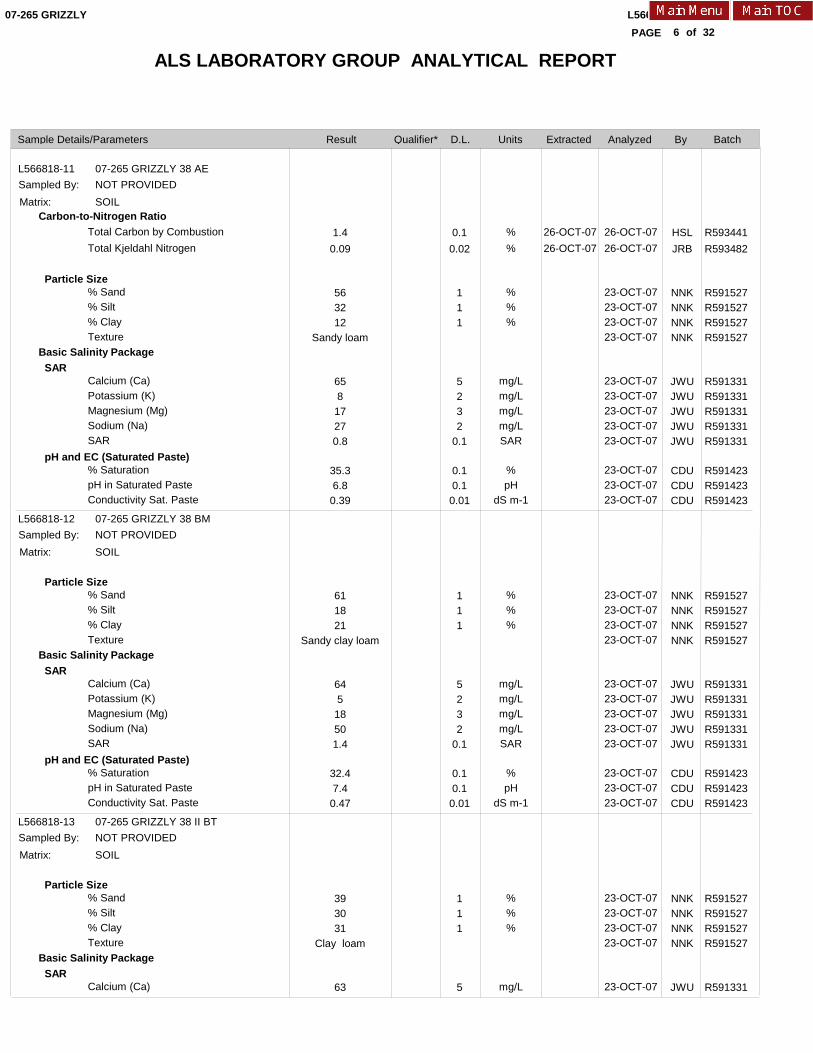
ALS LABORATORY GROUP ANALYTICAL REPORT
L566818 CONTD....
6PAGE
Result D.L. Units Extracted Analyzed BySample Details/Parameters
of
07-265 GRIZZLY
Qualifier* Batch
32
L566818-11
L566818-12
L566818-13
07-265 GRIZZLY 38 AE
07-265 GRIZZLY 38 BM
07-265 GRIZZLY 38 II BT
NOT PROVIDED
NOT PROVIDED
NOT PROVIDED
Sampled By:
Sampled By:
Sampled By:
SOIL
SOIL
SOIL
Carbon-to-Nitrogen Ratio
Basic Salinity Package
Basic Salinity Package
Basic Salinity Package
Total Carbon by CombustionTotal Kjeldahl Nitrogen
% Sand% Silt% ClayTexture
Calcium (Ca)Potassium (K)Magnesium (Mg)Sodium (Na)SAR
% SaturationpH in Saturated PasteConductivity Sat. Paste
% Sand% Silt% ClayTexture
Calcium (Ca)Potassium (K)Magnesium (Mg)Sodium (Na)SAR
% SaturationpH in Saturated PasteConductivity Sat. Paste
% Sand% Silt% ClayTexture
Calcium (Ca)
%%
%%%
mg/Lmg/Lmg/Lmg/LSAR
%pH
dS m-1
%%%
mg/Lmg/Lmg/Lmg/LSAR
%pH
dS m-1
%%%
mg/L
26-OCT-0726-OCT-07
26-OCT-0726-OCT-07
23-OCT-0723-OCT-0723-OCT-0723-OCT-07
23-OCT-0723-OCT-0723-OCT-0723-OCT-0723-OCT-07
23-OCT-0723-OCT-0723-OCT-07
23-OCT-0723-OCT-0723-OCT-0723-OCT-07
23-OCT-0723-OCT-0723-OCT-0723-OCT-0723-OCT-07
23-OCT-0723-OCT-0723-OCT-07
23-OCT-0723-OCT-0723-OCT-0723-OCT-07
23-OCT-07
HSLJRB
NNKNNKNNKNNK
JWUJWUJWUJWUJWU
CDUCDUCDU
NNKNNKNNKNNK
JWUJWUJWUJWUJWU
CDUCDUCDU
NNKNNKNNKNNK
JWU
1.40.09
563212
Sandy loam
65817270.8
35.36.80.39
611821
Sandy clay loam
64518501.4
32.47.40.47
393031
Clay loam
63
Particle Size
SAR
pH and EC (Saturated Paste)
Particle Size
SAR
pH and EC (Saturated Paste)
Particle Size
SAR
0.10.02
111
5232
0.1
0.10.10.01
111
5232
0.1
0.10.10.01
111
5
Matrix:
Matrix:
Matrix:
R593441R593482
R591527R591527R591527R591527
R591331R591331R591331R591331R591331
R591423R591423R591423
R591527R591527R591527R591527
R591331R591331R591331R591331R591331
R591423R591423R591423
R591527R591527R591527R591527
R591331
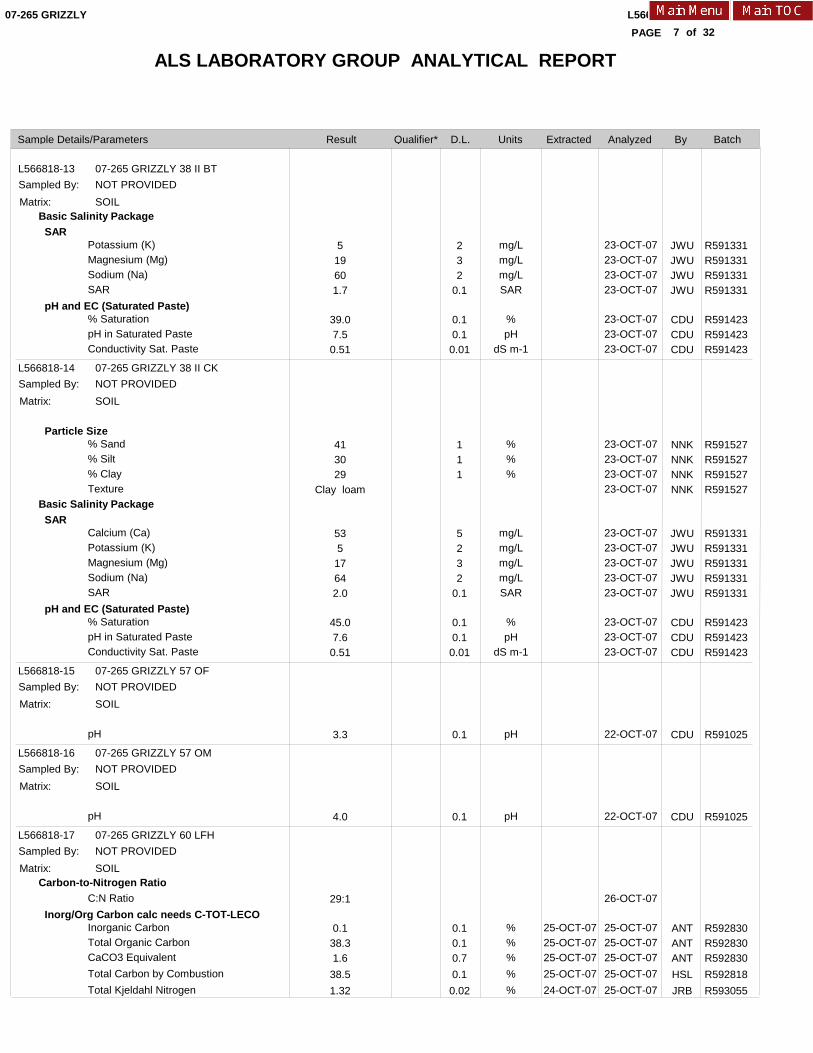
ALS LABORATORY GROUP ANALYTICAL REPORT
L566818 CONTD....
7PAGE
Result D.L. Units Extracted Analyzed BySample Details/Parameters
of
07-265 GRIZZLY
Qualifier* Batch
32
L566818-13
L566818-14
L566818-15
L566818-16
L566818-17
07-265 GRIZZLY 38 II BT
07-265 GRIZZLY 38 II CK
07-265 GRIZZLY 57 OF
07-265 GRIZZLY 57 OM
07-265 GRIZZLY 60 LFH
NOT PROVIDED
NOT PROVIDED
NOT PROVIDED
NOT PROVIDED
NOT PROVIDED
Sampled By:
Sampled By:
Sampled By:
Sampled By:
Sampled By:
SOIL
SOIL
SOIL
SOIL
SOIL
Basic Salinity Package
Basic Salinity Package
Carbon-to-Nitrogen Ratio
Potassium (K)Magnesium (Mg)Sodium (Na)SAR
% SaturationpH in Saturated PasteConductivity Sat. Paste
% Sand% Silt% ClayTexture
Calcium (Ca)Potassium (K)Magnesium (Mg)Sodium (Na)SAR
% SaturationpH in Saturated PasteConductivity Sat. Paste
pH
pH
C:N Ratio
Inorganic CarbonTotal Organic CarbonCaCO3 EquivalentTotal Carbon by CombustionTotal Kjeldahl Nitrogen
mg/Lmg/Lmg/LSAR
%pH
dS m-1
%%%
mg/Lmg/Lmg/Lmg/LSAR
%pH
dS m-1
pH
pH
%%%%%
25-OCT-0725-OCT-0725-OCT-0725-OCT-0724-OCT-07
23-OCT-0723-OCT-0723-OCT-0723-OCT-07
23-OCT-0723-OCT-0723-OCT-07
23-OCT-0723-OCT-0723-OCT-0723-OCT-07
23-OCT-0723-OCT-0723-OCT-0723-OCT-0723-OCT-07
23-OCT-0723-OCT-0723-OCT-07
22-OCT-07
22-OCT-07
26-OCT-07
25-OCT-0725-OCT-0725-OCT-0725-OCT-0725-OCT-07
JWUJWUJWUJWU
CDUCDUCDU
NNKNNKNNKNNK
JWUJWUJWUJWUJWU
CDUCDUCDU
CDU
CDU
ANTANTANTHSLJRB
519601.7
39.07.50.51
413029
Clay loam
53517642.0
45.07.60.51
3.3
4.0
29:1
0.138.31.638.51.32
SAR
pH and EC (Saturated Paste)
Particle Size
SAR
pH and EC (Saturated Paste)
Inorg/Org Carbon calc needs C-TOT-LECO
232
0.1
0.10.10.01
111
5232
0.1
0.10.10.01
0.1
0.1
0.10.10.70.10.02
Matrix:
Matrix:
Matrix:
Matrix:
Matrix:
R591331R591331R591331R591331
R591423R591423R591423
R591527R591527R591527R591527
R591331R591331R591331R591331R591331
R591423R591423R591423
R591025
R591025
R592830R592830R592830R592818R593055
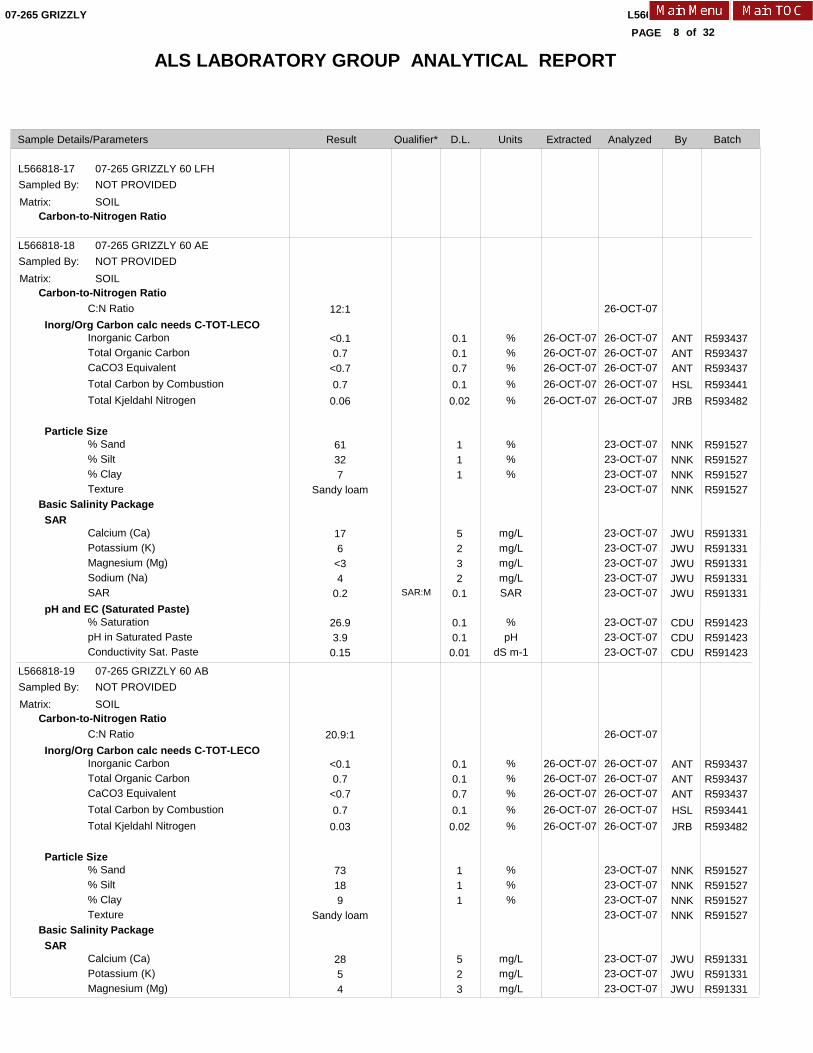
ALS LABORATORY GROUP ANALYTICAL REPORT
L566818 CONTD....
8PAGE
Result D.L. Units Extracted Analyzed BySample Details/Parameters
of
07-265 GRIZZLY
Qualifier* Batch
32
L566818-17
L566818-18
L566818-19
07-265 GRIZZLY 60 LFH
07-265 GRIZZLY 60 AE
07-265 GRIZZLY 60 AB
NOT PROVIDED
NOT PROVIDED
NOT PROVIDED
Sampled By:
Sampled By:
Sampled By:
SOIL
SOIL
SOIL
Carbon-to-Nitrogen Ratio
Carbon-to-Nitrogen Ratio
Basic Salinity Package
Carbon-to-Nitrogen Ratio
Basic Salinity Package
C:N Ratio
Inorganic CarbonTotal Organic CarbonCaCO3 EquivalentTotal Carbon by CombustionTotal Kjeldahl Nitrogen
% Sand% Silt% ClayTexture
Calcium (Ca)Potassium (K)Magnesium (Mg)Sodium (Na)SAR
% SaturationpH in Saturated PasteConductivity Sat. Paste
C:N Ratio
Inorganic CarbonTotal Organic CarbonCaCO3 EquivalentTotal Carbon by CombustionTotal Kjeldahl Nitrogen
% Sand% Silt% ClayTexture
Calcium (Ca)Potassium (K)Magnesium (Mg)
%%%%%
%%%
mg/Lmg/Lmg/Lmg/LSAR
%pH
dS m-1
%%%%%
%%%
mg/Lmg/Lmg/L
26-OCT-0726-OCT-0726-OCT-0726-OCT-0726-OCT-07
26-OCT-0726-OCT-0726-OCT-0726-OCT-0726-OCT-07
26-OCT-07
26-OCT-0726-OCT-0726-OCT-0726-OCT-0726-OCT-07
23-OCT-0723-OCT-0723-OCT-0723-OCT-07
23-OCT-0723-OCT-0723-OCT-0723-OCT-0723-OCT-07
23-OCT-0723-OCT-0723-OCT-07
26-OCT-07
26-OCT-0726-OCT-0726-OCT-0726-OCT-0726-OCT-07
23-OCT-0723-OCT-0723-OCT-0723-OCT-07
23-OCT-0723-OCT-0723-OCT-07
ANTANTANTHSLJRB
NNKNNKNNKNNK
JWUJWUJWUJWUJWU
CDUCDUCDU
ANTANTANTHSLJRB
NNKNNKNNKNNK
JWUJWUJWU
12:1
<0.10.7
<0.70.70.06
61327
Sandy loam
176
<34
0.2
26.93.90.15
20.9:1
<0.10.7
<0.70.70.03
73189
Sandy loam
2854
Inorg/Org Carbon calc needs C-TOT-LECO
Particle Size
SAR
pH and EC (Saturated Paste)
Inorg/Org Carbon calc needs C-TOT-LECO
Particle Size
SAR
0.10.10.70.10.02
111
5232
0.1
0.10.10.01
0.10.10.70.10.02
111
523
Matrix:
Matrix:
Matrix:
SAR:M
R593437R593437R593437R593441R593482
R591527R591527R591527R591527
R591331R591331R591331R591331R591331
R591423R591423R591423
R593437R593437R593437R593441R593482
R591527R591527R591527R591527
R591331R591331R591331
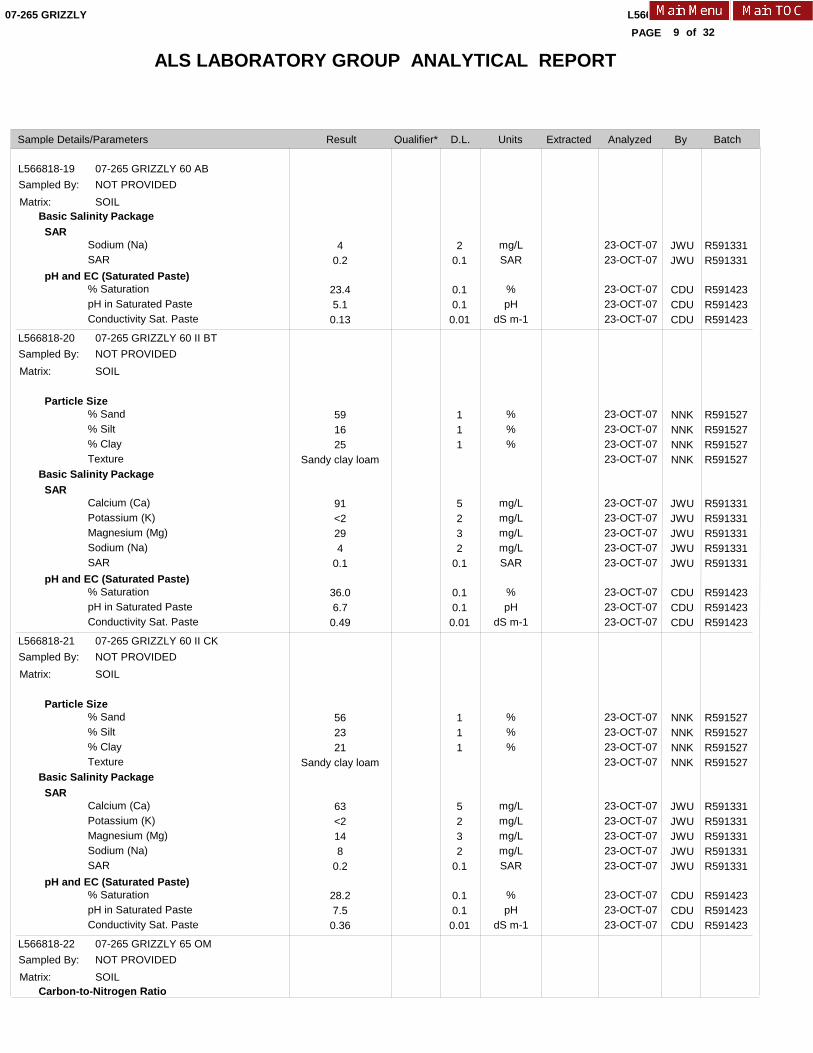
ALS LABORATORY GROUP ANALYTICAL REPORT
L566818 CONTD....
9PAGE
Result D.L. Units Extracted Analyzed BySample Details/Parameters
of
07-265 GRIZZLY
Qualifier* Batch
32
L566818-19
L566818-20
L566818-21
L566818-22
07-265 GRIZZLY 60 AB
07-265 GRIZZLY 60 II BT
07-265 GRIZZLY 60 II CK
07-265 GRIZZLY 65 OM
NOT PROVIDED
NOT PROVIDED
NOT PROVIDED
NOT PROVIDED
Sampled By:
Sampled By:
Sampled By:
Sampled By:
SOIL
SOIL
SOIL
SOIL
Basic Salinity Package
Basic Salinity Package
Basic Salinity Package
Carbon-to-Nitrogen Ratio
Sodium (Na)SAR
% SaturationpH in Saturated PasteConductivity Sat. Paste
% Sand% Silt% ClayTexture
Calcium (Ca)Potassium (K)Magnesium (Mg)Sodium (Na)SAR
% SaturationpH in Saturated PasteConductivity Sat. Paste
% Sand% Silt% ClayTexture
Calcium (Ca)Potassium (K)Magnesium (Mg)Sodium (Na)SAR
% SaturationpH in Saturated PasteConductivity Sat. Paste
mg/LSAR
%pH
dS m-1
%%%
mg/Lmg/Lmg/Lmg/LSAR
%pH
dS m-1
%%%
mg/Lmg/Lmg/Lmg/LSAR
%pH
dS m-1
23-OCT-0723-OCT-07
23-OCT-0723-OCT-0723-OCT-07
23-OCT-0723-OCT-0723-OCT-0723-OCT-07
23-OCT-0723-OCT-0723-OCT-0723-OCT-0723-OCT-07
23-OCT-0723-OCT-0723-OCT-07
23-OCT-0723-OCT-0723-OCT-0723-OCT-07
23-OCT-0723-OCT-0723-OCT-0723-OCT-0723-OCT-07
23-OCT-0723-OCT-0723-OCT-07
JWUJWU
CDUCDUCDU
NNKNNKNNKNNK
JWUJWUJWUJWUJWU
CDUCDUCDU
NNKNNKNNKNNK
JWUJWUJWUJWUJWU
CDUCDUCDU
40.2
23.45.10.13
591625
Sandy clay loam
91<2294
0.1
36.06.70.49
562321
Sandy clay loam
63<2148
0.2
28.27.50.36
SAR
pH and EC (Saturated Paste)
Particle Size
SAR
pH and EC (Saturated Paste)
Particle Size
SAR
pH and EC (Saturated Paste)
20.1
0.10.10.01
111
5232
0.1
0.10.10.01
111
5232
0.1
0.10.10.01
Matrix:
Matrix:
Matrix:
Matrix:
R591331R591331
R591423R591423R591423
R591527R591527R591527R591527
R591331R591331R591331R591331R591331
R591423R591423R591423
R591527R591527R591527R591527
R591331R591331R591331R591331R591331
R591423R591423R591423
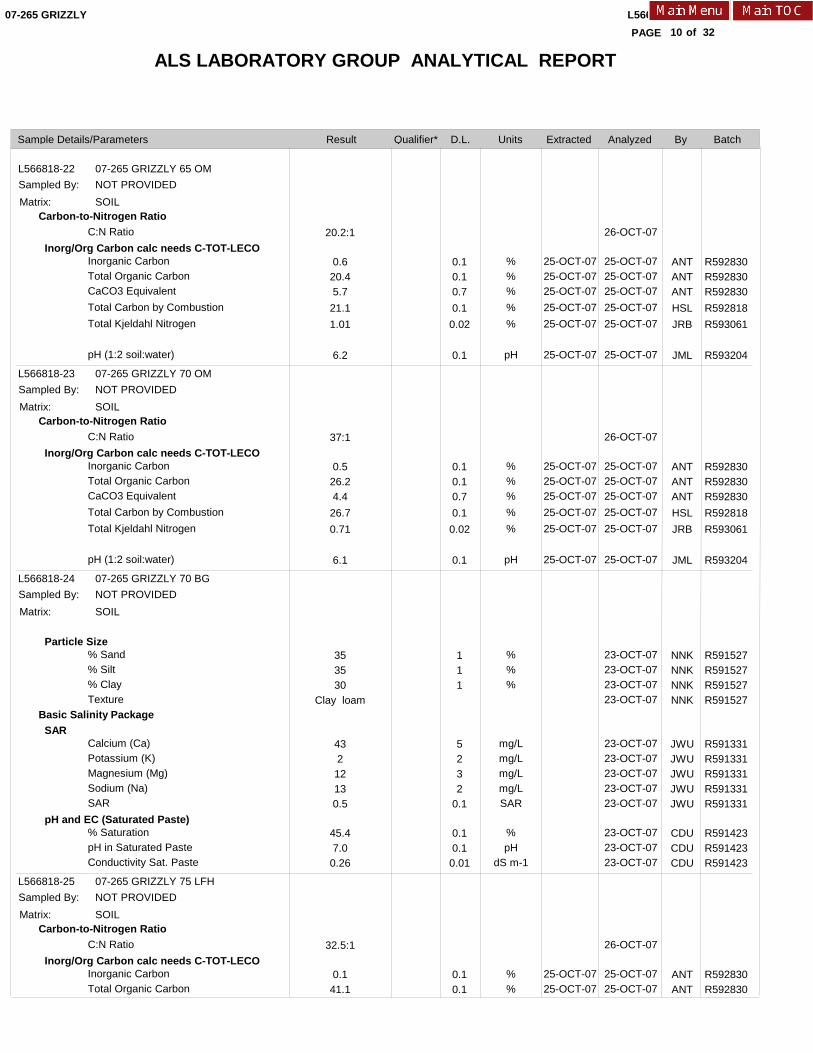
ALS LABORATORY GROUP ANALYTICAL REPORT
L566818 CONTD....
10PAGE
Result D.L. Units Extracted Analyzed BySample Details/Parameters
of
07-265 GRIZZLY
Qualifier* Batch
32
L566818-22
L566818-23
L566818-24
L566818-25
07-265 GRIZZLY 65 OM
07-265 GRIZZLY 70 OM
07-265 GRIZZLY 70 BG
07-265 GRIZZLY 75 LFH
NOT PROVIDED
NOT PROVIDED
NOT PROVIDED
NOT PROVIDED
Sampled By:
Sampled By:
Sampled By:
Sampled By:
SOIL
SOIL
SOIL
SOIL
Carbon-to-Nitrogen Ratio
Carbon-to-Nitrogen Ratio
Basic Salinity Package
Carbon-to-Nitrogen Ratio
C:N Ratio
Inorganic CarbonTotal Organic CarbonCaCO3 EquivalentTotal Carbon by CombustionTotal Kjeldahl Nitrogen
pH (1:2 soil:water)
C:N Ratio
Inorganic CarbonTotal Organic CarbonCaCO3 EquivalentTotal Carbon by CombustionTotal Kjeldahl Nitrogen
pH (1:2 soil:water)
% Sand% Silt% ClayTexture
Calcium (Ca)Potassium (K)Magnesium (Mg)Sodium (Na)SAR
% SaturationpH in Saturated PasteConductivity Sat. Paste
C:N Ratio
Inorganic CarbonTotal Organic Carbon
%%%%%
pH
%%%%%
pH
%%%
mg/Lmg/Lmg/Lmg/LSAR
%pH
dS m-1
%%
25-OCT-0725-OCT-0725-OCT-0725-OCT-0725-OCT-07
25-OCT-07
25-OCT-0725-OCT-0725-OCT-0725-OCT-0725-OCT-07
25-OCT-07
25-OCT-0725-OCT-07
26-OCT-07
25-OCT-0725-OCT-0725-OCT-0725-OCT-0725-OCT-07
25-OCT-07
26-OCT-07
25-OCT-0725-OCT-0725-OCT-0725-OCT-0725-OCT-07
25-OCT-07
23-OCT-0723-OCT-0723-OCT-0723-OCT-07
23-OCT-0723-OCT-0723-OCT-0723-OCT-0723-OCT-07
23-OCT-0723-OCT-0723-OCT-07
26-OCT-07
25-OCT-0725-OCT-07
ANTANTANTHSLJRB
JML
ANTANTANTHSLJRB
JML
NNKNNKNNKNNK
JWUJWUJWUJWUJWU
CDUCDUCDU
ANTANT
20.2:1
0.620.45.721.11.01
6.2
37:1
0.526.24.426.70.71
6.1
353530
Clay loam
43212130.5
45.47.00.26
32.5:1
0.141.1
Inorg/Org Carbon calc needs C-TOT-LECO
Inorg/Org Carbon calc needs C-TOT-LECO
Particle Size
SAR
pH and EC (Saturated Paste)
Inorg/Org Carbon calc needs C-TOT-LECO
0.10.10.70.10.02
0.1
0.10.10.70.10.02
0.1
111
5232
0.1
0.10.10.01
0.10.1
Matrix:
Matrix:
Matrix:
Matrix:
R592830R592830R592830R592818R593061
R593204
R592830R592830R592830R592818R593061
R593204
R591527R591527R591527R591527
R591331R591331R591331R591331R591331
R591423R591423R591423
R592830R592830
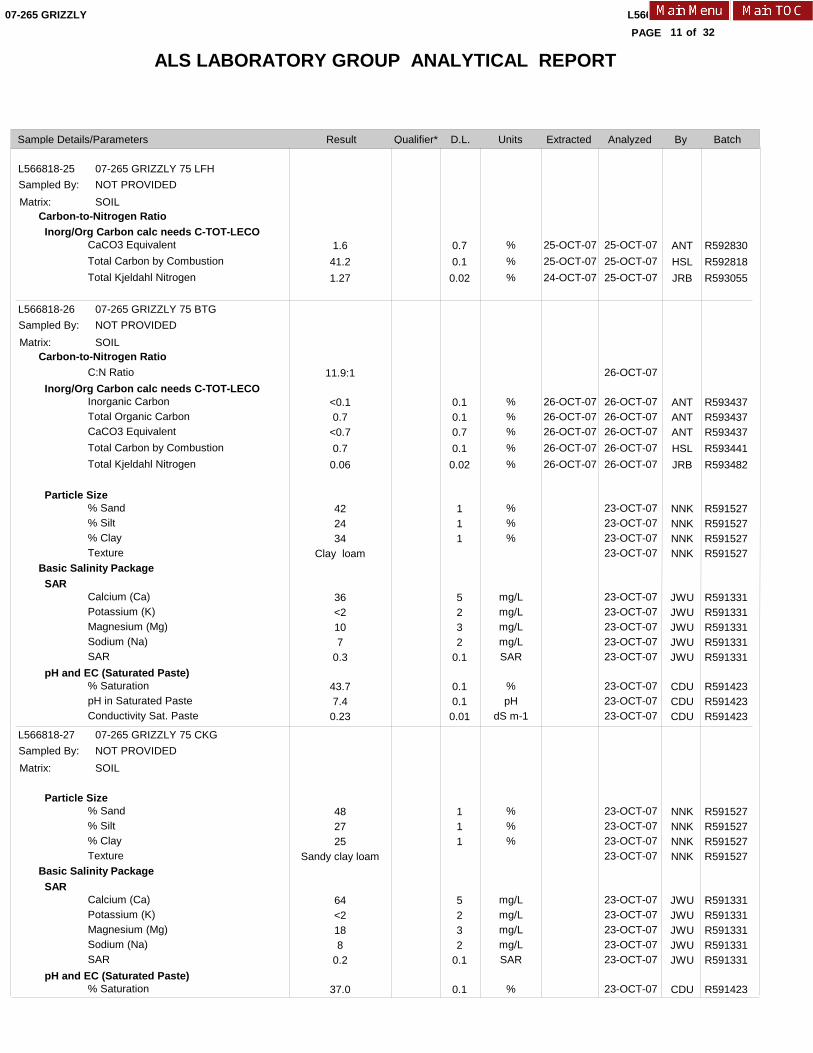
ALS LABORATORY GROUP ANALYTICAL REPORT
L566818 CONTD....
11PAGE
Result D.L. Units Extracted Analyzed BySample Details/Parameters
of
07-265 GRIZZLY
Qualifier* Batch
32
L566818-25
L566818-26
L566818-27
07-265 GRIZZLY 75 LFH
07-265 GRIZZLY 75 BTG
07-265 GRIZZLY 75 CKG
NOT PROVIDED
NOT PROVIDED
NOT PROVIDED
Sampled By:
Sampled By:
Sampled By:
SOIL
SOIL
SOIL
Carbon-to-Nitrogen Ratio
Carbon-to-Nitrogen Ratio
Basic Salinity Package
Basic Salinity Package
CaCO3 EquivalentTotal Carbon by CombustionTotal Kjeldahl Nitrogen
C:N Ratio
Inorganic CarbonTotal Organic CarbonCaCO3 EquivalentTotal Carbon by CombustionTotal Kjeldahl Nitrogen
% Sand% Silt% ClayTexture
Calcium (Ca)Potassium (K)Magnesium (Mg)Sodium (Na)SAR
% SaturationpH in Saturated PasteConductivity Sat. Paste
% Sand% Silt% ClayTexture
Calcium (Ca)Potassium (K)Magnesium (Mg)Sodium (Na)SAR
% Saturation
%%%
%%%%%
%%%
mg/Lmg/Lmg/Lmg/LSAR
%pH
dS m-1
%%%
mg/Lmg/Lmg/Lmg/LSAR
%
25-OCT-0725-OCT-0724-OCT-07
26-OCT-0726-OCT-0726-OCT-0726-OCT-0726-OCT-07
25-OCT-0725-OCT-0725-OCT-07
26-OCT-07
26-OCT-0726-OCT-0726-OCT-0726-OCT-0726-OCT-07
23-OCT-0723-OCT-0723-OCT-0723-OCT-07
23-OCT-0723-OCT-0723-OCT-0723-OCT-0723-OCT-07
23-OCT-0723-OCT-0723-OCT-07
23-OCT-0723-OCT-0723-OCT-0723-OCT-07
23-OCT-0723-OCT-0723-OCT-0723-OCT-0723-OCT-07
23-OCT-07
ANTHSLJRB
ANTANTANTHSLJRB
NNKNNKNNKNNK
JWUJWUJWUJWUJWU
CDUCDUCDU
NNKNNKNNKNNK
JWUJWUJWUJWUJWU
CDU
1.641.21.27
11.9:1
<0.10.7
<0.70.70.06
422434
Clay loam
36<2107
0.3
43.77.40.23
482725
Sandy clay loam
64<2188
0.2
37.0
Inorg/Org Carbon calc needs C-TOT-LECO
Inorg/Org Carbon calc needs C-TOT-LECO
Particle Size
SAR
pH and EC (Saturated Paste)
Particle Size
SAR
pH and EC (Saturated Paste)
0.70.10.02
0.10.10.70.10.02
111
5232
0.1
0.10.10.01
111
5232
0.1
0.1
Matrix:
Matrix:
Matrix:
R592830R592818R593055
R593437R593437R593437R593441R593482
R591527R591527R591527R591527
R591331R591331R591331R591331R591331
R591423R591423R591423
R591527R591527R591527R591527
R591331R591331R591331R591331R591331
R591423
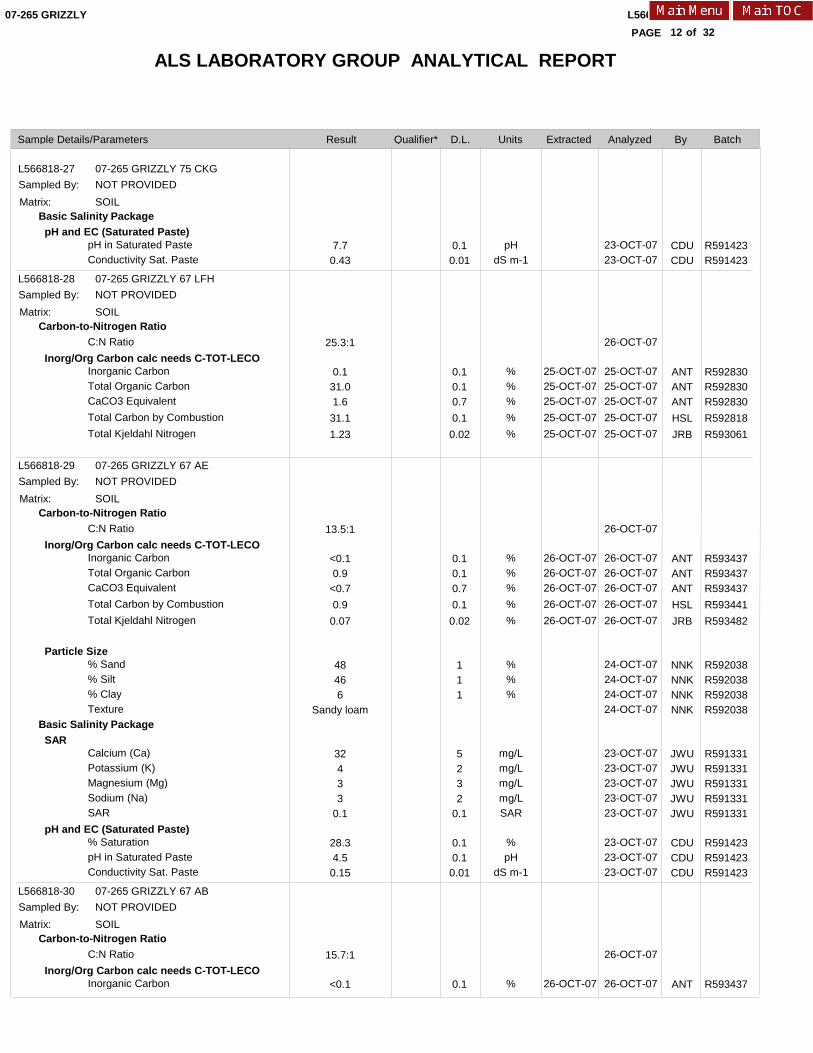
ALS LABORATORY GROUP ANALYTICAL REPORT
L566818 CONTD....
12PAGE
Result D.L. Units Extracted Analyzed BySample Details/Parameters
of
07-265 GRIZZLY
Qualifier* Batch
32
L566818-27
L566818-28
L566818-29
L566818-30
07-265 GRIZZLY 75 CKG
07-265 GRIZZLY 67 LFH
07-265 GRIZZLY 67 AE
07-265 GRIZZLY 67 AB
NOT PROVIDED
NOT PROVIDED
NOT PROVIDED
NOT PROVIDED
Sampled By:
Sampled By:
Sampled By:
Sampled By:
SOIL
SOIL
SOIL
SOIL
Basic Salinity Package
Carbon-to-Nitrogen Ratio
Carbon-to-Nitrogen Ratio
Basic Salinity Package
Carbon-to-Nitrogen Ratio
pH in Saturated PasteConductivity Sat. Paste
C:N Ratio
Inorganic CarbonTotal Organic CarbonCaCO3 EquivalentTotal Carbon by CombustionTotal Kjeldahl Nitrogen
C:N Ratio
Inorganic CarbonTotal Organic CarbonCaCO3 EquivalentTotal Carbon by CombustionTotal Kjeldahl Nitrogen
% Sand% Silt% ClayTexture
Calcium (Ca)Potassium (K)Magnesium (Mg)Sodium (Na)SAR
% SaturationpH in Saturated PasteConductivity Sat. Paste
C:N Ratio
Inorganic Carbon
pHdS m-1
%%%%%
%%%%%
%%%
mg/Lmg/Lmg/Lmg/LSAR
%pH
dS m-1
%
25-OCT-0725-OCT-0725-OCT-0725-OCT-0725-OCT-07
26-OCT-0726-OCT-0726-OCT-0726-OCT-0726-OCT-07
26-OCT-07
23-OCT-0723-OCT-07
26-OCT-07
25-OCT-0725-OCT-0725-OCT-0725-OCT-0725-OCT-07
26-OCT-07
26-OCT-0726-OCT-0726-OCT-0726-OCT-0726-OCT-07
24-OCT-0724-OCT-0724-OCT-0724-OCT-07
23-OCT-0723-OCT-0723-OCT-0723-OCT-0723-OCT-07
23-OCT-0723-OCT-0723-OCT-07
26-OCT-07
26-OCT-07
CDUCDU
ANTANTANTHSLJRB
ANTANTANTHSLJRB
NNKNNKNNKNNK
JWUJWUJWUJWUJWU
CDUCDUCDU
ANT
7.70.43
25.3:1
0.131.01.631.11.23
13.5:1
<0.10.9
<0.70.90.07
48466
Sandy loam
32433
0.1
28.34.50.15
15.7:1
<0.1
pH and EC (Saturated Paste)
Inorg/Org Carbon calc needs C-TOT-LECO
Inorg/Org Carbon calc needs C-TOT-LECO
Particle Size
SAR
pH and EC (Saturated Paste)
Inorg/Org Carbon calc needs C-TOT-LECO
0.10.01
0.10.10.70.10.02
0.10.10.70.10.02
111
5232
0.1
0.10.10.01
0.1
Matrix:
Matrix:
Matrix:
Matrix:
R591423R591423
R592830R592830R592830R592818R593061
R593437R593437R593437R593441R593482
R592038R592038R592038R592038
R591331R591331R591331R591331R591331
R591423R591423R591423
R593437
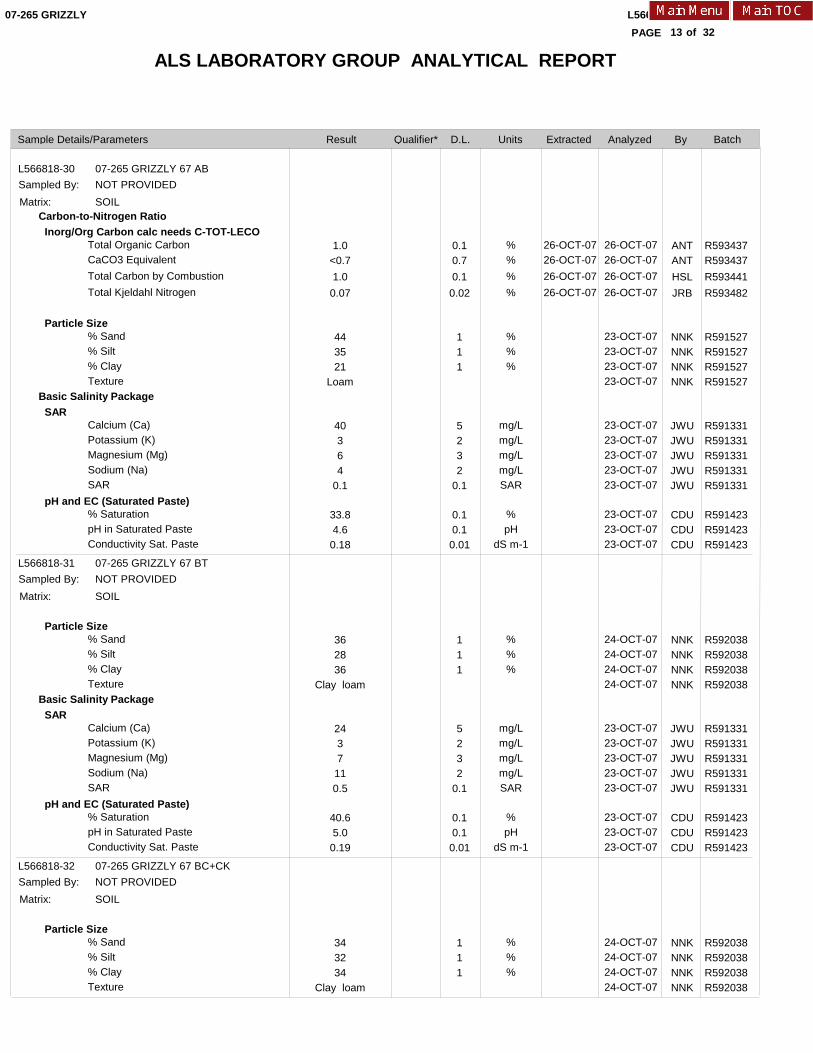
ALS LABORATORY GROUP ANALYTICAL REPORT
L566818 CONTD....
13PAGE
Result D.L. Units Extracted Analyzed BySample Details/Parameters
of
07-265 GRIZZLY
Qualifier* Batch
32
L566818-30
L566818-31
L566818-32
07-265 GRIZZLY 67 AB
07-265 GRIZZLY 67 BT
07-265 GRIZZLY 67 BC+CK
NOT PROVIDED
NOT PROVIDED
NOT PROVIDED
Sampled By:
Sampled By:
Sampled By:
SOIL
SOIL
SOIL
Carbon-to-Nitrogen Ratio
Basic Salinity Package
Basic Salinity Package
Total Organic CarbonCaCO3 EquivalentTotal Carbon by CombustionTotal Kjeldahl Nitrogen
% Sand% Silt% ClayTexture
Calcium (Ca)Potassium (K)Magnesium (Mg)Sodium (Na)SAR
% SaturationpH in Saturated PasteConductivity Sat. Paste
% Sand% Silt% ClayTexture
Calcium (Ca)Potassium (K)Magnesium (Mg)Sodium (Na)SAR
% SaturationpH in Saturated PasteConductivity Sat. Paste
% Sand% Silt% ClayTexture
%%%%
%%%
mg/Lmg/Lmg/Lmg/LSAR
%pH
dS m-1
%%%
mg/Lmg/Lmg/Lmg/LSAR
%pH
dS m-1
%%%
26-OCT-0726-OCT-0726-OCT-0726-OCT-07
26-OCT-0726-OCT-0726-OCT-0726-OCT-07
23-OCT-0723-OCT-0723-OCT-0723-OCT-07
23-OCT-0723-OCT-0723-OCT-0723-OCT-0723-OCT-07
23-OCT-0723-OCT-0723-OCT-07
24-OCT-0724-OCT-0724-OCT-0724-OCT-07
23-OCT-0723-OCT-0723-OCT-0723-OCT-0723-OCT-07
23-OCT-0723-OCT-0723-OCT-07
24-OCT-0724-OCT-0724-OCT-0724-OCT-07
ANTANTHSLJRB
NNKNNKNNKNNK
JWUJWUJWUJWUJWU
CDUCDUCDU
NNKNNKNNKNNK
JWUJWUJWUJWUJWU
CDUCDUCDU
NNKNNKNNKNNK
1.0<0.71.00.07
443521
Loam
40364
0.1
33.84.60.18
362836
Clay loam
2437110.5
40.65.00.19
343234
Clay loam
Inorg/Org Carbon calc needs C-TOT-LECO
Particle Size
SAR
pH and EC (Saturated Paste)
Particle Size
SAR
pH and EC (Saturated Paste)
Particle Size
0.10.70.10.02
111
5232
0.1
0.10.10.01
111
5232
0.1
0.10.10.01
111
Matrix:
Matrix:
Matrix:
R593437R593437R593441R593482
R591527R591527R591527R591527
R591331R591331R591331R591331R591331
R591423R591423R591423
R592038R592038R592038R592038
R591331R591331R591331R591331R591331
R591423R591423R591423
R592038R592038R592038R592038
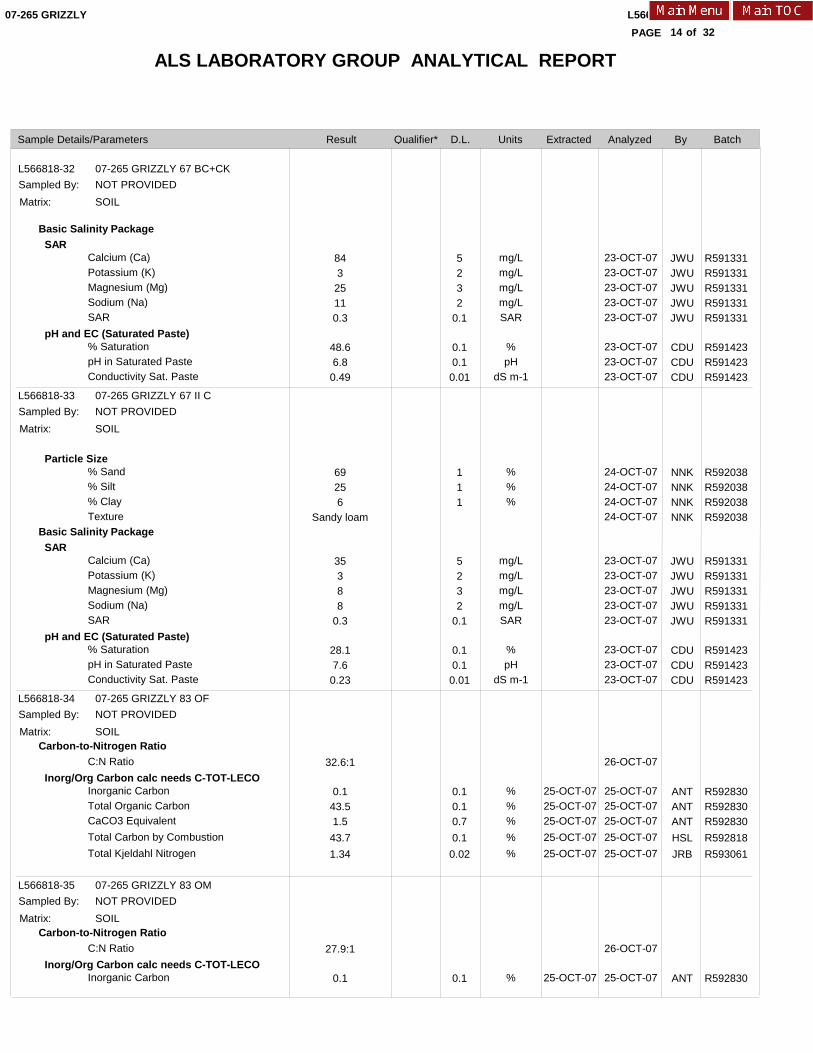
ALS LABORATORY GROUP ANALYTICAL REPORT
L566818 CONTD....
14PAGE
Result D.L. Units Extracted Analyzed BySample Details/Parameters
of
07-265 GRIZZLY
Qualifier* Batch
32
L566818-32
L566818-33
L566818-34
L566818-35
07-265 GRIZZLY 67 BC+CK
07-265 GRIZZLY 67 II C
07-265 GRIZZLY 83 OF
07-265 GRIZZLY 83 OM
NOT PROVIDED
NOT PROVIDED
NOT PROVIDED
NOT PROVIDED
Sampled By:
Sampled By:
Sampled By:
Sampled By:
SOIL
SOIL
SOIL
SOIL
Basic Salinity Package
Basic Salinity Package
Carbon-to-Nitrogen Ratio
Carbon-to-Nitrogen Ratio
Calcium (Ca)Potassium (K)Magnesium (Mg)Sodium (Na)SAR
% SaturationpH in Saturated PasteConductivity Sat. Paste
% Sand% Silt% ClayTexture
Calcium (Ca)Potassium (K)Magnesium (Mg)Sodium (Na)SAR
% SaturationpH in Saturated PasteConductivity Sat. Paste
C:N Ratio
Inorganic CarbonTotal Organic CarbonCaCO3 EquivalentTotal Carbon by CombustionTotal Kjeldahl Nitrogen
C:N Ratio
Inorganic Carbon
mg/Lmg/Lmg/Lmg/LSAR
%pH
dS m-1
%%%
mg/Lmg/Lmg/Lmg/LSAR
%pH
dS m-1
%%%%%
%
25-OCT-0725-OCT-0725-OCT-0725-OCT-0725-OCT-07
25-OCT-07
23-OCT-0723-OCT-0723-OCT-0723-OCT-0723-OCT-07
23-OCT-0723-OCT-0723-OCT-07
24-OCT-0724-OCT-0724-OCT-0724-OCT-07
23-OCT-0723-OCT-0723-OCT-0723-OCT-0723-OCT-07
23-OCT-0723-OCT-0723-OCT-07
26-OCT-07
25-OCT-0725-OCT-0725-OCT-0725-OCT-0725-OCT-07
26-OCT-07
25-OCT-07
JWUJWUJWUJWUJWU
CDUCDUCDU
NNKNNKNNKNNK
JWUJWUJWUJWUJWU
CDUCDUCDU
ANTANTANTHSLJRB
ANT
84325110.3
48.66.80.49
69256
Sandy loam
35388
0.3
28.17.60.23
32.6:1
0.143.51.543.71.34
27.9:1
0.1
SAR
pH and EC (Saturated Paste)
Particle Size
SAR
pH and EC (Saturated Paste)
Inorg/Org Carbon calc needs C-TOT-LECO
Inorg/Org Carbon calc needs C-TOT-LECO
5232
0.1
0.10.10.01
111
5232
0.1
0.10.10.01
0.10.10.70.10.02
0.1
Matrix:
Matrix:
Matrix:
Matrix:
R591331R591331R591331R591331R591331
R591423R591423R591423
R592038R592038R592038R592038
R591331R591331R591331R591331R591331
R591423R591423R591423
R592830R592830R592830R592818R593061
R592830
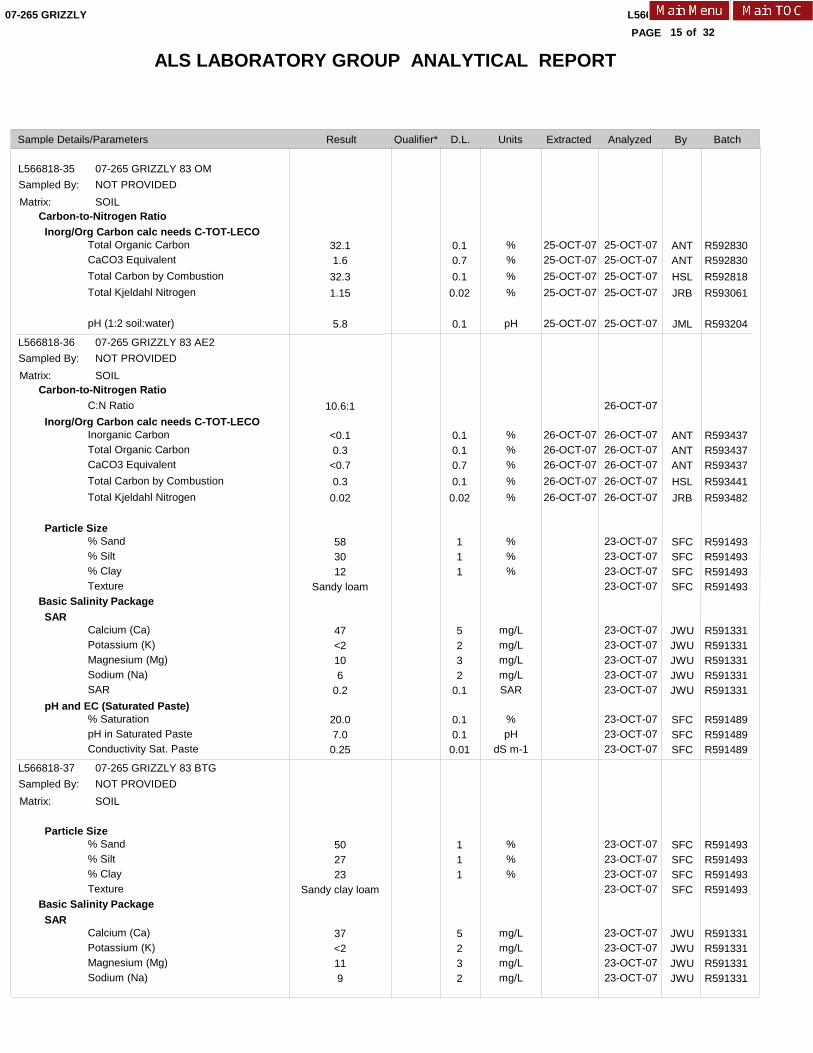
ALS LABORATORY GROUP ANALYTICAL REPORT
L566818 CONTD....
15PAGE
Result D.L. Units Extracted Analyzed BySample Details/Parameters
of
07-265 GRIZZLY
Qualifier* Batch
32
L566818-35
L566818-36
L566818-37
07-265 GRIZZLY 83 OM
07-265 GRIZZLY 83 AE2
07-265 GRIZZLY 83 BTG
NOT PROVIDED
NOT PROVIDED
NOT PROVIDED
Sampled By:
Sampled By:
Sampled By:
SOIL
SOIL
SOIL
Carbon-to-Nitrogen Ratio
Carbon-to-Nitrogen Ratio
Basic Salinity Package
Basic Salinity Package
Total Organic CarbonCaCO3 EquivalentTotal Carbon by CombustionTotal Kjeldahl Nitrogen
pH (1:2 soil:water)
C:N Ratio
Inorganic CarbonTotal Organic CarbonCaCO3 EquivalentTotal Carbon by CombustionTotal Kjeldahl Nitrogen
% Sand% Silt% ClayTexture
Calcium (Ca)Potassium (K)Magnesium (Mg)Sodium (Na)SAR
% SaturationpH in Saturated PasteConductivity Sat. Paste
% Sand% Silt% ClayTexture
Calcium (Ca)Potassium (K)Magnesium (Mg)Sodium (Na)
%%%%
pH
%%%%%
%%%
mg/Lmg/Lmg/Lmg/LSAR
%pH
dS m-1
%%%
mg/Lmg/Lmg/Lmg/L
25-OCT-0725-OCT-0725-OCT-0725-OCT-07
25-OCT-07
26-OCT-0726-OCT-0726-OCT-0726-OCT-0726-OCT-07
25-OCT-0725-OCT-0725-OCT-0725-OCT-07
25-OCT-07
26-OCT-07
26-OCT-0726-OCT-0726-OCT-0726-OCT-0726-OCT-07
23-OCT-0723-OCT-0723-OCT-0723-OCT-07
23-OCT-0723-OCT-0723-OCT-0723-OCT-0723-OCT-07
23-OCT-0723-OCT-0723-OCT-07
23-OCT-0723-OCT-0723-OCT-0723-OCT-07
23-OCT-0723-OCT-0723-OCT-0723-OCT-07
ANTANTHSLJRB
JML
ANTANTANTHSLJRB
SFCSFCSFCSFC
JWUJWUJWUJWUJWU
SFCSFCSFC
SFCSFCSFCSFC
JWUJWUJWUJWU
32.11.632.31.15
5.8
10.6:1
<0.10.3
<0.70.30.02
583012
Sandy loam
47<2106
0.2
20.07.00.25
502723
Sandy clay loam
37<2119
Inorg/Org Carbon calc needs C-TOT-LECO
Inorg/Org Carbon calc needs C-TOT-LECO
Particle Size
SAR
pH and EC (Saturated Paste)
Particle Size
SAR
0.10.70.10.02
0.1
0.10.10.70.10.02
111
5232
0.1
0.10.10.01
111
5232
Matrix:
Matrix:
Matrix:
R592830R592830R592818R593061
R593204
R593437R593437R593437R593441R593482
R591493R591493R591493R591493
R591331R591331R591331R591331R591331
R591489R591489R591489
R591493R591493R591493R591493
R591331R591331R591331R591331

ALS LABORATORY GROUP ANALYTICAL REPORT
L566818 CONTD....
16PAGE
Result D.L. Units Extracted Analyzed BySample Details/Parameters
of
07-265 GRIZZLY
Qualifier* Batch
32
L566818-37
L566818-38
L566818-39
L566818-40
07-265 GRIZZLY 83 BTG
07-265 GRIZZLY 83 CKG
07-265 GRIZZLY 95 OM
07-265 GRIZZLY 95 BG
NOT PROVIDED
NOT PROVIDED
NOT PROVIDED
NOT PROVIDED
Sampled By:
Sampled By:
Sampled By:
Sampled By:
SOIL
SOIL
SOIL
SOIL
Basic Salinity Package
Basic Salinity Package
Carbon-to-Nitrogen Ratio
Basic Salinity Package
SAR
% SaturationpH in Saturated PasteConductivity Sat. Paste
% Sand% Silt% ClayTexture
Calcium (Ca)Potassium (K)Magnesium (Mg)Sodium (Na)SAR
% SaturationpH in Saturated PasteConductivity Sat. Paste
C:N Ratio
Inorganic CarbonTotal Organic CarbonCaCO3 EquivalentTotal Carbon by CombustionTotal Kjeldahl Nitrogen
pH (1:2 soil:water)
% Sand% Silt% ClayTexture
SAR
%pH
dS m-1
%%%
mg/Lmg/Lmg/Lmg/LSAR
%pH
dS m-1
%%%%%
pH
%%%
25-OCT-0725-OCT-0725-OCT-0725-OCT-0725-OCT-07
25-OCT-07
23-OCT-07
23-OCT-0723-OCT-0723-OCT-07
23-OCT-0723-OCT-0723-OCT-0723-OCT-07
23-OCT-0723-OCT-0723-OCT-0723-OCT-0723-OCT-07
23-OCT-0723-OCT-0723-OCT-07
26-OCT-07
25-OCT-0725-OCT-0725-OCT-0725-OCT-0725-OCT-07
25-OCT-07
23-OCT-0723-OCT-0723-OCT-0723-OCT-07
JWU
SFCSFCSFC
SFCSFCSFCSFC
JWUJWUJWUJWUJWU
SFCSFCSFC
ANTANTANTHSLJRB
JML
SFCSFCSFCSFC
0.3
31.56.90.24
512425
Sandy clay loam
53<2114
0.1
36.27.50.33
29.9:1
<0.136.41.236.41.22
6.8
442531
Clay loam
SAR
pH and EC (Saturated Paste)
Particle Size
SAR
pH and EC (Saturated Paste)
Inorg/Org Carbon calc needs C-TOT-LECO
Particle Size
SAR
0.1
0.10.10.01
111
5232
0.1
0.10.10.01
0.10.10.70.10.02
0.1
111
Matrix:
Matrix:
Matrix:
Matrix:
R591331
R591489R591489R591489
R591493R591493R591493R591493
R591331R591331R591331R591331R591331
R591489R591489R591489
R592830R592830R592830R592818R593061
R593204
R591493R591493R591493R591493
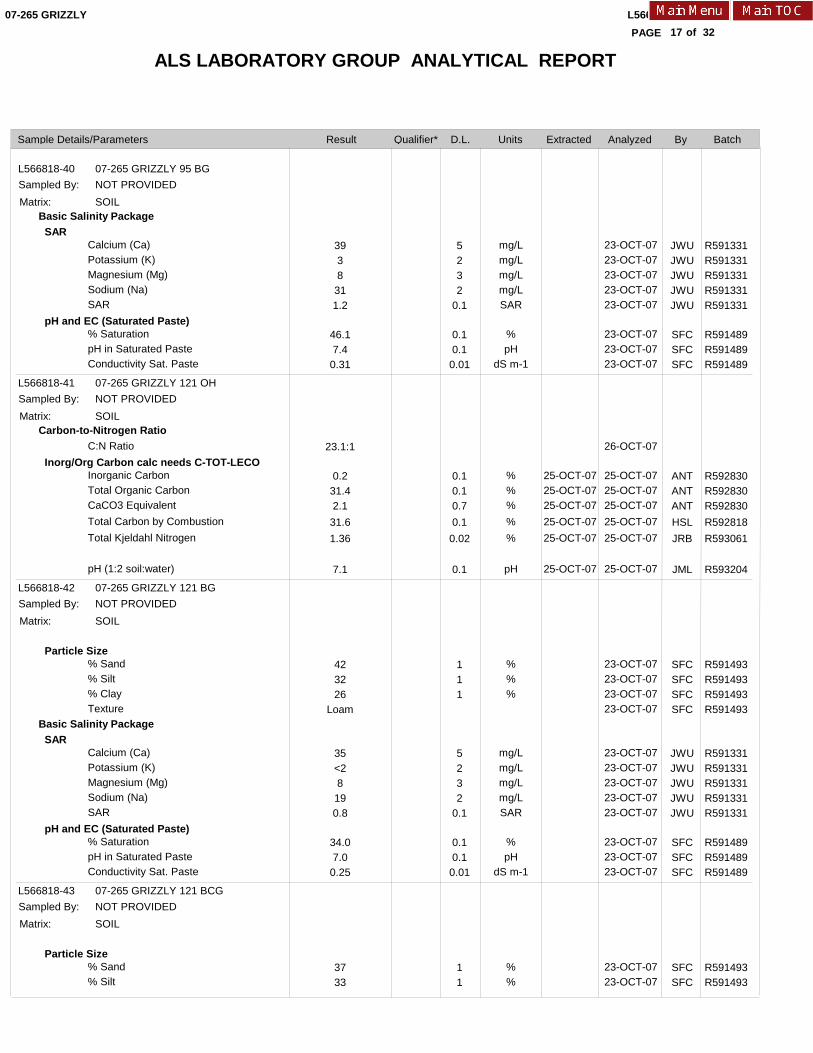
ALS LABORATORY GROUP ANALYTICAL REPORT
L566818 CONTD....
17PAGE
Result D.L. Units Extracted Analyzed BySample Details/Parameters
of
07-265 GRIZZLY
Qualifier* Batch
32
L566818-40
L566818-41
L566818-42
L566818-43
07-265 GRIZZLY 95 BG
07-265 GRIZZLY 121 OH
07-265 GRIZZLY 121 BG
07-265 GRIZZLY 121 BCG
NOT PROVIDED
NOT PROVIDED
NOT PROVIDED
NOT PROVIDED
Sampled By:
Sampled By:
Sampled By:
Sampled By:
SOIL
SOIL
SOIL
SOIL
Basic Salinity Package
Carbon-to-Nitrogen Ratio
Basic Salinity Package
Calcium (Ca)Potassium (K)Magnesium (Mg)Sodium (Na)SAR
% SaturationpH in Saturated PasteConductivity Sat. Paste
C:N Ratio
Inorganic CarbonTotal Organic CarbonCaCO3 EquivalentTotal Carbon by CombustionTotal Kjeldahl Nitrogen
pH (1:2 soil:water)
% Sand% Silt% ClayTexture
Calcium (Ca)Potassium (K)Magnesium (Mg)Sodium (Na)SAR
% SaturationpH in Saturated PasteConductivity Sat. Paste
% Sand% Silt
mg/Lmg/Lmg/Lmg/LSAR
%pH
dS m-1
%%%%%
pH
%%%
mg/Lmg/Lmg/Lmg/LSAR
%pH
dS m-1
%%
25-OCT-0725-OCT-0725-OCT-0725-OCT-0725-OCT-07
25-OCT-07
23-OCT-0723-OCT-0723-OCT-0723-OCT-0723-OCT-07
23-OCT-0723-OCT-0723-OCT-07
26-OCT-07
25-OCT-0725-OCT-0725-OCT-0725-OCT-0725-OCT-07
25-OCT-07
23-OCT-0723-OCT-0723-OCT-0723-OCT-07
23-OCT-0723-OCT-0723-OCT-0723-OCT-0723-OCT-07
23-OCT-0723-OCT-0723-OCT-07
23-OCT-0723-OCT-07
JWUJWUJWUJWUJWU
SFCSFCSFC
ANTANTANTHSLJRB
JML
SFCSFCSFCSFC
JWUJWUJWUJWUJWU
SFCSFCSFC
SFCSFC
3938311.2
46.17.40.31
23.1:1
0.231.42.131.61.36
7.1
423226
Loam
35<28190.8
34.07.00.25
3733
SAR
pH and EC (Saturated Paste)
Inorg/Org Carbon calc needs C-TOT-LECO
Particle Size
SAR
pH and EC (Saturated Paste)
Particle Size
5232
0.1
0.10.10.01
0.10.10.70.10.02
0.1
111
5232
0.1
0.10.10.01
11
Matrix:
Matrix:
Matrix:
Matrix:
R591331R591331R591331R591331R591331
R591489R591489R591489
R592830R592830R592830R592818R593061
R593204
R591493R591493R591493R591493
R591331R591331R591331R591331R591331
R591489R591489R591489
R591493R591493
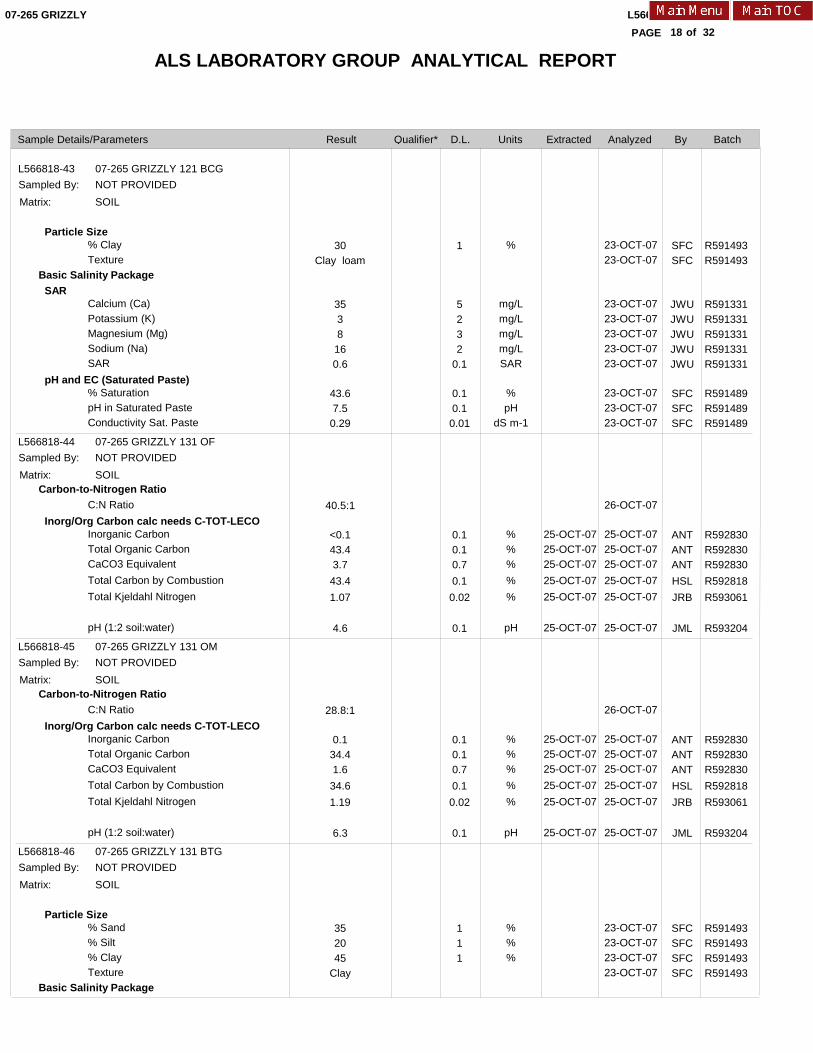
ALS LABORATORY GROUP ANALYTICAL REPORT
L566818 CONTD....
18PAGE
Result D.L. Units Extracted Analyzed BySample Details/Parameters
of
07-265 GRIZZLY
Qualifier* Batch
32
L566818-43
L566818-44
L566818-45
L566818-46
07-265 GRIZZLY 121 BCG
07-265 GRIZZLY 131 OF
07-265 GRIZZLY 131 OM
07-265 GRIZZLY 131 BTG
NOT PROVIDED
NOT PROVIDED
NOT PROVIDED
NOT PROVIDED
Sampled By:
Sampled By:
Sampled By:
Sampled By:
SOIL
SOIL
SOIL
SOIL
Basic Salinity Package
Carbon-to-Nitrogen Ratio
Carbon-to-Nitrogen Ratio
Basic Salinity Package
% ClayTexture
Calcium (Ca)Potassium (K)Magnesium (Mg)Sodium (Na)SAR
% SaturationpH in Saturated PasteConductivity Sat. Paste
C:N Ratio
Inorganic CarbonTotal Organic CarbonCaCO3 EquivalentTotal Carbon by CombustionTotal Kjeldahl Nitrogen
pH (1:2 soil:water)
C:N Ratio
Inorganic CarbonTotal Organic CarbonCaCO3 EquivalentTotal Carbon by CombustionTotal Kjeldahl Nitrogen
pH (1:2 soil:water)
% Sand% Silt% ClayTexture
%
mg/Lmg/Lmg/Lmg/LSAR
%pH
dS m-1
%%%%%
pH
%%%%%
pH
%%%
25-OCT-0725-OCT-0725-OCT-0725-OCT-0725-OCT-07
25-OCT-07
25-OCT-0725-OCT-0725-OCT-0725-OCT-0725-OCT-07
25-OCT-07
23-OCT-0723-OCT-07
23-OCT-0723-OCT-0723-OCT-0723-OCT-0723-OCT-07
23-OCT-0723-OCT-0723-OCT-07
26-OCT-07
25-OCT-0725-OCT-0725-OCT-0725-OCT-0725-OCT-07
25-OCT-07
26-OCT-07
25-OCT-0725-OCT-0725-OCT-0725-OCT-0725-OCT-07
25-OCT-07
23-OCT-0723-OCT-0723-OCT-0723-OCT-07
SFCSFC
JWUJWUJWUJWUJWU
SFCSFCSFC
ANTANTANTHSLJRB
JML
ANTANTANTHSLJRB
JML
SFCSFCSFCSFC
30Clay loam
3538160.6
43.67.50.29
40.5:1
<0.143.43.743.41.07
4.6
28.8:1
0.134.41.634.61.19
6.3
352045
Clay
Particle Size
SAR
pH and EC (Saturated Paste)
Inorg/Org Carbon calc needs C-TOT-LECO
Inorg/Org Carbon calc needs C-TOT-LECO
Particle Size
1
5232
0.1
0.10.10.01
0.10.10.70.10.02
0.1
0.10.10.70.10.02
0.1
111
Matrix:
Matrix:
Matrix:
Matrix:
R591493R591493
R591331R591331R591331R591331R591331
R591489R591489R591489
R592830R592830R592830R592818R593061
R593204
R592830R592830R592830R592818R593061
R593204
R591493R591493R591493R591493
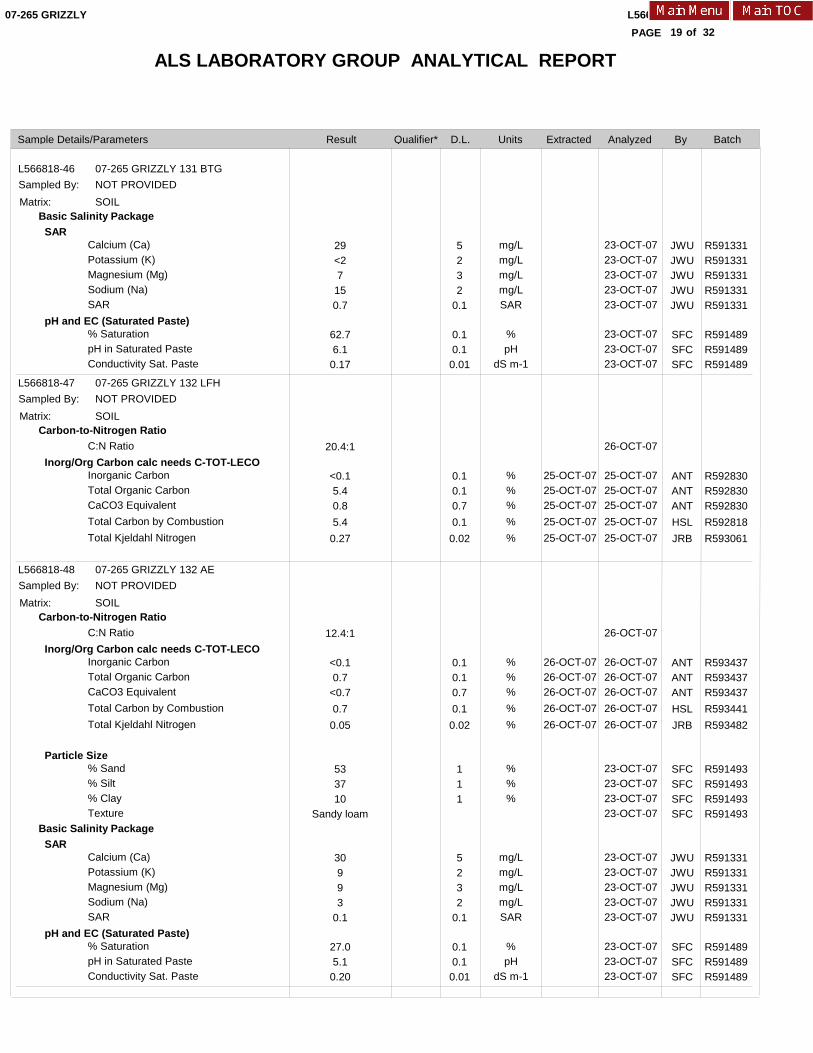
ALS LABORATORY GROUP ANALYTICAL REPORT
L566818 CONTD....
19PAGE
Result D.L. Units Extracted Analyzed BySample Details/Parameters
of
07-265 GRIZZLY
Qualifier* Batch
32
L566818-46
L566818-47
L566818-48
07-265 GRIZZLY 131 BTG
07-265 GRIZZLY 132 LFH
07-265 GRIZZLY 132 AE
NOT PROVIDED
NOT PROVIDED
NOT PROVIDED
Sampled By:
Sampled By:
Sampled By:
SOIL
SOIL
SOIL
Basic Salinity Package
Carbon-to-Nitrogen Ratio
Carbon-to-Nitrogen Ratio
Basic Salinity Package
Calcium (Ca)Potassium (K)Magnesium (Mg)Sodium (Na)SAR
% SaturationpH in Saturated PasteConductivity Sat. Paste
C:N Ratio
Inorganic CarbonTotal Organic CarbonCaCO3 EquivalentTotal Carbon by CombustionTotal Kjeldahl Nitrogen
C:N Ratio
Inorganic CarbonTotal Organic CarbonCaCO3 EquivalentTotal Carbon by CombustionTotal Kjeldahl Nitrogen
% Sand% Silt% ClayTexture
Calcium (Ca)Potassium (K)Magnesium (Mg)Sodium (Na)SAR
% SaturationpH in Saturated PasteConductivity Sat. Paste
mg/Lmg/Lmg/Lmg/LSAR
%pH
dS m-1
%%%%%
%%%%%
%%%
mg/Lmg/Lmg/Lmg/LSAR
%pH
dS m-1
25-OCT-0725-OCT-0725-OCT-0725-OCT-0725-OCT-07
26-OCT-0726-OCT-0726-OCT-0726-OCT-0726-OCT-07
23-OCT-0723-OCT-0723-OCT-0723-OCT-0723-OCT-07
23-OCT-0723-OCT-0723-OCT-07
26-OCT-07
25-OCT-0725-OCT-0725-OCT-0725-OCT-0725-OCT-07
26-OCT-07
26-OCT-0726-OCT-0726-OCT-0726-OCT-0726-OCT-07
23-OCT-0723-OCT-0723-OCT-0723-OCT-07
23-OCT-0723-OCT-0723-OCT-0723-OCT-0723-OCT-07
23-OCT-0723-OCT-0723-OCT-07
JWUJWUJWUJWUJWU
SFCSFCSFC
ANTANTANTHSLJRB
ANTANTANTHSLJRB
SFCSFCSFCSFC
JWUJWUJWUJWUJWU
SFCSFCSFC
29<27150.7
62.76.10.17
20.4:1
<0.15.40.85.40.27
12.4:1
<0.10.7
<0.70.70.05
533710
Sandy loam
30993
0.1
27.05.10.20
SAR
pH and EC (Saturated Paste)
Inorg/Org Carbon calc needs C-TOT-LECO
Inorg/Org Carbon calc needs C-TOT-LECO
Particle Size
SAR
pH and EC (Saturated Paste)
5232
0.1
0.10.10.01
0.10.10.70.10.02
0.10.10.70.10.02
111
5232
0.1
0.10.10.01
Matrix:
Matrix:
Matrix:
R591331R591331R591331R591331R591331
R591489R591489R591489
R592830R592830R592830R592818R593061
R593437R593437R593437R593441R593482
R591493R591493R591493R591493
R591331R591331R591331R591331R591331
R591489R591489R591489
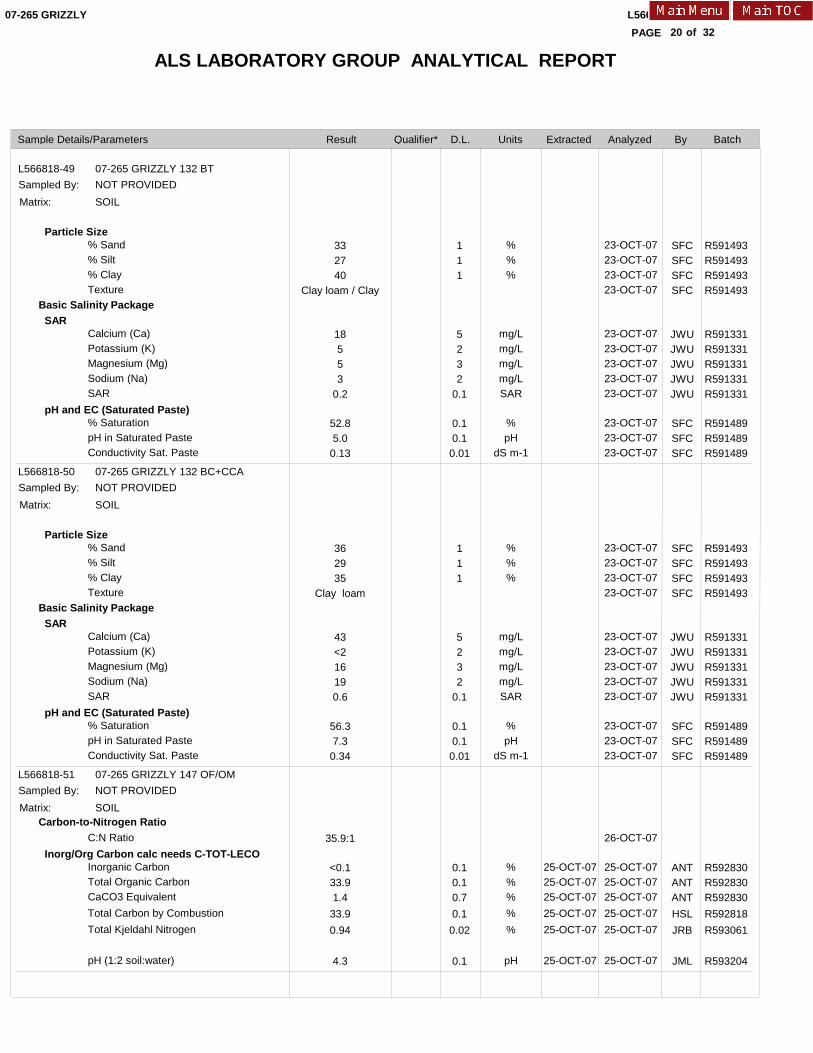
ALS LABORATORY GROUP ANALYTICAL REPORT
L566818 CONTD....
20PAGE
Result D.L. Units Extracted Analyzed BySample Details/Parameters
of
07-265 GRIZZLY
Qualifier* Batch
32
L566818-49
L566818-50
L566818-51
07-265 GRIZZLY 132 BT
07-265 GRIZZLY 132 BC+CCA
07-265 GRIZZLY 147 OF/OM
NOT PROVIDED
NOT PROVIDED
NOT PROVIDED
Sampled By:
Sampled By:
Sampled By:
SOIL
SOIL
SOIL
Basic Salinity Package
Basic Salinity Package
Carbon-to-Nitrogen Ratio
% Sand% Silt% ClayTexture
Calcium (Ca)Potassium (K)Magnesium (Mg)Sodium (Na)SAR
% SaturationpH in Saturated PasteConductivity Sat. Paste
% Sand% Silt% ClayTexture
Calcium (Ca)Potassium (K)Magnesium (Mg)Sodium (Na)SAR
% SaturationpH in Saturated PasteConductivity Sat. Paste
C:N Ratio
Inorganic CarbonTotal Organic CarbonCaCO3 EquivalentTotal Carbon by CombustionTotal Kjeldahl Nitrogen
pH (1:2 soil:water)
%%%
mg/Lmg/Lmg/Lmg/LSAR
%pH
dS m-1
%%%
mg/Lmg/Lmg/Lmg/LSAR
%pH
dS m-1
%%%%%
pH
25-OCT-0725-OCT-0725-OCT-0725-OCT-0725-OCT-07
25-OCT-07
23-OCT-0723-OCT-0723-OCT-0723-OCT-07
23-OCT-0723-OCT-0723-OCT-0723-OCT-0723-OCT-07
23-OCT-0723-OCT-0723-OCT-07
23-OCT-0723-OCT-0723-OCT-0723-OCT-07
23-OCT-0723-OCT-0723-OCT-0723-OCT-0723-OCT-07
23-OCT-0723-OCT-0723-OCT-07
26-OCT-07
25-OCT-0725-OCT-0725-OCT-0725-OCT-0725-OCT-07
25-OCT-07
SFCSFCSFCSFC
JWUJWUJWUJWUJWU
SFCSFCSFC
SFCSFCSFCSFC
JWUJWUJWUJWUJWU
SFCSFCSFC
ANTANTANTHSLJRB
JML
332740
Clay loam / Clay
18553
0.2
52.85.00.13
362935
Clay loam
43<216190.6
56.37.30.34
35.9:1
<0.133.91.433.90.94
4.3
Particle Size
SAR
pH and EC (Saturated Paste)
Particle Size
SAR
pH and EC (Saturated Paste)
Inorg/Org Carbon calc needs C-TOT-LECO
111
5232
0.1
0.10.10.01
111
5232
0.1
0.10.10.01
0.10.10.70.10.02
0.1
Matrix:
Matrix:
Matrix:
R591493R591493R591493R591493
R591331R591331R591331R591331R591331
R591489R591489R591489
R591493R591493R591493R591493
R591331R591331R591331R591331R591331
R591489R591489R591489
R592830R592830R592830R592818R593061
R593204
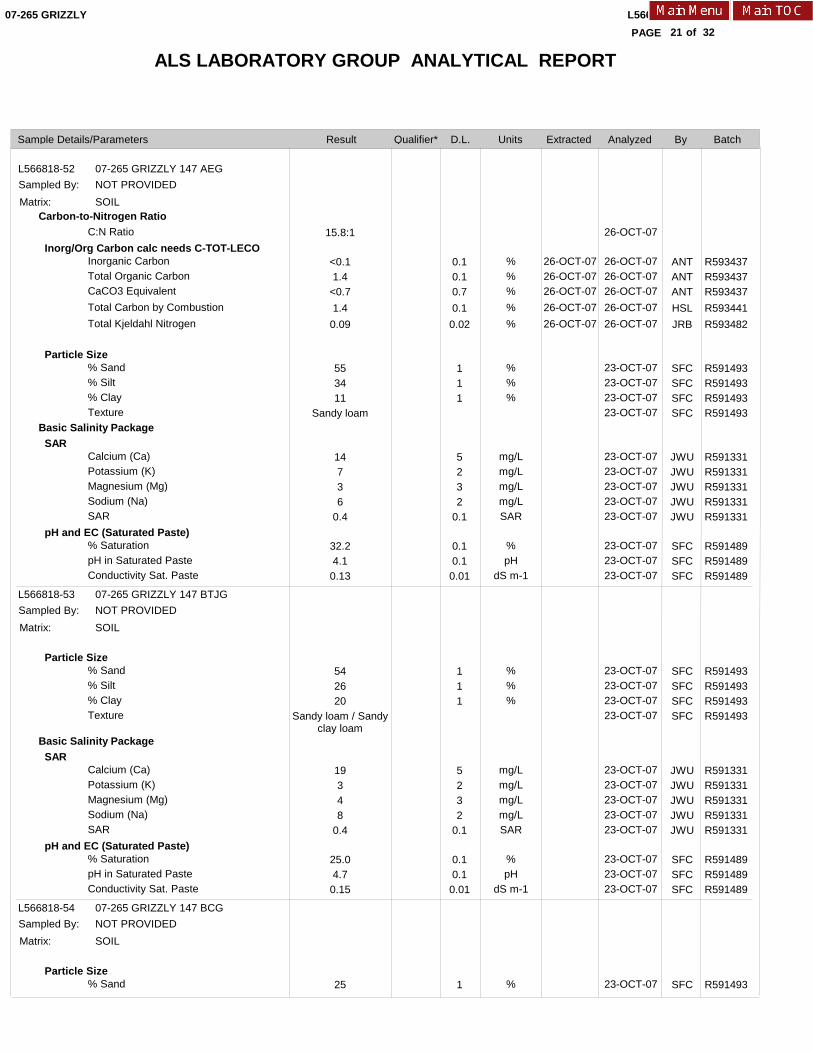
ALS LABORATORY GROUP ANALYTICAL REPORT
L566818 CONTD....
21PAGE
Result D.L. Units Extracted Analyzed BySample Details/Parameters
of
07-265 GRIZZLY
Qualifier* Batch
32
L566818-52
L566818-53
L566818-54
07-265 GRIZZLY 147 AEG
07-265 GRIZZLY 147 BTJG
07-265 GRIZZLY 147 BCG
NOT PROVIDED
NOT PROVIDED
NOT PROVIDED
Sampled By:
Sampled By:
Sampled By:
SOIL
SOIL
SOIL
Carbon-to-Nitrogen Ratio
Basic Salinity Package
Basic Salinity Package
C:N Ratio
Inorganic CarbonTotal Organic CarbonCaCO3 EquivalentTotal Carbon by CombustionTotal Kjeldahl Nitrogen
% Sand% Silt% ClayTexture
Calcium (Ca)Potassium (K)Magnesium (Mg)Sodium (Na)SAR
% SaturationpH in Saturated PasteConductivity Sat. Paste
% Sand% Silt% ClayTexture
Calcium (Ca)Potassium (K)Magnesium (Mg)Sodium (Na)SAR
% SaturationpH in Saturated PasteConductivity Sat. Paste
% Sand
%%%%%
%%%
mg/Lmg/Lmg/Lmg/LSAR
%pH
dS m-1
%%%
mg/Lmg/Lmg/Lmg/LSAR
%pH
dS m-1
%
26-OCT-0726-OCT-0726-OCT-0726-OCT-0726-OCT-07
26-OCT-07
26-OCT-0726-OCT-0726-OCT-0726-OCT-0726-OCT-07
23-OCT-0723-OCT-0723-OCT-0723-OCT-07
23-OCT-0723-OCT-0723-OCT-0723-OCT-0723-OCT-07
23-OCT-0723-OCT-0723-OCT-07
23-OCT-0723-OCT-0723-OCT-0723-OCT-07
23-OCT-0723-OCT-0723-OCT-0723-OCT-0723-OCT-07
23-OCT-0723-OCT-0723-OCT-07
23-OCT-07
ANTANTANTHSLJRB
SFCSFCSFCSFC
JWUJWUJWUJWUJWU
SFCSFCSFC
SFCSFCSFCSFC
JWUJWUJWUJWUJWU
SFCSFCSFC
SFC
15.8:1
<0.11.4
<0.71.40.09
553411
Sandy loam
14736
0.4
32.24.10.13
542620
Sandy loam / Sandyclay loam
19348
0.4
25.04.70.15
25
Inorg/Org Carbon calc needs C-TOT-LECO
Particle Size
SAR
pH and EC (Saturated Paste)
Particle Size
SAR
pH and EC (Saturated Paste)
Particle Size
0.10.10.70.10.02
111
5232
0.1
0.10.10.01
111
5232
0.1
0.10.10.01
1
Matrix:
Matrix:
Matrix:
R593437R593437R593437R593441R593482
R591493R591493R591493R591493
R591331R591331R591331R591331R591331
R591489R591489R591489
R591493R591493R591493R591493
R591331R591331R591331R591331R591331
R591489R591489R591489
R591493
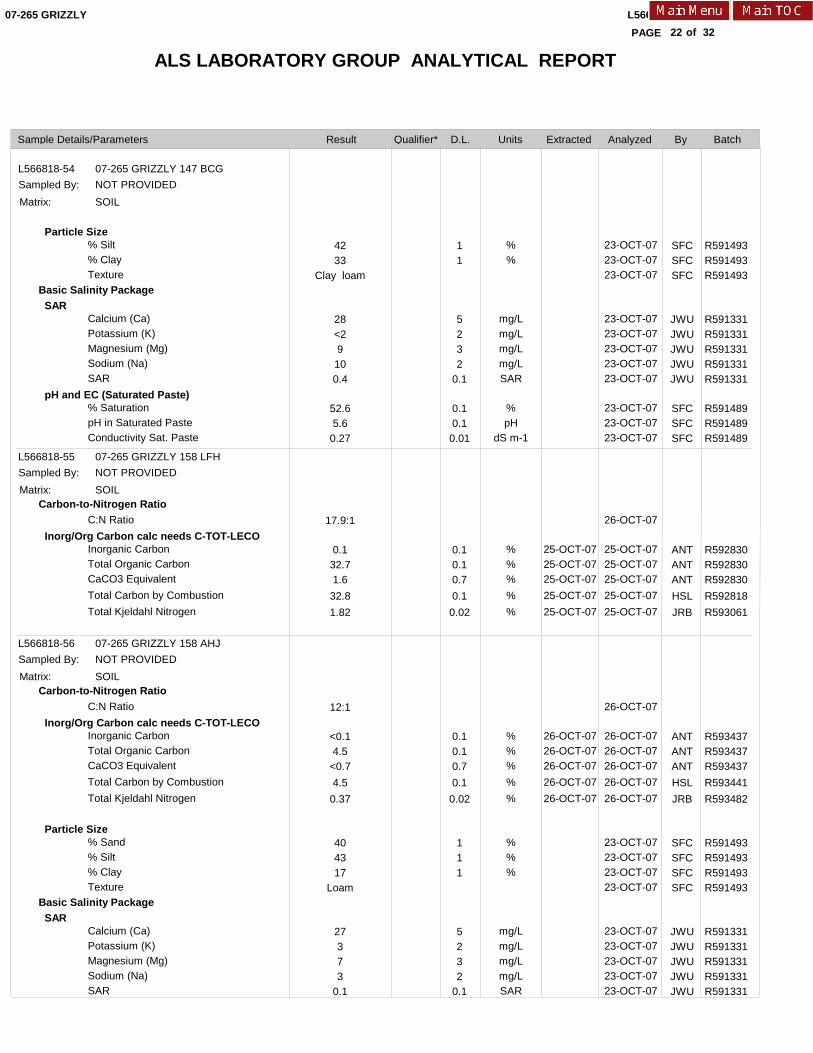
ALS LABORATORY GROUP ANALYTICAL REPORT
L566818 CONTD....
22PAGE
Result D.L. Units Extracted Analyzed BySample Details/Parameters
of
07-265 GRIZZLY
Qualifier* Batch
32
L566818-54
L566818-55
L566818-56
07-265 GRIZZLY 147 BCG
07-265 GRIZZLY 158 LFH
07-265 GRIZZLY 158 AHJ
NOT PROVIDED
NOT PROVIDED
NOT PROVIDED
Sampled By:
Sampled By:
Sampled By:
SOIL
SOIL
SOIL
Basic Salinity Package
Carbon-to-Nitrogen Ratio
Carbon-to-Nitrogen Ratio
Basic Salinity Package
% Silt% ClayTexture
Calcium (Ca)Potassium (K)Magnesium (Mg)Sodium (Na)SAR
% SaturationpH in Saturated PasteConductivity Sat. Paste
C:N Ratio
Inorganic CarbonTotal Organic CarbonCaCO3 EquivalentTotal Carbon by CombustionTotal Kjeldahl Nitrogen
C:N Ratio
Inorganic CarbonTotal Organic CarbonCaCO3 EquivalentTotal Carbon by CombustionTotal Kjeldahl Nitrogen
% Sand% Silt% ClayTexture
Calcium (Ca)Potassium (K)Magnesium (Mg)Sodium (Na)SAR
%%
mg/Lmg/Lmg/Lmg/LSAR
%pH
dS m-1
%%%%%
%%%%%
%%%
mg/Lmg/Lmg/Lmg/LSAR
25-OCT-0725-OCT-0725-OCT-0725-OCT-0725-OCT-07
26-OCT-0726-OCT-0726-OCT-0726-OCT-0726-OCT-07
23-OCT-0723-OCT-0723-OCT-07
23-OCT-0723-OCT-0723-OCT-0723-OCT-0723-OCT-07
23-OCT-0723-OCT-0723-OCT-07
26-OCT-07
25-OCT-0725-OCT-0725-OCT-0725-OCT-0725-OCT-07
26-OCT-07
26-OCT-0726-OCT-0726-OCT-0726-OCT-0726-OCT-07
23-OCT-0723-OCT-0723-OCT-0723-OCT-07
23-OCT-0723-OCT-0723-OCT-0723-OCT-0723-OCT-07
SFCSFCSFC
JWUJWUJWUJWUJWU
SFCSFCSFC
ANTANTANTHSLJRB
ANTANTANTHSLJRB
SFCSFCSFCSFC
JWUJWUJWUJWUJWU
4233
Clay loam
28<29100.4
52.65.60.27
17.9:1
0.132.71.632.81.82
12:1
<0.14.5
<0.74.50.37
404317
Loam
27373
0.1
Particle Size
SAR
pH and EC (Saturated Paste)
Inorg/Org Carbon calc needs C-TOT-LECO
Inorg/Org Carbon calc needs C-TOT-LECO
Particle Size
SAR
11
5232
0.1
0.10.10.01
0.10.10.70.10.02
0.10.10.70.10.02
111
5232
0.1
Matrix:
Matrix:
Matrix:
R591493R591493R591493
R591331R591331R591331R591331R591331
R591489R591489R591489
R592830R592830R592830R592818R593061
R593437R593437R593437R593441R593482
R591493R591493R591493R591493
R591331R591331R591331R591331R591331
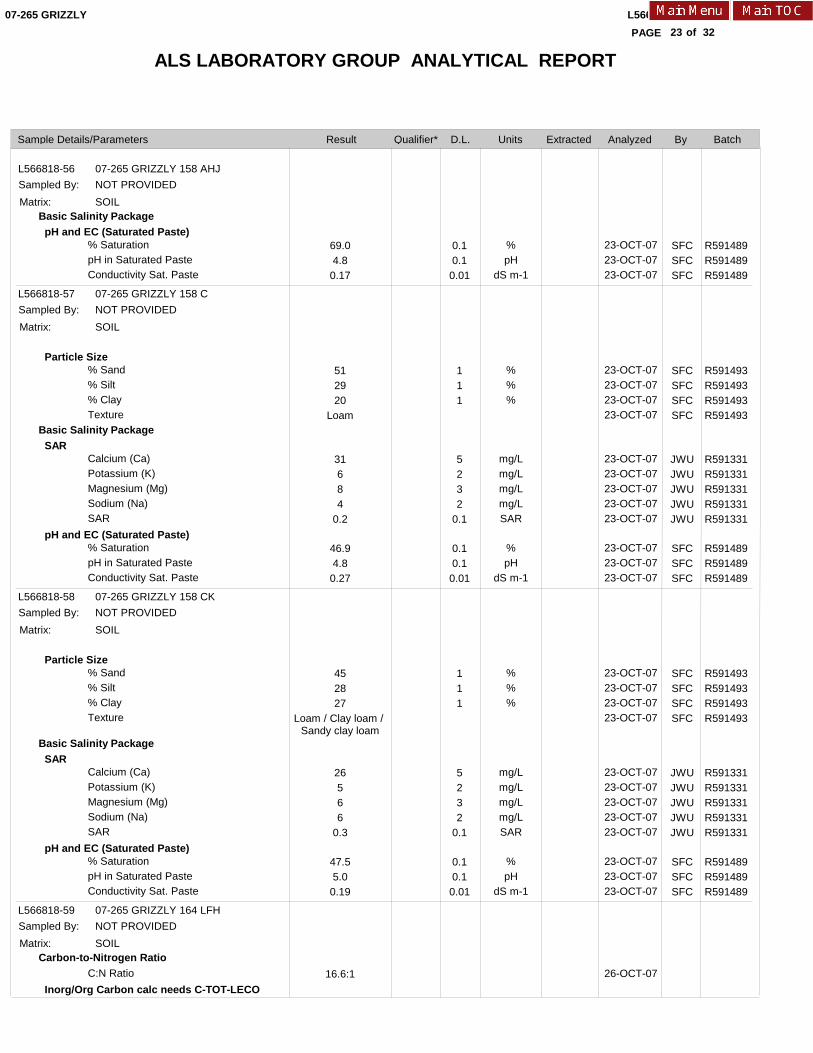
ALS LABORATORY GROUP ANALYTICAL REPORT
L566818 CONTD....
23PAGE
Result D.L. Units Extracted Analyzed BySample Details/Parameters
of
07-265 GRIZZLY
Qualifier* Batch
32
L566818-56
L566818-57
L566818-58
L566818-59
07-265 GRIZZLY 158 AHJ
07-265 GRIZZLY 158 C
07-265 GRIZZLY 158 CK
07-265 GRIZZLY 164 LFH
NOT PROVIDED
NOT PROVIDED
NOT PROVIDED
NOT PROVIDED
Sampled By:
Sampled By:
Sampled By:
Sampled By:
SOIL
SOIL
SOIL
SOIL
Basic Salinity Package
Basic Salinity Package
Basic Salinity Package
Carbon-to-Nitrogen Ratio
% SaturationpH in Saturated PasteConductivity Sat. Paste
% Sand% Silt% ClayTexture
Calcium (Ca)Potassium (K)Magnesium (Mg)Sodium (Na)SAR
% SaturationpH in Saturated PasteConductivity Sat. Paste
% Sand% Silt% ClayTexture
Calcium (Ca)Potassium (K)Magnesium (Mg)Sodium (Na)SAR
% SaturationpH in Saturated PasteConductivity Sat. Paste
C:N Ratio
%pH
dS m-1
%%%
mg/Lmg/Lmg/Lmg/LSAR
%pH
dS m-1
%%%
mg/Lmg/Lmg/Lmg/LSAR
%pH
dS m-1
23-OCT-0723-OCT-0723-OCT-07
23-OCT-0723-OCT-0723-OCT-0723-OCT-07
23-OCT-0723-OCT-0723-OCT-0723-OCT-0723-OCT-07
23-OCT-0723-OCT-0723-OCT-07
23-OCT-0723-OCT-0723-OCT-0723-OCT-07
23-OCT-0723-OCT-0723-OCT-0723-OCT-0723-OCT-07
23-OCT-0723-OCT-0723-OCT-07
26-OCT-07
SFCSFCSFC
SFCSFCSFCSFC
JWUJWUJWUJWUJWU
SFCSFCSFC
SFCSFCSFCSFC
JWUJWUJWUJWUJWU
SFCSFCSFC
69.04.80.17
512920
Loam
31684
0.2
46.94.80.27
452827
Loam / Clay loam / Sandy clay loam
26566
0.3
47.55.00.19
16.6:1
pH and EC (Saturated Paste)
Particle Size
SAR
pH and EC (Saturated Paste)
Particle Size
SAR
pH and EC (Saturated Paste)
Inorg/Org Carbon calc needs C-TOT-LECO
0.10.10.01
111
5232
0.1
0.10.10.01
111
5232
0.1
0.10.10.01
Matrix:
Matrix:
Matrix:
Matrix:
R591489R591489R591489
R591493R591493R591493R591493
R591331R591331R591331R591331R591331
R591489R591489R591489
R591493R591493R591493R591493
R591331R591331R591331R591331R591331
R591489R591489R591489
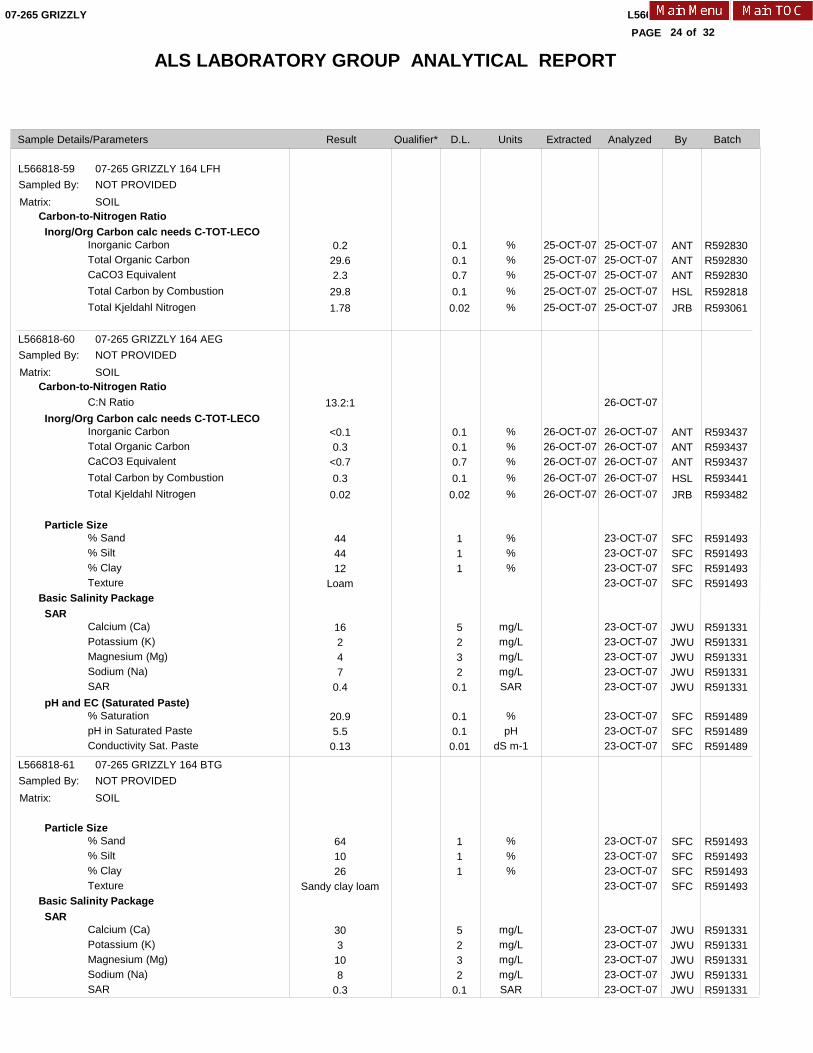
ALS LABORATORY GROUP ANALYTICAL REPORT
L566818 CONTD....
24PAGE
Result D.L. Units Extracted Analyzed BySample Details/Parameters
of
07-265 GRIZZLY
Qualifier* Batch
32
L566818-59
L566818-60
L566818-61
07-265 GRIZZLY 164 LFH
07-265 GRIZZLY 164 AEG
07-265 GRIZZLY 164 BTG
NOT PROVIDED
NOT PROVIDED
NOT PROVIDED
Sampled By:
Sampled By:
Sampled By:
SOIL
SOIL
SOIL
Carbon-to-Nitrogen Ratio
Carbon-to-Nitrogen Ratio
Basic Salinity Package
Basic Salinity Package
Inorganic CarbonTotal Organic CarbonCaCO3 EquivalentTotal Carbon by CombustionTotal Kjeldahl Nitrogen
C:N Ratio
Inorganic CarbonTotal Organic CarbonCaCO3 EquivalentTotal Carbon by CombustionTotal Kjeldahl Nitrogen
% Sand% Silt% ClayTexture
Calcium (Ca)Potassium (K)Magnesium (Mg)Sodium (Na)SAR
% SaturationpH in Saturated PasteConductivity Sat. Paste
% Sand% Silt% ClayTexture
Calcium (Ca)Potassium (K)Magnesium (Mg)Sodium (Na)SAR
%%%%%
%%%%%
%%%
mg/Lmg/Lmg/Lmg/LSAR
%pH
dS m-1
%%%
mg/Lmg/Lmg/Lmg/LSAR
25-OCT-0725-OCT-0725-OCT-0725-OCT-0725-OCT-07
26-OCT-0726-OCT-0726-OCT-0726-OCT-0726-OCT-07
25-OCT-0725-OCT-0725-OCT-0725-OCT-0725-OCT-07
26-OCT-07
26-OCT-0726-OCT-0726-OCT-0726-OCT-0726-OCT-07
23-OCT-0723-OCT-0723-OCT-0723-OCT-07
23-OCT-0723-OCT-0723-OCT-0723-OCT-0723-OCT-07
23-OCT-0723-OCT-0723-OCT-07
23-OCT-0723-OCT-0723-OCT-0723-OCT-07
23-OCT-0723-OCT-0723-OCT-0723-OCT-0723-OCT-07
ANTANTANTHSLJRB
ANTANTANTHSLJRB
SFCSFCSFCSFC
JWUJWUJWUJWUJWU
SFCSFCSFC
SFCSFCSFCSFC
JWUJWUJWUJWUJWU
0.229.62.329.81.78
13.2:1
<0.10.3
<0.70.30.02
444412
Loam
16247
0.4
20.95.50.13
641026
Sandy clay loam
303108
0.3
Inorg/Org Carbon calc needs C-TOT-LECO
Inorg/Org Carbon calc needs C-TOT-LECO
Particle Size
SAR
pH and EC (Saturated Paste)
Particle Size
SAR
0.10.10.70.10.02
0.10.10.70.10.02
111
5232
0.1
0.10.10.01
111
5232
0.1
Matrix:
Matrix:
Matrix:
R592830R592830R592830R592818R593061
R593437R593437R593437R593441R593482
R591493R591493R591493R591493
R591331R591331R591331R591331R591331
R591489R591489R591489
R591493R591493R591493R591493
R591331R591331R591331R591331R591331
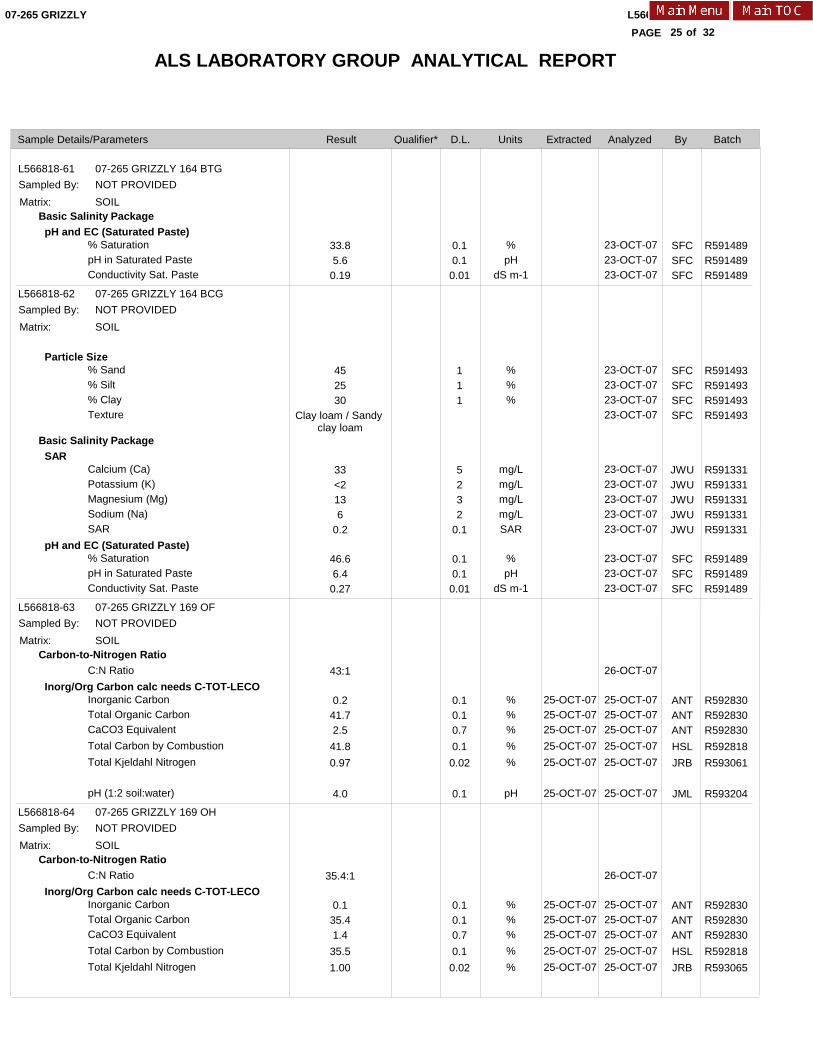
ALS LABORATORY GROUP ANALYTICAL REPORT
L566818 CONTD....
25PAGE
Result D.L. Units Extracted Analyzed BySample Details/Parameters
of
07-265 GRIZZLY
Qualifier* Batch
32
L566818-61
L566818-62
L566818-63
L566818-64
07-265 GRIZZLY 164 BTG
07-265 GRIZZLY 164 BCG
07-265 GRIZZLY 169 OF
07-265 GRIZZLY 169 OH
NOT PROVIDED
NOT PROVIDED
NOT PROVIDED
NOT PROVIDED
Sampled By:
Sampled By:
Sampled By:
Sampled By:
SOIL
SOIL
SOIL
SOIL
Basic Salinity Package
Basic Salinity Package
Carbon-to-Nitrogen Ratio
Carbon-to-Nitrogen Ratio
% SaturationpH in Saturated PasteConductivity Sat. Paste
% Sand% Silt% ClayTexture
Calcium (Ca)Potassium (K)Magnesium (Mg)Sodium (Na)SAR
% SaturationpH in Saturated PasteConductivity Sat. Paste
C:N Ratio
Inorganic CarbonTotal Organic CarbonCaCO3 EquivalentTotal Carbon by CombustionTotal Kjeldahl Nitrogen
pH (1:2 soil:water)
C:N Ratio
Inorganic CarbonTotal Organic CarbonCaCO3 EquivalentTotal Carbon by CombustionTotal Kjeldahl Nitrogen
%pH
dS m-1
%%%
mg/Lmg/Lmg/Lmg/LSAR
%pH
dS m-1
%%%%%
pH
%%%%%
25-OCT-0725-OCT-0725-OCT-0725-OCT-0725-OCT-07
25-OCT-07
25-OCT-0725-OCT-0725-OCT-0725-OCT-0725-OCT-07
23-OCT-0723-OCT-0723-OCT-07
23-OCT-0723-OCT-0723-OCT-0723-OCT-07
23-OCT-0723-OCT-0723-OCT-0723-OCT-0723-OCT-07
23-OCT-0723-OCT-0723-OCT-07
26-OCT-07
25-OCT-0725-OCT-0725-OCT-0725-OCT-0725-OCT-07
25-OCT-07
26-OCT-07
25-OCT-0725-OCT-0725-OCT-0725-OCT-0725-OCT-07
SFCSFCSFC
SFCSFCSFCSFC
JWUJWUJWUJWUJWU
SFCSFCSFC
ANTANTANTHSLJRB
JML
ANTANTANTHSLJRB
33.85.60.19
452530
Clay loam / Sandy clay loam
33<2136
0.2
46.66.40.27
43:1
0.241.72.541.80.97
4.0
35.4:1
0.135.41.435.51.00
pH and EC (Saturated Paste)
Particle Size
SAR
pH and EC (Saturated Paste)
Inorg/Org Carbon calc needs C-TOT-LECO
Inorg/Org Carbon calc needs C-TOT-LECO
0.10.10.01
111
5232
0.1
0.10.10.01
0.10.10.70.10.02
0.1
0.10.10.70.10.02
Matrix:
Matrix:
Matrix:
Matrix:
R591489R591489R591489
R591493R591493R591493R591493
R591331R591331R591331R591331R591331
R591489R591489R591489
R592830R592830R592830R592818R593061
R593204
R592830R592830R592830R592818R593065
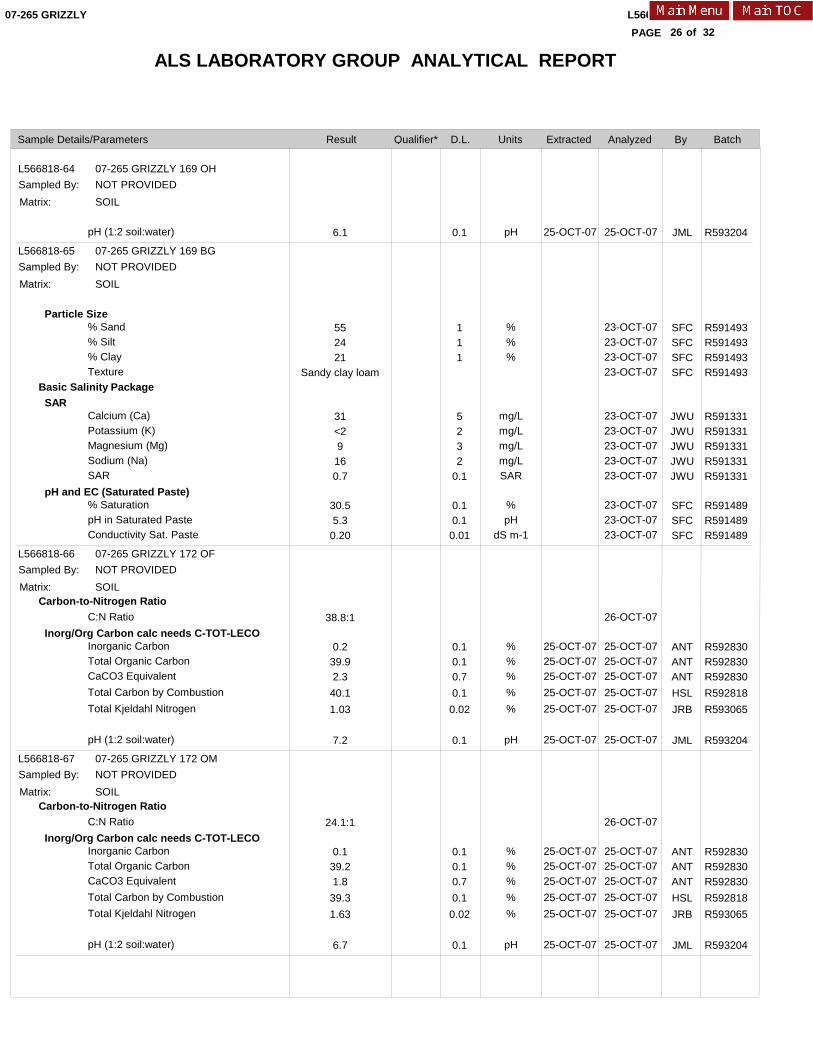
ALS LABORATORY GROUP ANALYTICAL REPORT
L566818 CONTD....
26PAGE
Result D.L. Units Extracted Analyzed BySample Details/Parameters
of
07-265 GRIZZLY
Qualifier* Batch
32
L566818-64
L566818-65
L566818-66
L566818-67
07-265 GRIZZLY 169 OH
07-265 GRIZZLY 169 BG
07-265 GRIZZLY 172 OF
07-265 GRIZZLY 172 OM
NOT PROVIDED
NOT PROVIDED
NOT PROVIDED
NOT PROVIDED
Sampled By:
Sampled By:
Sampled By:
Sampled By:
SOIL
SOIL
SOIL
SOIL
Basic Salinity Package
Carbon-to-Nitrogen Ratio
Carbon-to-Nitrogen Ratio
pH (1:2 soil:water)
% Sand% Silt% ClayTexture
Calcium (Ca)Potassium (K)Magnesium (Mg)Sodium (Na)SAR
% SaturationpH in Saturated PasteConductivity Sat. Paste
C:N Ratio
Inorganic CarbonTotal Organic CarbonCaCO3 EquivalentTotal Carbon by CombustionTotal Kjeldahl Nitrogen
pH (1:2 soil:water)
C:N Ratio
Inorganic CarbonTotal Organic CarbonCaCO3 EquivalentTotal Carbon by CombustionTotal Kjeldahl Nitrogen
pH (1:2 soil:water)
pH
%%%
mg/Lmg/Lmg/Lmg/LSAR
%pH
dS m-1
%%%%%
pH
%%%%%
pH
25-OCT-07
25-OCT-0725-OCT-0725-OCT-0725-OCT-0725-OCT-07
25-OCT-07
25-OCT-0725-OCT-0725-OCT-0725-OCT-0725-OCT-07
25-OCT-07
25-OCT-07
23-OCT-0723-OCT-0723-OCT-0723-OCT-07
23-OCT-0723-OCT-0723-OCT-0723-OCT-0723-OCT-07
23-OCT-0723-OCT-0723-OCT-07
26-OCT-07
25-OCT-0725-OCT-0725-OCT-0725-OCT-0725-OCT-07
25-OCT-07
26-OCT-07
25-OCT-0725-OCT-0725-OCT-0725-OCT-0725-OCT-07
25-OCT-07
JML
SFCSFCSFCSFC
JWUJWUJWUJWUJWU
SFCSFCSFC
ANTANTANTHSLJRB
JML
ANTANTANTHSLJRB
JML
6.1
552421
Sandy clay loam
31<29160.7
30.55.30.20
38.8:1
0.239.92.340.11.03
7.2
24.1:1
0.139.21.839.31.63
6.7
Particle Size
SAR
pH and EC (Saturated Paste)
Inorg/Org Carbon calc needs C-TOT-LECO
Inorg/Org Carbon calc needs C-TOT-LECO
0.1
111
5232
0.1
0.10.10.01
0.10.10.70.10.02
0.1
0.10.10.70.10.02
0.1
Matrix:
Matrix:
Matrix:
Matrix:
R593204
R591493R591493R591493R591493
R591331R591331R591331R591331R591331
R591489R591489R591489
R592830R592830R592830R592818R593065
R593204
R592830R592830R592830R592818R593065
R593204
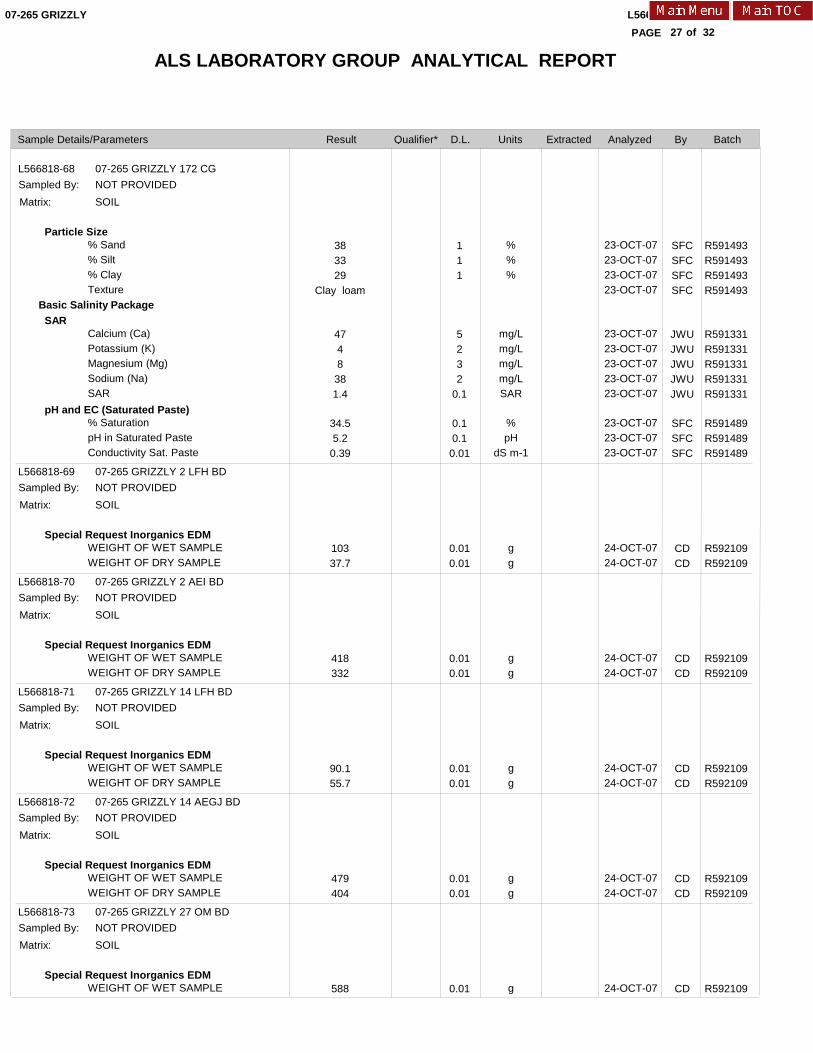
ALS LABORATORY GROUP ANALYTICAL REPORT
L566818 CONTD....
27PAGE
Result D.L. Units Extracted Analyzed BySample Details/Parameters
of
07-265 GRIZZLY
Qualifier* Batch
32
L566818-68
L566818-69
L566818-70
L566818-71
L566818-72
L566818-73
07-265 GRIZZLY 172 CG
07-265 GRIZZLY 2 LFH BD
07-265 GRIZZLY 2 AEI BD
07-265 GRIZZLY 14 LFH BD
07-265 GRIZZLY 14 AEGJ BD
07-265 GRIZZLY 27 OM BD
NOT PROVIDED
NOT PROVIDED
NOT PROVIDED
NOT PROVIDED
NOT PROVIDED
NOT PROVIDED
Sampled By:
Sampled By:
Sampled By:
Sampled By:
Sampled By:
Sampled By:
SOIL
SOIL
SOIL
SOIL
SOIL
SOIL
Basic Salinity Package
% Sand% Silt% ClayTexture
Calcium (Ca)Potassium (K)Magnesium (Mg)Sodium (Na)SAR
% SaturationpH in Saturated PasteConductivity Sat. Paste
WEIGHT OF WET SAMPLEWEIGHT OF DRY SAMPLE
WEIGHT OF WET SAMPLEWEIGHT OF DRY SAMPLE
WEIGHT OF WET SAMPLEWEIGHT OF DRY SAMPLE
WEIGHT OF WET SAMPLEWEIGHT OF DRY SAMPLE
WEIGHT OF WET SAMPLE
%%%
mg/Lmg/Lmg/Lmg/LSAR
%pH
dS m-1
gg
gg
gg
gg
g
23-OCT-0723-OCT-0723-OCT-0723-OCT-07
23-OCT-0723-OCT-0723-OCT-0723-OCT-0723-OCT-07
23-OCT-0723-OCT-0723-OCT-07
24-OCT-0724-OCT-07
24-OCT-0724-OCT-07
24-OCT-0724-OCT-07
24-OCT-0724-OCT-07
24-OCT-07
SFCSFCSFCSFC
JWUJWUJWUJWUJWU
SFCSFCSFC
CDCD
CDCD
CDCD
CDCD
CD
383329
Clay loam
4748381.4
34.55.20.39
10337.7
418332
90.155.7
479404
588
Particle Size
SAR
pH and EC (Saturated Paste)
Special Request Inorganics EDM
Special Request Inorganics EDM
Special Request Inorganics EDM
Special Request Inorganics EDM
Special Request Inorganics EDM
111
5232
0.1
0.10.10.01
0.010.01
0.010.01
0.010.01
0.010.01
0.01
Matrix:
Matrix:
Matrix:
Matrix:
Matrix:
Matrix:
R591493R591493R591493R591493
R591331R591331R591331R591331R591331
R591489R591489R591489
R592109R592109
R592109R592109
R592109R592109
R592109R592109
R592109
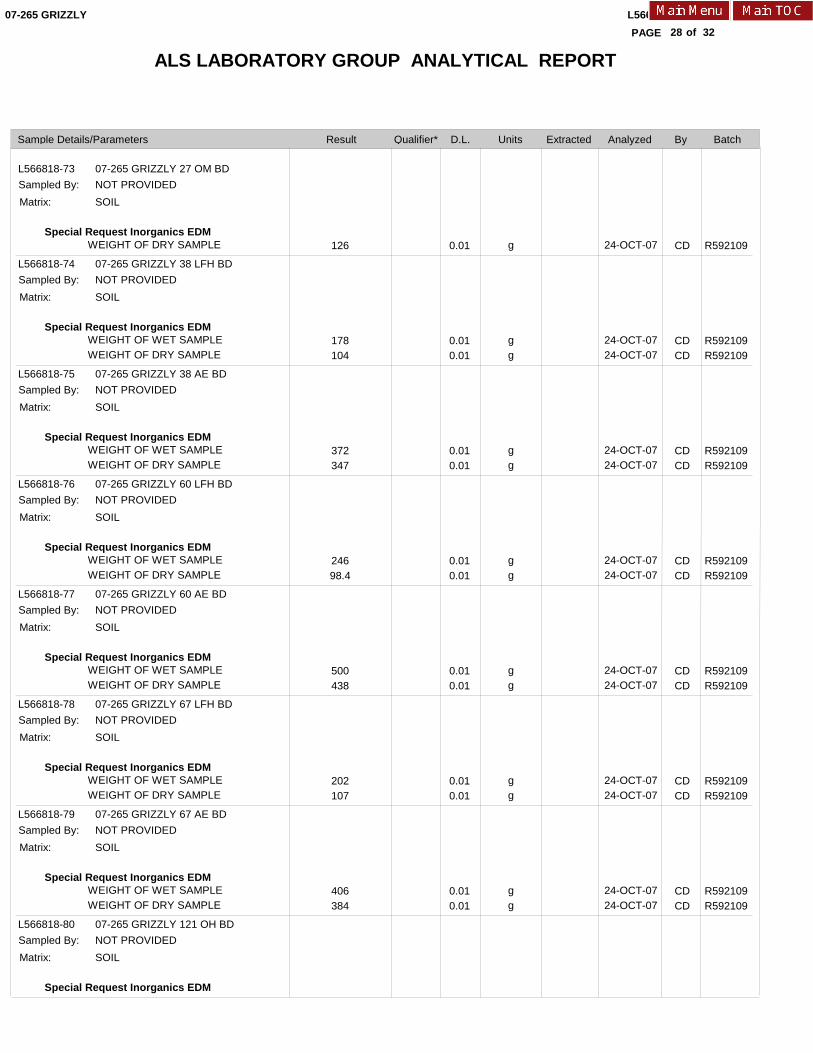
ALS LABORATORY GROUP ANALYTICAL REPORT
L566818 CONTD....
28PAGE
Result D.L. Units Extracted Analyzed BySample Details/Parameters
of
07-265 GRIZZLY
Qualifier* Batch
32
L566818-73
L566818-74
L566818-75
L566818-76
L566818-77
L566818-78
L566818-79
L566818-80
07-265 GRIZZLY 27 OM BD
07-265 GRIZZLY 38 LFH BD
07-265 GRIZZLY 38 AE BD
07-265 GRIZZLY 60 LFH BD
07-265 GRIZZLY 60 AE BD
07-265 GRIZZLY 67 LFH BD
07-265 GRIZZLY 67 AE BD
07-265 GRIZZLY 121 OH BD
NOT PROVIDED
NOT PROVIDED
NOT PROVIDED
NOT PROVIDED
NOT PROVIDED
NOT PROVIDED
NOT PROVIDED
NOT PROVIDED
Sampled By:
Sampled By:
Sampled By:
Sampled By:
Sampled By:
Sampled By:
Sampled By:
Sampled By:
SOIL
SOIL
SOIL
SOIL
SOIL
SOIL
SOIL
SOIL
WEIGHT OF DRY SAMPLE
WEIGHT OF WET SAMPLEWEIGHT OF DRY SAMPLE
WEIGHT OF WET SAMPLEWEIGHT OF DRY SAMPLE
WEIGHT OF WET SAMPLEWEIGHT OF DRY SAMPLE
WEIGHT OF WET SAMPLEWEIGHT OF DRY SAMPLE
WEIGHT OF WET SAMPLEWEIGHT OF DRY SAMPLE
WEIGHT OF WET SAMPLEWEIGHT OF DRY SAMPLE
g
gg
gg
gg
gg
gg
gg
24-OCT-07
24-OCT-0724-OCT-07
24-OCT-0724-OCT-07
24-OCT-0724-OCT-07
24-OCT-0724-OCT-07
24-OCT-0724-OCT-07
24-OCT-0724-OCT-07
CD
CDCD
CDCD
CDCD
CDCD
CDCD
CDCD
126
178104
372347
24698.4
500438
202107
406384
Special Request Inorganics EDM
Special Request Inorganics EDM
Special Request Inorganics EDM
Special Request Inorganics EDM
Special Request Inorganics EDM
Special Request Inorganics EDM
Special Request Inorganics EDM
Special Request Inorganics EDM
0.01
0.010.01
0.010.01
0.010.01
0.010.01
0.010.01
0.010.01
Matrix:
Matrix:
Matrix:
Matrix:
Matrix:
Matrix:
Matrix:
Matrix:
R592109
R592109R592109
R592109R592109
R592109R592109
R592109R592109
R592109R592109
R592109R592109
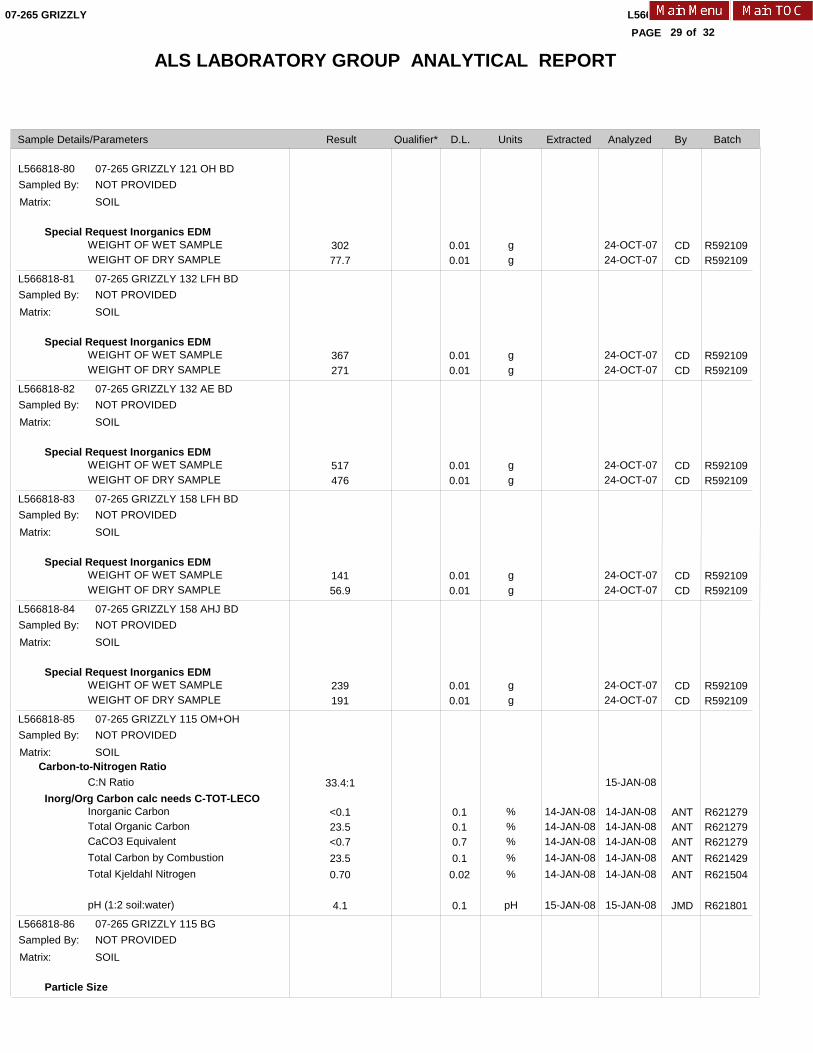
ALS LABORATORY GROUP ANALYTICAL REPORT
L566818 CONTD....
29PAGE
Result D.L. Units Extracted Analyzed BySample Details/Parameters
of
07-265 GRIZZLY
Qualifier* Batch
32
L566818-80
L566818-81
L566818-82
L566818-83
L566818-84
L566818-85
L566818-86
07-265 GRIZZLY 121 OH BD
07-265 GRIZZLY 132 LFH BD
07-265 GRIZZLY 132 AE BD
07-265 GRIZZLY 158 LFH BD
07-265 GRIZZLY 158 AHJ BD
07-265 GRIZZLY 115 OM+OH
07-265 GRIZZLY 115 BG
NOT PROVIDED
NOT PROVIDED
NOT PROVIDED
NOT PROVIDED
NOT PROVIDED
NOT PROVIDED
NOT PROVIDED
Sampled By:
Sampled By:
Sampled By:
Sampled By:
Sampled By:
Sampled By:
Sampled By:
SOIL
SOIL
SOIL
SOIL
SOIL
SOIL
SOIL
Carbon-to-Nitrogen Ratio
WEIGHT OF WET SAMPLEWEIGHT OF DRY SAMPLE
WEIGHT OF WET SAMPLEWEIGHT OF DRY SAMPLE
WEIGHT OF WET SAMPLEWEIGHT OF DRY SAMPLE
WEIGHT OF WET SAMPLEWEIGHT OF DRY SAMPLE
WEIGHT OF WET SAMPLEWEIGHT OF DRY SAMPLE
C:N Ratio
Inorganic CarbonTotal Organic CarbonCaCO3 EquivalentTotal Carbon by CombustionTotal Kjeldahl Nitrogen
pH (1:2 soil:water)
gg
gg
gg
gg
gg
%%%%%
pH
14-JAN-0814-JAN-0814-JAN-0814-JAN-0814-JAN-08
15-JAN-08
24-OCT-0724-OCT-07
24-OCT-0724-OCT-07
24-OCT-0724-OCT-07
24-OCT-0724-OCT-07
24-OCT-0724-OCT-07
15-JAN-08
14-JAN-0814-JAN-0814-JAN-0814-JAN-0814-JAN-08
15-JAN-08
CDCD
CDCD
CDCD
CDCD
CDCD
ANTANTANTANTANT
JMD
30277.7
367271
517476
14156.9
239191
33.4:1
<0.123.5<0.723.50.70
4.1
Special Request Inorganics EDM
Special Request Inorganics EDM
Special Request Inorganics EDM
Special Request Inorganics EDM
Special Request Inorganics EDM
Inorg/Org Carbon calc needs C-TOT-LECO
Particle Size
0.010.01
0.010.01
0.010.01
0.010.01
0.010.01
0.10.10.70.10.02
0.1
Matrix:
Matrix:
Matrix:
Matrix:
Matrix:
Matrix:
Matrix:
R592109R592109
R592109R592109
R592109R592109
R592109R592109
R592109R592109
R621279R621279R621279R621429R621504
R621801
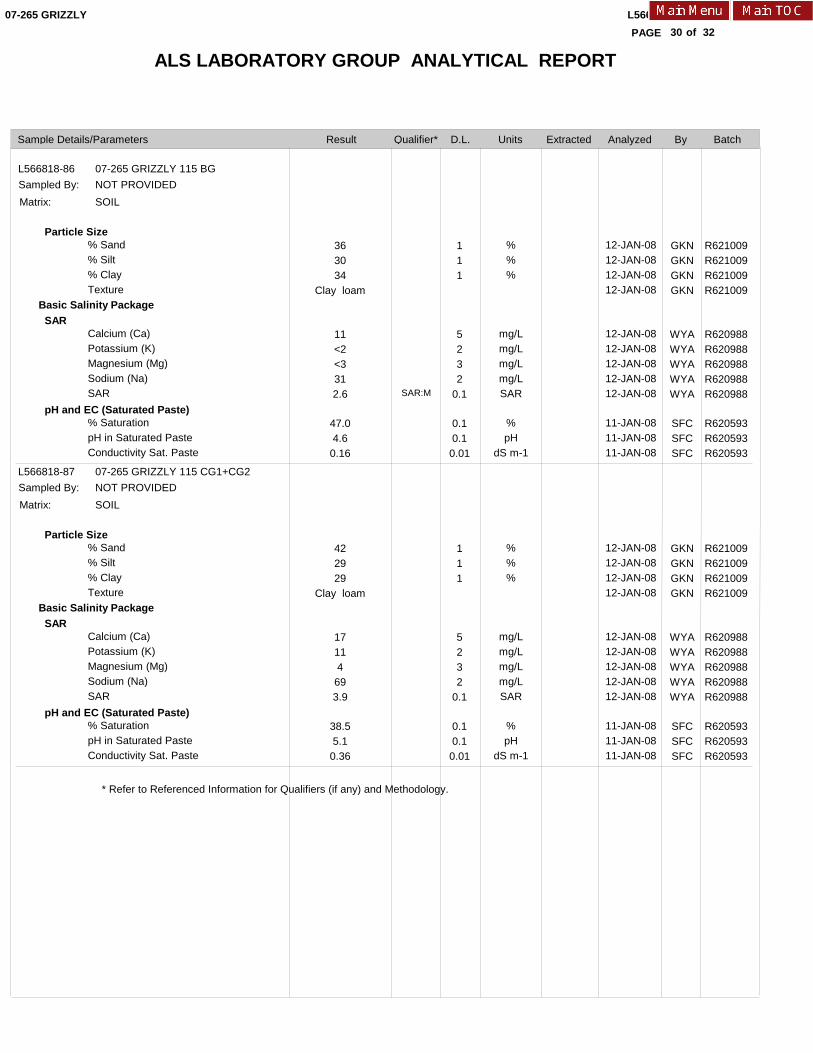
ALS LABORATORY GROUP ANALYTICAL REPORT
L566818 CONTD....
30PAGE
Result D.L. Units Extracted Analyzed BySample Details/Parameters
of
07-265 GRIZZLY
Qualifier* Batch
32
L566818-86
L566818-87
07-265 GRIZZLY 115 BG
07-265 GRIZZLY 115 CG1+CG2
NOT PROVIDED
NOT PROVIDED
Sampled By:
Sampled By:
SOIL
SOIL
Basic Salinity Package
Basic Salinity Package
% Sand% Silt% ClayTexture
Calcium (Ca)Potassium (K)Magnesium (Mg)Sodium (Na)SAR
% SaturationpH in Saturated PasteConductivity Sat. Paste
% Sand% Silt% ClayTexture
Calcium (Ca)Potassium (K)Magnesium (Mg)Sodium (Na)SAR
% SaturationpH in Saturated PasteConductivity Sat. Paste
%%%
mg/Lmg/Lmg/Lmg/LSAR
%pH
dS m-1
%%%
mg/Lmg/Lmg/Lmg/LSAR
%pH
dS m-1
12-JAN-0812-JAN-0812-JAN-0812-JAN-08
12-JAN-0812-JAN-0812-JAN-0812-JAN-0812-JAN-08
11-JAN-0811-JAN-0811-JAN-08
12-JAN-0812-JAN-0812-JAN-0812-JAN-08
12-JAN-0812-JAN-0812-JAN-0812-JAN-0812-JAN-08
11-JAN-0811-JAN-0811-JAN-08
GKNGKNGKNGKN
WYAWYAWYAWYAWYA
SFCSFCSFC
GKNGKNGKNGKN
WYAWYAWYAWYAWYA
SFCSFCSFC
363034
Clay loam
11<2<3312.6
47.04.60.16
422929
Clay loam
17114693.9
38.55.10.36
Particle Size
SAR
pH and EC (Saturated Paste)
Particle Size
SAR
pH and EC (Saturated Paste)
111
5232
0.1
0.10.10.01
111
5232
0.1
0.10.10.01
Matrix:
Matrix:
SAR:M
R621009R621009R621009R621009
R620988R620988R620988R620988R620988
R620593R620593R620593
R621009R621009R621009R621009
R620988R620988R620988R620988R620988
R620593R620593R620593
* Refer to Referenced Information for Qualifiers (if any) and Methodology.
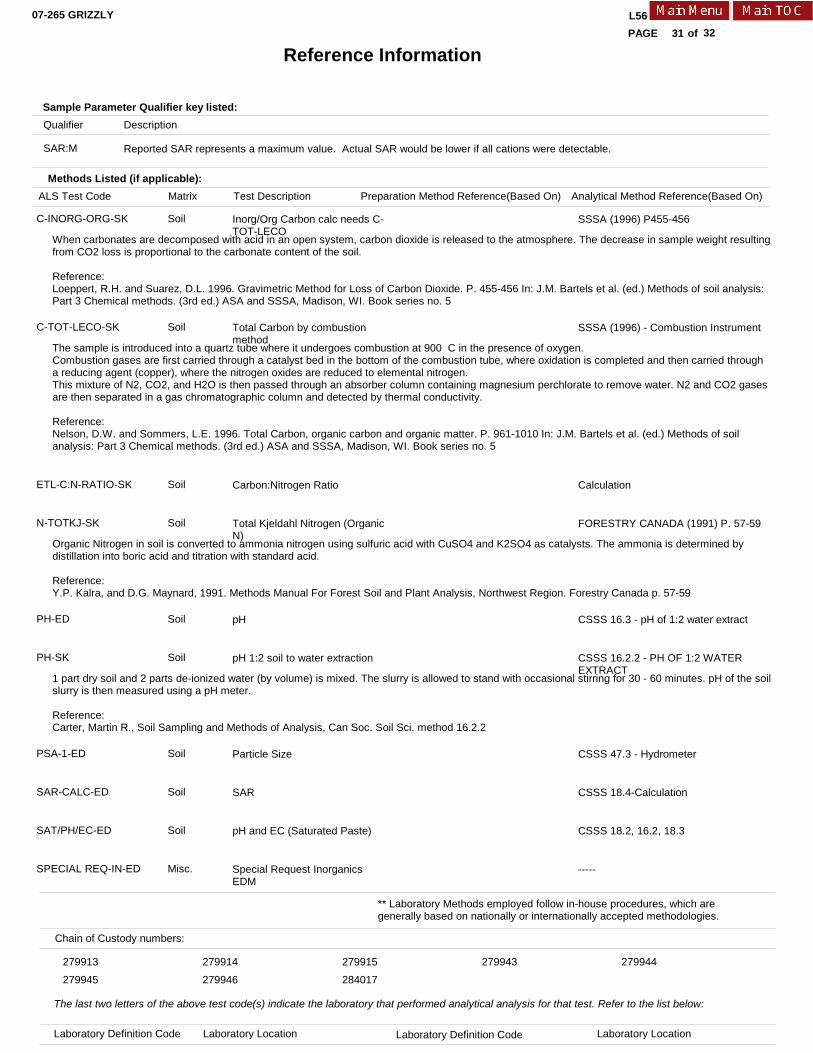
C-INORG-ORG-SK
C-TOT-LECO-SK
ETL-C:N-RATIO-SK
N-TOTKJ-SK
PH-ED
PH-SK
PSA-1-ED
SAR-CALC-ED
SAT/PH/EC-ED
SPECIAL REQ-IN-ED
Reference Information
Inorg/Org Carbon calc needs C-TOT-LECO
Total Carbon by combustion method
Carbon:Nitrogen Ratio
Total Kjeldahl Nitrogen (Organic N)
pH
pH 1:2 soil to water extraction
Particle Size
SAR
pH and EC (Saturated Paste)
Special Request Inorganics EDM
L566818 CONTD....
31PAGE of
07-265 GRIZZLY
When carbonates are decomposed with acid in an open system, carbon dioxide is released to the atmosphere. The decrease in sample weight resultingfrom CO2 loss is proportional to the carbonate content of the soil.
Reference:Loeppert, R.H. and Suarez, D.L. 1996. Gravimetric Method for Loss of Carbon Dioxide. P. 455-456 In: J.M. Bartels et al. (ed.) Methods of soil analysis: Part 3 Chemical methods. (3rd ed.) ASA and SSSA, Madison, WI. Book series no. 5
The sample is introduced into a quartz tube where it undergoes combustion at 900 C in the presence of oxygen.Combustion gases are first carried through a catalyst bed in the bottom of the combustion tube, where oxidation is completed and then carried through a reducing agent (copper), where the nitrogen oxides are reduced to elemental nitrogen.This mixture of N2, CO2, and H2O is then passed through an absorber column containing magnesium perchlorate to remove water. N2 and CO2 gases are then separated in a gas chromatographic column and detected by thermal conductivity.
Reference:Nelson, D.W. and Sommers, L.E. 1996. Total Carbon, organic carbon and organic matter. P. 961-1010 In: J.M. Bartels et al. (ed.) Methods of soil analysis: Part 3 Chemical methods. (3rd ed.) ASA and SSSA, Madison, WI. Book series no. 5
Organic Nitrogen in soil is converted to ammonia nitrogen using sulfuric acid with CuSO4 and K2SO4 as catalysts. The ammonia is determined by distillation into boric acid and titration with standard acid.
Reference:Y.P. Kalra, and D.G. Maynard, 1991. Methods Manual For Forest Soil and Plant Analysis, Northwest Region. Forestry Canada p. 57-59
1 part dry soil and 2 parts de-ionized water (by volume) is mixed. The slurry is allowed to stand with occasional stirring for 30 - 60 minutes. pH of the soilslurry is then measured using a pH meter.
Reference:Carter, Martin R., Soil Sampling and Methods of Analysis, Can Soc. Soil Sci. method 16.2.2
Methods Listed (if applicable):
ALS Test Code Test Description
Soil
Soil
Soil
Soil
Soil
Soil
Soil
Soil
Soil
Misc.
SAR:M Reported SAR represents a maximum value. Actual SAR would be lower if all cations were detectable.
Sample Parameter Qualifier key listed:
SSSA (1996) P455-456
SSSA (1996) - Combustion Instrument
Calculation
FORESTRY CANADA (1991) P. 57-59
CSSS 16.3 - pH of 1:2 water extract
CSSS 16.2.2 - PH OF 1:2 WATER EXTRACT
CSSS 47.3 - Hydrometer
CSSS 18.4-Calculation
CSSS 18.2, 16.2, 18.3
-----
Analytical Method Reference(Based On)
** Laboratory Methods employed follow in-house procedures, which are generally based on nationally or internationally accepted methodologies.
Description Qualifier
Preparation Method Reference(Based On) Matrix
The last two letters of the above test code(s) indicate the laboratory that performed analytical analysis for that test. Refer to the list below:
Laboratory Definition Code Laboratory Location Laboratory Definition Code Laboratory Location
Chain of Custody numbers:
279913 279914 279915 279943 279944
279945 279946 284017
32

Reference Information
L566818 CONTD....
32PAGE of
07-265 GRIZZLY
GLOSSARY OF REPORT TERMSSurr - A surrogate is an organic compound that is similar to the target analyte(s) in chemical composition and behavior but not normally detected in environmental samples. Prior to sample processing, samples are fortified with one or more surrogate compounds.The reported surrogate recovery value provides a measure of method efficiency. The Laboratory control limits are determined under column heading D.L.mg/kg (units) - unit of concentration based on mass, parts per million.mg/L (units) - unit of concentration based on volume, parts per million.< - Less than.D.L. - The reporting limit.N/A - Result not available. Refer to qualifier code and definition for explanation.
Test results reported relate only to the samples as received by the laboratory.UNLESS OTHERWISE STATED, ALL SAMPLES WERE RECEIVED IN ACCEPTABLE CONDITION.UNLESS OTHERWISE STATED, SAMPLES ARE NOT CORRECTED FOR CLIENT FIELD BLANKS.Although test results are generated under strict QA/QC protocols, any unsigned test reports, faxes, or emails are considered preliminary.
ALS Laboratory Group has an extensive QA/QC program where all analytical data reported is analyzed using approved referenced procedures followed by checks and reviews by senior managers and quality assurance personnel. However, since the results are obtained from chemical measurements and thus cannot be guaranteed, ALS Laboratory Group assumes no liability for the use or interpretation of the results.
ED SKALS LABORATORY GROUP - EDMONTON, ALBERTA, CANADA
ALS LABORATORY GROUP - SASKATOON, SASKATCHEWAN, CANADA
32
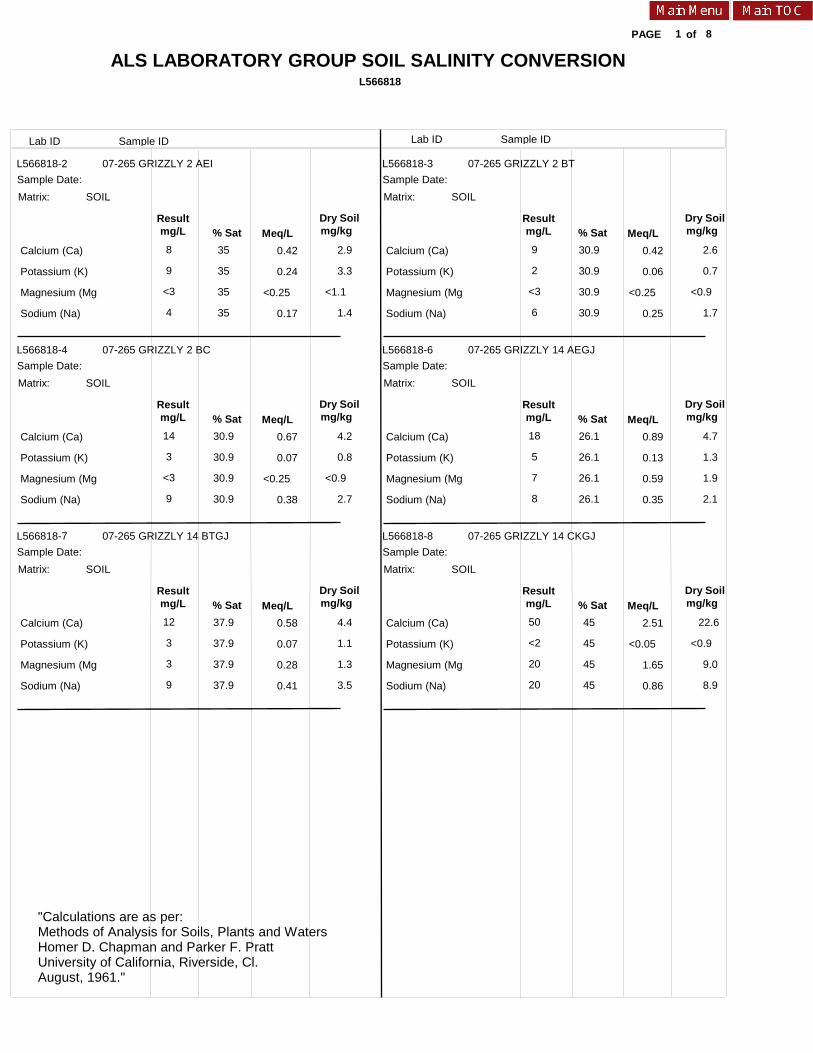
ALS LABORATORY GROUP SOIL SALINITY CONVERSIONL566818
1PAGE
Lab ID Sample ID
of
Lab ID Sample ID
"Calculations are as per:Methods of Analysis for Soils, Plants and WatersHomer D. Chapman and Parker F. PrattUniversity of California, Riverside, Cl.August, 1961."
8
L566818-2 L566818-3
L566818-4 L566818-6
L566818-7 L566818-8
07-265 GRIZZLY 2 AEI 07-265 GRIZZLY 2 BT
07-265 GRIZZLY 2 BC 07-265 GRIZZLY 14 AEGJ
07-265 GRIZZLY 14 BTGJ 07-265 GRIZZLY 14 CKGJ
Sample Date: Sample Date:
Sample Date: Sample Date:
Sample Date: Sample Date:
SOIL SOIL
SOIL SOIL
SOIL SOIL
Matrix: Matrix:
Matrix: Matrix:
Matrix: Matrix:
Resultmg/L
Resultmg/L
Resultmg/L
Resultmg/L
Resultmg/L
Resultmg/L
Calcium (Ca)
Potassium (K)
Magnesium (Mg)
Sodium (Na)
Calcium (Ca)
Potassium (K)
Magnesium (Mg)
Sodium (Na)
Calcium (Ca)
Potassium (K)
Magnesium (Mg)
Sodium (Na)
Calcium (Ca)
Potassium (K)
Magnesium (Mg)
Sodium (Na)
Calcium (Ca)
Potassium (K)
Magnesium (Mg)
Sodium (Na)
Calcium (Ca)
Potassium (K)
Magnesium (Mg)
Sodium (Na)
8
9
<3
4
9
2
<3
6
14
3
<3
9
18
5
7
8
12
3
3
9
50
<2
20
20
0.42
0.24
<0.25
0.17
0.42
0.06
<0.25
0.25
0.67
0.07
<0.25
0.38
0.89
0.13
0.59
0.35
0.58
0.07
0.28
0.41
2.51
<0.05
1.65
0.86
35
35
35
35
30.9
30.9
30.9
30.9
30.9
30.9
30.9
30.9
26.1
26.1
26.1
26.1
37.9
37.9
37.9
37.9
45
45
45
45
2.9
3.3
<1.1
1.4
2.6
0.7
<0.9
1.7
4.2
0.8
<0.9
2.7
4.7
1.3
1.9
2.1
4.4
1.1
1.3
3.5
22.6
<0.9
9.0
8.9
% Sat % Sat
% Sat % Sat
% Sat % Sat
Meq/L Meq/L
Meq/L Meq/L
Meq/L Meq/L
Dry Soilmg/kg
Dry Soilmg/kg
Dry Soilmg/kg
Dry Soilmg/kg
Dry Soilmg/kg
Dry Soilmg/kg
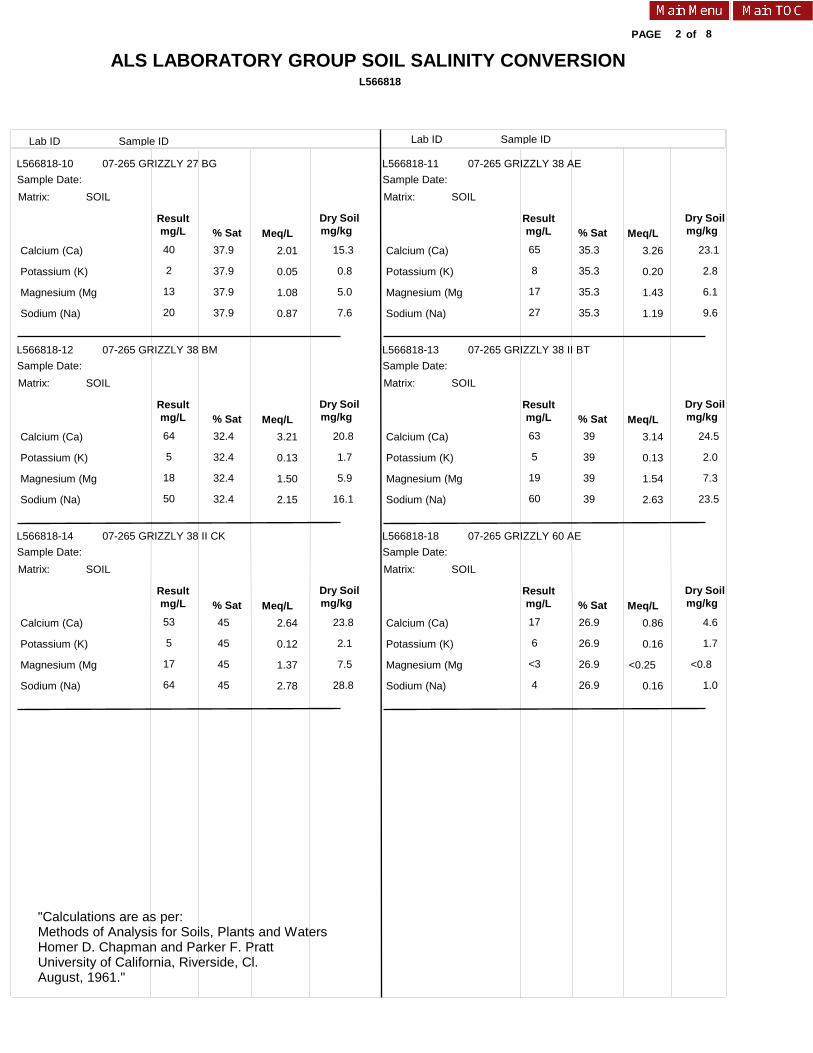
ALS LABORATORY GROUP SOIL SALINITY CONVERSIONL566818
2PAGE
Lab ID Sample ID
of
Lab ID Sample ID
"Calculations are as per:Methods of Analysis for Soils, Plants and WatersHomer D. Chapman and Parker F. PrattUniversity of California, Riverside, Cl.August, 1961."
8
L566818-10 L566818-11
L566818-12 L566818-13
L566818-14 L566818-18
07-265 GRIZZLY 27 BG 07-265 GRIZZLY 38 AE
07-265 GRIZZLY 38 BM 07-265 GRIZZLY 38 II BT
07-265 GRIZZLY 38 II CK 07-265 GRIZZLY 60 AE
Sample Date: Sample Date:
Sample Date: Sample Date:
Sample Date: Sample Date:
SOIL SOIL
SOIL SOIL
SOIL SOIL
Matrix: Matrix:
Matrix: Matrix:
Matrix: Matrix:
Resultmg/L
Resultmg/L
Resultmg/L
Resultmg/L
Resultmg/L
Resultmg/L
Calcium (Ca)
Potassium (K)
Magnesium (Mg)
Sodium (Na)
Calcium (Ca)
Potassium (K)
Magnesium (Mg)
Sodium (Na)
Calcium (Ca)
Potassium (K)
Magnesium (Mg)
Sodium (Na)
Calcium (Ca)
Potassium (K)
Magnesium (Mg)
Sodium (Na)
Calcium (Ca)
Potassium (K)
Magnesium (Mg)
Sodium (Na)
Calcium (Ca)
Potassium (K)
Magnesium (Mg)
Sodium (Na)
40
2
13
20
65
8
17
27
64
5
18
50
63
5
19
60
53
5
17
64
17
6
<3
4
2.01
0.05
1.08
0.87
3.26
0.20
1.43
1.19
3.21
0.13
1.50
2.15
3.14
0.13
1.54
2.63
2.64
0.12
1.37
2.78
0.86
0.16
<0.25
0.16
37.9
37.9
37.9
37.9
35.3
35.3
35.3
35.3
32.4
32.4
32.4
32.4
39
39
39
39
45
45
45
45
26.9
26.9
26.9
26.9
15.3
0.8
5.0
7.6
23.1
2.8
6.1
9.6
20.8
1.7
5.9
16.1
24.5
2.0
7.3
23.5
23.8
2.1
7.5
28.8
4.6
1.7
<0.8
1.0
% Sat % Sat
% Sat % Sat
% Sat % Sat
Meq/L Meq/L
Meq/L Meq/L
Meq/L Meq/L
Dry Soilmg/kg
Dry Soilmg/kg
Dry Soilmg/kg
Dry Soilmg/kg
Dry Soilmg/kg
Dry Soilmg/kg
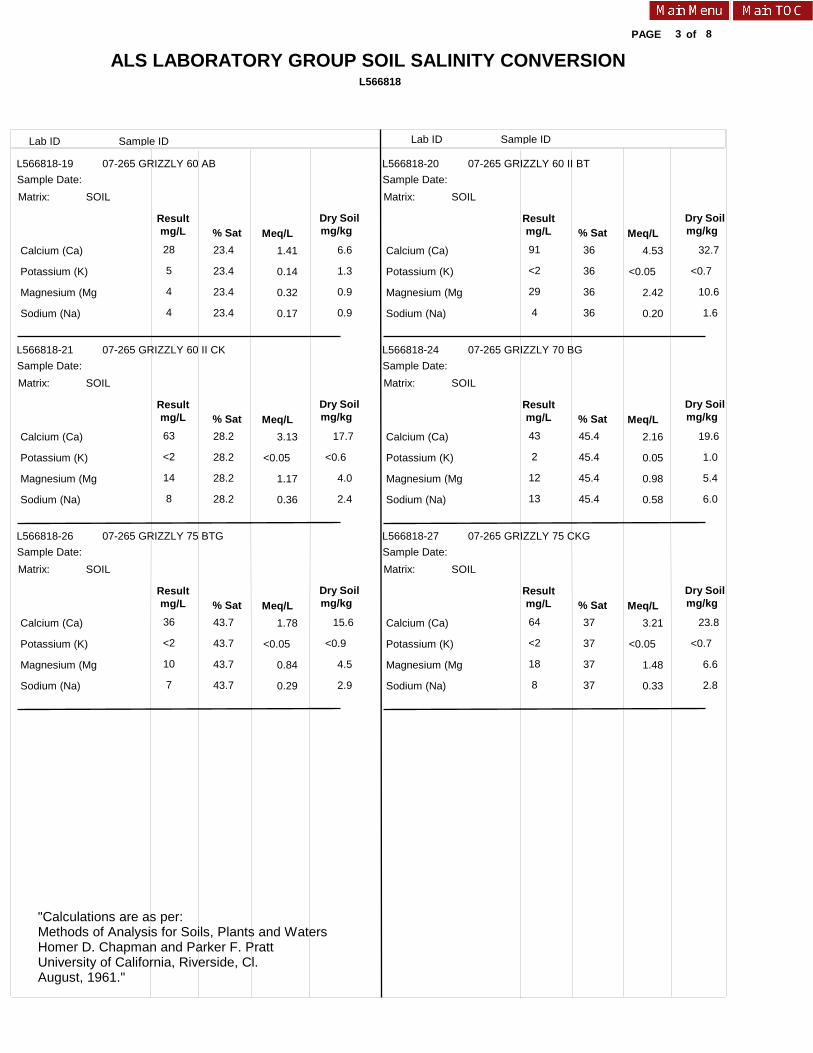
ALS LABORATORY GROUP SOIL SALINITY CONVERSIONL566818
3PAGE
Lab ID Sample ID
of
Lab ID Sample ID
"Calculations are as per:Methods of Analysis for Soils, Plants and WatersHomer D. Chapman and Parker F. PrattUniversity of California, Riverside, Cl.August, 1961."
8
L566818-19 L566818-20
L566818-21 L566818-24
L566818-26 L566818-27
07-265 GRIZZLY 60 AB 07-265 GRIZZLY 60 II BT
07-265 GRIZZLY 60 II CK 07-265 GRIZZLY 70 BG
07-265 GRIZZLY 75 BTG 07-265 GRIZZLY 75 CKG
Sample Date: Sample Date:
Sample Date: Sample Date:
Sample Date: Sample Date:
SOIL SOIL
SOIL SOIL
SOIL SOIL
Matrix: Matrix:
Matrix: Matrix:
Matrix: Matrix:
Resultmg/L
Resultmg/L
Resultmg/L
Resultmg/L
Resultmg/L
Resultmg/L
Calcium (Ca)
Potassium (K)
Magnesium (Mg)
Sodium (Na)
Calcium (Ca)
Potassium (K)
Magnesium (Mg)
Sodium (Na)
Calcium (Ca)
Potassium (K)
Magnesium (Mg)
Sodium (Na)
Calcium (Ca)
Potassium (K)
Magnesium (Mg)
Sodium (Na)
Calcium (Ca)
Potassium (K)
Magnesium (Mg)
Sodium (Na)
Calcium (Ca)
Potassium (K)
Magnesium (Mg)
Sodium (Na)
28
5
4
4
91
<2
29
4
63
<2
14
8
43
2
12
13
36
<2
10
7
64
<2
18
8
1.41
0.14
0.32
0.17
4.53
<0.05
2.42
0.20
3.13
<0.05
1.17
0.36
2.16
0.05
0.98
0.58
1.78
<0.05
0.84
0.29
3.21
<0.05
1.48
0.33
23.4
23.4
23.4
23.4
36
36
36
36
28.2
28.2
28.2
28.2
45.4
45.4
45.4
45.4
43.7
43.7
43.7
43.7
37
37
37
37
6.6
1.3
0.9
0.9
32.7
<0.7
10.6
1.6
17.7
<0.6
4.0
2.4
19.6
1.0
5.4
6.0
15.6
<0.9
4.5
2.9
23.8
<0.7
6.6
2.8
% Sat % Sat
% Sat % Sat
% Sat % Sat
Meq/L Meq/L
Meq/L Meq/L
Meq/L Meq/L
Dry Soilmg/kg
Dry Soilmg/kg
Dry Soilmg/kg
Dry Soilmg/kg
Dry Soilmg/kg
Dry Soilmg/kg

ALS LABORATORY GROUP SOIL SALINITY CONVERSIONL566818
4PAGE
Lab ID Sample ID
of
Lab ID Sample ID
"Calculations are as per:Methods of Analysis for Soils, Plants and WatersHomer D. Chapman and Parker F. PrattUniversity of California, Riverside, Cl.August, 1961."
8
L566818-29 L566818-30
L566818-31 L566818-32
L566818-33 L566818-36
07-265 GRIZZLY 67 AE 07-265 GRIZZLY 67 AB
07-265 GRIZZLY 67 BT 07-265 GRIZZLY 67 BC+CK
07-265 GRIZZLY 67 II C 07-265 GRIZZLY 83 AE2
Sample Date: Sample Date:
Sample Date: Sample Date:
Sample Date: Sample Date:
SOIL SOIL
SOIL SOIL
SOIL SOIL
Matrix: Matrix:
Matrix: Matrix:
Matrix: Matrix:
Resultmg/L
Resultmg/L
Resultmg/L
Resultmg/L
Resultmg/L
Resultmg/L
Calcium (Ca)
Potassium (K)
Magnesium (Mg)
Sodium (Na)
Calcium (Ca)
Potassium (K)
Magnesium (Mg)
Sodium (Na)
Calcium (Ca)
Potassium (K)
Magnesium (Mg)
Sodium (Na)
Calcium (Ca)
Potassium (K)
Magnesium (Mg)
Sodium (Na)
Calcium (Ca)
Potassium (K)
Magnesium (Mg)
Sodium (Na)
Calcium (Ca)
Potassium (K)
Magnesium (Mg)
Sodium (Na)
32
4
3
3
40
3
6
4
24
3
7
11
84
3
25
11
35
3
8
8
47
<2
10
6
1.60
0.11
0.27
0.13
2.01
0.08
0.51
0.16
1.21
0.09
0.57
0.46
4.18
0.07
2.08
0.49
1.75
0.07
0.66
0.36
2.37
<0.05
0.85
0.26
28.3
28.3
28.3
28.3
33.8
33.8
33.8
33.8
40.6
40.6
40.6
40.6
48.6
48.6
48.6
48.6
28.1
28.1
28.1
28.1
20
20
20
20
9.1
1.2
0.9
0.9
13.6
1.0
2.1
1.3
9.9
1.4
2.8
4.3
40.7
1.2
12.3
5.4
9.8
0.8
2.3
2.3
9.5
<0.4
2.1
1.2
% Sat % Sat
% Sat % Sat
% Sat % Sat
Meq/L Meq/L
Meq/L Meq/L
Meq/L Meq/L
Dry Soilmg/kg
Dry Soilmg/kg
Dry Soilmg/kg
Dry Soilmg/kg
Dry Soilmg/kg
Dry Soilmg/kg
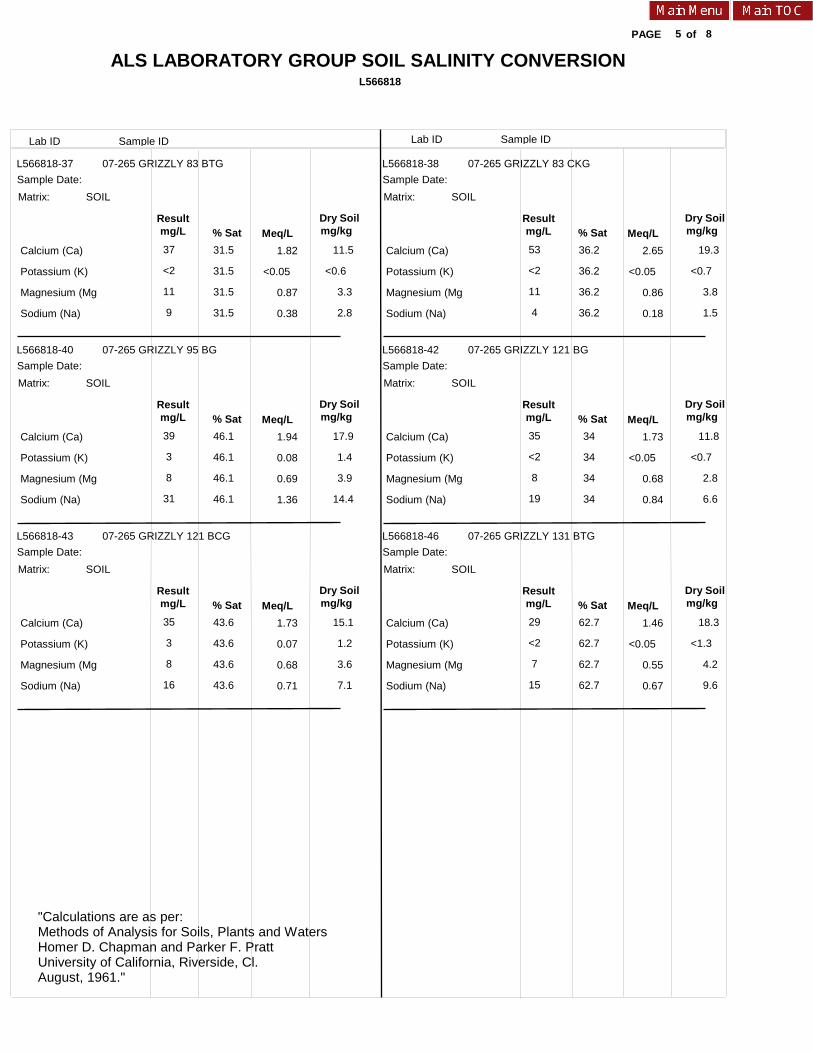
ALS LABORATORY GROUP SOIL SALINITY CONVERSIONL566818
5PAGE
Lab ID Sample ID
of
Lab ID Sample ID
"Calculations are as per:Methods of Analysis for Soils, Plants and WatersHomer D. Chapman and Parker F. PrattUniversity of California, Riverside, Cl.August, 1961."
8
L566818-37 L566818-38
L566818-40 L566818-42
L566818-43 L566818-46
07-265 GRIZZLY 83 BTG 07-265 GRIZZLY 83 CKG
07-265 GRIZZLY 95 BG 07-265 GRIZZLY 121 BG
07-265 GRIZZLY 121 BCG 07-265 GRIZZLY 131 BTG
Sample Date: Sample Date:
Sample Date: Sample Date:
Sample Date: Sample Date:
SOIL SOIL
SOIL SOIL
SOIL SOIL
Matrix: Matrix:
Matrix: Matrix:
Matrix: Matrix:
Resultmg/L
Resultmg/L
Resultmg/L
Resultmg/L
Resultmg/L
Resultmg/L
Calcium (Ca)
Potassium (K)
Magnesium (Mg)
Sodium (Na)
Calcium (Ca)
Potassium (K)
Magnesium (Mg)
Sodium (Na)
Calcium (Ca)
Potassium (K)
Magnesium (Mg)
Sodium (Na)
Calcium (Ca)
Potassium (K)
Magnesium (Mg)
Sodium (Na)
Calcium (Ca)
Potassium (K)
Magnesium (Mg)
Sodium (Na)
Calcium (Ca)
Potassium (K)
Magnesium (Mg)
Sodium (Na)
37
<2
11
9
53
<2
11
4
39
3
8
31
35
<2
8
19
35
3
8
16
29
<2
7
15
1.82
<0.05
0.87
0.38
2.65
<0.05
0.86
0.18
1.94
0.08
0.69
1.36
1.73
<0.05
0.68
0.84
1.73
0.07
0.68
0.71
1.46
<0.05
0.55
0.67
31.5
31.5
31.5
31.5
36.2
36.2
36.2
36.2
46.1
46.1
46.1
46.1
34
34
34
34
43.6
43.6
43.6
43.6
62.7
62.7
62.7
62.7
11.5
<0.6
3.3
2.8
19.3
<0.7
3.8
1.5
17.9
1.4
3.9
14.4
11.8
<0.7
2.8
6.6
15.1
1.2
3.6
7.1
18.3
<1.3
4.2
9.6
% Sat % Sat
% Sat % Sat
% Sat % Sat
Meq/L Meq/L
Meq/L Meq/L
Meq/L Meq/L
Dry Soilmg/kg
Dry Soilmg/kg
Dry Soilmg/kg
Dry Soilmg/kg
Dry Soilmg/kg
Dry Soilmg/kg

ALS LABORATORY GROUP SOIL SALINITY CONVERSIONL566818
6PAGE
Lab ID Sample ID
of
Lab ID Sample ID
"Calculations are as per:Methods of Analysis for Soils, Plants and WatersHomer D. Chapman and Parker F. PrattUniversity of California, Riverside, Cl.August, 1961."
8
L566818-48 L566818-49
L566818-50 L566818-52
L566818-53 L566818-54
07-265 GRIZZLY 132 AE 07-265 GRIZZLY 132 BT
07-265 GRIZZLY 132 BC+CCA 07-265 GRIZZLY 147 AEG
07-265 GRIZZLY 147 BTJG 07-265 GRIZZLY 147 BCG
Sample Date: Sample Date:
Sample Date: Sample Date:
Sample Date: Sample Date:
SOIL SOIL
SOIL SOIL
SOIL SOIL
Matrix: Matrix:
Matrix: Matrix:
Matrix: Matrix:
Resultmg/L
Resultmg/L
Resultmg/L
Resultmg/L
Resultmg/L
Resultmg/L
Calcium (Ca)
Potassium (K)
Magnesium (Mg)
Sodium (Na)
Calcium (Ca)
Potassium (K)
Magnesium (Mg)
Sodium (Na)
Calcium (Ca)
Potassium (K)
Magnesium (Mg)
Sodium (Na)
Calcium (Ca)
Potassium (K)
Magnesium (Mg)
Sodium (Na)
Calcium (Ca)
Potassium (K)
Magnesium (Mg)
Sodium (Na)
Calcium (Ca)
Potassium (K)
Magnesium (Mg)
Sodium (Na)
30
9
9
3
18
5
5
3
43
<2
16
19
14
7
3
6
19
3
4
8
28
<2
9
10
1.49
0.23
0.70
0.15
0.90
0.14
0.40
0.14
2.13
<0.05
1.34
0.81
0.69
0.18
0.28
0.28
0.94
0.09
0.32
0.33
1.41
<0.05
0.72
0.42
27
27
27
27
52.8
52.8
52.8
52.8
56.3
56.3
56.3
56.3
32.2
32.2
32.2
32.2
25
25
25
25
52.6
52.6
52.6
52.6
8.1
2.4
2.3
0.9
9.5
2.8
2.6
1.7
24.0
<1.1
9.2
10.5
4.5
2.2
1.1
2.1
4.7
0.9
1.0
1.9
14.8
<1.1
4.6
5.1
% Sat % Sat
% Sat % Sat
% Sat % Sat
Meq/L Meq/L
Meq/L Meq/L
Meq/L Meq/L
Dry Soilmg/kg
Dry Soilmg/kg
Dry Soilmg/kg
Dry Soilmg/kg
Dry Soilmg/kg
Dry Soilmg/kg
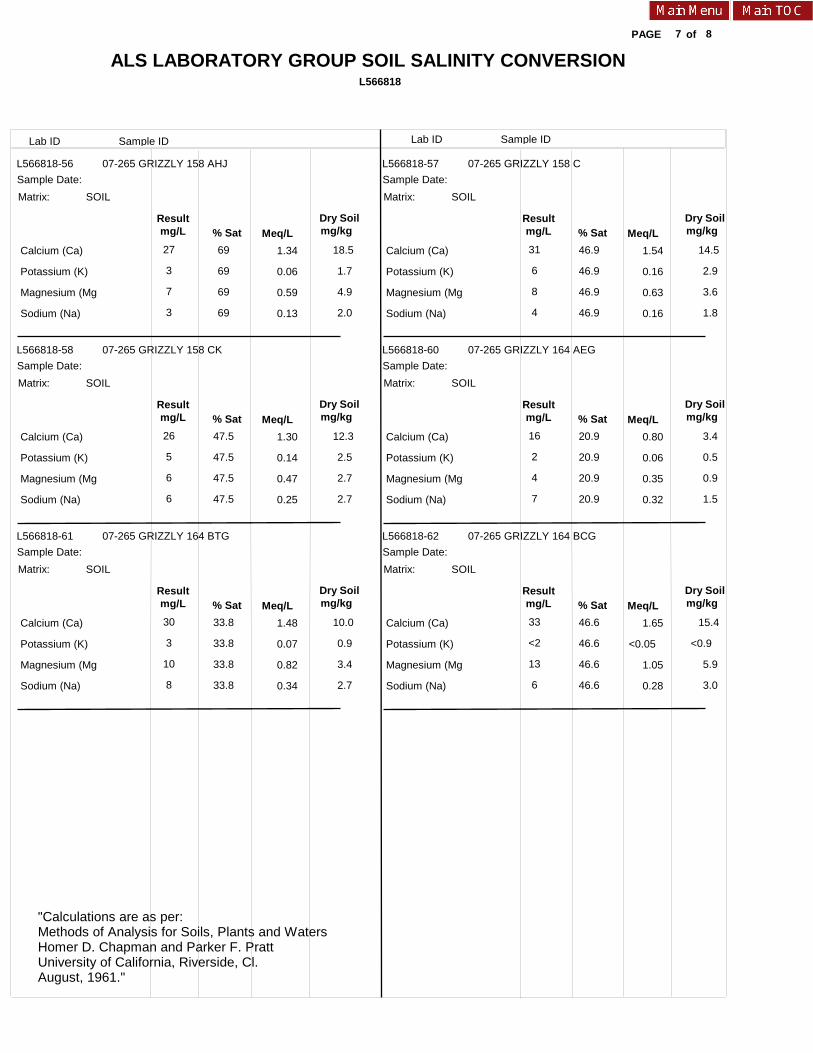
ALS LABORATORY GROUP SOIL SALINITY CONVERSIONL566818
7PAGE
Lab ID Sample ID
of
Lab ID Sample ID
"Calculations are as per:Methods of Analysis for Soils, Plants and WatersHomer D. Chapman and Parker F. PrattUniversity of California, Riverside, Cl.August, 1961."
8
L566818-56 L566818-57
L566818-58 L566818-60
L566818-61 L566818-62
07-265 GRIZZLY 158 AHJ 07-265 GRIZZLY 158 C
07-265 GRIZZLY 158 CK 07-265 GRIZZLY 164 AEG
07-265 GRIZZLY 164 BTG 07-265 GRIZZLY 164 BCG
Sample Date: Sample Date:
Sample Date: Sample Date:
Sample Date: Sample Date:
SOIL SOIL
SOIL SOIL
SOIL SOIL
Matrix: Matrix:
Matrix: Matrix:
Matrix: Matrix:
Resultmg/L
Resultmg/L
Resultmg/L
Resultmg/L
Resultmg/L
Resultmg/L
Calcium (Ca)
Potassium (K)
Magnesium (Mg)
Sodium (Na)
Calcium (Ca)
Potassium (K)
Magnesium (Mg)
Sodium (Na)
Calcium (Ca)
Potassium (K)
Magnesium (Mg)
Sodium (Na)
Calcium (Ca)
Potassium (K)
Magnesium (Mg)
Sodium (Na)
Calcium (Ca)
Potassium (K)
Magnesium (Mg)
Sodium (Na)
Calcium (Ca)
Potassium (K)
Magnesium (Mg)
Sodium (Na)
27
3
7
3
31
6
8
4
26
5
6
6
16
2
4
7
30
3
10
8
33
<2
13
6
1.34
0.06
0.59
0.13
1.54
0.16
0.63
0.16
1.30
0.14
0.47
0.25
0.80
0.06
0.35
0.32
1.48
0.07
0.82
0.34
1.65
<0.05
1.05
0.28
69
69
69
69
46.9
46.9
46.9
46.9
47.5
47.5
47.5
47.5
20.9
20.9
20.9
20.9
33.8
33.8
33.8
33.8
46.6
46.6
46.6
46.6
18.5
1.7
4.9
2.0
14.5
2.9
3.6
1.8
12.3
2.5
2.7
2.7
3.4
0.5
0.9
1.5
10.0
0.9
3.4
2.7
15.4
<0.9
5.9
3.0
% Sat % Sat
% Sat % Sat
% Sat % Sat
Meq/L Meq/L
Meq/L Meq/L
Meq/L Meq/L
Dry Soilmg/kg
Dry Soilmg/kg
Dry Soilmg/kg
Dry Soilmg/kg
Dry Soilmg/kg
Dry Soilmg/kg
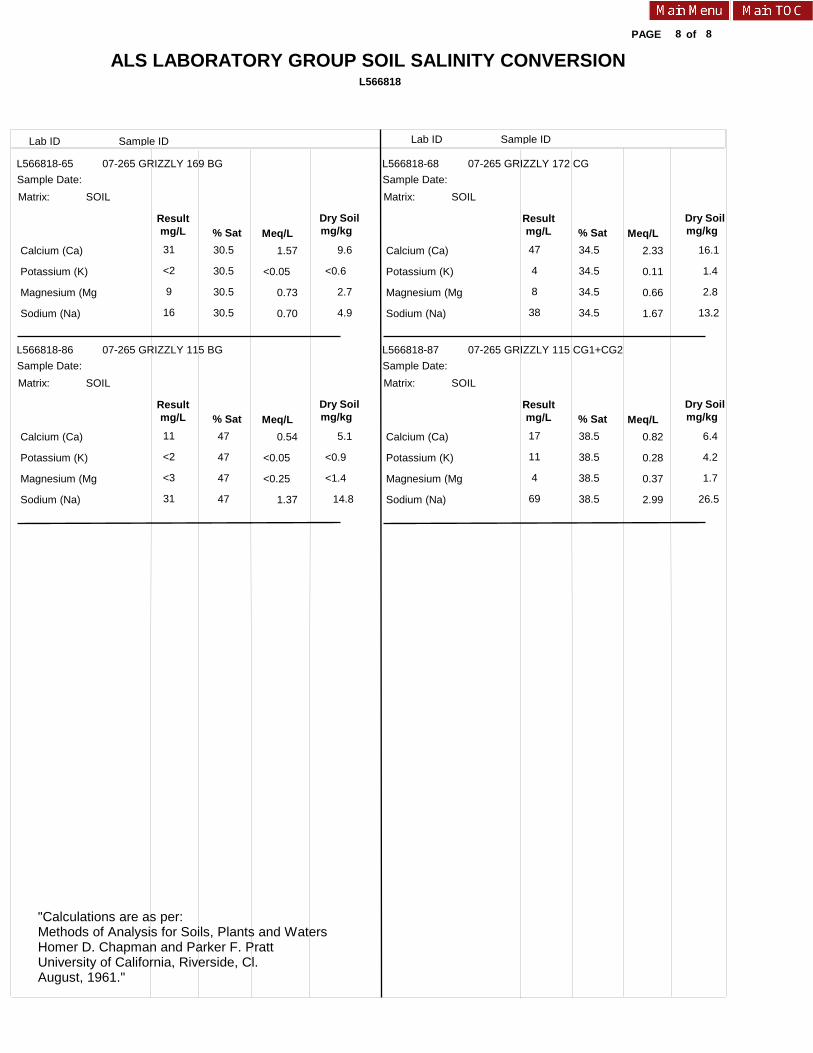
ALS LABORATORY GROUP SOIL SALINITY CONVERSIONL566818
8PAGE
Lab ID Sample ID
of
Lab ID Sample ID
"Calculations are as per:Methods of Analysis for Soils, Plants and WatersHomer D. Chapman and Parker F. PrattUniversity of California, Riverside, Cl.August, 1961."
8
L566818-65 L566818-68
L566818-86 L566818-87
07-265 GRIZZLY 169 BG 07-265 GRIZZLY 172 CG
07-265 GRIZZLY 115 BG 07-265 GRIZZLY 115 CG1+CG2
Sample Date: Sample Date:
Sample Date: Sample Date:
SOIL SOIL
SOIL SOIL
Matrix: Matrix:
Matrix: Matrix:
Resultmg/L
Resultmg/L
Resultmg/L
Resultmg/L
Calcium (Ca)
Potassium (K)
Magnesium (Mg)
Sodium (Na)
Calcium (Ca)
Potassium (K)
Magnesium (Mg)
Sodium (Na)
Calcium (Ca)
Potassium (K)
Magnesium (Mg)
Sodium (Na)
Calcium (Ca)
Potassium (K)
Magnesium (Mg)
Sodium (Na)
31
<2
9
16
47
4
8
38
11
<2
<3
31
17
11
4
69
1.57
<0.05
0.73
0.70
2.33
0.11
0.66
1.67
0.54
<0.05
<0.25
1.37
0.82
0.28
0.37
2.99
30.5
30.5
30.5
30.5
34.5
34.5
34.5
34.5
47
47
47
47
38.5
38.5
38.5
38.5
9.6
<0.6
2.7
4.9
16.1
1.4
2.8
13.2
5.1
<0.9
<1.4
14.8
6.4
4.2
1.7
26.5
% Sat % Sat
% Sat % Sat
Meq/L Meq/L
Meq/L Meq/L
Dry Soilmg/kg
Dry Soilmg/kg
Dry Soilmg/kg
Dry Soilmg/kg
Grizzly Oil Sands Algar Lake SAGD Project Millennium EMS Solutions Ltd. January 2010
07-099
APPENDIX C: RECLAMATION SUITABILITY CALCULATIONS
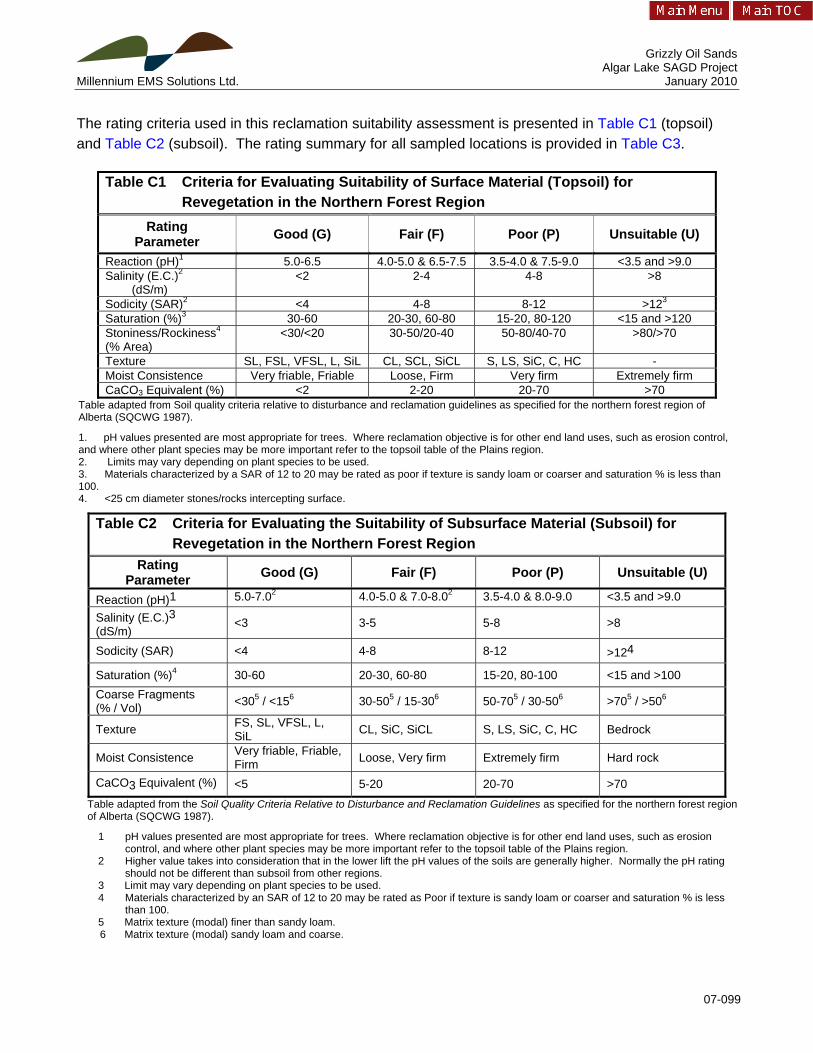
Grizzly Oil Sands Algar Lake SAGD Project Millennium EMS Solutions Ltd. January 2010
07-099
The rating criteria used in this reclamation suitability assessment is presented in Table C1 (topsoil) and Table C2 (subsoil). The rating summary for all sampled locations is provided in Table C3.
Table C1 Criteria for Evaluating Suitability of Surface Material (Topsoil) for Revegetation in the Northern Forest Region
Rating Parameter Good (G) Fair (F) Poor (P) Unsuitable (U)
Reaction (pH)1 5.0-6.5 4.0-5.0 & 6.5-7.5 3.5-4.0 & 7.5-9.0 <3.5 and >9.0 Salinity (E.C.)2
(dS/m) <2 2-4 4-8 >8
Sodicity (SAR)2 <4 4-8 8-12 >123 Saturation (%)3 30-60 20-30, 60-80 15-20, 80-120 <15 and >120 Stoniness/Rockiness4 (% Area)
<30/<20 30-50/20-40 50-80/40-70 >80/>70
Texture SL, FSL, VFSL, L, SiL CL, SCL, SiCL S, LS, SiC, C, HC - Moist Consistence Very friable, Friable Loose, Firm Very firm Extremely firm CaCO3 Equivalent (%) <2 2-20 20-70 >70
Table adapted from Soil quality criteria relative to disturbance and reclamation guidelines as specified for the northern forest region of Alberta (SQCWG 1987).
1. pH values presented are most appropriate for trees. Where reclamation objective is for other end land uses, such as erosion control, and where other plant species may be more important refer to the topsoil table of the Plains region. 2. Limits may vary depending on plant species to be used. 3. Materials characterized by a SAR of 12 to 20 may be rated as poor if texture is sandy loam or coarser and saturation % is less than 100. 4. <25 cm diameter stones/rocks intercepting surface.
Table C2 Criteria for Evaluating the Suitability of Subsurface Material (Subsoil) for Revegetation in the Northern Forest Region
Rating Parameter Good (G) Fair (F) Poor (P) Unsuitable (U)
Reaction (pH)1 5.0-7.02 4.0-5.0 & 7.0-8.02 3.5-4.0 & 8.0-9.0 <3.5 and >9.0
Salinity (E.C.)3 (dS/m)
<3 3-5 5-8 >8
Sodicity (SAR) <4 4-8 8-12 >124
Saturation (%)4 30-60 20-30, 60-80 15-20, 80-100 <15 and >100 Coarse Fragments (% / Vol) <305 / <156 30-505 / 15-306 50-705 / 30-506 >705 / >506
Texture FS, SL, VFSL, L, SiL CL, SiC, SiCL S, LS, SiC, C, HC Bedrock
Moist Consistence Very friable, Friable, Firm Loose, Very firm Extremely firm Hard rock
CaCO3 Equivalent (%) <5 5-20 20-70 >70
Table adapted from the Soil Quality Criteria Relative to Disturbance and Reclamation Guidelines as specified for the northern forest region of Alberta (SQCWG 1987).
1 pH values presented are most appropriate for trees. Where reclamation objective is for other end land uses, such as erosion control, and where other plant species may be more important refer to the topsoil table of the Plains region.
2 Higher value takes into consideration that in the lower lift the pH values of the soils are generally higher. Normally the pH rating should not be different than subsoil from other regions.
3 Limit may vary depending on plant species to be used. 4 Materials characterized by an SAR of 12 to 20 may be rated as Poor if texture is sandy loam or coarser and saturation % is less
than 100. 5 Matrix texture (modal) finer than sandy loam. 6 Matrix texture (modal) sandy loam and coarse.
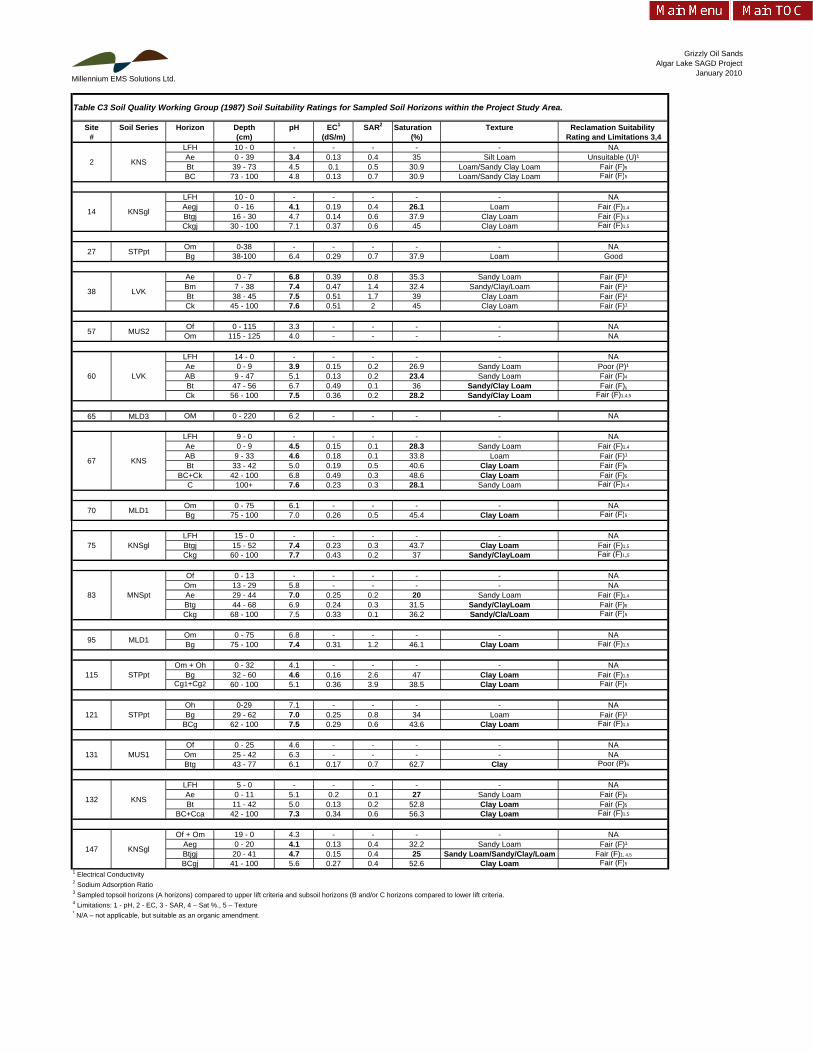
Millennium EMS Solutions Ltd.
Grizzly Oil SandsAlgar Lake SAGD Project
January 2010
Table C3 Soil Quality Working Group (1987) Soil Suitability Ratings for Sampled Soil Horizons within the Project Study Area.
Site Soil Series Horizon Depth pH EC1 SAR2 Saturation Texture Reclamation Suitability # (cm) (dS/m) (%) Rating and Limitations 3,4
LFH 10 - 0 - - - - - NAAe 0 - 39 3.4 0.13 0.4 35 Silt Loam Unsuitable (U)¹Bt 39 - 73 4.5 0.1 0.5 30.9 Loam/Sandy Clay Loam Fair (F)5
BC 73 - 100 4.8 0.13 0.7 30.9 Loam/Sandy Clay Loam Fair (F)5
LFH 10 - 0 - - - - - NAAegj 0 - 16 4.1 0.19 0.4 26.1 Loam Fair (F)1,4
Btgj 16 - 30 4.7 0.14 0.6 37.9 Clay Loam Fair (F)1,5
Ckgj 30 - 100 7.1 0.37 0.6 45 Clay Loam Fair (F)1,5
Om 0-38 - - - - - NABg 38-100 6.4 0.29 0.7 37.9 Loam Good
Ae 0 - 7 6.8 0.39 0.8 35.3 Sandy Loam Fair (F)¹Bm 7 - 38 7.4 0.47 1.4 32.4 Sandy/Clay/Loam Fair (F)¹Bt 38 - 45 7.5 0.51 1.7 39 Clay Loam Fair (F)¹Ck 45 - 100 7.6 0.51 2 45 Clay Loam Fair (F)¹
Of 0 - 115 3.3 - - - - NAOm 115 - 125 4.0 - - - - NA
LFH 14 - 0 - - - - - NAAe 0 - 9 3.9 0.15 0.2 26.9 Sandy Loam Poor (P)¹AB 9 - 47 5.1 0.13 0.2 23.4 Sandy Loam Fair (F)4
Bt 47 - 56 6.7 0.49 0.1 36 Sandy/Clay Loam Fair (F)5
Ck 56 - 100 7.5 0.36 0.2 28.2 Sandy/Clay Loam Fair (F)1,4,5
65 MLD3 OM 0 - 220 6.2 - - - - NA
LFH 9 - 0 - - - - - NAAe 0 - 9 4.5 0.15 0.1 28.3 Sandy Loam Fair (F)1,4
AB 9 - 33 4.6 0.18 0.1 33.8 Loam Fair (F)¹Bt 33 - 42 5.0 0.19 0.5 40.6 Clay Loam Fair (F)5
BC+Ck 42 - 100 6.8 0.49 0.3 48.6 Clay Loam Fair (F)5
C 100+ 7.6 0.23 0.3 28.1 Sandy Loam Fair (F)1,4
Om 0 - 75 6.1 - - - - NABg 75 - 100 7.0 0.26 0.5 45.4 Clay Loam Fair (F)5
LFH 15 - 0 - - - - - NABtgj 15 - 52 7.4 0.23 0.3 43.7 Clay Loam Fair (F)1,5
Ckg 60 - 100 7.7 0.43 0.2 37 Sandy/ClayLoam Fair (F)1,5
Of 0 - 13 - - - - - NAOm 13 - 29 5.8 - - - - NAAe 29 - 44 7.0 0.25 0.2 20 Sandy Loam Fair (F)1,4
Btg 44 - 68 6.9 0.24 0.3 31.5 Sandy/ClayLoam Fair (F)5
Ckg 68 - 100 7.5 0.33 0.1 36.2 Sandy/Cla/Loam Fair (F)5
Om 0 - 75 6.8 - - - - NABg 75 - 100 7.4 0.31 1.2 46.1 Clay Loam Fair (F)1,5
Om + Oh 0 - 32 4.1 - - - - NABg 32 - 60 4.6 0.16 2.6 47 Clay Loam Fair (F)1,5
Cg1+Cg2 60 - 100 5.1 0.36 3.9 38.5 Clay Loam Fair (F)5
Oh 0-29 7.1 - - - - NABg 29 - 62 7.0 0.25 0.8 34 Loam Fair (F)¹
BCg 62 - 100 7.5 0.29 0.6 43.6 Clay Loam Fair (F)1,5
Of 0 - 25 4.6 - - - - NAOm 25 - 42 6.3 - - - - NABtg 43 - 77 6.1 0.17 0.7 62.7 Clay Poor (P)5
LFH 5 - 0 - - - - - NAAe 0 - 11 5.1 0.2 0.1 27 Sandy Loam Fair (F)4
Bt 11 - 42 5.0 0.13 0.2 52.8 Clay Loam Fair (F)5
BC+Cca 42 - 100 7.3 0.34 0.6 56.3 Clay Loam Fair (F)1,5
Of + Om 19 - 0 4.3 - - - - NAAeg 0 - 20 4.1 0.13 0.4 32.2 Sandy Loam Fair (F)¹Btjgj 20 - 41 4.7 0.15 0.4 25 Sandy Loam/Sandy/Clay/Loam Fair (F)1, 4,5
BCgj 41 - 100 5.6 0.27 0.4 52.6 Clay Loam Fair (F)5
1 Electrical Conductivity2 Sodium Adsorption Ratio3 Sampled topsoil horizons (A horizons) compared to upper lift criteria and subsoil horizons (B and/or C horizons compared to lower lift criteria.4 Limitations: 1 - pH, 2 - EC, 3 - SAR, 4 – Sat %., 5 – Texture* N/A – not applicable, but suitable as an organic amendment.
2 KNS
14 KNSgl
27
38 LVK
STPpt
57
60
67
70
75
83
95
115
121
131
132
147 KNSgl
KNS
STPpt
MUS1
STPpt
MLD1
MNSpt
KNSgl
KNS
MLD1
LVK
MUS2
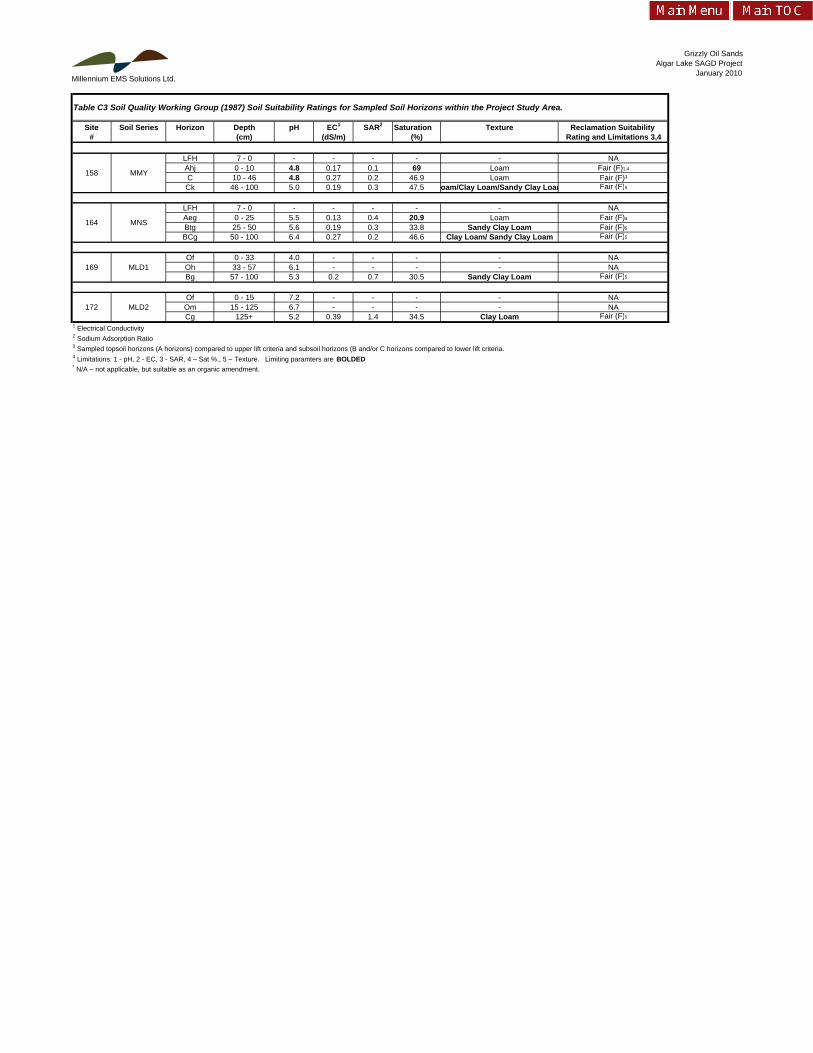
Millennium EMS Solutions Ltd.
Grizzly Oil SandsAlgar Lake SAGD Project
January 2010
Table C3 Soil Quality Working Group (1987) Soil Suitability Ratings for Sampled Soil Horizons within the Project Study Area.
Site Soil Series Horizon Depth pH EC1 SAR2 Saturation Texture Reclamation Suitability # (cm) (dS/m) (%) Rating and Limitations 3,4
LFH 7 - 0 - - - - - NAAhj 0 - 10 4.8 0.17 0.1 69 Loam Fair (F)1,4
C 10 - 46 4.8 0.27 0.2 46.9 Loam Fair (F)¹Ck 46 - 100 5.0 0.19 0.3 47.5 oam/Clay Loam/Sandy Clay Loam Fair (F)5
LFH 7 - 0 - - - - - NAAeg 0 - 25 5.5 0.13 0.4 20.9 Loam Fair (F)4
Btg 25 - 50 5.6 0.19 0.3 33.8 Sandy Clay Loam Fair (F)5
BCg 50 - 100 6.4 0.27 0.2 46.6 Clay Loam/ Sandy Clay Loam Fair (F)5
Of 0 - 33 4.0 - - - - NAOh 33 - 57 6.1 - - - - NABg 57 - 100 5.3 0.2 0.7 30.5 Sandy Clay Loam Fair (F)5
Of 0 - 15 7.2 - - - - NAOm 15 - 125 6.7 - - - - NACg 125+ 5.2 0.39 1.4 34.5 Clay Loam Fair (F)5
1 Electrical Conductivity2 Sodium Adsorption Ratio3 Sampled topsoil horizons (A horizons) compared to upper lift criteria and subsoil horizons (B and/or C horizons compared to lower lift criteria.4 Limitations: 1 - pH, 2 - EC, 3 - SAR, 4 – Sat %., 5 – Texture. Limiting paramters are BOLDED* N/A – not applicable, but suitable as an organic amendment.
158
164
169
172 MLD2
MLD1
MNS
MMY
Grizzly Oil Sands Algar Lake SAGD Project Millennium EMS Solutions Ltd. January 2010
07-099
APPENDIX D: LAND CAPABILITY CALCULATIONS
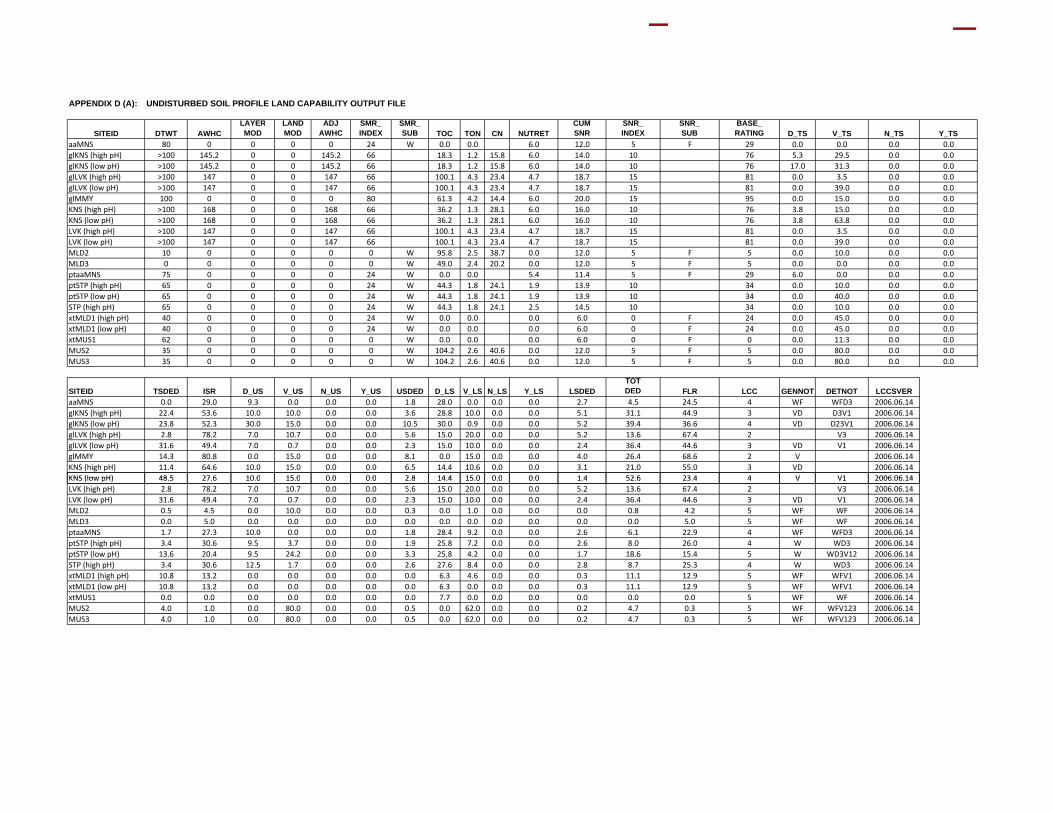
APPENDIX D (A): UNDISTURBED SOIL PROFILE LAND CAPABILITY OUTPUT FILE
SITEID DTWT AWHCLAYERMOD
LANDMOD
ADJAWHC
SMR_INDEX
SMR_SUB TOC TON CN NUTRET
CUMSNR
SNR_INDEX
SNR_SUB
BASE_RATING D_TS V_TS N_TS Y_TS
aaMNS 80 0 0 0 0 24 W 0.0 0.0 6.0 12.0 5 F 29 0.0 0.0 0.0 0.0glKNS (high pH) >100 145.2 0 0 145.2 66 18.3 1.2 15.8 6.0 14.0 10 76 5.3 29.5 0.0 0.0glKNS (low pH) >100 145.2 0 0 145.2 66 18.3 1.2 15.8 6.0 14.0 10 76 17.0 31.3 0.0 0.0glLVK (high pH) >100 147 0 0 147 66 100.1 4.3 23.4 4.7 18.7 15 81 0.0 3.5 0.0 0.0glLVK (low pH) >100 147 0 0 147 66 100.1 4.3 23.4 4.7 18.7 15 81 0.0 39.0 0.0 0.0glMMY 100 0 0 0 0 80 61.3 4.2 14.4 6.0 20.0 15 95 0.0 15.0 0.0 0.0KNS (high pH) >100 168 0 0 168 66 36.2 1.3 28.1 6.0 16.0 10 76 3.8 15.0 0.0 0.0KNS (low pH) >100 168 0 0 168 66 36.2 1.3 28.1 6.0 16.0 10 76 3.8 63.8 0.0 0.0LVK (high pH) >100 147 0 0 147 66 100.1 4.3 23.4 4.7 18.7 15 81 0.0 3.5 0.0 0.0LVK (low pH) >100 147 0 0 147 66 100.1 4.3 23.4 4.7 18.7 15 81 0.0 39.0 0.0 0.0MLD2 10 0 0 0 0 0 W 95.8 2.5 38.7 0.0 12.0 5 F 5 0.0 10.0 0.0 0.0MLD3 0 0 0 0 0 0 W 49.0 2.4 20.2 0.0 12.0 5 F 5 0.0 0.0 0.0 0.0ptaaMNS 75 0 0 0 0 24 W 0.0 0.0 5.4 11.4 5 F 29 6.0 0.0 0.0 0.0ptSTP (high pH) 65 0 0 0 0 24 W 44.3 1.8 24.1 1.9 13.9 10 34 0.0 10.0 0.0 0.0ptSTP (low pH) 65 0 0 0 0 24 W 44.3 1.8 24.1 1.9 13.9 10 34 0.0 40.0 0.0 0.0STP (high pH) 65 0 0 0 0 24 W 44.3 1.8 24.1 2.5 14.5 10 34 0.0 10.0 0.0 0.0xtMLD1 (high pH) 40 0 0 0 0 24 W 0.0 0.0 0.0 6.0 0 F 24 0.0 45.0 0.0 0.0xtMLD1 (low pH) 40 0 0 0 0 24 W 0.0 0.0 0.0 6.0 0 F 24 0.0 45.0 0.0 0.0xtMUS1 62 0 0 0 0 0 W 0.0 0.0 0.0 6.0 0 F 0 0.0 11.3 0.0 0.0MUS2 35 0 0 0 0 0 W 104.2 2.6 40.6 0.0 12.0 5 F 5 0.0 80.0 0.0 0.0MUS3 35 0 0 0 0 0 W 104.2 2.6 40.6 0.0 12.0 5 F 5 0.0 80.0 0.0 0.0
SITEID TSDED ISR D_US V_US N_US Y_US USDED D_LS V_LS N_LS Y_LS LSDEDTOTDED FLR LCC GENNOT DETNOT LCCSVER
aaMNS 0.0 29.0 9.3 0.0 0.0 0.0 1.8 28.0 0.0 0.0 0.0 2.7 4.5 24.5 4 WF WFD3 2006.06.14glKNS (high pH) 22.4 53.6 10.0 10.0 0.0 0.0 3.6 28.8 10.0 0.0 0.0 5.1 31.1 44.9 3 VD D3V1 2006.06.14glKNS (low pH) 23.8 52.3 30.0 15.0 0.0 0.0 10.5 30.0 0.9 0.0 0.0 5.2 39.4 36.6 4 VD D23V1 2006.06.14glLVK (high pH) 2.8 78.2 7.0 10.7 0.0 0.0 5.6 15.0 20.0 0.0 0.0 5.2 13.6 67.4 2 V3 2006.06.14glLVK (low pH) 31.6 49.4 7.0 0.7 0.0 0.0 2.3 15.0 10.0 0.0 0.0 2.4 36.4 44.6 3 VD V1 2006.06.14glMMY 14.3 80.8 0.0 15.0 0.0 0.0 8.1 0.0 15.0 0.0 0.0 4.0 26.4 68.6 2 V 2006.06.14KNS (high pH) 11.4 64.6 10.0 15.0 0.0 0.0 6.5 14.4 10.6 0.0 0.0 3.1 21.0 55.0 3 VD 2006.06.14KNS (low pH) 48 5 27 6 10 0 15 0 0 0 0 0 2 8 14 4 15 0 0 0 0 0 1 4 52 6 23 4 4 V V1 2006 06 14KNS (low pH) 48.5 27.6 10.0 15.0 0.0 0.0 2.8 14.4 15.0 0.0 0.0 1.4 52.6 23.4 4 V V1 2006.06.14LVK (high pH) 2.8 78.2 7.0 10.7 0.0 0.0 5.6 15.0 20.0 0.0 0.0 5.2 13.6 67.4 2 V3 2006.06.14LVK (low pH) 31.6 49.4 7.0 0.7 0.0 0.0 2.3 15.0 10.0 0.0 0.0 2.4 36.4 44.6 3 VD V1 2006.06.14MLD2 0.5 4.5 0.0 10.0 0.0 0.0 0.3 0.0 1.0 0.0 0.0 0.0 0.8 4.2 5 WF WF 2006.06.14MLD3 0.0 5.0 0.0 0.0 0.0 0.0 0.0 0.0 0.0 0.0 0.0 0.0 0.0 5.0 5 WF WF 2006.06.14ptaaMNS 1.7 27.3 10.0 0.0 0.0 0.0 1.8 28.4 9.2 0.0 0.0 2.6 6.1 22.9 4 WF WFD3 2006.06.14ptSTP (high pH) 3.4 30.6 9.5 3.7 0.0 0.0 1.9 25.8 7.2 0.0 0.0 2.6 8.0 26.0 4 W WD3 2006.06.14ptSTP (low pH) 13.6 20.4 9.5 24.2 0.0 0.0 3.3 25.8 4.2 0.0 0.0 1.7 18.6 15.4 5 W WD3V12 2006.06.14STP (high pH) 3.4 30.6 12.5 1.7 0.0 0.0 2.6 27.6 8.4 0.0 0.0 2.8 8.7 25.3 4 W WD3 2006.06.14xtMLD1 (high pH) 10.8 13.2 0.0 0.0 0.0 0.0 0.0 6.3 4.6 0.0 0.0 0.3 11.1 12.9 5 WF WFV1 2006.06.14xtMLD1 (low pH) 10.8 13.2 0.0 0.0 0.0 0.0 0.0 6.3 0.0 0.0 0.0 0.3 11.1 12.9 5 WF WFV1 2006.06.14xtMUS1 0.0 0.0 0.0 0.0 0.0 0.0 0.0 7.7 0.0 0.0 0.0 0.0 0.0 0.0 5 WF WF 2006.06.14MUS2 4.0 1.0 0.0 80.0 0.0 0.0 0.5 0.0 62.0 0.0 0.0 0.2 4.7 0.3 5 WF WFV123 2006.06.14MUS3 4.0 1.0 0.0 80.0 0.0 0.0 0.5 0.0 62.0 0.0 0.0 0.2 4.7 0.3 5 WF WFV123 2006.06.14
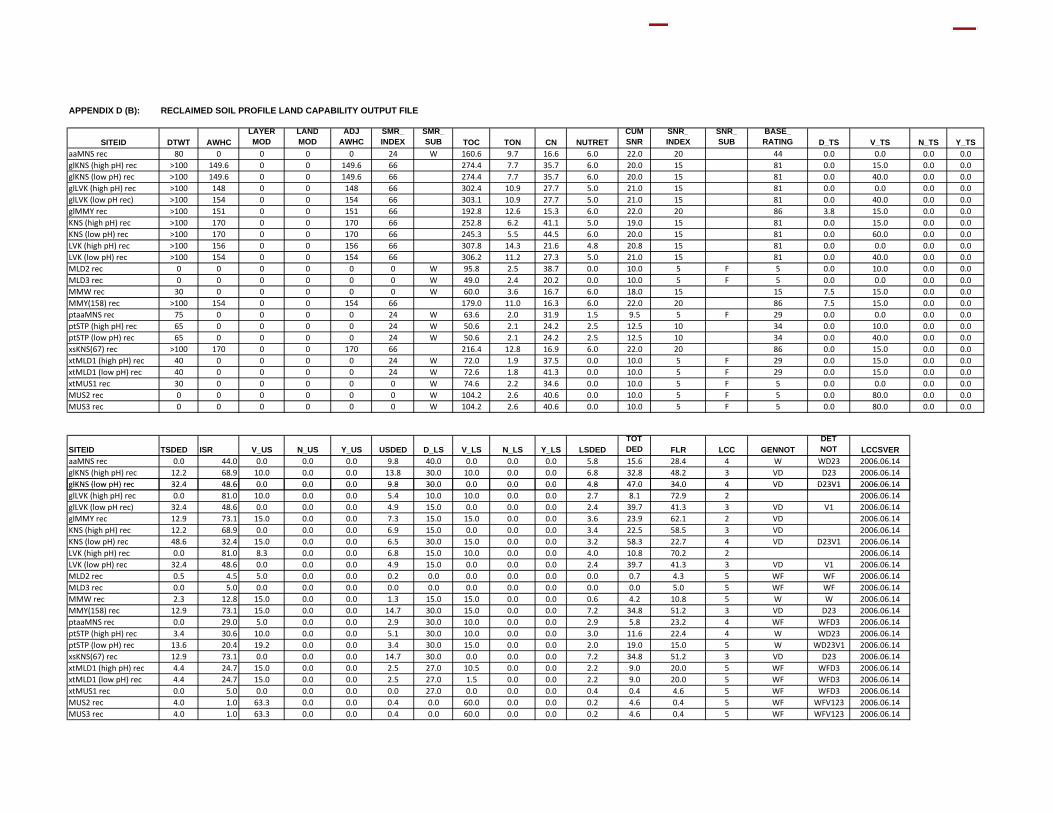
APPENDIX D (B): RECLAIMED SOIL PROFILE LAND CAPABILITY OUTPUT FILE
SITEID DTWT AWHCLAYERMOD
LANDMOD
ADJAWHC
SMR_INDEX
SMR_SUB TOC TON CN NUTRET
CUMSNR
SNR_INDEX
SNR_SUB
BASE_RATING D_TS V_TS N_TS Y_TS
aaMNS rec 80 0 0 0 0 24 W 160.6 9.7 16.6 6.0 22.0 20 44 0.0 0.0 0.0 0.0glKNS (high pH) rec >100 149.6 0 0 149.6 66 274.4 7.7 35.7 6.0 20.0 15 81 0.0 15.0 0.0 0.0glKNS (low pH) rec >100 149.6 0 0 149.6 66 274.4 7.7 35.7 6.0 20.0 15 81 0.0 40.0 0.0 0.0glLVK (high pH) rec >100 148 0 0 148 66 302.4 10.9 27.7 5.0 21.0 15 81 0.0 0.0 0.0 0.0glLVK (low pH rec) >100 154 0 0 154 66 303.1 10.9 27.7 5.0 21.0 15 81 0.0 40.0 0.0 0.0glMMY rec >100 151 0 0 151 66 192.8 12.6 15.3 6.0 22.0 20 86 3.8 15.0 0.0 0.0KNS (high pH) rec >100 170 0 0 170 66 252.8 6.2 41.1 5.0 19.0 15 81 0.0 15.0 0.0 0.0KNS (low pH) rec >100 170 0 0 170 66 245.3 5.5 44.5 6.0 20.0 15 81 0.0 60.0 0.0 0.0LVK (high pH) rec >100 156 0 0 156 66 307.8 14.3 21.6 4.8 20.8 15 81 0.0 0.0 0.0 0.0LVK (low pH) rec >100 154 0 0 154 66 306.2 11.2 27.3 5.0 21.0 15 81 0.0 40.0 0.0 0.0MLD2 rec 0 0 0 0 0 0 W 95.8 2.5 38.7 0.0 10.0 5 F 5 0.0 10.0 0.0 0.0MLD3 rec 0 0 0 0 0 0 W 49.0 2.4 20.2 0.0 10.0 5 F 5 0.0 0.0 0.0 0.0MMW rec 30 0 0 0 0 0 W 60.0 3.6 16.7 6.0 18.0 15 15 7.5 15.0 0.0 0.0MMY(158) rec >100 154 0 0 154 66 179.0 11.0 16.3 6.0 22.0 20 86 7.5 15.0 0.0 0.0ptaaMNS rec 75 0 0 0 0 24 W 63.6 2.0 31.9 1.5 9.5 5 F 29 0.0 0.0 0.0 0.0ptSTP (high pH) rec 65 0 0 0 0 24 W 50.6 2.1 24.2 2.5 12.5 10 34 0.0 10.0 0.0 0.0ptSTP (low pH) rec 65 0 0 0 0 24 W 50.6 2.1 24.2 2.5 12.5 10 34 0.0 40.0 0.0 0.0xsKNS(67) rec >100 170 0 0 170 66 216.4 12.8 16.9 6.0 22.0 20 86 0.0 15.0 0.0 0.0xtMLD1 (high pH) rec 40 0 0 0 0 24 W 72.0 1.9 37.5 0.0 10.0 5 F 29 0.0 15.0 0.0 0.0xtMLD1 (low pH) rec 40 0 0 0 0 24 W 72.6 1.8 41.3 0.0 10.0 5 F 29 0.0 15.0 0.0 0.0xtMUS1 rec 30 0 0 0 0 0 W 74.6 2.2 34.6 0.0 10.0 5 F 5 0.0 0.0 0.0 0.0MUS2 rec 0 0 0 0 0 0 W 104.2 2.6 40.6 0.0 10.0 5 F 5 0.0 80.0 0.0 0.0MUS3 rec 0 0 0 0 0 0 W 104.2 2.6 40.6 0.0 10.0 5 F 5 0.0 80.0 0.0 0.0
SITEID TSDED ISR V_US N_US Y_US USDED D_LS V_LS N_LS Y_LS LSDEDTOTDED FLR LCC GENNOT
DETNOT LCCSVER
aaMNS rec 0.0 44.0 0.0 0.0 0.0 9.8 40.0 0.0 0.0 0.0 5.8 15.6 28.4 4 W WD23 2006.06.14glKNS (high pH) rec 12.2 68.9 10.0 0.0 0.0 13.8 30.0 10.0 0.0 0.0 6.8 32.8 48.2 3 VD D23 2006.06.14glKNS (low pH) rec 32 4 48 6 0 0 0 0 0 0 9 8 30 0 0 0 0 0 0 0 4 8 47 0 34 0 4 VD D23V1 2006 06 14glKNS (low pH) rec 32.4 48.6 0.0 0.0 0.0 9.8 30.0 0.0 0.0 0.0 4.8 47.0 34.0 4 VD D23V1 2006.06.14glLVK (high pH) rec 0.0 81.0 10.0 0.0 0.0 5.4 10.0 10.0 0.0 0.0 2.7 8.1 72.9 2 2006.06.14glLVK (low pH rec) 32.4 48.6 0.0 0.0 0.0 4.9 15.0 0.0 0.0 0.0 2.4 39.7 41.3 3 VD V1 2006.06.14glMMY rec 12.9 73.1 15.0 0.0 0.0 7.3 15.0 15.0 0.0 0.0 3.6 23.9 62.1 2 VD 2006.06.14KNS (high pH) rec 12.2 68.9 0.0 0.0 0.0 6.9 15.0 0.0 0.0 0.0 3.4 22.5 58.5 3 VD 2006.06.14KNS (low pH) rec 48.6 32.4 15.0 0.0 0.0 6.5 30.0 15.0 0.0 0.0 3.2 58.3 22.7 4 VD D23V1 2006.06.14LVK (high pH) rec 0.0 81.0 8.3 0.0 0.0 6.8 15.0 10.0 0.0 0.0 4.0 10.8 70.2 2 2006.06.14LVK (low pH) rec 32.4 48.6 0.0 0.0 0.0 4.9 15.0 0.0 0.0 0.0 2.4 39.7 41.3 3 VD V1 2006.06.14MLD2 rec 0.5 4.5 5.0 0.0 0.0 0.2 0.0 0.0 0.0 0.0 0.0 0.7 4.3 5 WF WF 2006.06.14MLD3 rec 0.0 5.0 0.0 0.0 0.0 0.0 0.0 0.0 0.0 0.0 0.0 0.0 5.0 5 WF WF 2006.06.14MMW rec 2.3 12.8 15.0 0.0 0.0 1.3 15.0 15.0 0.0 0.0 0.6 4.2 10.8 5 W W 2006.06.14MMY(158) rec 12.9 73.1 15.0 0.0 0.0 14.7 30.0 15.0 0.0 0.0 7.2 34.8 51.2 3 VD D23 2006.06.14ptaaMNS rec 0.0 29.0 5.0 0.0 0.0 2.9 30.0 10.0 0.0 0.0 2.9 5.8 23.2 4 WF WFD3 2006.06.14ptSTP (high pH) rec 3.4 30.6 10.0 0.0 0.0 5.1 30.0 10.0 0.0 0.0 3.0 11.6 22.4 4 W WD23 2006.06.14ptSTP (low pH) rec 13.6 20.4 19.2 0.0 0.0 3.4 30.0 15.0 0.0 0.0 2.0 19.0 15.0 5 W WD23V1 2006.06.14xsKNS(67) rec 12.9 73.1 0.0 0.0 0.0 14.7 30.0 0.0 0.0 0.0 7.2 34.8 51.2 3 VD D23 2006.06.14xtMLD1 (high pH) rec 4.4 24.7 15.0 0.0 0.0 2.5 27.0 10.5 0.0 0.0 2.2 9.0 20.0 5 WF WFD3 2006.06.14xtMLD1 (low pH) rec 4.4 24.7 15.0 0.0 0.0 2.5 27.0 1.5 0.0 0.0 2.2 9.0 20.0 5 WF WFD3 2006.06.14xtMUS1 rec 0.0 5.0 0.0 0.0 0.0 0.0 27.0 0.0 0.0 0.0 0.4 0.4 4.6 5 WF WFD3 2006.06.14MUS2 rec 4.0 1.0 63.3 0.0 0.0 0.4 0.0 60.0 0.0 0.0 0.2 4.6 0.4 5 WF WFV123 2006.06.14MUS3 rec 4.0 1.0 63.3 0.0 0.0 0.4 0.0 60.0 0.0 0.0 0.2 4.6 0.4 5 WF WFV123 2006.06.14