COVID-19 - Export Promotion Council for Handicrafts
56
COVID-19 Indian Institute of Foreign Trade Deemed University under Ministry of Commerce Government of India Challenges, Opportunity & Threat for Indian Handicraft Exports Submitted by: Fashion J e wellery & Accessories
-
Upload
khangminh22 -
Category
Documents
-
view
4 -
download
0
Transcript of COVID-19 - Export Promotion Council for Handicrafts
COVID-19
Indian Institute of Foreign Trade
Deemed University under Ministry of Commerce
Government of India
Challenges, Opportunity & Threat
for Indian Handicraft Exports
Submitted by:
Fashion Jewellery & Accessories
1 | P a g e
CHAPTER 1 BACKGROUND
NEED ASSESSMENT
The Covid-19 pandemic is taking a hard toll on the global economy and India is no
exception to this. Handicraft industry, the largest second largest employer in the country
after agriculture, which is largely informal, is severely affected witnessed by
cancellations of existing export orders wherein around 30% of orders of labour-intensive
sectors have got cancelled., default payments and lowering down the future business
prospects in near future due to cancellation of few promising trade fairs including the
49th edition of IHGF – Delhi Fair Spring-2020 hampering the exports from major craft
clusters like Moradabad, Saharanpur, Jodhpur, Jaipur, Agra, Narsapur, Firozabad,
North-eastern region. Cancellation of key trade fairs in the US, Hong Kong and Jaipur
has impacted the jewelry business.
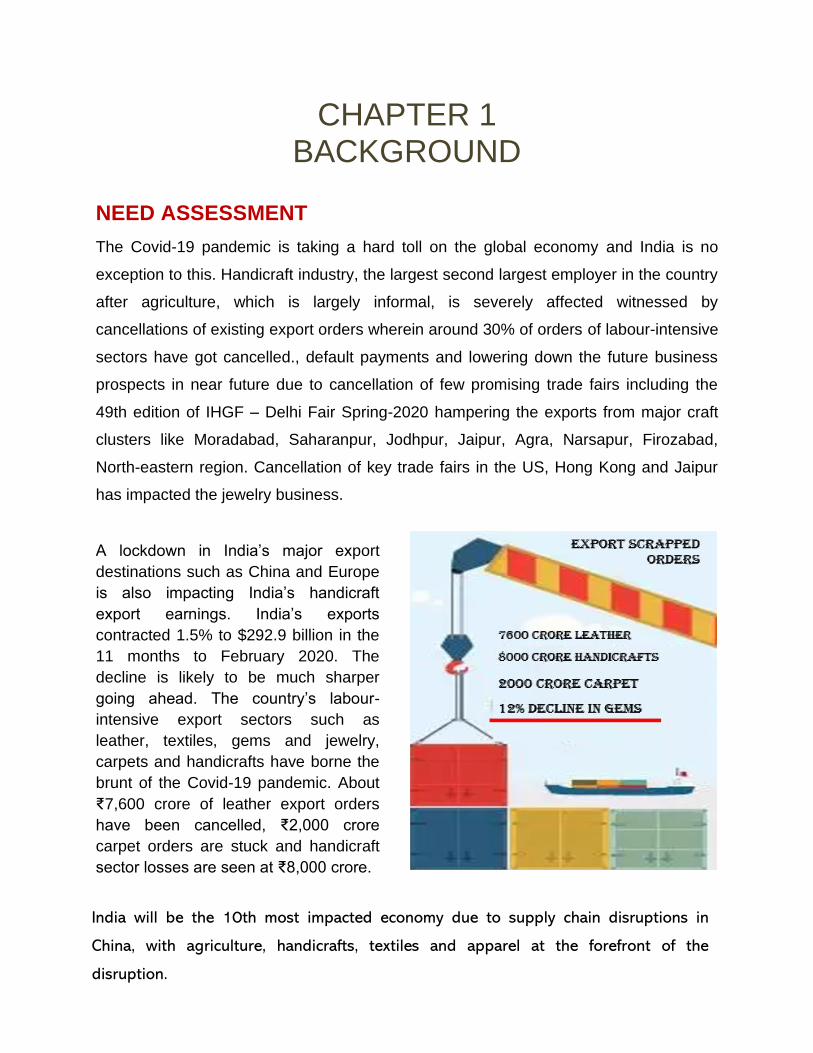
A lockdown in India’s major export
destinations such as China and Europe
is also impacting India’s handicraft
export earnings. India’s exports
contracted 1.5% to $292.9 billion in the
11 months to February 2020. The
decline is likely to be much sharper
going ahead. The country’s labour-
intensive export sectors such as
leather, textiles, gems and jewelry,
carpets and handicrafts have borne the
brunt of the Covid-19 pandemic. About
₹7,600 crore of leather export orders
have been cancelled, ₹2,000 crore
carpet orders are stuck and handicraft
sector losses are seen at ₹8,000 crore.
India will be the 10th most impacted economy due to supply chain disruptions in
China, with agriculture, handicrafts, textiles and apparel at the forefront of the
disruption.

2 | P a g e
Assuming the fact that China being the epicenter of the COVID-19 crises; would bring a
psychological shift in global procurement priorities from China to alternate sources.
COVID-19: EXPECTED ADVANTAGE FOR INDIAN HANDICRAFTS
As a result of the global COVID crises, it is witnessed that the western economies are
badly battered while countries like India, Indonesia, etc. are not so battered. Emotional
and Economic backlash against China is expected. Already, countries and companies
are working on strategy to pivot away from China as part of their supply chains. Japan
Govt has announced packages for its companies bringing back manufacturing home.
COVID crises in India’s major export
destinations such as China, USA and
Europe has impacted India’s
handicraft export earnings. This
entails the need for an immediate
hunting and trade diversion towards
newer destinations with relatively
lesser COVID impact.
Looking for trade opportunities beyond traditional
markets of the USA and EU for Indian handicraft
exports post COVID does make business sense due
to the fact that while on one hand COVID crises
seem to have brought forward obvious challenges
for Indian exporters due to issues in these export
markets, on the other hand appreciating the fact
that the COVID crises have hit global markets, many
of which have been competing suppliers for India in
prime importing countries for Indian handicrafts,
this current crises also seem to open newer
prospects for Indian handicraft exports.

3 | P a g e
Consumer behavioral shift post COVID Impact on Indian handicraft exports
For individuals, health and safety will
become a priority area of consumer
spending
Handicraft products like khadi mask, organic
clothing, cotton textile wears etc. would gain
edge
The ticket size of spending will drop for a
while. People will spend on cheaper
goods than on expensive goods, or delay
spending for a while
Gift items and other high priced handicraft
products would face a setback.
Extreme acceleration in digital economy EPCH members needs to be promoted to
have their own websites and look for
rigorous E-commerce marketing. Councils
needs to plan virtual trade fair
People will be less loyal towards brands as
other aspects will take over. People will
switch brands faster due to various other
concerns like safety, etc.
Shift in brand loyalty would mean opportunity
for MSMEs against bigger brands. Except for
the fact that price competitiveness and
design innovation will be most important
focus. It’s time for survival of the fittest.
Businesses need to keep this in mind and work accordingly. As a result of this, there
is an expected shift in consumer behavior post COVID which might impact the
purchasing behavior towards handicrafts. Indian businesses therefore need to try to
become the contract manufacturer of the world, just like China is. India needs to
make use of this opportunity smartly.
COVID impact is quite visible in shift of consumer preference
Chapter 2
Global buyers are turning to India to source ceramics,
homeware, fashion and lifestyle goods, textiles and
furniture from the country as China grapples with the
deadly coronavirus outbreak.
Cevisama 2020 ceramics fair in Spain, some 55 Indian
companies have drummed up greater interest from
buyers owing to muted competition from China.
Clients in the US and the EU have also set their sights on
India for labour-intensive products such as garments.
Indian exporters have received enquiries above Rs. 10
crore from the EU and US.
4 | P a g e
CHAPTER 2 INDIAN HANDICRAFTS EXPORTS:
PRE-COVID STATUS
INDIAN HANDICRAFT SECTOR: SNAPSHOT
The handicrafts sector is of importance to the Indian economy as it is one of the largest
employment generators and account for a significant share in the country’s export. The
state and regional clusters contribute significantly to handicrafts export. The Indian
handicrafts industry is fragmented with more than seven million regional artisans and
over 67,000 exporters/export houses promoting regional art and craftsmanship in the
domestic and global markets. Exports from the sector aggregated to Rs 24,500 crore.
Handicrafts embody the rich cultural heritage and traditions of India. There are a total of
744 handicraft clusters in India engaging nearly 2,12,000 artisans, offering more than
35,000 products. The major clusters are in Surat, Bareilly, Varanasi, Agra, Hyderabad,
Lucknow, Chennai, Ranipet, Mumbai, Kanpur, Farrukabad, Saharanpur, Etikoppaka,
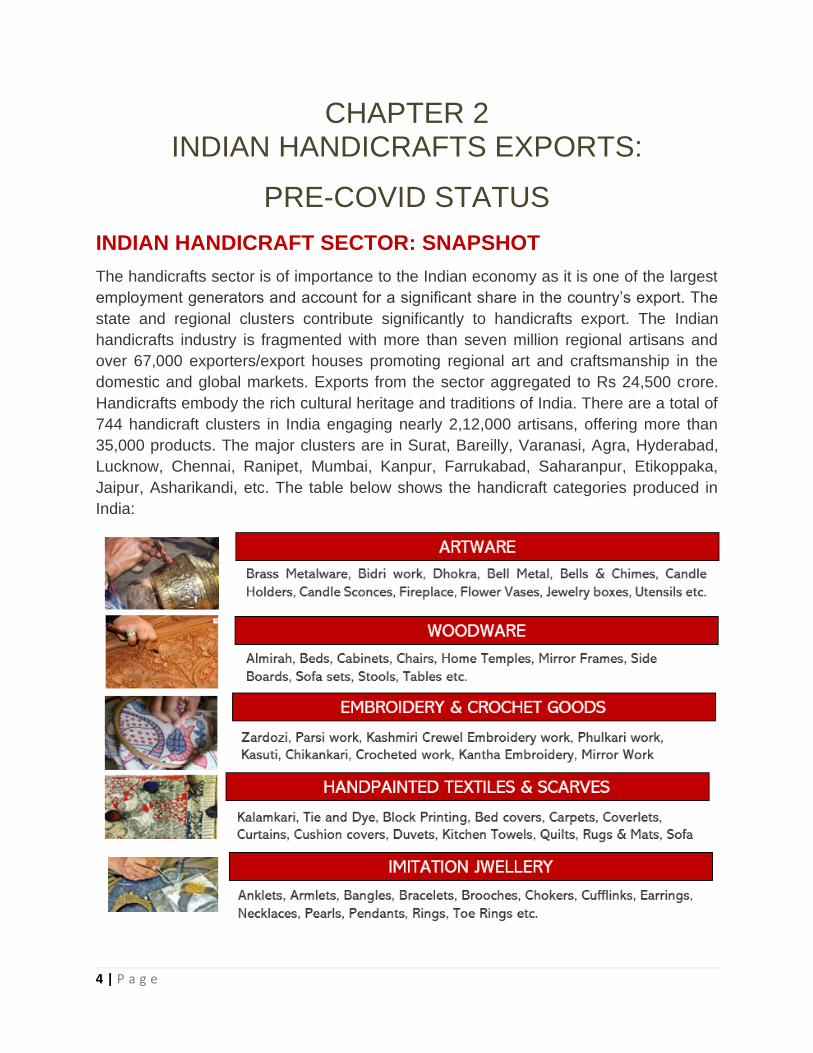
Jaipur, Asharikandi, etc. The table below shows the handicraft categories produced in
India:
5 | P a g e
Out of these traditional production strengths, main handicraft items exported by India
include house-ware, home textiles, furniture, glassware, bamboo goods, fashion jewelry
and lamp and lighting.
Major export destinations for domestic handicrafts items include the US, Europe,
South America, Africa and China. Other markets include UAE, Australia, Canada
and Japan. The US and Europe together account for about 60 per cent of the
country's total handicraft exports.
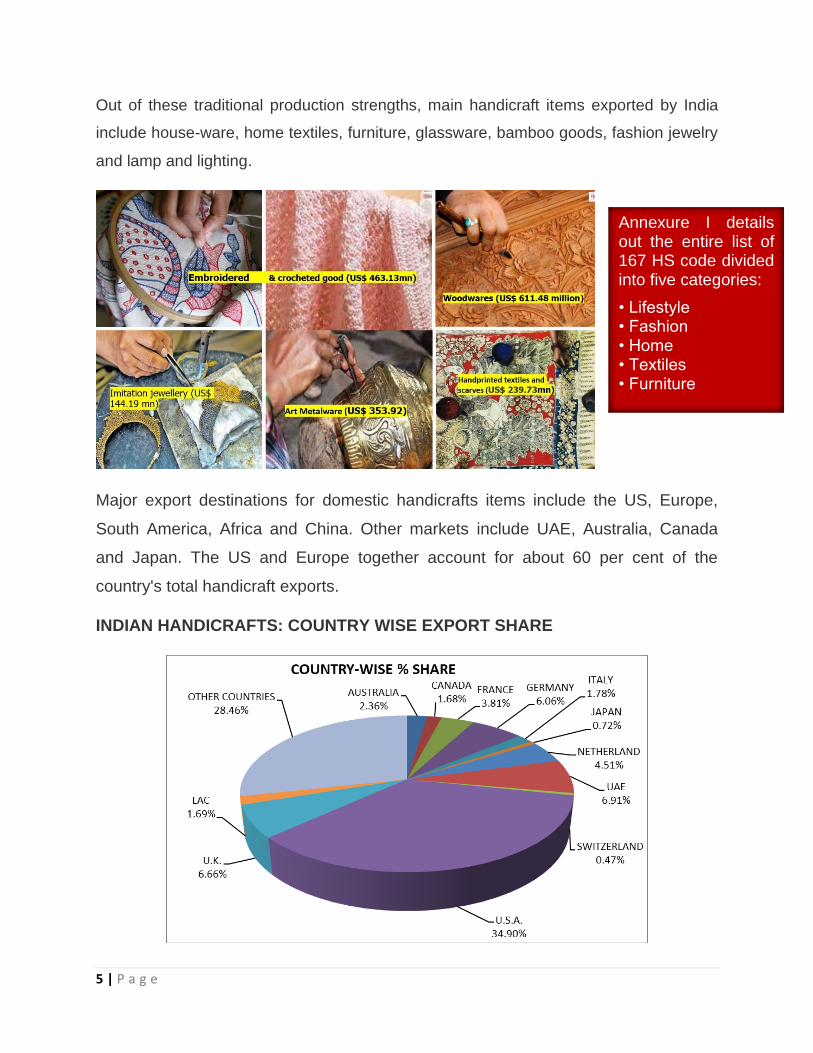
INDIAN HANDICRAFTS: COUNTRY WISE EXPORT SHARE
Annexure I details out the entire list of 167 HS code divided into five categories:
• Lifestyle • Fashion • Home • Textiles • Furniture

6 | P a g e
USA was the highest in importing of handicrafts among all the importing countries of
the world, which was 34.90 percent share of the total export. Further, followed by
UAE, UK, Germany, Netherland and France were having the percentage share of
6.91, 6.66, 6.06, 4.51 and 3.81 respectively in the import of handicrafts during the
year. These five countries have more demand for the handicraft products produced
by India, which was more than 64 percent of the total export during this year.
Export Markets for Fashion
Trend in Indian Handicraft exports (1986-2020)
Source: DGCIS, 2020
7 | P a g e
Handlooms and Handicrafts Sector craved for growth since quite a few years, which has
now actually turned prolific. No doubt, India has an edge against its competitors like
China, Philippines, Thailand, Taiwan and Korea who generally produce machine-made
products. Indian handmade products have a niche market all over the world creating a
distinct impact through exclusive designs, workmanship, finesse, colors and raw
material.
India is still to introduce such innovative technologies in the handicraft sector.
Appreciating the fact that the world handicraft market would be worth $ 1091.2 billion by
2024, expanding at 11%, annually compounded, during 2019-2024; it is worth exploring
the status of India versus other global players especially China in each of the 167 HS
codes carrying huge production strength for India.
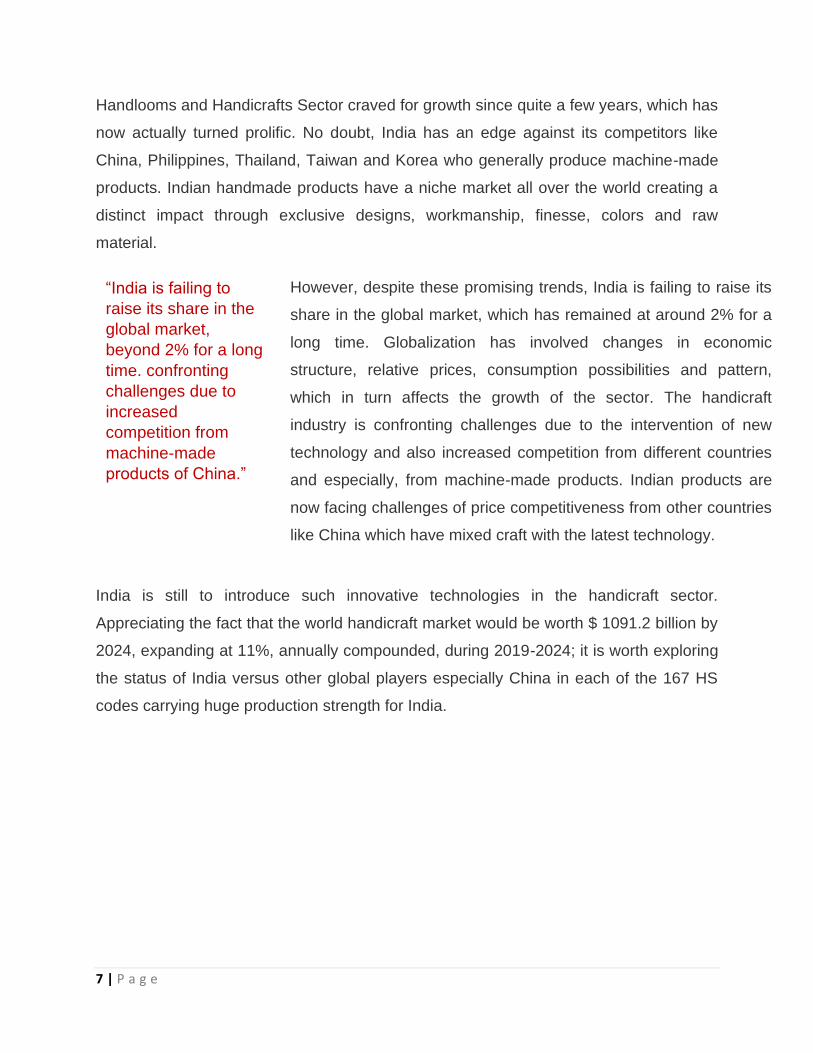
“India is failing to
raise its share in the
global market,
beyond 2% for a long
time. confronting
challenges due to
increased
competition from
machine-made
products of China.”
However, despite these promising trends, India is failing to raise its
share in the global market, which has remained at around 2% for a
long time. Globalization has involved changes in economic
structure, relative prices, consumption possibilities and pattern,
which in turn affects the growth of the sector. The handicraft
industry is confronting challenges due to the intervention of new
technology and also increased competition from different countries
and especially, from machine-made products. Indian products are
now facing challenges of price competitiveness from other countries
like China which have mixed craft with the latest technology.

8 | P a g e
WILL ANTI- CHINA SENTIMENTS GIVE ANY TRADE ADVANTAGE TO INDIAN
HANDICRAFTS?
As analyzed, China have been losing its market share in countries like USA, EU, Latin
America, GCC etc. which have been traditional export markets for Indian handicraft
exports. Also, the products where it has lost market in handicraft category includes
furniture, textiles and apparel and its accessories, iron and steel articles (wrought iron
handicraft products), footwear, toys and games. Most of these product categories seem
to be having great export potential across various handicraft clusters of India.
The section below therefore analyses the impact of all 167 HS codes of export interest
to EPCH and compares India’s export share with that of China versus other global
exporters. The HS codes are then divided into three categories:
Anti-China sentiment would give immediate advantage to Indian exports.
If global players have equivalent
share, anti-China sentiment will
only extend moderate advantage
to India.
• If China has not been the major player, anti-China sentiment will have no impact for India.
• Even if China is competitive but global players are stronger than India, advantage of the anti-China sentiment would be incurred by other competing players and not India.
9 | P a g e
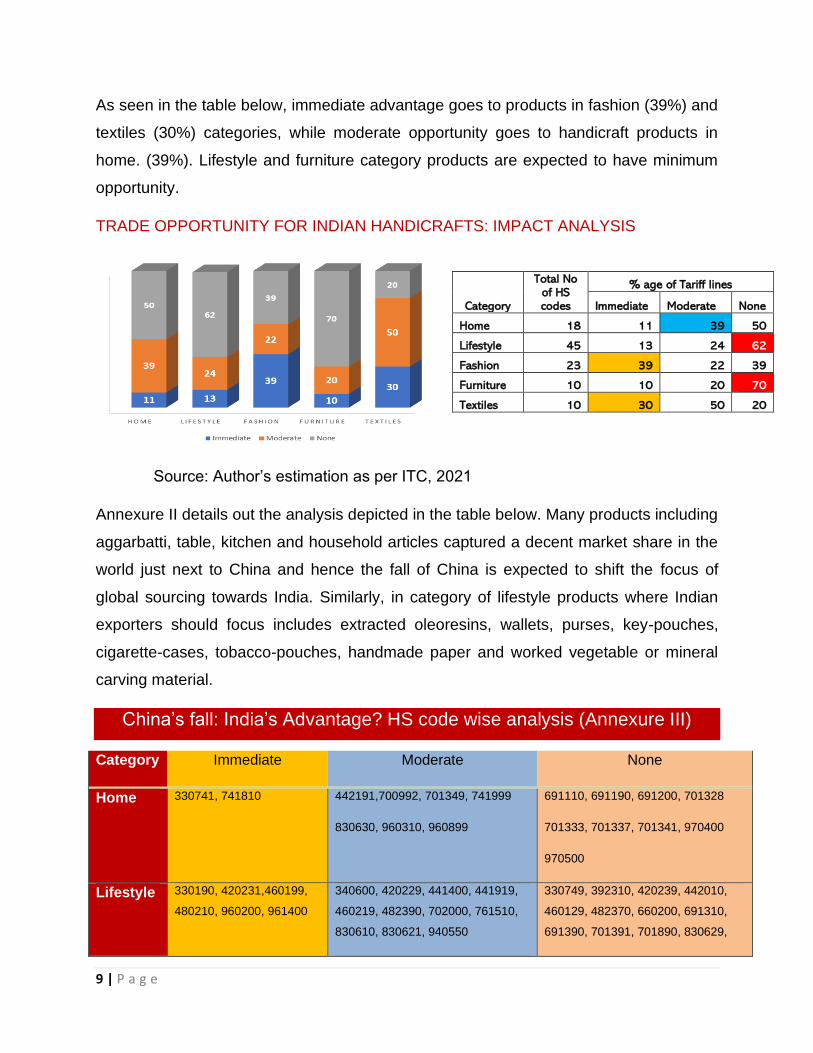
As seen in the table below, immediate advantage goes to products in fashion (39%) and
textiles (30%) categories, while moderate opportunity goes to handicraft products in
home. (39%). Lifestyle and furniture category products are expected to have minimum
opportunity.
TRADE OPPORTUNITY FOR INDIAN HANDICRAFTS: IMPACT ANALYSIS
Source: Author’s estimation as per ITC, 2021
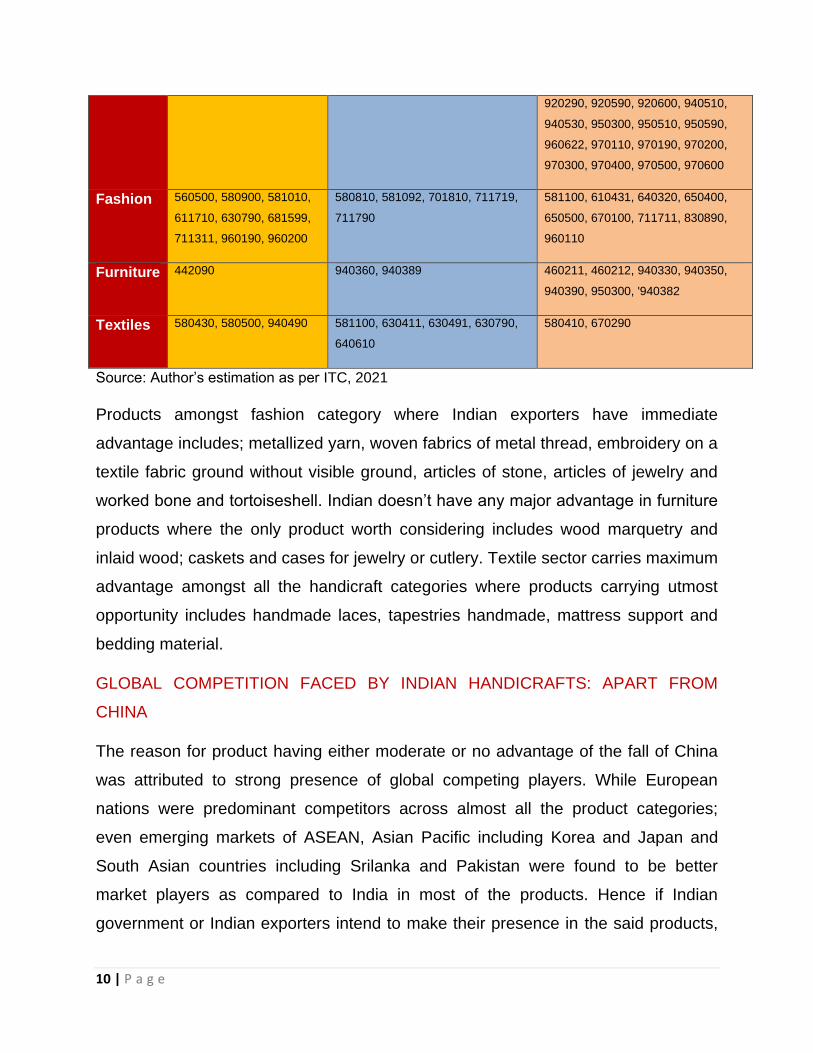
Annexure II details out the analysis depicted in the table below. Many products including
aggarbatti, table, kitchen and household articles captured a decent market share in the
world just next to China and hence the fall of China is expected to shift the focus of
global sourcing towards India. Similarly, in category of lifestyle products where Indian
exporters should focus includes extracted oleoresins, wallets, purses, key-pouches,
cigarette-cases, tobacco-pouches, handmade paper and worked vegetable or mineral
carving material.
China’s fall: India’s Advantage? HS code wise analysis (Annexure III)
Category Immediate Moderate None
Home 330741, 741810 442191,700992, 701349, 741999
830630, 960310, 960899
691110, 691190, 691200, 701328
701333, 701337, 701341, 970400
970500
Lifestyle 330190, 420231,460199,
480210, 960200, 961400
340600, 420229, 441400, 441919,
460219, 482390, 702000, 761510,
830610, 830621, 940550
330749, 392310, 420239, 442010,
460129, 482370, 660200, 691310,
691390, 701391, 701890, 830629,
Category
Total No of HS codes
% age of Tariff lines
Immediate Moderate None
Home 18 11 39 50
Lifestyle 45 13 24 62
Fashion 23 39 22 39
Furniture 10 10 20 70
Textiles 10 30 50 20
10 | P a g e
920290, 920590, 920600, 940510,
940530, 950300, 950510, 950590,
960622, 970110, 970190, 970200,
970300, 970400, 970500, 970600
Fashion 560500, 580900, 581010,
611710, 630790, 681599,
711311, 960190, 960200
580810, 581092, 701810, 711719,
711790
581100, 610431, 640320, 650400,
650500, 670100, 711711, 830890,
960110
Furniture 442090 940360, 940389 460211, 460212, 940330, 940350,
940390, 950300, '940382
Textiles 580430, 580500, 940490 581100, 630411, 630491, 630790,
640610
580410, 670290
Source: Author’s estimation as per ITC, 2021
Products amongst fashion category where Indian exporters have immediate
advantage includes; metallized yarn, woven fabrics of metal thread, embroidery on a
textile fabric ground without visible ground, articles of stone, articles of jewelry and
worked bone and tortoiseshell. Indian doesn’t have any major advantage in furniture
products where the only product worth considering includes wood marquetry and
inlaid wood; caskets and cases for jewelry or cutlery. Textile sector carries maximum
advantage amongst all the handicraft categories where products carrying utmost
opportunity includes handmade laces, tapestries handmade, mattress support and
bedding material.
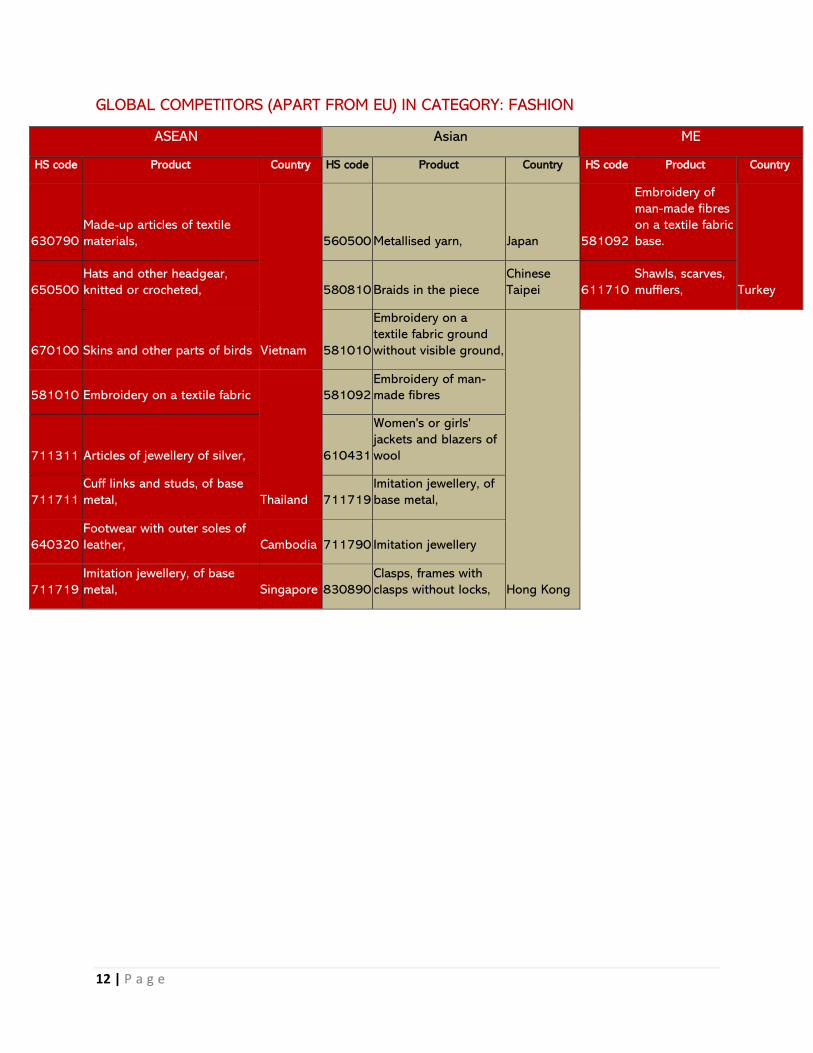
GLOBAL COMPETITION FACED BY INDIAN HANDICRAFTS: APART FROM
CHINA
The reason for product having either moderate or no advantage of the fall of China
was attributed to strong presence of global competing players. While European
nations were predominant competitors across almost all the product categories;
even emerging markets of ASEAN, Asian Pacific including Korea and Japan and
South Asian countries including Srilanka and Pakistan were found to be better
market players as compared to India in most of the products. Hence if Indian
government or Indian exporters intend to make their presence in the said products,

11 | P a g e
they would need to cater to strong competition arising from these countries apart
from China.
Figure below summarized from the data in the table below highlights the status of
global competition faced by Indian exporters across different handicraft categories.
Annexure I details it our further.
12 | P a g e
GLOBAL COMPETITORS (APART FROM EU) IN CATEGORY: FASHION
ASEAN Asian ME
HS code Product Country HS code Product Country HS code Product Country
630790
Made-up articles of textile
materials,
Vietnam
560500 Metallised yarn, Japan 581092
Embroidery of
man-made fibres
on a textile fabric
base.
Turkey 650500
Hats and other headgear,
knitted or crocheted, 580810 Braids in the piece
Chinese
Taipei 611710
Shawls, scarves,
mufflers,
670100 Skins and other parts of birds 581010
Embroidery on a
textile fabric ground
without visible ground,
Hong Kong
581010 Embroidery on a textile fabric
Thailand
581092
Embroidery of man-
made fibres
711311 Articles of jewellery of silver, 610431
Women's or girls'
jackets and blazers of
wool
711711
Cuff links and studs, of base
metal, 711719
Imitation jewellery, of
base metal,
640320
Footwear with outer soles of
leather, Cambodia 711790 Imitation jewellery
711719
Imitation jewellery, of base
metal, Singapore 830890
Clasps, frames with
clasps without locks,

13 | P a g e
CHAPTER 3 SURVIVAL STRATEGY FOR INDIAN HANDICRAFTS
COMPARATIVE QUADRANT ANALYSIS FOR IDENTIFIED CATEGORIES
Based on the above rationale and category-wise analysis; corresponding policy
suggestions are listed in the subsequent section. Graphs below illustrates the status of
all the products across different categories, which have been organized as per their
performance on the two parameters indicated above. Bubble graph on world imports in
each of the categories; depicts status of individual products across four quadrants
based on the above two parameters:
Color Coding Growth 2014-20 Absolute value 2020
High High
High Low
Low High
Low Low
Once the HS codes in each category is distributed across 4 quadrants based on their status in world imports, the same products are then mapped across another 4 quadrants based on their status in India’s exports. Finally; the policy recommendations HS code-wise is suggested as per the above-mentioned rationale.
CATEGORY: FASHION
WORLD IMPORT VALUE VS GROWTH
14 | P a g e
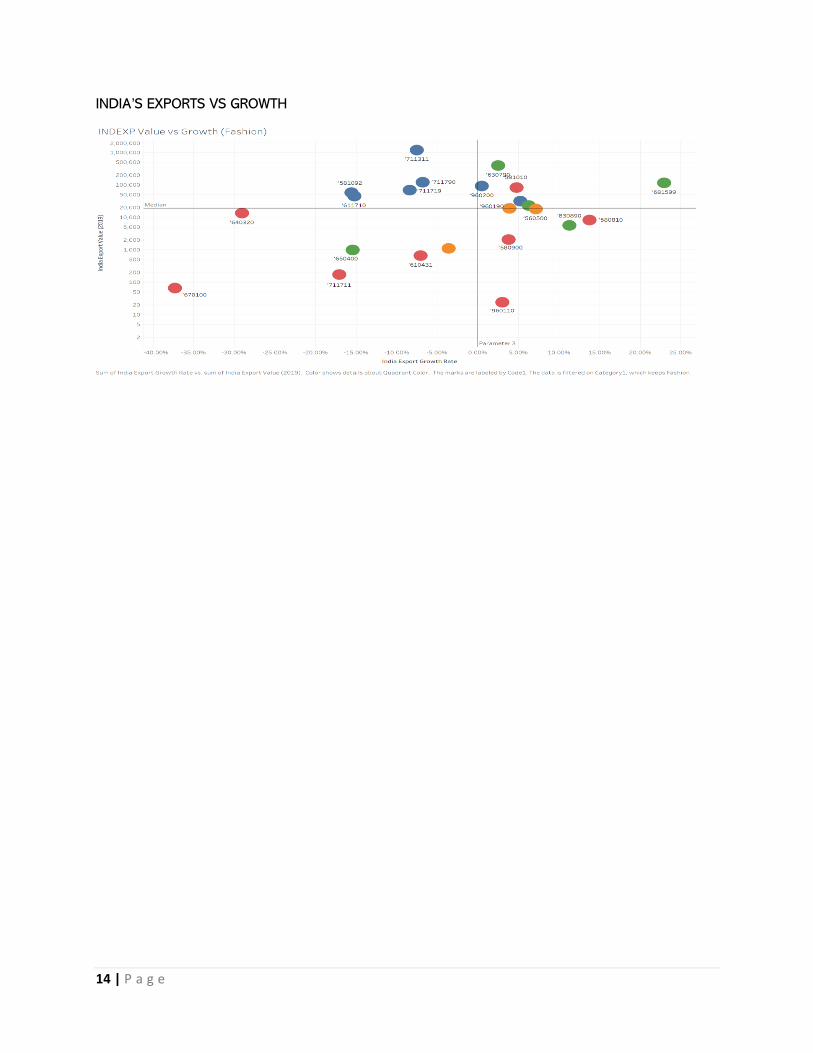
INDIA’S EXPORTS VS GROWTH

15 | P a g e
CHAPTER 4 EXPORT PROMOTION FOCUS POST COVID
POST COVID DEMAND ANALYSIS: FORECAST 2025
Since the COVID-19 crisis began, global GDP has fallen by 4.2%. Although the
pandemic has had a devastating economic effect around the world, it is expected to
return to pre-pandemic levels by the end of 2021. This revival of economy post covid
would vary from one region to another. Europe is expected to see GDP growth of
5.2% in 2021, while for the United States, that figure is just 3.1%.
Asian countries, in contrast have recovered much faster and are projected to see
GDP growth of 8% this year – in particular, China, which experienced only a
moderate dip in 2020 and which the International Monetary Fund (IMF) predicts will

16 | P a g e
see 8.2% in real GDP growth in 2021. The output in many other countries is
projected to remain around 5% below pre-crisis expectations in 2022. OECD has
projected global GDP to rise by around 4.2% in 2021 and by a further 3.7% in 2022.
In 2020, American consumers shifted their spend from services to retail goods, with
groceries and consumer durables like home appliances outpacing restaurants and
travel as consumer spending held steady over the summer months.
According to the
Organization for Economic
Development (OECD),
while global GDP should
rise by around 4¼% by
the end of 2021, national
bounce-back could be uneven. This would change
the consumer spending
across different countries.
17 | P a g e
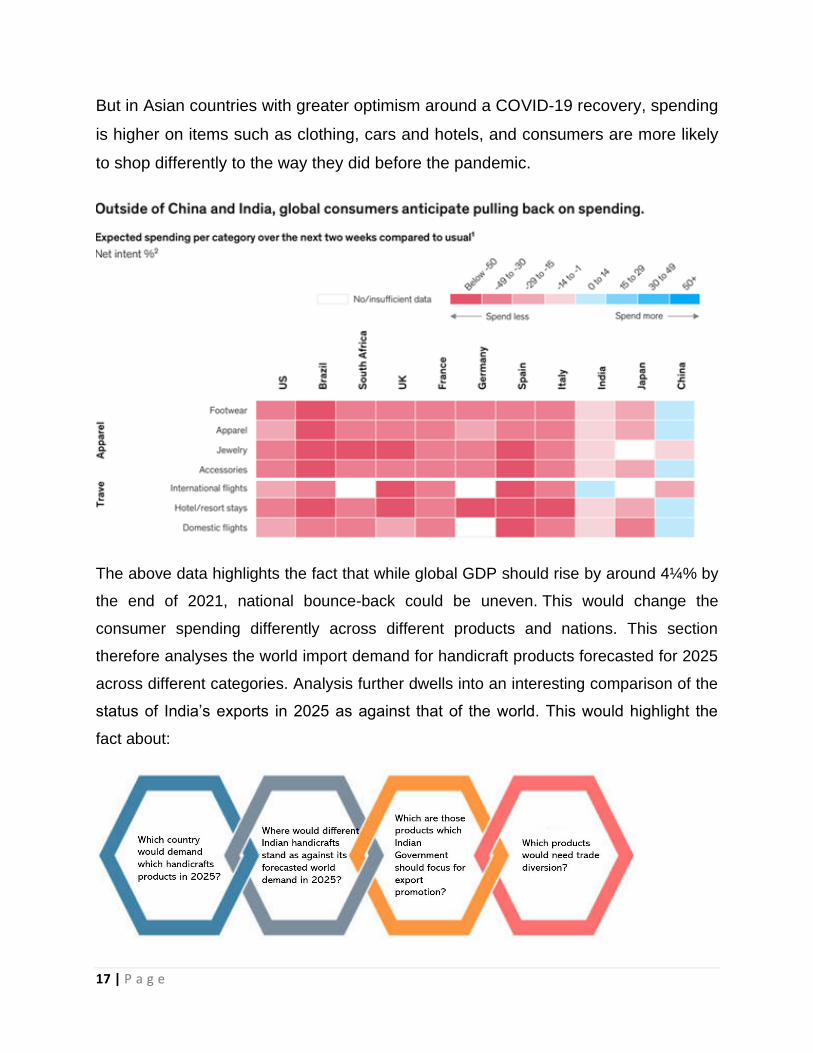
But in Asian countries with greater optimism around a COVID-19 recovery, spending
is higher on items such as clothing, cars and hotels, and consumers are more likely
to shop differently to the way they did before the pandemic.
The above data highlights the fact that while global GDP should rise by around 4¼% by
the end of 2021, national bounce-back could be uneven. This would change the
consumer spending differently across different products and nations. This section
therefore analyses the world import demand for handicraft products forecasted for 2025
across different categories. Analysis further dwells into an interesting comparison of the
status of India’s exports in 2025 as against that of the world. This would highlight the
fact about:
18 | P a g e
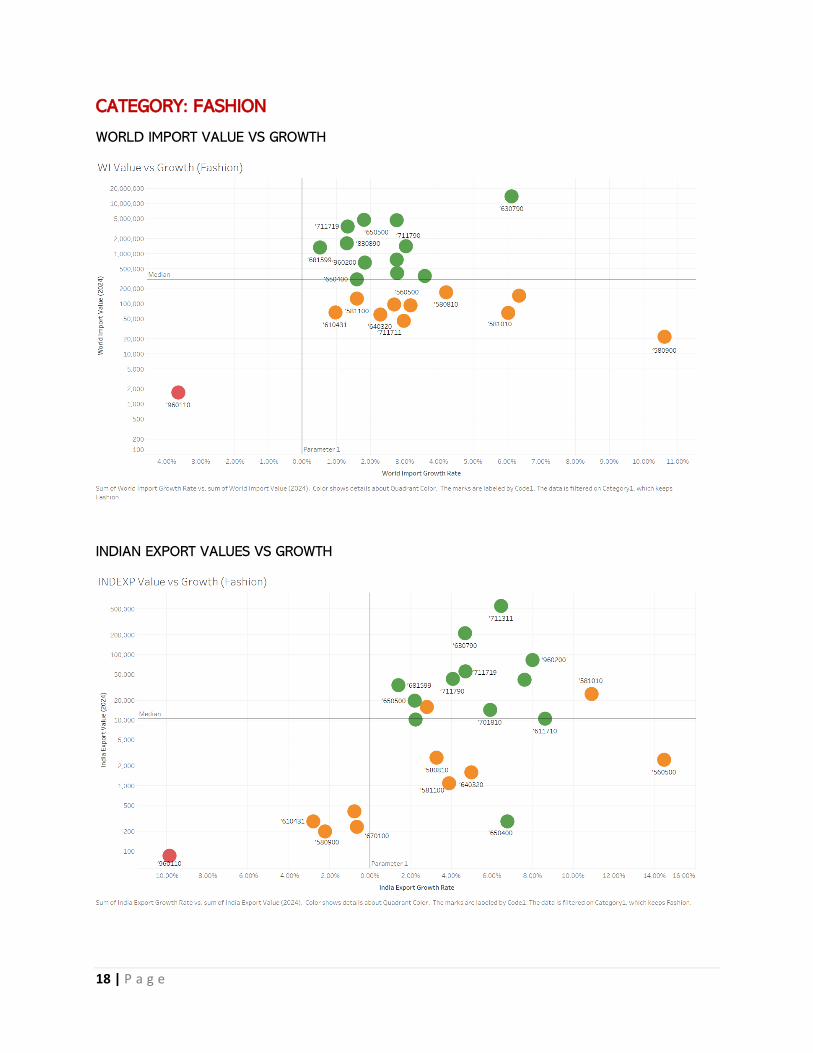
CATEGORY: FASHION
WORLD IMPORT VALUE VS GROWTH
INDIAN EXPORT VALUES VS GROWTH
19 | P a g e
Inference
• HS codes which are expected to gain in 2025 where export focus should be
maintained in the fashion category includes 711311 (Silver Filligree –
71131110), 630790 (Hand Printed Dress - 63079011), 960200 (Potpourri –
96020010), 711719 (Jewellery- Silver – 71171920), 711790 (Imitation
Jewellery – 71179010), 681599 (Marble & Stone Figurines – 68159990),
650500 (Knitted Or Crocheted Hat – 65050090), 701810 (Beaded Bangles –
70181010), 611710 (Pashmina Shawls & Stoles – 61171020)
• For HS code 650400 (Hats & Caps – 65040000), India is expected to pick up
the growth but will have to work on enhancing the volume of exports.
• For 960110 (Articles Of Ivory – 96011000), India should not have any focus
• For 610431 (Jackets of Wool or Fine Animal Hair – 61043100), 580900 (Zari
Borders – 58090010) and 670100 (Feather Dusters – 67010010), India needs
to gear up on growth while rest all HS codes are in sync with expected trend in
world imports by 2025.

20 | P a g e
PRODUCT SELECTION OF UTMOST IMPORTANCE CATEGORYWISE ANALYSIS
Above 27 HS codes are of utmost important and deserve a focused policy focus
towards sustaining the market share. All these identified commodities fair quite well
across all the parameters wherein Indian handicraft exporters as well as the
Government can be assured of sustainable import demand in the global market by the
end of 2025 with India having a great comparative advantage and expected to have a
decent share of exports in global market. Other Important HS code
Fashion
Order of selection
Product
681599 MARBLE & STONE FIGURINES - 68159990
581092 BADGES & EMBLEMS -58109210
611710 PASHMINA SHAWLS & STOLES - 61171020
640320 KOLAPURI CHAPPALS - 64032040
630790 PRINTED FABRICS - 63079020
711719 JEWELLERY- SILVER - 71171920
21 | P a g e
830890 IMITATION ZARI SPANGLES - 83089020
610431 JACKETS OF WOOL OR FINE ANIMAL HAIR - 61043100
581100 HAND EMBROIDERED GARMENTS - 58110010
670100 FEATHER DUSTERS - 67010010
650500 KNITTED OR CROCHETED HAT - 65050090
650400 HATS & CAPS - 65040000
711711 JEWELLERY- METAL - 71171100
960110 ARTICLES OF IVORY - 96011000
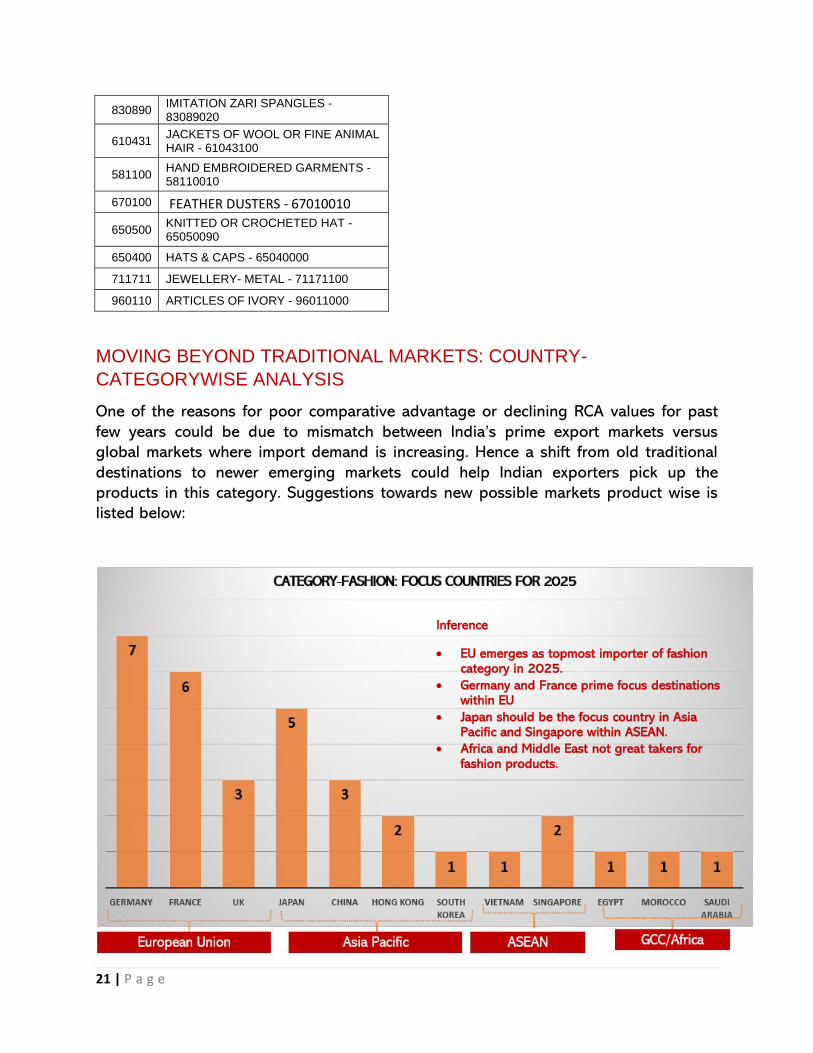
MOVING BEYOND TRADITIONAL MARKETS: COUNTRY-
CATEGORYWISE ANALYSIS
One of the reasons for poor comparative advantage or declining RCA values for past
few years could be due to mismatch between India’s prime export markets versus
global markets where import demand is increasing. Hence a shift from old traditional
destinations to newer emerging markets could help Indian exporters pick up the
products in this category. Suggestions towards new possible markets product wise is
listed below:
Inference
• EU emerges as topmost importer of fashion category in 2025.
• Germany and France prime focus destinations within EU
• Japan should be the focus country in Asia Pacific and Singapore within ASEAN.
• Africa and Middle East not great takers for fashion products.
22 | P a g e
CHAPTER 5 INDIA’S TRADE AGREEMENT
EX-POST ANALYSIS & WAY FORWARD FOR
INDIAN HANDICRAFTS
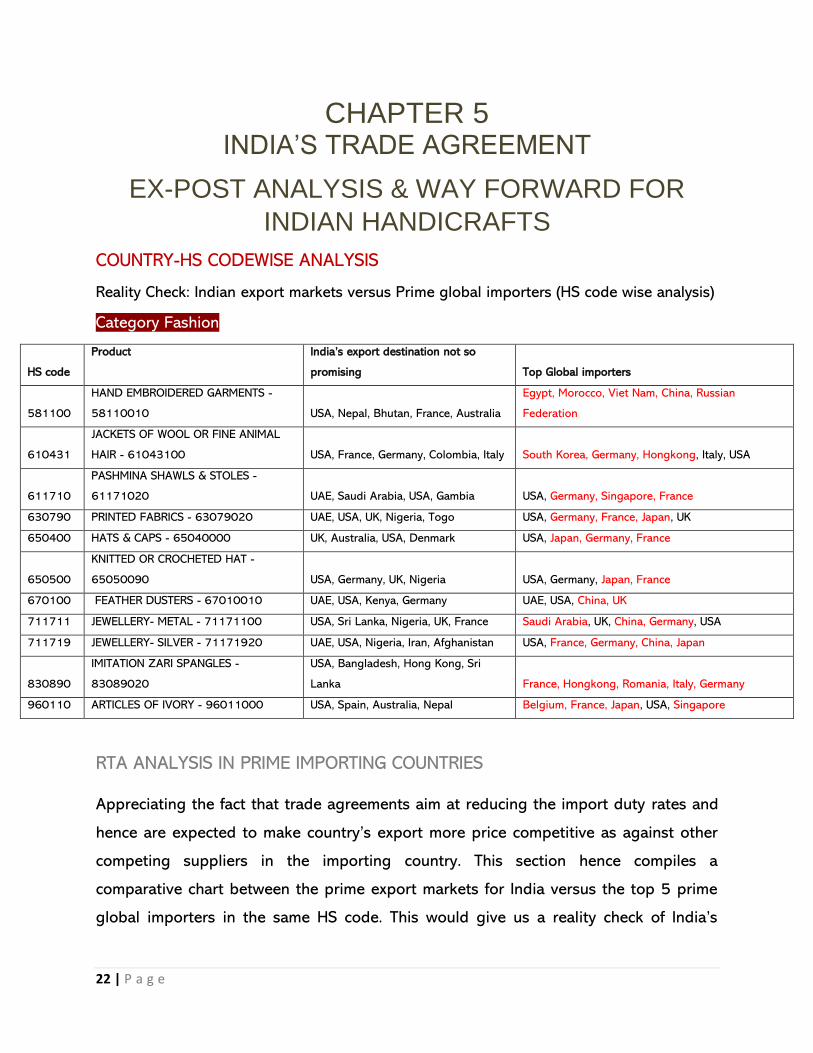
COUNTRY-HS CODEWISE ANALYSIS
Reality Check: Indian export markets versus Prime global importers (HS code wise analysis)
Category Fashion
HS code
Product India’s export destination not so
promising Top Global importers
581100
HAND EMBROIDERED GARMENTS -
58110010 USA, Nepal, Bhutan, France, Australia
Egypt, Morocco, Viet Nam, China, Russian
Federation
610431
JACKETS OF WOOL OR FINE ANIMAL
HAIR - 61043100 USA, France, Germany, Colombia, Italy South Korea, Germany, Hongkong, Italy, USA
611710
PASHMINA SHAWLS & STOLES -
61171020 UAE, Saudi Arabia, USA, Gambia USA, Germany, Singapore, France
630790 PRINTED FABRICS - 63079020 UAE, USA, UK, Nigeria, Togo USA, Germany, France, Japan, UK
650400 HATS & CAPS - 65040000 UK, Australia, USA, Denmark USA, Japan, Germany, France
650500
KNITTED OR CROCHETED HAT -
65050090 USA, Germany, UK, Nigeria USA, Germany, Japan, France
670100 FEATHER DUSTERS - 67010010 UAE, USA, Kenya, Germany UAE, USA, China, UK
711711 JEWELLERY- METAL - 71171100 USA, Sri Lanka, Nigeria, UK, France Saudi Arabia, UK, China, Germany, USA
711719 JEWELLERY- SILVER - 71171920 UAE, USA, Nigeria, Iran, Afghanistan USA, France, Germany, China, Japan
830890
IMITATION ZARI SPANGLES -
83089020
USA, Bangladesh, Hong Kong, Sri
Lanka France, Hongkong, Romania, Italy, Germany
960110 ARTICLES OF IVORY - 96011000 USA, Spain, Australia, Nepal Belgium, France, Japan, USA, Singapore
RTA ANALYSIS IN PRIME IMPORTING COUNTRIES
Appreciating the fact that trade agreements aim at reducing the import duty rates and
hence are expected to make country’s export more price competitive as against other
competing suppliers in the importing country. This section hence compiles a
comparative chart between the prime export markets for India versus the top 5 prime
global importers in the same HS code. This would give us a reality check of India’s
23 | P a g e
future course of policy focus from old traditional destinations to new destination as
emerging markets.
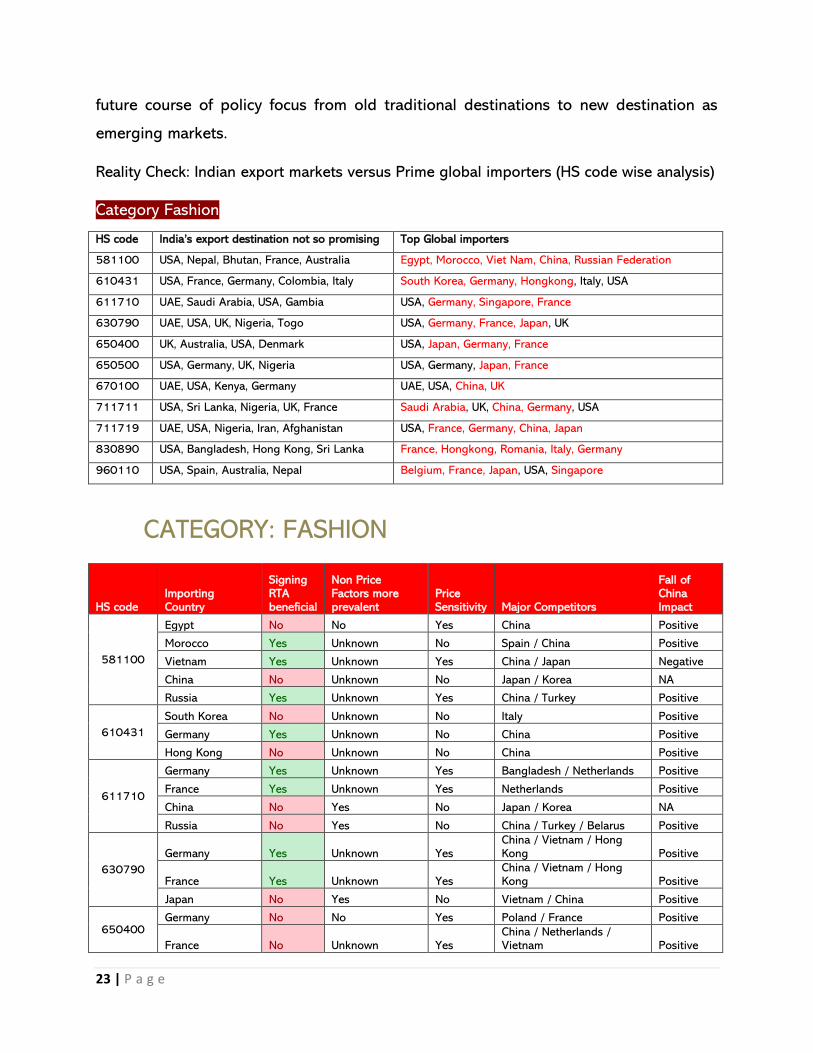
Reality Check: Indian export markets versus Prime global importers (HS code wise analysis)
Category Fashion
HS code India’s export destination not so promising Top Global importers
581100 USA, Nepal, Bhutan, France, Australia Egypt, Morocco, Viet Nam, China, Russian Federation
610431 USA, France, Germany, Colombia, Italy South Korea, Germany, Hongkong, Italy, USA
611710 UAE, Saudi Arabia, USA, Gambia USA, Germany, Singapore, France
630790 UAE, USA, UK, Nigeria, Togo USA, Germany, France, Japan, UK
650400 UK, Australia, USA, Denmark USA, Japan, Germany, France
650500 USA, Germany, UK, Nigeria USA, Germany, Japan, France
670100 UAE, USA, Kenya, Germany UAE, USA, China, UK
711711 USA, Sri Lanka, Nigeria, UK, France Saudi Arabia, UK, China, Germany, USA
711719 UAE, USA, Nigeria, Iran, Afghanistan USA, France, Germany, China, Japan
830890 USA, Bangladesh, Hong Kong, Sri Lanka France, Hongkong, Romania, Italy, Germany
960110 USA, Spain, Australia, Nepal Belgium, France, Japan, USA, Singapore
CATEGORY: FASHION
HS code Importing Country
Signing RTA beneficial
Non Price Factors more prevalent
Price Sensitivity Major Competitors
Fall of China Impact
581100
Egypt No No Yes China Positive
Morocco Yes Unknown No Spain / China Positive
Vietnam Yes Unknown Yes China / Japan Negative
China No Unknown No Japan / Korea NA
Russia Yes Unknown Yes China / Turkey Positive
610431
South Korea No Unknown No Italy Positive
Germany Yes Unknown No China Positive
Hong Kong No Unknown No China Positive
611710
Germany Yes Unknown Yes Bangladesh / Netherlands Positive
France Yes Unknown Yes Netherlands Positive
China No Yes No Japan / Korea NA
Russia No Yes No China / Turkey / Belarus Positive
630790
Germany Yes Unknown Yes China / Vietnam / Hong Kong Positive
France Yes Unknown Yes China / Vietnam / Hong Kong Positive
Japan No Yes No Vietnam / China Positive
650400 Germany No No Yes Poland / France Positive
France No Unknown Yes China / Netherlands / Vietnam Positive

24 | P a g e
Japan No Unknown Yes China / Italy / Thailand Positive
650500 France No Unknown Yes Italy / Netherlands Positive
Japan No Unknown Yes China / Vietnam / Thailand Positive
670100 China No Yes No NA Negative
UK No Yes No Germany / China Positive
711711
Saudi Arabia Yes Yes No France / Switzerland Positive
China No Yes No Italy / France NA
Germany Not Much Yes No Italy / China Positive
711719
France Yes Yes No Italy / China Positive
Germany Yes Yes No Austria / France / Thailand Positive
China No Yes No Italy / France NA
Japan No Yes No Korea Positive
830890
France Yes Yes No China Positive
Hong Kong No Unknown No China Positive
Italy Yes Yes No USA Negative
Germany Yes Yes No China Positive
711711 Cuff links and studs, of base metal Saudi Arabia, UK, China, Germany, USA
Value imported
% Share CIF price
Import Duty (actual)
Import Duty (If India signs RTA) FLP 1 FLP 2 TII Remarks
Saudi Arabia
China 7420 62.4 22901 5 5 24046 24046 6.16 This HIS is moderately price sensitive. Availability of the right product, quality and international demand would play a key role. FTA or RTA can assist imports
Switzerland 1006 8.5 503000 0 0 503000 503000 0.03
France 651 5.5 651000 5 5 683550 683550 0.01
India 155 1.3 11923 5 0 12519 11923 NA
China
Italy 1913 41.2 1913000 10 10 2104300 2104300 60.17 No major significance of FTA or RTA. Italy and France, with significantly high TII would be the major competitors
China 1083 23.4 60167 NA NA NA NA NA
France 644 13.9 644000 10 10 708400 708400 8.91
India NA NA NA 10 0 NA NA 0.35
Germany
China 2271 66.4 252333 4 4 262426 262426 11.39 China and France, with significantly high TII would be the major competitors. FTA or RTA can assist imports
Italy 360 10.5 360000 0 0 360000 360000 1.89
France 214 6.3 NA 0 0 NA NA 5.82
India 18 0.5 NA 4 0 NA NA 0.42
This HS is moderately price sensitive. Availability of the right product, quality and international
demand would play a key role. FTA or RTA can assist imports
25 | P a g e
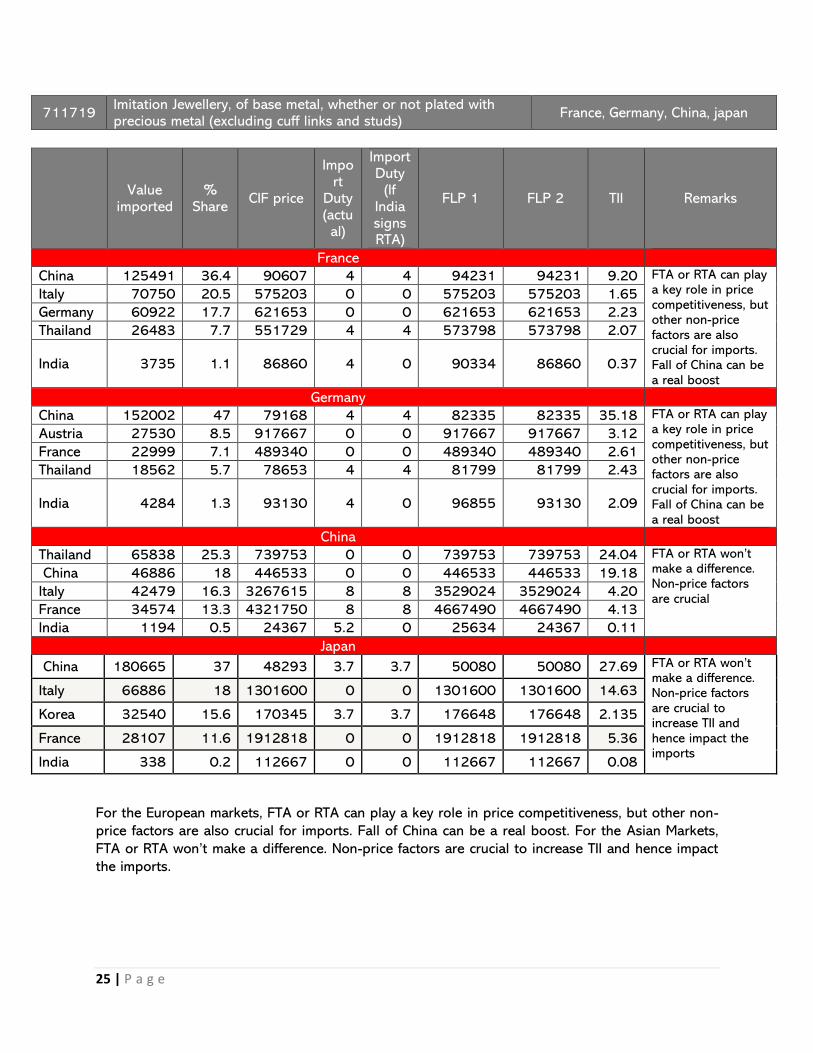
711719 Imitation Jewellery, of base metal, whether or not plated with precious metal (excluding cuff links and studs)
France, Germany, China, japan
Value
imported %
Share CIF price
Import
Duty (actual)
Import Duty
(If India signs RTA)
FLP 1 FLP 2 TII Remarks
France
China 125491 36.4 90607 4 4 94231 94231 9.20 FTA or RTA can play a key role in price competitiveness, but other non-price factors are also crucial for imports. Fall of China can be a real boost
Italy 70750 20.5 575203 0 0 575203 575203 1.65
Germany 60922 17.7 621653 0 0 621653 621653 2.23
Thailand 26483 7.7 551729 4 4 573798 573798 2.07
India 3735 1.1 86860 4 0 90334 86860 0.37
Germany
China 152002 47 79168 4 4 82335 82335 35.18 FTA or RTA can play a key role in price competitiveness, but other non-price factors are also crucial for imports. Fall of China can be a real boost
Austria 27530 8.5 917667 0 0 917667 917667 3.12
France 22999 7.1 489340 0 0 489340 489340 2.61
Thailand 18562 5.7 78653 4 4 81799 81799 2.43
India 4284 1.3 93130 4 0 96855 93130 2.09
China
Thailand 65838 25.3 739753 0 0 739753 739753 24.04 FTA or RTA won’t make a difference. Non-price factors are crucial
China 46886 18 446533 0 0 446533 446533 19.18
Italy 42479 16.3 3267615 8 8 3529024 3529024 4.20
France 34574 13.3 4321750 8 8 4667490 4667490 4.13
India 1194 0.5 24367 5.2 0 25634 24367 0.11
Japan
China 180665 37 48293 3.7 3.7 50080 50080 27.69 FTA or RTA won’t make a difference. Non-price factors are crucial to increase TII and hence impact the imports
Italy 66886 18 1301600 0 0 1301600 1301600 14.63
Korea 32540 15.6 170345 3.7 3.7 176648 176648 2.135
France 28107 11.6 1912818 0 0 1912818 1912818 5.36
India 338 0.2 112667 0 0 112667 112667 0.08
For the European markets, FTA or RTA can play a key role in price competitiveness, but other non-
price factors are also crucial for imports. Fall of China can be a real boost. For the Asian Markets,
FTA or RTA won’t make a difference. Non-price factors are crucial to increase TII and hence impact
the imports.
26 | P a g e
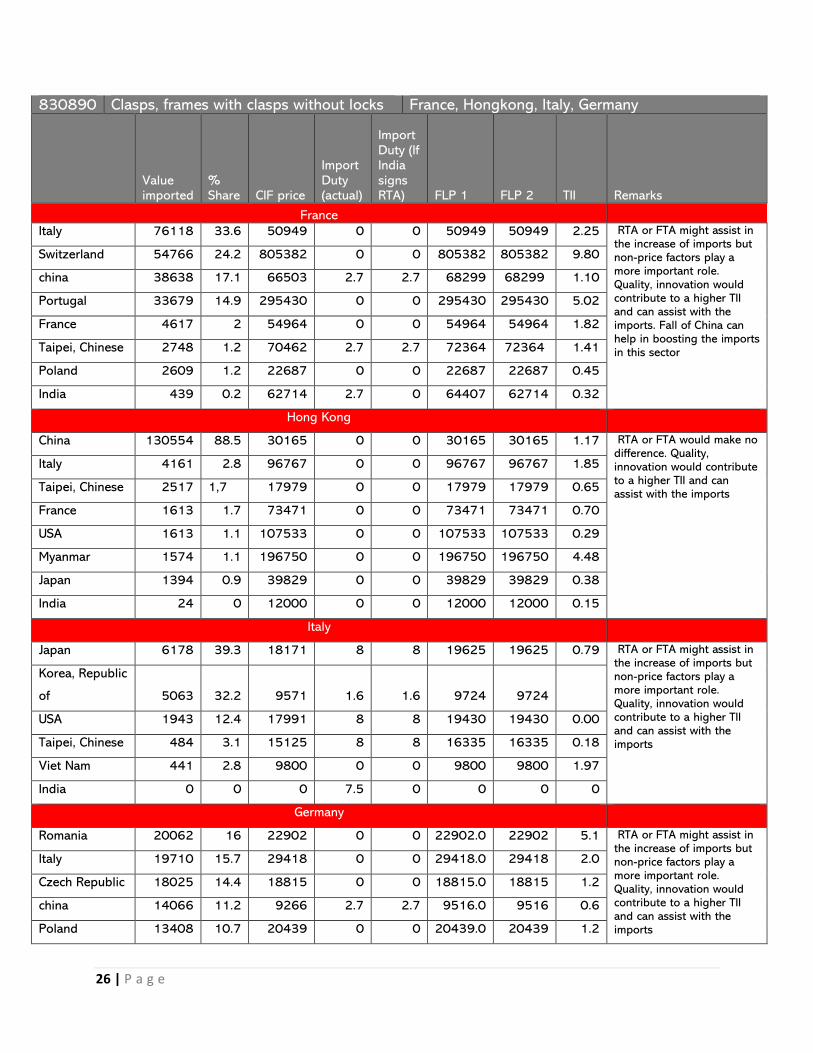
830890 Clasps, frames with clasps without locks France, Hongkong, Italy, Germany
Value imported
% Share CIF price
Import Duty (actual)
Import Duty (If India signs RTA) FLP 1 FLP 2 TII Remarks
France
Italy 76118 33.6 50949 0 0 50949 50949 2.25 RTA or FTA might assist in the increase of imports but non-price factors play a more important role. Quality, innovation would contribute to a higher TII and can assist with the imports. Fall of China can help in boosting the imports in this sector
Switzerland 54766 24.2 805382 0 0 805382 805382 9.80
china 38638 17.1 66503 2.7 2.7 68299 68299 1.10
Portugal 33679 14.9 295430 0 0 295430 295430 5.02
France 4617 2 54964 0 0 54964 54964 1.82
Taipei, Chinese 2748 1.2 70462 2.7 2.7 72364 72364 1.41
Poland 2609 1.2 22687 0 0 22687 22687 0.45
India 439 0.2 62714 2.7 0 64407 62714 0.32
Hong Kong
China 130554 88.5 30165 0 0 30165 30165 1.17 RTA or FTA would make no difference. Quality, innovation would contribute to a higher TII and can assist with the imports
Italy 4161 2.8 96767 0 0 96767 96767 1.85
Taipei, Chinese 2517 1,7 17979 0 0 17979 17979 0.65
France 1613 1.7 73471 0 0 73471 73471 0.70
USA 1613 1.1 107533 0 0 107533 107533 0.29
Myanmar 1574 1.1 196750 0 0 196750 196750 4.48
Japan 1394 0.9 39829 0 0 39829 39829 0.38
India 24 0 12000 0 0 12000 12000 0.15
Italy
Japan 6178 39.3 18171 8 8 19625 19625 0.79 RTA or FTA might assist in the increase of imports but non-price factors play a more important role. Quality, innovation would contribute to a higher TII and can assist with the imports
Korea, Republic
of 5063 32.2 9571 1.6 1.6 9724 9724
USA 1943 12.4 17991 8 8 19430 19430 0.00
Taipei, Chinese 484 3.1 15125 8 8 16335 16335 0.18
Viet Nam 441 2.8 9800 0 0 9800 9800 1.97
India 0 0 0 7.5 0 0 0 0
Germany
Romania 20062 16 22902 0 0 22902.0 22902 5.1 RTA or FTA might assist in the increase of imports but non-price factors play a more important role. Quality, innovation would contribute to a higher TII and can assist with the imports
Italy 19710 15.7 29418 0 0 29418.0 29418 2.0
Czech Republic 18025 14.4 18815 0 0 18815.0 18815 1.2
china 14066 11.2 9266 2.7 2.7 9516.0 9516 0.6
Poland 13408 10.7 20439 0 0 20439.0 20439 1.2

27 | P a g e
Hungary 12170 9.7 18810 0 0 18810 18810 4.63
Taipei, Chinese 4104 3.3 11726 2.7 2.7 12042 12042 1.94
India 919 0.7 2511 2.7 0 2579 2511 0.57
For the EU markets, RTA or FTA might assist in the increase of imports but non-price factors play a
more important role. Quality, innovation would contribute to a higher TII and can assist with the
imports. Fall of China can help in boosting the imports in this sector. For the Asian markets, RTA or
FTA would make no difference.

28 | P a g e
CHAPTER 6
GLOBAL CONSUMER BEHAVIOUR ANALYSIS
PRE AND POST COVID-19
In every market, consumers are the drivers of the market competitiveness, growth and
economic integration. As indicated in the section above, there have been incidences
where Indian handicraft products have been reasonably priced as against other
competing players including China, ASEAN and African countries in the traditional
export destinations of the USA and EU; still share of Indian handicrafts was found
meagre in these countries; highlighting the fact that while being price competitive was
important to combat global competition there are other non-price factors which are
much more important in certain developed markets. This highlights the importance of
Indian handicrafts exporters to customize their products as per the consumer behavior,
custom,
experiencing a transformation in behavior. The COVID-19 pandemic has upended life
for individuals across the globe, from how they work to how they socialize and even
how they shop. This section therefore also looks at how has consumer behavior
changed considering COVID-19, what trends in consumer behavior and sentiment have
been witnessed in the past few months, and what are consumers expecting as we move
closer to a post-pandemic lifestyle.
customs and traditions, gifting
etiquette, beliefs and taboos,
demographic profile etc. to
gain competitive advantage.
Hence exploration of these
factors through country case
studies towards adoption of
Indian handicraft products as
per importing country becomes
important.
With economic instability,
consumers are also
experiencing
29 | P a g e
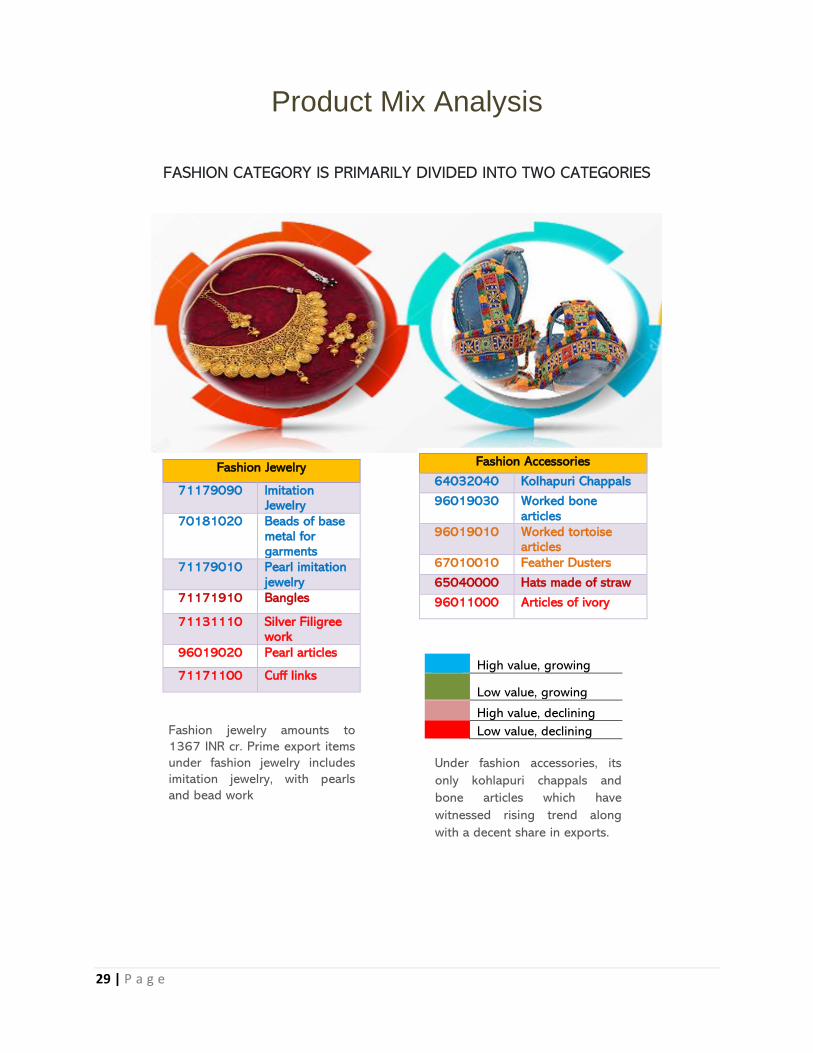
Product Mix Analysis
FASHION CATEGORY IS PRIMARILY DIVIDED INTO TWO CATEGORIES
Fashion Jewelry
71179090 Imitation Jewelry
70181020 Beads of base metal for garments
71179010 Pearl imitation jewelry
71171910 Bangles
71131110 Silver Filigree work
96019020 Pearl articles
71171100 Cuff links
Fashion Accessories
64032040 Kolhapuri Chappals
96019030 Worked bone articles
96019010 Worked tortoise articles
67010010 Feather Dusters
65040000 Hats made of straw
96011000 Articles of ivory
High value, growing
Low value, growing
High value, declining
Low value, declining
Fashion jewelry amounts to
1367 INR cr. Prime export items
under fashion jewelry includes
imitation jewelry, with pearls
and bead work
Under fashion accessories, its
only kohlapuri chappals and
bone articles which have
witnessed rising trend along
with a decent share in exports.
30 | P a g e
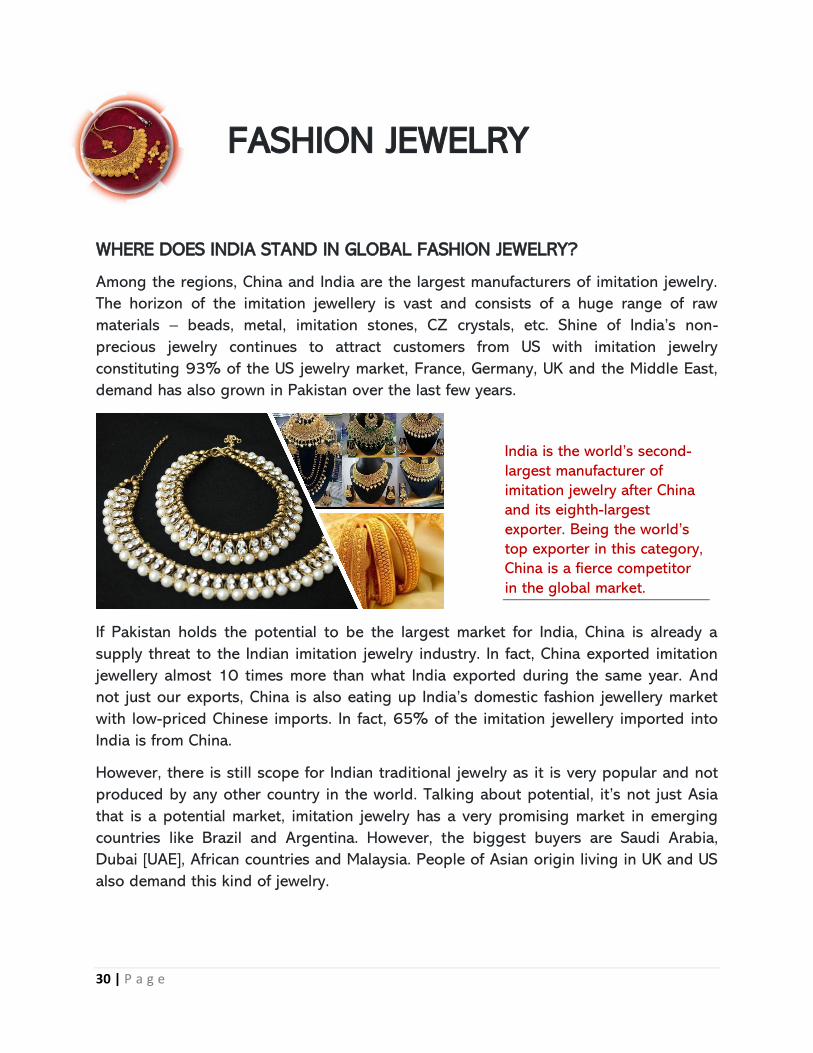
WHERE DOES INDIA STAND IN GLOBAL FASHION JEWELRY?
Among the regions, China and India are the largest manufacturers of imitation jewelry.
The horizon of the imitation jewellery is vast and consists of a huge range of raw
materials – beads, metal, imitation stones, CZ crystals, etc. Shine of India’s non-
precious jewelry continues to attract customers from US with imitation jewelry
constituting 93% of the US jewelry market, France, Germany, UK and the Middle East,
demand has also grown in Pakistan over the last few years.
If Pakistan holds the potential to be the largest market for India, China is already a
supply threat to the Indian imitation jewelry industry. In fact, China exported imitation
jewellery almost 10 times more than what India exported during the same year. And
not just our exports, China is also eating up India’s domestic fashion jewellery market
with low-priced Chinese imports. In fact, 65% of the imitation jewellery imported into
India is from China.
However, there is still scope for Indian traditional jewelry as it is very popular and not
produced by any other country in the world. Talking about potential, it’s not just Asia
that is a potential market, imitation jewelry has a very promising market in emerging
countries like Brazil and Argentina. However, the biggest buyers are Saudi Arabia,
Dubai [UAE], African countries and Malaysia. People of Asian origin living in UK and US
also demand this kind of jewelry.
FASHION JEWELRY
India is the world’s second-
largest manufacturer of
imitation jewelry after China
and its eighth-largest
exporter. Being the world’s
top exporter in this category,
China is a fierce competitor
in the global market.

31 | P a g e
GLOBAL FASHION JEWELRY TREND: WAY FORWARD FOR INDIA
The jewelry industry seems poised for a glittering future. The imitation jewelry market
is projected to grow at a high rate due to growing demand. The costume jewelry
market was valued at $32.9 billion in 2019, annual global sales of €148 billion were
expected to grow at a healthy clip of 5 to 6 percent each year, totaling €250 billion by
2020 and is estimated to reach $ 59.7 billion by 2027, registering a CAGR of 7.80%
from 2020 to 2027.
Costume jewelry has been gaining traction in emerging market, owing to change in
lifestyle, rise in disposable income, and surge in prices of precious metal jewelry and
helps to grow the costume jewelry market size. Other main drivers of growth for the
imitation jewelry market is globalization of brands, rising prices of gold and other
valuable stones and pearls, and growing demand for male costume jewelry. Growing
fashion consciousness among teens and cost-effective fashionable jewelry is likely to
boost the overall market in the coming years.
Moving beyond 2020: What product categories should India focus?
Global costume jewelry market analysis for 2019 highlights the necklaces & chains and
bracelets segments holding a combined share of 41.4% in global costume jewelry
market, owing to their increased demand emerging out of growing female as well as
male fashion-conscious consumers across the globe.
The rings segment would witness the fastest growth, registering a CAGR of 8.9%.
Female gender segment accounted for more than half of the share in the total costume
jewelry market and is expected to grow at a CAGR of 7.60% and is expected to
continue this trend by 2027. This can be attributed to changes in lifestyle and
demographic dividend, rise in awareness on skin care & allergies caused due to metals,
and customization of jewelry designs.
32 | P a g e
Furthermore, increase in fashion consciousness and surge in adoption of jewelries such
as necklaces, rings, and bracelets among female consumers drive the growth of
costume jewelry market growth. However, the male segment is expected to grow at the
highest CAGR throughout the global costume jewelry market forecast period, owing to
rise in metro sexual men, increase in acceptance for men’s jewelry, and rise in celebrity
culture, with influencers such as Bollywood and Hollywood actors.
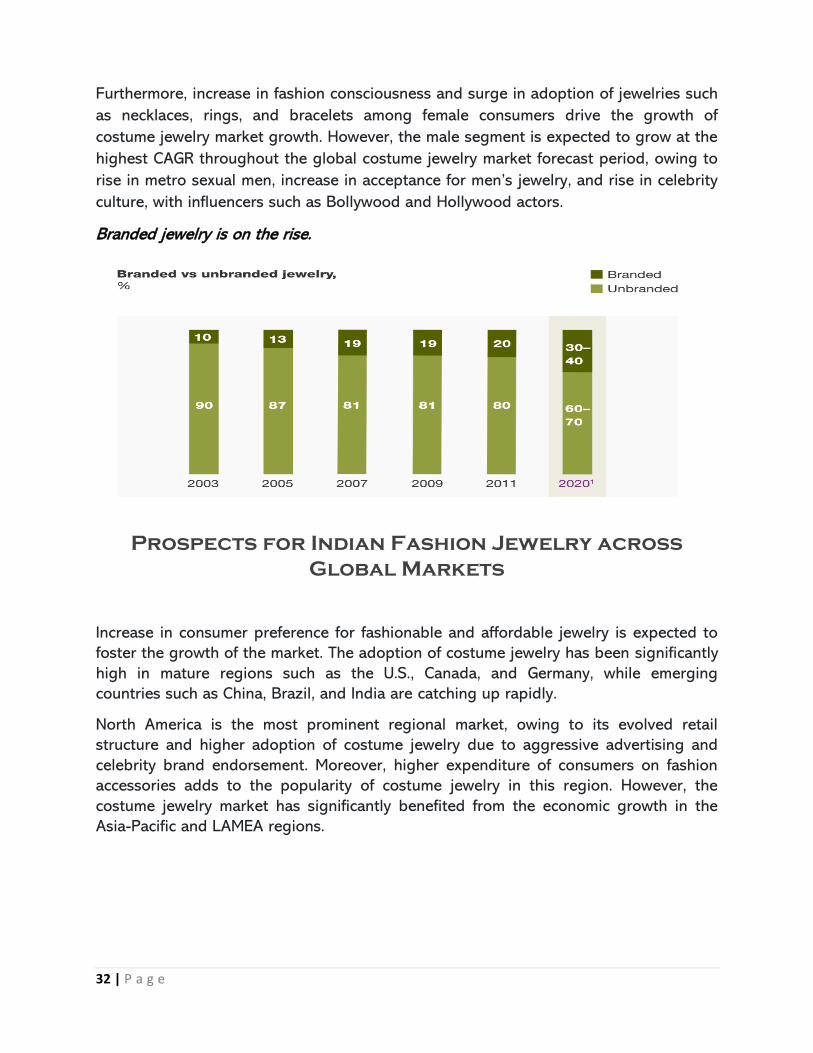
Branded jewelry is on the rise.
Prospects for Indian Fashion Jewelry across
Global Markets
Increase in consumer preference for fashionable and affordable jewelry is expected to
foster the growth of the market. The adoption of costume jewelry has been significantly
high in mature regions such as the U.S., Canada, and Germany, while emerging
countries such as China, Brazil, and India are catching up rapidly.
North America is the most prominent regional market, owing to its evolved retail
structure and higher adoption of costume jewelry due to aggressive advertising and
celebrity brand endorsement. Moreover, higher expenditure of consumers on fashion
accessories adds to the popularity of costume jewelry in this region. However, the
costume jewelry market has significantly benefited from the economic growth in the
Asia-Pacific and LAMEA regions.

33 | P a g e
UNITED STATES OF AMERICA
USA has always welcomed innovative designs that transform one's appearance into
remarkable stance. Although for the product categories listed below import demand in
the US is dropping for last 5 years, the demand for costume jewelry in the US is
expected to gain traction, in the years to come, as leading-edge accessories will
continue to replace traditional ornaments. by the end of 2024, the costume jewelry
market in US will have netted revenues worth over US$ 20,289.3 Mn.
Globally recognized fashion labels such as Chanel S.A., Gianni Versace S.p.A, Hermes
International AS, LVMH Moet Hennessy Louis Vuitton SE, and Gucci are key players in
US costume jewelry market. Others include Pandora A/S, ZARA ESPANA SA, Hennes &
Mauritz Ab, Guess Inc., and Alex and Ani, LLC.
CONSUMER TRENDS ACROSS USA
34 | P a g e
EUROPEAN UNION
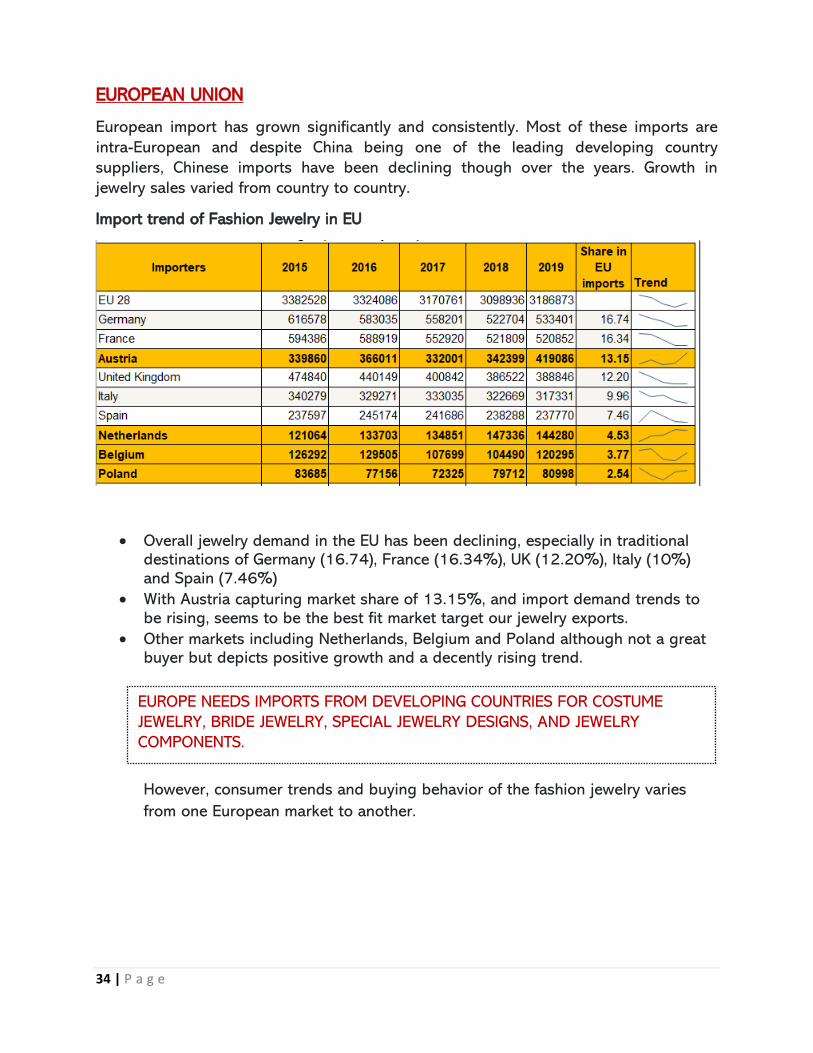
European import has grown significantly and consistently. Most of these imports are
intra-European and despite China being one of the leading developing country
suppliers, Chinese imports have been declining though over the years. Growth in
jewelry sales varied from country to country.
Import trend of Fashion Jewelry in EU
• Overall jewelry demand in the EU has been declining, especially in traditional destinations of Germany (16.74), France (16.34%), UK (12.20%), Italy (10%) and Spain (7.46%)
• With Austria capturing market share of 13.15%, and import demand trends to be rising, seems to be the best fit market target our jewelry exports.
• Other markets including Netherlands, Belgium and Poland although not a great buyer but depicts positive growth and a decently rising trend. However, consumer trends and buying behavior of the fashion jewelry varies
from one European market to another.
EUROPE NEEDS IMPORTS FROM DEVELOPING COUNTRIES FOR COSTUME
JEWELRY, BRIDE JEWELRY, SPECIAL JEWELRY DESIGNS, AND JEWELRY
COMPONENTS.
35 | P a g e
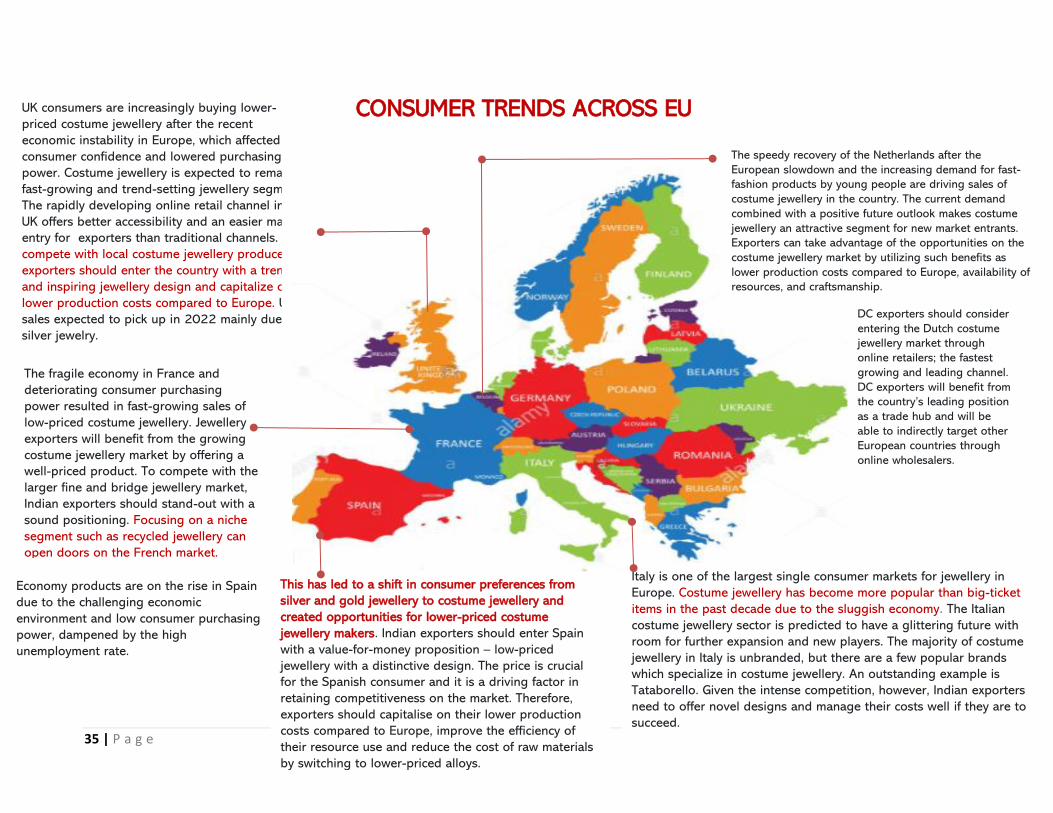
CONSUMER TRENDS ACROSS EU
UK consumers are increasingly buying lower-
priced costume jewellery after the recent
economic instability in Europe, which affected
consumer confidence and lowered purchasing
power. Costume jewellery is expected to remain a
fast-growing and trend-setting jewellery segment.
The rapidly developing online retail channel in the
UK offers better accessibility and an easier market
entry for exporters than traditional channels. To
compete with local costume jewellery producers,
exporters should enter the country with a trendy
and inspiring jewellery design and capitalize on
lower production costs compared to Europe. UK
sales expected to pick up in 2022 mainly due to
silver jewelry.
Italy is one of the largest single consumer markets for jewellery in
Europe. Costume jewellery has become more popular than big-ticket
items in the past decade due to the sluggish economy. The Italian
costume jewellery sector is predicted to have a glittering future with
room for further expansion and new players. The majority of costume
jewellery in Italy is unbranded, but there are a few popular brands
which specialize in costume jewellery. An outstanding example is
Tataborello. Given the intense competition, however, Indian exporters
need to offer novel designs and manage their costs well if they are to
succeed.
The fragile economy in France and
deteriorating consumer purchasing
power resulted in fast-growing sales of
low-priced costume jewellery. Jewellery
exporters will benefit from the growing
costume jewellery market by offering a
well-priced product. To compete with the
larger fine and bridge jewellery market,
Indian exporters should stand-out with a
sound positioning. Focusing on a niche
segment such as recycled jewellery can
open doors on the French market.
Efficient resource planning and the use of
cheaper metals and alloys will help
exporters keep the total production cost
low.
Economy products are on the rise in Spain
due to the challenging economic
environment and low consumer purchasing
power, dampened by the high
unemployment rate.
This has led to a shift in consumer preferences from
silver and gold jewellery to costume jewellery and
created opportunities for lower-priced costume
jewellery makers. Indian exporters should enter Spain
with a value-for-money proposition – low-priced
jewellery with a distinctive design. The price is crucial
for the Spanish consumer and it is a driving factor in
retaining competitiveness on the market. Therefore,
exporters should capitalise on their lower production
costs compared to Europe, improve the efficiency of
their resource use and reduce the cost of raw materials
by switching to lower-priced alloys.
The speedy recovery of the Netherlands after the
European slowdown and the increasing demand for fast-
fashion products by young people are driving sales of
costume jewellery in the country. The current demand
combined with a positive future outlook makes costume
jewellery an attractive segment for new market entrants.
Exporters can take advantage of the opportunities on the
costume jewellery market by utilizing such benefits as
lower production costs compared to Europe, availability of
resources, and craftsmanship.
DC exporters should consider
entering the Dutch costume
jewellery market through
online retailers; the fastest
growing and leading channel.
DC exporters will benefit from
the country’s leading position
as a trade hub and will be
able to indirectly target other
European countries through
online wholesalers.

36 | P a g e
PERSONAL SABLE AND/OR
CUSTOMIZABLE JEWELRY
European consumers
increasingly prefer jewelry
that no one else has.
Personalization and
customization offer
affordable ways of meeting
that need.
WEARABLE AND HI-TECH
JEWELRY
Sales of wearable tech is
increasing rapidly. This is due to
awareness in fitness, healthcare,
social media, and messaging. This
has made retailers engage more in
start-ups of wearable tech.
Significant growth is expected in
buyers who purchase for fashion
first. Wearables tend to be more
popular with women. However,
they smaller and sleeker devices.
STORY-TELLING DESIGNS
Consumers in Europe enjoy products that
add meaning and depth to their lives. This
is why storytelling designs: geographic or
historical stories, stories about the origins
or harvesting of raw materials, stories about
signs and symbols, production techniques,
or stories of how your revenues benefit the
local community; sell well.
DESIGNS WITH A LOCAL, ETHNIC
TOUCH
Designs with an authentic local or
ethnic touch answer to European
consumers’ interest in exotic
places, people and stories and
also in unique, unusual or rare
designs.
RECYCLE, REUSE, REDUCE
Recycling, reusing and reducing materials or
waste fits into the sustainability trend but is
worth mentioning separately. Innovative
materials & techniques European buyers are
always interested in new, or innovative
materials and techniques, from natural
materials to new alloys or even synthetics.
WHAT WOULD SELL IN EU?
DESIGNS WITH A
STATEMENT
Designs with a statement
answer to the preference
among some European
consumers for products
with meaning. In your
design, you could include a
statement on anything from
fashion and lifestyle to
music and sustainability.
Statements can be
humorous or philosophical,
too.
CHEAP & EASILY REPLACEABLE
VERSUS ROBUST AND DURABLE
The quality of fast fashion jewelry is
generally not as high as that of
slower, high-end products. The
European market has a growing
low-end segment, where trendiness
combined with very low prices and
easy replaceability tends to prevail
over robustness and durability. In
the middle segments, however,
durability matters more: consumers
paying a medium price for a piece
of jewelry or accessory expect it to
last long.
SUSTAINABLE MATERIALS
EU buyers increasingly support products
that are manufactured with respect for
human rights, labour conditions and the
environment. Sustainability is hotter than
ever in Europe. It includes environmental
care and social responsibility. There are lots
of materials one can use to develop a
sustainable, or green image, and that
currently constitute a niche segment in
jewelry: Wood; Textile; Cords; Leather,
including exotic leathers, such as that of a
sea snake; Elements from flora and fauna,
such as coconut chips and shells. Two retail
initiatives that have gained ground in
Western European countries are the
Business Social Compliance Initiative (BSCI)
and the Ethical Trading Initiative (ETI).
37 | P a g e
JAPAN- THE NEXT BIG MARKET
Japan can be considered as the next great destination for Indian jewelry exporters. The
jewelry industry in Japan covers myriads of product which range from personal
ornaments and decorative costume jewelry to precious metals and gems. And even
though the traditional sector of the jewelry market in Japan occupies almost 70 per
cent, there are increasing opportunities for Indian exporters as the demand for unique
and unusual designs growing everyday among the younger generation of the country.
At present, this non-traditional sector occupies 16 per cent but is widely expected to
increase rapidly over the coming years.
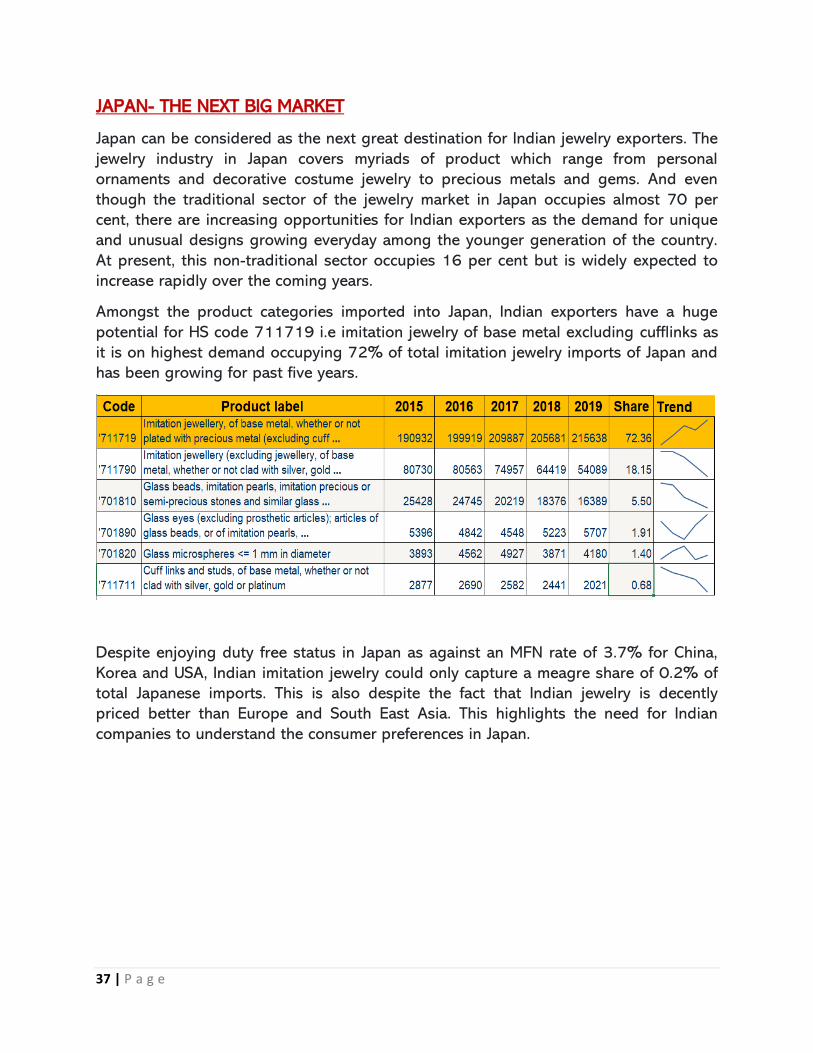
Amongst the product categories imported into Japan, Indian exporters have a huge
potential for HS code 711719 i.e imitation jewelry of base metal excluding cufflinks as
it is on highest demand occupying 72% of total imitation jewelry imports of Japan and
has been growing for past five years.
Despite enjoying duty free status in Japan as against an MFN rate of 3.7% for China,
Korea and USA, Indian imitation jewelry could only capture a meagre share of 0.2% of
total Japanese imports. This is also despite the fact that Indian jewelry is decently
priced better than Europe and South East Asia. This highlights the need for Indian
companies to understand the consumer preferences in Japan.
38 | P a g e
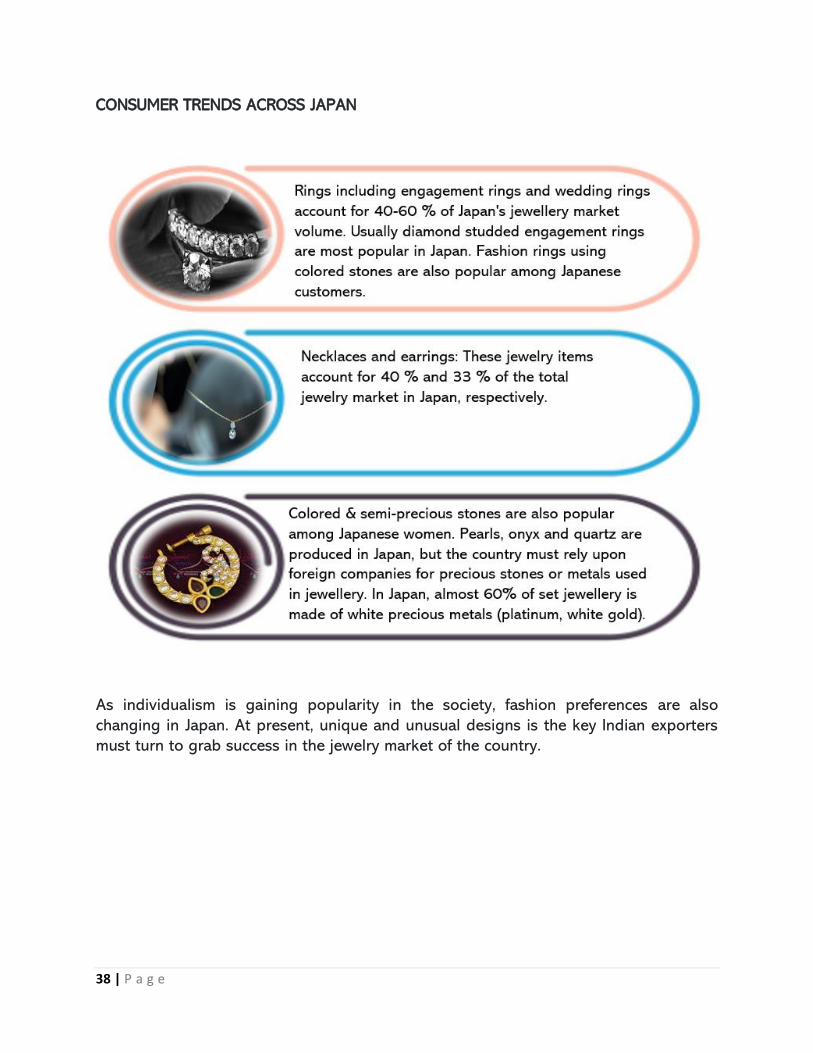
CONSUMER TRENDS ACROSS JAPAN
As individualism is gaining popularity in the society, fashion preferences are also
changing in Japan. At present, unique and unusual designs is the key Indian exporters
must turn to grab success in the jewelry market of the country.

39 | P a g e
FEW PRODUCTS MOST FREQUENTLY PURCHASED BY JAPANESE CUSTOMERS
LATIN AMERICA
Latin America is one of the smallest regions in terms of value sales of jewellery, only
beating Australia, at USD3.3 billion. In terms of per capita expenditure, the region is
also the second smallest, at USD11.80 , after the Middle East and Africa, at USD6.00. -
Jewelry is an enormously fragmented market in Latin America. The leading players
include a combination of Mexican, Brazilian, and global players. Jewelry sales in Latin
America are mostly driven by fine jewelry, wherein, Mexico and Brazil forms the key
markets for costume jewelry.
Important tips
• Best sales seasons in Japan are March and April. Christmas, Valentine's Day (16 February), White Day (16 March) are also prime gift-giving times.
• Fancy jewel boxes and woven fabric sachet are usually used for packaging of jewelry items.
• In Japan, success of a foreign business depends on being introduced by a prominent intermediary. Some distinguished importers in the Japanese jewelry market include Nagahori, Kuwayama, Kashikey, etc.
• Cooperating with a Japanese jewelry designer is a good idea to develop jewelry accessories that appeal to Japanese consumers.
40 | P a g e
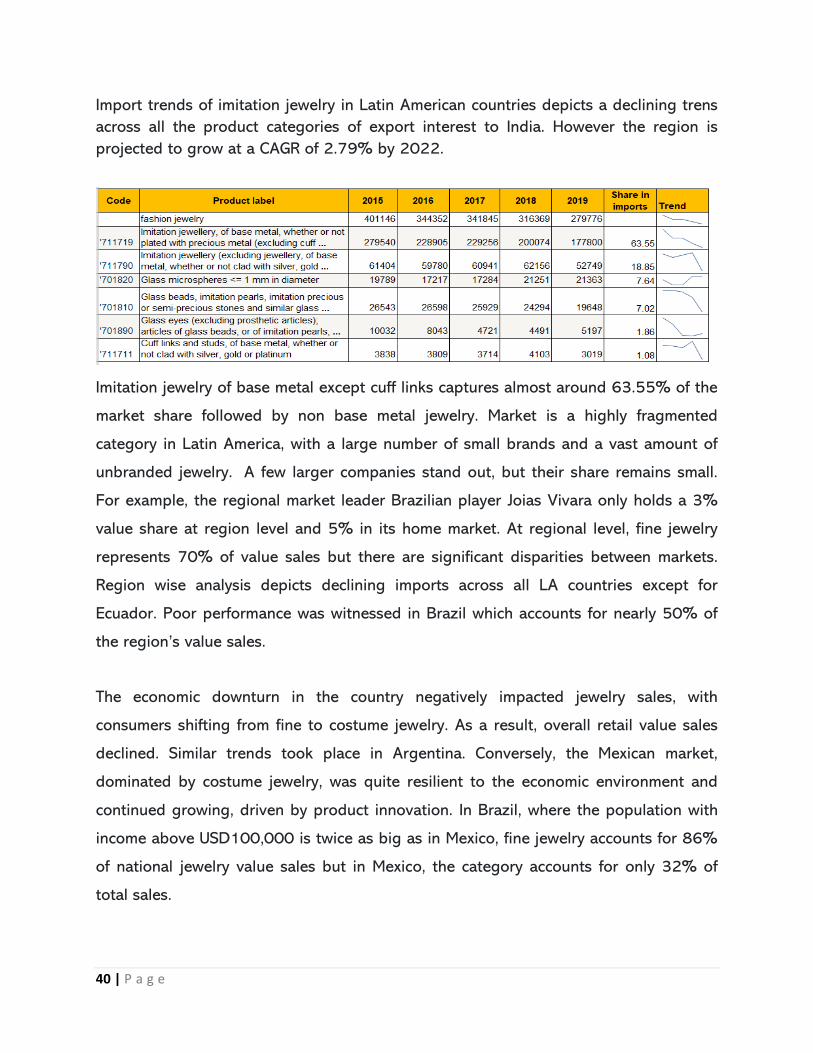
Import trends of imitation jewelry in Latin American countries depicts a declining trens
across all the product categories of export interest to India. However the region is
projected to grow at a CAGR of 2.79% by 2022.
Imitation jewelry of base metal except cuff links captures almost around 63.55% of the
market share followed by non base metal jewelry. Market is a highly fragmented
category in Latin America, with a large number of small brands and a vast amount of
unbranded jewelry. A few larger companies stand out, but their share remains small.
For example, the regional market leader Brazilian player Joias Vivara only holds a 3%
value share at region level and 5% in its home market. At regional level, fine jewelry
represents 70% of value sales but there are significant disparities between markets.
Region wise analysis depicts declining imports across all LA countries except for
Ecuador. Poor performance was witnessed in Brazil which accounts for nearly 50% of
the region’s value sales.
The economic downturn in the country negatively impacted jewelry sales, with
consumers shifting from fine to costume jewelry. As a result, overall retail value sales
declined. Similar trends took place in Argentina. Conversely, the Mexican market,
dominated by costume jewelry, was quite resilient to the economic environment and
continued growing, driven by product innovation. In Brazil, where the population with
income above USD100,000 is twice as big as in Mexico, fine jewelry accounts for 86%
of national jewelry value sales but in Mexico, the category accounts for only 32% of
total sales.

41 | P a g e
Mexico is also a strong silver producer, and local jewelers offer items made of various
materials, at various prices for consumers at different income levels. Conversely, in
costume jewelry, jewelry and watch specialist retailers only accounts for 34% of the
region’s category sales. Other key distribution channels for the category include leisure
and personal goods specialist retailers (36%), variety stores (22%), and apparel and
footwear specialist retailers (15%). Nonstore retailing is also a significant channel for
costume jewelry, accounting for nearly 16% of the category’s value sales in Latin
America.
CIS
Import trends of fashion jewelry in CIS has been found to be high in imitation jewelry
both of base and non-base excluding cufflinks capturing highest share of more than
50% and 25% respectively depicting a growing trend.
Russian Federation is the largest importer of imitation jewelry from amongst the CIS
nations followed by Kyrgyzstan; latter growing at the rate of 80% in past 5 years.
However, in the absence of any trade agreement, high import duty rate of 14.4% in
Azerbaijan which is growing at the rate of 44%.
Conclusion
India’s traditional jewelry has always been highly valued in several markets across the
globe. However Indian exporters need to be akin to the changing consumer
42 | P a g e
preferences. People used to wear intricate jewelry a while back. But now the trend has
changed. Nowadays, the jewelry normally worn by youngsters are simple chains or
small studs or thin bangles. The demand for this is more and China is very strong in
this particular field. Women in the age group of 25-35 years are the largest consumers
of this kind of jewelry. China has captured this particular market, where jewelry can be
mass produced. The machinery used are properly automated which can cater to the
demand of a large number of consumers. They have huge plants for production. In
India we still do not have proper machinery. Our artisans are still not exposed to the
technology. Chinese jewelry is cheaper for two reasons, one being automation and the
other being the support from their government. They are given land at very cheap rates
and their duty structure is favorable to the industry. In fact, China has captured almost
30% of the market in India itself. Indian policies need to take all these into account.
43 | P a g e
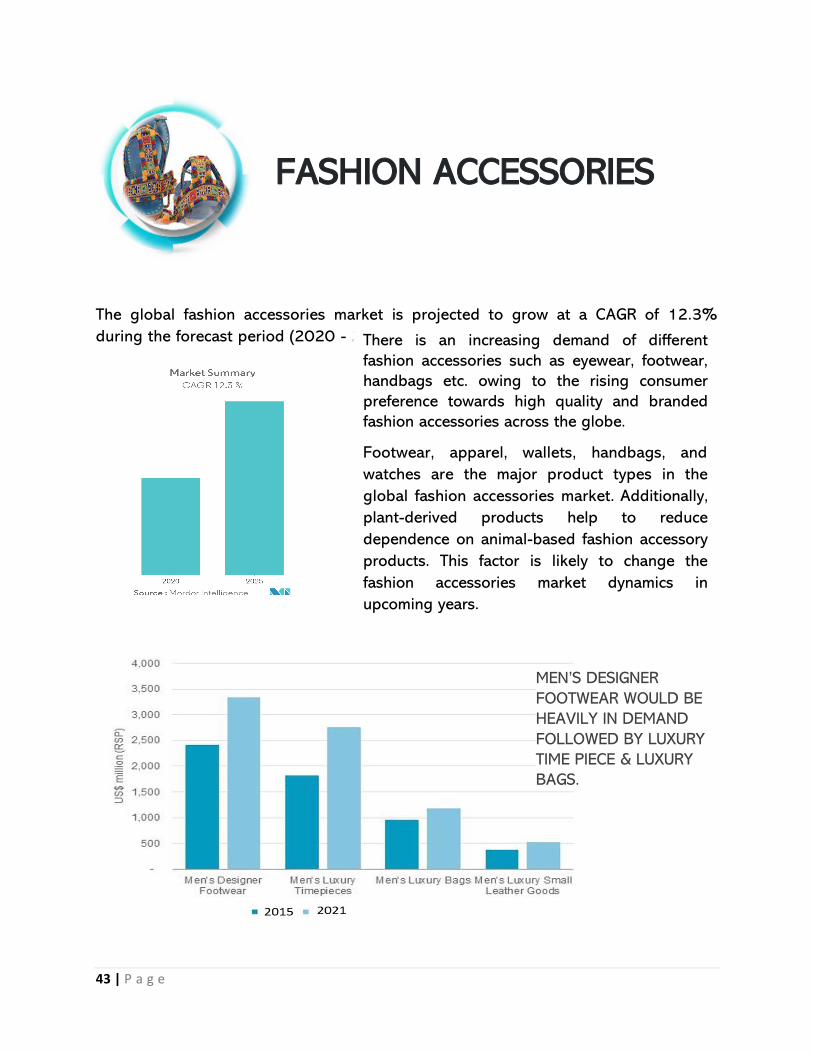
The global fashion accessories market is projected to grow at a CAGR of 12.3%
during the forecast period (2020 - 2025).
FASHION ACCESSORIES
There is an increasing demand of different
fashion accessories such as eyewear, footwear,
handbags etc. owing to the rising consumer
preference towards high quality and branded
fashion accessories across the globe.
Footwear, apparel, wallets, handbags, and
watches are the major product types in the
global fashion accessories market. Additionally,
plant-derived products help to reduce
dependence on animal-based fashion accessory
products. This factor is likely to change the
fashion accessories market dynamics in
upcoming years.
MEN’S DESIGNER
FOOTWEAR WOULD BE
HEAVILY IN DEMAND
FOLLOWED BY LUXURY
TIME PIECE & LUXURY
BAGS.
44 | P a g e
Compared to the saturated and competitive nature of
women’s accessories, men’s accessories is still small and has considerable room for
growth. Manufacturers are expanding their product lines in men’s clothing
and accessories to capture the growing menswear market. Online retailing is the
preferred channel for male consumers, as this best suits men’s purchasing habits. It
offers men a way to spend less time buying stylish accessories and allows them to
shop at their convenience. Compared with women, men tend to spend less time
shopping. When purchasing personal accessories, men often value practicality and
functionality as well as style.
▪ Forget the idea that fashion accessories are only for women and look for ways
to tap into the growing men’s segment; for example, with scarves, ties, hats, tip
clips, bracelets made from textile, leather, stones or other materials, belts, bags,
wallets or socks. Play with colours and designs in order to create distinctive,
personalised effects with your accessories
▪ The rise of “Yummies” (young urban males) has made men a prime target group
for accessories. The accessory segment for men is growing and it increasingly
incorporates creativity and vivid colours. For instance, men are gaining interest
in man bags.
Prospects for Indian
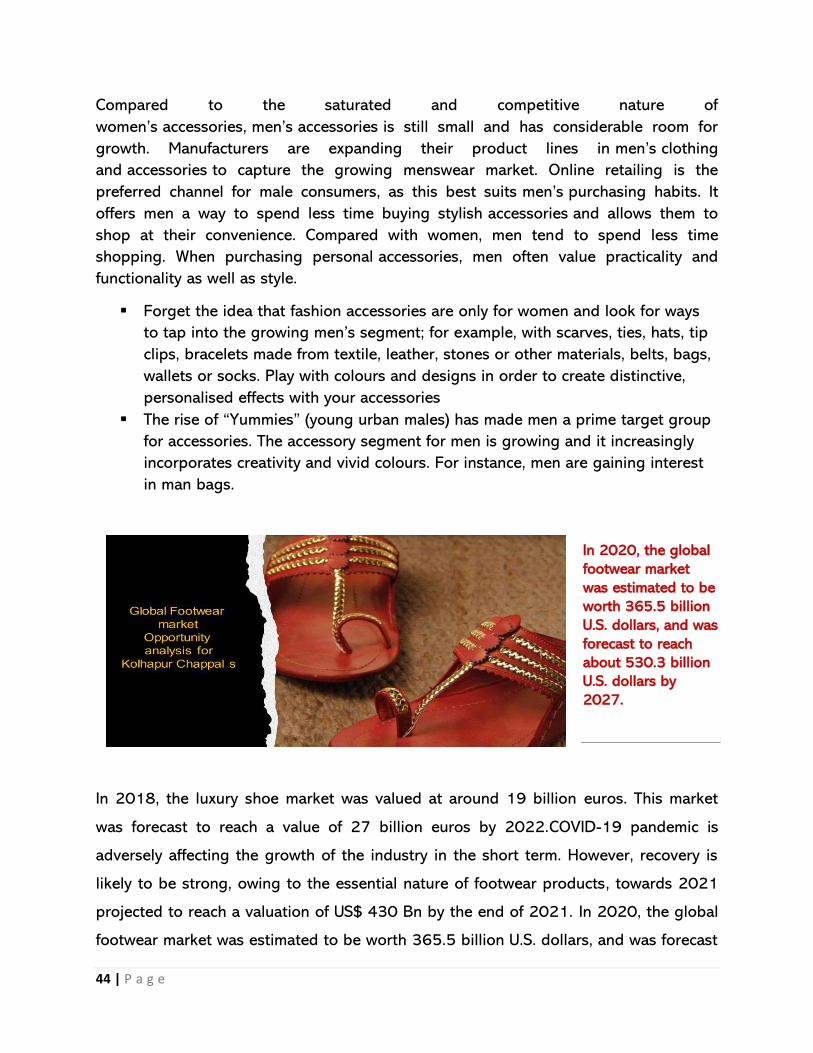
In 2018, the luxury shoe market was valued at around 19 billion euros. This market
was forecast to reach a value of 27 billion euros by 2022.COVID-19 pandemic is
adversely affecting the growth of the industry in the short term. However, recovery is
likely to be strong, owing to the essential nature of footwear products, towards 2021
projected to reach a valuation of US$ 430 Bn by the end of 2021. In 2020, the global
footwear market was estimated to be worth 365.5 billion U.S. dollars, and was forecast
In 2020, the global
footwear market
was estimated to be
worth 365.5 billion
U.S. dollars, and was
forecast to reach
about 530.3 billion
U.S. dollars by
2027.
45 | P a g e
to reach about 530.3 billion U.S. dollars by 2027Current forecasts indicate that that
footwear industry is currently worth 365.5 billion US dollars and this is projected to
grow by 30 percent over the next 5 years, an increase of up to 111 billion US
dollars. The footwear industry it adds is growing at a compound annual growth rate
(CAGR) of 5.5 percent for the forecast period of 2020-2027. The market is expected to
rise at over 4% CAGR through 2031. In terms of revenue, the global footwear market
is estimated to expand at a CAGR of ~8%.
Trend in footwear demand in 2022-24
➢ Footwear is produced in a vast variety on the basis of style and functionality,
including casual, fashion, occupational, therapeutics, athletic, protective, and
others. Of these, sales of fashion footwear accounted for more than 109 Bn in
2020.
➢ Rising demand for different types of footwear products are paving new
opportunities for many manufacturers. With rapid increase in eco-friendly
footwear, as consumers favor biodegradable materials that do less damage to
the environment than other fabrics, the global footwear market is expanding.
➢ Increase in number of working women worldwide has augmented the demand of
trendy and stylish footwear, which can be used for formal as well as casual
occasions. Moreover, surge in disposable income is allowing individuals to
spend more on luxury goods, thereby driving the growth of the footwear market.
➢ Demand for new fancy and trendy footwear, shoes, slip-ons, and flip flops is
continuously growing, thereby boosting the footwear market growth.
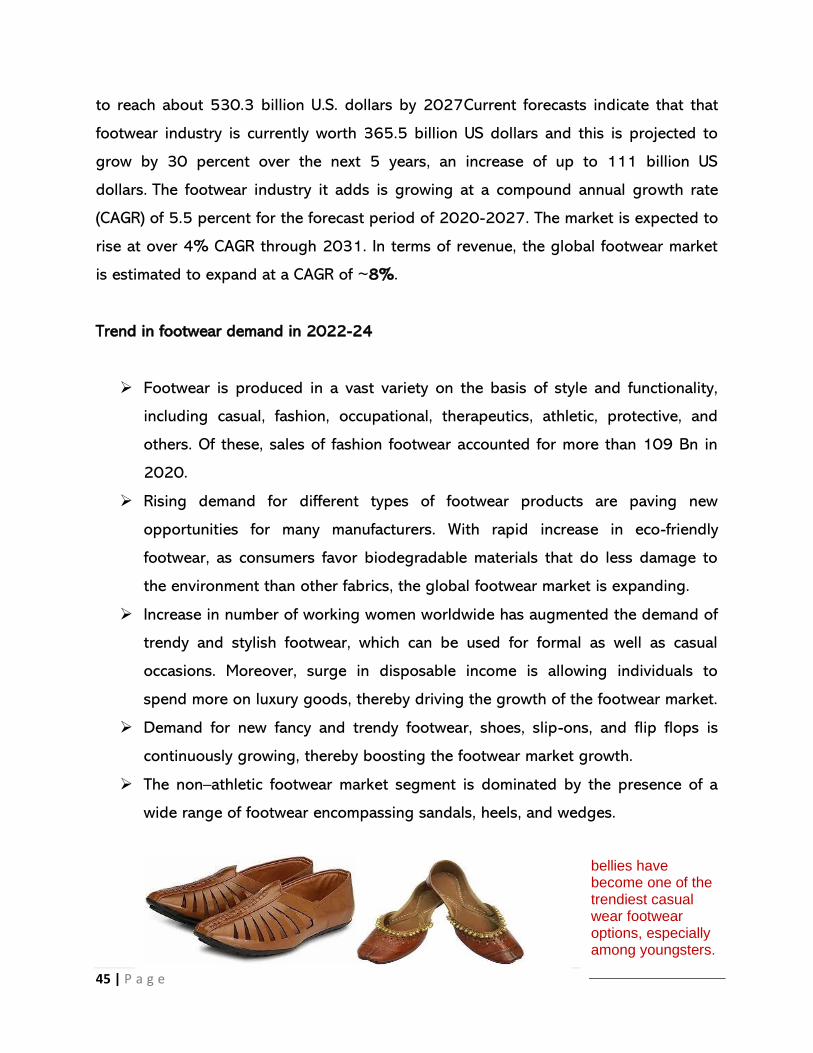
➢ The non–athletic footwear market segment is dominated by the presence of a
wide range of footwear encompassing sandals, heels, and wedges.
bellies have become one of the trendiest casual wear footwear options, especially among youngsters.

46 | P a g e
➢ Bellies shoes, boots, sandals, and others, wherein, sports shoes & bellies shoes
is projected to be a highly lucrative segment across the globe from 2018 to
2030.
➢ Additionally, bellies have become one of the trendiest casual wear footwear
options, especially among youngsters.
➢ Worldwide growth in security, military, corporate, and institution sectors is likely
to promote the expansion of the footwear market in terms of boots.
The influx of new and innovative designs coupled with increasing consumer
awareness about trendy and fashionable lifestyles are major factors fueling the
growth of the footwear market.
➢ Major manufacturers had increasingly displayed interest in offerings for mass-
produced fashion designs, including smoking slippers, peep-toe booties, ballet
flats, ankle boots, cutout shoes, and novelty shoes which was a was a major
contributor.
➢ By material, the non-leather segment led the market, in terms of value, in 2019.
Artificial and synthetic leather footwear are most often used as formal shoes by
men, women, and children. Moreover, increase in use of artificial and synthetic in
making sports shoes, slippers, casual shoes, sandals, sneakers, flip flops, and
rubber clogs is driving the growth of non-leather segment.
➢ Anti-bacterial footwear, and shoes for overweight people and people with
allergies, have met increasing popularity in recent years. In the United States, for
instance, the Medicare program sponsors a pair of these medical shoes each
year.
➢ Footwear adapted to health problems New types of footwear and new models of
shoes design to suit customers with different health problems (shoes for
diabetics, shoes for people suffering from dementia, shoes for people with
specific allergies)

47 | P a g e
➢ Supply chain tracking: The consumer will demand information about the
manufacturing process, and questions will range from the origin of the materials
and products, to details about the working conditions.
Common queries relating the leather will include questions about the conditions
under which the cattle was raised and the process used to treat the raw material
before manufacturing, similarly to what happened to food industry where some
products have to include indication on the packaging about the entire supply
chain
➢ Depending on end user, the women segment led in terms of market share in
2019. and is expected to retain its dominance during the forecast period. This is
attributed to increase in number of working women worldwide that fuels the
demand for trendy and stylish footwear, which can be used for formal as well as
casual occasions. Moreover, increase in disposable income is allowing
individuals to spend more on luxury goods, thereby driving the growth of the
women footwear segment.

48 | P a g e
Prospects for Indian Fashion accessories across
Global Markets
FOOTWEAR ATTRACTIVENESS INDEX BY REGION: 2021-2031
ASIA PACIFIC AND THE USA ARE THE MOST PROMINENT
MARKETS FOR FASHION
ACCESSORIES.

49 | P a g e
UNITED STATES OF AMERICA
United States has the largest footwear market in terms of revenue, with a revenue of
91.2 billion U.S. dollars. China was the second largest market for footwear with 64.77
billion U.S. dollars in revenue. In terms of production, China was the leading footwear
producer, producing approximately 13.3 billion pairs of shoes.
USA follows the global trend of importing just two prominent products in fashion
accessories category including products made out of worked bones, horn, antlers etc.
While Indian government has placed these products in prohibited category as per the
foreign trade policy. India should however strengthen its position on exporting
footwear with outer soles of leather to gain market share of fashion accessories in the
USA.
In North America, growing the consumer inclination towards adaptation of latest
fashion trends and the growing demand for products which exclusively available in
retail stores are driving the fashion accessories market growth in the region.
In 2018, sales of fashion footwear was surpassed by sports leisure footwear. Growth in
the sales of sandals and boots also contributed to the rise of fashion footwear sales, as
comfort and functional fashion have gained traction. U.S. imports over 7 pairs of shoes
for every man, woman, and child in the country, and annual sales have now crossed
US$ 85.6 billion. Imported footwear accounted for 99 percent of the overall U.S.
market for footwear. Stronger consumer spending on footwear has increased U.S.
imports by US$ 927 million, to reach an overall valuation of US$ 26.6 billion.

50 | P a g e
EUROPE
Prominent importing destinations where fashion accessories and fashion footwear
demand has been high on absolute terms includes UK, Germany and France.
Footwear is a small sector of the U.K.’s GDP, accounting for approximately 1%.
Footwear with leather bodies accounts for the largest market share at around 47%,
followed by textile footwear, rubber/plastic footwear, and others at approximately
20%, 17%, and 3%, respectively. France is the largest and fastest-growing footwear
market in Europe, reflecting a CAGR of over 6% through the assessment period. French
shoes are associated with luxury goods, high-end craftsmanship, and its massive
fashion industry.
Widespread adoption of specialized manufacturing techniques such as double-stitching,
Goodyear stitching, and more, with a wide range of materials such as fabric, leather,
and synthetics, are key to catering to the needs of varying consumer demographics.
Leading countries for exports of French footwear include Germany, Italy, the United
Kingdom, Spain, and the United States of America. On the other hand, imports account
for 6.7 billion Euros and 479 million pairs. Leading import countries include China,
Vietnam, Italy, Portugal, and Indonesia. B2C consumption in the French market
accounts for 8.7 billion euros.
China remained the leading
supplier of footwear to the
United States, accounting for
over 50% of total U.S.
footwear imports. However, its
share has displayed steady
decline, from approximately
two-third of U.S. imports.
On the other hand, the shares of second-tier
Asian suppliers such as Indonesia, Vietnam, and
Cambodia have displayed an increase. U.S.
imports from Italy and Mexico, known for leather
footwear, also rose recently, gaining US$ 172
million and US$ 84 million, respectively.
51 | P a g e
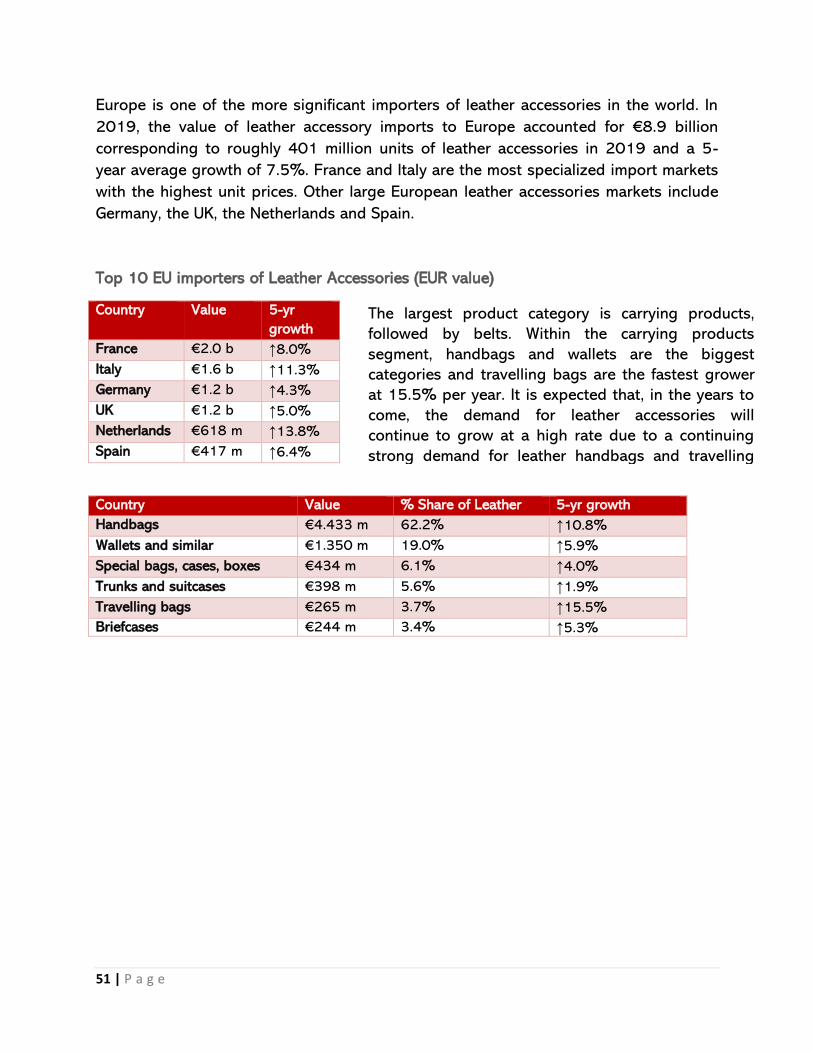
Europe is one of the more significant importers of leather accessories in the world. In
2019, the value of leather accessory imports to Europe accounted for €8.9 billion
corresponding to roughly 401 million units of leather accessories in 2019 and a 5-
year average growth of 7.5%. France and Italy are the most specialized import markets
with the highest unit prices. Other large European leather accessories markets include
Germany, the UK, the Netherlands and Spain.
Top 10 EU importers of Leather Accessories (EUR value)
Country Value 5-yr
growth
France €2.0 b ↑8.0%
Italy €1.6 b ↑11.3%
Germany €1.2 b ↑4.3%
UK €1.2 b ↑5.0%
Netherlands €618 m ↑13.8%
Spain €417 m ↑6.4%
Country Value % Share of Leather 5-yr growth
Handbags €4.433 m 62.2% ↑10.8%
Wallets and similar €1.350 m 19.0% ↑5.9%
Special bags, cases, boxes €434 m 6.1% ↑4.0%
Trunks and suitcases €398 m 5.6% ↑1.9%
Travelling bags €265 m 3.7% ↑15.5%
Briefcases €244 m 3.4% ↑5.3%
The largest product category is carrying products,
followed by belts. Within the carrying products
segment, handbags and wallets are the biggest
categories and travelling bags are the fastest grower
at 15.5% per year. It is expected that, in the years to
come, the demand for leather accessories will
continue to grow at a high rate due to a continuing
strong demand for leather handbags and travelling
bags.

52 | P a g e
CONSUMER TRENDS ACROSS EU
CANADA
Canadians love their shoes and have a rich and thriving shoe market. As of 2021,
the Canadian footwear industry is expected to reach nearly 8.7 billion Canadian dollars
in value. Ontario alone is home to around 1,094 shoe stores, the highest number of
any Canadian province. The average Canadian household spends approximately 347
Canadian dollars on women’s and girl’s footwear, and around 277 Canadian dollars
on men’s and boy’s footwear.
Men are also looking for ways
to personalize their suit or
outfit with eye-catching
colours and designs. The use
of very colourful or high-
comfort socks under a simple
grey suit is an example of
this. Particularly as ties lose
popularity, socks have
become an important
accessory for adding colour
and a personal style.
Accessories are
one of the best
segments for experimenting
with recycled
materials.
Man bags
began to
replace
briefcases
Leather accessories
– especially bags –
are a fast-growing
market. Many new
brands have started
offering them, often
citing idealism and
therefore focusing
on product first and
price second. This
fact also means that
they tend to use
environment friendly
tanning methods.
53 | P a g e
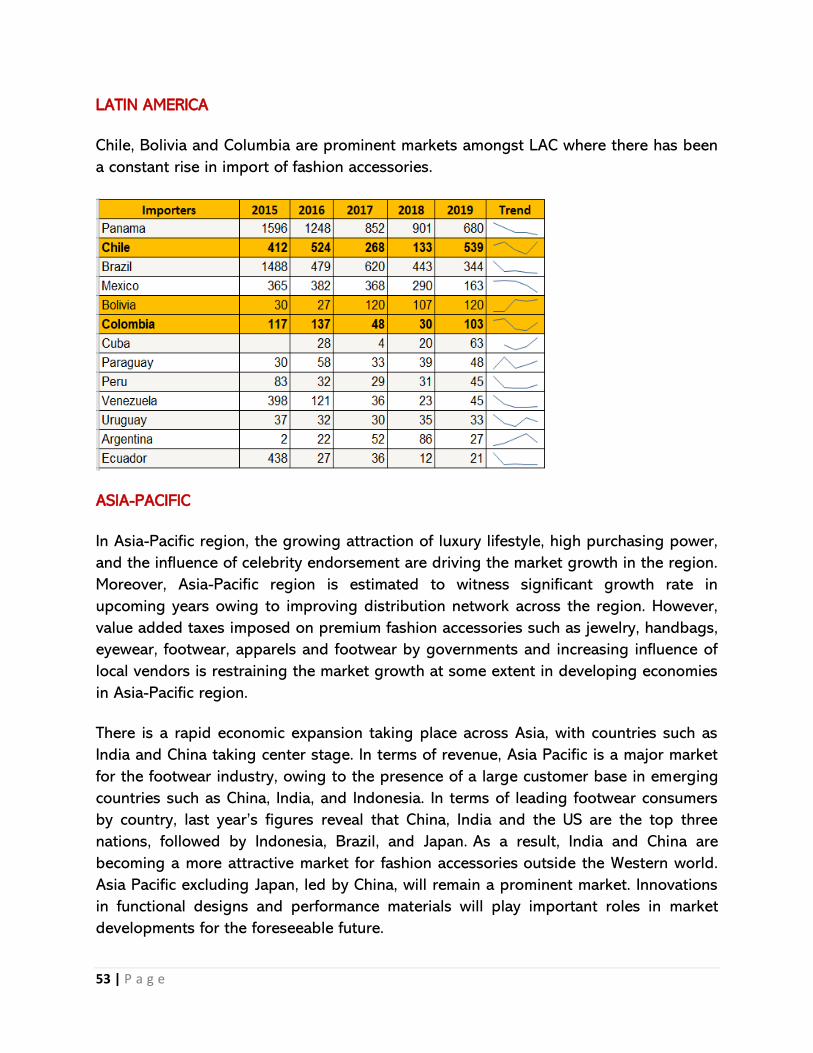
LATIN AMERICA
Chile, Bolivia and Columbia are prominent markets amongst LAC where there has been
a constant rise in import of fashion accessories.
ASIA-PACIFIC
In Asia-Pacific region, the growing attraction of luxury lifestyle, high purchasing power,
and the influence of celebrity endorsement are driving the market growth in the region.
Moreover, Asia-Pacific region is estimated to witness significant growth rate in
upcoming years owing to improving distribution network across the region. However,
value added taxes imposed on premium fashion accessories such as jewelry, handbags,
eyewear, footwear, apparels and footwear by governments and increasing influence of
local vendors is restraining the market growth at some extent in developing economies
in Asia-Pacific region.
There is a rapid economic expansion taking place across Asia, with countries such as
India and China taking center stage. In terms of revenue, Asia Pacific is a major market
for the footwear industry, owing to the presence of a large customer base in emerging
countries such as China, India, and Indonesia. In terms of leading footwear consumers
by country, last year’s figures reveal that China, India and the US are the top three
nations, followed by Indonesia, Brazil, and Japan. As a result, India and China are
becoming a more attractive market for fashion accessories outside the Western world.
Asia Pacific excluding Japan, led by China, will remain a prominent market. Innovations
in functional designs and performance materials will play important roles in market
developments for the foreseeable future.
54 | P a g e
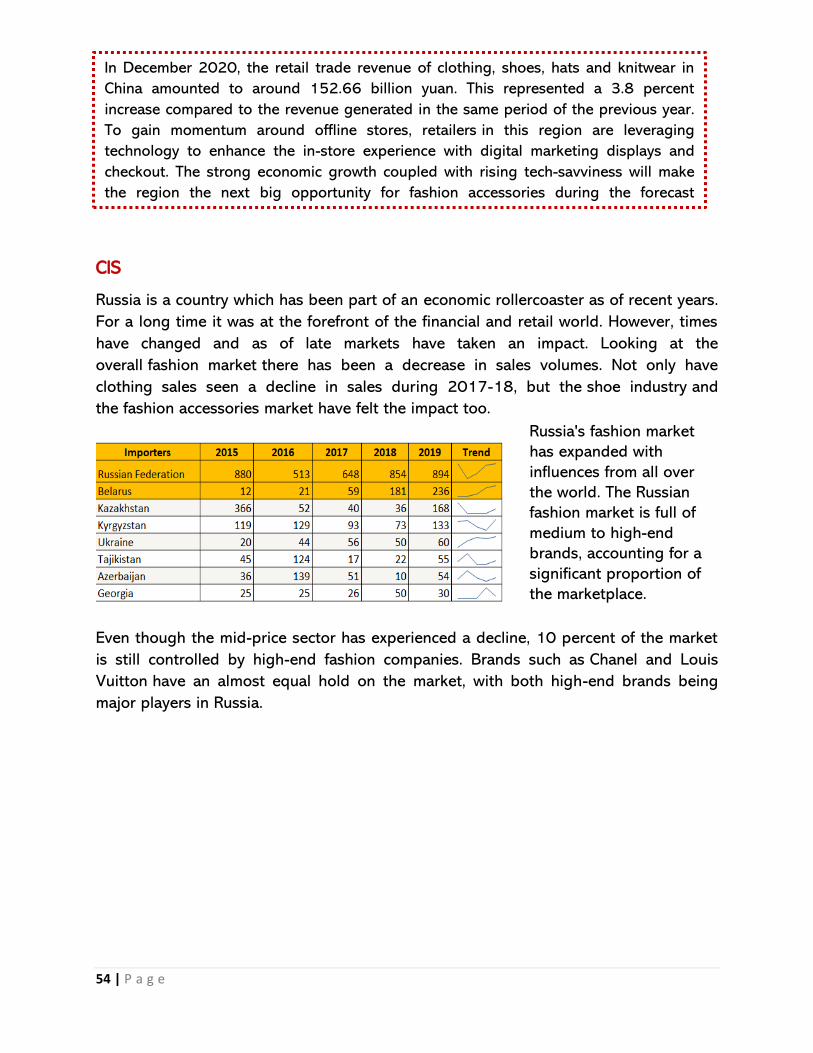
CIS
Russia is a country which has been part of an economic rollercoaster as of recent years.
For a long time it was at the forefront of the financial and retail world. However, times
have changed and as of late markets have taken an impact. Looking at the
overall fashion market there has been a decrease in sales volumes. Not only have
clothing sales seen a decline in sales during 2017-18, but the shoe industry and
the fashion accessories market have felt the impact too.
Even though the mid-price sector has experienced a decline, 10 percent of the market
is still controlled by high-end fashion companies. Brands such as Chanel and Louis
Vuitton have an almost equal hold on the market, with both high-end brands being
major players in Russia.
In December 2020, the retail trade revenue of clothing, shoes, hats and knitwear in
China amounted to around 152.66 billion yuan. This represented a 3.8 percent
increase compared to the revenue generated in the same period of the previous year.
To gain momentum around offline stores, retailers in this region are leveraging
technology to enhance the in-store experience with digital marketing displays and
checkout. The strong economic growth coupled with rising tech-savviness will make
the region the next big opportunity for fashion accessories during the forecast
period.
Russia's fashion market
has expanded with
influences from all over
the world. The Russian
fashion market is full of
medium to high-end
brands, accounting for a
significant proportion of
the marketplace.
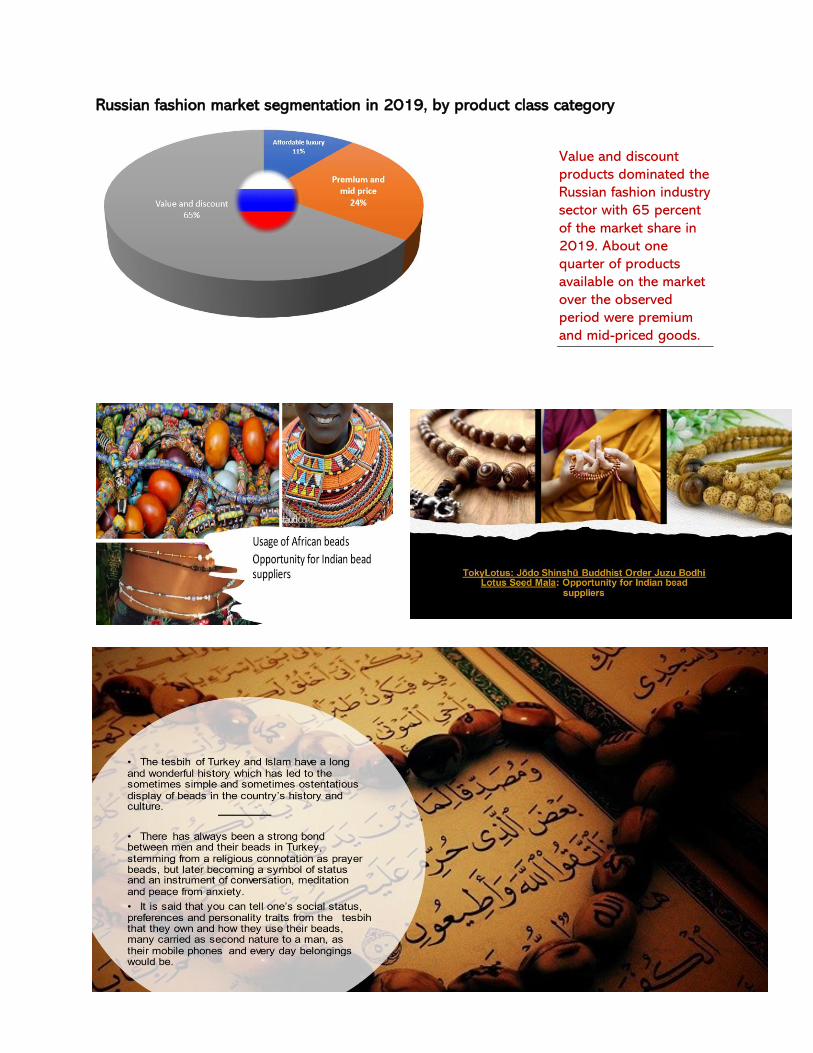
55 | P a g e
Russian fashion market segmentation in 2019, by product class category
Value and discount
products dominated the
Russian fashion industry
sector with 65 percent
of the market share in
2019. About one
quarter of products
available on the market
over the observed
period were premium
and mid-priced goods.
SHIFTING FROM HS CODE TO NTL: COUNTRY CASE STUDIES