COUNTYWIDE INTEGRATED WASTE MANAGEMENT PLAN ...
124
December 2019 COUNTYWIDE INTEGRATED WASTE MANAGEMENT PLAN 2018 Annual Report Countywide Summary Plan & Countywide Siting Element Photo courtesy of Maria Carlson
-
Upload
khangminh22 -
Category
Documents
-
view
4 -
download
0
Transcript of COUNTYWIDE INTEGRATED WASTE MANAGEMENT PLAN ...

December 2019
COUNTYWIDE INTEGRATED WASTE MANAGEMENT PLAN
2018 Annual Report
Countywide Summary Plan & Countywide Siting Element
Photo courtesy of Maria Carlson

2018 Annual Report County of Los Angeles Countywide Integrated Waste Management Plan
i
TABLE OF CONTENTS WHAT IS THE ANNUAL REPORT ............................................................... 1
SUMMARY PLAN AND SITING ELEMENT ASSESSMENT ............................ 2
ELECTRONIC ANNUAL REPORT (EAR) ....................................................... 2
SUMMARY PLAN .................................................................................... 4
REGIONAL SOLID WASTE ISSUES ............................................................. 5
SITING ELEMENT REVISION ................................................................... 20
GOALS AND POLICIES OF THE SITING ELEMENT ..................................... 22
SOLID WASTE DISPOSAL FACILITIES ....................................................... 24
DISPOSAL ANALYSIS FOR 2018 .............................................................. 25
Table 1: 2018 Disposal Tonnage Breakdown ............................................ 25
Table 2: 2018 Waste Generation and Disposal Quantities for Municipal Solid Waste ................................................................................................ 26
STRATEGY FOR MAINTAINING ADEQUATE DISPOSAL CAPACITY ............ 37
Table 3: Scenario Comparison Table ......................................................... 41
JURISDICTION/REGIONAL AGENCY CONTACT ........................................ 52
Appendix E-1 Solid Waste Facility Fact Sheets ....................................... 54
Antelope Valley Recycling and Disposal Facility ...................... 56
Azusa Land Reclamation Company Landfill ............................. 57
Burbank Landfill No. 3 .............................................................. 58
Calabasas Landfill ..................................................................... 59
Chiquita Canyon Landfill ........................................................... 60
Commerce Refuse-to-Energy Facility (CREF) ............................ 61
Lancaster Landfill and Recycling Center ................................... 62
Mesquite Regional Landfill ....................................................... 63
Pebbly Beach Landfill ................................................................ 64
San Clemente Island Landfill .................................................... 65
Scholl Canyon Landfill ............................................................... 66
Southeast Resource Recovery Facility (SERRF) ........................ 67
Sunshine Canyon City/County Landfill ..................................... 68
Whittier (Savage Canyon) Landfill ........................................... 69
Appendix E-2: Tables ............................................................................ 70
Table 4 - Remaining Permitted Capacity of Existing Solid Waste Disposal Facilities in Los Angeles County ................................................................ 70
Table 5 - Summary of Existing Inert Debris Disposal Sites in Los Angeles County ....................................................................................................... 70
Table 6 - Out-of-County Landfills Currently Available for Use by Jurisdictions in Los Angeles County .......................................................... 70
Table 7 - Population, Employment, Real Taxable Sales, and Waste Generation in Los Angeles County ........................................................... 70
Table 8 - Los Angeles County Solid Waste Disposal Capacity Need Projection .................................................................................................. 70
Appendix E-3: Disposal Capacity Analysis Scenarios .............................. 72
Appendix E-4: List and Map of Large Volume Transfer and Processing Facilities in Los Angeles County in 2018 ................................................ 74
Appendix E-5: List and Map of Composting, Chipping and Grinding, and Anaerobic Digestion Facilities in Los Angeles County in 2018 ................ 76
Appendix E-6: List of Source Separated Recycling Facilities in Los Angeles County and Neighboring Counties in 2018 ............................................ 78
Appendix E-7: Locations of Existing Inert Waste Landfills/Inert Debris Disposal Sites in Los Angeles County in 2018 (Map) .............................. 73
Appendix E-8: Waste Disposal by Jurisdiction of Origin at Permitted Municipal Solid Waste Facilities in Southern California in 2018 (Map) ... 74
2018 Annual Report County of Los Angeles Countywide Integrated Waste Management Plan
ii
TABLE OF FIGURES
Figure 1: Disposal Trend ................................................................5
Figure 2: Disposal Trend at Major Landfills ..................................5
Figure 3: Use of Green Waste as ADC in 2018 .............................6
Figure 4: JWPCP using a slurry produced from food waste .........9
Figure 5: Solid Waste Management Hierarchy ......................... 21
Figure 6: Top 10 Jurisdiction Disposal Quantities in 2018 ........ 25
Figure 7: Disposal Quantities by Facility in 2018 ....................... 27
Figure 8: Various Types of Materials Recycled or Beneficially Used* On-site at In-county Disposal Facilities (Tons) ............... 28
Figure 9: On-site Beneficial Use (Tons) ...................................... 28
Figure 10: Antelope Valley Landfill ............................................ 29
Figure 11: Burbank Landfill ........................................................ 29
Figure 12: Calabasas Landfill ...................................................... 29
Figure 13: Chiquita Canyon Landfill ........................................... 29
Figure 14: Commerce Refuse-to-Energy Facility ....................... 30
Figure 15: Lancaster Landfill ...................................................... 30
Figure 16: Pebbly Beach Landfill ................................................ 30
Figure 17: San Clemente Landfill (R) ........................................... 30
Figure 18: Savage Canyon Landfill (R) ......................................... 31
Figure 19: Scholl Canyon Landfill (R) ........................................... 31
Figure 20: Southeast Resource Recovery Facility ...................... 31
Figure 21: Sunshine Canyon Landfill .......................................... 31
Figure 22: Class III Landfill Estimated Remaining Disposal Capacity ....................................................................................... 32
Figure 23: Class III Landfill Estimated Remaining Life ............... 33
Figure 24: Population, Employment, and Real Taxable Sales ... 38
Figure 25: Solid Waste Generation and Disposal Demand ....... 39
Figure 26: Utilization of Permitted In-County Disposal Capacity Only Scenario .............................................................................. 42
Figure 27: Status Quo Scenario .................................................. 43
Figure 28: Meeting CalRecycle’s Statewide Disposal Target Scenario....................................................................................... 44
Figure 29: Meeting Senate Bill 1383 Organic Waste Reduction Disposal Targets Scenario ........................................................... 45
Figure 29: Utilization of Additional Alternative Technology Capacity Scenario ....................................................................... 46
Figure 30: Increase in Exports to Out-of-County Landfills Scenario....................................................................................... 47
Figure 31: All Solid Waste Management Options Considered Become Available Scenario ........................................................ 48

2018 Annual Report County of Los Angeles Countywide Integrated Waste Management Plan
iii
ACRONYMS AND GLOSSARY OF TERMS
ADC Alternative Daily Cover County County of Los Angeles (Los Angeles County) CSE Countywide Siting Element (Siting Element) LUP/CUP Land Use Permit/Conditional Use Permit DRS Disposal Reporting System EIR Environmental Impact Report EMSW Engineered Municipal Solid Waste EPR Extended Producer Responsibility FOC Finding of Conformance IDEFO Inert Debris Engineered Fill Operation LARA Los Angeles Regional Agency also known as Los Angeles Area Integrated Waste Management Authority LEA Local Enforcement Agency Public Works County of Los Angeles Department of Public Works PPD Pounds per Person per Day Regional Planning County of Los Angeles Department of Regional Planning Sanitation Districts Sanitation Districts of Los Angeles County SRRE Source Reduction and Recycling Element Summary Plan Los Angeles County Countywide Integrated Waste Management Summary Plan SWFP Solid Waste Facility Permit SWIMS Solid Waste Information Management System Task Force Los Angeles County Solid Waste Management Committee/Integrated Waste Management Task Force TPD Tons per Day, Based on 6 Operating Days per Week (tpd-6) TPW Tons per Week TPY Tons per Year UCLA University of California, Los Angeles CalRecycle California Department of Resources Recycling and Recovery

2018 Annual Report County of Los Angeles Countywide Integrated Waste Management Plan
1
WHAT IS THE ANNUAL REPORT
The California Integrated Waste Management Act of 1989, also known as Assembly Bill 939 (AB 939), mandates jurisdictions to meet a diversion goal of 50 percent by the year 2000, and thereafter. In addition, each county is also required to prepare and administer a Countywide Integrated Waste Management Plan. This plan is comprised of the County’s and it’s cities solid waste reduction planning documents, an Integrated Waste Management Summary Plan (Summary Plan), and a Countywide Siting Element (CSE). To assess compliance with AB 939, the Disposal Reporting System (DRS) was established to measure the amount of disposal from each jurisdiction. Comparing current disposal rates to base-year solid waste generation determines whether each jurisdiction complies with the diversion mandate. The County of Los Angeles Department of Public Works (Public Works) is responsible for preparing the Summary Plan and the CSE. These documents were approved by the County, the County’s cities containing a majority of the County’s population, the County Board of Supervisors, and the California Department of Resources, Recycling, and Recovery (CalRecycle).
The Summary Plan, approved by CalRecycle on June 23, 1999, describes the steps to be taken by local agencies, acting independently and in concert, to achieve the state mandated diversion rate by integrating strategies aimed toward reducing,
reusing, recycling, diverting, and marketing solid waste generated within the County.
The CSE, approved by CalRecycle on June 24, 1998, identifies how the County and it’s cities would meet their long-term disposal capacity needs for a 15-year planning period to safely handle solid waste generated in the County that cannot be reduced, recycled, or composted.
The Electronic Annual Report (EAR), which contains an assessment of the
Summary Plan and Siting Element, was submitted to CalRecycle on August 1, 2018. The purpose of the Annual Report is to provide an annual update to the Summary Plan and CSE. Public Works prepares the Annual Report to summarize the changes in solid waste management that have taken place since the approval of the Summary Plan and the CSE, including updated strategies to meet the long-term needs and maintain adequate disposal capacity.

2018 Annual Report County of Los Angeles Countywide Integrated Waste Management Plan
2
SUMMARY PLAN AND SITING ELEMENT ASSESSMENT ELECTRONIC ANNUAL REPORT (EAR)
Summary Plan Assessment Summary Plan 1. Question:
Does the Summary Plan need to be revised? Response: No.
Siting Element Assessment Total County or Agency Wide Disposal Capacity 1. Question:
Based on the best available estimates of current and future disposal, how many years of disposal capacity does your county or regional agency have? Response:
15 Total County or Agency Wide Disposal Capacity 2. Question:
If you do not currently have 15 years of disposal capacity, describe your strategy for obtaining 15 years of capacity? Response:
Not applicable.

2018 Annual Report County of Los Angeles Countywide Integrated Waste Management Plan
3
Siting Element Adequacy 3. Question:
Does the Siting Element need to be revised? The Siting Element will need to be revised if you have less than 15 years disposal capacity and have not described a strategy for obtaining 15 years disposal capacity. Response:
Yes.
As discussed in the Five-Year Review Report and approved by CalRecycle in December 2014, the County of Los Angeles Department of Public Works is currently revising the Siting Element and anticipates releasing it to the public for review and comment mid-2019. On June 16, 2014, an Initial Study and Notice of Preparation for the Siting Element Revision were released to all responsible agencies and interested parties for review and comment. Additionally, detailed analyses will be included in the 2018 Annual Report of the Los Angeles County Countywide Integrated Waste Management Plan, which will be submitted to CalRecycle separately. The Annual Report will describe the County’s strategy to meet the future disposal demand.

2018 Annual Report County of Los Angeles Countywide Integrated Waste Management Plan
4
SUMMARY PLAN
The Summary Plan, approved by CalRecycle in 1999, was prepared by the County to describe the steps to be taken by individual jurisdictions, acting independently and in concert, to achieve the 50 percent waste diversion mandate. Since 1999, the County and it’s cities have experienced several changes in regional solid waste management, demographics, economics, and public awareness of environmental stewardship. The County and cities continue to enhance and expand their waste reduction efforts while also adapting these strategies to changing conditions. Individual jurisdictions within the County of Los Angeles continue to implement and enhance waste reduction, recycling, special waste, and public education programs identified in their Source Reduction and Recycling Elements, Household Hazardous Waste Element, and Non-Disposal Facility Element (as updated through their Annual Reports). Through the Countywide and regional programs implemented by the County and the cities, most jurisdictions have already met the 50 percent mandate and achieved significant, measurable results. The County’s first Five-Year Review Report was approved by CalRecycle on September 21, 2004. CalRecycle approved the
second Five-Year Review Report in August 2010, which concluded that an update to the Summary Plan was not necessary. A new Five-Year Review Report was approved by CalRecycle on December 9, 2014, which also determined that an update to the Summary Plan is not necessary.
The following section is a summary discussion on the
various regional solid waste issues that currently play a significant role in the County’s continuing solid waste management efforts, including recent legislation, markets for recyclable materials, development of alternative technology facilities, diversion credit for such facilities, and the State’s 75 percent recycling goal.

2018 Annual Report County of Los Angeles Countywide Integrated Waste Management Plan
5
REGIONAL SOLID WASTE ISSUES
Disposal Trend
While the economy has shown signs of improvement in recent years, the amount of waste that residents and businesses generated and disposed of in the County continued to remain relatively low due to various factors. Figure 1 shows a downward disposal trend from 2007 to 2010, with a plateau between the years 2010 through 2014 and an increase from 2014 to the present. Figure 1: Disposal Trend
Figure 2 shows the disposal trends of major landfills within the County. Figure 2: Disposal Trend at Major Landfills
0.0
2,000,000.0
4,000,000.0
6,000,000.0
8,000,000.0
10,000,000.0
12,000,000.0
20
07
20
08
20
09
20
10
20
11
20
12
20
13
20
14
20
15
20
16
20
17
20
18
Ton
s
Waste Exported to Out-of-County Facilities
Waste Disposal at In-County Facilities
Total Disposal
0.0
0.1
0.2
0.3
0.4
0.5
0.6
0.7
0.8
2015 2016 2017 2018
Ton
s o
f So
lid W
aste
Dis
po
sed
per
Qu
arte
r(i
n m
illio
ns)
Sunshine Canyon Chiquita Canyon Scholl Canyon
Calabasas Antelope Valley Lancaster

2018 Annual Report County of Los Angeles Countywide Integrated Waste Management Plan
6
Green Waste as Alternative Daily Cover
Due to the closure of Puente Hills Landfill in October 2013, jurisdictions that once depended on the facility to recycle their green waste as alternative daily cover (ADC) looked to other sites to recycle or compost their green waste. Figure 3 shows the amount of green waste used as ADC at in-County landfills. Figure 3: Use of Green Waste as ADC in 2018
Since the closure of Puente Hills, the County, the cities, and the waste management industry have been working towards
developing alternatives for managing green waste. However, there are many challenges associated with green waste management, such as green waste capacity within the County due to difficulties in permitting and developing composting facilities, limited markets for compost made from green waste, and costs for long-distance transportation to out-of-County facilities and operations. In addition, Assembly Bill 1594 (AB 1594, Williams), which was signed by Governor Brown on September 28, 2014, provides that on and after January 1, 2020, green waste used as ADC will no longer receive diversion credit and will now be considered disposal for purposes of AB 939. The passage of this bill encourages the County, the cities, and the waste management industry to develop alternatives for managing green waste.
Adequacy of Permitted Disposal Capacity
As detailed in the section titled Strategy for Maintaining Adequate Disposal Capacity (Page 36), a shortfall in permitted solid waste disposal capacity within the County is not anticipated to occur within the next 15 years under current conditions. To meet disposal capacity needs during the planning period, jurisdictions in the County must further increase their waste reduction and diversion efforts, continue to encourage the development of alternative technologies, support the exportation of waste to out-of-County facilities, utilize the Waste-by-Rail system to Mesquite Regional Landfill, and, if found to be environmentally sound and technically feasible, expand in-County Class III landfill capacity.
36,326
49,076
12,813
711
62,615
0
15,000
30,000
45,000
60,000
75,000
Ton
s
Facility

2018 Annual Report County of Los Angeles Countywide Integrated Waste Management Plan
7
Los Angeles County’s Roadmap to a Sustainable Waste Management Future
On October 21, 2014, the Board of Supervisors adopted the Roadmap to a Sustainable Waste Management Future (Roadmap), that established a goal to divert 80-percent of solid waste generated in the unincorporated County areas from landfills by 2025, 90-percent by 2035, and 95-percent or more by 2045. The County’s efforts to achieve waste diversion are guided by the new waste management paradigm, which places a greater emphasis on source reduction, reuse, recycling, and otherwise maximizing the benefits and use of materials over disposal. The County continues to make progress towards implementing the initiatives outlined in the Roadmap. However, recent developments impacting the solid waste management system present strong challenges to continued
progress. These include strong economic activity in the County’s unincorporated areas (with a corresponding increase in waste generation) and unstable Statewide recycling markets.
Nevertheless, the continued implementation of the Roadmap’s initiatives over the next few years, such as organic waste recycling, and the implementation of new ordinances, will help the County continue to make strides towards achieving the Roadmap’s goal of 80-percent diversion by 2025.
Some of the noteworthy waste diversion achievements during this reporting period include:
• The Board adopted the Plastic Straw Ordinance (Ordinance) that became effective on January 1, 2019, in County Unincorporated Communities and at County facilities.
• In December 2018, the U.S. Environmental Protection Agency (EPA) awarded Public Works a 2018 Food Recovery Challenge Regional Award in recognition of its efforts to reduce and recycle food waste.
• A Waste-Free Event Guide that provides a simple checklist of activities and equipment necessary to prepare for and conduct a waste-free event was created.

2018 Annual Report County of Los Angeles Countywide Integrated Waste Management Plan
8
• The County Operations Organics website that provides resources to assist County departments with starting organics recycling programs at their facilities was launched.
• In 2018, Public Works sent a memo to all County Department Facility Managers and Recycling Coordinators informing them of facilities that may fall under the Tiers 1, 2, or 3 of AB 1826.
• Thirty-nine Bigbelly dual units (trash and recyclables) were placed in key locations throughout the Belvedere Garbage Disposal District.
• Public Works coordinated and hosted the first Los Angeles County Solid Waste Management Summit for Public Works Directors, held at Public Works Headquarters on November 1, 2018. The topics of discussion focused on organic waste recycling and China’s National Sword policy.
• On February 20, 2019, Public Works, in collaboration with CalRecycle, hosted a Southern California regional Senate Bill 1383 (SB 1383) Public Education meeting.
• The County is ahead of schedule to achieve the next milestone of 200 tpd in-County waste conversion by 2020.
Los Angeles County’s Conversion Technology Efforts
To address the fraction of the waste stream that cannot be feasibly recycled, the development of conversion technology (CT) facilities is a vital aspect of the new paradigm and necessary to achieve a sustainable waste management future. Through the County’s CT Program, Public Works continues to support and advance the efforts to establish CT facilities in Los Angeles County. The goal is to establish clear definitions in statute that promote the highest and best use of resources while supporting the State’s key environmental goals.
Public Works serves as the chair of the Los Angeles County Integrated Waste Management Task Force’s Alternative Technology Advisory Subcommittee. This group evaluates and promotes the development of CT projects in Southern California, such as the ones described below.
CR&R Waste and Recycling Services has begun operating the first two phases of an anaerobic digestion (AD) facility at their material recovery facility (MRF) and transfer station in Perris, CA. The facility has plans to scale up in four equal phases and ultimately digest up to 335,000 tons per year (tpy). Phases I and II have a total capacity of 167,500 tpy. CR&R expects to begin construction on the third phase next year. This project turns organic waste into fuel that is used by the company’s waste collection vehicles or into biomethane that is injected into the natural gas pipeline. In addition, CR&R has completed construction of an on-site organic waste MRF that is now fully operational. Public Works assisted CR&R in obtaining funding and provided technical assistance to the developers.

2018 Annual Report County of Los Angeles Countywide Integrated Waste Management Plan
9
The Sanitation Districts continue to use a DODA bio-separator food waste pre-processing technology at the Puente Hills MRF to remove contaminants from source-separated food waste. The capacity of the DODA is 165 tpd of food waste and it currently processes an average of 30 tpd of food waste. The food waste is processed into a slurry at the Puente Hills MRF and then transported to the Districts’ Joint Water Pollution Control Plant (JWPCP) in Carson, CA for co-digestion.
The Sanitation Districts continue to expand their food waste co-digestion project at JWPCP. The existing Liquid Waste Disposal Station (LWDS) at JWPCP has a capacity of 350 tpd of food waste and receives food waste through various contracts.
The digester gas, which consist mostly of methane, is currently used at the JWPCP Total Energy Facility to produce electricity. However, in the future, the Districts plan to begin converting digester gas into compressed natural gas (CNG) for vehicle fueling which will require the development of biogas conditioning infrastructure and the expansion of existing vehicle fueling stations. With this project, the Districts expects to be able to produce about 2,300 to 3,500 gasoline gallon equivalents of CNG per day. The Districts are expecting to complete the biogas conditioning infrastructure in 2020 and will also expand the fueling station. The Sanitation Districts also
signed a contract to convert a portion of the biosolids from JWPCP to biofuel using pyrolysis and Fischer-Tropsch Technology at a facility in Rialto, California that is expected to begin operating in mid-2020.
Commercial Food Waste Collection Pilot Project. Since July 2016, the County in partnership with
the Puente Hills Material Recovery Facility (PHMRF) provides a rebate incentive to waste haulers that collect uncontaminated food waste diverted from commercial accounts and deliver the food waste to the PHMRF. Currently, one waste hauler is participating and providing food waste diversion services to four supermarkets in the
San Gabriel Valley area. As of June 2019, the project has successfully diverted over 1,500 tons of food waste.
The food waste is sent to the PHMRF for pre-processing and is eventually anaerobically digested at the Districts’ Joint Water Pollution Control Plant (JWPCP) in Carson. This pilot program has increased the amount of food waste being digested at the JWPCP and thus, increased the production of biogas.
The Los Angeles County Sherriff’s Department (LASD) requested assistance from Public Works in researching an in-vessel composting system to manage organic waste at Pitchess Detention Center (PDC), a jail facility in Castaic, California. Subsequently, LASD received a proposal from an organics
Figure 4: JWPCP using a slurry produced from food waste. Photo courtesy of Waste Management

2018 Annual Report County of Los Angeles Countywide Integrated Waste Management Plan
10
processor to further expand the scope to include a commercial-scale composting operation and an AD facility. The commercial-scale composting and AD project is currently on hold pending long-term, comprehensive project planning by LASD at PDC. In 2018, Public Works, along with its technical consultant, Alternative Resources, Inc., provided permitting guidance and is currently performing a cost analysis for a potential in-vessel composting or small-scale AD technology to process 1-2 tpd of food waste generated on-site at PDC, a cluster of jail facilities in Castaic. The technology may also be used to process green waste and wood waste generated on-site and from nearby County facilities such as the Department of Parks and Recreation Castaic Lake State Recreation Area.
A Comparative Greenhouse Gas (GHG) Emissions Analysis was commissioned by Public Works to compare the net GHG emissions of processing waste through a MRF against disposing residuals in a landfill. The comparative analysis shows the net environmental benefits of managing residual solid waste using AD and gasification at an integrated CT facility. It demonstrates that CT facilities are needed to improve air quality and combat climate change. Public Works continues to promote the Comparative Analysis at www.SoCalConversion.org and at various waste conferences, meetings with stakeholders, and other outreach activities.
City of Los Angeles’ Alternative Technology Efforts
In 2017, the City of Los Angeles entered into exclusive franchise agreements with waste haulers to provide solid waste, commingled recyclables, and organics collection, transfer, disposal, and processing services to commercial and
multifamily establishments in the City. The companies that were awarded the contract for each franchise secured a dedicated waste stream, increasing the financial viability to develop new organic waste processing and CT facilities near the City of Los Angeles. By establishing this position in the market, it can be financially advantageous for these facilities to process organic waste originating from other jurisdictions in addition to the City.
Conversion Technology Legislation
On September 28, 2014, Governor Brown signed into law Senate Bill 498 (SB 498, Lara), a biomass conversion technology bill. This is significant because AB 939 requires 50 percent diversion of solid waste, of which 10-percent can come from transformation or biomass conversion. State law formerly limited “biomass conversion” to only the controlled combustion of organic materials such as wood, lawn and garden clippings, agricultural waste, leaves, tree pruning, and non-recyclable paper. When separated from other solid waste these organic materials are used for producing electricity or heat. SB 498 expanded the definition of biomass conversion to include non-combustion thermal CTs. By doing so, SB 498 allows for the cleaner and more efficient non-combustion CTs to be used to convert biomass into fuels and products in addition to heat and/or electricity. Senate Bill 498 will help the State reach its 75-percent recycling goal as well as the organic waste disposal reduction goals established by Senate Bill 1383 (SB 1383, Lara). This bill will also assist in meeting the goals of the state’s Bioenergy Action Plan, which has identified municipal solid waste as a substantially

2018 Annual Report County of Los Angeles Countywide Integrated Waste Management Plan
11
underutilized resource for biomass feedstock. SB 498 will also create a pathway to use biomass waste as a low-carbon fuel. Moreover, the utilization of CTs will provide jurisdictions with increased flexibility to process biomass material to produce green energy. Without increased options, biomass waste may need to be transported to facilities hundreds of miles away, which is economically and environmentally costly. Public Works continues to actively pursue and support the passage of legislation that encourages the siting of CT facilities. Public Works will continue to take incremental steps progressing toward the conversion of non-recyclable residual solid waste.
AB 32, SB 32 and SB 1383 – Reducing Greenhouse Gas Emissions in California
Assembly Bill 32 In 2006 Governor Schwarzenegger signed the California Global Warming Solutions Act of 2006 (AB 32, Nunez) into law. AB 32 is considered the most sweeping law addressing climate change in the country and sets a target of reducing greenhouse gas (GHG) emissions statewide back to 1990 levels by 2020. To implement the provisions of the law, the California Air Resources Board (CARB) was directed to adopt a Climate Change Scoping Plan (Scoping Plan) by 2009, which developed the initial measures needed to meet the 2020 targets. The Scoping Plan includes recommendations for landfill methane emission reductions and reduction in waste generation, both of which were implemented in subsequent legislation. The first update to the Scoping Plan, which was released in 2014, includes a more comprehensive discussion of the waste management sector, including an expectation that it become “climate neutral” by 2020. The document states that CARB and CalRecycle will work to eliminate landfill disposal of organic materials, a major source of GHGs and methane, by utilizing their regulatory authority under AB 32 if legislation requiring businesses to recycle their organic waste was not enacted in 2014. The legislature did pass such a law in 2014 (Assembly Bill 1826, Chesbro) as well as a law that eliminates diversion credit for use of green waste as an alternative daily cover at landfills (Assembly Bill 1594, Williams).

2018 Annual Report County of Los Angeles Countywide Integrated Waste Management Plan
12
Senate Bill 32 On September 8, 2016, Governor Brown signed Senate Bill 32 (SB 32, Pavley), codifying into law Executive Order B-30-15. This established a mid-term GHG reduction target for California of 40-percent below 1990 levels by 2030. The executive order directed CARB to update the AB 32 Scoping Plan to reflect the 2030 target. The 2017 Climate Change Scoping Plan Update: The Strategy for Achieving California’s 2030 Greenhouse Gas Target was adopted by CARB in December 2017. The Plan is a package of economically viable and technically feasible actions to not only achieve the 2030 target but to stay on track to develop a low-to-zero-carbon economy. The Plan includes strategies for creating inclusive policies and broad support for clean technologies, continuing to lead on clean energy, and putting waste resources to beneficial use. Senate Bill 1383 – Short Lived Climate Pollutants In September 19, 2016, Governor Brown signed SB 1383, the Short-Lived Climate Pollutants (SLCP) Bill, into law. As required by SB 1383, CARB prepared the SLCP Reduction Strategy to achieve a reduction in methane by 40-percent, hydrofluorocarbon gases by 40-percent, and anthropogenic black carbon by 50-percent below 2013 levels by 2030. CARB approved the SLCP Strategy in March 2017. SB 1383 also introduces targets to achieve a 50 percent reduction in the level of the statewide disposal of organic waste from the 2014 level by 2020 and a 75-percent reduction in the level of the statewide disposal of organic waste from the 2014 level by 2025. The law
requires CalRecycle, in consultation with CARB, to adopt regulations that achieve these targets. CalRecycle expects to adopt the regulations in late 2019 or early 2020. The regulations are likely to require jurisdictions to provide and enforce mandatory organic waste collection for all generators, including residents, businesses, municipal facilities, and large venues. Jurisdictions, waste haulers, and organic waste generators are required to be in compliance with the regulations on January 1, 2022. SB 1383 would authorize local jurisdictions to charge and collect fees to recover local jurisdictions’ costs incurred in complying with the regulations. It requires CalRecycle, in consultation with CARB, to analyze the progress that the waste sector, state government, and local governments have made in achieving the specified targets for reducing organic waste in landfills no later than July 1, 2020. SB 1383 authorizes CalRecycle, depending on the outcome of that analysis, to amend the regulations to include incentives or additional requirements, as specified.

2018 Annual Report County of Los Angeles Countywide Integrated Waste Management Plan
13
Assembly Bills 1594, 1826 and 876 – Organic State Laws In September 2014, Governor Brown signed two bills into law, that were intended to substantially reduce the amount of organic waste that is disposed of in California landfills. Assembly Bill 1594 (AB 1594) and Assembly Bill 1826 (AB 1826) presented a range of challenges for jurisdictions and collectively signaled a new era of solid waste management for the State. Additionally, on October 8, 2015, Governor Brown signed Assembly Bill 876 (AB 876) into law which would require counties and regional agencies to report to CalRecycle, the amount of organic waste generated within their counties or regional areas for a period of 15 years.
Assembly Bill 1594 Since 1993, State law has considered green material used for ADC at landfills an act of “recycling” as opposed to “disposal”. In addition to helping jurisdictions with their efforts to comply with the 50-percent solid waste diversion mandate established pursuant to AB 939, this law greatly promoted the development of infrastructure that allowed for separate collection of green materials. AB 1594 states that for the purposes of complying with the waste diversion mandates of AB 939, beginning January 1, 2020, the use of green waste as ADC will be considered an act of “disposal” as opposed to “recycling”. Also, due to the foregoing change in State law, commencing August 1, 2018, a jurisdiction must include information in it’s electronic annual report to CalRecycle on how it intends to address compliance with the waste diversion mandates of AB 939 as a result of the new law. Jurisdictions that are not able to comply with AB 939 will be required to identify and address barriers to recycling green material, if sufficient capacity at organics waste recycling facilities is not available before the jurisdiction’s next compliance review by CalRecycle. There are several cities within the County that could fall out of compliance with AB 939’s 50-percent diversion mandate if they continue to use green waste at landfills as ADC after January 1, 2020 and fail to implement new diversion programs to account for the ADC’s diversion credit loss. This could potentially expose them to fines of up to $10,000 per day for non-compliance.

2018 Annual Report County of Los Angeles Countywide Integrated Waste Management Plan
14
Governor Brown included a signing statement with AB 1594 which encourages legislators to address a provision in the law that will exempt green waste sent to landfills from the State’s disposal fee. Legislation that would remove this provision is expected to face opposition, as this provision was included to garner the support needed to pass AB 1594. Assembly Bill 1826 While AB 1594 only affects jurisdictions that use green material as ADC, AB 1826 affects most jurisdictions throughout the State. AB 1826 requires jurisdictions to implement an organic waste recycling program for businesses that would include outreach, education, and monitoring of affected businesses by January 1, 2016. Additionally, each jurisdiction is to identify a multitude of information, including barriers to siting organic waste recycling facilities and closed or abandoned sites that might be available for new organic waste recycling facilities. AB 1826 defines “organic waste” as food waste, green waste, landscape and pruning waste, non-hazardous wood waste, and food-soiled paper waste that is mixed in with food waste. It defines a “business” as a commercial or public entity, including, but not limited to, a firm, partnership, proprietorship, joint stock company, corporation, or association that is organized as a for-
profit or nonprofit entity, or a multifamily residential dwelling consisting of five or more units.
Assembly Bill 876
AB 876 requires a county or regional agency, commencing August 1, 2017, to include the following in its annual report to CalRecycle: (1) an estimate of the amount of organic waste in cubic yards that will be generated in the county or region over a 15-year period; (2) an estimate of the additional organic waste
recycling facility capacity in cubic yards that will be needed to process the amount of waste previously mentioned; and (3) areas identified by the county or regional agency as locations for new or expanded organic waste recycling facilities capable of safely meeting that additional need. In April 2018, the County published its Countywide Organic Waste Management Plan (Organics Plan). The
Organics Plan is intended to identify and determine whether there is adequate
compostable organic waste processing facility infrastructure and processing capacity to meet the demand for organic waste that is projected to be diverted due to the newly enacted legislation. The Organics Plan provides an estimate of the total organic waste processing capacity currently available within the County and the neighboring counties within the Southern California region. An analysis of the additional

2018 Annual Report County of Los Angeles Countywide Integrated Waste Management Plan
15
processing capacity needed to handle organic waste recycling is also included in the Organics Plan. Currently, the County is working on the first Annual Update to the Organics Plan.
Assembly Bill 901 – Solid Waste Reporting Requirements Enforcement
Assembly Bill 901 (AB 901, Chapter 746, Statutes of 2015) was signed into law by Governor Brown on October 10, 2015. This bill requires operators of disposal, recycling, and composting facilities as well as solid waste haulers to report information and data directly to CalRecycle. Prior to the passing of this bill, these facilities reported this information to counties who in turn submitted the data to CalRecycle. Additionally, those who transport, sell, and export recyclables and compost material will be required to periodically submit data to CalRecycle on the types, quantities, and destinations of those materials. Beginning 4th quarter 2019, disposal, recycling, and composting facilities as well as solid waste haulers are required to report their solid waste data to CalRecycle’s new Recycling and Disposal Reporting System (RDRS).
Assembly Bill 845 – Prohibition on Local Disposal Limits
Assembly Bill 845, which was signed by Governor Brown on September 25, 2012, prohibits an ordinance enacted by a city or county from otherwise restricting or limiting the importation of solid waste into a privately-owned solid waste facility in that city or county based on place of origin.
CalRecycle’s “State of Disposal in California” and “State of Recycling in California” Reports In August 2017, CalRecycle published a staff report titled “State of Disposal and Recycling in California 2017 Update”. This report, which builds on previous State of Disposal in California and State of Recycling in California reports, provides an update on disposal and recycling trends using the most up-to-date data available. According to the reports, California’s average disposal rate must be less than 2.7 pounds per person per day (PPD) to achieve the 75-percent statewide recycling goal of

2018 Annual Report County of Los Angeles Countywide Integrated Waste Management Plan
16
Assembly Bill 3411. However, CalRecycle states that without a more precise picture of the state’s recycling infrastructure, it is impossible to determine whether this disposal rate will be an accurate reflection of 75-percent recycling in 2020. The updated report states that in 2016, California’s overall disposal increased for a fourth consecutive year to 35.2 million tons of landfilled material and 0.8 million tons of incinerated waste at the three transformation facilities in California. The state had a 6.0 PPD disposal rate in 2016, which is below the 6.3 PPD disposal target (established under AB 939).
Markets for Recovered Materials
The County strongly recommends that CalRecycle continue its efforts to address the need to develop sufficient statewide infrastructure and take a leadership role in the expansion of markets for recycled products. These efforts are in line with the statewide goal of 75-percent recycling. State recycling mandates have long created an extensive supply of diverted materials but have not fully addressed the demand side of the “recycling equation.” The result has been a significant dependence on foreign markets for our recyclable materials, in which inadequate environmental controls exist for processing these materials.
1 Assembly Bill 341 (AB 341, Chesbro) was signed into law by Governor Brown on October 6, 2011, establishing a statewide goal that no less than 75 percent of solid waste generated in the State be source reduced, recycled, or composted by 2020, and
This dependence on foreign markets first became evident in February 2013, when Chinese customs officials began vigorously enforcing the environmental regulations for container loads of scrap material through a policy, known as “Operation Green Fence.” As a result, recycling facilities increased their quality control measures to produce higher quality loads of scrap material. In 2017, China notified the World Trade Organization of its intent to restrict 24 types of waste materials from entering China. This new policy became known as “China’s National Sword.” The policy, which went into effect in January 2018,
required local jurisdictions to implement commercial recycling programs by July 1, 2012.

2018 Annual Report County of Los Angeles Countywide Integrated Waste Management Plan
17
limits imported scrap materials, increases inspections, and restricts contamination to no more than 0.5-percent. Per CalRecycle, in 2017, 55-percent of California’s recyclable exports were sent to China. Material recovery facilities (MRFs) in California increased their efforts to produce bales of recyclable materials meeting the contamination limit. Several countries in Southeast Asia as well as other countries such as India, Canada, and Mexico, have started to accept recyclable materials no longer being accepted by China. However, an oversupply and a demand for higher quality product have resulted in lower commodity prices. China’s “Operation Green Fence” and “National Sword” policies show us that while collection of recyclable materials is an important element of our integrated solid waste management system and is imperative in reducing our dependence on landfills, true success through recycling efforts can only be achieved with a strong market demand for recovered materials. Developing recyclables markets will become even more critical in the coming years because China announced that it would prohibit imports of post-industrial scrap plastic by the end of 2018. Additionally, in July 2018, China released a new proposal to ban every form of solid waste from import by 2020.
One way that California can build its recycling infrastructure is through the Recycling Market Development Zone program (RMDZ). The RMDZ is a state program administered by CalRecycle in cooperation with Public Works, which provides financial, technical, and marketing assistance to eligible applicants that manufacture products from reused or recycled
materials which can significantly reduce the emissions of greenhouse gases The program’s goal is to grow California’s markets for recycled materials, keep usable materials out of landfills, and create green jobs. In October 2018, rPlanet Earth, a polyethylene terephthalate (PET) plastics recycler and recipient of a RMDZ loan, held a grand opening celebration to inaugurate its new
302,000 square-foot plastic recovery and production facility in Vernon, CA.
CalRecycle and Public Works staff attended the event and presented rPlanet Earth with a check for $2 million. Public Works plans to launch a direct-mail campaign targeting manufacturing businesses in Los Angeles County with the next round of ZIF funds, which will be fully available in 2020. Public Works is also in the process of removing the annual membership fee charged to its member cities as an incentive for other cities to join the program.

2018 Annual Report County of Los Angeles Countywide Integrated Waste Management Plan
18
Extended Producer Responsibility
To facilitate a comprehensive solid waste management strategy, the County strongly supports statewide legislation, regulations, and policies that establish product stewardship, also known as Extended Producer Responsibility (EPR). EPR is an adopted strategic policy that shifts the responsibility from local governments to producers and manufacturers to reduce the environmental impact of their products and packaging waste. EPR encourages producers to adopt product designs that promote environmental sustainability, minimize the negative impact on human health, reduce the toxicity resulting in environmental risks , and considers the cost of treatment and disposal in the total cost of the product. In 2012, Assembly Bill 1343 (AB 1343, Huffman) was considered the first EPR bill in California, requiring paint manufacturers to establish a stewardship organization (PaintCare) and take responsibility for the end-of-life management of postconsumer paints sold in California. The County Household Hazardous Waste (HHW) Program has partnered with PaintCare to assist in the collection of millions of pounds of unused paint over the years which has significantly reduced the cost to the County for proper disposal and recycling of collected paint.
Since then, additional EPR efforts have been focused on certain hard-to-handle materials such as mattresses, carpet, pharmaceuticals, and sharps/needles. Public Works has been advocating for improvements to the State’s Carpet Stewardship Program established per AB 2398 (Perez, 2010). In 2017, AB
1158 (Chu) was signed into law to enhance the Carpet Stewardship program structure and goals.
In 2013, California enacted the Used Mattress Recovery and Recycling Act, which requires mattress producers to create a statewide recycling program to collect and recycle mattresses. The Mattress Recycling Council (MRC) is the stewardship organization created by the mattress industry to operate recycling programs in states such as California that have enacted mattress recycling laws. Los Angeles County hosts mattress collection events funded through the MRC where collected mattresses are taken to a facility for recycling. Mattresses collected by the County Road Department are eligible for reimbursement through the MRC. On September 30, 2018, after many years of work, Senate Bill 212 (SB 212, Jackson) was signed into law. SB 212 deals with the management of pharmaceuticals and sharps. SB 212 is landmark legislation that requires the establishment of a stewardship program for manufacturers and distributors of pharmaceuticals and sharps waste to create, finance, and manage the safe and proper collection and disposal of unused pharmaceuticals and sharps. Specific minimum requirements for the stewardship

2018 Annual Report County of Los Angeles Countywide Integrated Waste Management Plan
19
Waste-by-Rail System The Waste-by-Rail (WBR) system is comprised of a remote intermodal yard and disposal facility, local materials recovery facilities/transfer stations, a local intermodal rail yard, and rail transportation. The starting point of the waste-by-rail system is the Puente Hills Intermodal Facility (PHIMF), located near the Puente Hills Materials Recovery Facility. Residual waste from materials recovery facilities and transfer stations located throughout the County will be loaded onto rail carts at the PHIMF, and then transported via rail to the Mesquite Regional Landfill (MRL) for disposal. The Sanitation Districts have completed planning and development of all the WBR system components except for the local intermodal facility which is currently under construction. Upon completion, the PHIMF will facilitate intermodal transfer of containers of up to two trains per day, or approximately 8,000 tpd of municipal solid waste.
The operation of the MRL and WBR is entirely dependent on the availability of in-county and near-county disposal capacity, diversion from landfills, and the cost of disposal. When the MRL/WBR disposal capacity is needed and when the tipping fees make MRL/WBR economically viable, then the system may begin operation. However, for the purpose of the disposal analysis, the WBR system is assumed to begin its operation in 2021. The WBR system will help ensure that solid waste disposal services continue to be provided to jurisdictions in Los Angeles County without interruption throughout the 15-year planning period, as well as into the future.

2018 Annual Report County of Los Angeles Countywide Integrated Waste Management Plan
20
SITING ELEMENT REVISION
AB 939 requires each county to prepare a countywide siting element that describes how the county and the cities within the county, plan to manage the disposal of their solid waste for a 15-year planning period. The existing CSE, dated June 1997, was approved by the County’s cities containing a majority of the County’s population. It was subsequently approved by the Board of Supervisors in January 1998, and by CalRecycle on June 24, 1998. The current CSE revision, which covers the 15-year planning period, reflects the following significant changes compared to the previous version:
❖ Removes two potential landfill sites, Elsmere and Blind Canyon Landfills, in accordance with a motion passed by the Board of Supervisors on September 30, 2003;
❖ Includes the expansion of existing in-County Class III landfills to increase landfill capacities within the County;
❖ Updates the goals and policies to be more aligned with the
new solid waste management paradigm (Figure 4), to enhance the comprehensiveness of Los Angeles County’s solid waste management system and to incorporate current and upcoming solid waste management processes and technologies;
❖ Promotes the development of alternatives to landfilling, such as CTs, on a Countywide basis; and
❖ Promotes the development and use of infrastructure to transport solid waste to out-of-County landfills, such as Mesquite Regional Landfill, to complement the County’s waste management system.

2018 Annual Report County of Los Angeles Countywide Integrated Waste Management Plan
21
The draft revised CSE and its environmental document will undergo a review and approval process in compliance with statutory and regulatory requirements. This includes review by the Task Force, and review and approval by jurisdictions in Los Angeles County, the County Board of Supervisors, and CalRecycle.
Figure 5: Solid Waste Management Hierarchy

2018 Annual Report County of Los Angeles Countywide Integrated Waste Management Plan
22
GOALS AND POLICIES OF THE SITING ELEMENT
The CSE establishes goals and policies for the County to maintain adequate permitted disposal capacity for a 15-year planning period. To provide adequate disposal capacity, the CSE offers strategies and establishes siting criteria for potential sites. Existing landfills (including those located out-of-County) are identified and analyzed regarding their permitted disposal capacity and estimated closure date. Additionally, the CSE includes goals and policies to facilitate the use of out-of-County/remote landfills and to foster the development of alternatives to landfill disposal, such as CTs on a countywide basis. The goals and policies2 are either being or may have to be implemented by the County and cities in the County to meet the mandates of the AB 939. These goals are consistent with those listed in the Los Angeles County Solid Waste Management Action Plan (Action Plan)3 and County Solid Waste Management Plan (CoSWMP)4. The goals are as follows: 1. To protect the health, welfare, and safety of all citizens by
addressing the disposal need of the 88 cities in Los Angeles County and the County unincorporated communities during the 15-year planning period through the development of
2The corresponding policies associated with each Goal can be found in the 1997 Los Angeles County Countywide Siting Element approved by CalRecycle on June 24, 1998. 3The Action Plan was adopted by the County Board of Supervisors in April 1988 and was
subsequently superseded by the County Integrated Waste Management Plan, which was
environmentally safe and technically feasible disposal facilities for solid waste that cannot be reduced, reused, recycled, or composted.
This goal incorporates policies to:
• Enhance in-County landfill disposal capacity, and
• Facilitate utilization of out-of-County/remote disposal facilities.
2. To foster the development of transformation and other
innovative solid waste disposal technologies as alternatives to landfill disposal.
3. To protect the economic well-being of Los Angeles County by ensuring that the cities and the County unincorporated communities are served by an efficient and economical public/private solid waste disposal system.
4. To protect the economic well-being of Los Angeles County by ensuring that the cities and the County unincorporated communities are served by an efficient and economical public/private solid waste disposal system.
approved by the former California Integrated Waste Management Board (CIWMB) (now California Department of Resources Recycling and Recovery (CalRecycle)) in June 1999.
4 The CoSWMP was approved by the County’s cities containing a majority of the County’s population, the County Board of Supervisors, and the former CIWMB (now CalRecycle).

2018 Annual Report County of Los Angeles Countywide Integrated Waste Management Plan
23
5. To provide siting criteria that considers and provides for the environmentally safe and technically feasible development of solid waste disposal facilities.
6. To reduce the volume (tonnage) of solid waste requiring disposal/transformation by continuing to implement and expand source reduction, recycling, composting, and public education programs.
7. To conserve Class III landfill capacity through diversion of inert waste, disposal of inert waste at unclassified landfills, increased waste disposal compaction rates, and use of green waste and other appropriate materials for landfill daily cover.
8. To promote, encourage, and expand waste diversion activities at disposal facilities.
9. To promote adequate markets for recycled materials and compost products.

2018 Annual Report County of Los Angeles Countywide Integrated Waste Management Plan
24
SOLID WASTE DISPOSAL FACILITIES
Permit Changes
As of 2018, there are no permit changes to existing solid waste disposal facilities.
Proposed Facility Expansions
Scholl Canyon Landfill Expansion
Scholl Canyon Landfill (SCL) is located north of the Ventura Freeway, in the City of Glendale. The Landfill has been operated by the Sanitation Districts pursuant to a Joint Powers Agreement between the Sanitation Districts, the City of Glendale, and the County of Los Angeles since October 7, 1997. The City of Glendale initially considered to expand this landfill and circulated a CEQA document in April 2014. However, on May 9, 2018, the City notified the County of Los Angeles that it has withdrawn the proposed Scholl Canyon Landfill Expansion Project. For more information on this facility, refer to Appendix E-1.
Others
Mesquite Regional Landfill
The Sanitation Districts owns and operates the Mesquite Regional Landfill, located in Imperial County, and anticipates receiving a portion of the County’s waste by truck or rail if found to be technically and economically feasible. For more information on this facility, refer to Out-of-County Disposal Facilities (Page 47) and Appendix E-1.

2018 Annual Report County of Los Angeles Countywide Integrated Waste Management Plan
25
DISPOSAL ANALYSIS FOR 2018
The 2018 disposal analysis consists of an analysis of solid waste generated within the County, solid waste disposed within the County, and solid waste exported to out-of-County landfills. To determine the amount of waste generated by Los Angeles County residents, a calculation was performed using the countywide solid waste disposal and diversion rate.
Solid Waste Disposal
In 2018, the total amount of solid waste (including an import amount of 166,711 tons) disposed of at in-county Class III landfills, transformation facilities, and out-of-County landfills was approximately 10.7 million tons. In addition, the amount of inert waste disposed at the permitted inert waste landfill totaled 358,254 tons.
Table 1: 2018 Disposal Tonnage Breakdown
The following is a breakdown of the disposal quantities at each type of disposal facility. Figure 6 below shows the top ten jurisdictions that disposed solid waste, including inert waste disposed at the permitted inert waste landfill, in and outside of the County in 2018. Figure 6: Top 10 Jurisdiction Disposal Quantities in 2018
4,151,768935,037
514,656
327,793
231,683
231,562
206,965
194,672
160,444
141,443
0.0
50
0,0
00.
0
1,0
00
,00
0.0
1,5
00
,00
0.0
2,0
00
,00
0.0
2,5
00
,00
0.0
3,0
00
,00
0.0
3,5
00
,00
0.0
4,0
00
,00
0.0
4,5
00
,00
0.0
LOS ANGELES
LOS ANGELES COUNTY UNINC.
LONG BEACH
SANTA CLARITA
PASADENA
GLENDALE
CARSON
VERNON
TORRANCE
SOUTH GATE
TONS
Annual Disposal
Tonnage Daily Disposal
Rate*
In-County Class III Landfills: 5,121,209 16,414
Transformation Facilities: 416,464 1,335
Exports to Out-of-County Landfills: 5,120,871 16,413
Subtotal Solid Waste Disposed: 10,658,546 34,162
Permitted Inert Waste Landfill: 358,254 1,148
Grand Total Solid Waste Disposed: 11,016,800 tons 35,310 tpd
*(Based on Six Operating Days/Week)

2018 Annual Report County of Los Angeles Countywide Integrated Waste Management Plan
26
Waste Generation
For the purpose of long-term disposal capacity planning, a countywide diversion rate of 65-percent was assumed for 2018. Based on a total disposal of 10.5 million tons (excluding inert waste and imports) and the 65-percent diversion rate, the County generated approximately 29.95 million tons or an average of 96,000 tpd (Table 2).
Senate Bill 1016
With the implementation of Senate Bill 1016 (SB 1016), CalRecycle no longer calculates diversion rates for individual jurisdictions and as a result, countywide diversion rates are no longer provided by CalRecycle. The last diversion rates provided by CalRecycle were for 2006, which resulted in a countywide diversion rate of 58-percent. Under SB 1016, a target per capita disposal rate, using a 50-percent diversion rate, is calculated using an approved jurisdiction-specific average of per capita generation rates between 2003 and 2006. To establish compliance with AB 939, each jurisdiction’s per capita disposal rate is calculated for each reporting year and compared to their individual target rates.
Table 2: 2018 Waste Generation and Disposal Quantities for Municipal Solid Waste
A B C D E F
In-County Disposal Exports to Out-of County Class III Landfills
Total
Disposal*
Estimated Countywide
Diversion Rate
Calculated 2018
Solid Waste Generation*
Class III Landfills
Transformation Facilities
TONS TONS TONS TONS percent TONS
4,995,296
366,642 5,120,871 10,482,809 65 29,950,883
* Data from permitted inert waste landfill and imports is excluded from these calculations.
Column A: Total disposal at Class III landfills in Los Angeles County. Does not include waste imported from jurisdictions outside the County.
Column B: Total disposal at transformation facilities in Los Angeles County. Does not include waste imported from jurisdictions outside the County.
Column C: Waste exported by jurisdictions in Los Angeles County to disposal facilities located outside the County.
Column D: Columns A + B + C. Column E: A Countywide Diversion Rate of 65-percent is assumed.
Column F: Column D ÷ 35-percent (disposal percentage). This estimate is used to project the County's Class III landfill and transformation disposal needs through the year 2032.

2018 Annual Report County of Los Angeles Countywide Integrated Waste Management Plan
27
Waste Disposal at In-County Facilities
In addition to waste generated within the County, Class III landfills and transformation facilities in the County also received 175,737 tons, or 563 tpd, of waste from jurisdictions outside the
County in 2018. Figure 7 shows the total amount of solid waste disposed at each Class III landfill and transformation facility, including imports from outside the County. For more detailed information, refer to Appendix E-2, Table 4.
516,697
31,804
318,405
1,530,160
115,524 3,682 355
403,176
2,110,816
90,591 44,616
371,849
0
500,000
1,000,000
1,500,000
2,000,000
2,500,000
Ton
s o
f So
lid W
aste
Dis
po
sed
Facility
Figure 7: Disposal Quantities by Facility in 2018

2018 Annual Report County of Los Angeles Countywide Integrated Waste Management Plan
28
When waste is received at Class III landfills and transformation facilities, some of it is recycled for on-site use, such as ADC, and some is sent off-site for recycling or processing. The remaining waste is landfilled or transformed into energy. If transformed, the residual ash is turned into ashcrete and used as road base for winter deck operating areas and other beneficial uses. Figure 8 quantifies each of these activities. The various types of materials recycled or beneficially used on-site at Class III landfills are further broken down in Figure 9. Figure 8: Various Types of Materials Recycled or Beneficially Used* On-site at In-county Disposal Facilities (Tons)
*Excluding ash as beneficial use since ash is a product of transformed materials.
5 Wasteshed Restrictions refers to a geographical area from which waste can logically
be delivered to a given disposal facility. This term is synonymous with waste service area.
Figure 9: On-site Beneficial Use (Tons)
Figures 10 through 21 show the annual disposal at each in-County facility (excluding imports from outside the County) in 2018, broken down by jurisdiction. The facilities with an “(R)” next to their names represent landfills with wasteshed restrictions5. For a map that shows the location of each facility, refer to Appendix E-6.
On-site Use1,296,350
18%
Transformed416,465
6%
Landfilled5,479,464
76%
Green Waste161,540
12%
Auto Shred-
0%
C&D337,318
26%
Contaminated Sediment
383,146 30%
Other414,346
32%

2018 Annual Report County of Los Angeles Countywide Integrated Waste Management Plan
29
Figure 10: Antelope Valley Landfill 510,431 tons (1,636 tpd)
Figure 11: Burbank Landfill 31,804 tons (102 tpd)
Figure 12: Calabasas Landfill 307,448 tons (985 tpd)
Figure 13: Chiquita Canyon Landfill 142,2610 tons (4,560 tpd)
CITY OF LOS ANGELES
53%
PALMDALE21%
LOS ANGELES COUNTY UNINC.
13%
LANCASTER7%
OTHERS6%
BURBANK100%
LOS ANGELES51%
CALABASAS21%
LOS ANGELES COUNTY UNINC.
17%
MALIBU6%
OTHERS5%
LOS ANGELES57%
SANTA CLARITA
12%
LOS ANGELES COUNTY UNINC.
6%
GARDENA4%
OTHERS21%

2018 Annual Report County of Los Angeles Countywide Integrated Waste Management Plan
30
Figure 14: Commerce Refuse-to-Energy Facility
38,840 tons (124 tpd)
Figure 15: Lancaster Landfill 114,382 tons (367 tpd)
Figure 16: Pebbly Beach Landfill
3,682 tons (12 tpd)
Figure 17: San Clemente Landfill (R) 355 tons (1 tpd)
LOS ANGELES20%
COMMERCE17%
SOUTH GATE10%
HUNTINGTON PARK7%
OTHERS46%
LANCASTER71%
LOS ANGELES15%
LOS ANGELES COUNTY UNINC.
9%
PALMDALE3%
OTHERS2%
AVALON100%
LOS ANGELES COUNTY UNINC.100%

2018 Annual Report County of Los Angeles Countywide Integrated Waste Management Plan
31
WHITTIER51%
LOS ANGELES COUNTY UNINC.
12%
SANTA FE SPRINGS
11%
ROSEMEAD10%
OTHERS16%
GLENDALE49%
PASADENA40%
LOS ANGELES COUNTY UNINC.
8%
SOUTH PASADENA1%
OTHERS2%
Figure 18: Savage Canyon Landfill (R) 90,591 tons (290 tpd)
Figure 19: Scholl Canyon Landfill (R) 403,176 tons (1,292 tpd)
Figure 20: Southeast Resource Recovery Facility 327,802 tons (1,051 tpd)
Figure 21: Sunshine Canyon Landfill 2,110,816 tons (6,765 tpd)
LONG BEACH54%
TORRANCE5%
LAKEWOOD5%
REDONDO BEACH5%
OTHERS31%
LOS ANGELES56%
LOS ANGELES COUNTY UNINC.
10%COMPTON
4%
VERNON4%
OTHERS26%

2018 Annual Report County of Los Angeles Countywide Integrated Waste Management Plan
32
Remaining Disposal Capacity at End of 2018
Transformation Facilities
In 2018 two transformation facilities operate in the County (Commerce Refuse-to-Energy Facility (CREF) and Southeast Resource Recovery Facility (SERRF)) with a combined average daily solid waste intake of 1,335 tpd, which is equivalent to 416,465 tpy.
CREF is closed permanently as of June 26, 2018. SERRF will continue to operate until June 2024 at its current average daily rate during the planning period. The city of Long Beach has announced an amended agreement to provide for the continued operation of SERRF and allow for opportunities to process higher-value waste. The owner and operator of SERRF has indicated that there are no plans to increase the permitted daily capacity.
Class III Landfills
Public Works conducted a survey requesting landfill operators in the County to provide updates of their estimated remaining disposal capacities. Based on the results of the survey and considering permit restrictions, the total remaining permitted Class III landfill capacity in the County is estimated at 163.39 million tons. Figure 22 shows a breakdown of each landfill’s remaining disposal capacity, in million tons. For more detailed information, refer to Appendix E-2, Table 4.
Figure 22: Class III Landfill Estimated Remaining Disposal Capacity
The remaining life of each landfill is determined by dividing the landfill’s remaining capacity by its average daily disposal, maximum permitted capacity, or permit restrictions (if specified). Generally, the variable with the smallest value is chosen. The lifespan of each landfill is shown in Figure 23.
59,752,250
12,001,395
10,231,322
4,908,186
4,580,480
4,294,664
2,264,431
46,314
35,650
0 20,000,000 40,000,000 60,000,000 80,000,000
Sunshine Canyon City/County
Chiquita Canyon
Antelope Valley
Lancaster
Calabasas
Savage Canyon
Scholl Canyon
Burbank
Pebbly Beach
Tons

2018 Annual Report County of Los Angeles Countywide Integrated Waste Management Plan
33
Figure 23: Class III Landfill Estimated Remaining Life
* Landfill remaining life based on 2018 average daily disposal ** Landfill remaining life based on maximum permitted capacity as of December 31, 2018. *** Landfill remaining life based on land use/solid waste facility permit restrictions as of
December 31, 2018.
Permitted Inert Waste Landfill
As of 2018, Azusa Land Reclamation is the only permitted Inert Waste Landfill in the County that has a full solid waste facility permit. The remaining capacity of this landfill is estimated at 57.72 million tons, or 46.17 million cubic yards. Refer to Appendix E-2, Table 4 for detailed data. Given the remaining permitted capacity and the average disposal rate of 1,148 tpd in 2018, this landfill’s capacity will be exhausted in 28 years.
Inert Debris Facilities
Inert debris facilities include Inert Debris Engineered Fill Operations (IDEFO) and other facilities that process inert waste and other construction and demolition waste. In 2018, inert debris facilities (excluding Azusa Land Reclamation Co. Landfill) collectively handled nearly 2.60 million tons, or approximately 2.09 million cubic yards, of material in the County. For more detailed information, refer to Appendix E-2, Table 5 and Appendix E-7.
Transfer and Processing Capacity
There are 42 permitted Large Volume Transfer/Processing and Direct Transfer Facilities, which can receive 100 tons of waste or more per operating day, and numerous facilities of smaller volume operating within the County. A transfer station/processing facility refers to a facility which receives, handles, separates, converts, or otherwise processes solid waste. There are three types of facilities that are recognized as transfer/processing facilities in this report: transfer stations, material recovery facilities, and construction, demolition and inert debris processing facilities. Transfer stations typically transfer solid waste directly from one container to another or from one vehicle to another for transport, or temporarily store solid waste prior to final disposal at CalRecycle-permitted landfills or transformation facilities. Material recovery facilities (MRFs) refer to intermediate processing facilities designed to remove recyclables and other valuable materials from the waste stream. A construction, demolition, and inert (CDI) debris processing facility refers to a site that receives any combination
39
37
35
23
22
19
14
11
11
10
0 10 20 30 40
Chiquita Canyon*
Savage Canyon***
Burbank***
Lancaster***
Antelope Valley**
Sunshine Canyon***
San Clemente***
Calabasas***
Scholl Canyon*
Pebbly Beach***
Years

2018 Annual Report County of Los Angeles Countywide Integrated Waste Management Plan
34
of construction and demolition debris, and Type A6 inert debris per operating day for the purposes of storage, handling, transferring, or processing. In addition to the 42 facilities discussed above, there are 13 Large Volume Transfer/Processing Facilities that fall under the umbrella of Clean Material Recovery Facilities (MRF). A clean MRF refers to a facility that separates materials from commingled recyclables, typically collected from residential or commercial curbside programs. As local waste disposal capacity options diminish in the County, transfer and processing facility operators are expected to export waste to out-of-County landfills via truck or rail transport. For a list and map of Large
6 Type A inert debris includes, but is not limited to, concrete (including fiberglass or steel
reinforcing bar embedded in the concrete), fully cured asphalt, crushed glass, fiberglass, asphalt or
fiberglass roofing shingles, brick, slag, ceramics, plaster, and clay products.
Volume Transfer and Processing facilities located within the County, refer to Appendix E-4.
Composting/Chipping and Grinding and Anaerobic Digestion Facilities
The County has 22 operational Composting/Chipping and Grinding Facilities which are permitted to receive 6 tons of waste or more per operating day, and numerous composting/chipping and grinding facilities of smaller volume. A composting facility refers to a facility that processes organic materials such as green waste, manure, food waste, and other organics. The organics are transformed through controlled biological decomposition and sold as an end product, usually in the form of home or farm soil amendments. A chipping and grinding facility refers to a facility that separates, grades and resizes woody green waste or used lumber to be sent to a composting facility, used at a landfill for Alternative Daily Cover (ADC) or sent to miscellaneous end markets such as feedstock at biomass to energy plants.
Currently there are two anaerobic digestion facilities operating within the County. An anaerobic digestion facility refers to a facility that biologically decomposes organic matter with little or no oxygen in a fully enclosed structure (in-vessel digestion) to produce biogas, liquid fertilizer and compost. For a list and map of Composting/Chipping and Grinding and Anaerobic Digestion facilities located within the County, refer to Appendix E-5.

2018 Annual Report County of Los Angeles Countywide Integrated Waste Management Plan
35
On-going Efforts to Optimize Utilization of Existing Disposal Capacity
Over the last decade, the County has encouraged waste diversion and recycling activities at landfills located in the unincorporated County areas through the land use permit process. The permit process includes a Waste Plan Conformance Agreement, which requires a landfill operator to implement waste diversion and recycling programs as well as other activities, both on and off-site to assist individual jurisdictions within the County in achieving the diversion mandate of AB 939. In addition, the Agreement contains provisions to encourage and assist residents in properly disposing their waste. These programs or activities may include the following: Conservation of Capacity ❖ Maximize available fill capacity at Class III landfills by
improving compaction methods and diverting or reducing high-volume or low-density waste materials;
❖ Conduct waste characterization studies; On-Site Reuse ❖ Utilize waste materials received and processed at the
landfill, such as shredded green waste, as a supplement to daily, intermediate, and final cover;
❖ Use green waste for other beneficial uses, including composting;
❖ Salvage wood waste for landscaping and erosion, weed, and fire break control;
❖ Salvage construction and demolition waste for road construction, erosion control, and other uses;
Establishment of: ❖ Materials recovery operations or facilities; ❖ Used oil collection centers; ❖ Drop-off or buy-back recycling centers; Activities to Encourage Proper Disposal ❖ Free disposal days; ❖ Waste tire processing; ❖ Christmas tree recycling; ❖ Acceptance of bulky items from residents free of charge; ❖ As appropriate, providing reduced rates to customers for
source-separated materials which can be diverted or otherwise salvaged at the landfill;
❖ Public education activities; Provide Funding for: ❖ Household hazardous and electronic waste collection
events; and ❖ Research and development of alternative technologies.

2018 Annual Report County of Los Angeles Countywide Integrated Waste Management Plan
36
Active Class III landfills that have a Waste Plan Conformance Agreement with the County include Chiquita Canyon, Lancaster, and Sunshine Canyon City/County Landfills. Together, these landfills handle over 70-percent of in-County Class III waste. Due to the dynamic and varied nature of solid waste management in the County, the provisions of the Waste Plan Conformance Agreement for each landfill are tailored to meet the specific needs of the communities serviced by the landfill. As the economy continues to show signs of improvement, increasing the diversion rate and promoting advancements such as improving compaction methods, will prevent the remaining capacity of existing landfills from being depleted as quickly as previously projected and is expected to provide longer lifespans for in-County landfills.

2018 Annual Report County of Los Angeles Countywide Integrated Waste Management Plan
37
STRATEGY FOR MAINTAINING ADEQUATE DISPOSAL CAPACITY
This section discusses strategies on how the County plans to maintain adequate solid waste disposal capacity for the next 15 years, from 2018 to 2033. It includes an analysis which considers recently passed legislation, such as the mandatory commercial recycling and diversion of organic waste from landfills through organics recycling programs, as well as information contained in the State of Disposal and State of Recycling in California reports by CalRecycle. The discussion first evaluates whether the existing permitted disposal capacity in the County will be able to accommodate the solid waste generated that cannot be reduced, reused, or recycled. Additionally, an evaluation of the existing disposal infrastructure and the current diversion rate analyzes whether there will be daily disposal capacity shortfall or reserve. The discussion goes on to present several scenarios applying various options for managing the residual solid waste. Inert waste landfills are not included in this discussion since the County currently has adequate permitted inert waste landfill capacity, as discussed earlier in Permitted Inert Waste Landfill (Page 32).
Definitions
The following are a set of terms used throughout this section (all quantities are in tons per day (tpd)): Daily Disposal Demand – The amount of solid waste generated minus the amount diverted by means of reuse, recycling,
composting, or anaerobic digestion based on a 6-day-per-week operation at permitted solid waste disposal facilities. Daily Available Capacity – The amount of solid waste permitted to be received at solid waste disposal facilities based on a 6-day-per-week operation in accordance with the terms, conditions, and wasteshed restrictions of the facility’s SWFP, land use permit, waste discharge requirements, or any other permit regulating the operation - whichever is more restrictive. Disposal Capacity Reserve – The amount of solid waste by which the total Daily Available Capacity exceeds Daily Disposal Demand. Disposal Capacity Shortfall – The amount of solid waste by which Daily Disposal Demand exceeds the total Daily Available Capacity.
Evaluation of Existing Disposal Infrastructure
Waste Generation Projections
Projections of solid waste generation during the planning period were made using the “Adjustment Methodology” developed by CalRecycle. The Methodology requires knowledge of how the generated waste is distributed into the residential and non-residential sectors as well as future population, employment, and real taxable sales.

2018 Annual Report County of Los Angeles Countywide Integrated Waste Management Plan
38
Population, employment, and real taxable sales projections are available from the California Department of Transportation (Caltrans) and UCLA for each year of the planning period. The UCLA Long-Term Forecast, published in July 2018, was used since it focuses on the Los Angeles region, in contrast with the Caltrans’ forecast, which is statewide and yields more general projections. Additionally, the UCLA forecast data is updated more frequently. Figure 24 shows a graph of the parameters used in the analysis. The detailed data is provided in Appendix E-2, Table 7. Considering each jurisdiction’s Source Reduction and Recycling Element and last approved base generation year as of 2005, the average Countywide waste distribution by sector is as follows:
• Residential Sector Waste Generation = 30-percent of total waste generation
• Non-Residential Sector Waste Generation = 70-percent of total waste generation
Daily Disposal Demand Projections The quantity of Daily Disposal Demand depends on the amount of solid waste that may be diverted. As noted in Waste Generation (Page 26), a diversion rate of 65-percent was assumed for the analysis in this report. With this assumption, the amount of residual waste that requires disposal capacity is 35-percent of the projected waste generation.
Transformation Facility Capacity
For the purposes of the analysis, as explained earlier in Remaining Disposal Capacity at End of 2018 (Page 31), SERRF is assumed to provide up to 1,370 tpd of Daily Available Capacity throughout the planning period. Figure 24: Population, Employment, and Real Taxable Sales
2
4
6
8
10
12
14
20
18
20
19
20
20
20
21
20
22
20
23
20
24
20
25
20
26
20
27
20
28
20
29
20
30
20
31
20
32
20
33
40
80
120
160
200
240
280
Po
pu
lati
on
/Em
plo
ymen
t (m
illio
ns)
Rea
l Tax
able
Sal
es (
Bill
ion
s)
Countywide Real Taxable Sales (UCLA Data)
Countywide Population (UCLA Data)
Countywide Employment (UCLA Data)

2018 Annual Report County of Los Angeles Countywide Integrated Waste Management Plan
39
Class III Landfill Capacity Need
Assuming no other options are available, such as exporting to out-of-County facilities or the development of new alternative technologies, the County’s Class III landfill disposal needs are determined after considering the available transformation capacity. The result of the evaluation is plotted in Figure 25. The detailed data is provided in Appendix E-2, Table 8. Figure 25: Solid Waste Generation and Disposal Demand
In Figure 25, the area in blue illustrates the amount of disposal capacity needed from Class III landfills throughout the planning period. The analysis shows that the cumulative need for Class III landfill disposal capacity, approximately 176.1 million tons in 2033, will exceed the 2018 remaining permitted Class III landfill capacity of 163.4 million tons (Page 32). Refer to Appendix E-2, Table 9. Other constraints that may limit the accessibility of Class III landfill capacity include wasteshed boundaries, geographic barriers, weather, and natural disasters. Therefore, further detailed analysis that incorporates capacity options in addition to existing in-County infrastructure and permit constraints is necessary to provide a more thorough evaluation.
Scenario Analysis
The scenario analysis considers the various capacity options that are currently available or may become available in the future to assist the County in meeting the Daily Disposal Demand. The analysis looks at the following: Existing in-County Class III Landfills and Transformation Facilities – The analysis considers a facility’s permitted capacity, termination date, and wasteshed restriction, if any. Proposed Expansions of In-County Class III Landfills – The analysis assumes no proposed landfill expansions that will occur during the planning period.
0
5,000,000
10,000,000
15,000,000
20,000,000
25,000,000
30,000,000
35,000,000
40,000,000
20
18
20
19
20
20
20
21
20
22
20
23
20
24
20
25
20
26
20
27
20
28
20
29
20
30
20
31
20
32
20
33
Solid
Was
te (
ton
s)
Class III Landfill Disposal Demand Transformation Demand/Capacity
Generation Total Disposal Demand

2018 Annual Report County of Los Angeles Countywide Integrated Waste Management Plan
40
Imports and Exports – The analysis considers imported and exported waste to and from out-of-county jurisdictions. Existing facilities in Kern, Orange, Riverside, San Bernardino, and Ventura Counties are currently accepting waste from the County. Future use of the waste-by-rail system to Mesquite Regional Landfill in Imperial County is also considered. For more detail, refer to Out-of-County Disposal Facilities (Page 49). Diversion Rate – A 65 percent diversion rate is assumed in the majority of the scenarios. A potential increase in the diversion rate is assumed in some scenarios, considering that all jurisdictions in the County are required to comply with new state laws such as the mandatory commercial recycling and the diversion of organic waste from landfills through organics recycling programs. The potential development of composting and anaerobic digestion processing facilities, in response to these laws, is also assumed to contribute to the increase in diversion rate. Alternative Technologies – Potential engineered municipal solid waste (EMSW) conversion facilities or other alternative technologies may be developed during the planning period. As discussed above, the anaerobic digestion capacity is incorporated into the assumption of an increased diversion rate, and is therefore, not included in the projections for potential available alternative technology capacity.
Given all the various capacity options, the analysis evaluated seven potential scenarios during the 15-year planning period. Table 2 summarizes the differences between the scenarios. For all seven scenarios, the projected waste generation remains the same. The analysis closely examines how much Daily Available Capacity from existing Class III landfills is expected to be utilized during each year. The analysis ultimately evaluates whether we expect a reserve or shortfall in the Class III Landfill disposal capacity by assessing whether the Daily Disposal Demand can be met for each year during the 15-year planning
period. No new landfills are expected to be permitted in the County during the planning period. For more detail, refer to Appendix E-3 Disposal Capacity Analysis Scenarios

2018 Annual Report County of Los Angeles Countywide Integrated Waste Management Plan
41
Table 3: Scenario Comparison Table
Scenario Number
Existing Permitted In-County Disposal Capacity
Diversion Rate 7
Exports to Out-of-County
Landfills
Proposed Expansions of
in-County Class III Landfills
Utilization of Additional Alternative Technology
Capacity
Increase in Exports to
Out-of-County Landfills
I Utilization of Permitted In-County Disposal Capacity Only
II Status Quo Scenario
III Meeting CalRecycle’s Statewide Disposal Target of 2.7 PPD
IV Meeting Senate Bill 1383 Organic Waste Disposal
Reduction Targets
V Utilization of Additional Alternative Technology Capacity
VI Increase in Exports to Out-of-County Landfills
VII All Solid Waste Management Options Considered
Become Available
7 Scenario I, II, V, and VI assume a 65 percent diversion rate throughout the planning period. Scenario III assumes an increase in diversion rate (83-percent by 2020) to meet CalRecycle’s Statewide Disposal Target of 2.7 PPD. Scenario IV assumes an increase in diversion rate (74 percent by 2020) to meet Senate Bill 1383 organic waste disposal reduction targets. Scenario VII assumes an increase in diversion rate (75-percent by 2020) considering all jurisdictions in the County comply with new state laws.

2018 Annual Report County of Los Angeles Countywide Integrated Waste Management Plan
42
Scenario I – Utilization of Permitted In-County Disposal Capacity Only
Assumptions/Considerations:
• Use of Existing Permitted In-County Class III Landfills and
Transformation Facilities only
• No Exports to Out-of-County Landfills
Scenario I assumes that all solid waste disposed will be managed by existing permitted in-County disposal infrastructure only. The scenario assumes continued diversion efforts by individual jurisdictions, resulting in a countywide diversion rate to 65-percent throughout the planning period, and no expansions of existing landfills. The following assumptions are made with respect to imports and exports: Imports – The average waste import rate for 2018 was 563 tpd. However, for purposes of this analysis, the amount of waste imported to in-County landfills is projected to be at 600 tpd every year for the remainder of the planning period. Exports – The amount of waste exported to out-of-County landfills in 2018 was approximately 16,413 tpd. For the purposes of this scenario, it is assumed that the use of available out-of-County disposal capacity will continue at the current rate in 2019 and will not continue through the remainder of the planning period.
Based on these assumptions, a shortfall in disposal capacity is expected to occur in this scenario during the planning period. For more detailed data, refer to Appendix E-3. Figure 26: Utilization of Permitted In-County Disposal Capacity Only Scenario
0
20,000
40,000
60,000
80,000
100,000
120,000
20
18
20
19
20
20
20
21
20
22
20
23
20
24
20
25
20
26
20
27
20
28
20
29
20
30
20
31
20
32
20
33
(tp
d-6
)
Year
Scenario I
Export to Out-of-County Landfills
Transformation Capacity
Disposal Demand at 65% Diversion Rate
In-County Class III Landfill Capacity
Diversion

2018 Annual Report County of Los Angeles Countywide Integrated Waste Management Plan
43
Scenario II - Status Quo
Assumptions/Considerations:
• Use of Existing Permitted In-County Class III Landfills and
Transformation Facilities
• Use of Exports to Out-of-County Landfills
Scenario II assumes that all solid waste disposed will be managed by existing permitted in-County disposal infrastructure and available out-of-County landfill capacity. The scenario assumes continued diversion efforts by individual jurisdictions, resulting in a countywide diversion rate to 65-percent throughout the planning period, and no expansions of existing landfills. The following assumptions are made with respect to imports and exports: Imports – The average waste import rate for 2018 was 563 tpd. However, for purposes of this analysis, the amount of waste imported to in-County landfills is projected to be at 600 tpd every year for the remainder of the planning period. Exports – The amount of waste exported to out-of-County landfills in 2018 was approximately 16,413 tpd and it is assumed that export to out-of-County landfills will continue at the current rate through the remainder of the planning period. Based on these assumptions, a shortfall in disposal capacity is not expected to occur in this scenario during the planning period. For more detailed data, refer to Appendix E-3.
Figure 27: Status Quo Scenario
0
20,000
40,000
60,000
80,000
100,000
120,000
20
18
20
19
20
20
20
21
20
22
20
23
20
24
20
25
20
26
20
27
20
28
20
29
20
30
20
31
20
32
20
33
(tp
d-6
)
Year
Scenario II
In-County Class III Landfill Capacity
Export to Out-of-County Landfills
Transformation Capacity
Disposal Demand at 65% Diversion Rate
Diversion

2018 Annual Report County of Los Angeles Countywide Integrated Waste Management Plan
44
Scenario III - Meeting CalRecycle’s Statewide Disposal Target of 2.7 PPD
Assumptions/Considerations:
• Use of Existing Permitted In-County Class III Landfills and
Transformation Facilities
• Use of Exports to Out-of-County Landfills
• Meeting CalRecycle’s Statewide Disposal Target of 2.7
pounds per person per day (PPD) Along with the assumptions mentioned in Scenario II, Scenario III assumes aggressive diversion efforts by individual jurisdictions to achieve CalRecycle’s statewide disposal target of 2.7 PPD, resulting in a sudden increase of the countywide diversion rate to 83-percent in 2020. This scenario also assumes no expansions of existing landfills. The following assumptions are made with respect to imports and exports: Imports –The average waste import rate for 2018 was 563 tpd. However, for purposes of this analysis, the amount of waste imported to in-County landfills is projected to be at 600 tpd every year for the remainder of the planning period. Exports – The amount of waste exported to out-of-County landfills in 2018 was approximately 16,413 tpd and it is assumed that export to out-of-County landfills will continue at the current rate through the remainder of the planning period.
Based on these assumptions, a shortfall in disposal capacity is not expected to occur in this scenario during the planning period. For more detailed data, refer to Appendix E-3. Figure 28: Meeting CalRecycle’s Statewide Disposal Target Scenario
0
20,000
40,000
60,000
80,000
100,000
120,000
20
18
20
19
20
20
20
21
20
22
20
23
20
24
20
25
20
26
20
27
20
28
20
29
20
30
20
31
20
32
20
33
(tp
d-6
)
Year
Scenario III
In-County Class III Landfill Capacity
Transformation Capacity
Disposal Demand at 83% Diversion Rate by 2020
Export to Out-of-County LandfillsDiversion

2018 Annual Report County of Los Angeles Countywide Integrated Waste Management Plan
45
Scenario IV – Meeting Senate Bill 1383 Organic Waste Disposal Reduction Targets Assumptions/Considerations:
• Use of Existing Permitted In-County Class III Landfills and
Transformation Facilities
• Use of Exports to Out-of-County Landfills
• 74-percent diversion rate by 2020 Along with the assumptions in Scenario II , Scenario IV satisfies the requirements of AB 1383 which introduces targets to reduce the landfill disposal of organic waste as follows: (1) a 50-percent reduction in the level of the statewide disposal of organic waste from the 2014 level by 2020 and (2) a 75-percent reduction in the level of the statewide disposal of organic waste from the 2014 level by 2025. The following assumptions are made with respect to imports and exports: Imports – The average waste import rate for 2018 was 563 tpd. However, for purposes of this analysis, the amount of waste imported to in-County landfills is projected to be at 600 tpd every year for the remainder of the planning period. Exports – The amount of waste exported to out-of-County landfills in 2018 was approximately 16,413 tpd and it is assumed that export to out-of-County landfills will continue at the current rate through the remainder of the planning period. Based on these assumptions, a shortfall in disposal capacity is not expected to occur in this scenario during the planning period. For more detailed data, refer to Appendix E-3.
Figure 29: Meeting Senate Bill 1383 Organic Waste Reduction Disposal Targets Scenario
0
20,000
40,000
60,000
80,000
100,000
120,000
20
18
20
19
20
20
20
21
20
22
20
23
20
24
20
25
20
26
20
27
20
28
20
29
20
30
20
31
20
32
20
33
(tp
d-6
)
Year
Scenario IV
In-County Class III Landfill Capacity
Daily Disposal Demand at 74% Diversion by 2020 (SB1383)
Alternative Technology Capacity
Export to Out of-County Landfills
Diversion

2018 Annual Report County of Los Angeles Countywide Integrated Waste Management Plan
46
Scenario V – Utilization of Additional Alternative Technology Capacity Assumptions/Considerations:
• Use of Existing Permitted In-County Class III Landfills and
Transformation Facilities
• Use of Exports to Out-of-County Landfills
• Additional Alternative Technology Capacity Along with the assumptions mentioned in Scenario II, Scenario V assumes the use of additional capacity from other alternative technology facilities (e.g., EMSW conversion facilities). The disposal capacity from anaerobic digestion facilities is considered to be part of the diversion rate since the process of anaerobic digestion fits within the statutory definition of composting, which is considered “recycling”. The scenario assumes continued diversion efforts by individual jurisdictions, resulting in a countywide diversion rate to 65-percent throughout the planning period, and no expansions of existing landfills. The following assumptions are made with respect to imports and exports: Imports – The average waste import rate for 2018 was 563 tpd. However, for purposes of this analysis, the amount of waste imported to in-County landfills is projected to be at 600 tpd every year for the remainder of the planning period. Exports – The amount of waste exported to out-of-County landfills in 2018 was approximately 16,413 tpd and it is assumed that export to out-of-County landfills will continue at the current rate through the remainder of the planning period.
Based on these assumptions, a shortfall in disposal capacity is not expected to occur in this scenario during the planning period. For more detailed data, refer to Appendix E-3. Figure 30: “Utilization of Additional Alternative Technology Capacity” Scenario
0
20,000
40,000
60,000
80,000
100,000
120,000
20
18
20
19
20
20
20
21
20
22
20
23
20
24
20
25
20
26
20
27
20
28
20
29
20
30
20
31
20
32
20
33
(tp
d-6
)Year
Scenario V
In-County Class III Landfill Capacity
Disposal Demand at 65% Diversion Rate
Alternative Technology Capacity
Export to Out of-County Landfills
Diversion

2018 Annual Report County of Los Angeles Countywide Integrated Waste Management Plan
47
Scenario VI – Increase in Exports to Out-of-County Landfills Assumptions/Considerations:
• Use of Existing Permitted In-County Class III Landfills and
Transformation Facilities
• Increase in Exports to Out-of-County Landfills (excluding
potential waste-by-rail capacity)
Along with the assumptions mentioned in Scenario II, Scenario V assumes an increase in exports to out-of-County landfills (up to 19,000 tpd). The scenario assumes continued diversion efforts by individual jurisdictions, resulting in a countywide diversion rate to 65-percent throughout the planning period, and no expansions of existing landfills. The following assumptions are made with respect to imports and exports: Imports – The average waste import rate for 2018 was 563 tpd. However, for purposes of this analysis, the amount of waste imported to in-County landfills is projected to be at 600 tpd every year for the remainder of the planning period. Exports – The amount of waste exported to out-of-County landfills in 2018 was approximately 16,413 tpd and it is assumed that export to out-of-County landfills will increase up to 19,000 tpd through the remainder of the planning period. Based on these assumptions, a shortfall in disposal capacity is not expected to occur in this scenario during the planning period. For more detailed data, refer to Appendix E-3.
Figure 31: Increase in Exports to Out-of-County Landfills Scenario
0
20,000
40,000
60,000
80,000
100,000
120,000
20
18
20
19
20
20
20
21
20
22
20
23
20
24
20
25
20
26
20
27
20
28
20
29
20
30
20
31
20
32
20
33
(tp
d-6
)
Year
Scenario VI
Disposal Demand at 65% Diversion Rate
Transformation Capacity
In-County Class III Landfill Capacity
Export to Out of-County Landfills
Diversion

2018 Annual Report County of Los Angeles Countywide Integrated Waste Management Plan
48
Scenario VII - All Solid Waste Management Options Considered Become Available Assumptions/Considerations:
• Use of Existing Permitted In-County Class III Landfills and
Transformation Facilities
• Increase in Exports to Out-of-County Landfills through use of
potential waste-by-rail capacity • Additional Alternative Technology Capacity
Scenario VII considers all solid waste management options become available throughout the entire planning period. The scenario assumes continued diversion efforts by individual jurisdictions, resulting in a gradual increase of the countywide diversion rate to 75-percent by 2020, and no expansions of existing landfills. The following assumptions are made with respect to imports and exports: Imports – The average waste import rate for 2018 was 563 tpd. However, for purposes of this analysis, the amount of waste imported to in-County landfills is projected to be at 600 tpd every year for the remainder of the planning period. Exports – The amount of waste exported to out-of-County landfills in 2018 was approximately 16,413 tpd and it is assumed that export to out-of-County landfills will continue at a rate of 16,000 tpd through the remainder of the planning period. In addition, a potential waste-by-rail capacity of 4,000 tpd is assumed to be available in the future.
Based on these assumptions, a shortfall in disposal capacity is not expected to occur in this scenario during the 15-year planning period. For more detailed data, refer to Appendix E-3. Figure 32: All Solid Waste Management Options Considered Become Available Scenario
0
20,000
40,000
60,000
80,000
100,000
120,000
20
18
20
19
20
20
20
21
20
22
20
23
20
24
20
25
20
26
20
27
20
28
20
29
20
30
20
31
20
32
20
33
(tp
d-6
)
Year
Disposal Demand at 75% Diversion by 2020
Alternative Technology Capacity
In-County Class III Landfill Capacity
Export to Out of-County Landfills
Waste-by-RailCapacity
Diversion

2018 Annual Report County of Los Angeles Countywide Integrated Waste Management Plan
49
Out-of-County Disposal Facilities
The scenario analysis considers both the current projected availability of active landfills and the potential availability of landfills that are not yet active at the following out-of-County locations:
El Sobrante Landfill, Riverside County (Active) – The landfill has an estimated remaining capacity of 148 million tons and an expected design lifespan of about 43 years, as of December 31, 2018. It is permitted to receive 16,054 tpd of waste for disposal. In 2018, the landfill received an average of 12,050 tpd, of which 4,857 tpd were imported from Los Angeles County.
Frank R. Bowerman Sanitary Landfill, Olinda Alpha Sanitary Landfill, and Prima Deshecha Sanitary Landfill, Orange County
(Active) – These three landfills have estimated remaining capacities of 104 million tons, 16 million tons, and 80 million tons, and have expected remaining lives of 34, 7, and 83 years, respectively. The permitted daily disposal of each respective landfill is 11,500 tpd, 8,000 tpd, and 4,000 tpd. Currently, Orange County has waste importation agreements with various entities in Los Angeles County. In 2018, Frank R. Bowerman Sanitary Landfill, Olinda Alpha Sanitary Landfill, and Prima Deshecha Sanitary Lanfill received 7,593 tpd, 6,858 tpd, and 1,747 tpd, respectively, of which, 2,310 tpd, 2,896 tpd, and 240 tpd were from Los Angeles County.
H.M. Holloway Landfill, Inc., Kern County (Active) – The landfill has a remaining capacity of 3 million tons and an expected design lifespan of about 10 years, as of December 31, 2018. It is permitted to receive 2,000 tpd of waste for disposal. In 2018, the landfill received an average of 1,141 tpd, of which 544 tpd were imported from Los Angeles County. Mid-Valley Sanitary Landfill and San Timoteo Sanitary Landfill, San Bernardino County (Active) – These landfills have an estimated remaining capacity of 37 million tons and 7 million tons and have expected remaining lives of 14 and 24 years, respectively. The landfills are permitted to dispose of 7,500 tpd and 2,000 tpd, respectively. In 2018, Mid Valley Sanitary Landfill received an average of 3,616 tpd and San Timoteo Sanitary Landfill received an average of 906 tpd of solid waste, of which 1,752 tpd and 457 tpd were from Los Angeles County.

2018 Annual Report County of Los Angeles Countywide Integrated Waste Management Plan
50
Simi Valley Landfill & Recycling Center, Ventura County (Active) – The landfill has a remaining capacity of 50 million tons and an expected design lifespan of about 54 years, as of Decmeber 31, 2018. It is permitted to receive a maximum of 6,000 tpd of waste for disposal. The landfill received an average of 4,087 tpd of solid waste, of which 2,522 tpd were imported from Los Angeles County in 2018. Mesquite Regional Landfill, Imperial County (Not yet active) – The Sanitation Districts acquired the landfill in 2002 and completed construction of all infrastructures on December 24, 2008. The landfill is permitted to accept up to 20,000 tpd and has a total disposal capacity of 660 million tons, which is equivalent to a lifespan of nearly 109 years.
For more detailed data on these facilities, refer to Appendix E-2, Table 6 for more detailed data. Conclusion
The scenario analysis discussed earlier assesses the County’s ability to meet the Daily Disposal Demand throughout the 15-year planning period under seven different scenarios. Three scenarios (Scenarios III, IV, and VII) assume an increase in diversion rate, considering all jurisdictions within the County comply with new state laws such as mandatory commercial recycling and the diversion of organics from landfills through organics recycling programs. As demonstrated by the analysis, the County would be able to meet the disposal needs of all jurisdictions through the 15-year
planning period for Scenarios II through VII. However, as demonstrated by Scenario I, reliance on existing permitted in-County landfill capacity alone is insufficient in meeting the County’s long-term disposal needs. To maintain adequate disposal capacity, individual jurisdictions within the County must continue to pursue all of the following strategies: Maximize Waste Reduction and Recycling – An increase in
the Countywide diversion rate could significantly reduce the Daily Disposal Demand, extend landfill life, and ensure that the County, as a whole, will be able to meet the disposal needs of its residents and businesses. Therefore, all jurisdictions are strongly encouraged to continue to expand and enhance programs to maximize diversion.
Expand Existing Landfills – Expanded landfill capacity is necessary, provided it can be done in a technically feasible and environmentally safe manner.
Study, Promote, and Develop Alternative Technologies –
The development of commercial-scale state-of-the-art CTs as a convenient alternative to landfilling appears to be an attainable goal. Jurisdictions must invest and actively participate in the research, promotion, and development of alternative technology facilities by:
o Supporting legislation that places these facilities above landfilling in the waste management hierarchy;
o Entering into waste commitment agreements; and o Establishing partnerships with facilities and
technology vendors.
2018 Annual Report County of Los Angeles Countywide Integrated Waste Management Plan
51
❖ Expand Transfer and Processing Infrastructure – Development of additional in-County solid waste management infrastructure, such as transfer/processing, composting, and anaerobic digestion facilities, to assist jurisdictions in achieving higher diversion rates and facilitate the transport of solid waste to out-of-County landfills.
❖ Out-of-County Disposal (including Waste-by-Rail) –
Individual jurisdictions within the County may use the out-of-County disposal option to achieve their solid waste management goals. Out-of-County disposal may not only be essential for the disposal of residual solid waste originating within the County in the future, but it may also supplement and extend the life of the current in-County disposal capacity. As the disposal capacity within the County continues to diminish, and the siting of new and/or expansion of existing Class III landfills becomes increasingly difficult, out-of-County disposal options, such as the waste-by-rail system, will become more essential to meet the County’s disposal needs.
The assumptions made on the scenario analysis are consistent with the goals and policies established in the CSE as well as recently passed legislation, such as mandatory commercial recycling and the diversion of organic waste from landfills through organics recycling programs, as well as information contained in CalRecycle’s State of Disposal and State of Recycling in California Reports, released on March 2015. The County acknowledges that although all the scenarios assume an increase in diversion rate, there will be significant challenges in developing the processing capacity needed by the 2020
deadline. Therefore, maintaining adequate reserve (excess) capacity will be essential in ensuring that the disposal needs of the County are met throughout the 15-year planning period. It should be noted that future conditions considered in this report are projections, and may change based on several factors, such as decisions made by the 89 individual jurisdictions or their waste management service providers and on other conditions such as changes in regulatory requirements, disposal rates, fuel costs, and traffic congestion. Nevertheless, the preceding scenario analyses provide a useful tool to assess the ability of individual jurisdictions within the County to meet the disposal needs of their residents and businesses under various conditions. Given that solid waste disposal is an essential public service, it must be provided without interruption to protect the health and safety of the public as well as the environment. Accordingly, major concerted actions must continue to be taken by individual jurisdictions towards expanding and enhancing waste reduction and recycling programs and implementing prudent solid waste management strategies.

2018 Annual Report County of Los Angeles Countywide Integrated Waste Management Plan
52
JURISDICTION/REGIONAL AGENCY CONTACT
Primary Contacts COBY SKYE Assistant Deputy Director Environmental Programs Division Phone: (626) 458-3500 Fax: (626) 979-5389 E-Mail: [email protected] Mailing Address County of Los Angeles Department of Public Works Environmental Programs Division P.O. Box 1460 Alhambra, CA 91802-1460
Secondary Contacts CARLOS RUIZ Assistant Division Engineer Environmental Programs Division Phone: (626) 458-3501 Fax: (626) 979-5389 E-Mail: [email protected] PATRICK HOLLAND Assistant Division Engineer Environmental Programs Division Phone: (626) 458-3502 Fax: (626) 979-5389 E-Mail: [email protected]

2018 Annual Report County of Los Angeles Countywide Integrated Waste Management Plan
53
[This Page Intentionally Left Blank]

2018 Annual Report Los Angeles County Countywide Integrated Waste Management Plan
54
APPENDIX E-1 SOLID WASTE FACILITY FACT SHEETS

2018 Annual Report Los Angeles County Countywide Integrated Waste Management Plan
55
[This Page Intentionally Left Blank

2018 Annual Report Los Angeles County Countywide Integrated Waste Management Plan
56
Antelope Valley Recycling and Disposal Facility
1. FACILITY INFORMATION Owner: Waste Management of California, Inc. Operator: Waste Management of California, Inc. Address: 1200 West City Ranch Road, Palmdale, CA 93551 Operating Days: Monday-Saturday SWFP No: 19-AA-5624 SWFP Issue Date: 11/16/2011
Last 5-year Review Date: 11/16/2016 5-year Review Due Date: 11/10/2021 2. REMAINING PERMITTED CAPACITY (as of December 31, 2018) Remaining Permitted Capacity: 12,001,395 16,131,440 cubic yards Estimated Remaining Life: 22 years (based on maximum permitted rate of disposal of 1,677 tpd, 307 days per year) In-Place Density: 0.75 tons/cubic yard 3. MAXIMUM PERMITTED DAILY CAPACITY Daily: 3,600 tons [4,800 cubic yards] Yearly Equivalent: [1,123,200 tons] [1,497,600 cubic yards] 4. 2018 AVERAGE WASTE QUANTITIES DISPOSED (INCLUDING IMPORT QUANTITIES) Daily (based on 6 days): 1,677 tons [2,236 cubic yards] 5. LAND USE/CONDITIONAL USE PERMIT Permit No.: 98-12 Effective: 06/21/2011 Modified: 01/11/2018 6. WASTE DISCHARGE REQUIREMENTS Order No.: 6-95-119A2 Effective: 10/10/2001 7. FOC GRANT DATE – October 18, 2018 8. PERMITTED WASTE TYPES - Solid waste 9. FUTURE LAND USE - No plans at this time 10. RESTRICTIONS - There is no wasteshed or restriction on origin of waste. Based on the SWFP, the landfill is permitted to receive 3,600
tpd of MSW and 1,948 tpd of materials for recycling and beneficial use. 11. REMARKS/STATUS - The City of Palmdale approved the expansion of Antelope Valley Landfill, which consolidates Unit 1 and Unit
2, on June 9, 2011 Note: Information above was provided by the landfill operator by completing the Annual Survey Form or through the Solid Waste Information Management System (SWIMS) as of June 2019. Calculated or assumed quantities are shown in brackets.

2018 Annual Report Los Angeles County Countywide Integrated Waste Management Plan
57
Azusa Land Reclamation Company Landfill
1. FACILITY INFORMATION Owner: Azusa Land Reclamation Inc. Operator: Azusa Land Reclamation Inc. Address: 1211 West Gladstone Street, Azusa, CA 91702 Operating Days: Monday-Friday SWFP No: 19-AA-0013 SWFP Issue Date: 11/12/2014
Last 5-year Review Date: 03/10/2016 5-year Review Due Date: 03/10/2021 2. REMAINING PERMITTED CAPACITY (as of December 31, 2018) Remaining Permitted Capacity: 57,716,118 tons [46,172,894 cubic yards] Estimated Remaining Life: 28 years (based on the current SWPF estimated closure date) In-Place Density: ` [1.25 tons/cubic yard] 3. MAXIMUM PERMITTED DAILY CAPACITY Daily: 6,500 tons [5,200 cubic yards] Yearly Equivalent: [2,028,000 tons] [1,622,400 cubic yards] 4. 2018 AVERAGE WASTE QUANTITIES DISPOSED (INCLUDING IMPORT QUANTITIES) Daily (based on 6 days): 1,358 tons [1,086 cubic yards] 5. LAND USE/CONDITIONAL USE PERMIT Permit No.: Owner Participation Agreement No.1 (incorporated CUP No. C-151 of 4/9/75) Effective: 01/27/1984 Expiration: None 6. WASTE DISCHARGE REQUIREMENTS Order No.: R4-2009-0098 Effective: 09/03/2009 7. FOC GRANT DATE – 05/16/1996 8. PERMITTED WASTE TYPES – Inert Solid waste 9. FUTURE LAND USE - Open space 10. RESTRICTIONS - 6,500 tpd per SWFP. Only accepts inert solid waste. 11. REMARKS/STATUS - By Court Order, on October 2, 1996, the California Regional Water Quality Control Board-Los Angeles region
ordered the Azusa Land Reclamation Landfill to stop accepting Municipal Solid Waste. Permitted daily capacity of 6,500 tpd consists of 6,000 tpd of refuse and 500 tpd of inert waste. Facility currently accepts inert waste only.
Note: Information above was provided by the landfill operator by completing the Annual Survey Form or through the Solid Waste Information Management System (SWIMS) as of June 2019. Calculated or assumed quantities are shown in brackets.

2018 Annual Report Los Angeles County Countywide Integrated Waste Management Plan
58
Burbank Landfill No. 3
1. FACILITY INFORMATION Owner: City of Burbank - DPW Operator: City of Burbank - DPW
Address: 3000 North Bel Aire, Burbank, CA 91504 Operating Days: Monday-Friday SWFP No.: 19-AA-0040 SWFP Issue Date: 06/03/1997 Last 5-year Review Date: 07/11/2016 5-year Review Due Date: 07/11/2021
2. REMAINING PERMITTED CAPACITY (as of December 31, 2018) Remaining Permitted Capacity: [2,264,430 tons] 4,117,147 cubic yards Estimated Remaining Life: 35 years (based on the current SWFP estimated closure date) In-Place Density: [0.55 tons/cubic yard] 3. MAXIMUM PERMITTED DAILY CAPACITY Daily: 240 tons [436 cubic yards] Yearly Equivalent: [62,400] [113,455 cubic yards] 4. 2018 AVERAGE WASTE QUANTITIES DISPOSED (INCLUDING IMPORT QUANTITIES) Daily (based on 6 days): 122 tons [244 cubic yards] 5. LAND USE/CONDITIONAL USE PERMIT Permit No.: 2000-16 Effective: 11/13/2000 Expiration: None 6. WASTE DISCHARGE REQUIREMENTS Order No.: 93-062 Effective: 09/27/1993 Order No.: R4-2002-0154 Effective: 09/26/2002 Order No.: R4-2006-0007 Effective: 01/19/2006 Order No.: R4-2011-0052 Effective: 03/03/2011 7. FOC GRANT DATE – 12/18/1986 8. PERMITTED WASTE TYPES - Solid waste 9. FUTURE LAND USE - Irrigated open space. 10. RESTRICTIONS - Origin of waste limited to the City of Burbank and is not open to the public. 11. REMARKS/STATUS - Limited to the City of Burbank use only. Note: Information above was provided by the landfill operator by completing the Annual Survey Form or through the Solid Waste Information Management System (SWIMS) as of July 2019. Calculated or assumed quantities are shown in brackets.

2018 Annual Report Los Angeles County Countywide Integrated Waste Management Plan
59
Calabasas Landfill
1. FACILITY INFORMATION Owner: County of Los Angeles Operator: County Sanitation District No. 2 of Los Angeles County
Address: 5300 Lost Hills Road, Agoura, CA 91301 (Los Angeles County unincorporated area) Operating Days: Monday-Saturday SWFP No.: 19-AA-0056 SWFP Issue Date: 04/04/2016 Last 5-year Review Date: 03/25/2016 5-year Review Due Date: 08/11/2019
2. REMAINING PERMITTED CAPACITY (as of December 31, 2018) Remaining Permitted Capacity: 4,908,186 tons 11,071,716 cubic yards Estimated Remaining Life: 11 years (based on the current SWFP estimated closure date ) In-Place Density: 0.443 tons/cubic yard 3. MAXIMUM PERMITTED DAILY CAPACITY Daily: 3,500 tons [7,901 cubic yards] Yearly Equivalent: [1,081,500 tons] [2,441,309 cubic yards] 4. 2018 AVERAGE WASTE QUANTITIES DISPOSED (INCLUDING IMPORT QUANTITIES) Daily (based on 6 days): 1,030 tons [2,324 cubic yards] 5. LAND USE/CONDITIONAL USE PERMIT Permit No.: 5022-(5) Effective: 08/23/1972 Expiration: None 6. WASTE DISCHARGE REQUIREMENTS Order No.: 93-062 Effective: 09/27/1993 Order No.: R4-2006-0007 Effective: 01/19/2006 Order No.: R4-2009-0088 Effective: 07/16/2009 Order No.: R4-2011-0052 Effective: 03/03/2011 7. FOC GRANT DATE – None 8. PERMITTED WASTE TYPES - Solid waste 9. FUTURE LAND USE - Open space 10. RESTRICTIONS - Origin of waste is limited to that generated in the Calabasas Wasteshed as defined by Los Angeles County Ordinance
No. 91-0003. 11. REMARKS/STATUS - Limited to the Calabasas Wasteshed as defined by Los Angeles County Ordinance No. 91-0003. Note: Information above was provided by the landfill operator by completing the Annual Survey Form or through the Solid Waste Information Management System (SWIMS) as of June 2019. Calculated or assumed quantities are shown in brackets.
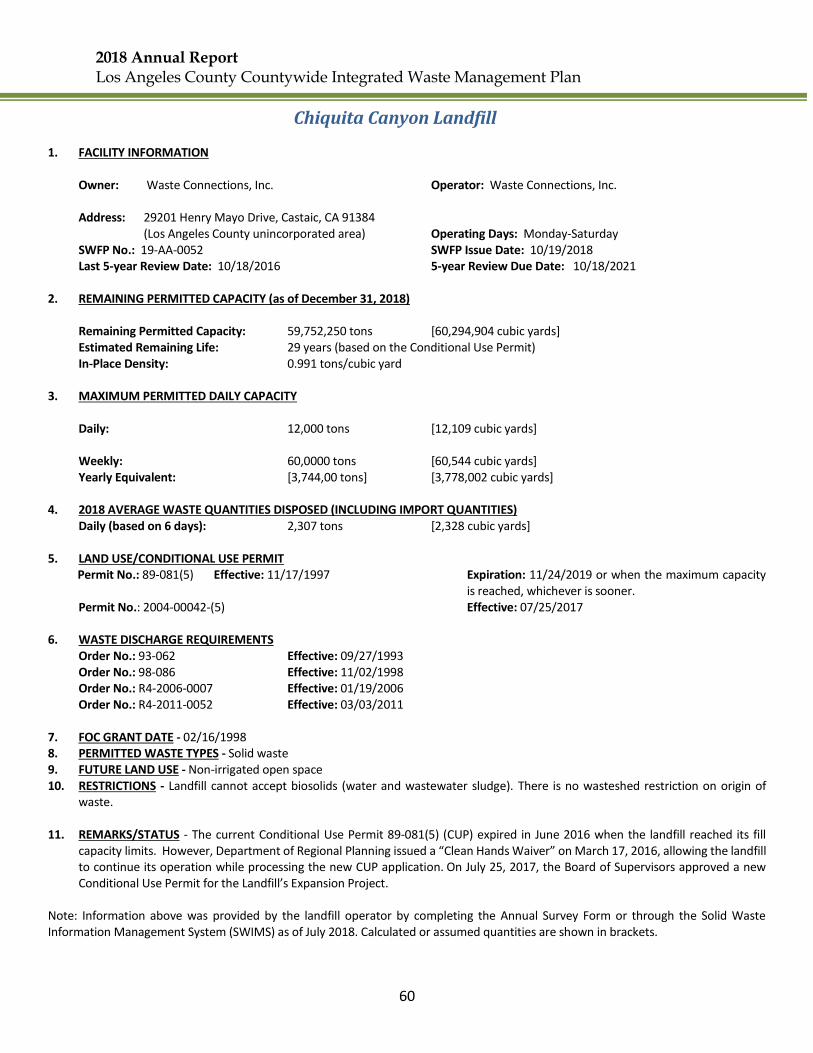
2018 Annual Report Los Angeles County Countywide Integrated Waste Management Plan
60
Chiquita Canyon Landfill
1. FACILITY INFORMATION Owner: Waste Connections, Inc. Operator: Waste Connections, Inc.
Address: 29201 Henry Mayo Drive, Castaic, CA 91384 (Los Angeles County unincorporated area) Operating Days: Monday-Saturday SWFP No.: 19-AA-0052 SWFP Issue Date: 10/19/2018 Last 5-year Review Date: 10/18/2016 5-year Review Due Date: 10/18/2021
2. REMAINING PERMITTED CAPACITY (as of December 31, 2018) Remaining Permitted Capacity: 59,752,250 tons [60,294,904 cubic yards] Estimated Remaining Life: 29 years (based on the Conditional Use Permit) In-Place Density: 0.991 tons/cubic yard 3. MAXIMUM PERMITTED DAILY CAPACITY Daily: 12,000 tons [12,109 cubic yards] Weekly: 60,0000 tons [60,544 cubic yards] Yearly Equivalent: [3,744,00 tons] [3,778,002 cubic yards] 4. 2018 AVERAGE WASTE QUANTITIES DISPOSED (INCLUDING IMPORT QUANTITIES) Daily (based on 6 days): 2,307 tons [2,328 cubic yards] 5. LAND USE/CONDITIONAL USE PERMIT
Permit No.: 89-081(5) Effective: 11/17/1997 Expiration: 11/24/2019 or when the maximum capacity is reached, whichever is sooner.
Permit No.: 2004-00042-(5) Effective: 07/25/2017 6. WASTE DISCHARGE REQUIREMENTS Order No.: 93-062 Effective: 09/27/1993 Order No.: 98-086 Effective: 11/02/1998 Order No.: R4-2006-0007 Effective: 01/19/2006 Order No.: R4-2011-0052 Effective: 03/03/2011 7. FOC GRANT DATE - 02/16/1998 8. PERMITTED WASTE TYPES - Solid waste 9. FUTURE LAND USE - Non-irrigated open space 10. RESTRICTIONS - Landfill cannot accept biosolids (water and wastewater sludge). There is no wasteshed restriction on origin of
waste. 11. REMARKS/STATUS - The current Conditional Use Permit 89-081(5) (CUP) expired in June 2016 when the landfill reached its fill
capacity limits. However, Department of Regional Planning issued a “Clean Hands Waiver” on March 17, 2016, allowing the landfill to continue its operation while processing the new CUP application. On July 25, 2017, the Board of Supervisors approved a new Conditional Use Permit for the Landfill’s Expansion Project.
Note: Information above was provided by the landfill operator by completing the Annual Survey Form or through the Solid Waste Information Management System (SWIMS) as of July 2018. Calculated or assumed quantities are shown in brackets.

2018 Annual Report Los Angeles County Countywide Integrated Waste Management Plan
61
Commerce Refuse-to-Energy Facility (CREF) (closed as of 6/26/2018)
1. FACILITY INFORMATION Owner: Commerce Refuse-to-Energy Authority (City of Operator: County Sanitation District No. 2 Commerce and County Sanitation Districts of Los Angeles County of Los Angeles County)
Address: 5926 Sheila Street, Commerce, CA 90040 Operating Days: Monday-Friday (receive) Monday-Sunday (process) SWFP No.: 19-AA-0506 SWFP Issue Date: 07/09/1997
Last 5-year Review Date: 08/15/2012 5-year Review Due Date: 08/15/2017
2. MAXIMUM PERMITTED DAILY CAPACITY Daily: 1,000 tons (SWFP Requirement) Weekly: 2,800 tons (SWFP Requirement) 3. 2018 AVERAGE TRANSFORMED WASTE QUANTITIES (INCLUDING IMPORT QUANTITIES) Daily Received: 331 tpd (based on 6 days) Daily Processed: 293 tpd 4. LAND USE/CONDITIONAL USE PERMIT – Not Applicable 5. WASTE DISCHARGE REQUIREMENTS - Not Applicable 6. PERMITTED WASTE TYPES - Solid waste 7. FOC GRANT DATE – 10/20/1983 8. FUTURE LAND USE - Not applicable 9. RESTRICTIONS - Facility requires high energy content waste. The City of Commerce Planning Commission made a written
determination that the facility is consistent with the City’s Plan, and the adjacent zoning and surrounding land use is compatible with its operation.
Note: Information above was provided by the landfill operator by completing the Annual Survey Form or through the Solid Waste Information Management System (SWIMS) as of July 2018. Calculated or assumed quantities are shown in brackets.

2018 Annual Report Los Angeles County Countywide Integrated Waste Management Plan
62
Lancaster Landfill and Recycling Center
1. FACILITY INFORMATION Owner: Waste Management of California, Inc. Operator: Waste Management of California, Inc. Address: 600 East Avenue "F", Lancaster, CA 93535 Operating Days: Monday-Saturday
(Los Angeles County Unincorporated Area) SWFP No.: 19-AA-0050 SWFP Issue Date: 02/19/2013 Last 5-year Review Date: 02/13/2018 5-year Review Due Date: 02/19/2023
2. REMAINING PERMITTED CAPACITY (as of December 31, 2018) Remaining Permitted Capacity: 10,231,322 tons 13,641,763 cubic yards
Estimated Remaining Life: 23 years (based on Land Use Permit Restriction) In-Place Density: 0.75 tons/cubic yard
3. MAXIMUM PERMITTED DAILY CAPACITY Daily: 3,000 tons [4,000 cubic yards]
Yearly Equivalent: [936,000 tons] [1,248,000 cubic yards] 4. 2018 AVERAGE WASTE QUANTITIES DISPOSED (INCLUDING IMPORT QUANTITIES) Daily (based on 6 days): 376 tons [501 cubic yards] 5. LAND USE/CONDITIONAL USE PERMIT Permit No.: 03-170-(5) Effective: 08/01/2012 Expiration: 10/19/2041 or when limit of fill is reached, whichever occurs first. 6. WASTE DISCHARGE REQUIREMENTS Order No.: R6V-2016-0037 Effective: 06/14/2000 7. FOC GRANT DATE - 05/18/2013 8. PERMITTED WASTE TYPES - Solid waste 9. FUTURE LAND USE - Open space 10. RESTRICTIONS - The Landfill cannot accept more than 10 tpd of biosolids (sewage sludge). There is no wasteshed restriction on
origin of waste. Based on the SWFP, the landfill accepts 3,000 tpd of refuse and 2,100 tpd of inert debris and beneficial use. Note: Information above was provided by the landfill operator by completing the Annual Survey Form or through the Solid Waste Information Management System (SWIMS) as of June 2019. Calculated or assumed quantities are shown in brackets.

2018 Annual Report Los Angeles County Countywide Integrated Waste Management Plan
63
Mesquite Regional Landfill
(Out-of-County Landfill)
1. FACILITY INFORMATION Owner: County of Los Angeles Sanitation District 2 Operator: County of Los Angeles Sanitation District 2 of Los Angeles County Address: 6502 E Hwy 78, Brawley 92227 Operating Days: Not yet operational SWFP No.: 13-AA-0026 SWFP Issue Date: 04/08/97 Last 5-year Review Date: 10/03/2016 5-year Review Due Date: 10/03/2021 2. REMAINING PERMITTED CAPACITY (as of December 31, 2018) Remaining Permitted Capacity: [660,000,000 tons] [1,100,000,000 cubic yards] Estimated Remaining Life: 109 years In-Place Density: 0.60 tons/cubic yard 3. MAXIMUM PERMITTED CAPACITY Daily: 20,000 tons [33,333 cubic yards] Yearly Equivalent: [7.3 million tons] [12.2 million cubic yards] 4. 2018 AVERAGE WASTE QUANTITIES DISPOSED Daily: Not yet operational 5. LAND USE/CONDITIONAL USE PERMIT Permit No.: NO. 060003 Effective: 04/27/2011 Expiration: To Be Determined 6. WASTE DISCHARGE REQUIREMENTS Order No.: R7-2009-0003 Effective: 06/18/2009 7. PERMITTED WASTE TYPES - Solid Waste 8. FUTURE LAND USE – Disposal 9. RESTRICTIONS/CURRENT STATUS
In February 2007, the Sanitation Districts submitted an application to Imperial County to amend the Mesquite Regional Landfill CUP for the receipt of up to 4,000 tpd of municipal solid waste by truck. Once the waste-by-rail system is operational, the ability to receive waste by truck will provide operational flexibility with the ability to ramp up until enough tonnage is received to make up a unit train. Imperial County Planning and Development Services issued a Notice of Availability of the Final Subsequent EIR on October 6, 2010. The Board of Supervisors held a public hearing on the project on April 5, 2011, and subsequently approved the CUP. The Sanitation Districts also obtained a revised Solid Waste Facility Permit (SWFP) from CalRecycle/Local Enforcement Agency on October 1, 2011 for truck haul and other entitlements granted by the new CUP.
Note: Calculated or assumed quantities are shown in bracket.

2018 Annual Report Los Angeles County Countywide Integrated Waste Management Plan
64
Pebbly Beach Landfill
1. FACILITY INFORMATION Owner: City of Avalon Operator: Consolidated Disposal Services dba Seagull Sanitation Systems Address: 1 Dump Road, Avalon, CA 90704 Operating Days: Monday-Sunday (Los Angeles County Unincorporated Area) SWFP No.: 10-AA-0061 SWFP Issue Date: 04/10/2001 Last 5-year Review Date: 04/30/2015 5-year Review Due Date: 04/30/2020 2. REMAINING PERMITTED CAPACITY (as of December 31, 2018) Remaining Permitted Capacity: [34,735 tons] 46,313 cubic yards Estimated Remaining Life: 10 years (based on Land Use Permit Restriction) In-Place Density: 0.75-1.25 tons/cubic yard 3. MAXIMUM PERMITTED DAILY CAPACITY Daily: 49 tons [65 cubic yards] Yearly Equivalent: 17,885 tons [23,847 cubic yards] 4. 2018 AVERAGE WASTE QUANTITIES DISPOSED (INCLUDING IMPORT QUANTITIES) Daily (based on 6 days): 9.7 tons [13 cubic yards] 5. LAND USE/CONDITIONAL USE PERMIT Permit No.: 96-162-(4) Effective: 07/29/1998 Expiration: 07/02/2028 6. WASTE DISCHARGE REQUIREMENTS Order No.: R4-2002-0058 Effective: 02/28/2002 Order No.: R4-2011-0052 Effective: 03/03/2011 Order No.: R4-2011-0165 Effective: 11/07/2011 7. FOC GRANT DATE - 01/21/1999 8. PERMITTED WASTE TYPES - Solid waste 9. FUTURE LAND USE - Open space 10. RESTRICTIONS - There is no wasteshed restriction on origin of waste. However, due to its location on Santa Catalina Island, only the
City of Avalon and adjacent unincorporated County areas have access to this facility. Based on the SWFP, no Haz-Mat, designated waste, untreated medical waste, or liquids accepted at the facility. Sewage must be at least 50 percent solids on sludge.
Note: Information above was provided by the landfill operator by completing the Annual Survey Form or through the Solid Waste Information Management System (SWIMS) as of June 2019. Calculated or assumed quantities are shown in brackets.

2018 Annual Report Los Angeles County Countywide Integrated Waste Management Plan
65
San Clemente Island Landfill
1. FACILITY INFORMATION
Owner: U.S. Department of the Navy Operator: U.S. Department of the Navy Address: San Clemente Island, CA Operating Days: 2 days/week
SWFP No.: 19-AA-0063 SWFP Issue Date: 06/24/1997 Last 5-year Review Date: 04/22/2018 5-year Review Due Date: 04/22/2023
2. REMAINING PERMITTED CAPACITY (as of December 31, 2018) Remaining Permitted Capacity: [35,650 tons] 285,203 cubic yards Estimated Remaining Life: 15 years (based on average daily disposal of 9.6 tpd, 104 days per year ) In-Place Density: 0.125 tons/cubic yard 3. MAXIMUM PERMITTED DAILY CAPACITY Daily: 9.6 tons [77 cubic yards] Yearly Equivalent: 991 tons [7,928 cubic yards] 4. 2018 AVERAGE WASTE QUANTITIES DISPOSED (INCLUDING IMPORT QUANTITIES) Daily (based on 6 days): 3.42 ton [27.36 cubic yards] 5. LAND USE/CONDITIONAL USE PERMIT – Not Applicable 6. WASTE DISCHARGE REQUIREMENTS Order No.: R4-2004-0057 Effective: 04/01/2004 Order No.: R4-2010-0045 Effective: 03/04/2010 7. FOC GRANT DATE – None 8. PERMITTED WASTE TYPES - Solid waste 9. FUTURE LAND USE - Open space. None. 10. RESTRICTIONS - This landfill is used solely by the U.S. Department of the Navy. SWFP is still under review by the CalRecycle as they
address new Title 27 methane monitoring requirements. Note: Information above was provided by the landfill operator by completing the Annual Survey Form or through the Solid Waste Information Management System (SWIMS) as of June 2019. Calculated or assumed quantities are shown in brackets.

2018 Annual Report Los Angeles County Countywide Integrated Waste Management Plan
66
Scholl Canyon Landfill
1. FACILITY INFORMATION
Owner: City of Glendale & County of Los Angeles Operator: County Sanitation District No. 2 of Los Angeles County
Address: 7721 N. Figueroa St, Los Angeles, CA, 90041 Operating Days: Monday-Saturday
SWFP No.: 19-AA-0012 SWFP Issue Date: 12/13/2011 Last 5-year Review Date: 12/13/2016 5-year Review Due Date: 12/13/2021
2. REMAINING PERMITTED CAPACITY (as of December 31, 2018) Remaining Permitted Capacity: 4,294,664 tons 7,084,899 cubic yards Estimated Remaining Life: 11 years (based on average daily disposal of 1,211 tpd, 309 days per year) In-Place Density: 0.593 tons/cubic yard 3. MAXIMUM PERMITTED DAILY CAPACITY Daily: 3,400 tons [5,734 cubic yards] Yearly Equivalent: [1,050,600 tons] [1,771,669 cubic yards] 4. 2018 AVERAGE WASTE QUANTITIES DISPOSED (INCLUDING IMPORT QUANTITIES) Daily (based on 6 days): 929 tons [1,567 cubic yards] 5. LAND USE/CONDITIONAL USE PERMIT Permit No.: 6668-U (Zoning Variance) Effective: 10/07/1997 6. WASTE DISCHARGE REQUIREMENTS Order No.: 01-132 Effective: 09/19/2001; Order No.: R4-2011-0052 Effective: 03/03/2011 7. FOC GRANT DATE - None 8. PERMITTED WASTE TYPES - Solid waste 9. FUTURE LAND USE - Open space 10. RESTRICTIONS - The use of the Landfill is restricted by the City of Glendale Ordinance 4780 to the County of Los Angeles Cities of
Glendale, La Canada Flintridge, Pasadena, South Pasadena, San Marino, and Sierra Madre; and the Los Angeles County unincorporated areas of Altadena, La Crescenta, Montrose; the unincorporated area bordered by the incorporated cities of San Gabriel, Rosemead, Temple City, Arcadia and Pasadena; and the unincorporated area immediately to the north of the City of San Marino bordered by the City of Pasadena on the west, north, and east sides.
Note: Information above was provided by the landfill operator by completing the Annual Survey Form or through the Solid Waste Information Management System (SWIMS) as of June 2019. Calculated or assumed quantities are shown in brackets.

2018 Annual Report Los Angeles County Countywide Integrated Waste Management Plan
67
Southeast Resource Recovery Facility (SERRF)
1. FACILITY INFORMATION Owner: Southeast Resource Recovery Facility Authority, a joint Operator: City of Long Beach powers authority consisting of the City of Long Beach and the Los Angeles County Sanitation District No. 2
Address: 120 Henry Ford Avenue, Long Beach, CA 90802 Operating Days: Monday-Friday (receive) Monday-Sunday (process)
SWFP No.: 19-AK-0083 SWFP Issue Date: 08/19/2015 Last 5-year Review Date: 08/27/2014 5-year Review Due Date: 07/29/2019
2. MAXIMUM PERMITTED DAILY CAPACITY Daily: 2,240 tons (SWFP Requirement) 3. 2018 AVERAGE TRANSFORMED WASTE QUANTITIES (INCLUDING IMPORT QUANTITIES) Daily Received: 1,196 tpd (based on 6 days) Daily Processed: 1,194 tpd 4. LAND USE/CONDITIONAL USE PERMIT Permit No.: HDP-84174 5. WASTE DISCHARGE REQUIREMENTS - Not Applicable 6. PERMITTED WASTE TYPES - Solid waste 7. FOC GRANT DATE - 09/18/1997 8. FUTURE LAND USE - Not applicable 9. RESTRICTIONS - There is no wasteshed or restriction on origin of waste. 2,240 tpd per SWFP.
10. REMARKS/STATUS - SERRF will continue to operate until June 2024 at its current average daily rate during the planning period. The
city of Long Beach has announced an amended agreement to provide for the continued operation of SERRF and allow for opportunities to process higher-value waste. The owner and operator of SERRF has indicated that there are no plans to increase the permitted daily capacity.
Note: Information above was provided by the landfill operator by completing the Annual Survey Form or through the Solid Waste Information Management System (SWIMS) as of June 2019. Calculated or assumed quantities are shown in brackets.
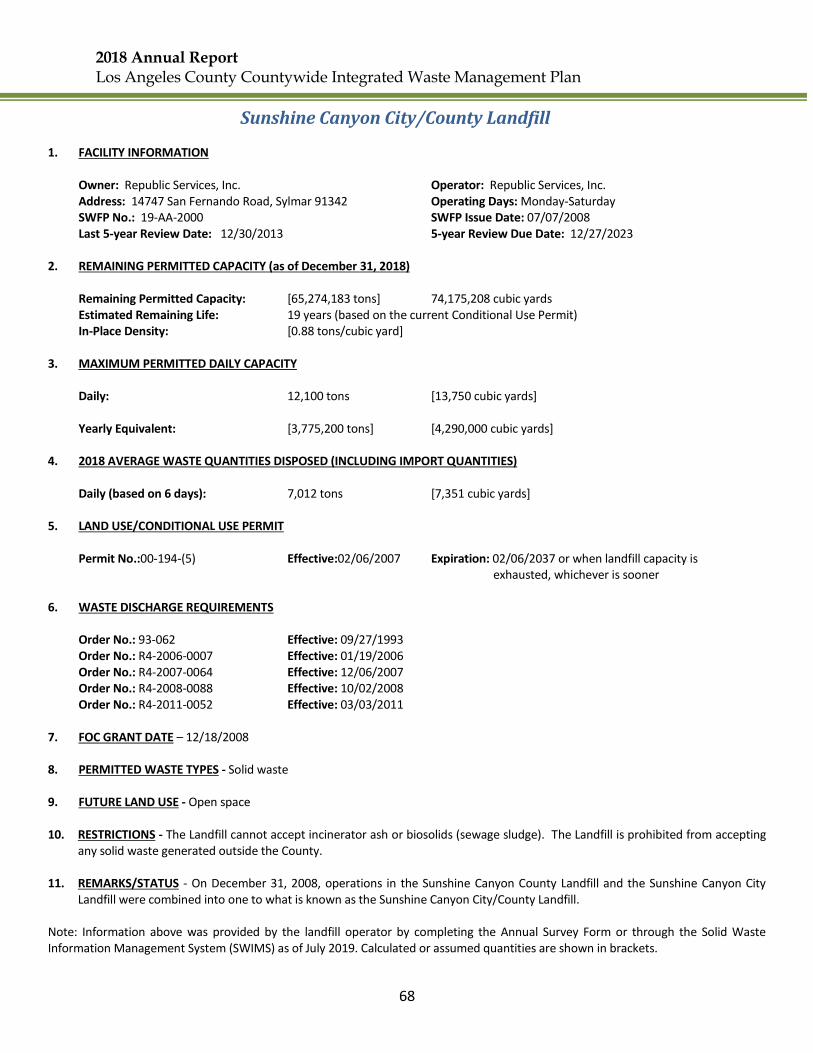
2018 Annual Report Los Angeles County Countywide Integrated Waste Management Plan
68
Sunshine Canyon City/County Landfill
1. FACILITY INFORMATION Owner: Republic Services, Inc. Operator: Republic Services, Inc. Address: 14747 San Fernando Road, Sylmar 91342 Operating Days: Monday-Saturday SWFP No.: 19-AA-2000 SWFP Issue Date: 07/07/2008 Last 5-year Review Date: 12/30/2013 5-year Review Due Date: 12/27/2023 2. REMAINING PERMITTED CAPACITY (as of December 31, 2018) Remaining Permitted Capacity: [65,274,183 tons] 74,175,208 cubic yards Estimated Remaining Life: 19 years (based on the current Conditional Use Permit)
In-Place Density: [0.88 tons/cubic yard] 3. MAXIMUM PERMITTED DAILY CAPACITY Daily: 12,100 tons [13,750 cubic yards] Yearly Equivalent: [3,775,200 tons] [4,290,000 cubic yards] 4. 2018 AVERAGE WASTE QUANTITIES DISPOSED (INCLUDING IMPORT QUANTITIES) Daily (based on 6 days): 7,012 tons [7,351 cubic yards] 5. LAND USE/CONDITIONAL USE PERMIT Permit No.:00-194-(5) Effective:02/06/2007 Expiration: 02/06/2037 or when landfill capacity is exhausted, whichever is sooner 6. WASTE DISCHARGE REQUIREMENTS Order No.: 93-062 Effective: 09/27/1993 Order No.: R4-2006-0007 Effective: 01/19/2006 Order No.: R4-2007-0064 Effective: 12/06/2007 Order No.: R4-2008-0088 Effective: 10/02/2008 Order No.: R4-2011-0052 Effective: 03/03/2011 7. FOC GRANT DATE – 12/18/2008 8. PERMITTED WASTE TYPES - Solid waste 9. FUTURE LAND USE - Open space 10. RESTRICTIONS - The Landfill cannot accept incinerator ash or biosolids (sewage sludge). The Landfill is prohibited from accepting
any solid waste generated outside the County. 11. REMARKS/STATUS - On December 31, 2008, operations in the Sunshine Canyon County Landfill and the Sunshine Canyon City
Landfill were combined into one to what is known as the Sunshine Canyon City/County Landfill. Note: Information above was provided by the landfill operator by completing the Annual Survey Form or through the Solid Waste Information Management System (SWIMS) as of July 2019. Calculated or assumed quantities are shown in brackets.

2018 Annual Report Los Angeles County Countywide Integrated Waste Management Plan
69
Whittier (Savage Canyon) Landfill
1. FACILITY INFORMATION Owner: City of Whittier Operator: City of Whittier - DPW Address: 13919 E. Penn St., Whittier, CA 90602 Operating Days: Monday-Saturday
SWFP No.: 19-AH-0001 SWFP Issue Date: 10/30/2013 Last 5-year Review Date: 10/18/2018 5-year Review Due Date: 10/30/2023
2. REMAINING PERMITTED CAPACITY (as of December 31, 2018) Remaining Permitted Capacity: 4,580,480 tons [7,634,133 cubic yards]
Estimated Remaining Life: 37 years (based on the current SWPF estimated closure date) In-Place Density: 0.60 tons/cubic yard
3. MAXIMUM PERMITTED DAILY CAPACITY Daily: 350 tons [583 cubic yards]
Yearly Equivalent: 109,200 tons [182,000 cubic yards] 4. 2018 AVERAGE WASTE QUANTITIES DISPOSED (INCLUDING IMPORT QUANTITIES) Daily (based on 6 days): 296 tons [493 cubic yards] 5. LAND USE/CONDITIONAL USE PERMIT Permit No.: City Resolution No. 4907 Effective: 08/23/1977 Expiration: Completion of project 6. WASTE DISCHARGE REQUIREMENTS Order No. 93-062 Effective: 09/27/1993 Order No.: R4-2006-0007 Effective: 01/19/2006 Order No.: R4-2006-0080 Effective: 10/24/2006 Order No.: R4-2011-0052 Effective: 03/03/2011 7. FOC GRANT DATE – 11/30/1978 8. PERMITTED WASTE TYPES - Mixed municipal, Construction/demolition, Industrial, Green Materials, and Inert waste. 9. FUTURE LAND USE - Open space 10. RESTRICTIONS - Hazardous, radioactive, liquid, or medical waste are all prohibited per Chapter 6.1, Division 20 of California Health
and Safety Code.
Note: Information above was provided by the landfill operator by completing the Annual Survey Form or through the Solid Waste Information Management System (SWIMS) as of June 2019. Calculated or assumed quantities are shown in brackets.

2018 Annual Report Los Angeles County Countywide Integrated Waste Management Plan
APPENDIX E-2: TABLES
Table 4 - Remaining Permitted Capacity of Existing Solid Waste Disposal Facilities in Los Angeles County
Table 5 - Summary of Existing Inert Debris Disposal Sites in Los Angeles County
Table 6 - Out-of-County Landfills Currently Available for Use by Jurisdictions in Los Angeles County
Table 7 - Population, Employment, Real Taxable Sales, and Waste Generation in Los Angeles County
Table 8 - Los Angeles County Solid Waste Disposal Capacity Need Projection

Solid Waste LocationPermitted LUP/CUP 2018Annual Disposal Remaining
Tipping
Fee
FacilityOperation Maximum Life ($ per ton)
Facility Permit City or Daily Comments
Number Unincoporated Area Capacity (b)
Million Million (a)
days/week Tons Tons In-County Out-of-County Total In-County Out-of-County Total Tons Cubic Yards
Sunshine Canyon City/County 19-AA-2000Los Angeles/
Unincorporated Area6 12,100 12,100 2.111 0.000 2.111 6,765 0 6,765 74.18 19 $83.54
Permitted Inert Landfills
Transformation Facilities
Commerce Refuse
To-Energy Facility
Southeast Resource
Recovery Facility
NOTES: Abbreviation:
LUP Land Use Permit
SWFP Solid Waste Facility Permit
CUP Conditional Use Permit
FOOTNOTES:
(a) Conversion factor based on in-place solid waste density is provided by landfill operators, otherwise a conversion factor of 1,200 lb/cy was used for Class III landfills.(b) Remaing Life is based on either the 2018 average daily disposal tonnage, maximum permitted capacity, or the facility's permit expiration date.(c) Based on the Solid Waste Facility Permit limit of 2,800 tons per week, expressed as a daily average, seven days per week.(d) Based on EPA limit of 500,000 tons per year, expressed as a daily average, seven days per week.(e) Tonnage expressed as a daily average, seven days per week.
Source: Los Angeles County Department of Public Works
---
Available Average Daily Capacity (tpd)
By Court Order, on October 2, 1996, the California Regional Water Quality ControlBoard-Los Angeles region ordered the Azusa Land Reclamation Landfill to stopaccepting Municipal Solid Waste.
213 46.17
1,148 28
57.72
57.72 46.179360.292
163.39 --194.3522,549 --5.121
Antelope Valley 1,636
1. Disposal quantities are based on actual tonnages reported by owners/operators of permitted solid waste disposal facilities to the Los Angeles County Department of Public Works' Solid Waste Information Management System (www.LACountySWIMS.org.)
7
0.403
Whittier (Savage Canyon) 19-AH-0001
0.367
0.000
---Whittier 6
---
37
0
0.045
2 0.0004
0.091
1,65619-AA-5624 Palmdale 0.5106The City of Palmdale approved the expansion and combined Antelope Valley Landfills#1 & #2 on September 19, 2011.
985
102
22
35
11Limited to the Calabasas Wasteshed as defined by Los Angeles County Ordinance No.91-0003.
Limited to the City of Burbank use only.
$67.57
$45.25
$52.32
2.26 4.120.032
0.318
102
13.64
4.91
10.23
0.05 0.05
11.07
370
4,9041.530
4
12
4,560
367
12 0
1,021
0.004
0.116
59.75
(See Note 2)
0.006
Estimated Remaining Permitted
0.517 12.0020
Maximum Daily
Capacity
2018 Average Daily Disposal
(Million Tons)
1,800 1,800
tpd-6
16.00
Capacity (as of December 31, 2018)
7
3,000 0.0010.1145,100
SWFP
10,000
6
49
6,616 ('17-'24)3,411 ('25-'47)
49
19-AA-0012
19-AA-0040
19-AA-0056
19-AA-0063
19-AA-0052
Burbank
Unincorporated Area
Burbank
Calabasas
19-AA-0050
19-AA-0061
Unincorporated Area
Unincorporated Area
Unincorporated Area
Glendale/Unincorporated Area
Scholl Canyon
Pebbly Beach
Lancaster
San Clemente Island
Chiquita Canyon
San Clemente
6
0 290
1,292
0 1
3,400
350
0.000---9.6 1
0.091
LUP expires July 29, 2028.
Landfill owned and operated by the U.S. Navy.
39
23
10
0.0004
0.004 0.000
$68.0060.29
$71.18-$73.72
$139.58
NotAvailable
0.036
4.58 7.63
4.29
0.29
0.403
178
Limited to use by City of Whittier and waste haulers contracted with the City of Whittier.
213
1,148
290
404 16,414
249
1,292
65.27
$53.83
$47.32
$88.00
Limited to the Scholl Canyon Wasteshed as defined by City of Glendale Ordinance No.4780.
0.372
16,011
0.358
$75.00
0.000
TOTAL 4.99534,449
14
117.08
Long Beach
AzusaAzusa Land Reclamation 19-AA-0013
---
6,500 0.0666
7 0.328
---
0.04419-AK-0083 2,240
37
1,192
0.126
2018 ANNUAL REPORT
LOS ANGELES COUNTY COUNTYWIDE INTEGRATED WASTE MANAGEMENT PLAN
APPENDIX E-2 TABLE 4REMAINING PERMITTED DISPOSAL CAPACITY OF EXISTING SOLID WASTE DISPOSAL FACILITIES IN LOS ANGELES COUNTY
(See Note 1)(See Note 1)
345
0
35
1.423
--- 0.032
0.307
0.000
6
240
3,500 0.011
6
5
0.108
3,500
1,3000.416--- (e)3,240TOTAL 0.050 1,478
19-AA-0506 Commerce 1,000 ---
1,051
0.039
141
2860.006
Average daily disposal quantities are based on 312 days (6 days per week, average)
Years
1,770
Water Quality Control Board, and the South Coast Air Quality Management District.
Out-of-County Disposal Los Angeles County Waste Exported in 2018 to Out-of-County Class III Disposal Facilities = 5,120,871 tons or 16,413 tpd-6
TOTAL 0.292 9360.3580.0666,500
2. Estimated Remaining Permitted Capacity is based on landfill owner/operator's response in a written survey conducted by Los Angeles County Department of Public Works in June 2019 as well as site-specific permit criteria established by local land use agencies, Local Enforcement Agencies, CalRecycle,
---
1,370 (d)
400 (c)

(cubic yards)3 (tpd)3(cubic yards) (tpd) (cubic yards) (tons)
Durbin Landfill 19-AA-1111 Irwindale 5 3,840 4,800 2,471 3,089 770,951 963,689
Hanson Aggregates West, Inc.4 19-AA-0044 Irwindale 6 3,205 4,006 N/A N/A N/A N/A
Manning Pit5 N/A6 Irwindale N/A N/A N/A N/A N/A N/A N/A
Montebello Land & Water Co. 19-AA-0019 Montebello 5 1 1 0.80 1 249 311
North Kincaid Pit5 N/A Irwindale N/A N/A N/A N/A N/A N/A N/A
Nu-Way Arrow Reclamation 19-AA-1074 Irwindale 6 6,923 8,654 1,621 2,026 505,666 632,083
Peck Road Gravel Pit6 19-AA-0838 Monrovia 7 3,200 4,000 528 660 164,785 205,981
Reliance Pit II Inert Debris Engineered
Fill Site19-AA-0854 Irwindale 5 6,729 8,412 140 175 43,740 54,675
Sun Valley Landfill 19-AR-1160 Sun Valley 5 1,458 1,823 1,928 2,411 601,673 752,091
United Rock Products Pit #2 19-AA-0046 Irwindale 6 3,077 3,846 926 1,157 288,795 360,994
TOTAL 28,433 35,541 7,615 9,519 2,375,858 2,969,823
NOTES:
1. Disposal quantities for 2018 are based on actual tonnages reported by owners/operators through the Solid Waste Management Fee invoice receipt.
2. Conversion factor based on in-place solid waste density if provided by landfill operators, otherwise a conversion factor of 2,500 lb/cy was used.
3. Derived from the permit values noted in the CalRecycle Website as of July 2018.
4. The facility has resumed its backfilling activities since February 2016.
5. Manning Pit and North Kincaid Pit are both unclassified as of December 31, 2018.
6. N/A means not available.
Source: Los Angeles County Department of Public Works
APPENDIX E-2 TABLE 5
LOS ANGELES COUNTY COUNTYWIDE INTEGRATED WASTE MANAGEMENT PLAN
2018 ANNUAL REPORT
2018 Average Daily Disposal1
2018 Annual Disposal2
Facility SWIS No. Location
Operation
days/week
Enforcement Agency Notification (EAN)
Maximum Daily Capacity
SUMMARY OF EXISTING INERT DEBRIS DISPOSAL SITES IN LOS ANGELES COUNTY (AS OF DECEMBER 31, 2018)

Mesquite Regional Landfill
Imperial County YES 210 miles —1 — 20,000 660 109 $105-$125 $1 (min)
8
County Sanitation District No. 2 of Los Angeles County
H.M. Holloway Landfill, Inc.
Kern County YES 156 miles 1,141.15 544 6 2,000 3 10 $20.00 --
Holloway Environmental, LLC.
Frank R. Bowerman Sanitary Landfill
Orange County7 NO 45 miles 7,593 2,470 6 11,500 104 34 $59.05 Varies
O.C. Waste and Recycling
Olinda Alpha Sanitary Landfill
Orange County NO 30 miles 6,858 2,761 6 8,000 16 7 $58.18 – Non-Contract Varies
O.C. Waste and Recycling $34.18 – Contract Rate
Prima Deshecha Sanitary Landfill
Orange County NO 60 miles 1,747 295 6 4,000 80 83 $58.18 —
O.C. Waste and Recycling
El Sobrante Landfill
Riverside County NO 60 miles 12,050 4,857 7 16,054 148 43 $35.91 $3.56
USA Waste Services of California, Inc.
Mid-Valley Sanitary Landfill
San Bernardino County NO 53 miles 3,616 1,752 6 7,500 37 14 $31.260 - $47.94 --
San Bernardino County Solid Waste Management Division
San Timoteo Sanitary Landfill
San Bernardino County NO 67 miles 906 457 6 2,000 7 24 $31.26 - $47.94 --
San Bernardino County Solid Waste Management Division
Simi Valley Landfill & Recycling Center
Ventura County NO 50 miles 4,087 2,522 7 6,000 50 54 $68.00 - $72.00 $5
Waste Management of California, Inc.
TOTAL 37,998 15,659 77,054
NOTES:
1. "—" data not provided or available.
2. Distance is measured from Downtown Los Angeles, California.3. Estimated quantity based on the data provided by the Counties in the Solid Waste Information Management System (SWIMS) and/or the Disposal Reporting System.4. Waste exported to other Out of County landfills accounts for another 754 tons per day. Total Waste exported in 2018 is approximately 16,413 tons per day.5. Estimated quantity provided by landfill operators in tons, otherwise a conversion factor of 1,200 lb/cy was used.
6. Tipping fees are based on current waste disposal fees provided by landfill operators.7. The County of Orange and the County Sanitation Districts (Districts) has extended the import waste agreement allowing the Districts to deliver solid waste to the County's disposal system to June 30, 2025.8. Amount based on Imperial County Host fees per facility operator.
Source: Los Angeles County Department of Public Works
Comments
H.M. Holloway currently has a contract with the Los Angeles CountySanitation Districts. Tipping Fees (per ton): $16 per ton for LACounty and $20 per/ton for other contracts.
7Not yet operational. Permitted to reserve up to 1,000 tpd ofavailable capacity for Imperial County. Up to 4,000 tpd may betransported by truck haul.
The County of Orange has three import waste agreements with wastehauling companies to import waste into Orange County.
Frank R. Bowerman, Olinda Alpha, and Prima Deshecha SanitaryLandfills have import waste agreements with waste haulingcompanies and County Sanitation Districts which will expire on June30, 2025.
Regular gate rate is $47.94 (additional $12 fee per ton for waste thathas not been pre-processed through recycling programs). LA Countywaste being delivered for disposal at the San Timoteo SanitaryLandfill through the import agreement with Athens Services is$31.26/ton for FY 2018-2019.
2018 ANNUAL REPORT
LOS ANGELES COUNTY COUNTYWIDE INTEGRATED WASTE MANAGEMENT PLAN
APPENDIX E-2 TABLE 6OUT-OF-COUNTY LANDFILLS CURRENTLY AVAILABLE FOR USE BY JURISDICTIONS IN LOS ANGELES COUNTY1
Facility
Location
Owner/Operator
Rail Access
Distance
from Los
Angeles
County2
2018 Average
Daily Disposal
Rate
(tpd-6)
Import
Surcharge
(per ton)
2018 Average
Disposal from Los
Angeles County3,4
(tpd-6)
Permitted
Operating
days/week
Permitted
Daily
Disposal
(tpd)
Remaining
Permitted
Disposal
Capacity
(million tons)5
Remaining
Design Life
(years)
Tipping
Fees6
(per ton)

YEAR POPULATION EMPLOYMENTREAL TAXABLE
SALESB-YRWG B-YNWG RAF NAF
TOTAL GENERATION
(TONS)
2018 10,347,600 4,504,100 $134,100,000,000 8,985,265 20,965,618 29,950,883
2019 10,404,900 4,589,800 $132,800,000,000 8,985,265 20,965,618 1.005101971 1.004666425 30,094,560
2020 10,452,000 4,637,000 $134,900,000,000 8,985,265 20,965,618 1.013912685 1.017736073 30,447,740
2021 10,514,800 4,611,700 $130,200,000,000 8,985,265 20,965,618 1.006780811 0.997403286 29,957,369
2022 10,577,800 4,636,700 $130,300,000,000 8,985,265 20,965,618 1.011399048 1.000551391 30,064,867
2023 10,641,300 4,685,000 $133,100,000,000 8,985,265 20,965,618 1.022368268 1.016353143 30,494,722
2024 10,705,200 4,724,100 $137,400,000,000 8,985,265 20,965,618 1.035642591 1.036726444 31,041,134
2025 10,769,400 4,764,600 $141,500,000,000 8,985,265 20,965,618 1.048636261 1.056509447 31,572,648
2026 10,834,000 4,805,500 $148,200,000,000 8,985,265 20,965,618 1.06651859 1.086031111 32,352,266
2027 10,899,000 4,845,300 $150,500,000,000 8,985,265 20,965,618 1.076156358 1.099024998 32,711,288
2028 10,964,400 4,884,700 $153,000,000,000 8,985,265 20,965,618 1.086164109 1.112720193 33,088,339
2029 11,030,200 4,923,600 $155,500,000,000 8,985,265 20,965,618 1.096163435 1.126359882 33,464,150
2030 11,096,400 4,964,400 $158,200,000,000 8,985,265 20,965,618 1.106660405 1.140956203 33,864,489
2031 11,160,700 5,007,400 $160,900,000,000 8,985,265 20,965,618 1.117187677 1.155796746 34,270,220
2032 11,225,500 5,050,500 $163,700,000,000 8,985,265 20,965,618 1.127931088 1.171021246 34,685,944
2033 11,290,600 5,094,200 $166,600,000,000 8,985,265 20,965,618 1.138908725 1.186685208 35,112,986
Population: Countywide Population Projection (UCLA, Long Term Forecast of Los Angeles County, June 2018)
Employment: Countywide Employment Projection (UCLA, Long Term Forecast of Los Angeles County, July 2018)
Employment data from UCLA only accounts for non-farm employment.
Real Taxable Sales: Countywide Taxable Sales (Source of information is UCLA, Long Term Forcast of Los Angeles County, July 2018).
Real Taxable Sales data from UCLA considers the real dollar value. (Real Taxable Sales)
B-Y RWG = Base Year Residential Waste Generation. Calculation based on California 2008 Statewide Waste Characterization Study. Single-family and multifamily
residential waste together account for 30 percent of the state's waste stream.
B-Y NWG = Base Year Non-Residential Waste Generation. Calculation based on California 2008 Statewide Waste Characterization Study (All other sources account
for 70 percent of the state's total waste stream).
RAF = Residential Adjustment Factor = {(PR/PB)+[ER/EB+(CB/CR*TR/TB)]/2}/2
NAF = Non-Residential Adjustment Factor = [ER/EB+(CB/CR*TR/TB)]/2
The Adjustment Methodology Formula as adopted by the CIWMB is expressed as follows:
Estimated Reporting Year Solid Waste Generation = {[(B-Y RWG) (RAF)] + [(B-Y NWG)(NAF)]}
PR= Reporting Year Population PB= Base Year Population
ER= Reporting Year Employment EB= Base Year Employment
CR= Reporting Year Consumer Price Index CB= Base Year Consumer Price Index
TR= Reporting Year Taxable Sales TB= Base Year Taxable Sales
Source: Los Angeles County Department of Public Works, June 2019
2018 ANNUAL REPORTLOS ANGELES COUNTY COUNTYWIDE INTEGRATED WASTE MANAGEMENT PLAN
APPENDIX E-2 TABLE 7POPULATION, EMPLOYMENT, REAL TAXABLE SALES, AND WASTE GENERATION IN LOS ANGELES COUNTY

A B C D E F G H I J
PROJECTED AVAILABLE CLASS III LANDFILL
TOTAL PERCENT TOTAL TRANSFORMATION & TRANSFORMATION DISPOSAL NEED
GENERATION DIVERSION DIVERSION CLASS III LANDFILL CAPACITY ANNUAL CUMULATIVE (YEAR'S END)
YEAR TONS (ASSUMED) TONS DISPOSAL (TONS) TONS TONS CUBIC YARDS TONS CUBIC YARDS
2018 29,950,883 65% 19,468,074 10,482,809 645,600 9,837,209 16,395,348 9,837,209 16,395,348
2019 30,094,560 65% 19,561,464 10,533,096 572,800 9,960,296 16,600,493 19,797,505 32,995,842
2020 30,447,740 65% 19,791,031 10,656,709 500,000 10,156,709 16,927,848 29,954,214 49,923,690
2021 29,957,369 65% 19,472,290 10,485,079 500,000 9,985,079 16,641,798 39,939,293 66,565,489
2022 30,064,867 65% 19,542,163 10,522,703 500,000 10,022,703 16,704,506 49,961,997 83,269,994
2023 30,494,722 65% 19,821,569 10,673,153 500,000 10,173,153 16,955,254 60,135,149 100,225,248
2024 31,041,134 65% 20,176,737 10,864,397 250,000 10,614,397 17,690,661 70,749,546 117,915,910
2025 31,572,648 65% 20,522,221 11,050,427 0 11,050,427 18,417,378 81,799,973 136,333,288
2026 32,352,266 65% 21,028,973 11,323,293 0 11,323,293 18,872,155 93,123,266 155,205,443
2027 32,711,288 65% 21,262,337 11,448,951 0 11,448,951 19,081,585 104,572,217 174,287,028
2028 33,088,339 65% 21,507,420 11,580,919 0 11,580,919 19,301,531 116,153,135 193,588,559
2029 33,464,150 65% 21,751,698 11,712,453 0 11,712,453 19,520,754 127,865,588 213,109,313
2030 33,864,489 65% 22,011,918 11,852,571 0 11,852,571 19,754,285 139,718,159 232,863,598
2031 34,270,220 65% 22,275,643 11,994,577 0 11,994,577 19,990,962 151,712,736 252,854,560
2032 34,685,944 65% 22,545,864 12,140,080 0 12,140,080 20,233,467 163,852,817 273,088,028
2033 35,112,986 65% 22,823,441 12,289,545 0 12,289,545 20,482,575 176,142,361 293,570,602
NOTES:
1.
2.
3.
4.
5.
Source: Los Angeles County Department of Public Works
2018 ANNUAL REPORT
LOS ANGELES COUNTY COUNTYWIDE INTEGRATED WASTE MANAGEMENT PLAN
APPENDIX E-2 TABLE 8LOS ANGELES COUNTY SOLID WASTE DISPOSAL CAPACITY NEED PROJECTION
Waste generation (Column B) is calculated using CalRecycle's Adjustment Methodology, utilizing employment, population, and taxable sales projections from UCLA Anderson Long-term Forecast (July 2018).
Columns H and J are based on Columns G and I, respectively, using an in-place waste density of 1,200 lb/cy.
Waste generation for 2018 is based on actual in-County and out-of-County transformation and Class III landfill disposal by jurisdictions in Los Angeles County. A 68 percent diversion rate is assumed for year 2019 and
increase up to 72% by year 2020. These tonnages DO NOT include inert waste disposed at permitted inert landfills.
The 2018 transformation and Class III landfill disposal quantity (first figure under Column E) is based on tonnages reported by permitted solid waste disposal facility operators in Los Angeles County and export quantities
reported by other counties to County of Los Angeles Department of Public Works as part of the 2018 Disposal Quantity Reporting data.The available transformation capacity is based on (1) EPA limit of 500,000 tons per year (expressed as a daily average, seven days per week) for Southeast Resource Recovery Facility (SERRF) and (2) the Solid Waste
Facility Permit limit of 2,800 tons per week (expressed as a daily average, seven days per week) for Commerce Refuse-to-Energy Facility (CREF). CREF is closed permanently as of June 26, 2018. SERRF is assumed to
cease its operation in June 2024.

2018 Annual Report Los Angeles County Countywide Integrated Waste Management Plan
[This Page Intentionally Left Blank]

2018 Annual Report Los Angeles County Countywide Integrated Waste Management Plan
APPENDIX E-3: DISPOSAL CAPACITY ANALYSIS SCENARIOS

• • Diversion Rate at 65% • No Utilization of Out-of-County Disposal Capacity
1 2 3 4 5 6 7 8 9 10 11
R R R R R Total
Year Waste Diversion Total Imports Daily Available Exports to Class III Antelope Burbank Calabasas Chiquita Lancaster Pebbly BeachSan Clemente Scholl Sunshine Whittier In-County Class III Class III Landfill
Generation Rate Daily from Capacity from Out-of-County Landfill Valley City/County (Savage Canyon) Landfill Available Daily Disposal
Rate1Disposal Other Transformation Landfills3
Daily Combined Capacity4 (tpd-6) Capacity
Demand Counties Facilities2 Disposal Maximum Permitted Daily Capacity (tpd-6) ------------- Shortfall
Demand Expected Average Daily Tonnage (tpd-6) Total In-County (Reserve)
Remaining Capacity at Year's End (Million Tons) Class III Landfill
Remaining Capacity
(million tons)
A B C=A(1-B) D E F G=C+D-E-F H I=G-H
(tpd-6) (tpd-6) (tpd-6) (tpd-6) (tpd-6) (tpd-6) (tpd-6) (tpd-6)
2018 95,996 65% 33,599 563 1,300 16,413 16,449 1,800 240 3,500 6,000 3,000 49 10 3,400 11,000 350 24,483 --
1,636 102 985 4,560 367 12 1 1,292 6,765 290
12.0 2.3 4.9 59.8 10.2 0.05 0.04 4.3 65.3 4.6 163
2019 96,457 65% 33,760 600 1,400 16,150 16,810 1,800 240 3,500 12,000 3,000 49 10 3,400 11,000 350 25,158 --
1,672 104 1,007 6,616 375 12 1 1,321 6,914 297
11.5 2.2 4.6 57.7 10.1 0.04 0.04 3.9 63.1 4.5 158
2020 97,589 65% 34,156 600 1,400 0 33,356 3,600 240 3,500 12,000 3,000 49 10 3,400 11,000 350 29,418 3,939
3,317 207 1,998 6,616 743 24 2 2,620 13,719 350
10.4 2.2 4.0 55.6 9.9 0.04 0.03 3.1 58.8 4.4 148
2021 96,017 65% 33,606 600 1,400 0 32,806 3,600 240 3,500 12,000 3,000 49 10 3,400 11,000 350 29,332 3,474
3,263 203 1,965 6,616 731 24 2 2,577 13,493 344 `
9.4 2.1 3.4 53.6 9.7 0.03 0.03 2.3 54.6 4.3 139
2022 96,362 65% 33,727 600 1,400 0 32,927 3,600 240 3,500 12,000 3,000 49 10 3,400 11,000 350 29,351 3,576
3,275 204 1,972 6,616 734 24 2 2,587 13,542 345
8.4 2.0 2.7 51.5 9.4 0.02 0.03 1.5 50.4 4.2 130
2023 97,739 65% 34,209 600 1,400 0 33,409 3,600 240 3,500 12,000 3,000 49 10 3,400 11,000 350 29,425 3,984
3,323 207 2,001 6,616 745 24 2 2,625 13,741 350
7.4 2.0 2.1 49.4 9.2 0.01 0.03 0.6 46.1 4.1 121
2024 99,491 65% 34,822 600 700 0 34,722 3,600 240 3,500 12,000 3,000 49 10 3,400 11,000 350 29,616 5,106
3,453 215 2,080 6,616 774 25 2 2,728 14,281 350
6.3 1.9 1.5 47.4 9.0 0.01 0.03 CC 41.7 3.9 112
2025 101,194 65% 35,418 600 0 0 36,018 3,600 240 3,500 12,000 3,000 49 10 11,000 350 23,769 12,249
3,582 223 2,158 3,411 803 26 1 14,814 350
5.2 1.8 0.8 46.3 8.7 CC 0.04 37.0 3.8 104
2026 103,693 65% 36,293 600 0 0 36,893 3,600 240 3,500 12,000 3,000 10 11,000 350 23,801 13,092
3,600 229 2,210 3,411 822 1 15,174 350
4.1 1.8 0.1 45.2 8.4 0.03 32.3 3.7 96
2027 104,844 65% 36,695 600 0 0 37,295 3,600 240 3,500 12,000 3,000 10 11,000 350 23,827 13,468
3,600 231 2,234 3,411 831 1 15,339 350
2.9 1.7 CC 44.2 8.2 0.03 27.5 3.6 88
2028 106,052 65% 37,118 600 0 0 37,718 3,600 240 12,000 3,000 10 11,000 350 21,596 16,122
3,600 234 3,411 841 1 11,000 350
1.8 1.6 43.1 7.9 CP 0.03 24.1 3.5 82
2029 107,257 65% 37,540 600 0 0 38,140 3,600 240 12,000 3,000 10 11,000 350 21,598 16,541
3,600 236 3,411 850 1 11,000 350
0.7 1.5 CP 42.0 7.7 0.03 20.7 3.4 76
2030 108,540 65% 37,989 600 0 0 38,589 3,600 240 12,000 3,000 10 11,000 350 21,601 16,988
3,642 239 3,411 860 1 11,000 350
CC 1.5 41.0 7.4 0.03 17.2 3.3 70
2031 109,840 65% 38,444 600 0 0 39,044 240 12,000 3,000 10 11,000 350 18,004 21,040
242 3,411 870 1 11,000 350
1.4 39.9 7.1 0.03 13.8 3.2 65
2032 111,173 65% 38,911 600 0 0 39,511 240 12,000 3,000 10 11,000 350 18,007 21,504
245 3,411 881 1 11,000 350
1.3 38.9 6.8 0.03 10.4 3.1 60
2033 112,542 65% 39,390 600 0 0 39,990 240 12,000 3,000 10 11,000 350 18,010 21,980
248 3,411 891 1 11,000 350
1.2 37.8 6.6 0.03 6.9 3.0 56
ASSUMPTIONS:
1. Waste Generation is estimated using CalRecycle's Adjustment Methodology, utilizing population projection, employment and real taxable sales projections from UCLA's Longterm Forecast, July 2017.
2. Daily Available Capacity from Transfomation Facilities assume Southeast Resource Recovery Facility will cease its operation on June 2024. Commerce Refuse to Energy Facility ceased its operation on June 2018.
3.
4.
expected average daily tonnage is based on the limits set on the new conditional use permit and therefore used to calculate the Total In-County Class III landfill Available Capacity.
5. This scenario also considers the effect of Assembly Bill 1594 that removes diversion credit from green waste used as alternative daily cover (ADC) at landfills.
LEGEND:
CC/CP
E
R
W/WE
Source: Los Angeles County Department of Public Works
The scenario assumes utilization of in-County disposal capacity only. A "Clean Hands Waiver (W)" was granted to Chiquita Canyon Landfill on March 17, 2016 to continue its operation while processing the landfill's new conditional use permit. On July 25, 2017, the Board of Supervisorsapproved a new Conditional Use Permit for the Landfill’s Expansion Project.
2018 ANNUAL REPORT
LOS ANGELES COUNTY COUNTYWIDE INTEGRATED WASTE MANAGEMENT PLAN
APPENDIX E-3SCENARIO I - UTILIZATION OF EXISTING IN-COUNTY DISPOSAL CAPACITY ONLY
Existing In-County Class III Landfills and Transformation Facilities
IN-COUNTY CLASS III LANDFILLS3
DISPOSAL CAPACITY NEED ANALYSIS (EXCLUDING INERT WASTE LANDFILLS)
Total In-County Class III Landfill Available Capacity is calculated based on Maximum Permitted Daily Capacity (in blue text) for facilities without a restricted wasteshed or Expected Average Daily Tonnage for facilities with a restricted wasteshed (R). Chiquita Canyon Landfill's
- Closure due to exhausted capacity (CC) or permit expiration (CP)
- Expansion may become effective
- Restricted wasteshed
- Clean Hands Waiver (Waiver) or Waiver expiration

• • Diversion Rate at 65% • Exports based on Existing Export Agreements
1 2 3 4 5 6 7 8 9 10 11
R R R R R Total
Year Waste Diversion Total Imports Daily Available Exports to Class III Antelope Burbank Calabasas Chiquita Lancaster Pebbly BeachSan Clemente Scholl Sunshine Whittier In-County Class III Class III Landfill
Generation Rate Daily from Capacity from Out-of-County Landfill Valley City/County (Savage Canyon) Landfill Available Daily Disposal
Rate1Disposal Other Transformation Landfills Daily Combined Capacity3 (tpd-6) Capacity
Demand Counties Facilities2 Disposal Maximum Permitted Daily Capacity (tpd-6) ------------- Shortfall
Demand Expected Average Daily Tonnage (tpd-6) Total In-County (Reserve)
Remaining Capacity at Year's End (Million Tons) Class III Landfill
Remaining Capacity
(million tons)
A B C=A(1-B) D E F G=C+D-E-F H I=G-H
(tpd-6) (tpd-6) (tpd-6) (tpd-6) (tpd-6) (tpd-6) (tpd-6) (tpd-6)
2018 95,996 65% 33,599 563 1,300 16,413 16,449 1,800 240 3,500 6,000 3,000 49 10 3,400 11,000 350 24,483 --
1,636 102 985 4,560 367 12 1 1,292 6,765 290
12.0 2.3 4.9 59.8 10.2 0.05 0.04 4.3 65.3 4.6 163
2019 96,457 65% 33,760 600 1,400 16,462 16,498 1,800 240 3,500 12,000 3,000 49 10 3,400 11,000 350 25,107 --
1,641 102 988 6,616 368 12 1.14 1,296 6,786 291
11.5 2.2 4.6 57.7 10.1 0.04 0.04 3.9 63.2 4.5 158
2020 97,589 65% 34,156 600 1,400 16,660 16,696 3,600 240 3,500 12,000 3,000 49 10 3,400 11,000 350 26,939 (10,243)
1,661 103 1,000 6,616 372 12 1.16 1,312 6,867 295
11.0 2.2 4.3 55.6 10.0 0.04 0.03 3.5 61.0 4.4 152
2021 96,017 65% 33,606 600 1,400 16,385 16,421 3,600 240 3,500 12,000 3,000 49 10 3,400 11,000 350 26,894 (10,473)
1,633 102 984 6,616 366 12 1.14 1,290 6,754 290 `
10.5 2.2 4.0 53.6 9.9 0.04 0.03 3.1 58.9 4.3 146
2022 96,362 65% 33,727 600 1,400 16,445 16,481 3,600 240 3,500 12,000 3,000 49 10 3,400 11,000 350 26,904 (10,423)
1,639 102 987 6,616 367 12 1.14 1,295 6,779 291
10.0 2.1 3.7 51.5 9.8 0.03 0.03 2.7 56.8 4.2 141
2023 97,739 65% 34,209 600 1,400 16,686 16,723 3,600 240 3,500 12,000 3,000 49 10 3,400 11,000 350 26,943 (10,221)
1,663 104 1,002 6,616 373 12 1.16 1,314 6,878 295
9.4 2.1 3.4 49.4 9.7 0.03 0.03 2.3 54.6 4.1 135
2024 99,491 65% 34,822 600 700 17,342 17,380 3,600 240 3,500 12,000 3,000 49 10 3,400 11,000 350 27,051 (9,671)
1,729 108 1,041 6,616 387 12 1.20 1,365 7,148 307
8.9 2.1 3.0 47.4 9.5 0.02 0.03 1.8 52.4 4.0 129
2025 101,194 65% 35,418 600 0 17,989 18,029 3,600 240 3,500 12,000 3,000 49 10 3,400 11,000 350 23,951 (5,923)
1,793 112 1,080 3,411 402 13 1.25 1,416 7,415 318
8.3 2.0 2.7 46.3 9.4 0.02 0.03 1.4 50.1 3.9 124
2026 103,693 65% 36,293 600 0 18,426 18,467 3,600 240 3,500 12,000 3,000 49 10 3,400 11,000 350 24,023 (5,556)
1,837 114 1,106 3,411 412 13 1.28 1,451 7,595 326
7.8 2.0 2.4 45.2 9.3 0.02 0.03 0.9 47.7 3.8 119
2027 104,844 65% 36,695 600 0 18,627 18,668 3,600 240 3,500 12,000 3,000 49 10 3,400 11,000 350 24,056 (5,388)
1,857 116 1,118 3,411 416 13 1.29 1,467 7,678 330
7.2 2.0 2.0 44.2 9.2 0.01 0.03 0.5 45.3 3.7 114
2028 106,052 65% 37,118 600 0 18,838 18,880 3,600 240 3,500 12,000 3,000 49 10 3,400 11,000 350 24,090 (5,210)
1,878 117 1,131 3,411 421 14 1.31 1,483 7,765 333
6.6 1.9 1.7 43.1 9.0 CP 0.03 0.02 42.9 3.6 109
2029 107,257 65% 37,540 600 0 19,049 19,091 3,600 240 3,500 12,000 3,000 10 3,400 11,000 350 24,111 (5,020)
1,899 118 1,144 3,411 425 1.32 1,500 7,852 337
6.0 1.9 CP 42.0 8.9 0.03 CC 40.5 3.5 103
2030 108,540 65% 37,989 600 0 19,273 19,316 3,600 240 12,000 3,000 10 11,000 350 21,473 (2,157)
1,921 120 3,411 430 1.34 7,944 341
5.4 1.9 41.0 8.8 0.03 38.0 3.4 98
2031 109,840 65% 38,444 600 0 19,501 19,544 3,600 240 12,000 3,000 10 11,000 350 21,478 (1,935)
1,944 121 3,411 436 1.35 8,038 345
4.8 1.8 39.9 8.6 0.03 35.5 3.3 94
2032 111,173 65% 38,911 600 0 19,733 19,777 3,600 240 12,000 3,000 10 11,000 350 21,484 (1,707)
1,967 123 3,411 441 1.37 8,134 349
4.2 1.8 38.9 8.5 CP 32.9 3.2 89
2033 112,542 65% 39,390 600 0 19,973 20,017 3,600 240 12,000 3,000 11,000 350 21,485 (1,468)
1,991 124 3,411 446 8,233 350
3.6 1.7 37.8 8.3 30.4 3.1 85
ASSUMPTIONS:
1. Waste Generation is estimated using CalRecycle's Adjustment Methodology, utilizing population projection, employment and real taxable sales projections from UCLA's Longterm Forecast, July 2017.
2. Daily Available Capacity from Transfomation Facilities assume Southeast Resource Recovery Facility will cease its operation on June 2024. Commerce Refuse to Energy Facility ceased its operation on June 2018.
3. Total In-County Class III Landfill Available Capacity is calculated based on Maximum Permitted Daily Capacity (in blue text) for facilities without a restricted wasteshed or Expected Average Daily Tonnage for facilities with a restricted wasteshed (R). A "Clean Hands Waiver" was granted to
average daily tonnage is based on the limits set on the new conditional use permit and therefore used to calculate the Total In-County Class III landfill Available Capacity.
4. This scenario also considers the effect of Assembly Bill 1594 that removes diversion credit from green waste used as alternative daily cover (ADC) at landfills.
LEGEND:
CC/CP
E
R
W/WE
Source: Los Angeles County Department of Public Works
- Expansion may become effective
- Restricted wasteshed
- Clean Hands Waiver (Waiver) or Waiver expiration.
2018 ANNUAL REPORT
LOS ANGELES COUNTY COUNTYWIDE INTEGRATED WASTE MANAGEMENT PLAN
APPENDIX E-3SCENARIO II - STATUS QUO
Existing In-County Class III Landfills and Transformation Facilities
IN-COUNTY CLASS III LANDFILLS
DISPOSAL CAPACITY NEED ANALYSIS (EXCLUDING INERT WASTE LANDFILLS)
Chiquita Canyon Landfill on March 17, 2016 to continue its operation while processing the landfill's new conditional use permit. On July 25, 2017, the Board of Supervisors approved a new Conditional Use Permit for the Landfill’s Expansion Project. Chiquita Canyon Landfill's expected
- Closure due to exhausted capacity (CC) or permit expiration (CP)

• • Diversion Rate (83% by 2020) • Exports based on Existing Export Agreements
1 2 3 4 5 6 7 8 9 10 11
R R R R R Total
Year Waste Diversion Total Per Capita Imports Daily Available Exports to Class III Antelope Burbank Calabasas Chiquita Lancaster Pebbly BeachSan Clemente Scholl Sunshine Whittier In-County Class III Class III Landfill
Generation Rate Daily Disposal from Capacity from Out-of-County Landfill Valley City/County (Savage Canyon) Landfill Available Daily Disposal
Rate1Disposal Rate Other Transformation Landfills Daily Combined Capacity4 (tpd-6) Capacity
Demand2Based on Counties Facilities3
Disposal Maximum Permitted Daily Capacity (tpd-6) ------------- Shortfall
CalRecycle's Demand Expected Average Daily Tonnage (tpd-6) Total In-County (Reserve)
Remaining Capacity at Year's End (Million Tons) Class III Landfill
Remaining Capacity
Adjusted Adjusted Target = 2.7 (million tons)
A B C=A(1-B) D E F G H=C+-E-F-G I J=H-I
(tpd-6) (tpd-6) (tpd-6) (tpd-6) (tpd-6) (tpd-6) (tpd-6) (tpd-6)
2018 95,996 65% 33,599 -- 563 1,300 16,413 16,449 1,800 240 3,500 6,000 3,000 49 10 3,400 11,000 350 24,542 --
1,569 104 1,090 4,588 438 11 1 1,254 6,469 280
12.0 2.3 4.9 59.8 10.2 0.0 0.04 4.3 65.3 4.6 163
2019 96,457 74% 25,038 -- 600 1,400 12,106 12,132 1,800 240 3,500 12,000 3,000 49 10 3,400 11,000 350 24,438 --
1,157 77 804 6,616 323 8 1 925 4,771 207
11.6 2.2 4.7 57.7 10.1 0.04 0.04 4.0 63.8 4.5 159
2020 97,589 83% 16,507 2.70 600 1,400 7,845 7,862 3,600 240 3,500 12,000 3,000 49 10 3,400 11,000 350 25,526 (17,664)
750 50 521 6,616 209 5 1 600 3,092 134
11.4 2.2 4.5 55.6 10.1 0.04 0.04 3.8 62.8 4.5 155
2021 96,017 83% 16,606 2.70 600 1,400 7,894 7,912 3,600 240 3,500 12,000 3,000 49 10 3,400 11,000 350 25,535 (17,623)
755 50 524 6,616 211 5 1 603 3,112 135 `
11.2 2.2 4.3 53.6 10.0 0.04 0.03 3.6 61.8 4.4 151
2022 96,362 83% 16,706 2.70 600 1,400 7,944 7,962 3,600 240 3,500 12,000 3,000 49 10 3,400 11,000 350 25,543 (17,581)
759 50 528 6,616 212 5 1 607 3,131 136
10.9 2.2 4.2 51.5 9.9 0.04 0.03 3.4 60.9 4.4 148
2023 97,739 83% 16,806 2.70 600 1,400 7,994 8,012 3,600 240 3,500 12,000 3,000 49 10 3,400 11,000 350 25,551 (17,539)
764 51 531 6,616 213 6 1 611 3,151 137
10.7 2.2 4.0 49.4 9.9 0.04 0.03 3.3 59.9 4.3 144
2024 99,491 83% 16,907 2.70 600 700 8,394 8,413 3,600 240 3,500 12,000 3,000 49 10 3,400 11,000 350 25,618 (17,205)
802 53 558 6,616 224 6 1 642 3,309 143
10.4 2.2 3.8 47.4 9.8 0.04 0.03 3.1 58.9 4.3 140
2025 101,194 83% 17,008 2.70 600 0 8,794 8,814 3,600 240 3,500 12,000 3,000 49 10 3,400 11,000 350 22,480 (13,666)
841 56 584 3,411 235 6 1 672 3,466 150
10.2 2.1 3.6 46.3 9.7 0.03 0.03 2.8 57.8 4.3 137
2026 103,693 83% 17,110 2.70 600 0 8,845 8,865 3,600 240 3,500 12,000 3,000 49 10 3,400 11,000 350 22,489 (13,624)
845 56 588 3,411 236 6 1 676 3,486 151
9.9 2.1 3.5 45.2 9.7 0.03 0.03 2.6 56.7 4.2 134
2027 104,844 84% 17,213 2.70 600 0 8,897 8,916 3,600 240 3,500 12,000 3,000 49 10 3,400 11,000 350 22,497 (13,581)
850 56 591 3,411 237 6 1 680 3,507 152
9.7 2.1 3.3 44.2 9.6 0.03 0.03 2.4 55.6 4.2 131
2028 106,052 84% 17,316 2.70 600 0 8,948 8,968 3,600 240 3,500 12,000 3,000 49 10 3,400 11,000 350 22,506 (13,538)
855 57 594 3,411 239 6 1 684 3,527 153
9.4 2.1 3.1 43.1 9.5 CP 0.03 2.2 54.5 4.1 128
2029 107,257 84% 17,420 2.70 600 0 9,000 9,020 3,600 240 3,500 12,000 3,000 10 3,400 11,000 350 22,508 (13,488)
860 57 598 3,411 240 1 688 3,547 154
9.1 2.1 CP 42.0 9.4 0.03 2.0 53.4 4.1 122
2030 108,540 84% 17,525 2.70 600 0 9,052 9,072 3,600 240 12,000 3,000 10 3,400 11,000 350 21,916 (12,843)
865 57 3,411 241 1 692 3,568 155
8.8 2.1 41.0 9.4 0.03 1.8 52.3 4.0 119
2031 109,840 84% 17,626 2.70 600 0 9,103 9,123 3,600 240 12,000 3,000 10 3,400 11,000 350 21,921 (12,797)
870 58 3,411 243 1 696 3,588 156
8.6 2.0 39.9 9.3 0.03 1.6 51.2 4.0 117
2032 111,173 84% 17,729 2.70 600 0 9,154 9,174 3,600 240 12,000 3,000 10 3,400 11,000 350 21,926 (12,751)
875 58 3,411 244 1 700 3,608 156
8.3 2.0 38.9 9.2 CP 1.3 50.0 3.9 114
2033 112,542 84% 17,832 2.70 600 0 9,206 9,226 3,600 240 12,000 3,000 3,400 11,000 350 21,930 (12,704)
880 58 3,411 246 704 3,628 157
8.0 2.0 37.8 9.1 1.1 48.9 3.9 111
ASSUMPTIONS/NOTES:
1. Waste Generation is estimated using CalRecycle's Adjustment Methodology, utilizing population projection, employment and real taxable sales projections from UCLA's Longterm Forecast, July 2017.
2. The Total Daily Disposal Demand for the years 2017 - 2019 (Column C) is determined based on the daily solid waste generation rate and the assumed diversion rates for the scenario. However, for the purposes of this scenario, the total daily disposal demand for the years 2020 - 2032 is adjusted using
CalRecycle's statewide disposal target of 2.7 pounds per person per day (PPD). As a result, the diversion rate is assumed to increase from 65% (as shown in other scenarios) to 83% by 2020.
3. Daily Available Capacity from Transfomation Facilities assume Southeast Resource Recovery Facility will cease its operation on June 2024. Commerce Refuse to Energy Facility ceased its operation on June 2018.
4. Total In-County Class III Landfill Available Capacity is calculated based on Maximum Permitted Daily Capacity (in blue text) for facilities without a restricted wasteshed or Expected Average Daily Tonnage for facilities with a restricted wasteshed (R). A "Clean Hands Waiver" was granted to
Chiquita Canyon Landfill on March 17, 2016 to continue its operation while processing the landfill's new conditional use permit. On July 25, 2017, the Board of Supervisors approved a new Conditional Use Permit for the Landfill’s Expansion Project. Chiquita Canyon Landfill's expected average daily tonnage
is based on the limits set on the new conditional use permit and therefore used to calculate the Total In-County Class III landfill Available Capacity.
5. This scenario also considers the effect of Assembly Bill 1594 that removes diversion credit from green waste used as alternative daily cover (ADC) at landfills.
LEGEND:
CC/CP
E
R
W/WE
Source: Los Angeles County Department of Public Works
IN-COUNTY CLASS III LANDFILLS
DISPOSAL CAPACITY NEED ANALYSIS (EXCLUDING INERT WASTE LANDFILLS)
2018 ANNUAL REPORT
LOS ANGELES COUNTY COUNTYWIDE INTEGRATED WASTE MANAGEMENT PLAN
APPENDIX E-3SCENARIO III - MEETING CALRECYCLE'S STATEWIDE DISPOSAL TARGET OF 2.7 PPD
Existing In-County Class III Landfills and Transformation Facilities
- Closure due to exhausted capacity (CC) or permit expiration (CP)
- Expansion may become effective
- Restricted wasteshed
- Clean Hands Waiver (Waiver) or Waiver expiration.

• • Diversion Rate (74% by 2020) • Exports based on Existing Export Agreements
1 2 3 4 5 6 7 8 9 10 11
R R R R R Total
Year Total Total Total Total Organic % of Imports Daily Available Exports to Class III Antelope Burbank Calabasas Chiquita Lancaster Pebbly Beach San Clemente Scholl Sunshine Whittier In-County Class III Class III Landfill
Solid Waste Solid Waste Solid Waste Solid Waste Waste Disposed from Capacity from Out-of-County Landfill Valley City/County (Savage Canyon) Landfill Available Daily Disposal
Generation Diversion Diversion Daily Disposal Organic Waste Other Transformation Landfills Daily Combined Capacity7 (tpd-6) Capacity
Rate1 Rate2 Tonnage3Disposal Tonnage5
in Counties Facilities6Disposal ------------- Shortfall
Demand4Total Solid Demand Total In-County (Reserve)
Waste Disposal Class III Landfill
Demand Remaining Capacity
(million tons)
A C=A*B D=A(1-B) E F=E/D G H I J=D+G-H-I K L=J-K
(tpd-6) (tpd-6) (tpd-6) (tpd-6) (tpd-6) (tpd-6) (tpd-6) (tpd-6) (tpd-6) (tpd-6)
2014 70,170 60% 42,102 28,068 11,311 40% -- -- -- -- -- -- -- -- -- -- -- -- -- -- -- --
2018 95,996 65% 62,398 33,599 13,552 40% 563 1,300 16,413 16,449 1,800 240 3,500 6,000 3,000 49 10 3,400 11,000 350 24,542 --
1,569 104 1,090 4,588 438 11 2.00 1,254 6,469 280
12.0 2.3 4.9 59.8 10.2 0.05 0.04 4.3 65.3 4.6 163
2019 96,457 69% 66,948 29,509 9,360 32% 600 1,400 14,339 14,370 1,800 240 3,500 12,000 3,000 49 10 3,400 11,000 350 24,812 --
1,371 91 952 6,616 382 10 2 1,096 5,652 245
11.6 2.2 4.6 57.7 10.1 0.04 0.04 4.0 63.5 4.5 158
2020 97,589 74% 72,036 25,553 5,656 22% 600 1,400 12,363 12,390 3,600 240 3,500 12,000 3,000 49 10 3,400 11,000 350 26,282 (13,891)
50% 1,182 78 821 6,616 330 9 2 945 4,873 211
11.2 2.2 4.4 55.6 10.0 0.04 0.03 3.7 62.0 4.4 154
2021 96,017 74% 71,459 24,558 4989 20% 600 1,400 11,866 11,892 3,600 240 3,500 12,000 3,000 49 10 3,400 11,000 350 26,199 (14,307)
1,134 75 788 6,616 316 8 1 907 4,677 203
10.9 2.2 4.1 53.6 9.9 0.04 0.03 3.4 60.5 4.4 149
2022 96,362 75% 72,301 24,061 4,420 18% 600 1,400 11,617 11,643 3,600 240 3,500 12,000 3,000 49 10 3,400 11,000 350 26,157 (14,514)
1,110 74 772 6,616 310 8 1 888 4,579 198
10.5 2.2 3.9 51.5 9.8 0.04 0.03 3.1 59.1 4.3 144
2023 97,739 76% 73,929 23,811 3,882 16% 600 1,400 11,493 11,518 3,600 240 3,500 12,000 3,000 49 10 3,400 11,000 350 26,136 (14,618)
1,099 73 763 6,616 307 8 1 878 4,530 196
10.2 2.1 3.6 49.4 9.7 0.03 0.03 2.8 57.7 4.3 140
2024 99,491 76% 75,858 23,633 3,338 14% 600 700 11,753 11,779 3,600 240 3,500 12,000 3,000 49 10 3,400 11,000 350 26,180 (14,400)
1,123 75 781 6,616 313 8 1 898 4,633 201
9.8 2.1 3.4 47.4 9.6 0.03 0.03 2.5 56.2 4.2 135
2025 101,194 77% 77,715 23,479 2,828 12% 600 0 12,026 12,053 3,600 240 3,500 12,000 3,000 49 10 3,400 11,000 350 23,020 (10,968)
75% 1,150 76 799 3,411 321 8 1 919 4,740 205
9.5 2.1 3.1 46.3 9.5 0.03 0.03 2.3 54.8 4.1 132
2026 103,693 77% 79,693 24,001 2,828 12% 600 0 12,287 12,314 3,600 240 3,500 12,000 3,000 49 10 3,400 11,000 350 23,064 (10,750)
1,174 78 816 3,411 328 8 1 939 4,843 210
9.1 2.1 2.9 45.2 9.4 0.03 0.03 2.0 53.3 4.1 128
2027 104,844 77% 80,577 24,267 2,854 12% 600 0 12,420 12,447 3,600 240 3,500 12,000 3,000 49 10 3,400 11,000 350 23,086 (10,639)
1,187 79 825 3,411 331 9 2 949 4,895 212
8.7 2.0 2.6 44.2 9.3 0.02 0.03 1.7 51.7 4.0 124
2028 106,052 77% 81,505 24,547 2,881 12% 600 0 12,560 12,588 3,600 240 3,500 12,000 3,000 49 10 3,400 11,000 350 23,110 (10,522)
1,201 80 834 3,411 335 9 2 960 4,950 215
8.3 2.0 2.4 43.1 9.2 CP 0.03 1.4 50.2 3.9 121
2029 107,257 77% 82,431 24,826 2,908 12% 600 0 12,699 12,727 3,600 240 3,500 12,000 3,000 10 3,400 11,000 350 23,124 (10,397)
1,214 81 843 3,411 339 2 971 5,005 217
8.0 2.0 CP 42.0 9.1 0.03 CC 48.6 3.9 114
2030 108,540 77% 83,417 25,123 2,937 12% 600 0 12,847 12,876 3,600 240 12,000 3,000 10 11,000 350 21,314 (8,438)
1,228 82 3,411 343 2 5,064 219
7.6 2.0 41.0 9.0 0.03 47.0 3.8 110
2031 109,840 77% 84,416 25,424 2,966 12% 600 0 12,998 13,026 3,600 240 12,000 3,000 10 11,000 350 21,317 (8,291)
1,242 82 3,411 347 2 5,123 222
7.2 1.9 39.9 8.9 0.03 45.4 3.7 107
2032 111,173 77% 85,440 25,733 2,996 12% 600 0 13,152 13,181 3,600 240 12,000 3,000 10 11,000 350 21,321 (8,140)
1,257 83 3,411 351 2 5,184 225
6.8 1.9 38.9 8.8 CP 43.8 3.7 104
2033 112,542 77% 86,492 26,050 3,027 12% 600 0 13,310 13,339 3,600 240 12,000 3,000 11,000 350 21,323 (7,983)
1,272 84 3,411 355 5,246 227
6.4 1.9 37.8 8.7 42.2 3.6 101
`
ASSUMPTIONS:
1. Waste Generation is estimated using CalRecycle's Adjustment Methodology, utilizing population projection, employment and real taxable sales projections from UCLA's Longterm Forecast, July 2017.
2. Total Solid Waste Diversion Rate for the years 2019-2033 reflects the impact of diverting the amount of additional organics from disposal.
3. Total Soild Waste Diversion Tonnage for the years 2019-2033 is calculated to reflect the amount of additional organics being diverted in order to meet the organic waste disposal reduction target of Senate Bill 1383. (Source: Countywide Organic Waste Management Plan, 2018 Annual Report)
4. Total Solid Waste Daily Disposal Demand for the years 2019-2033 is calculated to reflect the amount of additional organics being diverted in order to meet the organic waste disposal reduction targets of Senate Bill 1383. (Source: Countywide Organic Waste Management Plan, 2018 Annual Report)
5. The amount of Organic Waste Disposal Tonnage is calculated using the organic waste disposal reduction targets of Senate Bill 1383. (Source: Countywide Organic Waste Management Plan, 2018 Annual Report)
6. Daily Available Capacity from Transfomation Facilities assume Southeast Resource Recovery Facility will cease its operation on June 2024. Commerce Refuse to Energy Facility ceased its operation on June 2018.
7.
Total In-County Class III landfill Available Capacity.
8.
LEGEND:
CC/CP
E
R
W/WE
Source: Los Angeles County Department of Public Works
2018 ANNUAL REPORT
LOS ANGELES COUNTY COUNTYWIDE INTEGRATED WASTE MANAGEMENT PLAN
APPENDIX E-3SCENARIO IV - MEETING SENATE BILL 1383 ORGANIC WASTE DISPSOSAL REDUCTION TARGETS
Existing In-County Class III Landfills & Transformation Facilities
DISPOSAL CAPACITY NEED ANALYSIS (EXCLUDING INERT WASTE LANDFILLS)
Maximum Permitted Daily Capacity (tpd-6)
Expected Average Daily Tonnage (tpd-6)
Remaining Capacity at Year's End (Million Tons)
Generation Diversion DisposalIN-COUNTY CLASS III LANDFILLS
- Closure due to exhausted capacity (CC) or permit expiration (CP)
- Expansion may become effective
- Restricted wasteshed
- Clean Hands Waiver (Waiver) or Waiver expiration.
Total In-County Class III Landfill Available Capacity is calculated based on Maximum Permitted Daily Capacity (in blue text) for facilities without a restricted wasteshed or Expected Average Daily Tonnage for facilities with a restricted wasteshed. A "Clean Hands Waiver" was granted to Chiquita Canyon Landfill on March 17, 2016 to continue its
operation while processing the landfill's new conditional use permit. On July 25, 2017, the Board of Supervisors approved a new Conditional Use Permit for the Landfill’s Expansion Project. Chiquita Canyon Landfill's expected average daily tonnage is based on the limits set on the new conditional use permit and therefore used to calculate the
This scenario also considers the effect of Assembly Bill 1594 that removes diversion credit from green waste used as alternative daily cover (ADC) at landfills.

• Existing In-County Class III Landfills and Transformation Facilities • Diversion Rate at 65% • Exports based on Existing Export Agreements
• Utilization of Additional Alternative Technology Capacity
1 2 3 4 5 6 7 8 9 10 11
R R R R R Total
Year Waste Diversion Total Imports Potential Daily Exports to Class III Antelope Burbank Calabasas Chiquita Lancaster Pebbly Beach San Clemente Scholl Sunshine Whittier In-County Class III Class III Landfill
Generation Rate Daily from Avialable Capacity Out-of-County Landfill Valley City/County (Savage Canyon) Landfill Available Daily Disposal
Rate1Disposal Other from Alternative Landfills Daily Combined Capacity3 (tpd-6) Capacity
Demand Counties Technology Disposal Maximum Permitted Daily Capacity (tpd-6) ------------- Shortfall
Facilities2Demand Expected Average Daily Tonnage (tpd-6) Total In-County (Reserve)
Remaining Capacity at Year's End (Million Tons) Class III Landfill
Remaining Capacity
(million tons)
A B C=A(1-B) D E F G=C+D-E-F H I=G-H
(tpd-6) (tpd-6) (tpd-6) (tpd-6) (tpd-6) (tpd-6) (tpd-6) (tpd-6)
2018 95,996 65% 33,599 563 1,300 16,413 16,449 1,800 240 3,500 6,000 3,000 49 10 3,400 11,000 350 24,542 --
1,569 104 1,090 4,588 438 11 1 1,254 6,469 280
12.0 2.3 4.9 59.8 10.2 0.0 0.04 4.3 65.3 4.6 163
2019 96,457 65% 33,760 600 1,400 16,462 16,498 1,800 240 3,500 12,000 3,000 49 10 3,400 11,000 350 25,166 --
1,573 104 1,093 6,616 439 11 1 1,258 6,488 281
11.5 2.2 4.6 48.1 10.1 0.04 0.04 3.9 63.2 4.5 148
2020 97,589 65% 34,156 600 1,600 16,560 16,596 3,600 240 3,500 12,000 3,000 49 10 3,400 11,000 350 26,982 (10,386)
1,583 105 1,100 6,616 442 11 1 1,266 6,527 283
11.0 2.2 4.2 46.0 10.0 0.04 0.03 3.5 61.2 4.4 143
2021 96,017 65% 33,606 600 1,600 16,285 16,321 3,600 240 3,500 12,000 3,000 49 10 3,400 11,000 350 26,936 (10,615)
1,557 103 1,082 6,616 434 11 1 1,245 6,419 278 `
10.5 2.2 3.9 44.0 9.8 0.04 0.03 3.1 59.2 4.3 137
2022 96,362 65% 33,727 600 1,600 16,345 16,381 3,600 240 3,500 12,000 3,000 49 10 3,400 11,000 350 26,946 (10,565)
1,562 104 1,086 6,616 436 11 1 1,249 6,442 279
10.0 2.1 3.5 41.9 9.7 0.03 0.03 2.7 57.2 4.2 132
2023 97,739 65% 34,209 600 1,600 16,586 16,623 3,600 240 3,500 12,000 3,000 49 10 3,400 11,000 350 26,987 (10,364)
1,585 105 1,102 6,616 442 11 1 1,268 6,537 283
9.5 2.1 3.2 39.9 9.5 0.03 0.03 2.3 55.2 4.1 126
2024 99,491 65% 34,822 600 1,600 16,892 16,930 3,600 240 3,500 12,000 3,000 49 10 3,400 11,000 350 27,038 (10,108)
1,615 107 1,122 6,616 451 12 1 1,291 6,658 289
9.0 2.1 2.9 37.8 9.4 0.02 0.03 1.9 53.1 4.1 120
2025 101,194 65% 35,418 600 1,600 17,190 17,228 3,600 240 3,500 12,000 3,000 49 10 3,400 11,000 350 23,882 (6,654)
1,643 109 1,142 3,411 458 12 1 1,314 6,775 294
8.5 2.0 2.5 36.7 9.3 0.02 0.03 1.5 51.0 4.0 116
2026 103,693 65% 36,293 600 1,600 17,627 17,666 3,600 240 3,500 12,000 3,000 49 10 3,400 11,000 350 23,955 (6,290)
1,685 112 1,171 3,411 470 12 1 1,347 6,948 301
8.0 2.0 2.1 35.7 9.1 0.02 0.03 1.1 48.8 3.9 111
2027 104,844 65% 36,695 600 1,600 17,828 17,867 3,600 240 3,500 12,000 3,000 49 10 3,400 11,000 350 23,989 (6,122)
1,704 113 1,184 3,411 475 12 1 1,363 7,027 305
7.5 2.0 1.8 34.6 9.0 0.01 0.03 0.7 46.6 3.8 106
2028 106,052 65% 37,118 600 1,600 18,039 18,079 3,600 240 3,500 12,000 3,000 49 10 3,400 11,000 350 24,024 (5,945)
1,724 114 1,198 3,411 481 12 1 1,379 7,110 308
6.9 1.9 1.4 33.5 8.8 CP 0.03 0.2 44.4 3.7 101
2029 107,257 65% 37,540 600 1,600 18,250 18,290 3,600 240 3,500 12,000 3,000 10 3,400 11,000 350 24,047 (5,757)
1,744 116 1,212 3,411 487 1 1,395 7,193 312
6.4 1.9 CP 32.5 8.7 0.03 CC 42.1 3.6 95
2030 108,540 65% 37,989 600 1,600 18,474 18,515 3,600 240 12,000 3,000 10 11,000 350 21,445 (2,930)
1,766 117 3,411 493 1 7,282 316
5.8 1.9 31.4 8.5 0.03 39.9 3.5 91
2031 109,840 65% 38,444 600 1,600 18,701 18,743 3,600 240 12,000 3,000 10 11,000 350 21,451 (2,708)
1,788 119 3,411 499 1 7,371 319
5.3 1.8 30.3 8.4 0.03 37.6 3.4 87
2032 111,173 65% 38,911 600 1,600 18,934 18,976 3,600 240 12,000 3,000 10 11,000 350 21,456 (2,480)
1,810 120 3,411 505 1 7,463 323
4.7 1.8 29.3 8.2 CP 35.2 3.3 83
2033 112,542 65% 39,390 600 1,600 19,174 19,216 3,600 240 12,000 3,000 11,000 350 21,460 (2,244)
1,833 122 3,411 511 7,557 328
4.1 1.7 28.2 8.0 32.9 3.2 78
ASSUMPTIONS:
1. Waste Generation is estimated using CalRecycle's Adjustment Methodology, utilizing population projection, employment and real taxable sales projections from UCLA's Longterm Forecast, July 2017.
2. Potential Daily Available Capacity from Alternative Technology Facilities assume Southeast Resource Recovery Facility (SERRF) will continue its operation or will get retrofitted to provide additional capacity and additional capacity will be available from potential EMSW facilities or other alternative
technologies. This scenario also assumes Potential capacity from anaerobic digestion facility is considered part of diversion since anaerobic digestion process is within the statutory definition of composting which is considered as recycling. Commerce Refuse to Energy Facility ceased its operation
on June 2018.
3. Total In-County Class III Landfill Available Capacity is calculated based on Maximum Permitted Daily Capacity (in blue text) for facilities without a restricted wasteshed or Expected Average Daily Tonnage for facilities with a restricted wasteshed. A "Clean Hands Waiver" was granted to
Chiquita Canyon Landfill on March 17, 2016 to continue its operation while processing the landfill's new conditional use permit. On July 25, 2017, the Board of Supervisors approved a new Conditional Use Permit for the Landfill’s Expansion Project. Chiquita Canyon Landfill's expected average
daily tonnage is based on the limits set on the new conditional use permit and therefore used to calculate the Total In-County Class III landfill Available Capacity.
4. This scenario also considers the effect of Assembly Bill 1594 that removes diversion credit from green waste used as alternative daily cover (ADC) at landfills.
LEGEND:
CC/CP
E
R
W/WE
Source: Los Angeles County Department of Public Works
- Closure due to exhausted capacity (CC) or permit expiration (CP)
- Expansion may become effective
- Restricted wasteshed
- Clean Hands Waiver (Waiver) or Waiver expiration
2018 ANNUAL REPORT
LOS ANGELES COUNTY COUNTYWIDE INTEGRATED WASTE MANAGEMENT PLAN
APPENDIX E-3SCENARIO V - UTILIZATION OF ADDITIONAL ALTERNATIVE TECHNOLOGY CAPACITY
IN-COUNTY CLASS III LANDFILLS
DISPOSAL CAPACITY NEED ANALYSIS (EXCLUDING INERT WASTE LANDFILLS)

• • Diversion Rate at 65% • Exports based on Existing Export Agreements
• Increase in Exports to Out-of-County Landfills (Excluding Potential Waste-by-Rail Capacity)
1 2 3 4 5 6 7 8 9 10 11
R R R R R Total
Year Waste Diversion Total Imports Daily Available Exports to Class III Antelope Burbank Calabasas Chiquita Lancaster Pebbly Beach San Clemente Scholl Sunshine Whittier In-County Class III Potential Class III Landfill
Generation Rate Daily from Capacity from Out-of-County Landfill Valley City/County (Savage Canyon) Landfill Available Waste-by-Rail Daily Disposal
Rate1Disposal Other Transformation Landfills Daily Combined Capacity3 (tpd-6) Capacity4
Capacity
Demand Counties Facilities2Disposal Maximum Permitted Daily Capacity (tpd-6) ------------- Shortfall
Demand Expected Average Daily Tonnage (tpd-6) Total In-County (Reserve)
Remaining Capacity at Year's End (Million Tons) Class III Landfill
Remaining Capacity
(million tons)
A B C=A(1-B) D E F G=C+D-E-F H I J=G-H-I
(tpd-6) (tpd-6) (tpd-6) (tpd-6) (tpd-6) (tpd-6) (tpd-6) (tpd-6) (tpd-6)
2018 95,996 65% 33,599 563 1,300 16,413 16,449 1,800 240 3,500 6,000 3,000 49 10 3400 11,000 350 24,542 ─ --
1,569 104 1,090 4,588 438 11 1 1254 6,469 280
12.0 2.3 4.9 59.8 10.2 0.0 0.04 4.3 65 4.6 163
2019 96,457 65% 33,760 600 1,400 18,000 14,960 1,800 240 3,500 12,000 3,000 49 10 3400 11,000 350 24,909 ─ --
1,427 95 991 6,616 398 10 1 1141 5,883 255
11.6 2.2 4.6 48.1 10.1 0.04 0.04 3.9 63 4.5 149
2020 97,589 65% 34,156 600 1,400 18,000 15,356 3,600 240 3,500 12,000 3,000 49 10 3400 11,000 350 26,775 ─ (11,419)
1,465 97 1,018 6,616 409 11 1 1171 6,039 262
11.1 2.2 4.3 46.0 10.0 0.04 0.03 3.6 62 4.4 143
2021 96,017 65% 33,606 600 1,400 18,000 14,806 3,600 240 3,500 12,000 3,000 49 10 3400 11,000 350 26,684 ─ (11,878)
1,412 94 981 6,616 394 10 1 1129 5,823 252
10.7 2.2 4.0 44.0 9.9 0.04 0.03 3.2 60 4.3 138
2022 96,362 65% 33,727 600 1,400 18,000 14,927 3,600 240 3,500 12,000 3,000 49 10 3400 11,000 350 26,704 ─ (11,777)
1,424 94 989 6,616 397 10 1 1138 5,870 254
10.2 2.1 3.7 41.9 9.7 0.03 0.03 2.9 58 4.3 133
2023 97,739 65% 34,209 600 1,400 18,000 15,409 3,600 240 3,500 12,000 3,000 49 10 3400 11,000 350 26,784 ─ (11,375)
1,470 98 1,021 6,616 410 11 1 1175 6,060 263
9.8 2.1 3.3 39.9 9.6 0.03 0.03 2.5 56 4.2 127
2024 99,491 65% 34,822 600 700 18,000 16,722 3,600 240 3,500 12,000 3,000 49 10 3400 11,000 350 27,003 ─ (10,281)
1,595 106 1,108 6,616 445 12 1 1275 6,576 285
9.3 2.1 3.0 37.8 9.5 0.03 0.03 2.1 54 4.1 122
2025 101,194 65% 35,418 600 0 19,000 17,018 3,600 240 3,500 12,000 3,000 49 10 3400 11,000 350 23,847 ─ (6,829)
1,623 108 1,128 3,411 453 12 1 1298 6,693 290
8.8 2.0 2.7 36.7 9.3 0.02 0.03 1.7 52 4.0 117
2026 103,693 65% 36,293 600 0 19,000 17,893 3,600 240 3,500 12,000 3,000 49 10 3400 11,000 350 23,993 ─ (6,101)
1,706 113 1,186 3,411 476 12 1 1364 7,037 305
8.2 2.0 2.3 35.7 9.2 0.02 0.03 1.3 50 3.9 112
2027 104,844 65% 36,695 600 0 19,000 18,295 3,600 240 3,500 12,000 3,000 49 10 3400 11,000 350 24,060 ─ (5,765)
1,745 116 1,213 3,411 487 13 1 1395 7,195 312
7.7 2.0 1.9 34.6 9.0 0.02 0.03 0.8 47 3.8 107
2028 106,052 65% 37,118 600 0 19,000 18,718 3,600 240 3,500 12,000 3,000 49 10 3400 11,000 350 24,131 ─ (5,413)
1,785 118 1,241 3,411 498 13 1 1427 7,362 319
7.1 1.9 1.5 33.5 8.9 CP 0.03 0.4 45 3.7 102
2029 107,257 65% 37,540 600 0 19,000 19,140 3,600 240 3,500 12,000 3,000 10 3400 11,000 350 24,188 ─ (5,048)
1,825 121 1,268 3,411 509 1 1460 7,527 326
6.5 1.9 CP 32.5 8.7 0.03 -0.07 43 3.6 96
2030 108,540 65% 37,989 600 0 19,000 19,589 3,600 240 12,000 3,000 10 3400 11,000 350 22,964 ─ (3,375)
1,868 124 3,411 521 2 1494 7,704 334
6.0 1.9 31.4 8.5 0.03 CC 40 3.5 92
2031 109,840 65% 38,444 600 0 19,000 20,044 3,600 240 12,000 3,000 10 11,000 350 21,481 ─ (1,437)
1,912 127 3,411 533 2 7,883 342
5.4 1.8 30.3 8.4 0.03 38 3.4 87
2032 111,173 65% 38,911 600 0 19,000 20,511 3,600 240 12,000 3,000 10 11,000 350 21,492 ─ (981)
1,956 130 3,411 546 2 8,066 350
4.8 1.8 29.3 8.2 CP 35 3.3 83
2033 112,542 65% 39,390 600 0 19,000 20,990 3,600 240 12,000 3,000 11,000 350 21,502 ─ (512)
2,002 133 3,411 559 8,255 358
4.1 1.7 28.2 8.0 33 3.2 78
ASSUMPTIONS:
1. Waste Generation is estimated using CalRecycle's Adjustment Methodology, utilizing population projection, employment and real taxable sales projections from UCLA's Longterm Forecast, July 2017.
3. Daily Available Capacity from Transfomation Facilities assume Southeast Resource Recovery Facility will cease its operation on June 2024. Commerce Refuse to Energy Facility ceased its operation on June 2018.
3. Total In-County Class III Landfill Available Capacity is calculated based on Maximum Permitted Daily Capacity (in blue text) for facilities without a restricted wasteshed or Expected Average Daily Tonnage for facilities with a restricted wasteshed. A "Clean Hands Waiver" was granted to Chiquita Canyon Landfill on
March 17, 2016 to continue its operation while processing the landfill's new conditional use permit. On July 25, 2017, the Board of Supervisors approved a new Conditional Use Permit for the Landfill’s Expansion Project. Chiquita Canyon Landfill's expected average daily tonnage is based on the limits set on the
new conditional use permit and therefore used to calculate the Total In-County Class III landfill Available Capacity.
4. The operation of the Mesquite Regional Landfill (MRL) and waste by rail system (WBR) is entirely dependent on the availability of in-county and near-county disposal capacity, diversion from landfills and the cost of disposal. When the MRL/WBR disposal capacity is needed and when the tipping fees
make MRL/WBR economically viable, then the system may begin operation. However, for the purpose of the analysis, the additional capacity of the waste-by-rail system is excluded from this scenario.
5. This scenario also considers the effect of Assembly Bill 1594 that removes diversion credit from green waste used as alternative daily cover (ADC) at landfills.
LEGEND:
CC/CP
E
R
W/WE
Source: Los Angeles County Department of Public Works
Existing In-County Class III Landfills and Transformation Facilities
DISPOSAL CAPACITY NEED ANALYSIS (EXCLUDING INERT WASTE LANDFILLS)
2018 ANNUAL REPORT
LOS ANGELES COUNTY COUNTYWIDE INTEGRATED WASTE MANAGEMENT PLAN
APPENDIX E-3SCENARIO VI - INCREASE IN EXPORTS TO OUT-OF-COUNTY LANDFILLS (EXCLUDING POTENTIAL WASTE-BY-RAIL CAPACITY)
- Closure due to exhausted capacity (CC) or permit expiration (CP)
- Expansion may become effective
- Restricted wasteshed
- Clean Hands Waiver (Waiver) or Waiver expiration
IN-COUNTY CLASS III LANDFILLS

• Existing In-County Class III Landfills &Transformation Facilities • • Diversion Rate (75% by 2020) • Utilization of Additional Alternative Technology Capacity
• Increase in Exports to Out-of-County Landfills (Including Potential Waste-by-Rail Capacity)
1 2 3 4 5 6 7 8 9 10 11
R R R R R Total
Year Waste Diversion Total Imports Potential Available Exports to Class III Antelope Burbank Calabasas Chiquita Lancaster Pebbly Beach San Clemente Scholl Sunshine Whittier In-County Class III Potential Class III Landfill
Generation Rate Daily from Capacity from Out-of-County Landfill Valley City/County (Savage Canyon) Landfill Available Waste-by-Rail Daily Disposal
Rate1Disposal Other Alternative Landfills Daily Combined Capacity
3(tpd-6) Capacity4
Capacity
Demand Counties Technology Disposal ------------- Shortfall
Facilities2Demand Total In-County (Reserve)
Class III Landfill
Remaining Capacity
(million tons)
A B C=A(1-B) D E G H=C+D-E-F-G I J K=H-I-J
(tpd-6) (tpd-6) (tpd-6) (tpd-6) (tpd-6) (tpd-6) (tpd-6) (tpd-6) (tpd-6)
2018 95,996 65% 33,599 563 1,300 16,413 16,449 1,800 240 3,500 6,000 3,000 49 10 3,400 11,000 350 24,542 ─ --
1,569 104 1,090 4,588 438 11 1.27 1,254 7,250 280
12.0 2.3 4.9 59.8 10.2 0.05 0.04 4.3 65.3 4.6 163
2019 96,457 68% 30,545 600 1,400 16,000 13,745 1,800 240 3,500 12,000 3,000 49 10 3,400 11,000 350 24,707 ─ --
1,311 87 911 6,616 366 9 1.06 1,048 6,058 234
11.6 2.2 4.6 48.1 10.1 0.04 0.04 4.0 63.4 4.5 149
2020 97,589 75% 24,397 600 1,600 16,000 7,397 3,600 240 3,500 12,000 3,000 49 10 3,400 11,000 350 25,449 ─ (18,052)
705 47 490 6,616 500 5 0.57 564 3,260 126
11.4 2.2 4.5 46.0 10.0 0.04 0.04 3.79 62.4 4.5 145
2021 96,017 75% 24,004 600 1,600 16,000 7,004 3,600 240 3,500 12,000 3,000 49 10 3,400 11,000 350 25,383 4,000 (22,379)
668 44 464 6,616 600 5 0.54 534 3,087 119
11.2 2.2 4.3 44.0 9.8 0.04 0.03 3.6 61.4 4.4 141
2022 96,362 75% 24,090 600 1,600 16,000 7,090 3,600 240 3,500 12,000 3,000 49 10 3,400 11,000 350 25,398 4,000 (22,307)
676 45 470 6,616 700 5 0.55 541 3,125 121
11.0 2.2 4.2 41.9 9.6 0.04 0.03 3.5 60.4 4.4 137
2023 97,739 75% 24,435 600 1,600 16,000 7,435 3,600 240 3,500 12,000 3,000 49 10 3,400 11,000 350 25,455 4,000 (22,020)
709 47 493 6,616 800 5 0.57 567 3,277 127
10.7 2.2 4.0 39.9 9.3 0.04 0.03 3.3 59.4 4.4 133
2024 99,491 75% 24,873 600 1,600 16,000 7,873 3,600 240 3,500 12,000 3,000 49 10 3,400 11,000 350 25,528 4,000 (21,655)
751 50 522 6,616 900 5 0.61 600 3,470 134
10.5 2.2 3.9 37.8 9.0 0.04 0.03 3.1 58.3 4.3 129
2025 101,194 75% 25,299 600 1,600 16,000 8,299 3,600 240 3,500 12,000 3,000 49 10 3,400 11,000 350 22,394 4,000 (18,096)
791 53 550 3,411 1,000 6 0.64 633 3,658 141
10.3 2.1 3.7 36.7 8.7 0.03 0.03 2.9 57.2 4.3 126
2026 103,693 75% 25,923 600 1,600 16,000 8,923 3,600 240 3,500 12,000 3,000 49 10 3,400 11,000 350 22,498 4,000 (17,575)
851 56 591 3,411 1,100 6 0.69 680 3,933 152
10.0 2.1 3.5 35.7 8.4 0.03 0.03 2.7 56.0 4.2 123
2027 104,844 75% 26,211 600 1,600 16,000 9,211 3,600 240 3,500 12,000 3,000 49 10 3,400 11,000 350 22,546 4,000 (17,335)
878 58 610 3,411 1,200 6 0.71 702 4,060 157
9.7 2.1 3.3 34.6 8.0 0.03 0.03 2.5 54.7 4.2 119
2028 106,052 75% 26,513 600 1,600 16,000 9,513 3,600 240 3,500 12,000 3,000 49 10 3,400 11,000 350 22,597 4,000 (17,084)
907 60 630 3,411 1,300 7 0.73 725 4,193 162
9.4 2.1 3.1 33.5 7.6 CP 0.03 2.2 53.4 4.1 116
2029 107,257 75% 26,814 600 1,600 16,000 9,814 3,600 240 3,500 12,000 3,000 10 3,400 11,000 350 22,640 4,000 (16,826)
936 62 650 3,411 1,400 0.76 748 4,326 167
9.1 2.1 CP 32.5 7.2 0.03 2.0 52.0 4.1 109
2030 108,540 75% 27,135 600 1,600 16,000 10,135 3,600 240 12,000 3,000 10 3,400 11,000 350 22,022 4,000 (15,887)
967 64 3,411 1,500 0.78 773 4,467 173
8.8 2.1 31.4 6.7 0.03 1.8 50.6 4.0 105
2031 109,840 75% 27,460 600 1,600 16,000 10,460 3,600 240 12,000 3,000 10 3,400 11,000 350 22,054 4,000 (15,594)
998 66 3,411 1,600 0.80 798 4,610 178
8.5 2.0 30.3 6.2 0.03 1.5 49.2 4.0 102
2032 111,173 75% 27,793 600 1,600 16,000 10,793 3,600 240 12,000 3,000 10 3,400 11,000 350 22,087 4,000 (15,294)
1,029 68 3,411 1,700 0.83 823 4,757 184
8.2 2.0 29.3 5.7 CP 1.3 47.7 3.9 98
2033 112,542 75% 28,135 600 1,600 16,000 11,135 3,600 240 12,000 3,000 3,400 11,000 350 22,120 4,000 (14,985)
1,062 70 3,411 1,800 849 4,908 190
7.9 2.0 28.2 5.1 1.0 46.2 3.8 94
ASSUMPTIONS:
1. Waste Generation is estimated using CalRecycle's Adjustment Methodology, utilizing population projection, employment and real taxable sales projections from UCLA's Longterm Forecast, July 2017.
2. Potential Daily Available Capacity from Alternative Technology Facilities assume Southeast Resource Recovery Facility (SERRF) will continue its operation or will get retrofitted to provide additional capacity and additional capacity will be available from potential EMSW facilities or other alternative
technologies. This scenario also assumes Potential capacity from anaerobic digestion facility is considered part of diversion since anaerobic digestion process is within the statutory definition of composting which is considered as recycling. Commerce Refuse to Energy Facility ceased its operation
on June 2018.
3. Total In-County Class III Landfill Available Capacity is calculated based on Maximum Permitted Daily Capacity (in blue text) for facilities without a restricted wasteshed or Expected Average Daily Tonnage for facilities with a restricted wasteshed. A "Clean Hands Waiver" was granted to Chiquita Canyon Landfill on
March 17, 2016 to continue its operation while processing the landfill's new conditional use permit. On July 25, 2017, the Board of Supervisors approved a new Conditional Use Permit for the Landfill’s Expansion Project. Chiquita Canyon Landfill's expected average daily tonnage is based on the limits set on the new
conditional use permit and therefore used to calculate the Total In-County Class III landfill Available Capacity.
4. The operation of the Mesquite Regional Landfill (MRL) and waste by rail system (WBR) is entirely dependent on the availability of in-county and near-county disposal capacity, diversion from landfills and the cost of disposal. When the MRL/WBR disposal capacity is needed and when the tipping fees
make MRL/WBR economically viable, then the system may begin operation. However, for the purpose of the analysis, the scenario assumes: (1) an increase in exports to out-of-County landfills and (2) the waste-by-rail system is assumed to begin its operation in 2021.5. This scenario also considers the effect of Assembly Bill 1594 that removes diversion credit from green waste used as alternative daily cover (ADC) at landfills.
LEGEND:
CC/CPE
R
W/WE
Source: Los Angeles County Department of Public Works
- Closure due to exhausted capacity (CC) or permit expiration (CP)- Expansion may become effective
- Restricted wasteshed
- Clean Hands Waiver (Waiver) or Waiver expiration
2018 ANNUAL REPORT
DISPOSAL CAPACITY NEED ANALYSIS (EXCLUDING INERT WASTE LANDFILLS)
APPENDIX E-3
SCENARIO VII - ALL SOLID WASTE MANAGEMENT OPTIONS CONSIDERED BECOME AVAILABLE
Exports based on Existing Export Agreements
IN-COUNTY CLASS III LANDFILLS
Maximum Permitted Daily Capacity (tpd-6)
Expected Average Daily Tonnage (tpd-6)
Remaining Capacity at Year's End (Million Tons)
LOS ANGELES COUNTY COUNTYWIDE INTEGRATED WASTE MANAGEMENT PLAN

2018 Annual Report Los Angeles County Countywide Integrated Waste Management Plan
[This Page Intentionally Left Blank]

2018 Annual Report Los Angeles County Countywide Integrated Waste Management Plan
APPENDIX E-4: LIST AND MAP OF LARGE VOLUME TRANSFER AND PROCESSING FACILITIES IN LOS ANGELES COUNTY IN 2018

Facility Name Location Address Permitted Capacity (tpd) Facilities Recycling Rates Transfer Facilities Only Mixed Solid Waste Recycling Rate Mixed C&D Waste Recycling RateMixed Food Waste Recycling
Rate
1 Active Recycling MRF and Transfer Station 2000 W. Slauson Avenue, Los Angeles, CA 90047 250 77% 77% ---- ----
2 American Industrial Services, LLC 5626 Cherry Ave, Long Beach, CA 90805 173 70% ---- 70% ----
3 American Reclamation CDI Processing Facility 4560 Doran Street, Los Angeles, CA 90039 174 77% ---- 82% ----
4 American Waste Transfer Station 1449 West Rosecrans Avenue, Gardena, CA 90249 2,225 14% 14%
5 Athens Services 14048 East Valley Boulevard, Industry, CA 91746 5,000 30% 27% ---- 82%
6 Athens Sun Valley MRF 11121 Pendleton Street, Sun Valley, CA 91353 1,500 30% 30% N/A N/A
7 Azusa Transfer and MRF 1501 West Gladstone Street, Azusa, CA 91701 3,800 90-100% 90-100% ---- ----
8 Bel-Art Waste Transfer Station 2501 East 68th Street Long Beach, CA 90805 1,500 31% 31%
9 California Waste Services, LLC 621 West 152nd Street, Gardena, CA 90247 1,000 78% ---- 75% ----
10 Carson Transfer Station and MRF 321 West Francisco Street, Carson, CA 90745 5,300 X X
11 Central LA Recycling & Transfer Station 2201 E Washington Boulevard, Los Angeles, CA 90021 4,025 X X
12 City of Inglewood Transfer Station 222 West Beach Avenue, Inglewood, CA 90302 100 X X
13 City Terrace Recycling Transfer Station 1511-1533 Fishburn Avenue, City Terrace, CA 90063 700 15% 15% ---- ----
14 Clean Up America 2900 Lugo Street, Los Angeles, CA 90023 174 70% ---- 70% ----
15 Commercial Waste Services, Inc. 1530 and 1540 Date Street, Montebello, CA 90640 175 87% ---- 84% ----
16 Compton Recycling & Transfer Station (Allied/BFI Waste Systems) 2509 West Rosecrans Avenue, Compton, CA 90059 1,500 X X
17 Construction and Demolition Recycling 9309 Rayo Avenue, South Gate, CA 90280 3,000 81% ---- 80% ----
18 Crown Recycling Services 9147 De Garmo Avenue, Sun Valley, CA 91352 4,600 56% 70% 85%
19 Culver City Transfer/Recycling Station 9255 West Jefferson Boulevard, Culver City, CA 90232 500 X X
20 Direct Disposal C&D Recycling 3720 Noakes Street, Los Angeles, CA 90023 120 82% ---- 78% ----
21 Downey Area Recycling & Transfer 9770 Washburn Road, Downey, CA 90241 5,000 80% 23% ---- ----
22 East Los Angeles Recycling And Transfer 1512 North Bonnie Beach Place, City Terrace, CA 90063 700 80% 16%
23 East Street Maintenance District Yard 452 San Fernando Road, Los Angeles, CA 90065 315 X X
24 East Valley Diversion (formerly Looney Bins) 11616 Sheldon Street, Sun Valley, CA 91352 750 78% ---- 75% ----
25 EDCO Recycling and Transfer 2755 California Avenue, Signal Hill, CA 90755 1,500 X X
26 Falcon Refuse Center, Inc. 3031 East "I" Street, Wilmington, CA 90744 1,850 75% ---- 82% ----
27 Granada Hills Street MDY 10210 Etiwanda Avenue, Northridge, CA 91325 450 X X
28 Grand Central Recycling & Transfer Station 999 Hatcher Boulevard, Industry, CA 91748 5,000 -N/A- 33% 50% ----
29 Innovative Waste Control 4133 Bandini Boulevard, Vernon, CA 90023 1,250 1% 1%
30 Downtown Diversion (formerly Looney Bins) 2424 E Olympic Boulevard, Los Angeles, CA 90021 1,500 80% ---- 77% ----
31 Mission Recycling/West Coast Recycling 1326 East Ninth Street, Pomona, CA 91766 300 -N/A- -N/A- ---- ----
32 Mission Recycling/West Coast Recycling 1341 East Mission Boulevard, Pomona, CA 91766 200 -N/A- -N/A- ---- ----
33 Mission Road Recycling & Transfer Station 840 South Mission Road, Los Angeles, CA 90023 1,785 54% ---- ---- 73%
34 Paramount Resource Recycling Facility 7230 Petterson Lane, Paramount, CA 90723 2,450 38% 50% ---- ----
35 Puente Hills Materials Recovery Facility 2808 Workman Mill Road, Whittier, CA 90601 4,400 8-10% 8-10% ---- -N/A-
Transfer Stations, Material Recovery Facilities, and CDI Processing Facilities
2018 ANNUAL REPORTLOS ANGELES COUNTY COUTYWIDE INTEGRATED WASTE MANAGEMENT PLAN
TRANSFER/PROCESSING FACILITIES IN LOS ANGELES COUNTYAPPENDIX E-4

Facility Name Location Address Permitted Capacity (tpd) Facilities Recycling Rates Transfer Facilities Only Mixed Solid Waste Recycling Rate Mixed C&D Waste Recycling RateMixed Food Waste Recycling
Rate
Transfer Stations, Material Recovery Facilities, and CDI Processing Facilities
2018 ANNUAL REPORTLOS ANGELES COUNTY COUTYWIDE INTEGRATED WASTE MANAGEMENT PLAN
TRANSFER/PROCESSING FACILITIES IN LOS ANGELES COUNTYAPPENDIX E-4
36 South Gate Transfer Station 9530 South Garfield Avenue, South Gate, CA 90280 1,000 12-15% 3% 2% -N/A-
37 Southern Cal. Disposal Co. R. & TS 1908 Frank Street, Santa Monica, CA 90404 1,056 12% 12% ---- ----
38 Southwest Street MDY 5860 South Wilton Place, Los Angeles, CA 90047 225 -N/A- -N/A- -N/A- -N/A- -N/A-
39 Universal Waste Systems Inc. DTF 2460 East 24 th Street, Los Angeles, CA 90058 150 X X
40 Van Nuys Street MDY 15145 Oxnard Street, Van Nuys, CA 91411 225 X X
41 Waste Resource Recovery 357 West Compton Boulevard, Gardena, CA 90247 500 14% 14% ---- ----
42 Western District Satellite Yard 6000 West Jefferson Boulevard, Los Angeles, CA 90016 149 X XNotes: 1. Facilities listed are permitted by the CalRecycle as “Large Volume Transfer/Processing” or “Direct Transfer” Facilities with a permitted daily capacity or maximum average allowed intake of at least 100 tpd. If capacity is in cubic yards, a conversion factor is assumed as follows: 1200 lbs/cubic
yard for Construction and Demolition/Processing facilities; and 900 lbs/cubic yard for Transfer and Processing facilities.2. Information on facility type and recycling rate is based on surveys conducted, the CalRecycle's Solid Waste Information System (SWIS), and the City of Los Angeles' certified processors list for Calendar year 2017 (https://www.lacitysan.org/)3. "-N/A-" means information is either not available or not applicable.4. Refer to pages 35-36 for the definitions of the following term(s): transfer/processing facilities; transfer stations; material recovery facilities; and CDI processing facilities.
Material Recovery Facility (Clean)
Facility Name Location Address Permitted Capacity (tpd)
1 Allan Company Baldwin Park 14604-14618 Arrow Highway, Baldwin Park, CA 91706 750
2 Angelus Western Paper Fibers, Inc. 2474 Porter Street, Los Angeles, CA 90021 650
3 Bradley East Transfer Station (Sun Valley Recycling Park) 9227 Tujunga Avenue, Sun Valley, CA 91352 1,532
4 City Fibers – West Valley Plant 16714 Schoenborn Street, Los Angeles, CA 91343 350
5 City Fibers - LA Plant No. 2 2545 East 25th Street Los Angeles, CA 90058 300
6 City of Glendale MRF and TS 540 W. Chevy Chase Dr. Glendale, CA 91204 250
7 Los Angeles Express Materials Rec. Fac. 6625 Stanford Avenue, Los Angeles, CA 90001 207
8 Pico Rivera MRF 8405 Loch Lomond Drive, Pico Rivera, CA 90660 327
9 Potential Industries 922 East E. Street, Wilmington, CA 90744 5,000
10 SA Recycling LLC 8720 Tujunga Avenue, Sun Valley, CA 91352 100
11 Sun Valley Paper Stock MRF and TS 8701 North San Fernando Road, Sun Valley, CA 91352 750
12 Waste Management South Gate Transfer Station 4489 Ardine Street, South Gate, CA 90280 2,000
13 West Valley Fibres 14811 Keswick Avenue, Van Nuys, CA 91405 100
Total 12,316Notes: 1. Facilities listed are permitted by CalRecycle with a minimum of 100 tpd of permitted capacity or maximum average allowed intake. If capacity is in cubic yards, a
conversion factor is assumed as follows: 1200 lbs/cubic yard for Construction and Demolition/Processing and 900 lbs/cubic yard for Transfer and Processing facilities.2. Refer to page 36 for the definition of the following term(s): material recovery facility (clean).

CAST AIC
ASUZA
C HAE
YTICER
V LU C
B
GN
O
L
FAIRM O NT
CO
P I C O R I V E R A
C O M M E R C E
SANT AFE
E L M O N T E
RO LLINGHILLS
PALO S
SEQUIT
DEL REY
M O N T E B E L L O
PASADENA
D O W N E Y
I R W I N D
A L E
CO
M ARINA
LAWNDALEM ANHAT T AN
PT DUM E
ART ESIA
C E R R I T O S
NO RT HWEST
SEAL CO VE
HARBO R
P A L M D A L E
QUART Z HILL
CO
GO RM AN
CAT ALINAHARBO R
AVALO N
PT VICENT E
PT FERM IN
EST AT ES
HILLS
ROLLING
LO M IT A
CO
COCO
EST AT ESS
V
RDEE
PALOS
RO CKY
VERDES
OHRANC
CO
HILLSIGNAL
L A K E W O O D
CO
BELLFLO WER
HAWAIIANGARDENS
CO
UDNI
S T R Y
CO
CO
CO
INDUST RY
W EST CO VINA
CLAREMONT
SA
MID
ARODNEL
G
CO
CO
CO
CO
CO
CO
COCO
CO
CO
CO
HILLS
AINOM
CO
CO
CO
CO
CO
CO
CO
C A L A B A S A S
PT
M ALIBU PT
C I T Y O FM A L I B U
WEST LAKE
VILLAGE
AGO URAHILLS
CO HILLSHIDDEN
BEA
HC
HERMOSA
BEACH
HAWT HO RNE
T O R R A N C E
CO
CUDAHY
B E L L
CO
CO
GARDENSBELL
W H I T T I E R
CO
LY NWO O D
PARKHUNT INGT O N
BELLAM WY O O D
D
UARTE
BRADBURY
CO
CO
T EM PLE CITY
EL M O NT E
SO UT H
SO UT H
P A S A D E N A
CO
CO
B U R B A N K
FLINT RIDGE
LA CANADA
SAN M AR
INO
A R C A D I A
CO
BALDWIN PARK
SAUGUS
P A L M D A L E
L A N C A S T E R
NO RWALK
HEIGHTSLA HAB
RA
SPRINGS
PARAM O UNT
G A R D E N A
R E D O N D O
INGLEWO O D
EL SEGUNDO
BEACH
PT LO SANGELES
BEVERLY
W
SE THO LLY WO O D
C
SANT A
SOL E SLEGNA
SAN
FERNANDO
LAVERNE
NA
S
P O M O N A
W A L N U
T
S A N T A C L A R I T A
LA PUENT E
RO
EMEAD
S
M O NT EREY PARK
V E R N O N
CO
D I A M O N D B A R
L A M I R A D A
SIERRA M
ADRE
M O N R O V I A
CO VINAA L H A M B R A SA
N GABRIEL
G L E N D A L E
SO UT H GAT E
C O M P T O N
CARSO N
CO
VENTURA
COUNTY
VENTURA
COUNTY
KERN
COUN
TYSA
NBE
RNAR
DINO
COUN
TY
SAN
BERN
ARDIN
O
COUNTY
COUNTY
ORAN
GE
AV
AV
AV
BV
AV FO O T HILL
GRAND
AV
HY
BV
BASE LINE RD
AVTOWNE
HY
HUGHES
BVDR
ST
STST
BV N
N
RD
BV
FELIZLO S
AV
BV
AV
RD
6T H
PY
SAN
BV
CANYON
HYRD
RD
HY
ANGELES
M T
RED
BO X
PY
BV
T UJUNGARD
BV
HY
HY
RD
BV
BV
BV
ART ESIA
M AGIC
WOODMAN
AV
WY
BVLA
BV
VAN NUYS
RD
RD
BAR
BV
BV
RD
VALLEY
BV
BV
BV
MAGNOLIA
AV
BVST
VINELAND
AV
AVTAMPA
M O UNT AIN
BV
DR
CO LO RADO HUNT INGT O N
RD
LIVEST
RD
AV C-6-LANCAST ER RD
AVENUE
260TH
ST W
RD
THREEPOINTS
RD
O AK
LANCAST ER
PINE
CANY O N
RDFAIRMO NT
RES RD
RD
FRANCISQUIT O
CANY O N
O LD
BV
SHERM AN
BALBOA
FALLBRO OK
AV
M AY O
DR
LY O NS AV
RD
SAND
WEST
T HE
RD
SAN
ARROYO
RD
ARRO WAV
DRFO O T HILL
FO O T HILLSAN
FERNANDO
BV
RD
RO SCO E
BV
DEVO NSHIRE
HY
HY
AZUSA
WILSHIRE
RD
RD
KANAN
SUNSET
BV
CO AST
ELIZ ABET H
RD
BV
AV
MT
ALO ST A
BV
LAKE
BV
ST
IM PERIAL
M T
RD
BL
VENT URA
BLVICT O RY
WY
CARSO N
CO AST
25T HST
ALAMIT OS AV
AV
BVMAIN
B ST
ST
ST
ART ESIA
BV
NORWALK
FIREST O NE
ATLANTIC
BV
BV
BV
HYLEFFINGWELL
RD
BV
COLIMA
O FF
CUT
RD
NORWALK
RD
BV
AV
AV
ST CARSO N
7T H
ATLANTIC
WILLO W
BV HY
ST
ST W
30T H
AVENUE P
170TH
ST W
HILL
RD
HY
BIG PINES
AVENUE
LANCAST ERRD
IJ
GAVENUE
110TH
ST W
AVENUE
10TH
10 TH
ST E
ST W
AVENUE M
LAKE
RD
RD
RD
60T H
ST W
AVENUE
AVENUE
ST E
ST E
ST E
L
140TH
90T H
50 TH
47T H ST E
PEARBLO SSO M
PEARBLO SSO M
HY
HY
HY
ANT ELO PE
ST E
165TH
PALM DALE
SIERRA
BV
AVENUE P
240TH ST E
AVENUE O
HY
D
87 TH
ST E
E
FO RT T EJO N
RD
170TH
ST E
BOB'S GAP
RD
VALY ERM O
RD
HY
RD
RD
RD
PACIFIC
DECKER
M ULHO LLAND RD
LAKE
M ULHO LLAND
VIRGENES
LAS
CANYO N
M ALIBU
M ULHO LLAND
VALLEY
CIRCLE
SUNLAND
T UXFO RD
HILL
GLENDALE VERDUGO
HUNT ING
T O N
M ISSION
M AIN
PECK
GABRIEL
BALDY
BO UQUET
SO LEDAD CANY O N
SIERRA
SECO CYN
FERNANDO
VALENCIA
RDSAN
CANYO N
M UNZ RANCH
CANY O N
BIG
CREST
ANGELES
FO REST
GLEASON ANG
ELES
CREST
FO O T
AV
WILSO N
PACIFIC
SEPULVEDA
HAWT HO RNE
WEST ERN WILMINGTON
BIG
RO CK CREEK
BROADW
AY
VALLEYM AIN
HACIENDA
FULLERT O N
LITT LE
T UJUNGA
DIAM OND
M ISSIO N
GRANDBREA CN
BREA
CNM ANCHEST ER
BREA
RO SECRANS
O CEAN
ALAMEDA
ROSEM EAD
CRY ST AL
LAKE
CANYO N
SPUNKY
CANY O N
GO DDE
KANAN
DUME
TOPANGA
SUNSET
CANYO N
WHIT T IERLINCO LN
HENRY
T EM PLIN
LAS T UNAS DR
SLAUSO N
GLENDORA AV
LANCAST ER
GO RM AN PO ST RD AV C-15-LANCAST ER RD
STGAFFEY
SEPULVEDA
PACIFIC
AV
LAKEWO OD
BV
SANT A CAT ALINAISLAND
SAN CLEM ENT E
ISLAND
Note: T hese islands are not to scale nor at their true location.
6
49
§̈¦5
§̈¦5
§̈¦10
§̈¦10
§̈¦10 §̈¦10
§̈¦105
§̈¦105
§̈¦710
§̈¦110
§̈¦605
§̈¦605
§̈¦405
§̈¦405
§̈¦405
§̈¦210
§̈¦210
§̈¦710
§̈¦110
£¤101 £¤101
£¤101
}2
}71
}91}91
}90
}60
}60
}60}57
}57
}14
}14
}170
}210}110
}134
}118
}57
9
5
7
3
8
1
2
10
55
41
52
46
50
47
40
31
20
44
35
36
51
26
33
43
42
23
25
11
15
22
34
14
3029
18
12 19
27
4
54
53
4832
38
16
39
45
17
13
28
37
24
21
0 6M iles
REF: \\Pwisilong6-smb\gisfiles\SMPM\GIS_Services\MPMGIS\projects\epd\WasteFacilities\TSMRF_2018.mxd DATE: Dec 2, 2019
Survey/M apping and Property M anagement Division, M apping and GIS Services Section
Large Volume Solid WasteTransfer and Processing Facilities
in Los Angeles County in 2018FACILITY NAME AND ADDRESSNO.
PERMITTED CAPACITY (Tpd)100 - 499500 - 999
1000 - 1999
2000 - 3999
4000 - 5300
·
12345678910111213141516171819202122232425262728293031323334353637383940414243444546474849505152535455
CAPACITY (Tpd)PERMITTED
Carson Transfer Station & Materials Recovery FacilityAthens ServicesDowney Area Recycling & TransferGrand Central Recycling & Transfer StationPotential IndustriesCrown Recycling ServicesPuente Hills Materials Recovery FacilityCentral LA Recycling & Transfer StationAzusa Transfer & Materials Recovery FacilityConstruction and Demolition RecyclingParamount Resource Recycling FacilityAmerican Waste Transfer StationWaste Management South Gate Transfer StationFalcon Refuse Center, Inc.Mission Road Recycling & Transfer StationBradley East Transfer StationAthens Sun Valley Materials Recovery FacilityBel-Art Waste Transfer StationCompton Recycling & Transfer Station (Allied/BFI Waste Systems)EDCO Recycling and TransferDowntown Diversion (formerly Looney Bins)Innovative Waste ControlSouthern Cal. Disposal Co. Recycling & Transfer StationCalifornia Waste Services, LLCSouth Gate Transfer StationAllan Company Baldwin ParkEast Valley Diversion (formerly Looney Bins)Sun Valley Paper Stock Materials Recovery Facility & Transfer StationCity Terrace Recycling Transfer StationEast Los Angeles Recycling and TransferAngelus Western Paper Fibers, Inc.Culver City Transfer/Recycling StationWaste Resource RecoveryGranada Hills Street Maintenance District YardCity Fibers - West Valley PlantPico Rivera Materials Recovery FacilityEast Street Maintenance District YardCity Fibers - LA Plant No. 2Mission Recycling/West Coast RecyclingActive Recycling MRF and Transfer StationCity of Glendale MRF and Transfer StationSouthwest Street Maintenance District YardVan Nuys Street Maintenance District YardLos Angeles Express Materials Recovery FacilityMission Recycling/West Coast RecyclingCommercial Waste Services, Inc.American Reclamation CDI Processing FacilityClean Up AmericaAmerican Industrial Services, LLCUniversal Waste Systems Inc. Direct Transfer FacilityWestern District Satellite YardDirect Disposal C & D RecyclingCity of Inglewood Transfer StationSA Recycling LLCWest Valley Fibers
321 West Francisco Street, Carson, 9074514048 East Valley Boulevard, Industry, 917469770 Washburn Road, Downey, 90241999 Hatcher Boulevard, Industry, 91748922 East E Street, Wilmington, 907449147 De Garmo Avenue, Sun Valley, CA 913522808 Workman M ill Road, Whittier, 906012201 East Washington Boulevard, Los Angeles, 900341501 West Gladstone Street, Azusa, 917019309 Rayo Avenue, South Gate, 902807230 Petterson Lane, Paramount, 907231449 West Rosecrans Avenue, Gardena, 902494489 Ardine Street, South Gate, 902803031 East "I" Street, Wilmington, 90744840 South M ission Road, Los Angeles, 900239227 T ujunga Avenue, Sun Valley, 9135211121 Pendleton Street, Sun Valley, 913522501 East 68th Street, Long Beach, 908052509 West Rosecrans Avenue, Compton, 900592755 California Avenue, Signal Hill, 907552424 East O lympic Boulevard, Los Angeles, 900214133 Bandini Boulevard, Vernon, 900231908 Frank Street, Santa M onica, 90404621 West 152nd Street, Gardena, 902479530 South Garfield Avenue, South Gate, 9028014604-14618 Arrow Highway, Baldwin Park, 9170611616 Sheldon Street, Sun Valley, 913528701 North San Fernando Road, Sun Valley, 913521511-1533 Fishburn Avenue, City T errace, 900631512 North Bonnie Beach Place, City T errace, 900632474 Porter Street, Los Angeles, 900219255 West Jefferson Boulevard, Culver City, 90232357 West Compton Boulevard, Gardena, 9024710210 Etiwanda Avenue, Northridge, 9132516714 Schoenborn Street, Los Angeles, 913438405 Loch Lomond Drive, Pico Rivera, 90660452 San Fernando Road, Los Angeles, 900652545 East 25th Street, Los Angeles, 900581326 East Ninth Street, Pomona, 917662000 W. Slauson Avenue, Los Angeles, 90047540 West Chevy Chase Drive, Glendale, 912045860 South Wilton Place, Los Angeles, 9004715145 O xnard Street, Van Nuys, 914116625 Stanford Avenue, Los Angeles, 910011341 East M ission Boulevard, Pomona, 917661530 and 1540 Date Street, M ontebello, 906404560 Doran Street, Los Angeles, 900392900 Lugo Street, Los Angeles, 900235626 Cherry Avenue, Long Beach, 908052460 East 24th Street, Los Angeles, 900586000 West Jefferson Boulevard, Los Angeles, 900163720 Noak es Street, Los Angeles, 90023222 West Beach Avenue, Inglewood, 903028720 T ujunga Avenue, Sun Valley, 9135214811 Keswick Avenue, Van Nuys, 91405
5,3005,0005,0005,0005,0004,6004,4004,0253,8003,0002,4502,2252,0001,8501,7851,5321,5001,5001,5001,5001,5001,2501,0561,0001,000750750750700700650500500450350327315300300250250225225207200175174174173150149120100100100
X
#
X
X
X
#
#
#
#
#
#
#
NO T ES:1 - Facilities listed are permitted by the CalRecycle as “Large Volume T ransfer/Processing” or “Direct T ransfer” Facilities with daily capacities of 100 tpd or more. 2 - Permitted capacity is based on the M ax. Permitted T hroughput as specified in the Solid Waste Facility Permit. If capacity is in cubic yards, a conversion factor is assumed as follows: 900 lbs/cubic yard for T ransformation/Processing facilities; and 1,200 lbs/cubic yard for Construction and Demolition/Processing facilities.3 - T pd is tons per day based on 6 operating days a week, 312 days a year. Facilities located in County unincorporated areas. Construction and Demolition/Processing Facilities.X
#
X
#

2018 Annual Report Los Angeles County Countywide Integrated Waste Management Plan
[This Page Intentionally Left Blank]

2018 Annual Report Los Angeles County Countywide Integrated Waste Management Plan
APPENDIX E-5: LIST AND MAP OF COMPOSTING, CHIPPING AND GRINDING, AND ANAEROBIC DIGESTION FACILITIES IN LOS ANGELES COUNTY IN 2018
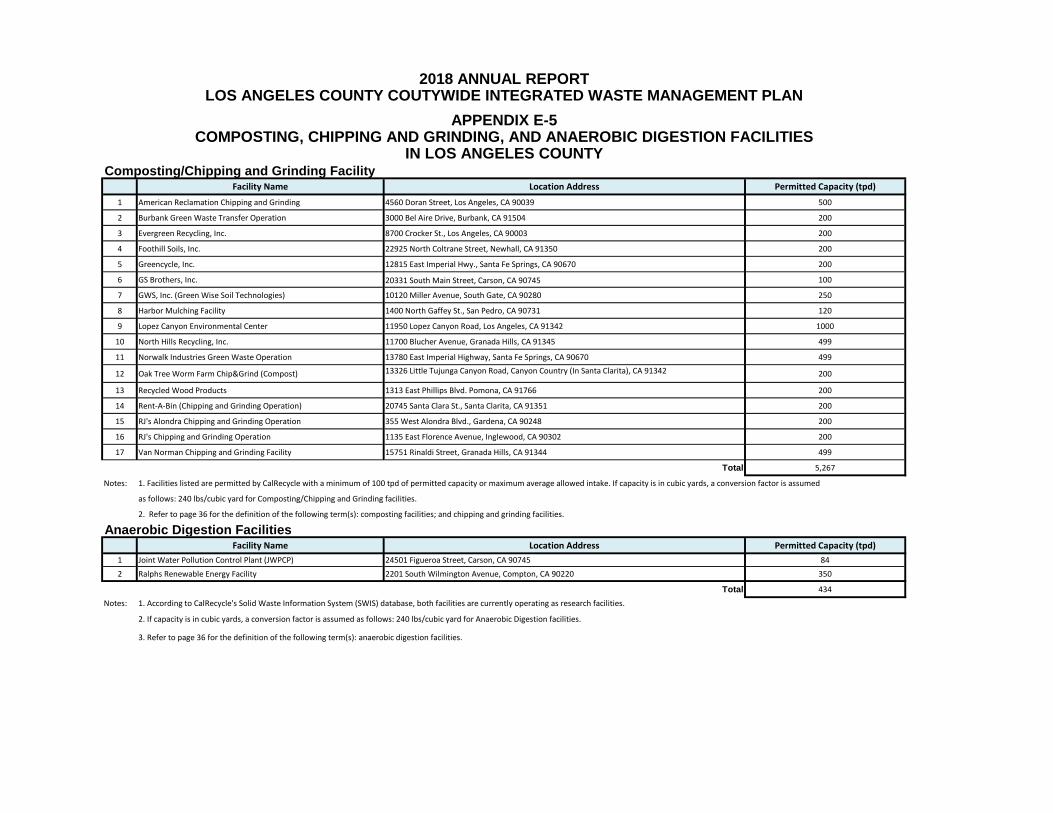
Composting/Chipping and Grinding FacilityFacility Name Location Address Permitted Capacity (tpd)
1 American Reclamation Chipping and Grinding 4560 Doran Street, Los Angeles, CA 90039 500
2 Burbank Green Waste Transfer Operation 3000 Bel Aire Drive, Burbank, CA 91504 200
3 Evergreen Recycling, Inc. 8700 Crocker St., Los Angeles, CA 90003 200
4 Foothill Soils, Inc. 22925 North Coltrane Street, Newhall, CA 91350 200
5 Greencycle, Inc. 12815 East Imperial Hwy., Santa Fe Springs, CA 90670 200
6 GS Brothers, Inc. 20331 South Main Street, Carson, CA 90745 100
7 GWS, Inc. (Green Wise Soil Technologies) 10120 Miller Avenue, South Gate, CA 90280 250
8 Harbor Mulching Facility 1400 North Gaffey St., San Pedro, CA 90731 120
9 Lopez Canyon Environmental Center 11950 Lopez Canyon Road, Los Angeles, CA 91342 1000
10 North Hills Recycling, Inc. 11700 Blucher Avenue, Granada Hills, CA 91345 499
11 Norwalk Industries Green Waste Operation 13780 East Imperial Highway, Santa Fe Springs, CA 90670 499
12 Oak Tree Worm Farm Chip&Grind (Compost) 13326 Little Tujunga Canyon Road, Canyon Country (In Santa Clarita), CA 91342 200
13 Recycled Wood Products 1313 East Phillips Blvd. Pomona, CA 91766 200
14 Rent-A-Bin (Chipping and Grinding Operation) 20745 Santa Clara St., Santa Clarita, CA 91351 200
15 RJ's Alondra Chipping and Grinding Operation 355 West Alondra Blvd., Gardena, CA 90248 200
16 RJ's Chipping and Grinding Operation 1135 East Florence Avenue, Inglewood, CA 90302 200
17 Van Norman Chipping and Grinding Facility 15751 Rinaldi Street, Granada Hills, CA 91344 499
Total 5,267
Notes: 1. Facilities listed are permitted by CalRecycle with a minimum of 100 tpd of permitted capacity or maximum average allowed intake. If capacity is in cubic yards, a conversion factor is assumed
as follows: 240 lbs/cubic yard for Composting/Chipping and Grinding facilities.
2. Refer to page 36 for the definition of the following term(s): composting facilities; and chipping and grinding facilities.
Anaerobic Digestion FacilitiesFacility Name Location Address Permitted Capacity (tpd)
1 Joint Water Pollution Control Plant (JWPCP) 24501 Figueroa Street, Carson, CA 90745 84
2 Ralphs Renewable Energy Facility 2201 South Wilmington Avenue, Compton, CA 90220 350
Total 434
Notes: 1. According to CalRecycle's Solid Waste Information System (SWIS) database, both facilities are currently operating as research facilities.
2. If capacity is in cubic yards, a conversion factor is assumed as follows: 240 lbs/cubic yard for Anaerobic Digestion facilities.
3. Refer to page 36 for the definition of the following term(s): anaerobic digestion facilities.
IN LOS ANGELES COUNTY
2018 ANNUAL REPORTLOS ANGELES COUNTY COUTYWIDE INTEGRATED WASTE MANAGEMENT PLAN
APPENDIX E-5COMPOSTING, CHIPPING AND GRINDING, AND ANAEROBIC DIGESTION FACILITIES

CAST AIC
ASUZA
C HAE
YTICER
V LU C
B
GN
O
L
FAIRM ONT
CO
P I C O R I V E R A
C O M M E R C E
SANT AFE
E L M O N T E
ROLLINGHILLS
PALOS
SEQU IT
DEL REY
M O N T E B E L L O
PASADENA
D O W N E Y
I R W I N D
A L E
CO
M ARINA
LAWNDALEM ANHAT T AN
PT DU M E
ART ESIA
C E R R I T O S
NORT HWEST
SEAL COV E
HARBOR
P A L M D A L E
QU ART Z HILL
CO
GORM AN
CAT ALINAHARBOR
AV ALON
PT V ICENT E
PT FERM IN
EST AT ES
HILLS
ROLLING
LOM IT A
CO
COCO
EST AT ESS
V
RDEE
PALOS
ROCKY
V ERDES
OHRANC
CO
HILLSIGNAL
L A K E W O O D
CO
BELLFLOWER
HAWAIIANGARDENS
CO
UDNI
S T R Y
CO
CO
CO
INDU ST RY
W EST COV INA
CLAREMONT
SA
MID
ARODNEL
G
CO
CO
CO
CO
CO
CO
COCO
CO
CO
CO
HILLS
AINOM
CO
CO
CO
CO
CO
CO
CO
C A L A B A S A S
PT
M ALIBU PT
C I T Y O FM A L I B U
WEST LAKE
V ILLAGE
AGOU RAHILLS
CO HILLSHIDDEN
BEA
HC
HERMOSA
BEACH
HAWT HORNE
T O R R A N C E
CO
CU DAHY
B E L L
CO
CO
GARDENSBELL
W H I T T I E R
CO
LY NWOOD
PARKHU NT INGT ON
BELLAM WY OOD
D
U ARTE
BRADBU RY
CO
CO
T EM PLE CITY
EL M ONT E
SOU T H
SOU T H
P A S A D E N A
CO
CO
B U R B A N K
FLINT RIDGE
LA CANADA
SAN M AR
INO
A R C A D I A
CO
BALDWIN PARK
SAU GU S
P A L M D A L E
L A N C A S T E R
NORWALK
HEIGHTSLA HAB
RA
SPRINGS
PARAM OU NT
G A R D E N A
R E D O N D O
INGLEWOOD
EL SEGU NDO
BEACH
PT LOSANGELES
BEV ERLY
W
SE THOLLY WOOD
C
SANT A
SOL E SLEGNA
SAN
FERNANDO
LAV ERNE
NA
S
P O M O N A
W A L N U
T
S A N T A C L A R I T A
LA PU ENT E
RO
EMEAD
S
M ONT EREY PARK
V E R N O N
CO
D I A M O N D B A R
L A M I R A D A
SIERRA M
ADRE
M O N R O V I A
COV INAA L H A M B R A SA
N GABRIEL
G L E N D A L E
SOU T H GAT E
C O M P T O N
CARSO N
CO
VENTURA
COUNTY
VENTURA
COUNTY
KERN
COUN
TYSA
NBE
RNAR
DINO
COUN
TY
SAN
BERN
ARDIN
O
COUNTY
COUNTY
ORAN
GE
AV
AV
AV
BV
AV FOOT HILL
GRAND
AV
HY
BV
BASE LINE RD
AVTOWNE
HY
HUGHES
BVDR
ST
STST
BV N
N
RD
BV
FELIZLOS
AV
BV
AV
RD
6T H
PY
SAN
BV
CANYON
HYRD
RD
HY
ANGELES
M T
RED
BOX
PY
BV
T U JU NGARD
BV
HY
HY
RD
BV
BV
BV
ART ESIA
M AGIC
WOODMAN
AV
WY
BVLA
BV
VAN NU YS
RD
RD
BAR
BV
BV
RD
V ALLEY
BV
BV
BV
MAGNOLIA
AV
BVST
VINELAND
AV
AVTAMPA
M OU NT AIN
BV
DR
COLORADO HU NT INGT ON
RD
LIV EST
RD
AV C-6-LANCAST ER RD
AV ENU E
260TH
ST W
RD
THREEPOINTS
RD
OAK
LANCAST ER
PINE
CANY ON
RDFAIRMONT
RES RD
RD
FRANCISQU IT O
CANY ON
OLD
BV
SHERM AN
BALBOA
FALLBROOK
AV
M AY O
DR
LY ONS AV
RD
SAND
WEST
T HE
RD
SAN
ARROYO
RD
ARROWAV
DRFOOT HILL
FOOT HILLSAN
FERNANDO
BV
RD
ROSCOE
BV
DEV ONSHIRE
HY
HY
AZU SA
WILSHIRE
RD
RD
KANAN
SU NSET
BV
COAST
ELIZ ABET H
RD
BV
AV
MT
ALOST A
BV
LAKE
BV
ST
IM PERIAL
M T
RD
BL
V ENT U RA
BLV ICT ORY
WY
CARSON
COAST
25T HST
ALAMIT OS AV
AV
BVMAIN
B ST
ST
ST
ART ESIA
BV
NORWALK
FIREST ONE
ATLANTIC
BV
BV
BV
HYLEFFINGWELL
RD
BV
COLIMA
OFF
CU T
RD
NORWALK
RD
BV
AV
AV
ST CARSON
7T H
ATLANTIC
WILLOW
BV HY
ST
ST W
30T H
AV ENU E P
170TH
ST W
HILL
RD
HY
BIG PINES
AV ENU E
LANCAST ERRD
IJ
GAV ENU E
110TH
ST W
AV ENU E
10TH
10 TH
ST E
ST W
AV ENU E M
LAKE
RD
RD
RD
60T H
ST W
AV ENU E
AV ENU E
ST E
ST E
ST E
L
140TH
90T H
50 TH
47T H ST E
PEARBLOSSOM
PEARBLOSSOM
HY
HY
HY
ANT ELOPE
ST E
165TH
PALM DALE
SIERRA
BV
AV ENU E P
240TH ST E
AV ENU E O
HY
D
87 TH
ST E
E
FORT T EJON
RD
170TH
ST E
BOB'S GAP
RD
V ALY ERM O
RD
HY
RD
RD
RD
PACIFIC
DECKER
M ULHOLLAND RD
LAKE
M U LHOLLAND
VIRGENES
LAS
CANYON
M ALIBU
M U LHOLLAND
VALLEY
CIRCLE
SUNLAND
T U XFORD
HILL
GLENDALE VERDUGO
HU NT ING
T ON
M ISSION
M AIN
PECK
GABRIEL
BALDY
BOUQU ET
SOLEDAD CANY ON
SIERRA
SECO CYN
FERNANDO
V ALENCIA
RDSAN
CANYON
M UNZ RANCH
CANY ON
BIG
CREST
ANGELES
FOREST
GLEASON ANG
ELES
CREST
FOOT
AV
WILSON
PACIFIC
SEPU LV EDA
HAWT HORNE
WEST ERN WILMINGTON
BIG
ROCK CREEK
BROADW
AY
V ALLEYM AIN
HACIENDA
FU LLERT ON
LITT LE
T UJUNGA
DIAM OND
M ISSION
GRANDBREA CN
BREA
CNM ANCHEST ER
BREA
ROSECRANS
OCEAN
ALAMEDA
ROSEM EAD
CRY ST AL
LAKE
CANYON
SPU NKY
CANY ON
GODDE
KANAN
DUME
TOPANGA
SU NSET
CANYON
WHIT T IERLINCOLN
HENRY
T EM PLIN
LAS T U NAS DR
SLAU SON
GLENDORA AV
LANCAST ER
GORM AN POST RD AV C-15-LANCAST ER RD
STGAFFEY
SEPULVEDA
PACIFIC
AV
LAKEWOOD
BV
!(
!(
!(
!(
!(
!(
!(
!(
!(
!(
!(
!(
!(
!(
!(
!(
!(
!(
!(SANT A CAT ALINAISLAND
SAN CLEM ENT E
ISLAND
Note: T hese islands are not to scale nor at their true location.
§̈¦5
§̈¦5
§̈¦10
§̈¦10
§̈¦10 §̈¦10
§̈¦105
§̈¦105
§̈¦710
§̈¦110
§̈¦605
§̈¦605
§̈¦405
§̈¦405
§̈¦405
§̈¦210
§̈¦210
§̈¦710
§̈¦110
£¤101 £¤101
£¤101
}2
}71
}91}91
}90
}60
}60
}60}57
}57
}14
}14
}170
}210}110
}134
}118
}57
2
6
4
5
4
8
7
3
1
11
19
10
13
9
18
15
17
14
12
16
0 6M iles
REF: \\Pwisilong6-smb\gisfiles\SMPM\GIS_Services\MPMGIS\projects\epd\WasteFacilities\CCNG_2017.mxd DATE: Feb 11, 2019
Survey/M apping and Property M anagement Division, M apping and GIS Services Section
PERMITTED CAPACITY (Tpd)!( 84 - 99!( 100 - 299
!( 300 - 499
!( 500 - 833
·
Lopez Canyon Environmental CenterRalphs Renewable Energy FacilityAmerican Reclamation Chipping and GrindingNorth Hills Recycling, Inc.Norwalk Industries Green Waste OperationVan Norman Chipping and Grinding FacilityBurbank Green Waste Transfer OperationFoothill Soils, Inc.GWS, Inc. (Green Wise Soil Technologies)Oak Tree Worm Farm Chip&Grind (Compost)Recycled Wood ProductsRJ's Alondra Chipping and Grinding OperationRJ's Chipping and Grinding OperationRent-A-Bin (Chipping and Grinding Operation)Greencycle, Inc.Harbor Mulching FacilityEvergreen Recycling, Inc.GS Brothers, Inc.Joint Water Pollution Control Plant (LA County Sanitation Districts)
11950 Lopez Canyon Road, Los Angeles, 913422201 South Wilmington Avenue, Compton, 902204560 Doran Street, Los Angeles, 9003911700 Blucher Avenue, Granada Hills, 9134513780 East Imperial Highway, Santa Fe Springs, 9067015751 Rinaldi Street, Granada Hills, 913443000 Bel Aire Drive, Burbank, 9150422925 North Coltrane Street, Newhall, 9135010120 M iller Avenue, South Gate, 9028013326 Little T ujunga Canyon Road, Canyon Country, 913421313 East Phillips Boulevard, Pomona, 91766355 West Alondra Boulevard, Gardena, 902481135 East Florence Avenue, Inglewood, 9030220745 Santa Clara Street, Santa Clarita, 9135112815 East Imperial Highway, Santa Fe Springs, 906701400 North Gaffey Street, San Pedro, 907318700 Crock er Street, Los Angeles, 9000320331 South M ain Street, Carson, 9074524501 Figueroa Street, Carson, 90745
83360049949949949920020020020020020020019913512010010084
"
X
!
"
"
"
"
"
"
"
"
"
"
"
"
"
"
"
NOT ES:1 - Facilities listed are permitted by the CalRecycle as “Composting/Chipping and Grinding” or “Anaerobic Digestion” Facilities with daily capacities of 100 tpd or more (with the exception of the Joint Water Pollution Control Plant which has a permitted capacity of 84 tpd). 2 - Permitted capacity is based on the M ax. Permitted T hroughput as specified in the Solid Waste Facility Permit. If capacity is in cubic yards, a conversion factor is assumed as follows: 240 lbs/cubic yard for Composting/Chipping and Grinding facilities.3 - T pd is tons per day based on 6 operating days a week, 312 days a year. Composting/Chipping and Grinding Facilities. Anaerobic Digestion Facility. Facility located in County unincorporated area.X
"
Composting/Chipping and Grinding and Anaerobic Digestion Facilities
in Los Angeles County in 2018
FACILITY NAME AND ADDRESSNO. CAPACITY (Tpd)PERMITTED
12345678910111213141516171819
!
!
"

2018 Annual Report Los Angeles County Countywide Integrated Waste Management Plan
[This Page Intentionally Left Blank]

2018 Annual Report Los Angeles County Countywide Integrated Waste Management Plan
APPENDIX E-6: LIST OF SOURCE SEPARATED RECYCLING FACILITIES IN LOS ANGELES COUNTY AND NEIGHBORING COUNTIES IN 2018
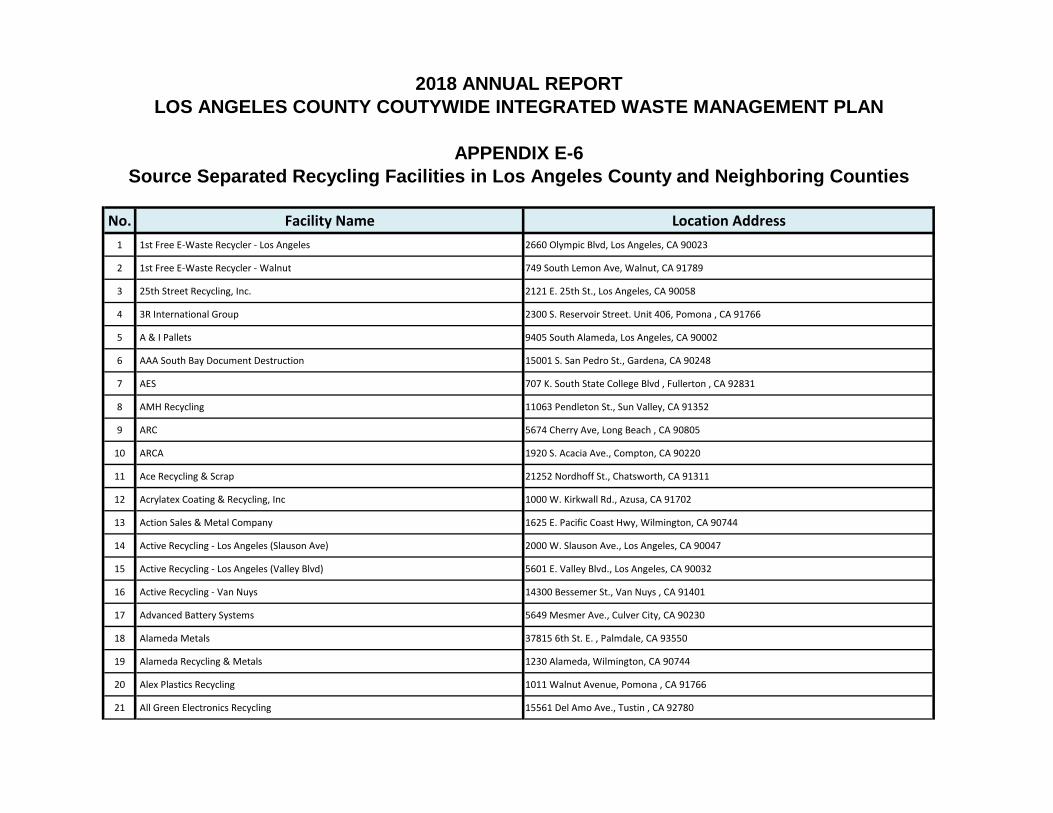
N o. Facility N am e L ocationA ddress
1 1st Free E-Waste Recycler - Los Angeles 2660 Olympic Blvd, Los Angeles, CA 90023
2 1st Free E-Waste Recycler - Walnut 749 South Lemon Ave, Walnut, CA 91789
3 25th Street Recycling, Inc. 2121 E. 25th St., Los Angeles, CA 90058
4 3R International Group 2300 S. Reservoir Street. Unit 406, Pomona , CA 91766
5 A & I Pallets 9405 South Alameda, Los Angeles, CA 90002
6 AAA South Bay Document Destruction 15001 S. San Pedro St., Gardena, CA 90248
7 AES 707 K. South State College Blvd , Fullerton , CA 92831
8 AMH Recycling 11063 Pendleton St., Sun Valley, CA 91352
9 ARC 5674 Cherry Ave, Long Beach , CA 90805
10 ARCA 1920 S. Acacia Ave., Compton, CA 90220
11 Ace Recycling & Scrap 21252 Nordhoff St., Chatsworth, CA 91311
12 Acrylatex Coating & Recycling, Inc 1000 W. Kirkwall Rd., Azusa, CA 91702
13 Action Sales & Metal Company 1625 E. Pacific Coast Hwy, Wilmington, CA 90744
14 Active Recycling - Los Angeles (Slauson Ave) 2000 W. Slauson Ave., Los Angeles, CA 90047
15 Active Recycling - Los Angeles (Valley Blvd) 5601 E. Valley Blvd., Los Angeles, CA 90032
16 Active Recycling - Van Nuys 14300 Bessemer St., Van Nuys , CA 91401
17 Advanced Battery Systems 5649 Mesmer Ave., Culver City, CA 90230
18 Alameda Metals 37815 6th St. E. , Palmdale, CA 93550
19 Alameda Recycling & Metals 1230 Alameda, Wilmington, CA 90744
20 Alex Plastics Recycling 1011 Walnut Avenue, Pomona , CA 91766
21 All Green Electronics Recycling 15561 Del Amo Ave., Tustin , CA 92780
2018 A NNUA L REP O RTL O S A NGEL ES C O UNTY C O UTYW ID E INTEGRA TED W A S TE M A NA GEM ENT P L A N
A P P END IX E-6S ou rc e S eparated Rec yc ling Fac ilities in L os A ngeles C ou nty and Neighboring C ou nties

N o. Facility N am e L ocationA ddress
2018 A NNUA L REP O RTL O S A NGEL ES C O UNTY C O UTYW ID E INTEGRA TED W A S TE M A NA GEM ENT P L A N
A P P END IX E-6S ou rc e S eparated Rec yc ling Fac ilities in L os A ngeles C ou nty and Neighboring C ou nties
22 Allan Company - Baldwin Park (Main Office) 14620 Joanbridge St, Baldwin Park , CA 91706
23 Allan Company - Commerce 5811 E. 81st Street, Commerce, CA 90040
24 Allan Company - Los Angeles 1417 Wright St., Los Angeles, CA 90015
25 Allan Company - Monrovia 145 W. Duarte Rd. , Monrovia, CA 91016
26 Allan Company - Santa Ana 2540 S. Main St. , Santa Ana, CA 92707
27 Allied Waste - Falcon 3031 East I Street, Wilmington, CA 90744
28 Alpert & Alpert Iron & Metal 1815 Soto St., Los Angeles, CA 90023
29 Alpha Recycling 13314 Saticoy St., North Hollywood, CA 91605
30 Amazon Environmental, Inc. 779 Palmyrita Ave, Riverside, CA 92507
31 Ambit Recycling (Ambit Pacific) 16228 S. Figueroa St, Gardena, CA 90248
32 American Metal Recycling 11150 Redwood Ave, Fontana, CA 92337
33 American National Recycling 2202 S. Milliken Ave., Ontario , CA 91761
34 American Reclamation Inc 4650 Doran St, East LA , CA 90023 )
35 American Soil 4730 Tapo Canyon Rd, Simi Valley, CA 93063
36 American Waste 2550 S. Soto St. , Los Angeles, CA 90023
37 Ammex Recycling Co. 3315 E. Washington Blvd., Los Angeles, CA 90023
38 Arcadia Reclamation 12321 Lower Azusa Rd, Arcadia, CA 91006
39 Architectural Detail 2602 Foothill Blvd, Pasadena, CA 91107
40 Arnie's Supply Service 1541 N. Ditman St., Los Angeles, CA 90063
41 Artesia Sawdust 13434 Ontario Ave., Ontario , CA 91761
42 Asco Metals 13014 Los Nietos Rd, Santa Fe Springs, CA 90670

N o. Facility N am e L ocationA ddress
2018 A NNUA L REP O RTL O S A NGEL ES C O UNTY C O UTYW ID E INTEGRA TED W A S TE M A NA GEM ENT P L A N
A P P END IX E-6S ou rc e S eparated Rec yc ling Fac ilities in L os A ngeles C ou nty and Neighboring C ou nties
43 Associated Students Recycling - CSULB 5800 Atherton St., Long Beach , CA 90840
44 Atlas Iron & Metal Co. 10019 S. Alameda St., Los Angeles, CA 90002
45 Azusa Land Reclamation 1211 West Gladstone Street, Azusa, CA 91702
46 Azusa Transfer and MRF 1501 W. Gladstone, Azusa, CA 91701
47 B & B Pallet 439 E. Carlin St., Compton, CA 90222
48 BCS, Inc. 8735 Remmet Ave. , Canoga Park , CA 91304
49 Baker Commodities 4020 Bandini Blvd., Vernon, CA 90058
50 Bas Tire Recycling 14050 Day St, Moreno Valley, CA 92553
51 Basic Fibers, Inc. 6019 S. Manhattan Pl, Los Angeles, CA 90047
52 Bata USA P.O. Box 1855, Walnut, CA 91788
53 Behavior Resources, Inc. 155 Pier Ave #B, Hermosa Beach, CA 90254
54 Bell Flower Recycling Center 17326 Woodruff Ave., Bellflower, CA 90706
55 Belmont Fibers 1736 Chapin Rd., Montebello, CA 90640
56 Benny's Oil Filter Recycling 6040 Walker Ave., Maywood, CA 90270
57 Bestway Recycling 2268 Firestone Blvd., Los Angeles, CA 90002
58 Bike Oven 3706 N. Figueroa St., Los Angeles, CA 90065
59 Brymax, Inc. 1802 Portrero Ave., South El Monte, CA 91733
60 Burbank Recycling Center 500 S. Flower St., Burbank, CA 91502
61 C & M Metals, Inc. 1709 E. 24th St., Los Angeles, CA 90058
62 CNS Metals 6850 Farmdale Ave., North Hollywood, CA 91605
63 CR & R, Inc. 11292 Western Ave., Stanton, CA 90680

N o. Facility N am e L ocationA ddress
2018 A NNUA L REP O RTL O S A NGEL ES C O UNTY C O UTYW ID E INTEGRA TED W A S TE M A NA GEM ENT P L A N
A P P END IX E-6S ou rc e S eparated Rec yc ling Fac ilities in L os A ngeles C ou nty and Neighboring C ou nties
64 CRM 15800 S. Avalon Blvd., Rancho Dominguez, CA 90220
65 CVT Recycling 1071 N. Blue Gum St, Anaheim , CA 92815
66 Cal Micro Recycling 1541 W. Brooks Street, Ontario, CA 91762
67 California Metals Recycling – Gardena 833 W. 182nd St., Gardena, CA 90248
68 California Metals Recycling - Harbor City 1022 Lomita Blvd., Harbor City , CA 90710
69 California Metals Recycling - South Gate 9309 Rayo Ave., South Gate, CA 90280
70 California Recycles 1932 Cotner Ave., Los Angeles, CA 90025
71 Canco Recycling 2725 E. South St., Long Beach, CA 90805
72 Carpeteria 42212 10th St. West, Unit 2A, Lancaster, CA 93534
73 Central Metal, Inc. - Huntington Park ( 8201 Santa Fe Ave., Huntington Park, CA 90255
74 Central Metal, Inc. - Los Angeles 2203 S. Alameda St., Los Angeles, CA 90058
75 Central Reclamation 2930 E. Pico Blvd., Los Angeles, CA 90023
76 Century Pallets 2911 Norton Ave., Lynwood, CA 90262
77 Certified Document Destruction 555 S. Rose St., Anaheim, CA 92805
78 Chiquita Canyon Landfill 29201 Henry Mayo Dr., Castaic, CA 91384
79 City Terrace Recycling, LLC 1525 Fishburn Avenue, Los Angeles, CA 90065
80 Clean Harbor Environmental Svcs, Inc. 5756 Alba St., Los Angeles, CA 90058
81 Clean Up America 2900 E. Lugo St. , Los Angeles, CA 90023
82 Co-West Commodities 1389 W. Mill St., San Bernardino, CA 92410
83 Coast Packing Co. 3275 E. Vernon Ave., Vernon, CA 90058
84 Coastal Inkjets, E-Waste Recovery 10021 1/2 Canoga Ave., Chatsworth, CA 91311

N o. Facility N am e L ocationA ddress
2018 A NNUA L REP O RTL O S A NGEL ES C O UNTY C O UTYW ID E INTEGRA TED W A S TE M A NA GEM ENT P L A N
A P P END IX E-6S ou rc e S eparated Rec yc ling Fac ilities in L os A ngeles C ou nty and Neighboring C ou nties
85 Commodities Resources 116 E. Prospect Ave., Burbank, CA 91502
86 Community Action Partnership 11870 Monarch St, Garden Grove, CA 92841
87 Conservation Station 20833 Santa Clara St., Santa Clarita, CA 91351
88 Corridor Recycling 22500 S. Alameda St., Long Beach, CA 90810
89 Crumb Rubber Manufacturers Company LLC 15800 S Avalon Blvd, Rancho Dominguez, CA 90220
90 D & T Recycling 14113 Garfield Ave, Paramount , CA 90723
91 DFS Flooring 15651 Saticoy St., Van Nuys, CA 91406
92 Dalton Recycling 555 S. Rose St., Anaheim, CA 92805
93 Dan Copp Crushing/Copp Materials - Anaheim 1120 N. Richfield Rd., Anaheim, CA 92807
94 Dan Copp Crushing/Copp Materials - Anaheim West 201 E. Commercial St., Anaheim, CA 92801
95 Dan Copp Crushing/Copp Materials - Beaumont 861 W. 4th St., Beaumont, CA N/A
96 Dan Copp Crushing/Copp Materials - Chino 11901 Highway 71, Chino, CA 91761
97 Dan Copp Crushing/Copp Materials - Colton 1120 S. La Cadena, Colton, CA 92324
98 Dan Copp Crushing/Copp Materials - El Segundo 332 S. Aviation Blvd., El Segundo , CA 90245
99 Dan Copp Crushing/Copp Materials - Fontana 13792 Slover Ave., Fontana, CA 92337
100 Dan Copp Crushing/Copp Materials - Santa Fe Spring 12017 Greenstone Ave., Santa Fe Springs , CA 90670
101 Dan Copp Crushing/Copp Materials - Sun City 27050 Watson Rd, Sun City, CA 92585
102 Danhew Enterprises 22108 S. Vermont Ave., Torrance, CA 90502
103 Darling International, Inc. 2626 E. 25th St., Los Angeles, CA 90058
104 Diversified Minerals, Inc. 1135 East Wooley Road, Oxnard, CA 93030
105 Donate Car USA 66 S. Primrose Avenue, Monrovia, CA 91106

N o. Facility N am e L ocationA ddress
2018 A NNUA L REP O RTL O S A NGEL ES C O UNTY C O UTYW ID E INTEGRA TED W A S TE M A NA GEM ENT P L A N
A P P END IX E-6S ou rc e S eparated Rec yc ling Fac ilities in L os A ngeles C ou nty and Neighboring C ou nties
106 Downey Area Recycling and Transfer Facility 9770 Washburn Rd., Downey, CA 90241
107 Downtown Diversion 2424 E. Olympic Blvd, Los Angeles, CA 90021
108 Downtown Metals & Recycling Center 526 S. Alameda St., Los Angeles, CA 90013
109 E-Cycle Environmental 2110 Artesia Blvd. Suite 445, Redondo Beach , CA 90728
110 E-Recycling of California 7230 Peterson Lane, Paramount, CA 90723
111 E-Waste Center, Inc. 5788 Smithway Street, Commerce, CA 90040
112 E-Waste Disposal, Inc. 2518 W. 5th St., Santa Ana, CA 92705
113 ECS Refining 705 Reed St., Santa Clara, CA 90550
114 ELV 1233 W. 255th St., Harbor City, CA 90710
115 Earthshine (Atkinson) 13633 S. Central Ave., Los Angeles , CA 90059
116 East Valley Recycling & Transfer 1150 S. Tippecanoe Ave., San Bernardino, CA 92408
117 Ecology Auto Parts Inc. Sante Fe Springs 13780 E. Imperial Hwy, Santa Fe Springs, CA 90670
118 Ecology Auto Parts Inc. Wilmington 1000 E. Lomita Blvd., Wilmington, CA 90744
119 Ecoplast - Los Angeles 815 E. 61st St., Los Angeles , CA 90001
120 Ecoplast – Pomona 1769 Mt. Vernon Ave., Pomona, CA 91768
121 Edgewise 602 N. Cyprus Street, Orange, CA 92867
122 Ekco Metals 2777 E. Washington Blvd, Los Angeles, CA 90023
123 Electronics Recycle Center 1395 E. Lexington Ave. #100, Pomona, CA 91766
124 Evolution Recycling 3535 E. 14th St., Los Angeles, CA 90023
125 Excellent Recycling & Scrap Metal 21252 Nordhoff St., Chatsworth, CA 91311
126 Express Metal Recycling 12207 Branford St., Sun Valley, CA 91352

N o. Facility N am e L ocationA ddress
2018 A NNUA L REP O RTL O S A NGEL ES C O UNTY C O UTYW ID E INTEGRA TED W A S TE M A NA GEM ENT P L A N
A P P END IX E-6S ou rc e S eparated Rec yc ling Fac ilities in L os A ngeles C ou nty and Neighboring C ou nties
127 F.S. Southwest Woodworks Co. 140 E. 163rd St., Gardena, CA 90248
128 Fairway Salvage 12428 Center St., South Gate, CA 90280
129 Foodbank Of Southern California 1444 San Francisco Ave., Long Beach , CA 90813
130 Foothill Unity Center – Monrovia 415 W. Chestnut Ave., Monrovia, CA 91016
131 Foothill Unity Center – Pasadena 191 N. Oak Ave., Pasadena, CA 91006
132 Freeway Building Materials 1124 S. Boyle Ave., Los Angeles, CA 90023
133 Full Circle Recycling 1920 Randolph St., Huntington Park, CA 90255
134 G. Harris International, Inc. 1025 MacFarland Ave., Wilmington, CA 90748
135 Gang Alternative Program 805 Traction Avenue, Los Angeles, CA 90013
136 Gardena Recycling Center 1538 W. 134th St, Gardena , CA 90249
137 General Waste Disposal 10717 Inez Avenue, Whittier, CA 90605
138 Gold Coast Recycling 5275 Colt Street, Ventura, CA 93003
139 Gold'N West Surplus 1121 California Ave, Riverside, CA 92881
140 Golden State Fibers 5585 E 61St Street, Commerce, CA 90040
141 Good Earth Recycling Center 2005 Bixby Rd., Lakewood, CA 90712
142 Grande Vista Steel 4611 Cecelia St., Cudahy, CA 90201
143 Green Spot Drop Off – Bellflower 17701 Ibbetson Avenue, Bellflower, CA 90706
144 Green Spot Drop Off – Glendale 4427 San Fernando Road, Glendale, CA 91204
145 Green Spot Drop Off - Long Beach 6655 Atlantic Ave., Long Beach, CA 90805
146 Green Spot Drop Off - Los Angeles (Federal Ave) 2300 Federal Avenue, Los Angeles, CA 90064
147 Green Spot Drop Off - Los Angeles (San Fernando Rd) 2840 N. San Fernando Road, Los Angeles, CA 90065

N o. Facility N am e L ocationA ddress
2018 A NNUA L REP O RTL O S A NGEL ES C O UNTY C O UTYW ID E INTEGRA TED W A S TE M A NA GEM ENT P L A N
A P P END IX E-6S ou rc e S eparated Rec yc ling Fac ilities in L os A ngeles C ou nty and Neighboring C ou nties
148 Green Spot Drop Off - Mission Hills 15237 South Brand Boulevard, Mission Hills, CA 91345
149 Green Spot Drop Off – Palmdale 37909 10th St. East, Palmdale , CA 93550
150 Green Spot Drop Off - Pasadena 686 S. Arroyo Parkway, Pasadena, CA 91105
151 Green Spot Drop Off - Santa Clarita 26825 Oak Avenue, Santa Clarita , CA 91351
152 Green Spot Drop Off – Walnut 3859 Valley Blvd., Walnut , CA 91789
153 Green Wise Soil Technologies 10120 Miller Way, South Gate, CA 90280
154 Greencycle 12815 East Imperial Highway, Santa Fe Springs, CA 90670
155 H & J Recycling Center 303 S. Pacific Ave., San Pedro, CA 90731
156 Habitat For Humanity - Greater Los Angeles 17700 S. Figueroa St., Gardena, CA 90248
157 Habitat For Humanity - Pomona Valley 4609 Holt Blvd, Montclair, CA 91763
158 Habitat For Humanity - San Gabriel Valley 770 N. Fair Oaks Ave., Pasadena, CA 91103
159 Hanson Aggregates - North Long Beach 6956 Cherry Ave, North Long Beach, CA 90805
160 Hanson Aggregates – Orange 6145 E. Santiago Canyon, Orange, CA 92869
161 Hanson Aggregates - South Gate 5625 Southern Ave, South Gate , CA 90280
162 Hanson Aggregates - South Long Beach 2850 California Ave., South Long Beach, CA 90805
163 Hi-Waste Disposal 11718 Arkansas St., Artesia, CA 90701
164 Hope For Homeless Youth 2406 Kent Street, Los Angeles, CA 90026
165 Hope Services 14770 E. Firestone Blvd. Suite 202, La Mirada, CA 90638
166 Hyran International Group 7000 E. Slauson, Commerce, CA 90040
167 Ideal Metal & Salvage Co. 18700 S. Broadway, Gardena, CA 90248
168 Imperial Western Products 4085 Bain Street, Mira Loma, CA 91752

N o. Facility N am e L ocationA ddress
2018 A NNUA L REP O RTL O S A NGEL ES C O UNTY C O UTYW ID E INTEGRA TED W A S TE M A NA GEM ENT P L A N
A P P END IX E-6S ou rc e S eparated Rec yc ling Fac ilities in L os A ngeles C ou nty and Neighboring C ou nties
169 International Recycling 12851 Alondra Blvd., Norwalk, CA 90650
170 JP Paper Shredders 428 W. Chestnut Ave., Monrovia, CA 91016
171 JP Rebon Wholesalers 1301 Hancock St. Unit C, Anaheim, CA 92807
172 Jack Engle & Co. 8440 S. Alameda St., Los Angeles, CA 90001
173 Jefferson Recycling Center 5717 W. Jefferson Blvd., Los Angeles , CA 90016
174 Joe's Plastics, Inc. 5725 District Blvd., Los Angeles , CA 90040
175 Jos Levin & Sons 2863 E. Slauson Ave, Huntington Park, CA 90255
176 Joy & G International, Inc. 1516 Highland Ave, Duarte , CA 91010
177 Julie's Trade Company 909 E. Slauson Ave., Los Angeles , CA 90001
178 Justice Cuts 5190 Wilson St., Riverside, CA 92509
179 Kay-Met Recycling 926 S. Nogales St., Rowland Heights, CA 91748
180 Kenco Paper Recycling 13314 Saticoy St., North Hollywood, CA 91606
181 Kinsbursky Brothers 1314 N. Anaheim Blvd., Anaheim, CA 92801
182 Korrect Imaging 6119 Cedar Mountain Dr., Alta Loma, CA 91737
183 Kramar's Iron & Metal, Inc. 8821 San Fernando Rd., Sun Valley , CA 91352
184 Kramer Metals - Ferrous Metals Division 2863 E. Slauson Ave., Los Angeles, CA 90001
185 L & R Wood Pallets 1530 Bonnie Beach Pl., Los Angeles, CA 90023
186 La Canada Recycling, Inc. 6449 San Fernando Rd., Glendale , CA 91201
187 La Records 16201 Stagg Street, Van Nuys, CA 91406
188 Lakin Tire Co. Of California, Inc. 15305 Spring Ave., Santa Fe Springs, CA 90670
189 Lancaster Recycling 45565 Division St., Lancaster, CA 93535

N o. Facility N am e L ocationA ddress
2018 A NNUA L REP O RTL O S A NGEL ES C O UNTY C O UTYW ID E INTEGRA TED W A S TE M A NA GEM ENT P L A N
A P P END IX E-6S ou rc e S eparated Rec yc ling Fac ilities in L os A ngeles C ou nty and Neighboring C ou nties
190 Laser Cartridge Exchange 545 W. Allen Ave. Suite 29, San Dimas, CA 91773
191 Lighting Resources, Inc. 805 E. Francis St., Ontario, CA 91761
192 Lima Recycling Center - La Puente 16023 Old Valley Blvd, La Puente , CA 91744
193 Los Angeles Conservation Corps 2824 S. Main St., Los Angeles, CA 90007
194 Los Angeles Fiber Company 5190 S. Santa Fe Ave., Vernon , CA 90058
195 Los Angeles Pumping Co., LLC P.O. Box 921393, Sylmar , CA 91392
196 Los Angeles Regional Foodbank 1734 E. 41st St., Los Angeles, CA 90058
197 Lu-Mar Metals Company 2120 N. Alameda St., Compton, CA 90222
198 Lumary's Tire Service 600 S. Santa Fe Ave., Los Angeles , CA 90021
199 Madison Materials 1035 E. 4th St., Santa Ana , CA 92701
200 Market Recycling, Inc. 2725 E.S. St., Long Beach, CA 90805
201 Mars Environmental P.O. Box 18029, Anaheim , CA 92817
202 Max Scrap Metals 21608 Nordhoff St., Chatsworth, CA 91311
203 Mercury Disposal System, Inc. 2650 Walnut Avenue Unit D, Tustin, CA 92867
204 Metropolitan Recycling Corporation 2601 S. Mount Vernon Ave, Bakersfield, CA 93306
205 Monrovia Recycling Center 145 W. Duarte Rd, Monrovia , CA 91016
206 Multi-Link International Corporation 12235 Los Nietos Rd., Santa Fe Springs, CA 90670
207 NASA Disposal P.O. Box 1755, Montobello, CA 90640
208 Neuwaste Business Recycling 4721 E. Washington Blvd., Commerce , CA 90040
209 New Generation Empowerment Group P.O. Box 1331, Culver City, CA 90232
210 New Green Day LLC 1710 East 111th Street, Los Angeles, CA 90059

N o. Facility N am e L ocationA ddress
2018 A NNUA L REP O RTL O S A NGEL ES C O UNTY C O UTYW ID E INTEGRA TED W A S TE M A NA GEM ENT P L A N
A P P END IX E-6S ou rc e S eparated Rec yc ling Fac ilities in L os A ngeles C ou nty and Neighboring C ou nties
211 New Horizon Salvage 11565 Branford St., Sun Valley , CA 91352
212 Newhall Junk & Salvage 12011 Branford St., Sun Valley, CA 91352
213 Newman & Sons, Inc. 9005 Bradley Ave., Sun Valley, CA 91352
214 Nick's Tire Service 3152 Bandini Blvd., Vernon, CA 90023
215 North Valley Construction 23802 Pine Street, Newhall, CA 91321
216 Nu Way 1270 Arrow Hwy, Irwindale, CA 91706
217 Number One Recycling 12051 Branford St., Sun Valley, CA 91352
218 OSS-Spectrum, Inc. 7125 Foothill Blvd., Tujunga, CA 91042
219 Ocean Blue Environmental Services 925 West Esther Street, Long Beach, CA 90813
220 Old Pasadena Vintage Lighting 2569 E. Colorado Blvd., Pasadena, CA 91107
221 One Stop Landscape Supply Co. 13024 San Timoteo Canyon Rd., Redlands , CA 92373
222 Out Of The Closet - Atwater Village Thrift Store 3160 Glendale Blvd., Glendale , CA 90039
223 Out Of The Closet - Canoga Park Thrift Store 21703 Sherman Way, Canoga Park , CA 91303
224 Out Of The Closet - Fairfax Thrift Store 360 N. Fairfax Ave., Los Angeles, CA 90036
225 Out Of The Closet - Glassell Park Thrift Superstore 2425 N. San Fernando Rd., Los Angeles , CA 90065
226 Out Of The Closet - Hollywood Thrift Store 6210 Sunset Blvd., Los Angeles, CA 90028
227 Out Of The Closet - Long Beach Thrift Store 3500 E. Pacific Coast Hwy, Long Beach , CA 90804
228 Out Of The Closet - Pasadena Thrift Store 1726 E. Colorado Blvd., Pasadena, CA 91106
229 Out Of The Closet - South Pasadena Thrift Store 1136 Fair Oaks Ave., South Pasadena, CA 91030
230 Out Of The Closet - Tarzana Thrift Store 18851 Ventura Blvd., Tarzana, CA 91356
231 Out Of The Closet - Venice Thrift Store 214 Lincoln Blvd., Venice, CA 90291

N o. Facility N am e L ocationA ddress
2018 A NNUA L REP O RTL O S A NGEL ES C O UNTY C O UTYW ID E INTEGRA TED W A S TE M A NA GEM ENT P L A N
A P P END IX E-6S ou rc e S eparated Rec yc ling Fac ilities in L os A ngeles C ou nty and Neighboring C ou nties
232 Out Of The Closet - Westside Thrift Store 10749 Pico Blvd., Los Angeles, CA 90064
233 P & T Metals 2213 Tyler Ave., South El Monte, CA 91733
234 P.W. Gillibrand 5810 Bennett Road, Simi Valley, CA 93062
235 PC Recycle 2580 Azurite Circle, Newbury Park, CA 91320
236 Pacific / West Recycling Services, Inc. P.O. Box 3369, Manhattan Beach, CA 90266
237 Pacific Coast Recycling - El Monte 12301 E. Valley Blvd., El Monte, CA 91732
238 Pacific Coast Recycling - South Gate 12428 Center Street, South Gate, CA 90280
239 Palmdale Recycling Center 38022 Sierra Hwy, Palmdale, CA 93550
240 Palos Verdes Recycling Center 26301 Crenshaw Blvd., Palos Verdes Estates, CA 90274
241 Pan Pacific Fibers, Inc. 14051 Marquardt Ave., Santa Fe Springs, CA 90670
242 Paramount Resource Recycling 7230 Petterson Lane, Paramount, CA 90723
243 Peach Hill Nursery 10765 Los Angeles Ave, Moorpark, CA 93021
244 Peck Road Gravel Pit 128 E. Live Oak Ave, Irwindale, CA 91706
245 Pedro Ruiz Recycling 3984 Whittier Blvd., Los Angeles , CA 90023
246 Performance Nursery 12777 Tierra Rejada Rd, Moorpark, CA 93021
247 Phonesells Computer Warehouse 702 West 139th St., Gardena, CA 90247
248 Pico Rivera Pallet 240 E. Congress St., Colton , CA 92324
249 Planet Green, Inc. ( 20724 Lassen St., Chatsworth, CA 91311
250 Poly Pac 4172 Bandini Blvd, VERNON, CA 90023
251 Pomona Scrap Metal Company 1432 E. 1st St., Pomona, CA 91766
252 Potential Industries 922 E. St., Wilmington, CA 90744

N o. Facility N am e L ocationA ddress
2018 A NNUA L REP O RTL O S A NGEL ES C O UNTY C O UTYW ID E INTEGRA TED W A S TE M A NA GEM ENT P L A N
A P P END IX E-6S ou rc e S eparated Rec yc ling Fac ilities in L os A ngeles C ou nty and Neighboring C ou nties
253 Powerstride Battery Company, Inc. – Hawthorne 4700 W. Rosecrans, Hawthorne , CA 90250
254 Powerstride Battery Company, Inc. - Santa Fe Springs 10532 Norwalk Blvd., Santa Fe Springs, CA 90670
255 Productivity California 10533 Sessler St., South Gate, CA 90280
256 Puente Hills Landfill 2800 Workman Mill Rd, Whittier, CA 90601
257 Puente Hills Materials Recovery Facility 2800 Workman Mill Rd., Whittier, CA 90601
258 RC Pallets 11500 Wright Rd., Lynwood, CA 90262
259 RTC (Recycle To Conserve) 9112 Graham Ave, Los Angeles , CA 90002
260 Reclaimed Aggregates, Inc. 2110 W. Aguamansa Rd., Colton, CA 92324
261 Recology Los Angeles TS (Community Recycling) 9147 De Garmo Ave, Sun Valley, CA 91352
262 Recycle America 8405 Loch Lomond Dr, Pico Rivera, CA 90660
263 Recycle America Alliance 701 E. Florence Ave., Los Angeles, CA 90001
264 Recycle4Charity.Com 24911 Avenue Stanford, Ste. 120, Valencia, CA 91355
265 Recycled Waste Products, Inc. 8834 Millergrove Dr., Santa Fe Springs, CA 90670
266 Recycled Wood Products 1313 East Phillips Boulevard, Pomona, CA 91766
267 Recycling Resources 1406 W. 2nd St., Pomona, CA 91766
268 Rent A Bin PO Box 4463, Chatsworth, CA 91311
269 Resource Conservation Group, LLC 8981 Sunset Blvd., Los Angeles, CA 90069
270 Revival Wear, Inc. 6515 McKinley Ave., Los Angeles , CA 90001
271 RockTenn Recycling 20502 Denker Ave., Torrance, CA 90501
272 SA Recycling – Anaheim 3200 E. Frontera, Anaheim, CA 92806
273 SA Recycling – Colton 790 E. M St., Colton, CA 92324

N o. Facility N am e L ocationA ddress
2018 A NNUA L REP O RTL O S A NGEL ES C O UNTY C O UTYW ID E INTEGRA TED W A S TE M A NA GEM ENT P L A N
A P P END IX E-6S ou rc e S eparated Rec yc ling Fac ilities in L os A ngeles C ou nty and Neighboring C ou nties
274 SA Recycling - East Los Angeles 2728 Long Beach Ave., East Los Angeles , CA 90058
275 SA Recycling – Fontana 15615 Arrow Blvd, Fontana, CA 92335
276 SA Recycling – Irwindale 2495 Buena Vista St., Irwindale, CA 91706
277 SA Recycling - Los Angeles 2104 E. 15th St., Los Angeles, CA 90021
278 SA Recycling – Lynwood 10313 S. Alameda St., Lynwood , CA 90002
279 SA Recycling – Montebello 1545 Gage Road, Montebello, CA 90640
280 SA Recycling - Sun Valley (San Fernando Rd) 9754 San Fernando Rd., Sun Valley , CA 91352
281 SA Recycling - Sun Valley (Tujunga Ave) 8250 Tujunga Ave., Sun Valley , CA 91352
282 SA Recycling - Terminal Island 901 Newdock St., Terminal Island, CA 90731
283 SD Pacific, Inc. 11-B Marconi, Irvine , CA 92618
284 Safeshred Co., Inc. 5928 S. Malt Ave., Commerce, CA 90040
285 Safety Kleen 2918 Worthen Ave., Los Angeles, CA 90039
286 Samiyatex 13003 South Figueroa St., Los Angeles, CA 90061
287 San Fernando Valley Pallet Company 20730 Dearborn, Chatsworth , CA 91311
288 Santa Fe Wrecking & Salvage 1600 S. Santa Fe Ave., Los Angeles, CA 90021
289 Santa Monica Community Recycling Center 2411 Delaware Ave, Santa Monica, CA 90404
290 Scholl Canyon Landfill 7721 N. Figueroa Street, Los Angeles, CA 90041
291 Second Harvest Foodbank Of Orange 8014 Marine Way, Irvine , CA 92618
292 Second Harvest Foodbank Of Riverside & SB 2950-B Jefferson St., Riverside , CA 92504
293 Secondary Fibers 6490-4 Stoney View Ln., Simi Valley , CA 93063
294 Shred-It California, Inc. 11821 Wakeman St., Santa Fe Springs, CA 90670

N o. Facility N am e L ocationA ddress
2018 A NNUA L REP O RTL O S A NGEL ES C O UNTY C O UTYW ID E INTEGRA TED W A S TE M A NA GEM ENT P L A N
A P P END IX E-6S ou rc e S eparated Rec yc ling Fac ilities in L os A ngeles C ou nty and Neighboring C ou nties
295 Simi Valley Base 240 W. Los Angeles Ave., Simi Valley, CA 93065
296 Simi Valley Recycling Center 400 West Los Angeles Ave, Simi Valley, CA 93065
297 Sims Recycling Solutions 20212 S. Rancho Way, Rancho Dominguez, CA 90220
298 Sirius Computer Associates 15561 Product Lane, D15, Huntington Beach, CA 92649
299 Skanska USA Civil West CA District, Inc. 27950 Sierra Del Sol, Thousand Palms , CA 92276
300 Sonoco Products Company 166 Baldwin Park Blvd, City of Industry, CA 91746
301 South Bay Recycling 15001 S. San Pedro St., Gardena , CA 90248
302 South Coast Fibers 4560 Doran St., Los Angeles , CA 90039
303 South Coast Recycling Metal 5487 San Fernando Rd. W., Los Angeles , CA 90039
304 Southwest Processors, Inc. 4120 Bandini Blvd., Vernon, CA 90023
305 Square Deal Plumbing & Heating Supplies 2302 E. Florence Ave, Huntington Park , CA 90255
306 Standard Feed 13751 S. Haven Ave., Ontario, CA 91761
307 Standard Metals Recycling 2032 E. 220th St., Long Beach, CA 90810
308 Star Scrap Metal Co., Inc. 14334 Firestone Blvd., La Mirada, CA 90638
309 Stop Scrap Metals 20749 Prairie St., Chatsworth, CA 91311
310 Storopack 12007 S. Woodruff Ave., Downey, CA 90241
311 Strategic Alliance 3211 E. 26th St., Vernon , CA 90023
312 Summit Pulp & Paper – Compton 1601 S. Anderson Ave., Compton, CA 90220
313 Summit Pulp & Paper - Los Angeles 2016 E. Bay St., Los Angeles, CA 90021
314 Summit Pulp & Paper – Riverside 1575 Marlboro Ave., Riverside, CA 92507
315 Sun Valley Paper Stock 8701 San Fernando Rd., Sun Valley, CA 91352

N o. Facility N am e L ocationA ddress
2018 A NNUA L REP O RTL O S A NGEL ES C O UNTY C O UTYW ID E INTEGRA TED W A S TE M A NA GEM ENT P L A N
A P P END IX E-6S ou rc e S eparated Rec yc ling Fac ilities in L os A ngeles C ou nty and Neighboring C ou nties
316 Sun-Lite Metals 2210 E. 85th Street, Los Angeles, CA 90001
317 Sunshine Canyon City/County Landfill 14747 San Fernando Rd., Sylmar, CA 91342
318 TSM Recovering & Recycling 3422 W. Pico Blvd., Los Angeles, CA 90019
319 TW Electronics Recycling 1612 N Indiana St., Los Angeles, CA 90063
320 Talco Plastics – Corona 1000 W. Rincon St., Corona , CA 92880
321 Talco Plastics - Long Beach 3270 E. 70th St, Long Beach, CA 90805
322 Tapo Rock And Sand 5023 Tapo Canyon Rd., Simi Valley, CA 93063
323 Tehachapi Recycling, Inc. 416 Dennison Road, Tehachapi, CA 93561
324 Temple Recycling Center 3521 W. Temple St., Los Angeles , CA 90004
325 The Reclaimer 12021 Lopez Canyon Road, Los Angeles , CA 91342
326 Tire Center, Inc. 1530 S. Alameda St., Los Angeles , CA 90021
327 Tko Electronics, Inc. 31113 Via Colinas, Westlake Village, CA 91362
328 Toner Warehouse 14629 Arminta St. Suite A, Van Nuys, CA 91402
329 Trash For Teaching 2946 E. 11th Street, Los Angeles, CA 90023
330 Tseng Long USA, Inc. - Slauson Ave 1160 E. Slauson Ave., Los Angeles, CA 90011
331 Tseng Long USA, Inc. - Vail Ave 2801 S. Vail Ave., Los Angeles, CA 90040
332 University Toner Recovery 1180 Murfield Rd, Los Angeles, CA 90019
333 Usedcardboardboxes.com - Los Angeles 4032 Wilshire Blvd., Suite 402, Los Angeles, CA 90010
334 Usedcardboardboxes.com – Montebello 720 S. Vail Ave., Montebello, CA 90803
335 Valley Base Materials 9050 Norris Ave., Sun Valley , CA 91352
336 Valley Iron & Metal 9754 San Fernando Rd., Sun Valley , CA 90280

N o. Facility N am e L ocationA ddress
2018 A NNUA L REP O RTL O S A NGEL ES C O UNTY C O UTYW ID E INTEGRA TED W A S TE M A NA GEM ENT P L A N
A P P END IX E-6S ou rc e S eparated Rec yc ling Fac ilities in L os A ngeles C ou nty and Neighboring C ou nties
337 Valley Metals 6850 Farmdale Ave., North Hollywood, CA 91650
338 Valley Recycling Center 20220 Plummer St., Chatsworth, CA 91311
339 Vanguard Foam & Packaging 15126 S. Broadway St., Gardena, CA 90248
340 Veolia Environmental Services 107 S. Motor Ave., Azusa, CA 91702
341 Vulcan Materials – Corona 1709 Sherborn St., Corona, CA 92879
342 Vulcan Materials – Irwindale 16005 Foothill Blvd, Irwindale, CA 91702
343 Vulcan Materials - Los Angeles (Main Office) 3200 San Fernando Rd., Los Angeles, CA 90065
344 Vulcan Materials - Oro Grande 20181 National Trails Hwy, Oro Grande, CA 92368
345 Vulcan Materials – Palmdale 6851 Ave. T., Little Rock , CA 93550
346 Vulcan Materials - San Bernardino 2400 W. Highland Ave., San Bernardino, CA 92407
347 Vulcan Materials - Santa Ana 1401 E. Warner Ave, Santa Ana , CA 92705
348 Walser's 23145 Kashiwa Court, Torrance, CA 90505
349 Waste Management Carson Transfer Station 321 W. Francisco St., Carson, CA 90745
350 West Coast Computer Recycler 9856 Baldwin Pl., El Monte, CA 91731
351 West Coast Rendering Co. 4105 Bandini Blvd., Vernon, CA 90023
352 West Los Angeles Recycling Center 4424 W. Jefferson Blvd., Los Angeles, CA 90016
353 West Valley Recycling 13373 Napa St., Fontana, CA 92335
354 Western Pacific Pulp & Paper 9400 Hall Road, Downey, CA 90241
355 Western Recycling Co., Inc. 13528 S. Western Ave., Gardena, CA 90249
356 WestRock 20502 Denker Avenue, Torrance, CA 90501
357 Westside Foodbank 1710 22nd Street, Santa Monica, CA 90404

N o. Facility N am e L ocationA ddress
2018 A NNUA L REP O RTL O S A NGEL ES C O UNTY C O UTYW ID E INTEGRA TED W A S TE M A NA GEM ENT P L A N
A P P END IX E-6S ou rc e S eparated Rec yc ling Fac ilities in L os A ngeles C ou nty and Neighboring C ou nties
358 Whittier Fertilizer 9441 Kruse Rd., Pico Rivera, CA 90660
Source: Los Angeles County Solid Waste Information Management Systems (SWIMS; August 2017)

2018 Annual Report Los Angeles County Countywide Integrated Waste Management Plan
[This Page Intentionally Left Blank]

2018 Annual Report Los Angeles County Countywide Integrated Waste Management Plan
APPENDIX E-7: LOCATIONS OF EXISTING INERT WASTE LANDFILLS/INERT DEBRIS DISPOSAL SITES IN LOS ANGELES COUNTY IN 2018 (MAP)

·|}þ
·|}þ
%&'(
%&'(
·|}þ %&'(
%&'(
·|}þ
·|}þ
%&'(
%&'(
%&'(
%&'(%&'(
%&'(%&'(·|}þ
·|}þ
·|}þ
·|}þ
·|}þ
·|}þ%&'(
%&'(
·|}þ
%&'(
%&'(
%&'(%&'(
·|}þ ·|}þ
·|}þ
·|}þ£¤
£¤£¤·|}þ
·|}þ
!(")
")
")")
")
")
")
")#*
#*
%&'(605
3
2
5
5
30
71
9191
90
60
60
60
57
57
1010
10 10
57
14
14
170
101 101
101
105
105
710
710
110
110
605
405
405
405
134 210
210118
110
6
4
2
9
8
7
5
1
11
10
1 Azusa Land Reclamation Landfill
2 Durbin Landfill
3 Hanson Aggregates West, Inc.
4 Manning Pit
5 Montebello Land & Water Co.
6 North Kincaid Pit
7 Nu-Way Arrow Reclamation
8 Peck Road Gravel Pit
9 Reliance Pit II Inert Debris Engineered Fill Site
10 Sun Valley Landfill
11 United Rock Products Pit #2
!(
±0 10
Miles
SANTA CATALINAISLAND
SAN CLEMENTEISLAND
These islands are not to scalenor at their true location.
FILE: \\Pwisilong6-smb\gisfiles\SMPM\GIS_Services\MPMGIS\projects\mpm\gismaps\wk_2834\inert_waste_Rev15.mxd DATE: Nov 20, 2019 Survey/Mapping and Property Management Division, Mapping and GIS Services Section
LOCATION OF EXISTING INERT WASTE LANDFILLS /INERT DEBRIS DISPOSAL SITES
IN LOS ANGELES COUNTY(as of DECEMBER 31, 2018)
LANDFILL NAMES CITIESNO.
Azusa
Irwindale
Irwindale
Irwindale
Montebello
Irwindale
Irwindale
Monrovia
Irwindale
Los Angeles
Irwindale
")
")
")
")
")
")
")
#*
#*
Legend
TIER
!( Full Solid Waste Facility Permit Tier
") Enforcement Agency Notification Tier
#* Unclassified
Major Freeways
Railroads
")

2018 Annual Report Los Angeles County Countywide Integrated Waste Management Plan
[This Page Intentionally Left Blank]

2018 Annual Report Los Angeles County Countywide Integrated Waste Management Plan
APPENDIX E-8: WASTE DISPOSAL BY JURISDICTION OF ORIGIN AT PERMITTED MUNICIPAL SOLID WASTE FACILITIES IN SOUTHERN
CALIFORNIA IN 2018 (MAP)

FILE
:\\
Pw
isil
on
g6
-sm
b\g
isfi
les\
SM
PM
\GIS
_Se
rvic
es\
MP
MG
IS\p
roje
cts\
ep
d\L
an
dF
ill\
Dis
posa
l_b
y_Ju
risd
icti
on
_2
01
8_
SoC
al_
rev
.mx
dD
AT
E:
No
v1
9,
20
19
Survey/Mapping & Property Management Division, Mapping & GIS Services Section
& >
!
!
!
!
!
!(
!(
!(
!(
"
"
§̈¦5
LOS ANGELESCOUNTY
LOSANGELES
COUNTY
SAN BERNARDINO COUNTY
RIVERSIDECOUNTY
SAN DIEGO COUNTY
LOS ANGELES COUNTY
ORANGE COUNTY
VENTURA COUNTY
KERN COUNTY
§̈¦10
§̈¦5
§̈¦15
§̈¦40
§̈¦8
§̈¦405
§̈¦215
§̈¦210
§̈¦805
§̈¦605
§̈¦110
§̈¦710
§̈¦105
§̈¦8§̈¦8
§̈¦10
§̈¦210
S ou rc es : E s ri, H ERE , Garm in, Interm ap, inc rem entP C orp. , GE B C O , US GS , FA O , N P S , N RC A N , GeoB as e, IGN , Kad as terN L , O rd nanc e S u rvey, E s riJapan, M ETI, E s riC hina (H ong Kong), (c )O penS treetM apc ontribu tors , and the GIS Us erC om m u nity
P A C I F I C O C E A N
0 4 8 12
MILES
4
LEGEND
Los Angeles County
Other Counties
Interstate Highway
Railroad
" Transformation Facility
Class III Landfills operated by:
! Los Angeles County
& > Los Angeles City & Los Angeles County
!( Other Cities
Other Counties
LANCASTER LANDFILL114,400 tons (367 tpd)
Remaining Capacity and Life:10.23 million tons and 23 years
ANTELOPE VALLEY LANDFILL510,400 tons (1,635 tpd)
SUNSHINE CANYONCITY/COUNTY LANDFILL
2,110,800 tons (6,765 tpd)
Remaining Capacity and Life:65.27 million tons and 19 years
CHIQUITA CANYON LANDFILL1,422,600 tons (4,560 tpd)
BURBANK LANDFILL31,800 tons (102 tpd)
Remaining Capacity and Life:2.26 million tons and 35 years
SCHOLL CANYON LANDFILL403,200 tons (1,292 tpd)
Remaining Capacity and Life:4.29 million tons and 11 years
CALABASAS LANDFILL307,400 tons (985 tpd)
Remaining Capacity and Life:4.91 million tons and 11 years
SAVAGE CANYON LANDFILL90,600 tons (290 tpd)
Remaining Capacity and Life:4.58 million tons and 37 years
COMMERCEREFUSE-TO-ENERGY FACILITY
38,800 tons (124 tpd)
SOUTHEAST RESOURCERECOVERY FACILTY
327,800 tons (1,051 tpd)
PEBBLY BEACH LANDFILL3,700 tons (12 tpd)
Remaining Capacity and Life:50,000 tons and 10 years
SAN CLEMENTE LANDFILL355 tons (1 tpd)
Remaining Capacity and Life:36,000 tons and 14 years
Remaining Capacity and Life:16 million tons and 7 years
MID-VALLEY SANITARY LANDFILL1,128,300 tons (3,616 tpd)
Remaining Capacity and Life:
37 million tons and 14 years
SAN TIMOTEO SANITARY LANDFILL275,800 tons (884 tpd)
Remaining Capacity and Life:7 million tons and 24 years
EL SOBRANTE LANDFILL3,386,500 tons (10,854 tpd)Remaining Capacity and Life:148 million tons and 43 years
Remaining Capacity and Life:104 million tons and 34 years
PRIMA DESHECHA SANITARY LANDFILL440,000 tons (1,410 tpd)
Remaining Capacity and Life:80 million tons and 83 years
SIMI VALLEY LANDFILL & RECYCLING CENTER1,275,300 tons (4,087 tpd)
Remaining Capacity and Life:50 million tons and 54 years
WASTE DISPOSAL BY JURISDICTION OF ORIGINAT PERMITTED MUNICIPAL SOLID WASTE FACILITIES
IN SOUTHERN CALIFORNIA2018
ImperialKernLos AngelesLos AngelesLos AngelesLos AngelesLos AngelesLos AngelesLos AngelesLos AngelesLos AngelesLos AngelesLos AngelesLos AngelesOrangeOrangeOrangeRiversideSan BernardinoSan BernardinoVentura
Mesquite Regional Landfill (See Inset B)H.M. Holloway Landfill (See Inset A)Antelope Valley LandfillBurbank LandfillCalabasas LandfillChiquita Canyon LandfillCommerce Refuse-to-Energy FacilityLancaster LandfillPebbly Beach LandfillSan Clemente LandfillSavage Canyon LandfillScholl Canyon LandfillSoutheast Resource Recovery FacilitySunshine Canyon LandfillFrank R. Bowerman Sanitary LandfillOlinda Alpha Sanitary LandfillPrima Deshecha Sanitary LandfillEl Sobrante LandfillMid-Valley Sanitary LandfillSan Timoteo Sanitary LandfillSimi Valley Landfill & Recycling Center
N/O356,000510,400
31,800307,400
1,422,60038,800
114,4003,700
35590,600
403,200327,800
2,110,8001,952,4001,843,500
440,003,386,5001,128,300
275,8001,275,300
20,0001,1411,635
102985
4,560124367
121
2901,2921,0516,7656,1715,9091,410
10,8543,616
8844,087
6003
122.264.91
59.75N/A
10.2350,00036,000
4.584.29N/A
65.27104
1680
14837
750
1001022351139
N/A2310143711
N/A1934
78343142454
COUNTY NAME TONNAGE TPD (Mil. Tons) (Years)
REMAININGCAPACITY LIFEANNUAL Ave.
Based on total tonnages disposed from January 1 thru December 31, 2018 (including imported waste).Total tonnages rounded to nearest hundred.N/O - Not Operational.N/A - Not Applicable or Available.
NOTES:
Remaining Capacity and Life:12 million tons and 22 years
CITY OFLOS ANGELES
57%
SANTACLARITA
12%
OTHERS21%
COUNTYUNINCORP.
6%
GARDENA4%
CITY OF LOSANGELES
51%
MALIBU6%
CALABASAS21%OTHERS
5%
COUNTYUNINCORP.
17%
OTHERS46%
SOUTHGATE10%
COMMERCE17%
CITY OFLOS ANGELES
20%
HUNTINGTON PARK7%
OTHERCOUNTIES
1%
SANBERNARDINO
COUNTY12%
RIVERSIDECOUNTY
29%
LOS ANGELESCOUNTY
50%(See table for breakdown)
OTHER COUNTIES2%
LOS ANGELESCOUNTY
62%(See table for breakdown)
VENTURA COUNTY36%
VERNON4%
COMPTON4%
AVALON100%
COUNTYUNINCORP.
100%
COUNTYUNINCORP.
8%
OTHERS2%
SOUTHPASADENA
1%GLENDALE
49%
PASADENA40%
WHITTIER51%
SANTA FESPRINGS
11%
OTHERS16%
COUNTYUNINCORP.
12%
OLINDA ALPHA SANITARY LANDFILL1,843,500 tons (5,909 tpd)
ORANGECOUNTY
53%
LOS ANGELESCOUNTY
42%(See table for breakdown)
FRANK R. BOWERMAN SANITARY LANDFILL1,952,400 tons (6,171 tpd)
LOS ANGELESCOUNTY
33%(See table for breakdown)
ORANGECOUNTY
66%
LOS ANGELESCOUNTY
49%(See table for breakdown)
SANBERNARDINO
COUNTY49%
OTHERCOUNTIES
1%
LOS ANGELESCOUNTY
51%(See table for breakdown)
SANBERNARDINO
COUNTY48%
SANBERNARDINO
COUNTY1%
OTHER COUNTIES4%
LOS ANGELES COUNTY16%
(See table for breakdown)
ORANGECOUNTY
79%
LONG BEACH54%
TORRANCE5%
LAKEWOOD5%
REDONDOBEACH
5%
CITY OFLOS ANGELES
56%
COUNTYUNINCORP.
10%
COUNTYUNINCORP.
9%
CITY OFLOS ANGELES
15%
LANCASTER71%
PALMDALE21%
COUNTYUNINCORP.
13%
LANCASTER7%
BURBANK100%
CITY OFLOS ANGELES
53%
IMPERIAL COUNTYSAN DIEGO COUNTY
§̈¦15
§̈¦5
§̈¦8§̈¦805
§̈¦8
S ou rc es : E s ri, H ERE , Garm in, Interm ap, inc rem entP C orp. , GE B C O , US GS , FA O , N P S , N RC A N , GeoB as e, IGN , Kad as terN L , O rd nanc e S u rvey, E s riJapan, M ETI,E s riC hina (H ong Kong), (c )O penS treetM apc ontribu tors , and the GIS Us erC omm u nity
MESQUITE REGIONAL LANDFILLFully permitted
but not yet operational
Capacity and Life:600 million tons and 100 years
!
KERN COUNTY
SAN BERNARDINOCOUNTY
SAN LUIS OBISPOCOUNTY
SANTA BARBARACOUNTY LOS ANGELES COUNTYVENTURA
COUNTY
§̈¦5
§̈¦15
§̈¦40
S ou rc es : E s ri, H ERE , Garm in, Interm ap, inc rem entP C orp. , GE B C O , US GS , FA O , N P S , N RC A N , GeoB as e, IGN , Kad as terN L , O rd nanc e S u rvey, E s riJapan, M ETI,E s riC hina (H ong Kong), (c )O penS treetM apc ontribu tors , and the GIS Us erC omm u nity
INSET B
H.M. HOLLOWAY LANDFILL356,000 tons (1,141 tpd)
Remaining Capacity and Life:3 million tons and 10 years
LOS ANGELES COUNTY48%
(See table for breakdown)
OTHER COUNTIES
11%
VENTURA COUNTY
4%
OTHERS2%
0 5 10 15
MILES
0 10 20 30
MILES
INSET A
(SEE INSET A)
(FOR IMPERIAL COUNTYSEE INSET B)
KERN COUNTY17%
Source: Los Angeles County Department of PublicWorksSolid Waste Informa� on Management System
(www.LACountySWIMS.org) and export data reports andsurveys received from facilities located out of the County, June 2019.
OTHERCOUNTIES
2%
ORANGE COUNTY20%
SAN DIEGOCOUNTY
8%
SAN BERNARDINOCOUNTY
5%
Remaining Capacity and Life:59.75 million tons and 39 years
OTHERCOUNTIES
1%
PALMDALE3%
ROSEMEAD10%
OTHER6%
OTHERS
26%
OTHERS31%
JURISDICTIONAL BREAKDOWN DISPOSED (TONS) PERCENT (%) JURISDICTIONAL BREAKDOWN DISPOSED (TONS) PERCENT (%) JURISDICTIONAL BREAKDOWN DISPOSED (TONS) PERCENT (%)
L os A ngeles 491 , 167 62% L os A ngeles C ity 121 , 144 22% L os A ngeles 115, 493 18%
C u lverC ity 40 , 623 5% L os A ngeles Uninc orporated 42 , 469 8% L ongB eac h 94, 2 13 15%
A gou ra H ills 15, 691 2% W es tC ovina 41 , 423 8% D owney 68 , 2 14 11%
M alibu 15, 511 2% Glend ora 26, 321 5% S ou thgate 36, 1 23 6%
O thers 223, 7 2 2 28% O thers 315, 353 58% O thers 332 , 355 51%
TOTAL 786,700 100% TOTAL 546,700 100% TOTAL 646,400 100%
JURISDICTIONAL BREAKDOWN DISPOSED (TONS) PERCENT (%) JURISDICTIONAL BREAKDOWN DISPOSED (TONS) PERCENT (%) JURISDICTIONAL BREAKDOWN DISPOSED (TONS) PERCENT (%)
L os A ngeles 7 2 1 , 60 3 43% L os A ngeles Uninc orporated 15, 68 2 11% L os A ngeles 19, 452 9%
L os A ngeles Uninc orporated 149, 8 66 9% W es tC ovina 15, 492 11% L ongB eac h 13, 0 7 2 6%
C ars on 8 9, 67 3 5% L os A ngeles C ity 12 , 461 9% B ellflower 9, 48 9 5%
S ou thGate 7 3, 661 4% Glend ora 9, 693 7% A rtes ia 6, 40 0 3%
O thers 647 , 60 2 38% O thers 8 9, 2 8 2 63% O thers 160 , 0 97 77%
TOTAL 1,682,400 100% TOTAL 142,600 100% TOTAL 208,500 100%
JURISDICTIONAL BREAKDOWN DISPOSED (TONS) PERCENT (%) JURISDICTIONAL BREAKDOWN DISPOSED (TONS) PERCENT (%)
L os A ngeles Uninc orporated 1 0 7 , 50 7 30% L os A ngeles 123, 133 16%
A naheim 7 0 , 0 40 20% Uninc orprated L A 7 1 , 495 9%
KernUninc orporated 60 , 67 0 17% Ind u s try 48 , 948 6%
C ars on 60 , 390 17% P ic o Rivera 40 , 8 0 5 5%
O thers 57 , 434 16% O thers 495, 529 64%
TOTAL 356,000 100% TOTAL 779,900 100%
H.M. Holloway Landfill
(Kern County)
Olinda Alpha Sanitary Landfill
(Orange County)
BREAKDOWN OF LOS ANGELES COUNTY JURISDICTIONS FOR OUT-OF-COUNTY DISPOSAL FACILITIES
2018
Simi Valley Landfill and Recycling Center
(Ventura County)
Mid-Valley Sanitary Landfill
(San Bernardino County)
Frank R. Bowerman Sanitary Landfill
(Orange County)
El Sobrante Landfill
(Riverside County)
San Timoteo Sanitary Landfill
(San Bernardino County)
Prima Deshecha Sanitary Landfill
(Orange County)

2018 Annual Report Los Angeles County Countywide Integrated Waste Management Plan
[This Page Intentionally Left Blank]