Cotton Production, Land Use Change and Resource Competition in the Aksu-Tarim River Basin, Xinjiang,...
19
Quarterly Journal of International Agriculture 53 (2014), No. 3: 243-261 Quarterly Journal of International Agriculture 53 (2014), No. 3; DLG-Verlag Frankfurt/M. Cotton Production, Land Use Change and Resource Competition in the Aksu-Tarim River Basin, Xinjiang, China Michael Kusi Appiah, Til Feike, Alexander Nimo Wiredu and Yusanjan Mamitimin University of Hohenheim, Stuttgart, Germany Abstract This paper assessed cotton production and land use change (CPLC) and resource competition along the Aksu-Tarim River (ATR) of Xinjiang, China. Trend analysis, correlation analysis, and the Comparative Advantage Indicies (CAI); Efficiency Advantage Index (EAI), Scale Advantage Index (SAI) and Aggregated Advantage Index (AAI) analysis were used in guiding efficient resource allocation for sustainable cotton production; minimize resource competition and conflict in the arid region. The results revealed a relative variation in comparative advantages (CA) in cotton produc- tion among upstream and downstream farms, and inside and outside Bingtuan between the years 1989 to 2009. CA for cotton production and agricultural land use area was observed for counties along the upper reaches of the ATR than their counterparts. Furthermore, CPLC were more responsive to policies than market price. Also, human, population, proximity of cotton farms to a water source, and cotton production was the major drivers of land use. Finally, key measures that could impact future sustainable cotton development were discussed based on CAI and ecology. Keywords: cotton, resource competition, efficient resource allocation, comparative advantage, Xinjiang, China JEL: Q00, Q1 1 Introduction Xinjiang leads in agricultural outputs in China, especially cotton production (SCULL, 2008) and is ranked first among all the other cotton producing provinces in the country. Cotton is one of the major crops grown in the region which provide employ- ment for over 10 million people through the textile industry, hence serving as a major source of livelihood of the people (UNEP, 2002). The Tarim River lies in the Northwest China and is the country's largest inland river that supply all human water activities in the region, as similarly found by SCULL et al. (2008) and LEIWEN et al. (2005) (n.d). The river receives its sources from snow and glacier melt in addition to the rainfall from the surrounding mountain ranges. Xinjiang is located in the northwest
-
Upload
zeppelin-university -
Category
Documents
-
view
1 -
download
0
Transcript of Cotton Production, Land Use Change and Resource Competition in the Aksu-Tarim River Basin, Xinjiang,...

Quarterly Journal of International Agriculture 53 (2014), No. 3: 243-261
Quarterly Journal of International Agriculture 53 (2014), No. 3; DLG-Verlag Frankfurt/M.
Cotton Production, Land Use Change and Resource Competition in the Aksu-Tarim River Basin, Xinjiang, China
Michael Kusi Appiah, Til Feike, Alexander Nimo Wiredu and Yusanjan Mamitimin
University of Hohenheim, Stuttgart, Germany
Abstract
This paper assessed cotton production and land use change (CPLC) and resource competition along the Aksu-Tarim River (ATR) of Xinjiang, China. Trend analysis, correlation analysis, and the Comparative Advantage Indicies (CAI); Efficiency Advantage Index (EAI), Scale Advantage Index (SAI) and Aggregated Advantage Index (AAI) analysis were used in guiding efficient resource allocation for sustainable cotton production; minimize resource competition and conflict in the arid region. The results revealed a relative variation in comparative advantages (CA) in cotton produc-tion among upstream and downstream farms, and inside and outside Bingtuan between the years 1989 to 2009. CA for cotton production and agricultural land use area was observed for counties along the upper reaches of the ATR than their counterparts. Furthermore, CPLC were more responsive to policies than market price. Also, human, population, proximity of cotton farms to a water source, and cotton production was the major drivers of land use. Finally, key measures that could impact future sustainable cotton development were discussed based on CAI and ecology.
Keywords: cotton, resource competition, efficient resource allocation, comparative advantage, Xinjiang, China
JEL: Q00, Q1
1 Introduction
Xinjiang leads in agricultural outputs in China, especially cotton production (SCULL, 2008) and is ranked first among all the other cotton producing provinces in the country. Cotton is one of the major crops grown in the region which provide employ-ment for over 10 million people through the textile industry, hence serving as a major source of livelihood of the people (UNEP, 2002). The Tarim River lies in the Northwest China and is the country's largest inland river that supply all human water activities in the region, as similarly found by SCULL et al. (2008) and LEIWEN et al. (2005) (n.d). The river receives its sources from snow and glacier melt in addition to the rainfall from the surrounding mountain ranges. Xinjiang is located in the northwest

244 Michael Kusi Appiah, Til Feike, Alexander Nimo Wiredu and Yusanjan Mamitimin
Quarterly Journal of International Agriculture 53 (2014), No. 3; DLG-Verlag Frankfurt/M.
of China. Xinjiang prefecture is the largest province among the five autonomous regions. It has an area of 1,600,000 sq km (625,000 square miles), and a population of at least 16 million. In 2004, the region harvested 1,345,000 tons of cotton on 997,000 hectares of arable land (XINJIANG STATISTICAL YEARBOOK, 1990-2010, and XPCC, 2010 (XPCC or Bingtuan = Xinjiang Production and Construction Corps)). Multi-faceted factors such as favourable climatic conditions along the Aksu-Tarim River; yearly sunshine between 2,500 to 3,000 hours, average annual rainfall around 150 millimeters (ml), and pivoted the successful higher productivity in cotton production in the region over the last two decades (from 1989-2009).
However, the capability of Xinjiang to keep China's number one cotton production status in the world (MEYER et al., 2008) has suffered setbacks from resource compete-tion that emanate from persistent water scarcity and increasing irrigated agricultural land over the last twenty years in the Aksu-Tarim River. Strong resource competition and conflicts among the different user groups, creates pressure on the scarce water and land resources that threatens the sustainability of cotton production along the river in the arid region. Furthermore, the increasing demand for a higher percentage of cotton produced from the local region (SINDELAR et al., 2011), pose ecological problems in the downstream cotton farms as the population settlement towards the upper reaches of Tarim River is at an alarming rate. The Chinese government's policy of bridging the cotton trade balance deficit by encouraging higher production to meet industrial demand, further worsen the intense competition for water and land resources among different users. Hence, all threatening the livelihood of farmers and cotton related workers within and around the various counties, Bingtuan or Xinjiang Productions and Construction Corps (XPCC), as well as the Aksu Administrative Offices and the Bayangol Mongol Autonomous prefectures.
Effort from previous studies that have evaluated comparative advantage of cotton production such as YU et al. (2006), only focused on the whole of Xinjiang using data from 1996 to 2003 and found that China enjoyed comparative advantage. Whilst comparing sustainability of cotton production between China and Australia, ZHAO et al. (2009), used time series trends and correlation estimates between 1980 and 2006. The study found that China’s relative access to reliable water supply enabled cultiva-tion of larger area and resulting higher cotton output than that of Australia. In addition ZHONG et al. (2000) on the other hand, only evaluated comparative advantages in grain production in China. In that study, indicators such as Domestic Resource Cost (DRC), Net Social Profitability (NSP), Efficiency Advantage Index (EAI), Scale Advantage Index (SAI) and Aggregated Advantage Index (AAI) were used. They found that efficiency advantages in grain varied across China and that efficient allocation of resources would improve grain production.

Cotton Production, Land Use Change and Resource Competition in the Aksu-Tarim River Basin 245
Quarterly Journal of International Agriculture 53 (2014), No. 3; DLG-Verlag Frankfurt/M.
Unlike YU et al. (2006) who focused on the period between 1999 and 2003, this paper extended the period from 1989 to 2009. The earlier studies considered the whole of Xinjiang province as a single unit. This paper disaggregates the analysis by location (i.e. inside XPCC or Bingtuan and outside XPCC, and upstream - downstream). More so, the paper combines trend analysis, and estimate of comparative advantage indicators to evaluate the economics of cotton production and agricultural land use change along the Tarim River. Correlation analysis was used to assess the relationship between the world market price of cotton and cotton production in China.
2 Material and Methods
2.1 Study Area
The objective of the study was to assess the economics of cotton production and land use change development along the Aksu-Tarim Region – a sub region of the Xinjiang Uighur Autonomous Region (XUAR). Xinjiang is located in the northwest of China. Xinjiang prefecture is the largest province among the five autonomous regions. These regions include Guanqxi, Inner Mongolia, Ninqxia, and Tibet. It lies within longitudes 79’ N and longitude 63’ E. Xinjian’s area, 1,600,000 sq km (625,000 square miles), which is about one-sixth of China's land mass is greater than the size of California (YU et al., 2006). Its mean annual rainfall is just around 150 millimeters (ml) on average. This provides a low humidity appropriate for the production of high quality agri-cultural products especially different types of cotton. The region recorded total grain output of 7.06 million tons and more than 34.59 million head of livestock in the year 2004 (YU et al., 2006). The output of staple crops increased significantly, with exceptional production amounts of sugar beets and cotton.
The Aksu-Tarim River is known for its economic support of the Xinjiang autonomous region by way of offering a distinctive, dynamic climate conditions that support all types of economic activities, especially cotton production. As a result of this and other factors such as changing climatic condition in the region, the Tarim River Basin Water Resource Commission founded in 1997 to oversee the management of the river. The commission was mandated to protect the river from over withdrawal and complete drying up. In addition, the commission fixes and allocate water quota for all economic activities in the arid region, including farming activities (THEVS, 2011). It has five bureaus under its control, including Aksu and Bayangol Prefectures, with the excep-tion of the XPCC whose operate under the army and therefore cannot be controlled by the commission (see THEVS, 2011, for more details).

246 Michael Kusi Appiah, Til Feike, Alexander Nimo Wiredu and Yusanjan Mamitimin
Quarterly Journal of International Agriculture 53 (2014), No. 3; DLG-Verlag Frankfurt/M.
Most farmers in this region use drip irrigation; more especially the state farms (XPCC) and the rest result to the flooding method. More importantly, about 70% to 80% of irrigation water for agriculture in the region comes from the Aksu-Tarim River. Land area is therefore, reclaimed from the desert land in this arid region, and converted to agricultural land conditioned that irrigation water is available. Among the major crops grown in the Xinjiang over the periods from 1989 to 2009, include cotton, grain, sugar beets, and oil bearing crops. Other crops such as watermelon, soy bean, apricots, tubers, lucernes, medicinal plants, apple, and other fruits are considered minor crops.
The study area covers 2 autonomous prefectures (Aksu and Bayangol), 2 cities, 17 counties and the Xinjiang Production and Construction Corps (XPCC Bingtuan) divisions one and two. Both Aksu and the Bayangol prefectures have autonomous status under the Chinese administration orders and comprise the entire Aksu-Tarim-Basin on the Chinese territory (Figure 1a). The XPCC farms are state farms under the control of the military and all production decisions are taken at the state level (top-down approach; by the military regulations) (XPCC, 2010). They have mechanized and modern farming structures and well planned system of farming units called 'divisions'. The divisions are not single farm unit rather collection of several farm units. Contrary, outside XPCC farms are private household mostly un-organized (with few cotton farmer groups linked to licensed cotton buyers associations) farmers who take decisions at the grass root (farm level), and significantly lag behind state farms in terms of organization, access to inputs, technology and research findings.
The selected counties (Figure 1a) under Bayangol prefecture comprises of Korla City, Luntai (Bugur) County, Yuli (Lopnur) County, Ruoqiang (Qarkilik) County, Qiemo (Qarqan) County, Hejing County, Hoxud County, Bohu (Bagrax) County; Aksu Ad-ministrative Offices also consists of the Aksu city, Wensu (Onsu) County, Kuqa County, Xayar County, Xinhe (Toksu) County, Baicheng (Bay) County, Wushi (Uxturpan) County, Awat County, and the Kalpin County.
The three administrative areas were purposefully and strategically stratified according to the geographical location of various farming sites in relation to the reaches of Tarim river (Figure 1b) into; the Total Xinjiang, which includes all the farms in the three prefectures; upstream county level also contains farms in Wushi, Wensu, Aksu City, Awat, Xayar, and Division one; the downstream county level, which also comprises of farms located at Kuqa, Luntai, Yuli and the Division 2; outside XPCC farms, which also consists of Wushi, Wensu, Aksu city, Awat, Xayar, Kuqa, Luntai and Yuli; and finally inside XPCC farms (state farms), which also consisting of Divisions one and two.

Cotton P
Figure
Source:
Figure
Source:
Production, L
e 1a. Prefe
generated us
e 1b. Farm
generated us
Land Use Ch
ectures of
sing Xinjiang
m locations
sing Xinjiang
hange and Re
Quarterly Journ
Aksu-Tar
g Statistical Y
s along Ak
g Statistical Y
esource Com
nal of Internation
rim River B
Yearbook (1
ksu-Tarim
Yearbook (1
mpetition in th
nal Agriculture 5
Basin
990-2010)
m River
990-2010)
he Aksu-Tari
53 (2014), No. 3
im River Bas
; DLG-Verlag F
sin 247
Frankfurt/M.

248 Michael Kusi Appiah, Til Feike, Alexander Nimo Wiredu and Yusanjan Mamitimin
Quarterly Journal of International Agriculture 53 (2014), No. 3; DLG-Verlag Frankfurt/M.
2.2 Method
This study first employed trend analysis to show the extent to which land resource is indirectly influenced by water resource availability and its accompanying cotton output. Secondly, the EAI, SAI and AAI, in addition to the statistical correlation estimates were employed to estimate efficiency and patterns of cotton production over the 20 year period. The trend analysis explained how the historical cotton production and yield levels per hectare of arable land resource varied among farmers in the study region. That is the period between years 1989 to 2009, given the scarce nature of water resource in the arid region. In addition, market price-output linkages were established. However, the paper did not attempt to evaluate profitability nor total factor pro-ductivity due to local price distortions and unavailability of cost components such as input prices of factors of productions. In Equation 1, EAI measure how efficiently a crop grows in a given region relative to the growing of other crops in that same region. It is calculated as the relative yield ratios of one crop in one region to the average yield of all crops in that same region to the yield of the same crop in the nation related to the average yield of all crops in the nation. The relative yield of the ith crop in the region is given as(Yc1/Aa1), the relative yield of all crops in the region also given as (Nyc/Nya). 1 = (( 1 / 1 ))/(( / )) (1)
Where, EAI1i = the efficiency advantage index of the ith crop - cotton, grown in region 1, Yc1i = the yield of the ith crop - cotton, in region 1, Aa1i = the average yield of all crops in region 1, Nyc = the national yield of the ith crop - cotton, in the Aksu-Tarim region (ATr), Nya = the national yield of all crops in the ATR. EAI calculations (Table 3) assume that; (some level of) competitive market structures exists in that region's economy, and there exists flexibility in mobility of technological diffusion YU (2006). In addition, the adoption of agricultural production system in that region or country is also assumed feasible. Hence, the EAI is used as a tool to measure the relative efficiency based on existing natural resource endowment, and other socio-cultural factors as well as other economic factors peculiar to the local conditions. If EAI1i value is greater than or equal to 1, it is interpreted as the yield of the ith crops - cotton, in region 1 on average, relative to yield of all other crops grown in the same region as being higher than that of the national average. That is, a region 1 has a comparative advantage in growing the ith crop - cotton, as compared to all other crops grown in the region. However, EAI1i value less than 1, indicates that the yield of ith crop - cotton, in the region 1, relative to yield of all other crops in the same region, is lower than that of the national average, and therefore has no yield or efficiency advantage for growing) ith crop - cotton, in region 1. The scale advantage index (Table 4) shows the extent to which certain crop(s) - cotton, is (are) grown in a particular region

Cotton Production, Land Use Change and Resource Competition in the Aksu-Tarim River Basin 249
Quarterly Journal of International Agriculture 53 (2014), No. 3; DLG-Verlag Frankfurt/M.
is (are) intense relative to that at the national average. The relative planted area of the ith crop-cotton, in the region is given as( 1 / 1 ), the relative planted area of all crops in the region given as ( / ). SAIij = ((Ac1i/Aa1i))/ ((Nci/Na)) (2)
Where: SAI1i = the scale advantage index of crop i -cotton, in region 1, Ac1i = the planted area of ith crop - cotton, grown in region 1, Aa1i = the total planted area of all crops grown in region 1, Nci = the total planted area of the ith crop - cotton, grown in the Aksu-Tarim Region and Na = the overall (total or national) planted area of all crops grown in the region. If SAI > 1, then the scale of the concentration of the ith crop - cotton, grown in region 1, is higher than the average national ratio of concentration in the Aksu-Tarim Region. This means that producers in region 1 prefer to grow more of the ith crop - cotton, compared to other producers in the nation. An SAI value less than 1 indicates that the degree of concentration of the ith crop - cotton, in region 1 is lower than that of the average national ratio in the region. This implies that, it is less profitable for farmers in region 1 to grow crop i - cotton, as compared to growing other crops in the region and vice versa. It indicates that producers in region 1 prefer to grow less of the crop i - cotton, as compared to other producers in the nation. Warranting the underlying assumptions that competitive market structures exist; farmers have control over crop mix, and can respond to either the market price or cost variability or both, the concentration levels are determined by economic factors or the profit margins of certain crops grown in the region. Larger index values are preferred and farmers are expected to commit more resources to the production of those crops concerned in the region. AAI (Figure 4) is an index for estimating cumulative advantage of specific crops in one region relative to the national average. It is calculated as the geometric average of the EAI and SAI as shown below
AAIji = √ ((EAIji*SAIji)) (3)
AAIji (Table 5) value greater than or equal to 1, means that the jth region has an overall comparative advantage over the national average for the growing of ith crop in the region, whilst AAIji value less than 1, means that the jth region does not have the overall comparative advantage over the national average of growing ith crops. (The ‘overall values’ = the Total Tarim County Level- in the Aksu-Tarim Region, were used as the 'Regional or national values').

250 Michael Kusi Appiah, Til Feike, Alexander Nimo Wiredu and Yusanjan Mamitimin
Quarterly Journal of International Agriculture 53 (2014), No. 3; DLG-Verlag Frankfurt/M.
3 Data
The study was based on time series data collected from the Xinjiang Statistical Yearbooks of China Statistical Service and the XPCC (appendix), the USDA, and IndexMundi commodities listings. Specifically, the data included land-use measured in hectares for the periods between the years 1989 to 2009. For the same period, data on output, measured in tons, of cotton and other crops were used. In addition, domestic and world market prices of cotton were used. The prices were quoted in US dollars.
4 Results
4.1 Analysis of Relative Land Use Changes and Cotton Production Trends
The results indicate that land use change in general for all farming activities increased significantly (2.8%) in the region over the period from 2,934 thousand hectares in the beginning year to over 4,700 thousand hectares at the terminal period (Figure 2). Table 1 summarizes the average growth of an area of land reclaimed for growing all the various farming crops over the period in Xinjiang. With the 2.8 % increase in land for farming in Xinjiang, upstream farms reclaimed 0.8% over downstream farms, whereas outside XPCC had 1.3% over the state farms (XPCC). However, farmers reclaimed 7.9% area for cotton cultivation as against 1.8% for other crops. Land reclaimed for cotton production analogously followed suit in terms of upstream-downstream, and outside - inside XPCC farms respectively in order of magnitude. In contrast, the rate of change for other crops was at a decreasing rate for downstream and XPCC farms.
Figure 2. Overall land use change trend in the Aksu-Tarim region
Source: generated using Xinjiang Statistical Yearbook (1990-2010)
0
1000
2000
3000
4000
5000
1989
1990
1991
1992
1993
1994
1995
1996
1997
1998
1999
2000
2001
2002
2003
2004
2005
2006
2007
2008
2009
area
in 1
000
hect
ares
year
Total
Cotton

Cotton Production, Land Use Change and Resource Competition in the Aksu-Tarim River Basin 251
Quarterly Journal of International Agriculture 53 (2014), No. 3; DLG-Verlag Frankfurt/M.
Table 1. Growth of an area of land reclaimed for all farm crops
Xinjiang Upstream Downstream XPCC Outside
Xinjiang 2.8 4.0 3.2 2.9 4.2
Cotton 7.9 10.3 9.8 7.4 12.3
Other 1.8 1.0 -0.4 -0.3 0.9
Source: generated using Xinjiang Statistical Yearbook (1990-2010)
However, examining the absolute land use trend for cotton below (Figure 3) gives a lucid pattern over the period. The Figure depicts the initial galloping increasing pattern for all the areas with the exception of the XPCC until the year 1999, afterwards both upstream and outside XPCC farms sagged in to assume their initial pattern. In converse, the XPCC and downstream farms' trend were smooth with a tendency of decreasing in land reclamations.
Figure 3. Land use trend for cotton cultivation in the Aksu-Tarim region
Source: generated using Xinjiang Statistical Yearbook (1990-2010)
The tremendous increases in land use in this arid region were attributed to human population growth in the region. This is in agreement with the results by Scull et al. (2008), YU et al. (2006), MEYER et al. (2008) and TANG and DENG (2010). As more people settle close to a water source for cotton production, more hectares of desert and virgin lands are converted for agricultural activities.
0
50
100
150
200
250
300
350
1989
1990
1991
1992
1993
1994
1995
1996
1997
1998
1999
2000
2001
2002
2003
2004
2005
2006
2007
2008
2009
area
100
0 he
ctar
e
year
inside XPCC
outside XPCC
upstream
downstream

252 Michael Kusi Appiah, Til Feike, Alexander Nimo Wiredu and Yusanjan Mamitimin
Quarterly Journal of International Agriculture 53 (2014), No. 3; DLG-Verlag Frankfurt/M.
Analogously, farming output production levels for all crops over the 20 year period increased on average per year by 8.6% provincially, 0.6% of upstream less than that of downstream, and 0.2% in outside XPCC farms less than that of the state farms (Table 2). With a 13.2% as against 1.5% (other crops) increased in cotton output amount, on average, per year, upstream farms enjoyed a higher increase in cotton production, 15.9% as against 13.2% for downstream farms. Whereas outside XPCC farms realized 17.7% growth in cotton output, farms within XPCC only observed 12.7% growth. Implicitly, higher human population in upstream (SHEN et al. 2010), lead to the use of more water resources for cotton production to the disadvantage of downstream farms, hence reflecting in cotton production amounts.
Table 2. Growth of output of all farm crops
Xinjiang Upstream Downstream XPCC Outside
Xinjiang 8.6 5.8 6.4 6.2 6.0
Cotton 13.2 15.9 13.2 12.7 17.7
Other 1.5 5.6 6.0 5.7 5.4
Source: generated using Xinjiang Statistical Yearbook (1990-2010)
4.2 Comparative Advantage in Xinxiang's Cotton Production along the Aksu-Tarim River (ATR)
The results of comparative advantage in cotton production and land use developments along the reaches of ATR in Xinjiang from 1990 to 2009 are summarized in Tables 3 through 5, and Figure 4. Over the 20 year period, most farms upstream of ATR had an efficiency in cotton production with a rising pattern (EAI = or >1) (Table 3), ahead of downstream farmers with only Division one achieving efficiency in 1/20 years. Meanwhile, Inside and Outside XPCC exhibit a wide difference in efficiency between, 1990 to 1999, and 2009 onwards. The development was supported by available land use for cultivating cotton through conversion of land use for other crops to cotton production (CHINA GOVERNMENT FIVE YEAR PLAN POLICY), proximity and availability of water supply.

Cotton Production, Land Use Change and Resource Competition in the Aksu-Tarim River Basin 253
Quarterly Journal of International Agriculture 53 (2014), No. 3; DLG-Verlag Frankfurt/M.
Table 3. Efficiency Advantage Index values for cotton (estimated using Eqn. 1 and data at appendix 1 and 2)
Year/ EAI
Up-stream
Down-stream
Outside XPCC
Inside XPCC
Year/EAI
Up-stream
Down-stream
Outside XPCC
Inside XPCC
1990 1.27 0.90 0.95 1.16 2000 1.50 0.75 1.35 1.01
1991 1.35 0.82 0.81 1.43 2001 1.37 0.74 0.94 1.20
1992 1.38 0.96 1.28 1.13 2002 1.46 0.81 1.00 1.27
1993 1.48 0.94 1.28 1.18 2003 1.51 0.83 0.95 1.37
1994 1.40 0.82 1.11 1.19 2004 1.55 0.81 0.94 1.41
1995 1.42 0.83 1.06 1.26 2005 1.57 0.82 0.98 1.37
1996 1.27 1.04 1.21 1.12 2006 1.61 0.83 0.97 1.44
1997 1.40 0.89 1.11 1.27 2007 1.84 0.82 1.07 1.50
1998 1.42 0.89 1.16 1.25 2008 1.76 0.9 1.14 1.49
1999 1.44 0.85 1.16 1.20 2009 1.83 0.88 1.19 1.50
Source: generated using Xinjiang Statistical Yearbook (1990-2010)
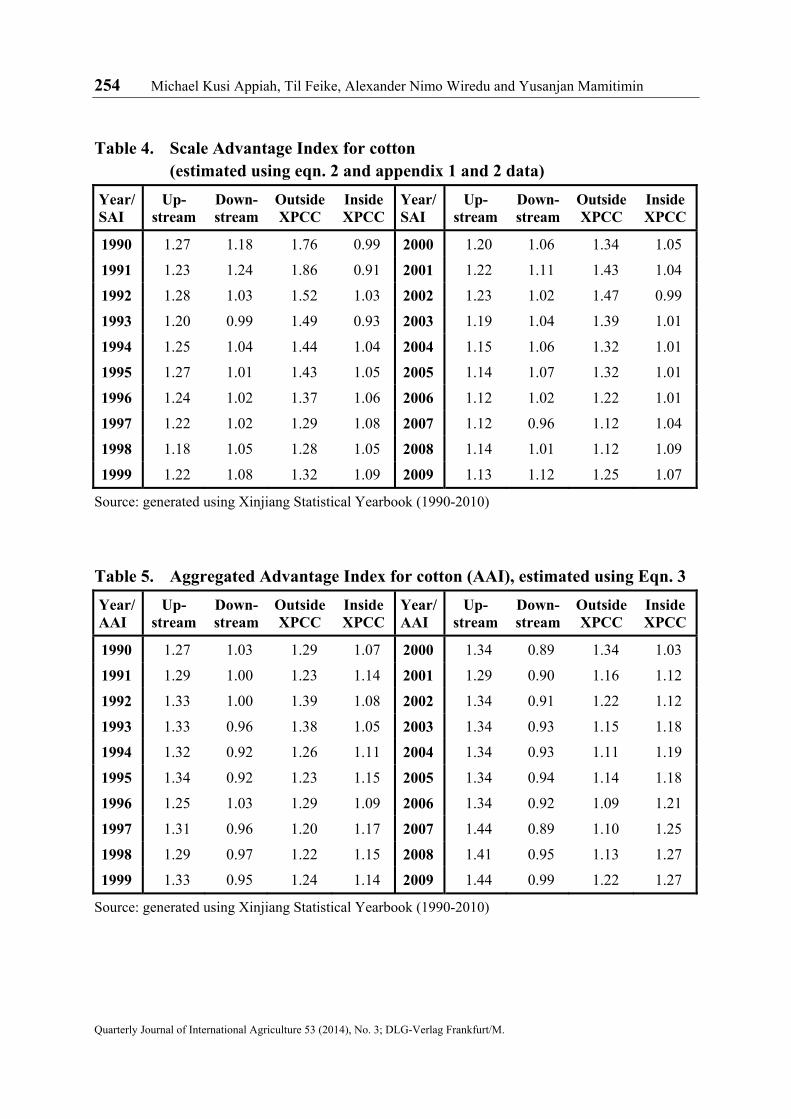
The SAI results (Table 4) showed a relatively high concentration of cotton cultivation per hectare of land available for cotton production in upstream farms over the 20 year period at a decreasing rate as against downstream farms with opposite trend. These were due to the differences in available arable land which is relatively limited to down-stream farms as compared to upstream farms. Thus farmers at downstream increased concentration of cotton cultivation in order to increase marginal profit (compete for market share). A similar pattern is observed for inside and outside XPCC, with the exception of farms in Division one. This could be attributed to factors such as better administrative management, availability of modern farm machinery, access to research findings, sustained water supply (LEIWEN et al., 2005) which Division one benefited as compared to other farms outside XPCC regions.
The AAI results (Table 5) depict that cotton farms located upstream of the river enjoyed the overall comparative efficiency in production of cotton above downstream farms. Farmers in areas such as Wushi County, Wensu, Aksu city, Awat, Xayer and Division one, achieved efficiency, scale and overall comparative advantages in cotton production. A similar pattern is observed for farms outside XPCC over inside XPCC farms with the exception of the years 2003 till 2009 where reverse occurs.
254 Michael Kusi Appiah, Til Feike, Alexander Nimo Wiredu and Yusanjan Mamitimin
Quarterly Journal of International Agriculture 53 (2014), No. 3; DLG-Verlag Frankfurt/M.
Table 4. Scale Advantage Index for cotton (estimated using eqn. 2 and appendix 1 and 2 data)
Year/ SAI
Up-stream
Down-stream
Outside XPCC
Inside XPCC
Year/SAI
Up-stream
Down-stream
Outside XPCC
Inside XPCC
1990 1.27 1.18 1.76 0.99 2000 1.20 1.06 1.34 1.05
1991 1.23 1.24 1.86 0.91 2001 1.22 1.11 1.43 1.04
1992 1.28 1.03 1.52 1.03 2002 1.23 1.02 1.47 0.99
1993 1.20 0.99 1.49 0.93 2003 1.19 1.04 1.39 1.01
1994 1.25 1.04 1.44 1.04 2004 1.15 1.06 1.32 1.01
1995 1.27 1.01 1.43 1.05 2005 1.14 1.07 1.32 1.01
1996 1.24 1.02 1.37 1.06 2006 1.12 1.02 1.22 1.01
1997 1.22 1.02 1.29 1.08 2007 1.12 0.96 1.12 1.04
1998 1.18 1.05 1.28 1.05 2008 1.14 1.01 1.12 1.09
1999 1.22 1.08 1.32 1.09 2009 1.13 1.12 1.25 1.07
Source: generated using Xinjiang Statistical Yearbook (1990-2010)
Table 5. Aggregated Advantage Index for cotton (AAI), estimated using Eqn. 3
Year/ AAI
Up-stream
Down-stream
Outside XPCC
Inside XPCC
Year/AAI
Up-stream
Down-stream
Outside XPCC
Inside XPCC
1990 1.27 1.03 1.29 1.07 2000 1.34 0.89 1.34 1.03
1991 1.29 1.00 1.23 1.14 2001 1.29 0.90 1.16 1.12
1992 1.33 1.00 1.39 1.08 2002 1.34 0.91 1.22 1.12
1993 1.33 0.96 1.38 1.05 2003 1.34 0.93 1.15 1.18
1994 1.32 0.92 1.26 1.11 2004 1.34 0.93 1.11 1.19
1995 1.34 0.92 1.23 1.15 2005 1.34 0.94 1.14 1.18
1996 1.25 1.03 1.29 1.09 2006 1.34 0.92 1.09 1.21
1997 1.31 0.96 1.20 1.17 2007 1.44 0.89 1.10 1.25
1998 1.29 0.97 1.22 1.15 2008 1.41 0.95 1.13 1.27
1999 1.33 0.95 1.24 1.14 2009 1.44 0.99 1.22 1.27
Source: generated using Xinjiang Statistical Yearbook (1990-2010)

Cotton Production, Land Use Change and Resource Competition in the Aksu-Tarim River Basin 255
Quarterly Journal of International Agriculture 53 (2014), No. 3; DLG-Verlag Frankfurt/M.
The current trend of overall CAI (AAI>1) for all counties and Division one and two in
the region (Table 5 and Figure 4), indicate an increasing trend of cotton production in
terms of comparative advantage, hence showing Xinjiang’s potential as a higher cotton
producing province over the rest of cotton producing provinces in China. These
capacities are high for farms at Aksu prefecture and Division one.
Figure 4. Overall Aggregated Advantage Index values for cotton in the
Aksu-Tarim Region
Source: generated using Xinjiang Statistical Yearbook (1990-2010)
4.3 Correlation and Cotton Price Analysis
Table 6 shows correlation estimates between cotton prices and cotton output among
various farms along the reaches of the ATR. The price analysis shows that there is a
weak linear relation between cotton prices both in China and the world market, and
cotton production as well as land resource allocated for cotton farming in the Xinjiang
province. The price - output relation for both prefectures from the years1989 till 2009
were positive for the world market prices (current and previous years) and cotton
output in Xinjiang (even though not significant) this shows the extent of cotton market
openness in China, whilst current and immediate past year’s local prices had a negative
linear relation to output, with a moderate effect.

256 Michael Kusi Appiah, Til Feike, Alexander Nimo Wiredu and Yusanjan Mamitimin
Quarterly Journal of International Agriculture 53 (2014), No. 3; DLG-Verlag Frankfurt/M.
Table 6. Correlation values for cotton prices and yield amounts in the Aksu-Tarim Region
Cotton price
Cotton Output
Upstream Downstream Inside XPCC
Outside XPCC
World market 0.295 0.261 0.312 0.258 0.293
China -0.531 -0.545 -0.532 -0.576 -0.512
Wpc_1 0.263 0.206 0.282 0.148 0.296
P1_1 -0.575 -0.609 -0.565 -0.647 0.493
Wpc_1 = the lagged values for cotton prices in the world market and P1_1 = the lagged values of cotton prices in China.
Source: own calculation using data from P1 from Xinjing Statistical Yearbooks 1990-2009. World market prices from Index Mundi annual commodity prices for the month of March 1990 to March 2009
5 Discussion
The study suggests that the high land reclamation in the region between 1989 and 2009 was mainly due to high human population influx to the region for agricultural activities especially cotton production and human settlements for farm workers. The land resource expansion was higher in both the upstream of the ATR and farming communities outside the XPCC farms than their counterparts. Strategically, higher percentage of hectares of the reclaimed land were allocated for cultivation of cotton, one of the major cash crops grown in the region, around upstream of Tarim river and outside XPCC state farms (STATISTICAL YEARBOOK, 1990-2010, and XPCC, 2010). As postulated by comparative advantage methodology above, farmers only (are willing to) allocated productive resources to the cultivation of crops in which they enjoy comparative advantages. As a result, upstream and outside XPPC farms, with the exception of division one enjoyed a comparative advantage in cotton production over the last 20 years (1989-2009).
Furthermore, significant land use activity around the upstream river may be due to the reason of proximity to water sources, constant water availability and supply for cotton farming (irrigation). Among the key reasons that accounted for the high land use activities for cotton production outside the XPCC farms over their counterparts included; different land control rules for within and outside XPCC farms, decision making process, and the level of technology in cotton production. XPCC farms have a strict land control rules and centralized decision making process which makes land use expansion rate slow as compared to outside XPCC farms. In addition to that, cotton

Cotton Production, Land Use Change and Resource Competition in the Aksu-Tarim River Basin 257
Quarterly Journal of International Agriculture 53 (2014), No. 3; DLG-Verlag Frankfurt/M.
farmers inside XPCC have access to research findings and highly farm machinery that could capitalize on high cotton yield with the same available land as compared to farms outside the XPCC (XPCC, 2010).
The cotton price policy analysis shows an indirect effect of price policy instruments such as Contracted Purchasing Scheme (CPS) in 1999 on decision to convert a piece of land from other uses (such as the growing of other crops) for cotton cultivation. Thus, the policy lead to an increase in cotton production irrespective of market mechanism since the prevailed market prices did not have any significant influence on cotton production amounts. Through the policy, Chinese government gives an advance payment guarantee price between 20% to 25 % to cotton farmers, CHENG et al. (2003), JIA (2004) and FAN et al. (2006) and farmers in return signed an undertaking to supply government with specific cotton output quota. This confirms the vital role played by the provincial government structures in setting cotton prices in the region. This is in agreement with the findings of YU et al. (2006). The same policy might have also accounted for the XPCC's use of more land for the production of other crops than cotton (0.3% higher than outside XPCC, Table 2 above) as they might not have received the CPS from the provincial government, since the XPCC is not under the provincial government.
6 Conclusion
This study analyzed the economics of cotton production and land use change along the Tarim River in Xinjiang-China from 1989 till 2009. The analysis showed that the region enjoys a significant comparative advantage in cotton production along the reaches of the ATR for both Aksu and Bayangol Prefectures. Cotton production amounts in the region are high and vary significantly in comparative advantage wise across the various counties and divisions along the reaches of the ATR. More so, competition for land and water resource use exist due mainly to population increase, cotton production and other agricultural activities which threatens the sustainability of Xinjiang's cotton potentials. Nonetheless, there is tremendous potential to improve resource allocation and to increase cotton production above the potential of trans-forming the Chinas economy. As cotton producers face more competition from world-wide cotton producing countries such as the United States and Australia, ensuring efficient resource allocation around the Aksu-Tarim River would improve the lively-hood of cotton farmers as well as cotton related workers-textile industries (China, number one in the world). It can be therefore deduced that, water in this arid region is the driving force of income for rural farming households, and therefore, no water supply, no income. Furthermore, embarking on activities other than cotton production at downstream would ensure full allocation of water resource for maximum cotton

258 Michael Kusi Appiah, Til Feike, Alexander Nimo Wiredu and Yusanjan Mamitimin
Quarterly Journal of International Agriculture 53 (2014), No. 3; DLG-Verlag Frankfurt/M.
production at upstream. In addition, reducing human settlement upstream through alternative policies will safeguard the Aksu-Tarim River from a complete drying up at downstream. Thus reducing, the water tension and disputes among farmers at opposing sides of the main water source. And finally, not the least, integrating community based water resource management into the state water management systems, would ensure the life span of the ATR to support cotton production in the region.
In summing up, the suggested policies may be introducing incentives for farmers out-side XPCC to use natural resources in a more sustainable way. In other words, to maintain a sustainable agricultural production in Xinjiang, an integrated framework of policies for production, natural resources, and environment is required. The current fragmented institutions and policies inside and outside XPCC should be revised.
References FANG, C. and B.A. BABCOCK (2003): China’s Cotton Policy and the Impact of China’s
WTO Accession and Bt Cotton Adoption on the Chinese and U.S. Cotton Sectors (03-WP-322). Iowa State University, Ames, Iowa. Available online at http://www.card.iastate.edu.
FAN, S., K. QIAN and X. ZHANG (eds.) (2006): China: an Unfinished Reform Agenda. Chapter 3. Agricultural R&D in the Developing World: Too little, Too Late? In: Pardey, P.G., J.M. Alston and R.R.R. Piggott (eds.). IFPRI, Washington, D.C.
INDEX MUNDI (var. years): World commodity price indices, (March) 1990 to 2010. Access on 20.09.2010 at http://www.indexmundi.com/commodities/?commodity=cotton& months=300&commodity=com.
JIA, D. (2004): An update and discussion on institutional reform and economic development in China's state farms. In: Economic Studies and References 2004 (70): 35-40.
LEIWEN, J., T. YUFEN, Z. ZHIJIE, L. TIANHONG and L. JIANHUA (2005): Water Resources, Land Exploration, and Population Dynamics in Arid Areas. The Case of Aksu-Tarim River in Xinjiang of China. In: Population and Environment 26 (6): 471-503.
MEYER, L., S. MACDONALD and J. KIAWU (2008): Report from the Economic Research Service. Cotton and Wool Situation and Outlook Yearbook. URL: http://www.usda.gov.
MEYER, W.B. and B.L. TURNER (2008): Human Population Growth and Global Land-Use / Cover Change Author (s). In: Annual Review of Ecology and Systematics 23 (1992): 39-61. Published by: Annual Reviews Stable. URL : http: //www.jstor.org/stable/ 2097281. Accessed 01/06/2009.
PEOPLES REPUBLIC OF CHINA (2011): 12th Five-Year Plan. China`s Statistical Press, Beijing.
SCULL, E. (2008): Environmental Health Challenges in Xinjiang. Research brief produced as part of the China Environment Forum´s partnership with Western Kentucky University on the USAID-supported China Environmental Health Project, Western Kentucky.
Cotton Production, Land Use Change and Resource Competition in the Aksu-Tarim River Basin 259
Quarterly Journal of International Agriculture 53 (2014), No. 3; DLG-Verlag Frankfurt/M.
TANG, D.S. and M.J. DENG (2010): On the management of water rights the Aksu-Tarim River. China Water Power Press, Beijing.
THEVS, N. (2011): Water Scarcity and Allocation in the Tarim Basin: Decision Structures and Adaptations on the Local Levels. In: Journal of Current Chinese Affairs 40 (3): 113-137.
UNEP (United Nations Environmental Program) (2002): Integrated assessment of trade liberalization and trade-related policies; a country study on the cotton sector in China. UNEP/ETB (2002/2004): People´s Republic of China. Cotton and Annual Products. Gain Report Number: Ch11018. Public distribution. Prepared by M.M. Meador and W. Xinping. Approved by S. Sindelar, New York and Geneva.
PEOPLE`S REPUBLIC OF CHINA (1990-2010): Xinjiang Statistical Yearbook China. Statistical Press, Beijing, China.
– (2010): Xinjiang Production and Construction, China. XPCC Press, Beijing, China.
XIAOLING, Y., M. YU and F. EWELL (2006): Xinjiang Cotton production and its Impacts to China's Cotton Market, 76402. Retrieved from http://www.tarleton.edu/Faculty/mu/ Documents/Publications/2006--Beltwide--Paper2--Poster.pdf.
XUFU, Z. and C. TISDEL (2009): The Sustainability of Cotton Production in China and in Australia: Comparative Economic and Environmental. Working paper on Economic, Ecology and the Environment No.157. The University of Queensland. Draft of a paper for an edited book entitled “Sustainable Agriculture: Technology, Planning and Management” to be published by Nova Science Publishers, New York.
YU, S. (2006): The Comparative Advantage of Upland Cotton Production in Texas. In: Texas Journal of Agricultural and Natural Resource 19: 31-38. Agricultural Consortium of Texas. Retrieved from http://www.tarleton.edu/~txjanr/Volumes/Vol 19-2006/ V19_06_Art04.pdf.
YULING, S. and H. LEIN (2010): Treating water as an economic good: policies and practices in irrigation agriculture in Xinjiang. In: The Geographical Journal 176 (2): 124-137.
ZHONG, F., Z. XU and L. FU (2000): Regional Comparative Advantage in China's Main Grain Crops. Working paper of the research project on Chinas Grain Market policy with special emphasis on the domestic grain trade. Center for international Economic studies, Adelaide University, Adelaide.
Contact author: Michael Kusi Appiah University of Hohenheim, Institute 410c, Linkenstr. 6, 70599 Stuttgart, Germany e-mail: [email protected]

260 Michael Kusi Appiah, Til Feike, Alexander Nimo Wiredu and Yusanjan Mamitimin
Quarterly Journal of International Agriculture 53 (2014), No. 3; DLG-Verlag Frankfurt/M.
Appendix
Table 7. Crop yield (kg ha-1) between 1990 and 2009
Year Upstream Downstream Outside Inside National output
All crops Cotton
All crops Cotton
All crops Cotton
All crops Cotton
All crops Cotton
1990 3.82 0.96 5.56 0.99 4.49 0.83 6.05 1.14 4.85 0.96
1991 3.57 1.11 4.91 0.93 4.40 1.16 5.05 0.95 4.56 1.06
1992 3.65 1.27 4.31 1.05 4.60 1.01 4.54 1.46 4.61 1.17
1993 3.63 1.35 4.77 1.12 4.58 1.07 4.78 1.54 4.68 1.18
1994 3.76 1.51 5.30 1.25 4.78 1.32 5.03 1.60 4.84 1.39
1995 3.79 1.64 5.48 1.38 4.90 1.49 5.22 1.68 4.98 1.52
1996 4.06 1.18 5.41 1.29 5.34 1.08 5.07 1.40 5.27 1.21
1997 4.23 1.45 5.69 1.24 5.68 1.35 5.35 1.45 5.59 1.37
1998 4.31 1.71 5.96 1.48 5.87 1.63 5.11 1.66 5.67 1.58
1999 4.08 1.47 6.25 1.32 5.68 1.33 5.39 1.57 5.60 1.40
2000 4.30 1.45 6.87 1.15 5.65 1.07 5.84 1.77 5.78 1.30
2001 4.44 1.87 7.81 1.77 5.82 1.82 6.49 1.87 5.87 1.81
2002 4.86 1.80 8.66 1.79 6.87 1.74 7.32 1.87 6.98 1.77
2003 4.67 1.82 8.81 1.88 6.63 1.74 8.06 1.98 6.99 1.80
2004 4.76 1.87 9.27 1.92 6.75 1.78 8.54 2.04 7.21 1.83
2005 4.73 1.98 9.16 2.01 6.78 1.81 8.66 2.26 7.18 1.92
2006 4.79 1.98 9.85 2.10 7.04 1.83 9.32 2.32 7.60 1.95
2007 4.37 2.03 10.46 2.17 7.50 1.84 9.02 2.44 7.90 1.99
2008 4.51 1.85 9.33 1.95 7.46 1.58 9.33 2.48 7.89 1.84
2009 4.92 1.94 10.36 1.96 8.73 2.51 9.84 1.67 8.97 1.93
Source: XINJIANG STATISTICAL YEARBOOK (1990-2010)

Cotton Production, Land Use Change and Resource Competition in the Aksu-Tarim River Basin 261
Quarterly Journal of International Agriculture 53 (2014), No. 3; DLG-Verlag Frankfurt/M.
Table 8. Land use (ha) between 1990 and 2009
Year Upstream Downstream Outside Inside National output
All crops Cotton
All Crops Cotton
All crops Cotton
All crops Cotton
All crops Cotton
1990 278.4 68.8 138.5 31.7 134.6 54.4 138.5 46.2 576.4 112.3
1991 293.0 96.3 148.1 49.0 150.2 70.7 148.1 74.6 605.2 161.7
1992 304.7 111.7 156.0 46.2 157.3 89.5 156.0 68.5 629.7 180.4
1993 296.4 116.4 149.8 48.5 156.3 88.5 149.8 76.4 605.1 198.0
1994 297.7 140.4 147.4 57.7 155.3 113.8 147.4 84.3 603.6 227.7
1995 304.4 141.8 150.1 56.0 159.5 114.0 150.1 83.7 617.9 227.3
1996 310.5 151.6 154.9 62.2 164.0 125.3 154.9 88.4 632.5 248.8
1997 332.0 173.2 161.6 71.0 175.0 147.2 161.6 97.0 669.0 287.2
1998 345.1 190.4 163.5 80.4 181.0 162.2 163.5 108.6 696.4 327.0
1999 350.0 192.0 169.0 82.1 185.8 163.1 169.0 111.0 709.3 320.0
2000 351.8 189.4 163.6 77.5 188.7 153.7 163.6 113.2 702.4 315.3
2001 362.0 194.6 163.9 80.0 190.0 154.3 163.9 120.2 744.7 328.5
2002 369.1 197.2 171.5 76.3 190.5 151.5 171.5 122.0 729.2 317.2
2003 362.9 201.3 174.9 84.4 187.0 164.8 174.9 120.9 734.5 341.7
2004 367.7 205.2 181.5 93.3 196.9 172.5 181.5 126.0 769.4 372.9
2005 385.8 211.0 192.7 99.4 199.0 183.7 192.7 126.7 817.9 393.7
2006 386.6 235.5 190.2 105.9 199.9 207.7 190.2 133.7 808.4 441.5
2007 388.3 274.1 195.1 118.1 217.6 239.5 195.1 152.6 825.7 518.1
2008 468.8 326.9 234.3 145.0 230.2 314.7 234.3 157.2 988.1 604.8
2009 545.2 329.4 233.8 140.8 231.8 315.1 233.8 155.2 1086.0 583.2
Source: XINJIANG STATISTICAL YEARBOOK (1990-2010)