Cost-Utility Analysis of Eprosartan Compared to Enalapril in Primary Prevention and Nitrendipine in...
15
Cost-Utility Analysis of Eprosartan Compared to Enalapril in Primary Prevention and Nitrendipine in Secondary Prevention in Europe—The HEALTH Model Björn Schwander, BSc, 1 Birgit Gradl, MSc, 2 York Zöllner, PhD, 2 Peter Lindgren, PhD, 3 Hans-Christoph Diener, MD, 4 Stephan Lüders, MD, 5 Joachim Schrader, MD, 5 Fernando Antoñanzas Villar, PhD, 6 Wolfgang Greiner, PhD, 7 Bengt Jönsson, PhD 8 1 Analytica International, Lörrach, Germany; 2 Solvay Pharmaceuticals, Hannover, Germany; 3 I3innovus, Stockholm, Sweden; 4 Department of Neurology, University Duisburg-Essen, Germany; 5 St.-Josefs-Hospital, Cloppenburg, Germany; 6 University of de la Rioja, Spain; 7 University of Bielefeld, Bielefeld, Germany; 8 Stockholm School of Economics, Stockholm, Sweden ABSTRACT Objective: To investigate the cost-utility of eprosartan versus enalapril (primary prevention) and versus nitrendipine (secondary prevention) on the basis of head-to-head evidence from randomized controlled trials. Methods: The HEALTH model (Health Economic Assessment of Life with Teveten ® for Hypertension) is an object-oriented probabilistic Monte Carlo simulation model. It combines a Framingham-based risk calculation with a systolic blood pressure approach to estimate the relative risk reduction of cardiovascular and cerebrovascular events based on recent meta-analyses. In secondary prevention, an additional risk reduction is modeled for eprosartan according to the results of the MOSES study (“Morbidity and Mortality after Stroke—Eprosartan Compared to Nitrendipine for Secondary Prevention”). Costs and utilities were derived from published estimates considering European country-specific health- care payer perspectives. Results: Comparing eprosartan to enalapril in a primary prevention setting the mean costs per quality adjusted life year (QALY) gained were highest in Germany (€24,036) followed by Belgium (€17,863), the UK (€16,364), Norway (€ 13,834), Sweden (€ 11,691) and Spain (€ 7918). In a secondary prevention setting (eprosartan vs. nitrendipine) the highest costs per QALY gained have been observed in Germany (€9136) followed by the UK (€6008), Norway (€1695), Sweden (€907), Spain (€-2054) and Belgium (€-5767). Conclusions: Considering a €30,000 willingness-to-pay threshold per QALY gained, eprosartan is cost-effective as compared to enalapril in primary prevention (patients 50 years old and a systolic blood pressure 160 mm Hg) and cost-effective as compared to nitrendipine in second- ary prevention (all investigated patients). Key words: cost-utility, eprosartan, enalapril, nitrendipine. Introduction According to the World Health Organization, approximately 62% of cerebrovascular disease and 49% of ischemic heart disease are attributable to suboptimal blood pressure control. Worldwide, high blood pressure is estimated to cause 7.1 million deaths per year (i.e., 13% overall mortality) [1]. High blood pressure in nondiabetics is defined as a diastolic blood pressure (DBP) >90 mm Hg and/or a systolic blood pressure (SBP) >140 mm Hg and graded into mild (SBP 140– 159 and/or DBP 90–99 mm Hg), moderate (160–179 and/or 100–109 mm Hg) and severe hypertension (180 and/or 110 mm Hg) [2]. The effectiveness of antihypertensive drug treatment is well established and has been quantified in terms of overall reduction in the relative risk for cerebrovascular events (such as stroke and transient ischemic attack) and cardiovascular diseases (such as myocardial infarction [MI] and angina pectoris [AP]) [3–9]. In patients with moderate to severe hypertension, without cardiovascular or cerebrovascular diseases (primary prevention population), there is evidence that the angiotensin receptor blocker (ARB) eprosartan (Teveten, Tevetens, Barcelona, Spain) is more effective in lowering SBP as directly compared to the angiotensin-converting-enzyme inhibitor (ACEI) enalapril [10]. During the past 10 years, several prospective cohort studies and meta-analyses have documented that SBP is a more important risk factor for cardiovascular (CV) and cerebrovascular (CBV) dis- eases than DBP, as was believed in the past [6,7,11–14]. In the field of secondary prevention the PROGRESS study (Perindopril Protection Against Recurrent Stroke Study) was the first large trial to document the positive influence of hypertension treatment on the CV and CBV risk within a population of patients with a primary CBV event. In this study, the ACEI perindopril (in possible combination with the diuretic indapam- ide) was compared to a placebo [15]. Further evidence for the reduction of CV and CBV events within a population of patients with previous CBV events (stroke and/ or transient ischemic attack [TIA]) was provided by the MOSES study (MOrbidity and mortality after Stroke— Eprosartan vs. nitrendipine for Secondary prevention). In this secondary prevention study, the calcium channel blocker (nitren- dipine) was compared to the ARB eprosartan [16]. Although the blood pressure reduction in both study arms was comparable (as intended by the study protocol) eprosartan showed a significantly greater relative risk reduction for CV and CBV events and overall mortality compared to that of the patients treated with nitren- dipine. It is likely that this effect is attributable to greater stimu- lation of the angiotensin II receptor and improved endothelial function (both not measured in MOSES) in patients on ARB therapy [17]. As both comparator substances, enalapril and nitrendipine, are available as generics depending on the country, there is a sizeable price difference between them and eprosartan. This Address correspondence to: Birgit Gradl, Solvay Pharmaceuticals Market- ing & Licensing AG; Hegenheimermattweg 127, CH-4123 Allschwil, Switzerland. E-mail: [email protected] 10.1111/j.1524-4733.2009.00507.x Funding: Financial support for this study was provided entirely by a grant from the Solvay Pharmaceuticals GmbH. Volume ** • Number ** • ** VALUE IN HEALTH © 2009, International Society for Pharmacoeconomics and Outcomes Research (ISPOR) 1098-3015/09/** **–** 1
-
Upload
bca-research -
Category
Documents
-
view
0 -
download
0
Transcript of Cost-Utility Analysis of Eprosartan Compared to Enalapril in Primary Prevention and Nitrendipine in...

Cost-Utility Analysis of Eprosartan Compared to Enalapril inPrimary Prevention and Nitrendipine in Secondary Preventionin Europe—The HEALTH Model
Björn Schwander, BSc,1 Birgit Gradl, MSc,2 York Zöllner, PhD,2 Peter Lindgren, PhD,3
Hans-Christoph Diener, MD,4 Stephan Lüders, MD,5 Joachim Schrader, MD,5 Fernando Antoñanzas Villar, PhD,6
Wolfgang Greiner, PhD,7 Bengt Jönsson, PhD8
1Analytica International, Lörrach, Germany; 2Solvay Pharmaceuticals, Hannover, Germany; 3I3innovus, Stockholm, Sweden; 4Department ofNeurology, University Duisburg-Essen, Germany; 5St.-Josefs-Hospital, Cloppenburg, Germany; 6University of de la Rioja, Spain; 7University ofBielefeld, Bielefeld, Germany; 8Stockholm School of Economics, Stockholm, Sweden
ABSTRACT
Objective: To investigate the cost-utility of eprosartan versus enalapril(primary prevention) and versus nitrendipine (secondary prevention) onthe basis of head-to-head evidence from randomized controlled trials.Methods: The HEALTH model (Health Economic Assessment of Lifewith Teveten® for Hypertension) is an object-oriented probabilistic MonteCarlo simulation model. It combines a Framingham-based risk calculationwith a systolic blood pressure approach to estimate the relative riskreduction of cardiovascular and cerebrovascular events based on recentmeta-analyses. In secondary prevention, an additional risk reduction ismodeled for eprosartan according to the results of the MOSES study(“Morbidity and Mortality after Stroke—Eprosartan Compared toNitrendipine for Secondary Prevention”). Costs and utilities were derivedfrom published estimates considering European country-specific health-care payer perspectives.
Results: Comparing eprosartan to enalapril in a primary preventionsetting the mean costs per quality adjusted life year (QALY) gained werehighest in Germany (€24,036) followed by Belgium (€17,863), the UK(€16,364), Norway (€ 13,834), Sweden (€ 11,691) and Spain (€ 7918). Ina secondary prevention setting (eprosartan vs. nitrendipine) the highestcosts per QALY gained have been observed in Germany (€9136) followedby the UK (€6008), Norway (€1695), Sweden (€907), Spain (€-2054) andBelgium (€-5767).Conclusions: Considering a €30,000 willingness-to-pay threshold perQALY gained, eprosartan is cost-effective as compared to enalapril inprimary prevention (patients �50 years old and a systolic blood pressure�160 mm Hg) and cost-effective as compared to nitrendipine in second-ary prevention (all investigated patients).Key words: cost-utility, eprosartan, enalapril, nitrendipine.
Introduction
According to the World Health Organization, approximately62% of cerebrovascular disease and 49% of ischemic heartdisease are attributable to suboptimal blood pressure control.Worldwide, high blood pressure is estimated to cause 7.1 milliondeaths per year (i.e., 13% overall mortality) [1].
High blood pressure in nondiabetics is defined as a diastolicblood pressure (DBP) >90 mm Hg and/or a systolic bloodpressure (SBP) >140 mm Hg and graded into mild (SBP 140–159 and/or DBP 90–99 mm Hg), moderate (160–179 and/or100–109 mm Hg) and severe hypertension (�180 and/or�110 mm Hg) [2].
The effectiveness of antihypertensive drug treatment is wellestablished and has been quantified in terms of overall reductionin the relative risk for cerebrovascular events (such as strokeand transient ischemic attack) and cardiovascular diseases (suchas myocardial infarction [MI] and angina pectoris [AP]) [3–9].
In patients with moderate to severe hypertension, withoutcardiovascular or cerebrovascular diseases (primary preventionpopulation), there is evidence that the angiotensin receptorblocker (ARB) eprosartan (Teveten, Tevetens, Barcelona, Spain) ismore effective in lowering SBP as directly compared to the
angiotensin-converting-enzyme inhibitor (ACEI) enalapril [10].During the past 10 years, several prospective cohort studies andmeta-analyses have documented that SBP is a more important riskfactor for cardiovascular (CV) and cerebrovascular (CBV) dis-eases than DBP, as was believed in the past [6,7,11–14].
In the field of secondary prevention the PROGRESS study(Perindopril Protection Against Recurrent Stroke Study) was thefirst large trial to document the positive influence of hypertensiontreatment on the CV and CBV risk within a population ofpatients with a primary CBV event. In this study, the ACEIperindopril (in possible combination with the diuretic indapam-ide) was compared to a placebo [15].
Further evidence for the reduction of CV and CBV eventswithin a population of patients with previous CBV events (strokeand/ or transient ischemic attack [TIA]) was provided bythe MOSES study (MOrbidity and mortality after Stroke—Eprosartan vs. nitrendipine for Secondary prevention). In thissecondary prevention study, the calcium channel blocker (nitren-dipine) was compared to the ARB eprosartan [16]. Although theblood pressure reduction in both study arms was comparable (asintended by the study protocol) eprosartan showed a significantlygreater relative risk reduction for CV and CBV events and overallmortality compared to that of the patients treated with nitren-dipine. It is likely that this effect is attributable to greater stimu-lation of the angiotensin II receptor and improved endothelialfunction (both not measured in MOSES) in patients on ARBtherapy [17].
As both comparator substances, enalapril and nitrendipine,are available as generics depending on the country, there is asizeable price difference between them and eprosartan. This
Address correspondence to: Birgit Gradl, Solvay Pharmaceuticals Market-ing & Licensing AG; Hegenheimermattweg 127, CH-4123 Allschwil,Switzerland. E-mail: [email protected]
10.1111/j.1524-4733.2009.00507.x
Funding: Financial support for this study was provided entirely by a grantfrom the Solvay Pharmaceuticals GmbH.
Volume ** • Number ** • **V A L U E I N H E A L T H
© 2009, International Society for Pharmacoeconomics and Outcomes Research (ISPOR) 1098-3015/09/** **–** 1
poses the question of whether the improved ability to lower SBPwith eprosartan in primary prevention, as well as the risk reduc-tion in secondary prevention, translates into sufficient healthgains in quality adjusted life years (QALYs) to justify the highercost.
Methods
The HEALTH (Health Economic Assessment of Life withTeveten for Hypertension) model is an object-oriented probabi-listic Monte Carlo simulation model based on a Markov processwith first- and second-order calculations [18]. The model wasdeveloped using Delphi and C++ for the operating systemsWindows 98, ME, 2000, and XP. The Borland Delphi develop-ment environment was used as the primary programming tool.
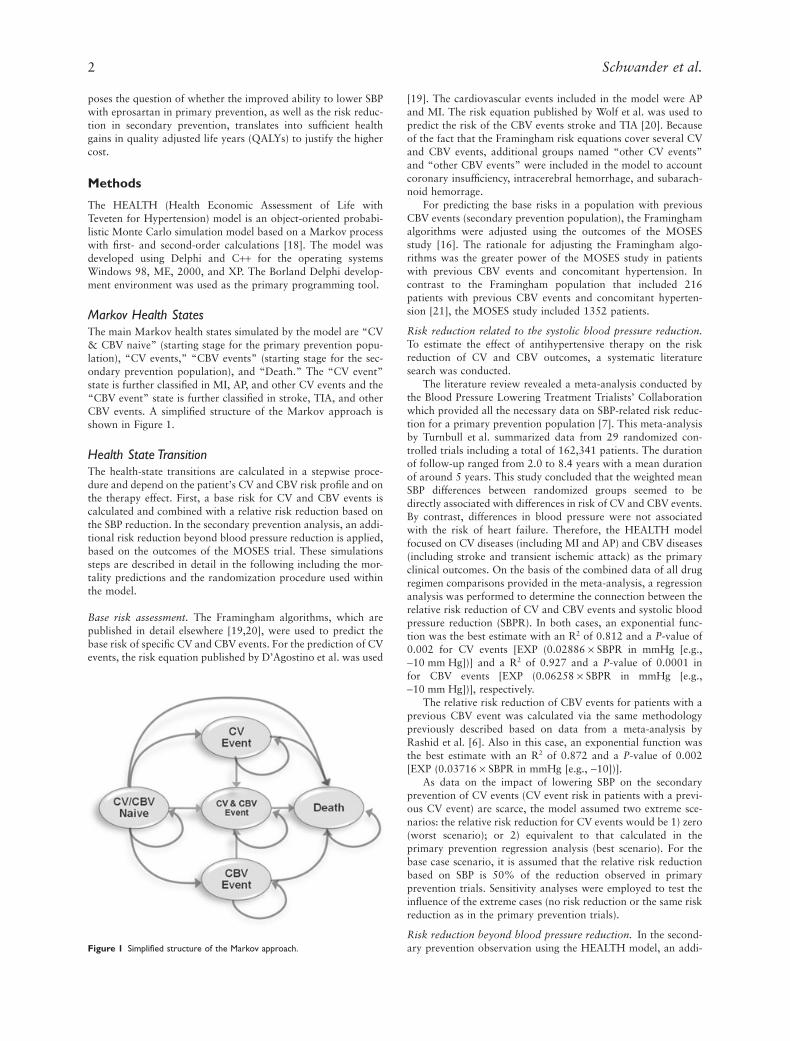
Markov Health StatesThe main Markov health states simulated by the model are “CV& CBV naive” (starting stage for the primary prevention popu-lation), “CV events,” “CBV events” (starting stage for the sec-ondary prevention population), and “Death.” The “CV event”state is further classified in MI, AP, and other CV events and the“CBV event” state is further classified in stroke, TIA, and otherCBV events. A simplified structure of the Markov approach isshown in Figure 1.
Health State TransitionThe health-state transitions are calculated in a stepwise proce-dure and depend on the patient’s CV and CBV risk profile and onthe therapy effect. First, a base risk for CV and CBV events iscalculated and combined with a relative risk reduction based onthe SBP reduction. In the secondary prevention analysis, an addi-tional risk reduction beyond blood pressure reduction is applied,based on the outcomes of the MOSES trial. These simulationssteps are described in detail in the following including the mor-tality predictions and the randomization procedure used withinthe model.
Base risk assessment. The Framingham algorithms, which arepublished in detail elsewhere [19,20], were used to predict thebase risk of specific CV and CBV events. For the prediction of CVevents, the risk equation published by D’Agostino et al. was used
[19]. The cardiovascular events included in the model were APand MI. The risk equation published by Wolf et al. was used topredict the risk of the CBV events stroke and TIA [20]. Becauseof the fact that the Framingham risk equations cover several CVand CBV events, additional groups named “other CV events”and “other CBV events” were included in the model to accountcoronary insufficiency, intracerebral hemorrhage, and subarach-noid hemorrage.
For predicting the base risks in a population with previousCBV events (secondary prevention population), the Framinghamalgorithms were adjusted using the outcomes of the MOSESstudy [16]. The rationale for adjusting the Framingham algo-rithms was the greater power of the MOSES study in patientswith previous CBV events and concomitant hypertension. Incontrast to the Framingham population that included 216patients with previous CBV events and concomitant hyperten-sion [21], the MOSES study included 1352 patients.
Risk reduction related to the systolic blood pressure reduction.To estimate the effect of antihypertensive therapy on the riskreduction of CV and CBV outcomes, a systematic literaturesearch was conducted.
The literature review revealed a meta-analysis conducted bythe Blood Pressure Lowering Treatment Trialists’ Collaborationwhich provided all the necessary data on SBP-related risk reduc-tion for a primary prevention population [7]. This meta-analysisby Turnbull et al. summarized data from 29 randomized con-trolled trials including a total of 162,341 patients. The durationof follow-up ranged from 2.0 to 8.4 years with a mean durationof around 5 years. This study concluded that the weighted meanSBP differences between randomized groups seemed to bedirectly associated with differences in risk of CV and CBV events.By contrast, differences in blood pressure were not associatedwith the risk of heart failure. Therefore, the HEALTH modelfocused on CV diseases (including MI and AP) and CBV diseases(including stroke and transient ischemic attack) as the primaryclinical outcomes. On the basis of the combined data of all drugregimen comparisons provided in the meta-analysis, a regressionanalysis was performed to determine the connection between therelative risk reduction of CV and CBV events and systolic bloodpressure reduction (SBPR). In both cases, an exponential func-tion was the best estimate with an R2 of 0.812 and a P-value of0.002 for CV events [EXP (0.02886 ¥ SBPR in mmHg [e.g.,-10 mm Hg])] and a R2 of 0.927 and a P-value of 0.0001 infor CBV events [EXP (0.06258 ¥ SBPR in mmHg [e.g.,-10 mm Hg])], respectively.
The relative risk reduction of CBV events for patients with aprevious CBV event was calculated via the same methodologypreviously described based on data from a meta-analysis byRashid et al. [6]. Also in this case, an exponential function wasthe best estimate with an R2 of 0.872 and a P-value of 0.002[EXP (0.03716 ¥ SBPR in mmHg [e.g., -10])].
As data on the impact of lowering SBP on the secondaryprevention of CV events (CV event risk in patients with a previ-ous CV event) are scarce, the model assumed two extreme sce-narios: the relative risk reduction for CV events would be 1) zero(worst scenario); or 2) equivalent to that calculated in theprimary prevention regression analysis (best scenario). For thebase case scenario, it is assumed that the relative risk reductionbased on SBP is 50% of the reduction observed in primaryprevention trials. Sensitivity analyses were employed to test theinfluence of the extreme cases (no risk reduction or the same riskreduction as in the primary prevention trials).
Risk reduction beyond blood pressure reduction. In the second-ary prevention observation using the HEALTH model, an addi-Figure 1 Simplified structure of the Markov approach.
2 Schwander et al.

tional risk reduction beyond blood pressure reduction wasmodeled for patients with previous CBV events. These additionalrisk reductions of 25% for CV and of 25% for CBV events wereapplied to the eprosartan arm only on the basis of the results ofthe MOSES study [16].
Mortality. The probability of death after specific CV and CBVevents was evaluated using the death rate prediction of theFramingham heart study published by Cupples et al. [22]. Thegeneral probability of death was estimated on the basis ofcountry-specific life tables retrieved from the WHO website [23].
For the secondary prevention simulations, two different mor-tality settings were analyzed. In the base case setting, the prob-ability of death was calculated on the basis of the Framinghammortality algorithms. In the sensitivity analyses, the mortalityinvestigated in the MOSES study was simulated. This probabilityof death was lower than the probability predicted by theFramingham algorithms. The mean 1-year period from the occur-rence of the CBV to the patient’s recruitment in the MOSESstudy was identified as the main reason for this difference becausemortality (especially mortality because of stroke) is highest in thefirst year after the event, according to published studies [24,25].Hence, compared to a real-world scenario, the mortalityobserved in the MOSES study might have been underestimatedbecause of the fact that some patients had already died during the1-year period between the qualifying event and inclusion in thestudy.
Randomization and simulation. For the simulation of the occur-rence of an event or mortality, the model used combined multiplerecursive 64-bit random number generators to produce auniformly distributed integer between 0 and 2377 with aperiodicity = 3.0783e+113 [26]. Each patient had an individualrandom number generator enabling the simulation of events andmortality independent from other patients. Thus, each patientwas regarded as an individual, to gain the best possible approxi-mation to a real world scenario.
For the simulation of the occurrence of an event, a randomnumber was drawn at each time step. If the random number wasless than or equal to the transition probability for the currenthealth state or parameter change, transition to the next healthstate occurred.
Time HorizonA lifelong perspective was used. Therefore, the model discrimi-nates between a treatment time horizon and a lifelong follow-upperiod.
The treatment time horizon used in the primary preventionbase case analysis was set to 5 years based on the meta-analysisby Turnbull et al. that provided all necessary data concerning theCV and CBV event risk reduction. This treatment time horizonwas varied in sensitivity analyses.
In the field of secondary prevention, a treatment time horizonof 2.5 years was selected based on the mean treatment periodwithin the MOSES study.
For modeling the treatment follow-up effects after the treat-ment time horizon, it was assumed that treatment was stopped inall patients, thus neither treatment costs (drug and monitoringcosts) nor treatment effects (blood pressure reduction; effectbeyond blood pressure reduction) were simulated after the treat-ment time horizon.
SBP ReductionIn the field of primary prevention, a study by Sega et al. [10]was used as the basis for the SBPR of eprosartan and enalapril.
This study compared the efficacy of eprosartan (n = 59) tothat of enalapril (n = 59) in patients with moderate to severehypertension. Sega et al. found a significant difference(P = 0.025) in SBP at the study end point when comparingthe eprosartan (-29.1 � 2.9 mm Hg) group to the enalapril(-21.1 � 2.7 mm Hg) group.
In the case of secondary prevention for drugs, nitrendipineand eprosartan, the same blood pressure reduction was appliedbased on the results of the MOSES study. Because of the fact thatthe blood pressure reduction in MOSES was comparablebetween the nitrendipine and eprosartan arm, the mean systolicblood pressure reduction of 15.99 mmHg relating to the 671patients of the Nitrendipine arm was taken into account [16].This procedure is based on the fact that the adjustment of theFramingham algorithms to the MOSES outcomes was based onthe Nitrendipine arm, where no risk reduction beyond bloodpressure reduction was observed.
In the case of compliance to treatment, the blood pressurereduction of the RCTs was taken into account for each treatmentstrategy. In the case of noncompliance, the systolic blood pres-sure reduction was set to zero.
Patient ComplianceAs the HEALTH model has a 5-year base case treatment timehorizon for the primary prevention simulations and a 2.5-yeartreatment time horizon for the secondary prevention simulations,data from the Conlin et al. study were used to estimate persis-tence data over 5 years of drug treatment [27]. This study inves-tigated the persistence pattern of a large, geographically diverse,drug-insured population of 15,175 patients over a 4-year period.According to this study, switch rates were comparable for alldrug classes, except for thiazide diuretics, which showed a higherswitch rate.
Because of the fact that the model investigates the efficacy ofan ARB versus specific comparators and because it is not knownto which drugs patients in these regimes would switch, switchinghas not been taken into account. The model differentiatesbetween compliance and noncompliance only. Conlin and col-leagues report 12-month persistence on ACEI of 60.7%, exclud-ing a 9.6% switch rate. The following calculation was made toadjust for switching; (60.7% ¥ 1) � (1 - 9.6%) = 67.2%.
Thus, the compliance rates used for the primary preventionsimulations in the model were: ARB 73.3% and 60.9% after thefirst and fourth years, respectively; ACEI 67.2% and 57.3% afterthe first and fourth years, respectively. Data on partial compliance(e.g., irregular drug use) for the drug classes ARB and ACEI werenot identified; hence, this aspect was not included in the model.
Published compliance data for a secondary prevention (high-risk patients with previous CBV events and concomitant hyper-tension) population are very limited. According to one Germanstudy, the overall compliance rate for antihypertensive treatment1 year after the stroke event was 90.8% [28]. Compared to thecompliance rates within a primary prevention population after 1year (ARB 73.3%, ACEI 67.2%, CCB 60.0%, and diuretics48.6%) [27], this overall compliance rate (90.8%) was greater inthe high-risk patients with previous stroke.
As a result of this difference, it seems to be impossible to defineadequate compliance rates in the field of secondary preventionwithout applying major assumptions. Therefore, the analyses inthe field of secondary prevention were performed without consid-ering patient compliance (compliance was set to 100%).
DiscountingFuture costs and health effects were discounted according tocountry-specific guidelines for health economic evaluations. The
CUA Eprosartan Europe 3

discount rates for health effects and costs used are shown inTable 1.
Willingness-to-Pay Threshold per QALY GainedIn the United Kingdom, the cost per QALY gained thresholdassessed to be cost-effective is £20,000 [ª €30,000], althoughrecent reimbursement decisions made by the National Institutefor Health and Clinical Excellence show that the upper limit ismoving toward a cutoff point of £30,000 (ª €45,000) [35].
The Swedish National Board of Health and Welfare discrimi-nates between low (<SEK 100,000), moderate (SEK 100,000 to500,000), high (SEK 500,000 to 1,000,000) and very high costs(>SEK 1,000,000) per QALY gained [36]. According to experi-enced health economists, costs per QALY gained within the lowand moderate range are usually regarded as cost-effective[37,38], leading to a threshold of SEK 500,000 (ª €54,000) perQALY gained.
In Germany, the Institute for Quality and Efficiency in HealthCare (IQWiG) gave an upper limit for the cost per QALY thresh-old of €50,000 in their first version method article [39]. Never-theless, in newer method articles, the QALY method is put intoquestion in general and no further statement on this threshold isgiven.
In all other countries investigated (Belgium, Spain, andNorway), there is no official information on the willingness topay threshold per QALY gained.
To make the country results comparable to each other wegenerally applied the lower UK willingness to pay threshold of€30,000 as the cutoff value for cost-effectiveness, independent ofpossibly higher QALY thresholds in individual countries.
Input Data
Population CharacteristicsTo calculate the risk for CV and CBV events, specific populationcharacteristics were used to apply the Framingham algorithms.
For the primary prevention population (patients without anyCV or CBV event at baseline), country-specific population char-acteristics for hypertensive patients have been derived on thebasis of published literature and/or by analyses of populationhealth surveys. The population input data for the primary pre-vention simulations is shown in Table 2 for Belgium, Germany,and Norway and in Table 3 for Spain, Sweden and the UnitedKingdom.
For the secondary prevention population, the patient charac-teristics of the MOSES study population were applied for eachcountry. The rationale for this procedure was the fact thatcountry-specific data for this highly selective patient cohort(hypertensive patients with a previous CBV event) have not beenidentified. The population input parameters for the secondaryprevention simulations are shown in Table 4.
Health Utility WeightsAccording to the health states achieved during the simulationprocess, different utilities were applied to each patient modeledbased on published literature. Each patient started with a healthutility value based on a typical hypertensive patient depending onsex and mean age. During the simulation process, the utility wasreduced by an event-specific utility reduction factor if a specificCV or CBV event developed in the patient. If the patient diedbecause of an event or because of other reasons, the health utilitywas set to zero.
The utility values applied to the model were based on aSwedish study [60]. In this study, data from the 1996–1997Survey of Living Conditions (ULF), a cross-sectional study basedon personal interviews with a representative sample (n = 11,698,aged 16–84) of the Swedish population were used. The healthutility was evaluated by the EQ-5D self-classifier. The cohortincluded 869 patients with hypertension, 520 with ischemic heartdisease and 86 with stroke.
Within the HEALTH model, the same utility values wereapplied for MI and AP (ICD-9 410–414) as well as for stroke andTIA (ICD-9 430–438) because of the fact that the population-
Table 1 Country-specific discount rates used in the HEALTH model
Country
Discount rate
ReferenceHealth effects Costs
Belgium 3.5% 3.5% [29]Germany 5.0% 5.0% [30]Norway 4.0% 4.0% [31]Spain 3.5% 3.5% [32]Sweden 3.0% 3.0% [33]United Kingdom 3.5% 3.5% [34]
Table 2 Population characteristics—primary prevention setting (Belgium, Germany, and Norway)
Parameter
Belgium* Germany Norway†
Males Females Ref. Males Females Ref. Males Females Ref.
Proportion (males/females) 48% 52% [40]‡ 48% 52% [40]‡ 44% 56% [41]Age in years 57.3 (�12.0) 60.6 (�11.3) [40]‡ 57.3 (�12.0) 60.6 (�11.3) [40]‡ 64.3 (�11.3) 66.7 (�11.3) [42]Baseline SBP in mm Hg¶ 179.2 (�2.3) 179.2 (�2.3) [10] 179.2 (�2.3) 179.2 (�2.3) [10] 179.2 (�2.3) 179.2 (�2.3) [10]Baseline DBP in mm Hg¶ 116.8 (�0.5) 116.8 (�0.5) [10] 116.8 (�0.5) 116.8 (�0.5) [10] 116.8 (�0.5) 116.8 (�0.5) [10]Patients with diabetes 12.1% 13.4% [40]‡ 12.1% 13.4% [40]‡ 11.4% 12.0% [41]Current smoker 24.4% 12.6% [40]‡ 24.4% 12.6% [40]‡ 20.4% 15.4% [42]Left ventricular hypertrophy 17.5% 18.5% [43] 17.5% 18.5% [43] 14% 9% [44–46]Atrial fibrillation 1.6% 1.4% [47] 1.6% 1.4% [47] 3.1% 2.8% [48]Total cholesterol in mg/dl 247.2 (�47.3) 257.3 (�44.7) [40]‡ 247.2 (�47.3) 257.3 (�44.7) [40]‡ 239.4 (�42.5) 258.7 (�50.2) [42]HDL-cholesterol in mg/dl 49.6 (�15.2) 62.4 (�17.8) [40]‡ 49.6 (�15.2) 62.4 (�17.8) [40]‡ 46.3 (�15.4) 54.1 (�15.4) [42]Mean age at menopause# — 52.0 [49] — 52.0 [49] — 49.0 [50]Alcohol consumption** — 31.0% [40]‡ — 31.0% [40]‡ — 65.3% [51]
*Because of the fact that published literature lacks Belgian population characteristics, German data was applied.†In cases where Norwegian data were not identified Swedish data were used as proxy.‡Data are based on our own analysis of the German Federal health survey 1998.¶Baseline blood pressure data was based on the Sega et al. study.#During the simulation the mean age of menopause was used to simulate whether a female patient had already entered menopause.**According to the Framingham algorithms moderate alcohol consumption has only a preventive effect in females.SBP, systolic blood pressure; DBP, diastolic blood pressure
4 Schwander et al.

based Swedish study on health utility weights used this combineddisease classification.
In view of the fact that additionally a secondary preventionpopulation was simulated, a differentiation between a utilityreduction for the first event and a utility reduction for the sub-sequent events was made.
By reviewing data from an overview of preference weights, ageneral convention was identified. According to the overview ofpublished health utilities, the utility reduction for subsequent CVand CBV events is half of the utility reduction of the primaryevent [61].
The health utility weights used in the model are shown inTable 5. To calculate a population’s baseline utility value, thebasis utility was adapted by the age-specific utility summandusing the population’s mean age at baseline and reduced by theutility reduction for hypertension. An age-related utility adapta-tion during the simulation process was not applied, thus sensitiveanalyses, simulating the lowest possible age-related baselineutility (basis utility minus utility reduction for hyperten-sion; males = 0.685; females = 0.6443) and the highest possible
age-related baseline utility (basis utility - utility reductionhypertension + x for 20–29-year-old subjects; males = 0.9052;females = 0.8645) were applied.
Additionally, a 10% variation of the baseline utility and thedisutilities has been simulated to investigate possible country-specific variations of the EQ-5D health utility weights.
Cost DataAn overview of the therapy costs and of the cardiovascularand cerebrovascular event costs used in the model is given inTable 6.
Drug costs are based on defined daily doses (DDD) of eachmedication; hence, the costs of 600 mg eprosartan, 10 mg enala-pril, and 20 mg nitrendipine were used in the model. Nitren-dipine is not licensed in Norway, Sweden, and the UK. In thiscase, the costs of another frequently used calcium channelblocker, amlodipine 5 mg, were applied. The drug costs are basedon an average price calculated over the DDD of all reimbursedproducts of the same substance within a country.
Table 3 Population characteristics—primary prevention setting (Spain, Sweden, and the UK)
Parameter
Spain Sweden UK
Males Females Ref. Males Females Ref. Males Females Ref.
Proportion (males/females) 43% 57% [52] 44% 56% [53] 46% 54% [54]*Age in years 67.0 (�7.9) 68.2 (�8.2) [52] 65.4 (�11.2) 66.9 (�11.7) [53] 64.8 (�12.3) 67.2 (�12.6) [54]*SBP in mm Hg† 179.2 (�2.3) 179.2 (�2.3) [10] 179.2 (�2.3) 179.2 (�2.3) [10] 179.2 (�2.3) 179.2 (�2.3) [10]DBP in mm Hg† 116.8 (�0.5) 116.8 (�0.5) [10] 116.8 (�0.5) 116.8 (�0.5) [10] 116.8 (�0.5) 116.8 (�0.5) [10]Patients with diabetes 31.0% 30.0% [52] 26.3% 19.2% [53] 14.6% 10.8% [54]*Current smoker 30.7% 6.5% [52] 15.0% 10.6% [53] 13.7% 14.7% [54]*Left ventricular hypertrophy 23.4% 17.8% [52] 14% 9% [44] 10.2% 6.2% [54]*Atrial fibrillation 7.9% 8.0% [52] 3.1% 2.8% [48] 4.5% 3.7% [54]*Total cholesterol in mg/dl 219.2 (37.5) 219.2 (37.5) [52] 222.9 (�41.5) 244.8 (�47.0) [55] 211.8 (�44.2) 235.3 (�47.0) [54]*HDL-cholesterol in mg/dl 56.4 (20.9) 56.4 (20.9) [52] 38.2 (�9.2) 44.6 (�9.8) [55] 51.8 (�14.3) 61.9 (�15.6) [54]*Mean age at menopause‡ — 50.0 [56] — 51.3 [57] — 51.0 [54]*Alcohol consumption§ — 20.0% [58] — 65.3% [51] — 58.7% [54]*
*Data are based on our own analysis of the England health survey 2003.†Baseline blood pressure data was based on the Sega et al. study.‡During the simulation the mean age of menopause was used in order simulate whether a female patient had already entered menopause.§According to the Framingham algorithms moderate alcohol consumption has only a preventive effect in females.SBP, systolic blood pressure; DBP, diastolic blood pressure.
Table 4 Population characteristics—secondary prevention setting
Parameter Males Females Ref.
Proportion (males/females) 54.8% 45.2% [16]*Age in years 66.96 (�8.82)* 70.49 (�9.9)* [16]*SBP in mm Hg 152.47 (�18.66) 151.49 (�17.71) [16]*DBP in mm Hg 87.83 (�9.38) 86.44 (�9.77) [16]*Patients with diabetes 39.1% 36.0% [16]*Current smoker 26.4% 12.2% [16]*Left ventricular hypertrophy 5.7% 9.9% [16]*Atrial fibrillation 4.6% 7.6% [16]*Total cholesterol in mg/dl 247.2 (�47.3) 257.3 (�44.7) [40]†
HDL-cholesterol in mg/dl 49.6 (�15.2) 62.4 (�17.8) [40]†
Mean age at menopause‡ — 52 [59]Alcohol consumption§ — 23.4% [16]*Previous myocardial infarction 10.1% 4.9% [16]*Previous angina pectoris 10.2% 9.8% [49]Previous other CV events 26.1% 28.7% [16]*Previous stroke 64.4% 56.1% [16]*Previous TIA 22.3% 33.7% [16]*Previous other CBV events 13.3% 10.2% [16]*
*Data for males and females as well as parameters not shown in the MOSES publication have been provided on request by the MOSES study team.†Cholesterol values have not been recorded during the MOSES study, thus data from the German federal health survey 1998 were used.‡During the simulation the mean age of menopause was used to simulate whether a female patient had already entered menopause.§According to the Framingham algorithms moderate alcohol consumption has only a preventive effect in females.SBP, systolic blood pressure; DBP, diastolic blood pressure;TIA, transient ischemic attack.
CUA Eprosartan Europe 5

Because of the fact that the model discriminates betweencompliance and noncompliance, the costs for therapy-relatedmonitoring were included additionally.
For each event, country-specific direct health-care costs forthe first year (after the occurrence of the event) as well as for thesubsequent years (second and following years after occurrence ofthe event) were evaluated on the basis of published literature. Ifmore than one cost value was identified for the same event, amean value was calculated. The cost data used reflects a health-care payer perspective.
All cost values retrieved from published literature wereinflated to 2007 values using the country-specific health-care costindexes (Belgium [62], Germany [63], Norway [64], Spain [65],Sweden [66], and the UK [67]).
Because of a lack of published literature, the Norwegian eventcosts have been estimated on the basis of Swedish event cost datausing a Norwegian study [68] on stroke costs as the transforma-tion basis. According to the comparison of Swedish and Norwe-gian costs for stroke care the Norwegian health-care costs arearound 6% higher than the Swedish health-care costs, hence theNorwegian health-care costs are estimated using this transitionfactor.
All costs were transferred to euros using the average exchangerate of the year 2007 (January to November) provided by theEuropean Central Bank [69].
Analyses
Analyses were performed using patient cohorts of 1000 patientsand 1000 iterations (different starting numbers of the randomnumber generator) for each cohort using a 5-year treatment timehorizon in primary prevention and a 2.5-year treatment timehorizon in secondary prevention, simulating the treatmentfollow-up effects over lifetime. The incremental cost-effectivenessratio (ICER) is shown as mean costs per QALY gained from ahealth-care payer perspective.
A probabilistic sensitivity analysis was performed to show thevariability of results based on randomization (first order) andinput parameter distributions (second order).
The influence of changes in single parameters was tested inone-way sensitivity analyses that are shown as a tornadodiagram.
In the field of primary prevention, this includes the discount-ing of costs (0–10%) and effects (0–10%), the secondary preven-tion of CV diseases (no RR reduction; RR risk reduction =primary prevention), systolic blood pressure reduction (extremecases using the upper and lower confidence intervals); the treat-ment time horizon (1 year and 10 years), the utility reductioncaused by TIA (reduction was set to zero), the baseline utility
Table 5 Health utility weights used in the HEALTH model
Health state Males Females
Basis utility 0.7257 0.6850Utility adaptation because of age* +X*Utility reduction hypertension† -0.0407Utility reduction MI or AP primary event -0.1156Utility reduction MI or AP subsequent event -0.0578Utility reduction stroke or TIA primary event -0.2743Utility reduction stroke or TIA subsequent event -0.1372
*X = 0.2202 (20–29 years); 0.2104 (30–39); 0.1897 (40–49); 0.1624 (50–59); 0.1335 (60–69);0.0967 (70–79).†Applied to all patients.MI, myocardial infarction;AP, angina pectoris;TIA, transient ischemic attack.
Tabl
e6
Ove
rvie
wof
cost
data
used
inth
eH
EALT
Hm
odel
—co
sts
are
give
nin
the
Euro
valu
esof
2007
Cos
tun
it
Belg
ium
Ger
man
yN
orw
aySp
ain
Swed
enU
K
Cos
ts(€
)R
ef.
Cos
ts(€
)R
ef.
Cos
ts(€
)R
ef.
Cos
ts(€
)R
ef.
Cos
ts(€
)R
ef.
Cos
ts(€
)R
ef.
Epro
sart
an60
0m
g/da
y0.
88[7
0]1.
16[7
1]0.
90[7
2]0.
55[7
3]0.
86[7
4]0.
75[7
5]En
alap
ril1
0m
g/da
y0.
21[7
0]0.
29[7
1]0.
19[7
2]0.
09[7
3]0.
16[7
4]0.
03[7
5]N
itren
dipi
ne20
mg/
day
0.83
[70]
0.32
[71]
0.41
*[7
2]0.
41[7
3]0.
34*
[74]
0.07
*[7
5]Ye
arly
mon
itori
ngco
sts
209
[76]
126†
[77]
232
[68,
78]
173‡
[79]
219
[78]
188‡
[80]
Stro
ke1s
tye
ar15
,648
[81–
83]
17,6
29[8
4–87
]21
,351
[68]
8,06
6[7
9,81
,85,
86,8
8]20
,153
[78,
81,8
9,90
]14
,028
[91,
92]
Stok
esu
bseq
uent
year
s3,
533
[81,
82]
7,33
7[8
4,86
]8,
616
[68,
78,9
3]3,
368
[79,
81,8
6]8,
133
[78,
93]
3,63
3[9
1,92
]T
IA1s
tye
ar2,
175§
[94,
95]
3,36
5[9
6,97
]2,
266
[98]
2,07
9[9
9]1,
669
[100
,101
]1,
737
[80,
102]
TIA
subs
eque
ntye
ars
00
00
00
MI
1st
year
8,50
3[8
1,82
,103
]11
,683
[85,
86,1
04,1
05]
13,5
52[6
8,78
,81,
93]
10,9
88[7
9,81
,85,
105]
12,7
91[7
8,81
,93]
9,90
6[1
02,1
06]
MI
subs
eque
ntye
ars
1,28
7[1
03]
2,80
3[8
6,10
4]2,
490
[68,
78,8
1]3,
087
[79,
81]
2,35
0[7
8,81
]2,
958
[81,
106]
AP
1st
year
6,99
0[8
2,10
3]4,
153
[86,
104,
107]
6,98
6[6
8,78
,93]
2,28
6[8
6,10
8]6,
594
[78,
93]
5,40
5[1
02,1
06]
AP
subs
eque
ntye
ars
1,13
2[8
2,10
3]1,
315
[86,
104,
107]
1,41
3[6
8,78
]48
3||[1
08]
1,33
3[7
8]2,
072
[106
]
TIA
,tra
nsie
ntis
chem
icat
tack
;MI,
myo
card
iali
nfar
ctio
n;A
P,an
gina
pect
oris
.*N
itren
dipi
neis
not
licen
sed
inN
orw
ay,S
wed
enan
dth
eU
K,h
ence
the
cost
sof
amlo
dipi
ne(5
mg)
wer
eus
edas
mod
elin
put.
† GP
ordi
natio
nco
mpl
ex(5
0%EB
M#
0311
1pl
us50
%EB
M#
0311
2)pl
usco
nsul
tatio
n,di
scus
sion
and/
orcl
arifi
catio
n(E
BM#
0312
0)pl
usth
erap
yan
dca
reof
apa
tient
with
ach
roni
cin
tern
alco
nditi
on(E
BM#
0321
0)as
sum
ing
four
visi
tspe
rye
aran
dan
EBM
poin
tva
lue
of€
0.04
usin
gth
eEB
Mve
rsio
nof
the
four
thqu
arte
r20
07.
‡ Ass
umpt
ion:
four
visi
tsto
the
heal
thce
ntre
per
year
.§ C
ost
per
day€
282
[94]
—es
timat
ion
mea
nle
ngth
ofst
ay7.
7da
ys(b
ased
onG
erm
anda
ta[9
7]).
|| Est
imat
ion
onth
eba
sis
ofth
em
ean
rela
tion
ofth
efir
stA
Pye
arco
stto
the
subs
eque
ntye
arA
Pco
stof
the
othe
r5
coun
trie
s;ex
chan
gera
tes
used
:1Eu
ro=
0.68
11Br
itish
Poun
ds;1
Euro
=9.
234
Swed
ish
Kro
na;1
Euro
=8.
031
Nor
weg
ian
Kro
na.
6 Schwander et al.

according to age (minimum and maximum values), the variationof health utility weights by �10% and the effect of excludingpatient compliance on ACEIs and ARBs (setting year 1 and year4 compliance to 100% for both primary treatments).
Furthermore, the variations in the cost-effectiveness weretested using different population characteristics that wereassumed to have a major influence on the basic risk for CV andCBV events. Therefore, analyses were performed for males(100%) and females (100%), different age groups and patientswith and without type 2 diabetes.
In the field of secondary prevention, the one-way sensitivityanalyses focus on the discounting of costs (0–10%) and effects(0–10%), the secondary prevention of CV diseases (no RR reduc-tion; RR risk reduction = primary prevention), blood pressurereduction beyond blood pressure reduction for CV events (reduc-tion was set to zero); the treatment time horizon (1 year to 10years), the utility reduction caused by TIA (reduction was set tozero), the baseline utility according to age (minimum andmaximum values) the variation of health utility weights by�10%.
Furthermore, the variations in the cost-effectiveness weretested using different population characteristics that wereassumed to have a major influence on the basic risk for CV andCBV events. Therefore, analyses were performed for males(100%) and females (100%), different age groups and patientswith and without type 2 diabetes.
The ICER scatter-plots as well as the tornado diagrams areshown for those countries that represent the lowest and thehighest mean cost per QALY gained within a primary preven-tion and a secondary prevention population, respectively. Therationale for this procedure is that only four scatter-plots andtornado diagrams have to be presented (instead of 16) and thatthis procedure enables the extreme variations of the modelingresults to be presented by choosing the countries with theextreme results (highest and the lowest mean ICER per QALYgained).
Results
Primary PreventionWithin a primary prevention cohort of 1000 patients, simulatinga lifetime horizon (treatment time horizon = 5 years), eprosartantherapy avoided on average 2.9 MIs, 2.3 AP cases, 2.6 strokes,0.7 TIAs, and 4.9 CV/ CBV mortality cases more than enalapril.The results of a primary prevention population in all countriesare shown in Figure 2.
The mean costs per QALY gained in the primary preventionsimulations, comparing eprosartan to enalapril, are shown inTable 7 and range from €7918 in Spain to €24,036 in Germany,simulating 1000 patients and 1000 iterations over a lifetimehorizon. The undiscounted modeling results are given in brack-ets, to provide an estimate on the influence of the country-specificdiscount rates applied.
Secondary PreventionWithin a secondary prevention cohort of 1000 patients, simulat-ing a lifetime horizon (treatment time horizon = 2.5 years), epro-sartan therapy avoided on average 4.8 MIs, 7.0 AP cases, 9.4strokes, 18.1 TIAs and 1.6 CV/CBV mortality cases more thannitrendipine. The results of a secondary prevention population inall countries are shown in Figure 3.
The mean costs per QALY gained in the secondary preventionsimulations, comparing eprosartan to nitrendipine, are shown inTable 8 and range from €-5767 in Belgium to €9136 in Germany,simulating 1000 patients and 1000 iterations over a lifetimehorizon. The undiscounted modeling results are given in brack-ets, to provide an estimate on the influence of the country-specificdiscount rates applied.
Probabilistic Sensitivity AnalysesThe incremental cost-effectiveness scatterplots for the extremescenarios in primary (Spain and Germany) and secondary
0.0 1.0 2.0 3.0 4.0 5.0 6.0 7.0
Fatal CV/ CBVevents
TIA
Stroke
Angina pectoris
Myocardial infarction
Events avoided by eprosartan simulating 1,000 patients over a lifetime horizon
Belgium Germany Norway Spain Sweden UK Average
Figure 2 Events additionally avoided by eprosartan compared to enalapril in 1000 patients simulating a lifetime horizon (primary prevention).
CUA Eprosartan Europe 7

prevention (Belgium and Germany) simulations are shown inFigure 4.
Considering a willingness to pay threshold of €30,000 perQALY gained the probability of eprosartan being cost-effectivecompared to enalapril was 61.2% in Belgium, 55.9% in Germany,69.5% in Norway, 76.6% in Spain, 72.3% in Sweden and 63.5%in the UK, simulating a primary prevention population.
In secondary prevention, the probability that eprosartan iscost-effective compared to nitrendipine was 100%, independentof the country and considering €30,000 as the willingness to paythreshold.
One Way Sensitivity AnalysesThe tornado diagrams for the primary prevention and the sec-ondary prevention settings are shown in Figure 5.
In the primary prevention setting, the variables with thegreatest influence on the analysis results were the patients’ base-
line age, systolic blood pressure reduction, the cost and effectdiscount rate, the patient’s sex and the baseline systolic bloodpressure. Considering the country simulation with the highestmean incremental cost-effectiveness ratio (Germany) the varia-tion of these parameters led to mean costs per QALY gained thatexceed the applied willingness to pay threshold of €30,000.Setting patient compliance rates for years 1 and 4 to 100% forboth ACEI and ARB therapies also resulted in an ICER greaterthan €30,000 per QALY gained in Germany (€33,210 per QALYgained).
Because of the fact that the baseline age and the baselinesystolic blood pressure could be influenced by the physician’spatient selection for eprosartan therapy the cutoff values forcost-effectiveness have been investigated for all countries.
Starting from an age of 37 in Spain (ICER per QALY gained= €28,488) and from an age of 52 in Germany (ICER per QALYgained = €29,924) the therapy of eprosartan is cost-effectivecompared to enalapril, whereas in younger patients the willing-
Table 7 Costs, utilities and cost per QALY gained comparing eprosartan to enalapril in primary prevention (1000 patients & 1000 iterations)
Country
Eprosartan Enalapril Incremental
ICER (€) per QALYCosts (€) Utilities Costs (€) Utilities Costs (€) Utilities
Belgium 6,277,551 10,359.0 5,629,136 10,322.7 648,415 36.3 17,863(9,711,995) (15,181.2) (9,022,023) (15,123.6) (689,972) (57.6) (11,979)
Germany 7,041,011 9,182.6 6,267,037 9,150.4 773,974 32.2 24,036(13,264,824) (15,431.2) (12,432,230) (15,370.5) (832,594) (60.7) (13,717)
Norway 8,123,926 8,456.1 7,566,432 8,415.8 557,494 40.3 13,834(12,649,227) (12,247.0) (12,055,162) (12,183.7) (594,065) (63.3) (9,385)
Spain 4,969,228 8,270.8 4,593,935 8,223.4 375,293 47.4 7,918(6,947,761) (11,122.5) (6,549,422) (11,054.9) (398,339) (67.6) (5,893)
Sweden 8,625,087 8,870.4 8,081,451 8,823.9 543,636 46.5 11,691(12,071,172 (11,752.8) (11,499,298) (11,687.8) (571,874) (65.0) (8,798)
UK 5,490,508 8,708.6 4,894,846 8,672.2 595,662 36.4 16,364(8,112,946) (12,221.0) (7,482,392) (12,167.2) (630,554) (53.8) (11,720)
ICER per QALY, Incremental cost-effectiveness ratio per QALY gained; cost and effects were discounted according to country-specific guidelines; (undiscounted modeling results are given inbrackets).
0.0 2.0 4.0 6.0 8.0 10.0 12.0 14.0 16.0 18.0 20.0
Fatal CV/ CBVevents
TIA
Stroke
Angina pectoris
Myocardial infarction
Events avoided by eprosartan simulating 1,000 patients over a lifetime horizon
Belgium Germany Norway Spain Sweden UK Average
Figure 3 Events additionally avoided by eprosartan compared to nitrendipine in 1000 patients simulating a lifetime horizon (secondary prevention).
8 Schwander et al.

ness to pay threshold is exceeded. The exclusion of the patientcompliance factor in Spain did not result in an ICER greater thanthe willingness to pay threshold (€10,734 per QALY gained).
The cutoff values for the baseline systolic blood pressure are164 mm Hg (ICER per QALY gained = €29,694) in Germanywhereas in Spain even patients within a mild systolic hyperten-sion range (140–159 mmHg) showed excellent CE results(<€20,000 per QALY gained).
Within a secondary prevention setting, the patient’s sex andbaseline age had the most significant effect on cost-effectivenessresults. These results, however, were still below the willingness topay threshold of €30,000 even for the extreme case of Germany.
Discussion
Primary Prevention SettingSimulating a health-care payer perspective over a lifetimehorizon, the mean ICER per QALY gained by eprosartan incomparison to enalapril, was always below the assumed willing-ness to pay threshold of €30,000, independent of the countryanalyzed.
The highest costs per QALY gained have been observed simu-lating a German health-care setting (€24,036) followed byBelgium (€17,863), the UK (€16,364), Norway (€13,834),Sweden (€11,691) and Spain (€7918).
These results were extensively tested by sensitivity analysesthat considered the analysis setting with the highest ICER perQALY gained, the German health-care setting, had a stronginfluence on the cost-effectiveness when applying a conserva-tively chosen cost per QALY gained threshold of €30,000.
The ICER was most sensitive to variations of the mean age atbaseline, systolic blood pressure reduction, the cost and effectdiscount rate, the patient’s sex, baseline blood pressure andpatient compliance.
The influence of age on the cost-effectiveness of antihyperten-sives is well established [109]. Younger patients are in general atlower risk of experiencing CV and CBV events than older ones,thus a higher ICER is expected in younger patients from a health-care payer perspective. Considering the worst-case scenario(Germany) the cutoff age for cost-effectiveness, choosing athreshold of €30,000, was determined at 52 years of age. Inyounger patients the willingness to pay threshold was exceeded.Considering the best-case scenario (Spain) the cutoff age forcost-effectiveness was observed at 37 years of age. The cutoffages within all other countries have not been investigated, but are
expected to be located somewhere between the range of 37 and52 years, observed in the two extreme scenarios.
In the model, systolic blood pressure reduction was used toestimate the preventive effect of antihypertensive drugs on CVand CBV events. The use of this approach has been confirmed byfindings of recently conducted meta-analyses [6,7].
Modeling the extreme case using the upper 95% CI for enala-pril and the lower 95% CI for eprosartan resulted in an ICER ofeprosartan that exceeded €30,000 compared to enalapril. Thisextreme case of the 95% CIs, and so the lowest possible bloodpressure reduction difference between eprosartan and enalapril,has to be regarded as a result that is statistically possible inindividual patients but not in a whole population, where a bloodpressure reduction near to the mean is to be expected. Neverthe-less, this sensitivity analysis showed that the model is sensitive tovariations in systolic blood pressure reduction.
Discounting future health effects and future costs has had astrong influence on the cost-effectiveness results. This is mainlybased on the fact that a lifetime horizon was simulated and as aresult most of the costs and health effects are to be expected inthe future, which makes the results more sensitive to discountingin contrast to simulations focusing to a shorter observationperiod.
The influence of sex on the cost-effectiveness of antihyperten-sive treatments has already been investigated by a ScandinavianCE analysis [109]. In females the ICER per QALY gained washigher than in males. This variation is based mainly on the lowerCV and CBV risk of females in comparison to males. This isconfirmed with the general rule for preventive therapies (e.g.,antihypertensive therapy) that says the lower the CV and CBVbase risk, the lower the effect of a preventive therapy.
Sensitivity analyses varying the systolic baseline blood pres-sure values have shown a higher ICER per QALY gained the lowerthe baseline systolic blood pressure was. Considering the worst-case scenario (Germany) the cutoff value for cost-effectiveness wasa baseline systolic blood pressure of 164 mm Hg. Starting fromthis blood pressure level cost-effectiveness was also achieved for aGerman health-care setting. In Spain the modeling results were notsensitive to the baseline systolic blood pressure.
The efficacy data used in the HEALTH model are mainlybased on the Sega et al. study [10] that found a significant dif-ference in systolic blood pressure reduction when comparingeprosartan to enalapril. The time horizon of this trial (10 weeks)does not deliver valid data for a 5-year treatment time horizon.Nevertheless, another study with a treatment duration of 2 yearsshowed that eprosartan would keep the initial blood pressure
Table 8 Costs, utilities and cost per QALY gained comparing eprosartan to nitrendipine in secondary prevention (1000 patients & 1000 iterations)
Country
Eprosartan Nitrendipine Incremental
ICER (€) per QALYCosts (€) Utilities Costs (€) Utilities Costs (€) Utilities
Belgium 17,867,996 3,244.3 18,081,950 3,207.2 -213,954 37.1 -5,767(21,388,173) (3,986.2) (21,587,048) (3,943.3) (-198,875) (42.9) (-4,635)
Germany 28,967,343 3,041.8 28,643,914 3,006.4 323,429 35.4 9,136(36,813,615) (4,037.1) (36,440,516) (3,993.7) (373,099) (43.4) (8,597)
Norway 34,993,752 3,247.1 34,930,873* 3,210.0 62,879 37.1 1,695(42,658,337) (4,114.9) (42,555,073) (4,071.0) (103,264) (43.9) (2,352)
Spain 15,015,775 3,084.8 15,089,497 3,048.9 -73,722 35.9 -2,054(19,155,946) (4,121.5) (19,215,025) (4,077.4) (-59,079) (44.1) (-1,340)
Sweden 36,318,567 3,404.9 36,283,665* 3,366.4 34,902 38.5 907(42,422,941) (4,085.6) (42,352,811) (4,041.8) (70,130) (43.8) (1,601)
UK 19,313,238 3,292.4 19,087,933* 3,254.9 225,305 37.5 6,008(23,163,526) (4,057.4) (22,918,206) (4,013.9) (245,320) (43.5) (5,640)
*Nitrendipine is not licensed in Norway, Sweden and the UK, hence the costs of amlodipine (5 mg) were used as model input.ICER per QALY, Incremental cost-effectiveness ratio per QALY gained; cost and effects were discounted according to country-specific guidelines; (undiscounted modeling results are given inbrackets).
CUA Eprosartan Europe 9

Ep
ros
art
an
vs
. E
na
lap
ril (
Ge
rma
ny
- p
rim
ary
pre
ve
nti
on
)
Incre
me
nta
l E
ffe
ct in
QA
LY
s g
ain
ed
18
01
60
14
01
20
10
08
06
04
02
00
-20
-40
-60
-80
Incremental Direct Costs in Euros1,3
00
,00
0
1,2
00
,00
0
1,1
00
,00
0
1,0
00
,00
0
90
0,0
00
80
0,0
00
70
0,0
00
60
0,0
00
50
0,0
00
40
0,0
00
30
0,0
00
20
0,0
00
10
0,0
00 0
-10
0,0
00
Ep
ros
art
an
vs
. E
na
lap
ril (
Sp
ain
- p
rim
ary
pre
ve
nti
on
)
Incre
me
nta
l E
ffe
ct in
QA
LY
s g
ain
ed
20
01
50
10
05
00
-50
-10
0
Incremental Direct Costs in Euros70
0,0
00
65
0,0
00
60
0,0
00
55
0,0
00
50
0,0
00
45
0,0
00
40
0,0
00
35
0,0
00
30
0,0
00
25
0,0
00
20
0,0
00
15
0,0
00
10
0,0
00
50
,00
0 0
-50
,00
0
Ep
ros
art
an
vs
. N
itre
nd
ipin
e (
Ge
rma
ny
- s
ec
on
da
ry p
rev
en
tio
n)
Incre
me
nta
l E
ffe
ct in
QA
LY
s g
ain
ed
60
55
50
45
40
35
30
25
20
15
10
50
-5
Incremental Direct Costs in Euros
70
0,0
00
65
0,0
00
60
0,0
00
55
0,0
00
50
0,0
00
45
0,0
00
40
0,0
00
35
0,0
00
30
0,0
00
25
0,0
00
20
0,0
00
15
0,0
00
10
0,0
00
50
,00
0 0
-50
,00
0
-10
0,0
00
Ep
ros
art
an
vs
. N
itre
nd
ipin
e (
Be
lgiu
m -
se
co
nd
ary
pre
ve
nti
on
)
Incre
me
nta
l E
ffe
ct in
QA
LY
s g
ain
ed
65
60
55
50
45
40
35
30
25
20
15
10
50
-5
Incremental Direct Costs in Euros
10
0,0
00
50
,00
0 0
-50
,00
0
-10
0,0
00
-15
0,0
00
-20
0,0
00
-25
0,0
00
-30
0,0
00
-35
0,0
00
-40
0,0
00
-45
0,0
00
-50
0,0
00
-55
0,0
00
Fig
ure
4C
ost-
effe
ctiv
enes
ssc
atte
r-pl
ots
for
the
extr
eme
scen
ario
sin
prim
ary
(Spa
in&
Ger
man
y)an
dse
cond
ary
prev
entio
n(B
elgi
um&
Ger
man
y)si
mul
atin
g10
00pa
tient
san
d10
00ite
ratio
nsov
erlif
etim
e.
10 Schwander et al.

Ep
rosa
rtan
vs.
En
alap
ril (
Sp
ain
- p
rim
ary
pre
ven
tio
n)
Co
st p
er
QA
LY
gain
ed
in E
uro
s
55
00
05
0 0
00
45
00
04
0 0
00
35
00
03
0 0
00
25
00
02
0 0
00
15 0
00
10 0
00
5 0
00
0
Sys
tolic
blo
od
pre
ssure
re
ductio
n (
95
% C
Is)
Dia
be
tes (
0-1
00
%)
Ma
les/F
em
ale
s
Ba
se
line
sys
tolic
blo
od p
ressure
(1
60
-200
mm
Hg)
Dis
co
unting
(0
-10
%)
Ag
e (
40
-80
ye
ars
)
Ba
se
line
utilit
y (m
inim
um
/ma
xim
um
)
Ris
k r
ed
uctio
n s
eco
nd
ary
CV
eve
nts
(0
-10
0%
)
Co
mp
liance
fa
cto
r (i
nclu
de
d/e
xclu
de
d)
Utilit
y re
ductio
n T
IA (
inclu
de
d/e
xclu
de
d)
Tre
atm
ent tim
e h
orizo
n (
1-1
0 y
ea
rs)
Ep
rosa
rtan
vs.
En
alap
ril (
Ger
man
y -
pri
mar
y p
reve
nti
on
)
Co
st p
er
QA
LY
gain
ed
in E
uro
s
55
00
05
0 0
00
45
00
04
0 0
00
35
00
03
0 0
00
25
00
020 0
00
15
00
01
0 0
00
5 0
00
0
Sys
tolic
blo
od
pre
ssure
re
ductio
n (
95
% C
Is)
Dis
counting
(0
-10%
)
Dia
be
tes (
0-1
00
%)
Ag
e (
40
-80
ye
ars
)
Ma
les/F
em
ale
s
Ba
se
line s
ysto
lic b
loo
d p
ressure
(1
60
-200
mm
Hg)
Ba
se
line
utilit
y (m
inim
um
/ma
xim
um
)
Tre
atm
ent tim
e h
ori
zon (
1-1
0 y
ea
rs)
Co
mp
liance
fa
cto
r (i
nclu
de
d/e
xclu
de
d)
Utilit
y re
ductio
n T
IA (
inclu
de
d/e
xclu
de
d)
Ris
k r
ed
uctio
n s
eco
nd
ary
CV
eve
nts
(0
-10
0%
)
Ep
rosa
rtan
vs.
Nitr
end
ipin
e (B
elg
ium
- se
con
dar
y p
reve
ntio
n)
Co
st
pe
r Q
AL
Y g
ain
ed
in
Eu
ros
15
,000
10
,00
05
,00
00
-5,0
00
Male
s/F
em
ale
s
Ag
e (
50
-80 y
ea
rs)
Utilit
y re
ductio
n T
IA (
inclu
de
d/e
xclu
ded
)
Dis
counting
(0
-10
%)
Tre
atm
ent tim
e h
ori
zon (
1-1
0 y
ea
rs)
Utilit
y w
eig
hts
(+
/-10
%)
Ba
selin
e u
tilit
y (m
inim
um
/ma
xim
um
)
Ba
selin
e s
ysto
lic b
loo
d p
ressure
(1
60-2
00
mm
Hg
)
RR
se
cond
ary
CV
eve
nts
(0
-10
0%
)
Dia
be
tes (
0-1
00%
)
RR
be
yond
BP
re
ductio
n C
V e
vents
(in
clu
de
d/e
xclu
de
d)
Mort
alit
y (F
ram
ingha
m/M
OS
ES
)
Ep
rosa
rtan
vs.
Nitr
end
ipin
e (G
erm
any
- sec
on
dar
y p
reve
ntio
n)
Cost per
QA
LY
gain
ed in E
uro
s
15
,00
01
0,0
00
5,0
00
0-5
,000
Male
s/F
em
ale
s
Ba
selin
e s
ysto
lic b
lood
pre
ssure
(16
0-2
00
mm
Hg
)
Ag
e (
50
-80
yea
rs)
Dia
be
tes (
0-1
00%
)
Mort
alit
y (F
ram
ingha
m/M
OS
ES
)
Utilit
y w
eig
hts
(+
/-1
0%
)
RR
se
co
nda
ry C
V e
vents
(0
-10
0%
)
Tre
atm
ent tim
e h
ori
zon (
1-1
0 y
ears
)
Ba
selin
e u
tilit
y (m
inim
um
/ma
xim
um
)
Dis
counting
(0
-10
%)
Utilit
y re
ductio
n T
IA (
inclu
ded
/exc
lud
ed)
RR
beyo
nd B
P r
ed
uctio
n C
V e
vents
(in
clu
ded
/exc
lud
ed
)
Fig
ure
5To
rnad
odi
agra
ms
for
the
extr
eme
scen
ario
sin
prim
ary
(Ger
man
y&
Spai
n)an
dse
cond
ary
prev
entio
n(G
erm
any
&Be
lgiu
m)
sim
ulat
ing
1000
patie
nts
and
1000
itera
tions
over
lifet
ime.
CUA Eprosartan Europe 11

reduction at the titration end point (week 15) over the wholestudy period (2 years) [110]. According to this trial it is assumedthat both eprosartan and enalapril will be able to maintain theinitial blood pressure reduction over a long time horizon.Changes in systolic blood pressure reduction over this timehorizon are taken into account by including the patient compli-ance that decreases continuously in the course of time [27]. Thus,the mean systolic blood pressure in each treatment arm risescontinuously because of the fact that noncompliant patientswere considered to have no blood pressure reduction. To test theinfluence of the treatment time horizon on the cost-effectivenessof eprosartan, sensitivity analyses assuming shorter and longertreatment time horizons were performed (1 year and 10 years)without showing a major impact on the cost-effectiveness ofeprosartan.
The model uses the DDD costs of eprosartan and enalaprilinstead of the drug dose distribution observed in the Sega et al.trial. The rationale for this was that the twice-daily 400 mgeprosartan dose, as given to some patients within the underlyingefficacy trial, is not available in all the countries investigated. If itwere possible to reflect the drug doses used in the Sega study, amean 683 mg daily dose of eprosartan (instead of 600 mg) wouldhave to be compared to a mean 32.6 mg daily dose of enalapril(instead of 10 mg).
Thus, in general, using the DDD in the primary preventionsetting is likely to underestimate the drug costs of enalapril,leading to a conservative estimation of the treatment cost of thecomparators.
Secondary Prevention SettingSimulating a health-care payer perspective over a lifetime horizonthe mean ICERs per QALY gained by eprosartan in comparisonto nitrendipine were always below the assumed willingness topay threshold of €30,000, independent of the country analysed.
The highest costs per QALY gained have been observed simu-lating a German health-care setting (€9136) followed by the UK(€6008), Norway (€1695), Sweden (€907), Spain (€-2054), andBelgium (€-5767).
These results were extensively tested by sensitivity analyses.The ICER was most sensitive with respect to the baseline age aswell as the sex, without changing the cost-effectiveness resultsfundamentally (all results remained below the assumed willing-ness to pay threshold of €30,000 per QALY gained). Both ofthese aspects (influence of age and influence of sex) have alreadybeen discussed in the previous chapter (primary preventiondiscussion).
The outcomes of the secondary prevention simulations arefurther strengthened by the results of the probabilistic sensitivityanalyses that have shown convincing results with a probability of100% that eprosartan is a cost-effective treatment strategy com-pared to nitrendipine regardless of the country analysed.
One limitation of the secondary prevention model, which ismainly based on the outcomes of the MOSES study, is the uncer-tainty concerning the mortality prediction in this specific popu-lation with stroke and concomitant hypertension. Therefore twodifferent settings were analysed. In the first setting (base case) theprobability of death was simulated by the Framingham mortalityalgorithms, whereas in the sensitivity analysis the MOSES mor-tality was applied. This probability of death based on theMOSES study was lower than the probability of death predictedby the Framingham algorithms. The mean 1-year period from theoccurrence of the CBV to the patient’s recruitment in the MOSESstudy was identified as the main reason for this difference,because mortality (especially mortality because of stroke) is
highest in the first year after the event, according to publishedstudies [24,25]. Simulating both approaches the Framinghammortality was considered to be more realistic and was thereforeused for the base case analyses. Although there is the abovementioned uncertainty concerning the mortality prediction in thesecondary prevention population, the impact of using theMOSES or the Framingham prediction on the cost per QALYgained is limited, as shown in the one-way sensitivity analyses.
Another limitation of the simulation was that we applied arisk reduction beyond blood pressure reduction for both CV andCBV events. Looking at the results of the MOSES study [16]there was a significant difference in the reduction of CBV andfirst CV events (P = 0.026 and P = 0.03) between the treatmentgroups, whereas the difference in reducing the recurrent CVevents was only of borderline significance (P = 0.061). A furtherlimitation of the secondary prevention analyses is that costs fornitrendipine were not available for Sweden, Norway and theUnited Kingdom. As a proxy, the local cost for amlodipine wasused in each setting. This assumption may have improved cost-effectiveness claims for eprosartan if nitrendipine would becheaper than amlodipine in these settings.
In view of the sizable difference in the number of CV eventscomparing eprosartan (4.95 CV events per 100 patient years)and nitrendipine (6.62 events per 100 patient years) we decidedto simulate the CV risk reduction of 25% in the base case setting,although the statistical evidence only supports this procedurewith respect to the first CV events, rather than with respect torecurrent CV events.
To investigate the impact of including the CV event riskreduction one way-sensitivity analyses have been performed thatexcluded the risk reduction for CV events beyond blood pressurereduction. The sensitivity analyses results show that the impactof excluding the CV event risk reduction had only a minorimpact on the results without influencing the cost-effectiveness ofeprosartan fundamentally.
We did not assess the benefits of fixed-dose combinationtherapies for hypertension in this analysis. A recent literaturereview has suggested that combination therapy may result insuperior blood pressure reductions compared to monotherapy inhypertension [111]. Furthermore, recent clinical trials have sug-gested benefits for fixed-dose combination with an ARB and acalcium channel blocker because of superior blood pressurereduction and better tolerability than either agent alone [112].Nevertheless, the combination of telmisartan and ramipril in therecent ONTARGET trial was not shown to improve survival orreduce renal events in patients with mild hypertension [113], andguidelines for the treatment of hypertension in the UnitedKingdom stipulate that combination therapy should be used onlywhen patients fail to reach blood pressure targets on mono-therapy [114]. Given conflicting evidence on the benefits of com-bination therapy for primary prevention, our findings thateprosartan as monotherapy is a cost-effective alternative toenalapril are relevant.
Conclusion
The results of the HEALTH model simulations in Belgium,Germany, Norway, Spain, Sweden, and the UK provide evidencethat eprosartan is a cost-effective treatment strategy compared toenalapril in primary prevention and to nitrendipine in secondaryprevention.
The cost-effectiveness in primary prevention is especially sen-sitive to changes in central patient characteristics, such as age andbaseline systolic blood pressure. These patient characteristics arethe two main factors to be considered for the prescription of
12 Schwander et al.

eprosartan in primary prevention. Considering the country withthe highest cost per QALY gained (Germany), starting fromthe age of 52 years and a baseline systolic blood pressure�164 mm Hg, eprosartan becomes a cost-effective treatmentoption compared to enalapril, although the generic price levelleads to a sizable difference in the drug therapy costs, and theexclusion of patient compliance with treatment (both ACEI andARB) did not result in cost-effectiveness in Germany. In all othercountries analysed cost-effectiveness is also observed in youngerpatients and in patients with a lower baseline systolic bloodpressure. Nevertheless, the focusing on older patients (�50 yearsof age) with a higher systolic blood pressure (�160 mm Hg) wasidentified as reasonable patient selection criteria to ensure acost-effective application of eprosartan within a primary preven-tion setting.
The cost-effectiveness outcomes show considerable evidencefor the cost-effectiveness of eprosartan compared to nitrendipinewithin a secondary prevention population in all countries inves-tigated, without any limitation related to the patient selection.
Supporting information for this article can be found at: http://www.ispor.org/publications/value/ViHsupplementary.asp
References
1 Elliott P, Law M, Lawes C, et al. Quantifying Selected MajorRisks To Health—High Blood Pressure, Murray C, Lopez A,The World Health Report 2002—Reducing Risks, PromotingHealthy Life. Geneva, Switzerland: World Health Organization,2002.
2 Mancia G, De Backer G, Dominiczak A, et al. ESH-ESC Guide-lines for the management of arterial Hypertension: the task forcefor the management of arterial Hypertension of the EuropeanSociety of Hypertension (ESH) and of the European Society ofCardiology (ESC). Blood Press 2007;16:135–232.
3 Pearce KA, Furberg CD, Rushing J. Does antihypertensive treat-ment of the elderly prevent cardiovascular events or prolonglife? A meta-analysis of hypertension treatment trials. Arch FamMed 1995;4:943–9.
4 Gueyffier F, Boutitie F, Boissel JP, et al. Effect of antihyperten-sive drug treatment on cardiovascular outcomes in women andmen. A meta-analysis of individual patient data from random-ized, controlled trials. The INDANA Investigators. Ann InternMed 1997;126:761–7.
5 Psaty BM, Smith NL, Siscovick DS, et al. Health outcomes asso-ciated with antihypertensive therapies used as first-line agents. Asystematic review and meta-analysis. JAMA 1997;277:739–45.
6 Rashid P, Leonardi-Bee J, Bath P. Blood pressure reduction andsecondary prevention of stroke and other vascular events: asystematic review. Stroke 2003;34:2741–8.
7 Turnbull F, Neal B, Algert C, et al. Effects of different blood-pressure-lowering regimens on major cardiovascular events:results of prospectively-designed overviews of randomised trials.Lancet 2003;362:1527–35.
8 Cheung BM, Cheung GT, Lauder IJ, et al. Meta-analysis of largeoutcome trials of angiotensin receptor blockers in hypertension.J Hum Hypertens 2006;20:37–43.
9 Psaty BM, Lumley T, Furberg CD, et al. Health outcomes asso-ciated with various antihypertensive therapies used as first-lineagents: a network meta-analysis. JAMA 2003;289:2534–44.
10 Sega R. Efficacy and safety of eprosartan in severe hypertension.Eprosartan Multinational Study Group. Blood Press 1999;8:114–21.
11 Staessen JA, Wang JG, Thijs L. Cardiovascular prevention andblood pressure reduction: a quantitative overview updated until1 March 2003. J Hypertens 2003;21:1055–76.
12 Wang JG, Staessen JA. Benefits of antihypertensive pharmaco-logic therapy and blood pressure reduction in outcome trials.J Clin Hypertens 2003;5:66–75.
13 Lawes CM, Rodgers A, Bennett DA, et al. Blood pressure andcardiovascular disease in the Asia Pacific region. J Hypertens2003;21:707–16.
14 Lawes CM, Bennett DA, Feigin VL, et al. Blood pressure andstroke: an overview of published reviews. Stroke 2004;35:776–85.
15 Chalmers J, MacMahon S, Bousser M-G, et al. Randomised trialof a perindopril-based blood-pressure-lowering regimen among6105 individuals with previous stroke or transient ischaemicattack. Lancet 2001;358:1033–41.
16 Schrader J, Lüders S, Kulschewski A, et al. Morbidity and Mor-tality After Stroke, Eprosartan Compared with Nitrendipine forSecondary Prevention: principal results of a prospective random-ized controlled study (MOSES). Stroke 2005;36:1218–26.
17 Schmeider RE. Mechanisms for the clinical benefits of angio-tensin receptor II blockers. Am J Hypertens 2005;18:720–30.
18 Hunink MG, Bult JR, de Vries J, et al. Uncertainty in decisionmodels analyzing cost-effectiveness: the joint distribution ofincremental costs and effectiveness evaluated with a nonpara-metric bootstrap method. Med Decis Making 1998;18:337–46.
19 D’Agostino RB, Russell MW, Huse DM, et al. Primary andsubsequent coronary risk appraisal: new results from theFramingham study. Am Heart J 2000;139:272–81.
20 Wolf PA, D’Agostino RB, Belanger AJ, et al. Probability ofstroke: a risk profile from the Framingham Study. Stroke1991;22:312–18.
21 Sacco RL, Wolf PA, Kannel WB, et al. Survival and recurrencefollowing stroke. The Framingham study. Stroke 1982;13:290–5.
22 Cupples LA, D’Agostino RB, Kiely D, Survival following initialcardiovascular events—The Framingham Study Section 35.In: Kannel WB, Wolf PA, Garrison RJ, eds. The FraminghamStudy—An Epidemiological Investigation of CardiovascularDisease. Bethesda, MD: US National Institutes of Health, 1988.
23 World Health Organization. Life tables for WHO member states.2007. Available from: http://www.who.int/whosis/database/life_tables/life_tables.cfm [Accessed November 19, 2007].
24 Hardie K, Hankey GJ, Jamrozik K, et al. Ten-year survival afterfirst-ever stroke in the Perth community stroke study. Stroke2003;34:1842–6.
25 Kolominsky-Rabas PL, Weber M, Gefeller O, et al. Epidemiol-ogy of ischemic stroke subtypes according to TOAST criteria:incidence, recurrence, and long-term survival in ischemic strokesubtypes: a population-based study. Stroke 2001;32:2735–40.
26 L’Ecuyer P, Zauberman G, Ariely D, et al. Good parameters andimplementations for combined multiple recursive randomnumber generators. Oper Res 1999;47:159–64.
27 Conlin PR, Gerth WC, Fox J, et al. Four-Year persistence pat-terns among patients initiating therapy with the angiotensin IIreceptor antagonist losartan versus other artihypertensive drugclasses. Clin Ther 2001;23:1999–2010.
28 Sappok T, Faulstich A, Stuckert E, et al. Compliance with sec-ondary prevention of ischemic stroke: a prospective evaluation.Stroke 2001;32:1884–9.
29 Annemans L, Crott R, Degraeve D, et al. Recommended struc-ture for reporting economic evaluation on pharmaceuticals inBelgium. Pharm World Sci 2002;24:5–7.
30 Schulenburg J-M, Greiner W, Jost F, et al. German recommen-dations on health economic evaluation—third and updatedversion of the Hanover Consensus. Gesundheitsökon Qualitäts-manage 2007;12:285–90.
31 Department of pharmacoeconomics of the Norwegian Medi-cines Agency. Norwegian guidelines for pharmacoeconomicanalysis in connection with applications for reimburse-ment. 2005. Available from: http://www.legemiddelverket.no/templates/InterPage____25644.aspx [Accessed December 10,2007].
32 Rovira J, Antonanzas F. Economic analysis of health technolo-gies and programmes. A Spanish proposal for methodologicalstandardisation. Pharmacoeconomics 1995;8:245–52.
33 Swedish Pharmaceutical Benefits Board. General guidelines foreconomic evaluations—Sweden. 2003. Available from: http://
CUA Eprosartan Europe 13

www.lfn.se/upload/English/ENG_lfnar2003-eng.pdf [AccessedNovember 20, 2007].
34 National Institute for Health and Clinical Excellence. Guide tothe methods of technology appraisal: section 5: Clinical and costeffectiveness and NHS impact. 2004. Available from: http://www.nice.org.uk/niceMedia/pdf/TAP_Methods.pdf [AccessedDecember 12, 2007].
35 Evans C, Tavakoli M, Crawford B. Use of quality adjusted lifeyears and life years gained as benchmarks in economic evalua-tions: a critical appraisal. Health Care Manag Sci 2004;7:43–9.
36 Socialstyrelsen. The Swedish National Board of Health and Wel-fare’s guidelines for cardiac care—support for decisions insetting priorities. 2004. Available from: http://www.sos.se/[Accessed May 3, 2008].
37 Persson U, Hjelmgren J. Hälso- och sjukvården behöverkunskap om hur befolkningen värderar hälsan. Läkartidningen2003;100:3436–7.
38 Lundin D. Kostnadseffektivitet som kriterium för subvention avläkemedel—en bra idé? ekonomiskdebatt 2004;34:32–40.
39 Bastian H, Bender R, Kaiser T, et al. IQWiG Methoden Version1.0. Cologne, Germany: Institute for Quality and Efficiency inHealth Care, 2005. Available from: http://www.iqwig.de/download/Methoden_IQWiG_V-1-0.pdf [Accessed December13, 2007].
40 Bellach BM. [The 1998 Federal Health Survey. Experiences,results, perspectives]. Gesundheitswesen 1999;61:Spec No:S55–6.
41 Hallan H, Romundstad S, Kvenild K, et al. Microalbuminuria indiabetic and hypertensive patients and the general population—consequences of various diagnostic criteria—the Nord-Trondelag Health Study (HUNT). Scand J Urol Nephrol 2003;37:151–8.
42 Kvenild K, Romundstad S, Midthjell K, et al. Microalbuminuriain treated hypertensives: only a mirror image of cardiovascularrisk? The HUNT Study, Norway. Scand J Prim Health Care2006;24:145–53.
43 Kuch B, Schunkert H, Muscholl M, et al. [Distribution, deter-minants and reference values of left ventricular parameters in thegeneral population—results of the MONICA/KORA echocar-diography studies]. Gesundheitswesen 2005;67(Suppl. 1):S68–73.
44 Cederholm J, Nilsson PM, Anderberg CP, et al. Blood pressureand other cardiovascular risk factors among treated hyperten-sives in Swedish primary health care. Scand J Prim Health Care2002;20:224–9.
45 Lindblad U, Rastam L, Ryden L, et al. Control of blood pressureand risk of first acute myocardial infarction: skaraborg hyper-tension project. BMJ 1994;308:681–6.
46 Nilsson P, Andersson DK, Andersson PE, et al. Cardiovascularrisk factors in treated hypertensives—a nation-wide, cross-sectional study in Sweden. J Intern Med 1993;233:239–45.
47 Heeringa J, van der Kuip DA, Hofman A, et al. Prevalence,incidence and lifetime risk of atrial fibrillation: the Rotterdamstudy. Eur Heart J 2006;27:949–53.
48 Ostgren CJ, Merlo J, Rastam L, et al. Atrial fibrillation and itsassociation with type 2 diabetes and hypertension in a Swedishcommunity. Diabetes Obes Metab 2004;6:367–74.
49 Thomas F, Renaud F, Benefice E, et al. International variabilityof ages at menarche and menopause: patterns and main deter-minants. Hum Biol 2001;73:271–90.
50 Jacobsen BK, Heuch I, Kvale G. Age at natural menopause andstroke mortality: cohort study with 3561 stroke deaths during37-year follow-up. Stroke 2004;35:1548–51.
51 Lidfeldt J, Nyberg P, Nerbrand C, et al. Socio-demographic andpsychosocial factors are associated with features of the meta-bolic syndrome. The Women’s Health in the Lund Area(WHILA) study. Diabetes Obes Metab 2003;5:106–12.
52 Lozano JV, Redon J, Cea-Calvo L, et al. [Risk assessment for afirst stroke in Spanish hypertensive population in primary care.The ERIC-HTA study]. Med Clin (Barc) 2005;125:247–51.
53 Bog-Hansen E, Lindblad U, Bengtsson K, et al. Risk factor clus-tering in patients with hypertension and non-insulin-dependent
diabetes mellitus. The Skaraborg Hypertension Project. J InternMed 1998;243:223–32.
54 National Centre for Social Research, Department of Epidemiol-ogy and Public Health at the Royal Free and University CollegeMedical School. Commissioned by Department of Health,England health survey 2003. UK data archive, 2004.
55 Ostgren CJ, Lindblad U, Melander A, et al. Survival in patientswith type 2 diabetes in a Swedish community: skaraborg hyper-tension and diabetes project. Diabetes Care 2002;25:1297–302.
56 Ceinos AM, Acosta EE, Martin PC, et al. [Risk factors related toosteoporosis and age of onset of menopause in the generalpopulation]. Aten Primaria 1999;24:140–4.
57 Rodstrom K, Bengtsson C, Milsom I, et al. Evidence for asecular trend in menopausal age: a population study of womenin Gothenburg. Menopause 2003;10:538–43.
58 Tuesca-Molina R, Guallar-Castillon P, Banegas-Banegas JR,et al. [Factors associated with the control of hypertensionamong older Spaniards, over 60 years of age]. Rev Esp SaludPublica 2006;80:233–42.
59 Thomas F, Renaud F, Benefice E, et al. International variabilityof ages at menarche and menopause: patterns and main deter-minants. Hum Biol 2001;73:271–90.
60 Burström K, Johannesson M, Diderichsen F. Health-relatedquality of life by disease and socio-economic group in thegeneral population in Sweden. Health Policy 2001;55:51–69.
61 Bell CM, Chapman RH, Stone PW, et al. An off-the-shelf helplist: a comprehensive catalog of preference scores from pub-lished cost-utility analyses. Med Decis Making 2001;21:288–94.
62 FPS Economy, SMEs, Self-employed and Energy. Healthcarecost index Belgium (Indice santé). 2007. Available from: http://economie.fgov.be/ [Accessed November 29, 2007].
63 Federal Statistical Office. Healthcare cost index Germany. 2007.Available from: http://www.destatis.de [Accessed November 29,2007].
64 Statistics Norway. Healthcare cost index Norway. 2007. Avail-able from: http://www.ssb.no [Accessed November 29, 2007].
65 The National Statistics Institute. Healthcare cost index Spain.2007. Available from: http://www.ine.es [Accessed November29, 2007].
66 Statistics Sweden. Healthcare cost index Sweden. 2007. Avail-able from: http://www.scb.se/ [Accessed November 29, 2007].
67 The Office for National Statistics. Healthcare cost index UK.2007. Available from: http://www.statistics.gov.uk [AccessedNovember 29, 2007].
68 Fjaertoft H, Indredavik B. [Cost-estimates for stroke]. TidsskrNor Laegeforen 2007;127:744–7.
69 The European Central Bank. Euro foreign exchange referencerates for Norway, Sweden and the UK. 2007. Available from:http://www.ecb.de/stats/exchange/eurofxref/html/index.en.html[Accessed November 29, 2007].
70 Institut national d’assurance maladie-invalidité (INAMI). Drugcosts Belgium: Liste des spécialités pharmaceutiques rembours-ables. 2007. Available from: http://www.inami.fgov.be[Accessed November 29, 2007].
71 Rote Liste® Service GmbH Frankfurt/Main. Drug costsGermany: ROTE LISTE®—Arzneimittelsverzeichnis für Deut-schland (online). 2007. Available from: http://www.rote-liste.de[Accessed November 29, 2007].
72 Norwegian Medicines Agency (NoMA). Drug costs Norway:Prisdatabase (PIA). 2007. Available from: http://www.legemiddelverket.no [Accessed November 29, 2007].
73 IMS Health. Drug costs Spain: Spanish IMS drug cost database.2007. Available from: http://www.imshealth.com [AccessedNovember 20, 2007].
74 Pharmaceutical Benefits Board (LFN). Drug costs Sweden: Sökpriser på läkemedel. 2007. Available from: http://www.lfn.se[Accessed November 29, 2007].
75 National Health Service England and Wales. Drug costs UK: theNHS Electronic Drug Tariff. 2007. Available from: http://www.ppa.org.uk [Accessed November 29, 2007].
76 Staessen JA, Den Hond E, Celis H, et al. Antihypertensive treat-ment based on blood pressure measurement at home or in the
14 Schwander et al.

physician’s office: a randomized controlled trial. JAMA 2004;291:955–64.
77 Association of Statutory Health Insurance Physicians. Germanphysician fee schedule (EBM 2000 plus), version of the fourthquarter 2007. 2007. Available from: http://www.kbv.de[Accessed November 29, 2007].
78 Johannesson M, Meltzer D, O’Conor RM. Incorporating futurecosts in medical cost-effectiveness analysis: implications for thecost-effectiveness of the treatment of hypertension. Med DecisMaking 1997;17:382–9.
79 Badia X, Bueno H, Gonzalez J Jr, et al. [Short-and long-termcost-effectiveness analysis of adding clopidogrel to standardtherapy in acute coronary syndrome patients in Spain]. Rev EspCardiol 2005;58:1385–95.
80 UK Department of Health. NHS reference costs. 2006. Availablefrom: http://www.dh.gov.uk [Accessed November 29, 2007].
81 Levy E, Gabriel S, Dinet J. The comparative medical costs ofatherothrombotic disease in European countries. Pharmacoeco-nomics 2003;21:651–9.
82 Muls E, Van Ganse E, Closon MC. Cost-effectiveness of prav-astatin in secondary prevention of coronary heart disease: com-parison between Belgium and the United States of a projectedrisk model. Atherosclerosis 1998;137(Suppl.):S111–16.
83 Schoenen J, Gianni F, Schretlen L, et al. Cost estimates of braindisorders in Belgium. Acta Neurol Belg 2006;106:208–14.
84 Kolominsky-Rabas PL, Heuschmann PU, Marschall D, et al.Lifetime cost of ischemic stroke in Germany: results andnational projections from a population-based stroke registry: theErlangen Stroke Project. Stroke 2006;37:1179–83.
85 Mullins CD, Sikirica M, Seneviratne V, et al. Comparisons ofhypertension-related costs from multinational clinical studies.Pharmacoeconomics 2004;22:1001–14.
86 Ray JA, Valentine WJ, Secnik K, et al. Review of the cost ofdiabetes complications in Australia, Canada, France, Germany,Italy and Spain. Curr Med Res Opin 2005;21:1617–29.
87 Rossnagel K, Nolte CH, Muller-Nordhorn J, et al. Medicalresource use and costs of health care after acute stroke inGermany. Eur J Neurol 2005;12:862–8.
88 Carod-Artal FJ, Egido-Navarro JA, Gonzalez-Gutierrez JL, et al.[Direct cost of cerebrovascular disease during the first year offollow-up]. Rev Neurol 1999;28:1123–30.
89 Andersson A, Levin LA, Oberg B, et al. Health care and socialwelfare costs in home-based and hospital-based rehabilitationafter stroke. Scand J Caring Sci 2002;16:386–92.
90 Ghatnekar O, Persson U, Glader EL, et al. Cost of stroke inSweden: an incidence estimate. Int J Technol Assess Health Care2004;20:375–80.
91 Caro JJ, Huybrechts KF. Stroke treatment economic model(STEM): predicting long-term costs from functional status.Stroke 1999;30:2574–9.
92 Youman P, Wilson K, Harraf F, et al. The economic burdenof stroke in the United Kingdom. Pharmacoeconomics2003;21(Suppl. 1):S43–50.
93 Zethraeus N, Molin T, Henriksson P, et al. Costs of coronaryheart disease and stroke: the case of Sweden. J Intern Med1999;246:151–9.
94 Finnern HW, Sykes DP. The hospital cost of vertebral frac-tures in the EU: estimates using national datasets (includes thecost per hospital day in Belgium). Osteoporos Int 2003;14:429–36.
95 Balestat G, Canaud MC, Lafortune G, et al. OECD Health Data2006: Mean length of stay for TIA in Belgium. Paris: Organisa-tion for Economic Co-operation, 2006.
96 Dodel RC, Haacke C, Zamzow K, et al. Resource utilization andcosts of stroke unit care in Germany. Value Health 2004;7:144–52.
97 Institut für das Entgeltsystem im Krankenhaus (Institute forthe Hospital Renumeration System). G-DRG case weights2007. 2007. Available from: http://www.g-drg.de/ [AccessedNovember 29, 2007].
98 Norwegian Directorate for Health and Social Affairs (Sosial-oghelsedirektoratet). Hospital funding 2007 (Innsatsstyrt finan-siering 2007). 2007. Available from: http://www.shdir.no/[Accessed August 27, 2007].
99 Navarro Espigares JL, González López JM, Hernandez Torres L,et al. Cost-Effectiveness Analysis of Ambulatory TreatmentBased on Eco-Doppler Examination for Patients with TransientIschemic Attack. The 115th annual meeting of the AmericanPublic Health Association, 2007.
100 Swedish National Board for Health and Welfare (Socialsty-relsen). Swedish NordDRG weights for 2007. 2007. Availablefrom: http://www.socialstyrelsen.se [Accessed August 27, 2007].
101 Stockholm Country Council. Estimated DRG cases and esti-mated costs per DRG point of hospitals within the Stockholmregion. 2007. Available from: http://www.sll.se/ [AccessedAugust 27, 2007].
102 Allender S, Scarborough P, Boxer A, et al., Economic Costs,Coronary Heart Disease Statistics. London: The British HeartFoundation, 2007.
103 Annemans L, Backer W, Rompay W, et al. Evaluation of thecosts of coronary heart disease in Belgium. Value Health1998;1:33.
104 Klever-Deichert G, Hinzpeter B, Hunsche E, et al. [Costs ofcoronary heart diseases over the remaining life time in coronaryheart disease cases—an analysis of the current status of coronaryheart disease cases in Germany from the social perspective]. ZKardiol 1999;88:991–1000.
105 Taylor MJ, Scuffham PA, McCollam PL, et al. Acute coronarysyndromes in Europe: 1-year costs and outcomes. Curr Med ResOpin 2007;23:495–503.
106 Clarke P, Gray A, Legood R, et al. The impact of diabetes-related complications on healthcare costs: results from theUnited Kingdom Prospective Diabetes Study (UKPDS Study No.65). Diabet Med 2003;20:442–50.
107 Koster I, Hauner H, von Ferber L. [Heterogeneity of costs ofdiabetic patients: the Cost of Diabetes Mellitus Study]. DtschMed Wochenschr 2006;131:804–10.
108 Gomez-Gerique JA, Casciano R, Stern L, et al. A pharmacoeco-nomic evaluation of the effects of atorvastatin on early recurrentischemic events in acute coronary syndromes in Spain. Eur JHealth Econ 2004;5:278–84.
109 Jönsson B. Measurement of health outcome and associated costsin cardiovascular disease. Eur Heart J 1996;17(Suppl. A):S2–7.
110 Levine B. Eprosartan provides safe and effective long-term main-tenance of blood pressure control in patients with mild to mod-erate essential hypertension. Curr Med Res Opin 2001;17:8–17.
111 Neutel JM. Prescribing patterns in hypertension: the emergingrole of fixed-dose combinations for attaining BP goals in hyper-tensive patients. Curr Med Res Opin 2008;24:2389–401.
112 Philipp T, Smith TR, Glazer R, et al. Two multicenter, 8-week,randomized, double-blind, placebo-controlled, parallel-groupstudies evaluating the efficacy and tolerability of amlodipine andvalsartan in combination and as monotherapy in adult patientswith mild to moderate essential hypertension. Clin Ther2007;29:563–80.
113 Mann JFE, Schmeider RE, McQueen M, et al. Renal outcomeswith telmisartan, ramipril, or both, in people at high vascularrisk (the ONTARGET study): a multicentre, randomized,double-blind, controlled trial. Lancet 2008;372:547–3.
114 National Collaborating Centre for Chronic Conditions. Hyper-tension: Management in Adults in Primary Care: Pharmacologi-cal Update. London: Royal College of Physicians, 2006.
CUA Eprosartan Europe 15


![Endoscopic sclerotherapy compared with no specific treatment for the primary prevention of bleeding from esophageal varices. A randomized controlled multicentre trial [ISRCTN03215899]](https://static.fdokumen.com/doc/165x107/6343f5bedf19c083b1075ec8/endoscopic-sclerotherapy-compared-with-no-specific-treatment-for-the-primary-prevention.jpg)