Development/Plasticity/Repair Mapping Infant Brain Myelination with Magnetic Resonance Imaging
Upload
khangminh22Category
view
2download
0
Received: 16 October 2021 Revised: 22 February 2022 Accepted: 17 March 2022
DOI: 10.1002/dneu.22874
R E S E A R C H A R T I C L E
Cortical myelination in toddlers and preschoolers with autismspectrum disorder
Bosi Chen1,2 Annika Linke1 Lindsay Olson1,2 Jiwandeep Kohli1,2
Mikaela Kinnear1 Martin Sereno1,2 Ralph-Axel Müller1,2,3 Ruth Carper1,2,3
Inna Fishman1,2,3
1Brain Development Imaging Laboratories,
Department of Psychology, San Diego State
University, San Diego, California, USA
2SDSU/UC San Diego Joint Doctoral
Program in Clinical Psychology, San Diego,
California, USA
3Center for Autism and Developmental
Disorders, San Diego State University, San
Diego, California, USA
CorrespondenceBosi Chen and Inna Fishman, SDSU/UC
San Diego Joint Doctoral Program in
Clinical Psychology, San Diego, CA, USA.
Email: [email protected];
Funding informationNational Institute of Mental Health,
Grant/Award Number: R01MH107802
AbstractIntracortical myelin is thought to play a significant role in the development of neu-
ral circuits and functional networks, with consistent evidence of atypical network
connectivity in children with autism spectrum disorder (ASD). However, little is
known about the development of intracortical myelin in the first years of life in ASD,
during the critical neurodevelopmental period when autism symptoms first emerge.
Using T1-weighted (T1w) and T2w structural magnetic resonance imaging (MRI) in
21 young children with ASD and 16 typically developing (TD) children, ages 1.5–
5.5 years, we demonstrate the feasibility of estimating intracortical myelin in vivo
using the T1w/T2w ratio as a proxy. The resultant T1w/T2w maps were largely com-
parable with those reported in prior T1w/T2w studies in TD children and adults, and
revealed no group differences between TD children and those with ASD. However,
differential associations between T1w/T2w and age were identified in several early
myelinated regions (e.g., visual, posterior cingulate, precuneus cortices) in the ASD
and TD groups, with age-related increase in estimated myelin content across the tod-
dler and preschool years detected in TD children, but not in children with ASD. The
atypical age-related effects in intracortical myelin, suggesting a disrupted myelina-
tion in the first years of life in ASD, may be related to the aberrant brain network con-
nectivity reported in young children with ASD in some of the same cortical regions
and circuits.
K E Y W O R D Sautism spectrum disorder, brain maturation, early childhood, intracortical myelin, neurodevelop-
ment, neuroimaging
1 INTRODUCTION
Although symptoms of autism spectrum disorder (ASD)
emerge early in postnatal life (Pierce et al., 2011) and can
be reliably identified during the second year of life (Corsello
This is an open access article under the terms of the Creative Commons Attribution-NonCommercial License, which permits use, distribution and reproduction in any medium,
provided the original work is properly cited and is not used for commercial purposes.
© 2022 The Authors. Developmental Neurobiology published by Wiley Periodicals LLC.
et al., 2013; Ozonoff et al., 2008, 2015; Pierce et al., 2019;
Sacrey et al., 2018), most children with ASD are not diag-
nosed until they are 4–5 years old (Maenner et al., 2020), in
large part due to the lack of clinically meaningful biomark-
ers. The implications of delayed identification are significant,
Developmental Neurobiology. 2022;82:261–274. wileyonlinelibrary.com/journal/dneu 261

262 CHEN ET AL.
given the positive impact of early interventions on both behav-
ior and the developing brain (Dawson et al., 2012; Estes et al.,
2015; Landa, 2018). The current consensus on the underlying
neurobiology is that ASD originates prenatally, affecting early
building blocks of brain circuit development and function,
such as protein synthesis and cellular metabolism, with cas-
cading effects on neuronal proliferation and migration, synap-
togenesis and synaptic signaling, myelination, and network
formation (Courchesne et al., 2019; Gordon & Geschwind,
2020). However, the current understanding of these funda-
mental neurodevelopmental processes (e.g., synaptic pruning
(Spear, 2013) or myelination (Abrahám et al., 2010; Chap-
man & Hill, 2020) is limited by the scarcity of brain imaging
studies in young children with ASD (before 4–5 years of age).
This is in part due to the known practical and methodological
challenges of acquiring high-quality imaging data early in life
(Turesky et al., 2021).
Although much of the developmental neurobiology of ASD
remains unknown, a few consistent findings have emerged
from the relatively limited but growing number of MRI stud-
ies in infants and toddlers at risk for, or with first symptoms
of autism, including prospective studies of infant siblings
of older children with ASD. The most consistently reported
finding to date is enlargement of brain volume early in life
(Courchesne et al., 2001; Hazlett et al., 2005, 2011; Nor-
dahl et al., 2011). This early brain overgrowth appears to
reflect accelerated growth rate particularly between 1 and 2
years of age (Hazlett et al., 2011), affecting both white and
gray matter volumes (Hazlett et al., 2005), and being possibly
driven by cortical surface area hyper-expansion between 6 and
12 months of age (Hazlett et al., 2017). Additionally, a number
of cross-sectional and longitudinal diffusion-weighted imag-
ing studies have reported increased structural connectivity
(indexed by greater fractional anisotropy [FA]) across multi-
ple white matter tracts (e.g., corpus callosum, cingulum, arcu-
ate fasciculus) in infants and toddlers who either have been or
are later diagnosed with ASD (Conti et al., 2017; Solso et al.,
2016; Wolff et al., 2012; Xiao et al., 2014). The early increase
in structural connectivity—contrasted with broadly reduced
structural connectivity (i.e., lower FA) in older children and
adults with ASD (Travers et al., 2012)—is thought to indicate
an accelerated white matter growth in the first years of life in
ASD, consistent with the aforementioned accelerated trajec-
tory of volumetric growth.
While these findings provide indirect evidence of altered
brain maturation early in life in ASD, our understanding of the
specific neurodevelopmental processes contributing to atypi-
cal early growth and structural connectivity remains limited.
Among such fundamental processes shaping the brain struc-
ture and function is myelination which is essential for effi-
cient neural communication (Liu et al., 2019), as myelinated
axons allow for rapid and reliable propagation of neuronal
signals across the brain. Equally critical for brain maturation
and connectivity is intracortical myelination found predomi-
nately in the deeper cortical layers (Fields, 2014), in part due
to spread of the white matter myelin into the periphery of cor-
tical neuropil (Shaw et al., 2008; Sowell et al., 2004). Intra-
cortical myelination is essential for establishing and maintain-
ing neural circuitry, as it contributes to fine-tuning the tim-
ing and synchrony of neural networks (Haroutunian et al.,
2014). In typical development, the maturational timing of
intracortical myelination, which commences at or near birth
(Arnold & Trojanowski, 1996), follows a general primary-
to-association cortices gradient (Sydnor et al., 2021), with
unimodal primary sensory and motor cortices being highly
myelinated by 1 year of age, and transmodal association areas
in frontal and temporal cortices exhibiting more protracted
myelination, continuing at least through the third decade of
life (Deoni et al., 2015; Grydeland et al., 2019; Rowley et al.,
2017; Shafee et al., 2015). Critically, this maturational princi-
ple parallels the development of brain network connectivity
in healthy development (Chen, Linke, Olson, Ibarra, Kinn-
ear, et al., 2021; Dong et al., 2021; Gao et al., 2015), with
recent evidence suggesting that the timing of functional net-
work maturation and differentiation may be disrupted in tod-
dlers with ASD (Chen, Linke, Olson, Ibarra, Reynolds, et al.,
2021).
Although no neuroimaging techniques allow direct mea-
surement of myelin in the human brain in vivo, advanced
MRI acquisition methods permit estimation of myelin content
through either quantitative imaging, such as voxel-wise map-
ping of longitudinal or transverse relaxation times (Bock et al.,
2013; Geyer et al., 2011), or semiquantitative ratio of T1-
weighted (T1w) and T2w signal intensity (Glasser et al., 2013;
Glasser & Van Essen, 2011). The T1w/T2w ratio has been
shown to successfully map the regional differences in myelin
content (Glasser & Van Essen, 2011) and has been incorpo-
rated in the multimodal minimal preprocessing pipelines for
the Human Connectome Project (Glasser et al., 2013). Inves-
tigating the change in the T1w/T2w-estimated myelin content
over much of the human life span in a large cross-sectional
cohort of neurotypical children and adults between ages 8 and
83 years, Grydeland et al. (2013) reported linear increases in
the T1w/T2w-estimated intracortical myelin content through
the late 30s, followed by about 20 stable years and a gradual
decline from the late 50s. The T1w/T2w ratio has also been
associated with cognitive performance, especially on tasks of
cognitive control (Grydeland et al., 2013; Grydeland et al.,
2016). Thus, the T1w/T2w ratio may be a well-suited MRI-
accessible proxy for investigating the development of intra-
cortical myelin in young children with ASD, which, to our
knowledge, has yet to be evaluated.
To enhance our understanding of early neurodevelopment
in autism, the current study sets out to examine age-related
effects in intracortical myelin in young children with ASD,
compared to typically developing (TD) age-matched peers,
using both T1w and T2w structural MRI data acquired
during natural nocturnal sleep. Given the lack of previous

CHEN ET AL. 263
studies using the T1w/T2w ratio in young children with ASD,
we expected to find main effects of diagnosis, but had no a
priori hypotheses regarding the direction of potential effects.
2 METHODS AND MATERIALS
2.1 Participants
This study includes data from young children enrolled in the
San Diego State University (SDSU) Toddler MRI Project, an
ongoing longitudinal study of early brain markers of ASD.
Children between the ages of 18 and 42 months with a
diagnosis of ASD (or behavioral concerns consistent with
ASD symptoms) were referred to the study from specialty
autism clinics, state-funded early education and developmen-
tal evaluation programs, local pediatricians, service providers,
and community clinics, and are being followed up through
age 5 years. TD children were recruited from the commu-
nity, including early head start programs, and via print and
social media advertisements. Participants in either group were
screened and excluded for any co-occurring neurological dis-
orders (e.g., cerebral palsy), history of perinatal CNS infec-
tion or gross CNS injury, nonfebrile seizures, and contraindi-
cations for MRI. Participants with known syndromic forms
of ASD (e.g., fragile X or Rett syndrome), as ascertained
from parent report, were also excluded. To limit known risk
factors for developmental delays among children enrolled
in the TD group, TD participants were also screened and
excluded for prematurity (<36 weeks of gestation), family his-
tory (in first-degree relatives) of ASD, intellectual disability,
or other heritable psychiatric or neurological disorders. The
research protocol was approved by the institutional review
boards of SDSU and University of California San Diego, and
the County of San Diego Health and Human Services Agency.
Written informed consent was obtained from the caregivers.
This report includes cross-sectional data from 21 children
with ASD and 16 TD participants, ages 1.5–5 years, for whom
high-quality T1w and T2w anatomical MRI data acquired in
the same session (during natural sleep; see Section 2.3 below
for details) were available. While 32 children with ASD and
23 TD children had completed the full imaging protocol, data
from 11 children with ASD and 7 TD children were excluded
following stringent data quality assessment, as detailed below
in Section 2.4. Participants with ASD and TD children were
matched at the group level on age and gender distribution (see
Table 1 for demographic characteristics of the sample).
2.2 Diagnostic and developmentalassessment
Upon enrollment, diagnoses of ASD (or clinical best esti-
mate (Ozonoff et al., 2015) in children younger than age
3 years) were established at a specialty clinic (SDSU Center
for Autism and Developmental Disorders) using standardized
measures in combination with clinical judgment, in accor-
dance with the current recommendations by the American
Academy of Pediatrics and Society for Developmental and
Behavioral Pediatrics (Weitzman & Wegner, 2015). Only par-
ticipants who met diagnostic criteria for ASD, or clinical
best estimate, on the DSM-5 (APA, 2013) were included in
the ASD group. Because diagnostic evaluation is repeated
at follow-up visits in the context of the larger longitudinal
study, only data from children with confirmed diagnosis were
included in the current dataset. The diagnoses were supported
by the Autism Diagnostic Observation Schedule-Second Edi-
tion (Lord et al., 2012) administered by research-reliable clini-
cians, the Social Communication Questionnaire (Lord & Rut-
ter, 2003), or the Autism Diagnostic Interview-Revised (Lord
et al., 1994) administered to caregivers of children 36 months
old and older, and expert clinical judgment (by two senior
authors). Developmental skills were assessed in all TD and
ASD participants with the Mullen Scales of Early Learning
(Mullen, 1995), a clinician-administered standardized assess-
ment of cognitive, language, and motor development. The
Vineland Adaptive Behavior Scales, Second Edition, Survey
Interview (Sparrow et al., 2005), a semistructured interview,
was administered to caregivers to assess the child’s adaptive
development skills demonstrated at home and other settings;
the Vineland scores were utilized to support the diagnostic
and developmental classification, and are not used as vari-
ables of interest in the current analyses. The Social Commu-
nication Questionnaire (Lord & Rutter, 2003), a screener for
ASD, was administered to caregivers of all participants, with
no TD participants exceeding the clinical cut-off score of 15
(all TD scores ≤10; see Table 1).
2.3 MRI data acquisition
MRI data were collected during natural nocturnal sleep on
a 3T GE Discovery MR750 MRI scanner, using a Nova
Medical 32-channel head coil. Whole-brain high-resolution
anatomical images were obtained using a fast 3D spoiled
gradient recalled (FSPGR) T1-weighted sequence (voxel
size = 0.8mm3, NEX = 1, TE/TI = min full/1060 ms, flip
angle = 8˚, FOV = 25.6 cm, matrix = 320 × 320, receiver
bandwidth 31.25 HZ) and Cube T2-weighted sequence (voxel
size = 0.8mm3, NEX = 1, TR = 3200 ms, TE = minimum,
FOV = 25.6 cm, matrix = 320 × 320, bandwidth 125htz).
Motion during T1w and T2w scans was corrected in real-time
using three navigator scans and prospective motion correction
(White et al., 2010), and images were bias corrected using the
GE PURE option. Other MRI data, including functional and
diffusion MRI, were also acquired but are not included in this
study.

264 CHEN ET AL.
T A B L E 1 Participant characteristics and demographic information
ASD (n = 21) TD (n = 16) ASD vs. TDMean ± SD (min–max) Mean ± SD (min–max) t/χ2 p-value
Age at scan (months)* 42.7 ± 12.8 (21–62) 41.8 ± 15.4 (20–65) t(35) = 0.19 .85
Gender (M/F) 16/5 9/7 χ2(1) = 1.65 .20
Ethnicity (Hispanic/Non-Hispanic)a 9/10 6/10 χ2(1) = 0.35 .56
Race (White/Black/More-than-one/Asian)b 16/0/3/1 13/2/0/0 – –
Gestational age (weeks)c 39.1 ± 1.9 (35–43) 39.6 ± 1.2 (37–42) t(34) = −1.09 .29
Birth weight (grams)d 3276.2 ± 583.1
(2098–4394)
3451.6 ± 363.0
(2863–4082)
t(33) = −1.04 .30
Delivery method (Vaginal/C-section) 13/8 13/3 χ2(1) = 1.63 .20
Maternal education level (%)
High school or some college credit, but <1 year 38% 6% – –
Associate degree 10% 0 – –
Bachelor’s degree 10% 44% – –
Master’s degree 29% 44% – –
Professional degree (MD, PhD, JD) 14% 6% – –
MSEL Early Learning Composite, Standard Score 75.3 ± 17.6 (49–105) 103.1 ± 16.1 (80–136) t(35) = −4.95 <.001
SCQ Total Scoree 14.3 ± 9.2 (3–35) 4.7 ± 2.4 (1–9) t(33) = 4.02 <.001
ADOS-2 Calibrated Severity Score 5.9 ± 2.2 (2–9) – – –
Total Brain Volume (cm3) 1099.8 ± 99.5
(910.0–1282.7)
1052.5 ± 100.9
(813.9–1202.3)
t(35) = 1.42 .16
Gray/White CNR 2.0 ± 0.2 (1.7–2.5) 1.9 ± 0.1 (1.7–2.1) t(35) = 1.50 .14
Abbreviations: ADOS-2, Autism Diagnostic Observation Schedule Second Edition; CNR, contrast-to-noise ratio; F, female; M, male; MSEL, Mullen Scales of Early
Learning; SCQ, Social Communication Questionnaire.
*MRI data were acquired within 3 weeks of the diagnostic and behavioral evaluation.aEthnicity data are missing for two ASD subjects.bRace data are missing for one ASD and one TD subjects.cGestational age data are missing for one ASD subject.dBirth weight data are missing for two ASD subjects.eSCQ data are missing for two ASD subjects.
In preparation for the scan night, and to optimize MRI data
acquisition, a comprehensive habituation protocol was imple-
mented. An individualized scan night sleep strategy (e.g., time
of arrival, approximating home-like sleeping arrangements,
including access to a double MRI bed for co-sleeping fam-
ilies, rocking chair, modular playpen mounted on the MRI
bed resembling a crib, lighting in the MRI suite) was devel-
oped for each child, based on the typical bedtime routines
assessed in advance with an in-house Sleep Habits Question-
naire. To habituate the child to the scanning environment,
the parents were instructed to practice nightly inserting soft
foam child-size earplugs after the child had fallen asleep, and
to play an mp3 file containing the MRI sounds of the scan
sequences employed in the study at progressively louder vol-
umes for a week. On the night of the scan, noise protection
was achieved with MRI compatible headphones (MR Con-
fon) and earplugs. Scanning commenced after approximately
30–50 min of sleep, with the T1w sequence acquired about
15 min into the scanning session and the T2w scan being the
last sequence acquired approximately 40 min after the start of
scanning.
2.4 MRI data preprocessing and qualityassessment
All structural images were visually inspected for motion-
related and other artifacts. Whole-brain average gray/white
contrast-to-noise ratio (CNR) was calculated for each par-
ticipant’s T1w image (see Table 1). The Human Connec-
tome Project minimal preprocessing structural pipelines (Pre-FreeSurfer, FreeSurfer, and PostFreeSurfer) were employed
to perform cortical reconstruction and to generate cortical
myelin maps (Glasser et al., 2013). Briefly, the PreFreeSurferpipeline was used to correct for gradient nonlinearity distor-
tion, to align the T1w and T2w images with a six degrees of
freedom rigid body transformation, and to correct for intensity
inhomogeneity, including correction for B1-bias and some

CHEN ET AL. 265
B1+bias in the T1w and T2 images by estimating the bias
field F from the square root of the product of the T1w and
T2w images after thresholding out nonbrain tissues.
The FreeSurfer pipeline used a modified FreeSurfer’s
(v.5.3.0-HCP) recon-all pipeline (Dale et al., 1999; Fischl,
Sereno, & Dale, 1999; Fischl, Sereno, Tootell, et al., 1999)
to perform brain extraction, automated tissue segmentation,
surface topology correction, and white and pial surface gen-
eration on the distortion- and bias-corrected T1w images in
native volume space derived from the PreFreeSurfer pipeline.
The T2w to T1w registration was further improved using
FreeSurfer’s BBRegister (Greve & Fischl, 2009).
Surface myelin maps were generated with the Post-FreeSurfer pipeline, using the methods described in Glasser
and Van Essen (2011) and Glasser et al. (2014). The T1w/T2w
ratio images were obtained by dividing the T1w images by
the aligned T2w images and were sampled at mid-thickness
between the white and pial surfaces as a proxy of intra-
cortical myelin. Residual bias field in the T1w/T2w images
was corrected by modeling the expected low spatial fre-
quency distribution of T1w/T2w intensities across the surface
and subtracting it from the individual T1w/T2w-estimated
myelin maps (Glasser & Van Essen, 2011; Glasser et al.,
2014).
All T1w and T2w images and FreeSurfer outputs were
examined slice-by-slice by two independent raters to assess
overall image quality and identify any inaccuracies in sur-
face placement. Of the 32 datasets from children with ASD
and 23 datasets from TD children with both T1w and T2w
images available, data from 10 ASD and seven TD chil-
dren were excluded due to major artifacts in the T1w or
T2w image, such as ghosting and ringing, and/or surface
placement inaccuracies on the FreeSurfer output of the T1w
image. All T1w/T2w-estimated myelin maps were also visu-
ally inspected, and whole brain mean T1w/T2w ratio was cal-
culated for each participant. Data from one child with ASD
with the whole brain mean T1w/T2w ratio greater than two
standard deviations above the group mean was identified as
an outlier and excluded from the analysis. The excluded chil-
dren (n = 18) did not significantly differ from those included
in the study with regard to their age (p = .63), sex distribution
(p = .73), overall developmental skills (p = .33) or, among
children with ASD, autism symptom severity (p = .27).
2.5 Statistical analysis
2.5.1 Regions of interest
The average T1w/T2w ratio values were extracted from 34
cortical regions of interest (ROIs) per hemisphere from the
Desikan–Killiany atlas (Desikan et al., 2006). In order to
reduce the number of comparisons, we focused on the regions
known to undergo rapid myelination in the first years of life
(Deoni et al., 2015). Thus, only ROIs with the T1w/T2w
ratio greater than the average whole-brain T1w/T2w for this
cohort (T1w/T2w ratio >2.2) were selected for subsequent
analyses, resulting in 11 ROIs. These highly myelinated cor-
tical regions included pericalcarine, cuneus, lingual, isthmus
cingulate, transverse temporal, lateral occipital, postcentral,
posterior cingulate, paracentral, precentral, and precuneus
cortices, encompassing the primary somatosensory, motor,
visual, auditory, and posterior parts of the cingulate cortices.
Given the similar rate of myelin development in the left and
right hemisphere reported in a large cohort of 1- to 6-years old
children (Deoni et al., 2015), we averaged between the left and
right homologous ROIs to calculate the mean T1w/T2w ratio
for each ROI.
2.5.2 T1w/T2w ratio analyses
Linear regression models were used with T1w/T2w ratio as
the outcome variable and diagnostic group, age, and age by
group interaction as predictors, for each of the selected ROIs.
Sex, gray/white CNR, and total brain volume (TBV) were
included as covariates in all regression models during model
specification state, and retained only if revealed to be sig-
nificant predictors. Gray/white CNR did not differ between
groups (see Table 1) nor accounted for significant variance
(ps > .2) in any of the models; as a result, it was removed
from the final models. Corrections for multiple comparisons
were conducted using Benjamini–Hochberg False Discovery
Rate (FDR) at q < 0.1. Follow-up partial correlations were
calculated between age and T1w/T2w ratio for each group
for those ROIs with significant age by group interactions,
while controlling for covariates revealed to be significant
predictors.
2.5.3 Correlations with autism symptoms
Associations between estimated myelin content and autism
symptoms (in children with ASD only) were examined with
linear regression models with T1w/T2w ratio as the outcome
variable, and ADOS-2 Calibrated Severity Scores (CSS, an
index of ASD symptom severity, which allows comparisons
across ages and language abilities) as predictor, controlling
for age, sex, and MSEL Early Learning Composite (ELC, a
standard score indexing child’s overall developmental level).
These models were only applied for the ROIs showing signif-
icant diagnostic group, or age by group interaction effects in
the main analysis. Benjamini–Hochberg FDR at q < 0.1 was
used to correct for multiple comparisons.

266 CHEN ET AL.
F I G U R E 1 Estimated myelin content (T1-weighted [T1w]/T2w ratio) in young children with autism spectrum disorder (ASD) and typically
developing (TD) children. (a) Average T1w/T2w ratio maps in the ASD and TD groups. Group average T1w/T2w ratio projected on the inflated
surface. In all medial surface panels, the medial wall is masked. The color palette reflects T1w/T2w ratio percentile rank indexing lightly myelinated
cortex in purple and more highly myelinated cortex in red. (b and c) Estimated myelin content (T1w/T2w ratio, averaged across hemispheres) for the
11 regions of interest (ROIs), in the ASD and TD groups. The 11 ROIs with the highest estimated myelin content (T1w/T2w ratio greater than the
average whole-brain T1w/T2w ratio for the whole cohort) include pericalcarine, cuneus, lingual, isthmus cingulate, transverse temporal, lateral
occipital, postcentral, posterior cingulate, paracentral, precentral, and precuneus cortices. Panel b shows average T1w/T2w ratio per group, and panel
c shows distribution of the T1w/T2w values within each group, for each ROI
3 RESULTS
The resultant T1w/T2w maps for the ASD and TD groups are
shown in Figure 1a. Overall, the T1w/T2w spatial patterns and
distribution were very similar for children in the ASD and TD
groups, with the motor/somatosensory strip in the central sul-
cus, visual cortex in the occipital lobe, primary auditory areas
in Heschl’s gyrus, and posterior aspects of the cingulate cortex
showing the highest T1w/T2w values. Regions with the low-
est myelination included the temporal pole, medial prefrontal
cortex, and the anterior cingulate cortex. These patterns are
highly consistent with those reported in adults (Glasser & Van
Essen, 2011) and in typically developing young children in
the same age range (obtained with a different myelin mapping
method; Deoni et al., 2015).
3.1 Group comparisons and age-relatedeffects on T1w/T2w ratio
Results of the regression analyses revealed no significant
group differences (ASD vs. TD) in the average T1w/T2w ratio

CHEN ET AL. 267
F I G U R E 2 Correlations between estimated myelin content and age in the autism spectrum disorder (ASD) and typically developing (TD)
groups. Scatterplots of correlations between T1w/T2w ratio and age, in seven out of 11 regions of interest (ROIs) where significant age by diagnostic
group interaction effects were detected. r-Values denote bivariate (zero-order) correlation coefficients for the ASD and TD groups, with significant
within-group correlations indicated in bold font. Bivariate correlations are presented because covariates (sex, contrast-to-noise ratio [CNR], and total
brain volume [TBV]) did not account for significant variance in these models
in the selected 11 ROIs (Figure 1b,c). However, significant
age by group interaction effects (q < 0.1) was identified in
seven out of the 11 ROIs (including the pericalcarine, cuneus,
lingual, isthmus cingulate, lateral occipital, posterior cingu-
late, and precuneus cortices), with a consistent pattern of pos-
itive associations between T1w/T2w and age in TD children
(correlation coefficients r = [0.32–0.58]) and a general lack
of such relationship with age in the ASD group (correlation
coefficients r= [−0.28 to−0.04]; see scatterplots in Figure 2).
Sex and TBV did not account for significant variance in these
models.
3.2 Links with autism symptoms
There were no significant associations between estimated
myelin content (T1w/T2w ratio) and autism symptoms
(ADOS-2 CSS) after controlling for age, sex, and overall
developmental skills (Mullen ELC) in the seven ROIs iden-
tified in the main analyses.
3.3 Post hoc examination of links betweenT1w/T2w ratio and other morphometric indicesof cortical maturation
Given the rapid brain volume growth and prominent morpho-
metric changes in the first years of life (Gilmore et al., 2012; Li
et al., 2013; Lyall et al., 2015), we conducted post hoc anal-
yses to explore whether T1w/T2w ratio relates to gray mat-
ter volume in the cortical ROIs showing significant age by
group interaction effects in the main analysis. Linear regres-
sion models with T1w/T2w ratio as the outcome variable, and
diagnostic group, cortical volume, and group by volume inter-
action as predictors, while controlling for age, sex, and TBV
were employed (cortical volumes were automatically calcu-
lated at each FreeSurfer surface vertex during preprocess-
ing and were averaged across all vertices within each ROI).
Corrections for multiple comparisons were conducted using
Benjamini–Hochberg FDR at q < 0.1.
These analyses revealed significant group by volume inter-
action effects in the cuneus, isthmus cingulate, and precuneus
cortices, after correcting for multiple comparisons (q < 0.1).
Age, sex, and TBV did not account for significant variance
in any of these models. Follow-up correlational analyses
between T1w/T2w and ROI volume in each group revealed
a significant positive association between T1w/T2w and vol-
ume in the cuneus in the TD group (r = 0.74, p < .001), indi-
cating that the two indices of cortical maturation co-vary in
young TD children, while such a relationship was not present
in the ASD group (see Figure 3). Because cortical volume is,
by and large, a product of cortical thickness and surface area,
we conducted an additional exploratory analysis to exam-
ine whether the atypical relationship between cortical myelin
and gray matter volume observed in the ASD group may be
related to atypical cortical thinning or surface area expansion
268 CHEN ET AL.
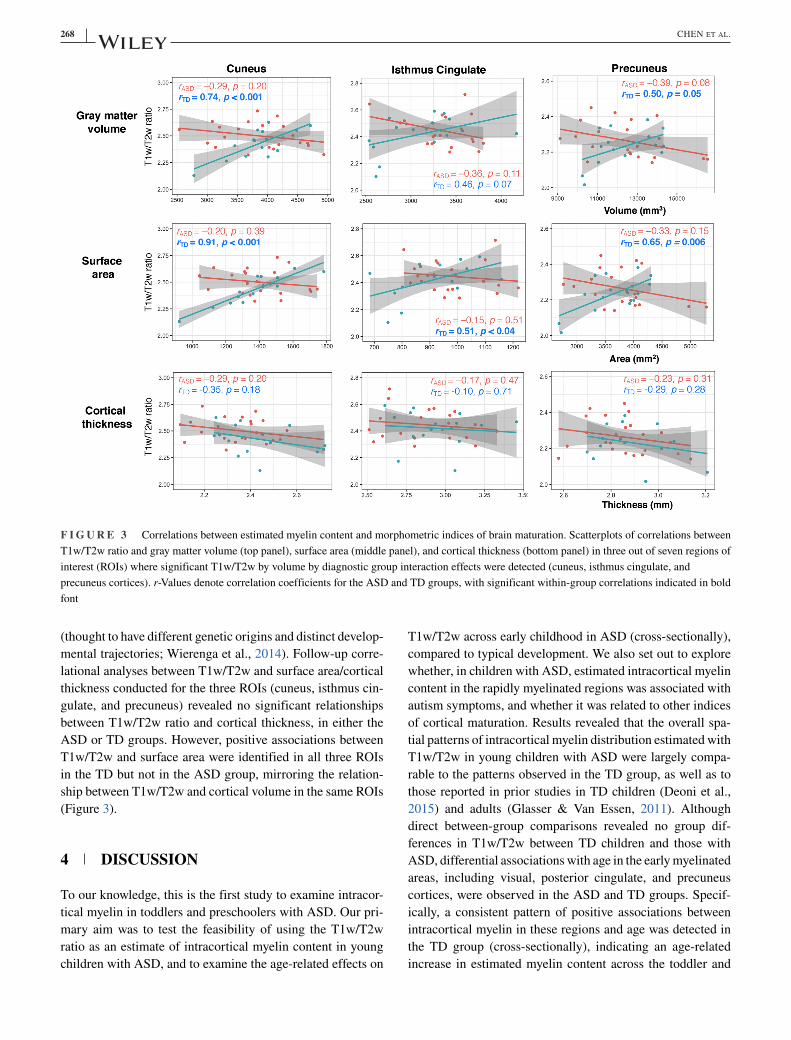
F I G U R E 3 Correlations between estimated myelin content and morphometric indices of brain maturation. Scatterplots of correlations between
T1w/T2w ratio and gray matter volume (top panel), surface area (middle panel), and cortical thickness (bottom panel) in three out of seven regions of
interest (ROIs) where significant T1w/T2w by volume by diagnostic group interaction effects were detected (cuneus, isthmus cingulate, and
precuneus cortices). r-Values denote correlation coefficients for the ASD and TD groups, with significant within-group correlations indicated in bold
font
(thought to have different genetic origins and distinct develop-
mental trajectories; Wierenga et al., 2014). Follow-up corre-
lational analyses between T1w/T2w and surface area/cortical
thickness conducted for the three ROIs (cuneus, isthmus cin-
gulate, and precuneus) revealed no significant relationships
between T1w/T2w ratio and cortical thickness, in either the
ASD or TD groups. However, positive associations between
T1w/T2w and surface area were identified in all three ROIs
in the TD but not in the ASD group, mirroring the relation-
ship between T1w/T2w and cortical volume in the same ROIs
(Figure 3).
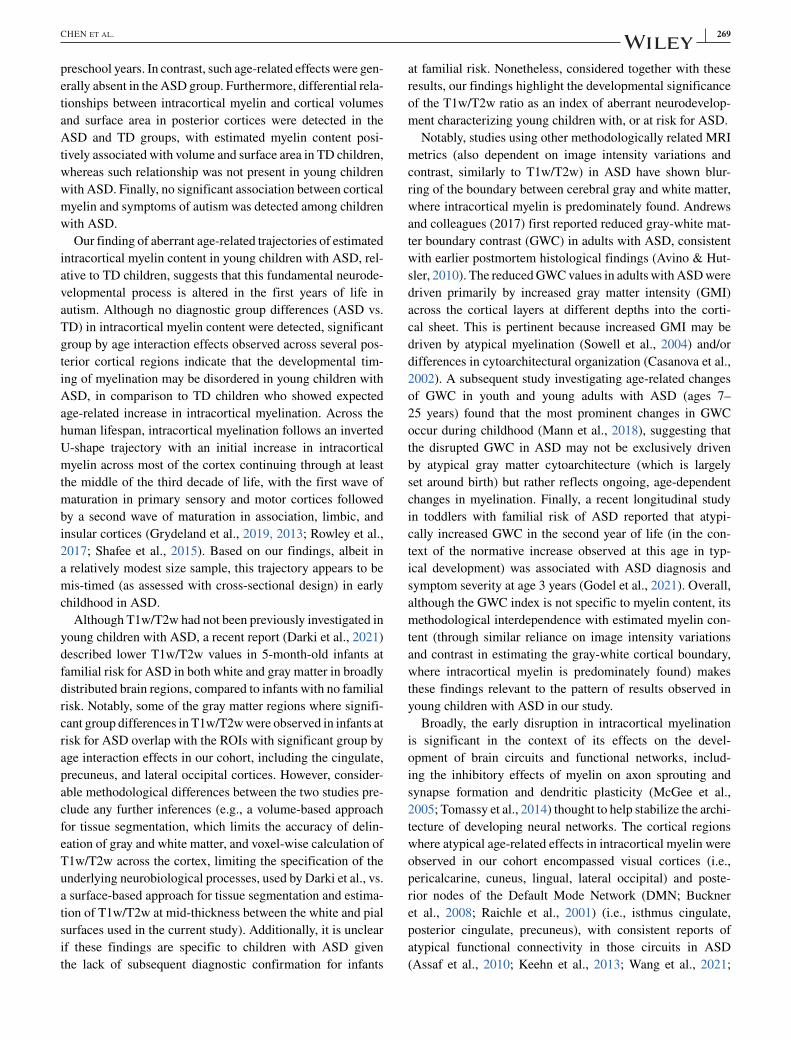
4 DISCUSSION
To our knowledge, this is the first study to examine intracor-
tical myelin in toddlers and preschoolers with ASD. Our pri-
mary aim was to test the feasibility of using the T1w/T2w
ratio as an estimate of intracortical myelin content in young
children with ASD, and to examine the age-related effects on
T1w/T2w across early childhood in ASD (cross-sectionally),
compared to typical development. We also set out to explore
whether, in children with ASD, estimated intracortical myelin
content in the rapidly myelinated regions was associated with
autism symptoms, and whether it was related to other indices
of cortical maturation. Results revealed that the overall spa-
tial patterns of intracortical myelin distribution estimated with
T1w/T2w in young children with ASD were largely compa-
rable to the patterns observed in the TD group, as well as to
those reported in prior studies in TD children (Deoni et al.,
2015) and adults (Glasser & Van Essen, 2011). Although
direct between-group comparisons revealed no group dif-
ferences in T1w/T2w between TD children and those with
ASD, differential associations with age in the early myelinated
areas, including visual, posterior cingulate, and precuneus
cortices, were observed in the ASD and TD groups. Specif-
ically, a consistent pattern of positive associations between
intracortical myelin in these regions and age was detected in
the TD group (cross-sectionally), indicating an age-related
increase in estimated myelin content across the toddler and
CHEN ET AL. 269
preschool years. In contrast, such age-related effects were gen-
erally absent in the ASD group. Furthermore, differential rela-
tionships between intracortical myelin and cortical volumes
and surface area in posterior cortices were detected in the
ASD and TD groups, with estimated myelin content posi-
tively associated with volume and surface area in TD children,
whereas such relationship was not present in young children
with ASD. Finally, no significant association between cortical
myelin and symptoms of autism was detected among children
with ASD.
Our finding of aberrant age-related trajectories of estimated
intracortical myelin content in young children with ASD, rel-
ative to TD children, suggests that this fundamental neurode-
velopmental process is altered in the first years of life in
autism. Although no diagnostic group differences (ASD vs.
TD) in intracortical myelin content were detected, significant
group by age interaction effects observed across several pos-
terior cortical regions indicate that the developmental tim-
ing of myelination may be disordered in young children with
ASD, in comparison to TD children who showed expected
age-related increase in intracortical myelination. Across the
human lifespan, intracortical myelination follows an inverted
U-shape trajectory with an initial increase in intracortical
myelin across most of the cortex continuing through at least
the middle of the third decade of life, with the first wave of
maturation in primary sensory and motor cortices followed
by a second wave of maturation in association, limbic, and
insular cortices (Grydeland et al., 2019, 2013; Rowley et al.,
2017; Shafee et al., 2015). Based on our findings, albeit in
a relatively modest size sample, this trajectory appears to be
mis-timed (as assessed with cross-sectional design) in early
childhood in ASD.
Although T1w/T2w had not been previously investigated in
young children with ASD, a recent report (Darki et al., 2021)
described lower T1w/T2w values in 5-month-old infants at
familial risk for ASD in both white and gray matter in broadly
distributed brain regions, compared to infants with no familial
risk. Notably, some of the gray matter regions where signifi-
cant group differences in T1w/T2w were observed in infants at
risk for ASD overlap with the ROIs with significant group by
age interaction effects in our cohort, including the cingulate,
precuneus, and lateral occipital cortices. However, consider-
able methodological differences between the two studies pre-
clude any further inferences (e.g., a volume-based approach
for tissue segmentation, which limits the accuracy of delin-
eation of gray and white matter, and voxel-wise calculation of
T1w/T2w across the cortex, limiting the specification of the
underlying neurobiological processes, used by Darki et al., vs.
a surface-based approach for tissue segmentation and estima-
tion of T1w/T2w at mid-thickness between the white and pial
surfaces used in the current study). Additionally, it is unclear
if these findings are specific to children with ASD given
the lack of subsequent diagnostic confirmation for infants
at familial risk. Nonetheless, considered together with these
results, our findings highlight the developmental significance
of the T1w/T2w ratio as an index of aberrant neurodevelop-
ment characterizing young children with, or at risk for ASD.
Notably, studies using other methodologically related MRI
metrics (also dependent on image intensity variations and
contrast, similarly to T1w/T2w) in ASD have shown blur-
ring of the boundary between cerebral gray and white matter,
where intracortical myelin is predominately found. Andrews
and colleagues (2017) first reported reduced gray-white mat-
ter boundary contrast (GWC) in adults with ASD, consistent
with earlier postmortem histological findings (Avino & Hut-
sler, 2010). The reduced GWC values in adults with ASD were
driven primarily by increased gray matter intensity (GMI)
across the cortical layers at different depths into the corti-
cal sheet. This is pertinent because increased GMI may be
driven by atypical myelination (Sowell et al., 2004) and/or
differences in cytoarchitectural organization (Casanova et al.,
2002). A subsequent study investigating age-related changes
of GWC in youth and young adults with ASD (ages 7–
25 years) found that the most prominent changes in GWC
occur during childhood (Mann et al., 2018), suggesting that
the disrupted GWC in ASD may not be exclusively driven
by atypical gray matter cytoarchitecture (which is largely
set around birth) but rather reflects ongoing, age-dependent
changes in myelination. Finally, a recent longitudinal study
in toddlers with familial risk of ASD reported that atypi-
cally increased GWC in the second year of life (in the con-
text of the normative increase observed at this age in typ-
ical development) was associated with ASD diagnosis and
symptom severity at age 3 years (Godel et al., 2021). Overall,
although the GWC index is not specific to myelin content, its
methodological interdependence with estimated myelin con-
tent (through similar reliance on image intensity variations
and contrast in estimating the gray-white cortical boundary,
where intracortical myelin is predominately found) makes
these findings relevant to the pattern of results observed in
young children with ASD in our study.
Broadly, the early disruption in intracortical myelination
is significant in the context of its effects on the devel-
opment of brain circuits and functional networks, includ-
ing the inhibitory effects of myelin on axon sprouting and
synapse formation and dendritic plasticity (McGee et al.,
2005; Tomassy et al., 2014) thought to help stabilize the archi-
tecture of developing neural networks. The cortical regions
where atypical age-related effects in intracortical myelin were
observed in our cohort encompassed visual cortices (i.e.,
pericalcarine, cuneus, lingual, lateral occipital) and poste-
rior nodes of the Default Mode Network (DMN; Buckner
et al., 2008; Raichle et al., 2001) (i.e., isthmus cingulate,
posterior cingulate, precuneus), with consistent reports of
atypical functional connectivity in those circuits in ASD
(Assaf et al., 2010; Keehn et al., 2013; Wang et al., 2021;

270 CHEN ET AL.
Yerys et al., 2015). The aberrant brain connectivity and net-
work organization involving visual and DMN networks have
been reported in young children with (or at risk for) ASD in
particular, with atypical connectivity linked to autism symp-
toms or early behavioral signs of ASD (e.g., joint attention or
core autism symptoms; Chen, Linke, Olson, Ibarra, Reynolds,
et al., 2021; Eggebrecht et al., 2017; McKinnon et al., 2019).
Further, the atypical relationships between T1w/T2w ratio
and gray matter volume/surface area in young children with
ASD, compared to TD children, revealed in the post hoc anal-
yses, suggest that the early disruption in intracortical myelina-
tion may be one of several aberrant cortical maturational pro-
cesses underlying the atypical neurodevelopment in the first
years of life in ASD. Namely, we found that, in posterior mid-
line cortices, including posterior cingulate, precuneus, and
cuneus, estimated intracortical myelin content and cortical
volumes/surface area are robustly linked within individuals
in TD children, suggesting effectively concomitant matura-
tion of these indices of neurodevelopment. However, intra-
cortical myelin and cortical volumes/surface area were not
associated in children with ASD, indicating that the two may
be uncoupled in early development in autism. As briefly dis-
cussed in Section 1, early accelerated growth in gray mat-
ter volume, possibly driven by surface area hyper-expansion,
has been consistently reported in young children with ASD
(Hazlett et al., 2017). Our findings expand on this literature by
highlighting an additional aspect of atypical cortical develop-
ment in autism, intracortical myelination, that can inform our
understanding of the neurobiology of the ASD.
4.1 Limitations and perspectives
While this study reports the first in vivo description of
intracortical myelination in young children with ASD, some
methodological limitations need to be acknowledged. The pri-
mary limitation is that the T1w/T2w ratio is not a direct mea-
sure of intracortical myelin content but rather a proxy that
has been shown to successfully map the myeloarchitectonic
properties in adults and typically developing children. Other
factors can also contribute to the T1w/T2w measure such as
iron content, which affects MRI signal contrast (Fukunaga
et al., 2010), head motion affecting image quality which can
indirectly affect the accurate placement of the cortical sur-
face, as well as maturation of the local white matter (e.g.,
Giedd, 2004). Given the rigorous quality assurance of all
structural images and exclusion of scans with major motion
artifacts or surface placement inaccuracies, and the use of
gray/white CNR as a measure of the overall image quality
(which did not account for significant variance in any of the
analyses), head motion is unlikely to be a major contribu-
tor for the current results. Additionally, although HCP pre-
processing pipeline includes an ad hoc correction method to
minimize the residual B1+ bias in the T1w/T2w maps, this
method works well for localizing cortical areas in individual
scans, but may potentially attenuate individual differences and
reduce sensitivity for detecting cross-participant differences
(Ganzetti et al., 2014). An improved method for B1+ trans-
mit field correction on the T1w/T2w-estimated myelin maps
may be needed in future studies utilizing the T1w/T2w ratio
measure. Other limitations include the relatively modest sam-
ple size limiting our study to an exploratory purpose only and
the use of cross-sectional data to explore age-related effects.
Future studies with larger samples and longitudinal data are
necessary to map the developmental trajectories of intracorti-
cal myelination in the first years of life in ASD.
Critically, while the current study design does not allow
inferences about whether the observed atypical maturational
trajectories of intracortical myelin in young children with
ASD reflect causation (i.e., pertain to the underlying etiol-
ogy) or compensatory effects, these findings are nonethe-
less crucial for translational efforts given the recent evidence
of adaptive myelination, modifiable by environmental expe-
rience (Fields, 2015; Forbes & Gallo, 2017). Specifically,
the prolonged plasticity of intracortical myelin, especially in
transmodal association cortices, provides an extended win-
dow of opportunity for modifications, through early interven-
tions or other critical changes in an individual’s socioemo-
tional, educational, and other environmental experiences, to
promote experience-dependent plasticity early in life in chil-
dren with ASD (e.g., Rosen et al., 2019).
A C K N O W L E D G M E N T SThis research was supported by the National Institutes of
Health (R01MH107802 to IF). The funding sources had no
role in study design, writing of the report, or the decision to
submit the article for publication. The authors are grateful to
Chris Fong, M.A. and Lisa Mash, Ph.D., of San Diego State
University, and Tiffany Wang, M.S., of University of Califor-
nia, San Diego, for invaluable assistance with data collection.
The authors’ strongest gratitude goes to the children and fam-
ilies who so generously dedicated their time and effort to this
research.
C O N F L I C T O F I N T E R E S TThe authors declare no conflict of interest.
D AT A AVA I L A B I L I T Y S T AT E M E N TAll behavioral and imaging data from this study will be shared
through the National Institute of Mental Health Data Archive
(NDA), Study Collection #2338.
O R C I DBosi Chen https://orcid.org/0000-0002-0117-9757

CHEN ET AL. 271
R E F E R E N C E SAbrahám, H., Vincze, A., Jewgenow, I., Veszprémi, B., Kravják, A.,
Gömöri, E., & Seress, L. (2010). Myelination in the human hippocam-
pal formation from midgestation to adulthood. International Journalof Developmental Neuroscience, 28(5), 401–410. https://doi.org/10.
1016/j.ijdevneu.2010.03.004
Andrews, D. S., Avino, T. A., Gudbrandsen, M., Daly, E., Marquand,
A., Murphy, C. M., Lai, M. C., Lombardo, M. V., Ruigrok, A.
N., Williams, S. C., Bullmore, E. T., The Mrc Aims Consortium,
Suckling, J., Baron-Cohen, S., Craig, M. C., Murphy, D. G., & Ecker,
C. (2017). In vivo evidence of reduced integrity of the gray-white
matter boundary in autism spectrum disorder. Cerebral Cortex, 27(2),
877–887. https://doi.org/10.1093/cercor/bhw404
APA. (2013). Diagnostic and Statistical Manual of Mental Disorders(DSM-5). American Psychiatric Association.
Arnold, S. E., & Trojanowski, J. Q. (1996). Human fetal hippocampal
development: I. Cytoarchitecture, myeloarchitecture, and neuronal
morphologic features. Journal of Comparative Neurology, 367(2),
274–292. https://doi.org/10.1002/(SICI)1096-9861(19960401)367:
2⟨274::AID-CNE9⟩3.0.CO;2-2
Assaf, M., Jagannathan, K., Calhoun, V. D., Miller, L., Stevens, M. C.,
Sahl, R., O’Boyle, J. G., Schultz, R. T., & Pearlson, G. D. (2010).
Abnormal functional connectivity of default mode sub-networks in
autism spectrum disorder patients. Neuroimage, 53(1), 247–256.
https://doi.org/10.1016/j.neuroimage.2010.05.067
Avino, T. A., & Hutsler, J. J. (2010). Abnormal cell patterning at the cor-
tical gray-white matter boundary in autism spectrum disorders. BrainResearch, 1360, 138–146. https://doi.org/10.1016/j.brainres.2010.08.
091
Bock, N. A., Hashim, E., Janik, R., Konyer, N. B., Weiss, M., Stanisz, G.
J., Turner, R., & Geyer, S. (2013). Optimizing T1-weighted imaging
of cortical myelin content at 3.0 T. Neuroimage, 65, 1–12. https://doi.
org/10.1016/j.neuroimage.2012.09.051
Buckner, R. L., Andrews-Hanna, J. R., & Schacter, D. L. (2008). The
brain’s default network: Anatomy, function, and relevance to disease.
Annals of the New York Academy of Sciences, 1124, 1–38. https://doi.
org/10.1196/annals.1440.011
Casanova, M. F., Buxhoeveden, D. P., Switala, A. E., & Roy, E. (2002).
Neuronal density and architecture (Gray Level Index) in the brains
of autistic patients. Journal of Child Neurology, 17(7), 515–521.
https://doi.org/10.1177/088307380201700708
Chapman, T. W., & Hill, R. A. (2020). Myelin plasticity in adulthood and
aging. Neuroscience Letters, 715, 134645. https://doi.org/10.1016/j.
neulet.2019.134645
Chen, B., Linke, A., Olson, L., Ibarra, C., Kinnear, M., & Fishman,
I. (2021). Resting state functional networks in 1-to-3-year-old typ-
ically developing children. Developmental Cognitive Neuroscience,
51, 100991. https://doi.org/10.1016/j.dcn.2021.100991
Chen, B., Linke, A., Olson, L., Ibarra, C., Reynolds, S., Müller, R. A.,
Kinnear, M., & Fishman, I. (2021). Greater functional connectivity
between sensory networks is related to symptom severity in toddlers
with autism spectrum disorder. Journal of Child Psychology and Psy-chiatry, 62(2), 160–170. https://doi.org/10.1111/jcpp.13268
Conti, E., Mitra, J., Calderoni, S., Pannek, K., Shen, K. K., Pagnozzi, A.,
Rose, S., Mazzotti, S., Scelfo, D., Tosetti, M., Muratori, F., & Cioni
Guzzetta, G., (2017). Network over-connectivity differentiates autism
spectrum disorder from other developmental disorders in toddlers:
A diffusion MRI study. Human Brain Mapping, 38(5), 2333–2344.
https://doi.org/10.1002/hbm.23520
Corsello, C. M., Akshoomoff, N., & Stahmer, A. C. (2013). Diagnosis
of autism spectrum disorders in 2-year-olds: A study of community
practice. Journal of Child Psychology and Psychiatry and Allied Dis-ciplines, 54(2), 178–185. https://doi.org/10.1111/j.1469-7610.2012.
02607.x
Courchesne, E., Karns, C. M., Davis, H. R., Ziccardi, R., Carper, R. A.,
Tigue, Z. D., Chisum, H. J., Moses, P., Pierce, K., Lord, C., Lincoln,
A. J., Pizzo, S., Schreibman, L., Haas, R. H., Akshoomoff, N. A., &
Courchesne, R. Y. (2001). Unusual brain growth patterns in early life
in patients with autistic disorder: An MRI study. Neurology, 57(2),
245–254.
Courchesne, E., Pramparo, T., Gazestani, V. H., Lombardo, M. V., Pierce,
K., & Lewis, N. E. (2019). The ASD living biology: From cell prolif-
eration to clinical phenotype. Molecular Psychiatry, 24(1), 88–107.
https://doi.org/10.1038/s41380-018-0056-y
Dale, A. M., Fischl, B., & Sereno, M. I. (1999). Cortical surface-based
analysis. I. Segmentation and surface reconstruction. Neuroimage,
9(2), 179–194. https://doi.org/10.1006/nimg.1998.0395
Darki, F., Nyström, P., McAlonan, G., Bölte, S., & Falck-Ytter, T.
(2021). T1-weighted/T2-weighted ratio mapping at 5 months cap-
tures individual differences in behavioral development and differenti-
ates infants at familial risk for autism from controls. Cerebral Cortex,
31(9), 4068–4077. https://doi.org/10.1093/cercor/bhab069
Dawson, G., Jones, E. J., Merkle, K., Venema, K., Lowy, R., Faja, S.,
Kamara, D., Murias, M., Greenson, J., Winter, J., Smith, M., Rogers,
S. J., & Webb, S. J. (2012). Early behavioral intervention is associ-
ated with normalized brain activity in young children with autism.
Journal of the American Academy of Child and Adolescent Psy-chiatry, 51(11), 1150–1159. https://doi.org/10.1016/j.jaac.2012.08.
018
Deoni, S. C., Dean, D. C., 3rd, Remer, J., Dirks, H., & O’Muircheartaigh,
J. (2015). Cortical maturation and myelination in healthy toddlers and
young children. Neuroimage, 115, 147–161. https://doi.org/10.1016/
j.neuroimage.2015.04.058
Desikan, R. S., Ségonne, F., Fischl, B., Quinn, B. T., Dickerson, B.
C., Blacker, D., Buckner, R. L., Dale, A. M., Maguire, R., Hyman,
B. T., Albert, M. S., & Killiany, R. J. (2006). An automated label-
ing system for subdividing the human cerebral cortex on MRI scans
into gyral based regions of interest. Neuroimage, 31(3), 968–980.
https://doi.org/10.1016/j.neuroimage.2006.01.021
Dong, H. M., Margulies, D. S., Zuo, X. N., & Holmes, A. J. (2021).
Shifting gradients of macroscale cortical organization mark the tran-
sition from childhood to adolescence. Proceedings of the NationalAcademy of Sciences, 118(28), e202444811. https://doi.org/10.1073/
pnas.2024448118
Eggebrecht, A. T., Elison, J. T., Feczko, E., Todorov, A., Wolff, J. J.,
Kandala, S., Adams, C. M., Snyder, A. Z., Lewis, J. D., Estes, A. M.,
Zwaigenbaum, L., Botteron, K. N., McKinstry, R. C., Constantino,
J. N., Evans, A., Hazlett, H. C., Dager, S., Paterson, S. J., Schultz,
R. T., . . . Pruett, J. R., Jr. (2017). Joint attention and brain functional
connectivity in infants and toddlers. Cerebral Cortex, 27(3), 1709–
1720. https://doi.org/10.1093/cercor/bhw403
Estes, A., Munson, J., Rogers, S. J., Greenson, J., Winter, J., & Dawson,
G. (2015). Long-term outcomes of early intervention in 6-year-
old children with autism spectrum disorder. Journal of the Ameri-can Academy of Child and Adolescent Psychiatry, 54(7), 580–587.
https://doi.org/10.1016/j.jaac.2015.04.005
Fields, R. D. (2014). Myelin—More than insulation. Science, 344(6181),
264–266. https://doi.org/10.1126/science.1253851

272 CHEN ET AL.
Fields, R. D. (2015). A new mechanism of nervous system plastic-
ity: Activity-dependent myelination. Nature Reviews Neuroscience,
16(12), 756–767. https://doi.org/10.1038/nrn4023
Fischl, B., Sereno, M. I., & Dale, A. M. (1999). Cortical surface-based
analysis. II: Inflation, flattening, and a surface-based coordinate sys-
tem. Neuroimage, 9(2), 195–207. https://doi.org/10.1006/nimg.1998.
0396
Fischl, B., Sereno, M. I., Tootell, R. B., & Dale, A. M. (1999). High-
resolution intersubject averaging and a coordinate system for the cor-
tical surface. Human Brain Mapping, 8(4), 272–284. https://doi.org/
10.1002/(sici)1097-0193(1999)8:4⟨272::aid-hbm10⟩3.0.co;2-4
Forbes, T. A., & Gallo, V. (2017). All wrapped up: Environmental effects
on myelination. Trends in Neuroscience, 40(9), 572–587. https://doi.
org/10.1016/j.tins.2017.06.009
Fukunaga, M., Li, T. Q., van Gelderen, P., de Zwart, J. A., Shmueli, K.,
Yao, B., Lee, J., Maric, D., Aronova, M. A., Zhang, G., Leapman, R.
D., Schenck, J. F., Merkle, H., & Duyn, J. H. (2010). Layer-specific
variation of iron content in cerebral cortex as a source of MRI con-
trast. Proceedings of the National Academy of Sciences of the UnitedStates of America, 107(8), 3834–3839. https://doi.org/10.1073/pnas.
0911177107
Ganzetti, M., Wenderoth, N., & Mantini, D. (2014). Whole brain myelin
mapping using T1- and T2-weighted MR imaging data. Frontiersin Human Neuroscience, 8, 671. https://doi.org/10.3389/fnhum.2014.
00671
Gao, W., Alcauter, S., Elton, A., Hernandez-Castillo, C. R., Smith, J. K.,
Ramirez, J., & Lin, W. (2015). Functional network development dur-
ing the first year: Relative sequence and socioeconomic correlations.
Cerebral Cortex, 25(9), 2919–2928. https://doi.org/10.1093/cercor/
bhu088
Geyer, S., Weiss, M., Reimann, K., Lohmann, G., & Turner, R. (2011).
Microstructural Parcellation of the human cerebral cortex—From
Brodmann’s post-mortem map to in vivo mapping with high-field
Magnetic Resonance Imaging. Frontiers in Human Neuroscience, 5,
19. https://doi.org/10.3389/fnhum.2011.00019
Giedd, J. N. (2004). Structural magnetic resonance imaging of the ado-
lescent brain. Annals of the New York Academy of Sciences, 1021,
77–85. https://doi.org/10.1196/annals.1308.009
Gilmore, J. H., Shi, F., Woolson, S. L., Knickmeyer, R. C., Short, S. J.,
Lin, W., Zhu, H., Hamer, R. M., Styner, M., & Shen, D. (2012). Lon-
gitudinal development of cortical and subcortical gray matter from
birth to 2 years. Cerebral Cortex, 22(11), 2478–2485. https://doi.org/
10.1093/cercor/bhr327
Glasser, M. F., Goyal, M. S., Preuss, T. M., Raichle, M. E., & Van
Essen, D. C. (2014). Trends and properties of human cerebral cortex:
Correlations with cortical myelin content. Neuroimage, 2, 165–175.
https://doi.org/10.1016/j.neuroimage.2013.03.060
Glasser, M. F., Sotiropoulos, S. N., Wilson, J. A., Coalson, T. S., Fischl,
B., Andersson, J. L., Xu, J., Jbabdi, S., Webster, M., Polimeni, J. R.,
Van Essen, D. C., Jenkinson, M., & Jenkinson, M. (2013). The mini-
mal preprocessing pipelines for the Human Connectome Project. Neu-roimage, 80, 105–124. https://doi.org/10.1016/j.neuroimage.2013.04.
127
Glasser, M. F., & Van Essen, D. C. (2011). Mapping human cortical areas
in vivo based on myelin content as revealed by T1- and T2-weighted
MRI. Journal of Neuroscience, 31(32), 11597–11616. https://doi.org/
10.1523/jneurosci.2180-11.2011
Godel, M., Andrews, D. S., Amaral, D. G., Ozonoff, S., Young, G. S.,
Lee, J. K., Nordahl, C. W., & Schaer, M. (2021). Altered gray-white
matter boundary contrast in toddlers at risk for autism relates to later
diagnosis of autism spectrum disorder. Frontiers in Neuroscience, 15,
669194. https://doi.org/10.3389/fnins.2021.669194
Gordon, A., & Geschwind, D. H. (2020). Human in vitro models for
understanding mechanisms of autism spectrum disorder. MolecularAutism, 11(1), 26. https://doi.org/10.1186/s13229-020-00332-7
Greve, D. N., & Fischl, B. (2009). Accurate and robust brain image align-
ment using boundary-based registration. Neuroimage, 48(1), 63–72.
Grydeland, H., Vértes, P. E., Váša, F., Romero-Garcia, R., Whitaker, K.,
Alexander-Bloch, A. F., Bjørnerud, A., Patel, A. X., Sederevičius, D.,
Tamnes, C. K., Westlye, L. T., White, S. R., Walhovd, K. B., Fjell, A.
M., & Bullmore, E. T. (2019). Waves of maturation and senescence
in micro-structural MRI markers of human cortical myelination over
the lifespan. Cerebral Cortex, 29(3), 1369–1381. https://doi.org/10.
1093/cercor/bhy330
Grydeland, H., Walhovd, K. B., Tamnes, C. K., Westlye, L. T., & Fjell,
A. M. (2013). Intracortical myelin links with performance variabil-
ity across the human lifespan: Results from T1- and T2-weighted
MRI myelin mapping and diffusion tensor imaging. Journal of Neu-roscience, 33(47), 18618–18630. https://doi.org/10.1523/jneurosci.
2811-13.2013
Grydeland, H., Westlye, L. T., Walhovd, K. B., & Fjell, A. M. (2016).
Intracortical posterior cingulate myelin content relates to error pro-
cessing: Results from T1- and T2-weighted MRI myelin mapping and
electrophysiology in healthy adults. Cerebral Cortex, 26(6), 2402–
2410. https://doi.org/10.1093/cercor/bhv065
Haroutunian, V., Katsel, P., Roussos, P., Davis, K. L., Altshuler, L. L.,
& Bartzokis, G. (2014). Myelination, oligodendrocytes, and serious
mental illness. Glia, 62(11), 1856–1877. https://doi.org/10.1002/glia.
22716
Hazlett, H. C., Gu, H., Munsell, B. C., Kim, S. H., Styner, M., Wolff, J.
J., Elison, J. T., Swanson, M. R., Zhu, H., Botteron, K. N., Collins,
D. L., Constantino, J. N., Dager, S. R., Estes, A. M., Evans, A. C.,
Fonov, V. S., Gerig, G., Kostopoulos, P., McKinstry, R. C., . . . Piven,
J. (2017). Early brain development in infants at high risk for autism
spectrum disorder. Nature, 542(7641), 348–351. https://doi.org/10.
1038/nature21369
Hazlett, H. C., Poe, M., Gerig, G., Smith, R. G., Provenzale, J., Ross,
A., Gilmore, J., & Piven, J. (2005). Magnetic resonance imaging
and head circumference study of brain size in autism: Birth through
age 2 years. Archives of General Psychiatry, 62(12), 1366–1376.
https://doi.org/10.1001/archpsyc.62.12.1366
Hazlett, H. C., Poe, M. D., Gerig, G., Styner, M., Chappell, C., Smith, R.
G., Vachet, C., & Piven, J. (2011). Early brain overgrowth in autism
associated with an increase in cortical surface area before age 2 years.
Archives of General Psychiatry, 68(5), 467–476. https://doi.org/10.
1001/archgenpsychiatry.2011.39
Keehn, B., Shih, P., Brenner, L. A., Townsend, J., & Müller, R. A. (2013).
Functional connectivity for an “island of sparing” in autism spectrum
disorder: An fMRI study of visual search. Human Brain Mapping,
34(10), 2524–2537. https://doi.org/10.1002/hbm.22084
Landa, R. J. (2018). Efficacy of early interventions for infants and young
children with, and at risk for, autism spectrum disorders. Interna-tional Review of Psychiatry, 30(1), 25–39. https://doi.org/10.1080/
09540261.2018.1432574
Li, G., Nie, J., Wang, L., Shi, F., Lin, W., Gilmore, J. H., & Shen, D.
(2013). Mapping region-specific longitudinal cortical surface expan-
sion from birth to 2 years of age. Cerebral Cortex, 23(11), 2724–2733.
https://doi.org/10.1093/cercor/bhs265

CHEN ET AL. 273
Liu, S., Li, A., Zhu, M., Li, J., & Liu, B. (2019). Genetic influences on
cortical myelination in the human brain. Genes, Brain, and Behavior,
18(4), e12537. https://doi.org/10.1111/gbb.12537
Lord, C., & Rutter, M. (2003). Social Communication Questionnaire(SCQ). Western Psychological Services.
Lord, C., Rutter, M., DiLavore, P. C., Risi, S., Gotham, K., & Bishop, S.
L. (2012). Autism diagnostic observation schedule, 2nd ed. (ADOS-
2). Western Psychological Services.
Lord, C., Rutter, M., & Le Couteur, A. (1994). Autism Diagnostic
Interview-Revised: A revised version of a diagnostic interview for
caregivers of individuals with possible pervasive developmental dis-
orders. Journal of Autism and Developmental Disorders, 24(5), 659–
685.
Lyall, A. E., Shi, F., Geng, X., Woolson, S., Li, G., Wang, L., Hamer,
R. M., Shen, D., & Gilmore, J. H. (2015). Dynamic development
of regional cortical thickness and surface area in early childhood.
Cerebral Cortex, 25(8), 2204–2212. https://doi.org/10.1093/cercor/
bhu027
Maenner, M. J., Shaw, K. A., Baio, J., Washington, A., Patrick, M.,
DiRienzo, M., Christensen, D. L., Wiggins, L. D., Pettygrove, S.,
Andrews, J. G., Lopez, M., Hudson, A., Baroud, T., Schwenk,
Y., White, T., Rosenberg, C. R., Lee, L.-C., Harrington, R. A.,
Huston, M., . . . Dietz, P. M. (2020). Prevalence of autism spec-
trum disorder among children aged 8 years—Autism and Devel-
opmental Disabilities Monitoring Network, 11 Sites, United States,
2016. MMWR Surveillance Summaries, 69(4), 1–12. https://doi.org/
10.15585/mmwr.ss6904a1
Mann, C., Bletsch, A., Andrews, D., Daly, E., Murphy, C., Murphy, D.,
& Ecker, C. (2018). The effect of age on vertex-based measures of the
grey-white matter tissue contrast in autism spectrum disorder. Molec-ular Autism, 9, 49. https://doi.org/10.1186/s13229-018-0232-6
McGee, A. W., Yang, Y., Fischer, Q. S., Daw, N. W., & Strittmatter, S.
M. (2005). Experience-driven plasticity of visual cortex limited by
myelin and Nogo receptor. Science, 309(5744), 2222–2226. https://
doi.org/10.1126/science.1114362
McKinnon, C. J., Eggebrecht, A. T., Todorov, A., Wolff, J. J., Elison,
J. T., Adams, C. M., Snyder, A. Z., Estes, A. M., Zwaigenbaum, L.,
Botteron, K. N., McKinstry, R. C., Marrus, N., Evans, A., Hazlett,
H. C., Dager, S. R., Paterson, S. J., Pandey, J., Schultz, R. T., Styner,
M. A., . . . Pruett, J. R., Jr. (2019). Restricted and repetitive behav-
ior and brain functional connectivity in infants at risk for develop-
ing autism spectrum disorder. Biological Psychiatry: Cognitive Neu-roscience and Neuroimaging, 4(1), 50–61. https://doi.org/10.1016/j.
bpsc.2018.09.008
Mullen, E. M. (1995). Mullen Scales of Early Learning. American Guid-
ance Service.
Nordahl, C. W., Lange, N., Li, D. D., Barnett, L. A., Lee, A., Buonocore,
M. H., Buonocore, M. H., Simon, T. J., Rogers, S., Ozonoff, S., &
Amaral, D. G. (2011). Brain enlargement is associated with regression
in preschool-age boys with autism spectrum disorders. Proceedingsof the National Academy of Sciences of the United States of America,
108(50), 20195–20200. https://doi.org/10.1073/pnas.1107560108
Ozonoff, S., Heung, K., Byrd, R., Hansen, R., & Hertz-Picciotto, I.
(2008). The onset of autism: Patterns of symptom emergence in the
first years of life. Molecular Autism, 1(6), 320–328. https://doi.org/
10.1002/aur.53
Ozonoff, S., Young, G. S., Landa, R. J., Brian, J., Bryson, S., Charman,
T., Chawarska, K., Macari, S. L., Messinger, D., Stone, W. L.,
Zwaigenbaum, L., & Iosif, A. M. (2015). Diagnostic stability in young
children at risk for autism spectrum disorder: A baby siblings research
consortium study. Journal of Child Psychology and Psychiatry, 56(9),
988–998. https://doi.org/10.1111/jcpp.12421
Pierce, K., Carter, C., Weinfeld, M., Desmond, J., Hazin, R., Bjork, R., &
Gallagher, N. (2011). Detecting, studying, and treating autism early:
The one-year well-baby check-up approach. Journal of Pediatrics,
159(3), 458–465. https://doi.org/10.1016/j.jpeds.2011.02.036
Pierce, K., Gazestani, V. H., Bacon, E., Barnes, C. C., Cha, D., Nalabolu,
S., Lopez, L., Moore, A., Pence-Stophaeros, S., & Courchesne, E.
(2019). Evaluation of the diagnostic stability of the early autism
spectrum disorder phenotype in the general population starting at
12 months. JAMA Pediatrics, 173, 578–587. https://doi.org/10.1001/
jamapediatrics.2019.0624
Raichle, M. E., MacLeod, A. M., Snyder, A. Z., Powers, W. J., Gusnard,
D. A., & Shulman, G. L. (2001). A default mode of brain function.
Proceedings of the National Academy of Sciences of the United Statesof America, 98(2), 676–682. https://doi.org/10.1073/pnas.98.2.676
Rosen, M. L., Amso, D., & McLaughlin, K. A. (2019). The role of
the visual association cortex in scaffolding prefrontal cortex devel-
opment: A novel mechanism linking socioeconomic status and exec-
utive function. Developmental Cognitive Neuroscience, 39, 100699.
https://doi.org/10.1016/j.dcn.2019.100699
Rowley, C. D., Sehmbi, M., Bazin, P. L., Tardif, C. L., Minuzzi, L.,
Frey, B. N., & Bock, N. A. (2017). Age-related mapping of intracor-
tical myelin from late adolescence to middle adulthood using T(1)-
weighted MRI. Human Brain Mapping, 38(7), 3691–3703. https://
doi.org/10.1002/hbm.23624
Sacrey, L. R., Zwaigenbaum, L., Bryson, S., Brian, J., Smith, I. M.,
Roberts, W., Roberts, W., Szatmari, P., Vaillancourt, T., Roncadin,
C., & Garon, N. (2018). Parent and clinician agreement regard-
ing early behavioral signs in 12- and 18-month-old infants at-risk
of autism spectrum disorder. Autism Research, 11(3), 539–547.
https://doi.org/10.1002/aur.1920
Shafee, R., Buckner, R. L., & Fischl, B. (2015). Gray matter myelination
of 1555 human brains using partial volume corrected MRI images.
Neuroimage, 105, 473–485. https://doi.org/10.1016/j.neuroimage.
2014.10.054
Shaw, P., Kabani, N. J., Lerch, J. P., Eckstrand, K., Lenroot, R., Gogtay,
N., Greenstein, D., Clasen, L., Evans, A., Rapoport, J. L., Giedd,
J. N., & Wise, S. P. (2008). Neurodevelopmental trajectories of the
human cerebral cortex. Journal of Neuroscience, 28(14), 3586–3594.
https://doi.org/10.1523/jneurosci.5309-07.2008
Solso, S., Xu, R., Proudfoot, J., Hagler, D. J., Jr., Campbell, K.,
Venkatraman, V., Barnes, C. C., Ahrens-Barbeau, C., Pierce, K., Dale,
A., Eyler, L., & Courchesne, E. (2016). Diffusion tensor imaging pro-
vides evidence of possible axonal overconnectivity in frontal lobes in
autism spectrum disorder toddlers. Biological Psychiatry, 79(8), 676–
684. https://doi.org/10.1016/j.biopsych.2015.06.029
Sowell, E. R., Thompson, P. M., Leonard, C. M., Welcome, S. E., Kan,
E., & Toga, A. W. (2004). Longitudinal mapping of cortical thickness
and brain growth in normal children. Journal of Neuroscience, 24(38),
8223–8231. https://doi.org/10.1523/jneurosci.1798-04.2004
Sparrow, S. S., Cicchetti, D. V., & Balla, D. A. (2005). Vineland AdaptiveBehavior Scales, Second Edition. American Guidance Service.
Spear, L. P. (2013). Adolescent neurodevelopment. Journal of Ado-lescent Health, 52(2), S7–S13. https://doi.org/10.1016/j.jadohealth.
2012.05.006
Sydnor, V. J., Larsen, B., Bassett, D. S., Alexander-Bloch, A., Fair, D.
A., Liston, C., Mackey, A. P., Milham, M. P., Pines, A., Roalf, D.

274 CHEN ET AL.
R., Seidlitz, J., Xu, T., Raznahan, A., & Satterthwaite, T. D. (2021).
Neurodevelopment of the association cortices: Patterns, mechanisms,
and implications for psychopathology. Neuron, 109, 2820–2846.
https://doi.org/10.1016/j.neuron.2021.06.016
Tomassy, G. S., Berger, D. R., Chen, H. H., Kasthuri, N., Hayworth,
K. J., Vercelli, A., Seung, H. S., Lichtman, J. W., & Arlotta, P.
(2014). Distinct profiles of myelin distribution along single axons of
pyramidal neurons in the neocortex. Science, 344(6181), 319–324.
https://doi.org/10.1126/science.1249766
Travers, B. G., Adluru, N., Ennis, C., do, T. P. M., Destiche, D., Doran,
S., Bigler, E. D., Lange, N., Lainhart, J. E., & Alexander, A. L. (2012).
Diffusion tensor imaging in autism spectrum disorder: A review.
Autism Research, 5(5), 289–313. https://doi.org/10.1002/aur.1243
Turesky, T. K., Vanderauwera, J., & Gaab, N. (2021). Imaging the rapidly
developing brain: Current challenges for MRI studies in the first five
years of life. Developmental Cognitive Neuroscience, 47, 100893.
https://doi.org/10.1016/j.dcn.2020.100893
Wang, Q., Li, H. Y., Li, Y. D., Lv, Y. T., Ma, H. B., Xiang, A. F., Jia,
X. Z., & Liu, D. Q. (2021). Resting-state abnormalities in functional
connectivity of the default mode network in autism spectrum disor-
der: A meta-analysis. Brain Imaging and Behavior, 15(5), 2583–2592.
https://doi.org/10.1007/s11682-021-00460-5
Weitzman, C., & Wegner, L. (2015). Promoting optimal development:
Screening for behavioral and emotional problems. Pediatrics, 135(2),
384–395. https://doi.org/10.1542/peds.2014-3716
White, N., Roddey, C., Shankaranarayanan, A., Han, E., Rettmann, D.,
Santos, J., Kuperman, J., & Dale, A. (2010). PROMO: Real-time
prospective motion correction in MRI using image-based tracking.
Magnetic Resonance in Medicine, 63(1), 91–105. https://doi.org/10.
1002/mrm.22176
Wierenga, L. M., Langen, M., Oranje, B., & Durston, S. (2014). Unique
developmental trajectories of cortical thickness and surface area. Neu-
roimage, 87, 120–126. https://doi.org/10.1016/j.neuroimage.2013.11.
010
Wolff, J. J., Gu, H., Gerig, G., Elison, J. T., Styner, M., Gouttard, S.,
Botteron, K. N., Dager, S. R., Dawson, G., Estes, A. M., Evans, A.
C., Hazlett, H. C., Kostopoulos, P., McKinstry, R. C., Paterson, S. J.,
Schultz, R. T., Zwaigenbaum, L., & Piven, J. (2012). Differences in
white matter fiber tract development present from 6 to 24 months in
infants with autism. American Journal of Psychiatry, 169(6), 589–
600. https://doi.org/10.1176/appi.ajp.2011.11091447
Xiao, Z., Qiu, T., Ke, X., Xiao, X., Xiao, T., Liang, F., Zou, B.,
Huang, H., Fang, H., Chu, K., Zhang, J., & Liu, Y. (2014). Autism
spectrum disorder as early neurodevelopmental disorder: Evidence
from the brain imaging abnormalities in 2–3 years old toddlers.
Journal of Autism and Developmental Disorders, 44(7), 1633–1640.
https://doi.org/10.1007/s10803-014-2033-x
Yerys, B. E., Gordon, E. M., Abrams, D. N., Satterthwaite, T. D.,
Weinblatt, R., Jankowski, K. F., Strang, J., Kenworthy, L., Gaillard,
W. D., & Vaidya, C. J. (2015). Default mode network segregation
and social deficits in autism spectrum disorder: Evidence from non-
medicated children. Neuroimage Clinical, 9, 223–232. https://doi.org/
10.1016/j.nicl.2015.07.018
How to cite this article: Chen, B., Linke, A., Olson,
L., Kohli, J., Kinnear, M., Sereno, M., Müller, R.-A.,
Carper, R., & Fishman, I. (2022). Cortical myelination
in toddlers and preschoolers with autism spectrum
disorder. Developmental Neurobiology, 82, 261–274.
https://doi.org/10.1002/dneu.22874
Copyright © 2022 FDOKUMEN