Mineralocorticoid Receptor Antagonists in Diabetic Kidney ...
Clin. Lab. 9+10/2013 1121
Clin. Lab. 2013;59:1121-1128 ©Copyright
ORIGINAL ARTICLE
Correlates of Serum Resistin in Elderly, Non-Diabetic Patients with Chronic Kidney Disease
ANNA MAROUGA 1, 2, *, MARIA DALAMAGA 1, *, ANASTASIA N. KASTANIA 3,
GEORGE ANTONAKOS 1, APOLLON THRASYVOULIDES 1, GEORGIA KONTELIA 1, CLAIRE DIMAS 1, DEMETRIOS V. VLAHAKOS 2
* These authors contributed equally to this work
1 Department of Clinical Biochemistry, Medical School, University of Athens, “Attikon” General University Hospital, Athens, Greece 2 Renal Unit, Medical School, University of Athens, “Attikon” General University Hospital, Athens, Greece
3 Department of Informatics, Athens University of Economics and Business, Greece
SUMMARY Background: Renal function may be a major determinant of resistin levels, since most studies revealed association between elevated resistin levels and decreased glomerular filtration rate (GFR) in patients with chronic kidney disease (CKD). The aim of the present study was to test the hypothesis whether serum resistin is associated with markers of malnutrition and inflammation in elderly non-diabetic adults in different stages of CKD including he-modialysis. Methods: This was a cross-sectional study of 80 elderly patients divided in four groups of 20 patients each accord-ing to eGFR and matched for age (± 5 years) and gender. Patients with eGFR more than 1.5 mL/second served as controls. Multivariate regression was used to evaluate the association of resistin with eGFR, demographic, meta-bolic and inflammatory markers, and insulin resistance. Hematological, biochemical, and immunochemical analy-ses were performed using commercially available enzyme immunoassays. Results: Our results showed that: 1) serum resistin levels were two times higher in patients with advanced CKD especially those undergoing hemodialysis compared to controls, 2) in univariate analysis, resistin levels correlated directly with Tumor Necrosis Factor-α (TNF-α), high sensitive C-Reactive Protein (hsCRP), and serum phosphate and inversely correlated with albumin, eGFR, and hematocrit levels. We failed to reveal any relationship between resistin levels and Homeostasis Model Assessment Score of Insulin Resistance (HOMA-IR), body mass index (BMI), cholesterol and leptin levels, 3) in multivariate analysis, only TNF-α (p < 0.001) and hsCRP (p = 0.032) were the most important independent determinants of serum resistin levels. Conclusions: These results indicate that resistin increases as GFR declines and may be involved in the malnutri-tion-inflammation state and the reverse epidemiology phenomenon present in elderly, non-diabetic patients with CKD. (Clin. Lab. 2013;59:1121-1128. DOI: 10.7754/Clin.Lab.2012.121112)
KEY WORDS resistin, chronic kidney disease, malnutrition, adipo-kine, inflammation
LIST OF ABBREVIATIONS BMI - Body Mass Index CKD - Chronic Kidney Disease
DBP - diastolic blood pressure eGFR - estimated Glomerular Filtration Rate HDL-C - high-density lipoprotein cholesterol HOMA-IR - Homeostasis Model Assessment Score of Insulin Resistance hsCRP - high sensitive C-Reactive Protein LDL-C - high-density lipoprotein cholesterol SBP - systolic blood pressure TNF-α - Tumor Necrosis Factor-alpha _____________________________________________ Manuscript accepted December 27, 2012
A. MAROUGA et al.
Clin. Lab. 9+10/2013 1122
INTRODUCTION While obesity, hypertension, and hypercholesterolemia are well-established harbingers of poor cardiovascular health and death, the same conditions actually increase the chance of survival in many people, including dialy-sis patients, elderly adults and patients with chronic heart failure, rheumatoid arthritis, chronic obstructive pulmonary disease, and cancer [1-2]. This phenomenon has been termed reverse epidemiology and has been linked to the so-called malnutrition-inflammation syn-drome, a state of elevated serum concentrations of pro-inflammatory cytokines that seem to be involved in its pathogenesis. Among the proteins synthesized and released from adi-pose tissue, resistin, a cysteine-rich secretory peptide, is a cytokine whose physiologic role has been the subject of much research and controversy. It was called "resis-tin" because it regulates glucose metabolism and insulin sensitivity. Indeed, resistin levels are increased in diet-induced and genetic forms of obesity in rodents, while resistin neutralization by specific antibodies resulted in decreased blood glucose concentration and improved in-sulin sensitivity [3]. Recombinant resistin reduced insu-lin sensitivity in mice, while resistin-deficient mice showed significantly better glucose tolerance and lower blood sugar after fasting than wild-type mice [4]. Others have linked resistin to inflammation. In further support of its proinflammatory properties, resistin levels have been shown to increase in inflammatory diseases, such as rheumatoid arthritis [5], Crohn’s disease [6], and sepsis [7]. Resistin is expressed in inflammatory cells including leukocytes and macrophages and has the potency of inducing the expression of several pro-in-flammatory cytokines, such as interleukin-1 (IL-1), in-terleukin-6 (IL-6), interleukin-12 (IL-12), and tumor ne-crosis factor-alpha (TNF-α) in an NF-κB-mediated fash-ion [8-10]. Resistin itself can be upregulated by inter-leukins and also by microbial antigens, such as lipo-polysaccharide [7,10]. Renal function may be a major determinant of resistin levels, since most studies revealed an association be-tween elevated resistin levels and decreased glomerular filtration rate (GFR) in patients with CKD [11] and in kidney allograft recipients [12]. Patients treated by both hemodialysis and peritoneal dialysis exhibited resistin concentrations significantly higher than controls [13, 18]. Moreover, hemodialysis patients with residual re-nal function had significantly lower resistin levels when compared with their counterparts without it [14]. The aim of the present study was to expand these obser-vations in elderly non-diabetic adults with different stages of CKD, including hemodialysis. To this end, we examined serum resistin levels in relation to demo-graphic and clinical data (age, gender, BMI, blood pres-sure), metabolic parameters (lipid profile, albumin, glu-cose, insulin levels, Homeostasis Model Assessment Score of Insulin Resistance, hemoglobin A1c, and ho-mocysteine) and inflammatory markers (white blood
count, high sensitive C-Reactive Protein-hsCRP, TNF-α, and fibrinogen). We hypothesized that resistin could be associated with the malnutrition-inflammation state and therefore, it could act as a key node in the enigmatic phenomenon of reverse epidemiology.
MATERIALS AND METHODS Study Design Eighty elderly men and women more than 60 years of age with stable chronic renal disease (CKD) of different stages were included in this cross-sectional study. After having obtained informed consent and approval from the Hospital Ethics Committee Review Board For Hu-man Studies, patients were divided in four groups ac-cording to eGFR by the Cockcroft-Gault formula which were also matched for age (± 5 years) and gender. Group I included 20 patients with normal renal function (eGFR > 1.5 mL/second, stage 1), who served as con-trols; Group II included 20 patients with mild renal in-sufficiency (eGFR 1 - 1.5 mL/second, stage 2); Group III-IV included 20 patients with moderate-to-severe CKD (eGFR 0.25 - 1 mL/second, stages 3 and 4); and Group V included 20 stable patients maintained on chronic hemodialysis (stage 5). Exclusion criteria were diabetes mellitus, active infection, acute illness within the last month, history of chronic inflammatory disease or cancer, treatment with immunosuppressant agents, anti-inflammatory or antilipemic drugs. Laboratory Analysis Blood specimens were collected early in the morning after 12 hours of fasting and prior to the administration of any medication. In particular, 4 mL of whole blood was drawn in serum isolation tubes and centrifuged at 3700 rpm for 7 minutes and the serum was collected in cryovials and stored in -70°C until further analysis. He-matological analysis was performed using the hemato-logical analyser Sysmex XE-2100D (Dade Behring-Sie-mens, Marburg, Germany). Biochemical parameters were measured using the biochemical analyser ILAB 600 (IL). The MDRD Study equation has not been val-idated in elderly and therefore, the Cockcroft and Gault formula was used for GFR estimates in all patients [15]. Homocystein was measured by nephelometry (BN PROSPECT, Dade Behring-Siemens, Marburg, Germa-ny). Glycosylated hemoglobin was measured on G7 HPLC analyzer (TOSOH, Japan) and insulin levels were measured on the immunochemical analyzer AIA-1800 (TOSOH, Japan). Homeostasis Model Assessment score of Insulin Resistance (HOMA-IR) was calculated using the formula: fasting serum insulin (μU/mL) x fasting serum glucose (mmol/L)/22.5 [16]. Serum leptin and resistin were measured by commer-cially available enzyme immunoassays (ELISA). Spe-cifically, serum leptin was measured using the “Human Leptin Elisa kit” by Avibion (Orgenium Laboratories, Helsinki, Finland).
RESISTIN AND CHRONIC KIDNEY DISEASE IN THE ELDERLY
Clin. Lab. 9+10/2013 1123
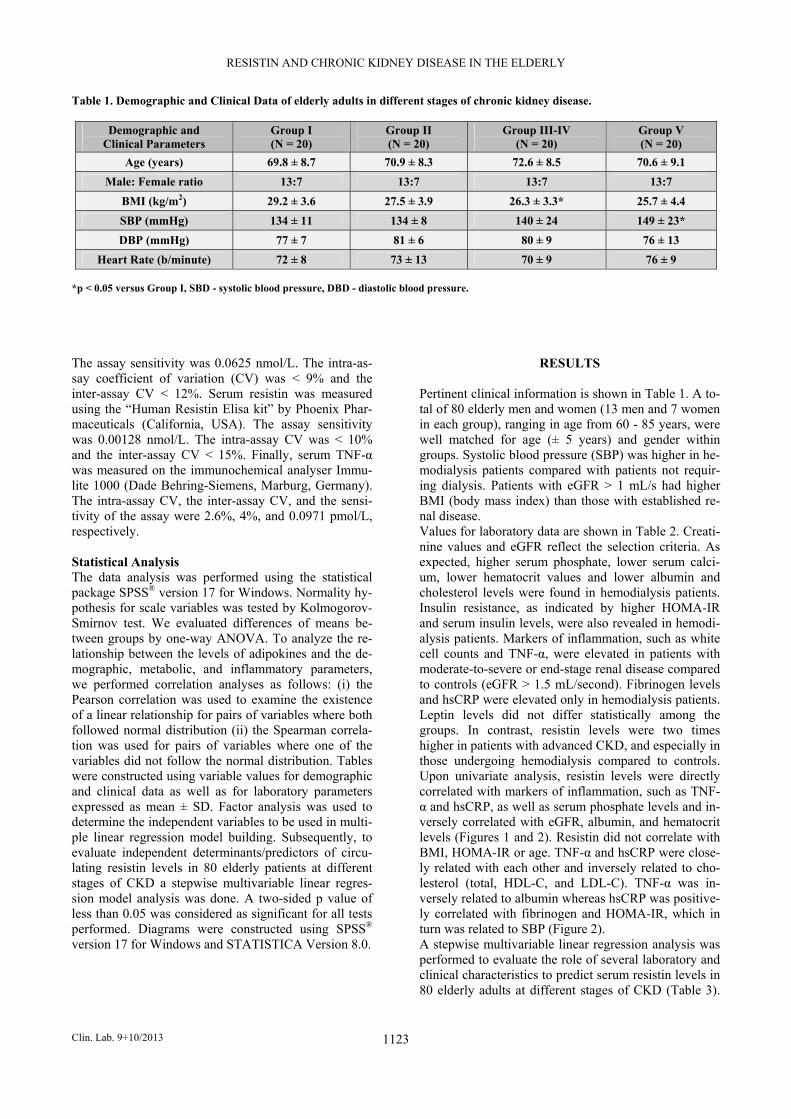
Table 1. Demographic and Clinical Data of elderly adults in different stages of chronic kidney disease.
Demographic and Clinical Parameters
Group I (N = 20)
Group II (N = 20)
Group III-IV (N = 20)
Group V (N = 20)
Age (years) 69.8 ± 8.7 70.9 ± 8.3 72.6 ± 8.5 70.6 ± 9.1
Male: Female ratio 13:7 13:7 13:7 13:7
BMI (kg/m2) 29.2 ± 3.6 27.5 ± 3.9 26.3 ± 3.3* 25.7 ± 4.4
SBP (mmHg) 134 ± 11 134 ± 8 140 ± 24 149 ± 23*
DBP (mmHg) 77 ± 7 81 ± 6 80 ± 9 76 ± 13
Heart Rate (b/minute) 72 ± 8 73 ± 13 70 ± 9 76 ± 9 *p < 0.05 versus Group I, SBD - systolic blood pressure, DBD - diastolic blood pressure. The assay sensitivity was 0.0625 nmol/L. The intra-as-say coefficient of variation (CV) was < 9% and the inter-assay CV < 12%. Serum resistin was measured using the “Human Resistin Elisa kit” by Phoenix Phar-maceuticals (California, USA). The assay sensitivity was 0.00128 nmol/L. The intra-assay CV was < 10% and the inter-assay CV < 15%. Finally, serum TNF-α was measured on the immunochemical analyser Immu-lite 1000 (Dade Behring-Siemens, Marburg, Germany). The intra-assay CV, the inter-assay CV, and the sensi-tivity of the assay were 2.6%, 4%, and 0.0971 pmol/L, respectively. Statistical Analysis The data analysis was performed using the statistical package SPSS® version 17 for Windows. Normality hy-pothesis for scale variables was tested by Kolmogorov-Smirnov test. We evaluated differences of means be-tween groups by one-way ANOVA. To analyze the re-lationship between the levels of adipokines and the de-mographic, metabolic, and inflammatory parameters, we performed correlation analyses as follows: (i) the Pearson correlation was used to examine the existence of a linear relationship for pairs of variables where both followed normal distribution (ii) the Spearman correla-tion was used for pairs of variables where one of the variables did not follow the normal distribution. Tables were constructed using variable values for demographic and clinical data as well as for laboratory parameters expressed as mean ± SD. Factor analysis was used to determine the independent variables to be used in multi-ple linear regression model building. Subsequently, to evaluate independent determinants/predictors of circu-lating resistin levels in 80 elderly patients at different stages of CKD a stepwise multivariable linear regres-sion model analysis was done. A two-sided p value of less than 0.05 was considered as significant for all tests performed. Diagrams were constructed using SPSS® version 17 for Windows and STATISTICA Version 8.0.
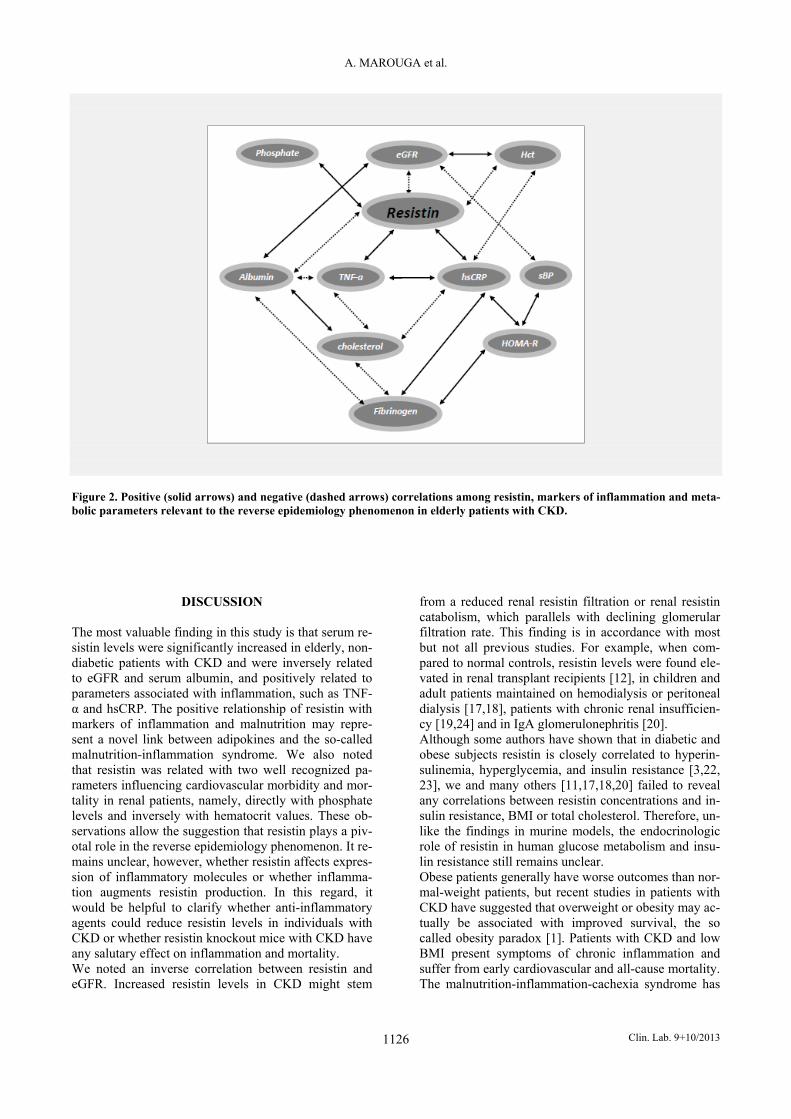
RESULTS Pertinent clinical information is shown in Table 1. A to-tal of 80 elderly men and women (13 men and 7 women in each group), ranging in age from 60 - 85 years, were well matched for age (± 5 years) and gender within groups. Systolic blood pressure (SBP) was higher in he-modialysis patients compared with patients not requir-ing dialysis. Patients with eGFR > 1 mL/s had higher BMI (body mass index) than those with established re-nal disease. Values for laboratory data are shown in Table 2. Creati-nine values and eGFR reflect the selection criteria. As expected, higher serum phosphate, lower serum calci-um, lower hematocrit values and lower albumin and cholesterol levels were found in hemodialysis patients. Insulin resistance, as indicated by higher HOMA-IR and serum insulin levels, were also revealed in hemodi-alysis patients. Markers of inflammation, such as white cell counts and TNF-α, were elevated in patients with moderate-to-severe or end-stage renal disease compared to controls (eGFR > 1.5 mL/second). Fibrinogen levels and hsCRP were elevated only in hemodialysis patients. Leptin levels did not differ statistically among the groups. In contrast, resistin levels were two times higher in patients with advanced CKD, and especially in those undergoing hemodialysis compared to controls. Upon univariate analysis, resistin levels were directly correlated with markers of inflammation, such as TNF-α and hsCRP, as well as serum phosphate levels and in-versely correlated with eGFR, albumin, and hematocrit levels (Figures 1 and 2). Resistin did not correlate with BMI, HOMA-IR or age. TNF-α and hsCRP were close-ly related with each other and inversely related to cho-lesterol (total, HDL-C, and LDL-C). TNF-α was in-versely related to albumin whereas hsCRP was positive-ly correlated with fibrinogen and HOMA-IR, which in turn was related to SBP (Figure 2). A stepwise multivariable linear regression analysis was performed to evaluate the role of several laboratory and clinical characteristics to predict serum resistin levels in 80 elderly adults at different stages of CKD (Table 3).
A. MAROUGA et al.
Clin. Lab. 9+10/2013 1124
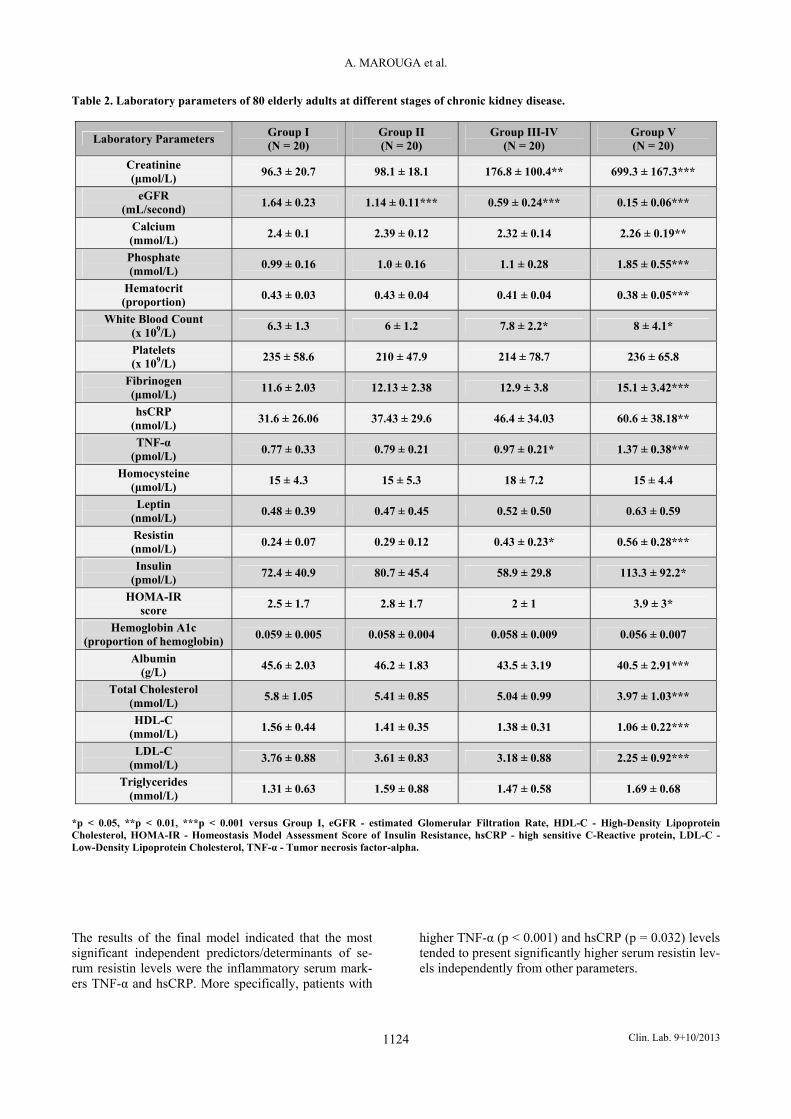
Table 2. Laboratory parameters of 80 elderly adults at different stages of chronic kidney disease.
Laboratory Parameters Group I (N = 20)
Group II (N = 20)
Group III-IV (N = 20)
Group V (N = 20)
Creatinine (μmol/L)
96.3 ± 20.7 98.1 ± 18.1 176.8 ± 100.4** 699.3 ± 167.3***
eGFR (mL/second)
1.64 ± 0.23 1.14 ± 0.11*** 0.59 ± 0.24*** 0.15 ± 0.06***
Calcium (mmol/L)
2.4 ± 0.1 2.39 ± 0.12 2.32 ± 0.14 2.26 ± 0.19**
Phosphate (mmol/L)
0.99 ± 0.16 1.0 ± 0.16 1.1 ± 0.28 1.85 ± 0.55***
Hematocrit (proportion)
0.43 ± 0.03 0.43 ± 0.04 0.41 ± 0.04 0.38 ± 0.05***
White Blood Count (x 109/L)
6.3 ± 1.3 6 ± 1.2 7.8 ± 2.2* 8 ± 4.1*
Platelets (x 109/L)
235 ± 58.6 210 ± 47.9 214 ± 78.7 236 ± 65.8
Fibrinogen (μmol/L)
11.6 ± 2.03 12.13 ± 2.38 12.9 ± 3.8 15.1 ± 3.42***
hsCRP (nmol/L)
31.6 ± 26.06 37.43 ± 29.6 46.4 ± 34.03 60.6 ± 38.18**
TNF-α (pmol/L)
0.77 ± 0.33 0.79 ± 0.21 0.97 ± 0.21* 1.37 ± 0.38***
Homocysteine (μmol/L)
15 ± 4.3 15 ± 5.3 18 ± 7.2 15 ± 4.4
Leptin (nmol/L)
0.48 ± 0.39 0.47 ± 0.45 0.52 ± 0.50 0.63 ± 0.59
Resistin (nmol/L)
0.24 ± 0.07 0.29 ± 0.12 0.43 ± 0.23* 0.56 ± 0.28***
Insulin (pmol/L)
72.4 ± 40.9 80.7 ± 45.4 58.9 ± 29.8 113.3 ± 92.2*
HOMA-IR score
2.5 ± 1.7 2.8 ± 1.7 2 ± 1 3.9 ± 3*
Hemoglobin A1c (proportion of hemoglobin)
0.059 ± 0.005 0.058 ± 0.004 0.058 ± 0.009 0.056 ± 0.007
Albumin (g/L)
45.6 ± 2.03 46.2 ± 1.83 43.5 ± 3.19 40.5 ± 2.91***
Total Cholesterol (mmol/L)
5.8 ± 1.05 5.41 ± 0.85 5.04 ± 0.99 3.97 ± 1.03***
HDL-C (mmol/L)
1.56 ± 0.44 1.41 ± 0.35 1.38 ± 0.31 1.06 ± 0.22***
LDL-C (mmol/L)
3.76 ± 0.88 3.61 ± 0.83 3.18 ± 0.88 2.25 ± 0.92***
Triglycerides (mmol/L)
1.31 ± 0.63 1.59 ± 0.88 1.47 ± 0.58 1.69 ± 0.68
*p < 0.05, **p < 0.01, ***p < 0.001 versus Group I, eGFR - estimated Glomerular Filtration Rate, HDL-C - High-Density Lipoprotein Cholesterol, HOMA-IR - Homeostasis Model Assessment Score of Insulin Resistance, hsCRP - high sensitive C-Reactive protein, LDL-C - Low-Density Lipoprotein Cholesterol, TNF-α - Tumor necrosis factor-alpha.
The results of the final model indicated that the most significant independent predictors/determinants of se-rum resistin levels were the inflammatory serum mark-ers TNF-α and hsCRP. More specifically, patients with
higher TNF-α (p < 0.001) and hsCRP (p = 0.032) levels tended to present significantly higher serum resistin lev-els independently from other parameters.
RESISTIN AND CHRONIC KIDNEY DISEASE IN THE ELDERLY
Clin. Lab. 9+10/2013 1125
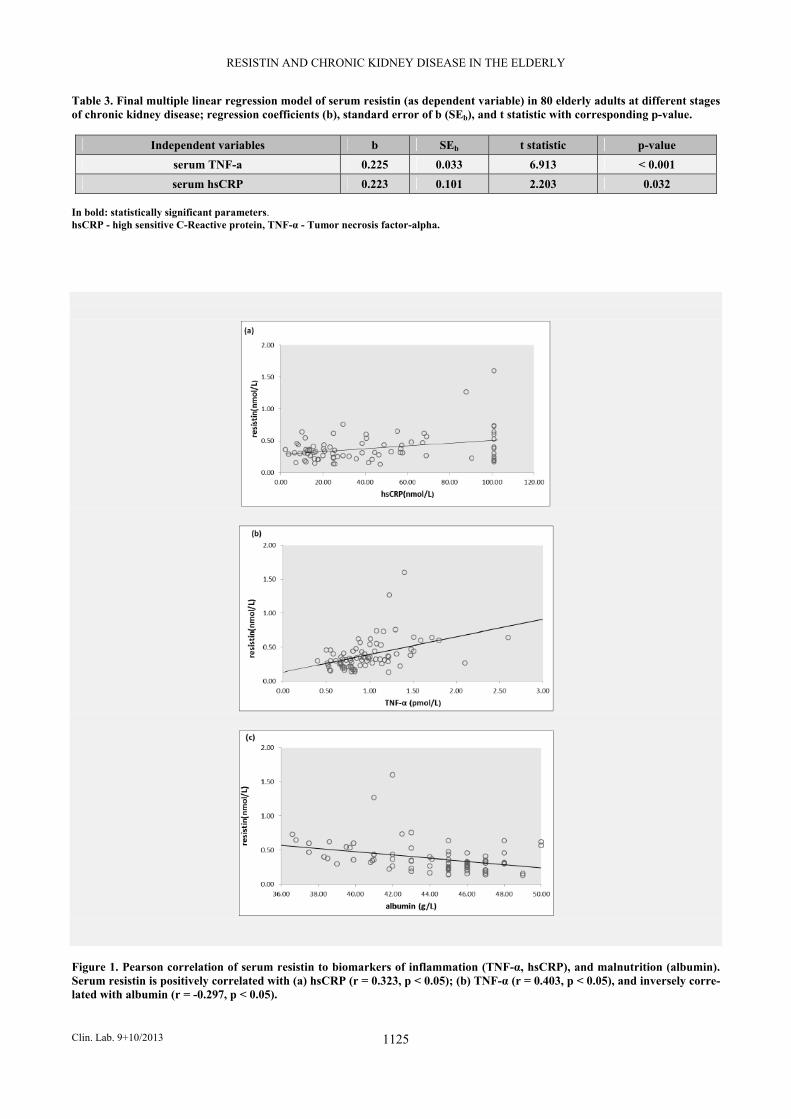
Table 3. Final multiple linear regression model of serum resistin (as dependent variable) in 80 elderly adults at different stages of chronic kidney disease; regression coefficients (b), standard error of b (SEb), and t statistic with corresponding p-value.
Independent variables b SEb t statistic p-value
serum TNF-a 0.225 0.033 6.913 < 0.001
serum hsCRP 0.223 0.101 2.203 0.032 In bold: statistically significant parameters. hsCRP - high sensitive C-Reactive protein, TNF-α - Tumor necrosis factor-alpha.
Figure 1. Pearson correlation of serum resistin to biomarkers of inflammation (TNF-α, hsCRP), and malnutrition (albumin). Serum resistin is positively correlated with (a) hsCRP (r = 0.323, p < 0.05); (b) TNF-α (r = 0.403, p < 0.05), and inversely corre-lated with albumin (r = -0.297, p < 0.05).
A. MAROUGA et al.
Clin. Lab. 9+10/2013 1126
Figure 2. Positive (solid arrows) and negative (dashed arrows) correlations among resistin, markers of inflammation and meta-bolic parameters relevant to the reverse epidemiology phenomenon in elderly patients with CKD.
DISCUSSION The most valuable finding in this study is that serum re-sistin levels were significantly increased in elderly, non-diabetic patients with CKD and were inversely related to eGFR and serum albumin, and positively related to parameters associated with inflammation, such as TNF-α and hsCRP. The positive relationship of resistin with markers of inflammation and malnutrition may repre-sent a novel link between adipokines and the so-called malnutrition-inflammation syndrome. We also noted that resistin was related with two well recognized pa-rameters influencing cardiovascular morbidity and mor-tality in renal patients, namely, directly with phosphate levels and inversely with hematocrit values. These ob-servations allow the suggestion that resistin plays a piv-otal role in the reverse epidemiology phenomenon. It re-mains unclear, however, whether resistin affects expres-sion of inflammatory molecules or whether inflamma-tion augments resistin production. In this regard, it would be helpful to clarify whether anti-inflammatory agents could reduce resistin levels in individuals with CKD or whether resistin knockout mice with CKD have any salutary effect on inflammation and mortality. We noted an inverse correlation between resistin and eGFR. Increased resistin levels in CKD might stem
from a reduced renal resistin filtration or renal resistin catabolism, which parallels with declining glomerular filtration rate. This finding is in accordance with most but not all previous studies. For example, when com-pared to normal controls, resistin levels were found ele-vated in renal transplant recipients [12], in children and adult patients maintained on hemodialysis or peritoneal dialysis [17,18], patients with chronic renal insufficien-cy [19,24] and in IgA glomerulonephritis [20]. Although some authors have shown that in diabetic and obese subjects resistin is closely correlated to hyperin-sulinemia, hyperglycemia, and insulin resistance [3,22, 23], we and many others [11,17,18,20] failed to reveal any correlations between resistin concentrations and in-sulin resistance, BMI or total cholesterol. Therefore, un-like the findings in murine models, the endocrinologic role of resistin in human glucose metabolism and insu-lin resistance still remains unclear. Obese patients generally have worse outcomes than nor-mal-weight patients, but recent studies in patients with CKD have suggested that overweight or obesity may ac-tually be associated with improved survival, the so called obesity paradox [1]. Patients with CKD and low BMI present symptoms of chronic inflammation and suffer from early cardiovascular and all-cause mortality. The malnutrition-inflammation-cachexia syndrome has
RESISTIN AND CHRONIC KIDNEY DISEASE IN THE ELDERLY
Clin. Lab. 9+10/2013 1127
been proposed to explain the increased mortality risk of low BMI in renal patients. Of particular interest is that a significant relationship between resistin and markers of malnutrition such as low albumin levels or markers of inflammation (TNF-α and hsCRP) was revealed in this study. Others have also shown that resistin levels corre-late with inflammatory markers in healthy volunteers [23] and in patients with obesity and diabetes [11], cor-onary artery disease [24], systemic lupus erythematosus [25] and in critically ill patients [7,22]. In addition, re-sistin was found to inversely correlate with the protein catabolic rate and therefore with the possible develop-ment of protein and energy malnutrition. Given the ele-vated resistin level in CKD patients and its diverse roles in metabolism and inflammation, this adipokine seems to be a relevant player in the emerging connection be-tween renal disease and cardiovascular morbidity and mortality. Although previous data have suggested that serum lep-tin levels are higher in patients with CKD compared to normal controls and were associated with atherogenic lipid profiles [26], insulin resistance [27], and CRP [28], we did not find any significant correlation between leptin and eGFR, hsCRP, lipid profile and HOMA-IR in this study. The reason for these divergent results is un-clear but it may be, in part, due to the variability in cir-culating levels of leptin in the various subgroups of pa-tients selected in each study. For instance, young obese or diabetic patients were excluded in this study. We acknowledge that there are several limitations in this investigation. First, resistin exerts its main action locally and the measured serum levels may reflect only a small spillover into the blood stream. Second, one re-sistin measurement may not be translated to chronic al-terations within this patient population. Third, the rela-tively small number of patients, though sufficient to generate statistically significant associations, makes it difficult to draw definitive conclusions regarding the role of resistin in reverse epidemiology. Therefore, pro-spective long-term studies focusing on sequential mea-surements of resistin levels and changes in inflammato-ry markers and nutritional status in this patient popula-tion in relation to progression of cardiovascular diseases and mortality are needed for further assessment of the potential impact of elevated resistin levels in reverse ep-idemiology. Nevertheless, the methodological strengths of the present investigation include: 1) the strict criteria for inclusion of cases and control subjects, 2) the match-ing for age and gender in each group of patients (diffi-cult to perform across the four groups of patients), which further reinforces the observed associations, and 3) the assessment of adipokines was made using well-validated assays in the same laboratory and in a blinded fashion which also eliminated uncontrolled confounding data from these sources. In conclusion, our results indicate that resistin increases as GFR declines and may be involved in the malnutri-tion-inflammation state and the reverse epidemiology phenomenon present in elderly, non-diabetic patients
with CKD. Further studies are required to clarify wheth-er resistin presents any pathophysiologic significance in the reverse epidemiology phenomenon observed in CKD and other chronic conditions or whether it should be regarded solely as a marker of inflammation. Acknowledgement: A. Marouga expresses her gratitude to I. Tsouras, Direc-tor of the Dialysis Unit of the Athens Naval Hospital, for providing patient sera from patients with chronic kidney disease. Furthermore, A. Marouga thanks K. Gi-annikakis and V. Fragaki for collecting blood serum. Author contributions: Anna Marouga (Biochemist) collected patients’ data, performed some of the experiments and wrote some portions of the manuscript. Maria Dalamaga (Assistant Professor, Clinical Patholo-gist) conceived the idea and the design of the study (adipokines and chronic kidney disease), obtained the funding, reviewed and revised the manuscript. Anastasia N. Kastania (Statistician) analyzed and pres-ented the data. George Antonakos (Consultant, Clinical Pathologist) re-viewed the manuscript. Apollon Thrasyvoulides (Biochemist) performed some of the experiments. Georgia Kontelia (Biochemist) performed some of the experiments. Claire Dimas (Assistant Professor, Biochemist) design-ed the experiments and reviewed the manuscript. Demetrios V. Vlahakos (Associate Professor, Nephrolo-gist) specified the aim of the work (resistin and chronic kidney disease), wrote major portions of the manuscript, supervised and reviewed the whole work. Funding Information: This work was supported by the Special Research Ac-counts of Athens University (Assistant Professor M. Dalamaga, Code 70/4/9139). Declaration of Interest: The authors have no conflict of interest to disclose. References: 1. Kalantar-Zadeh K, Abbott KC, Salahudeen A, Kilpatrick RD,
Horwich TB. Survival advantages of obesity in dialysis patients. Am J Clin Nutr 2005;81:543-54.
2. Mafra D, Guebre-Egziabher F, Fouque D. Body mass index, mus-cle and fat in chronic kidney disease: questions about survival. Nephrol Dial Transplant 2008;23:2461-6.
3. Steppan CM, Bailey ST, Bhat S, et al. The hormone resistin links obesity to diabetes. Nature 2001;409:307-12.
A. MAROUGA et al.
Clin. Lab. 9+10/2013 1128
4. Banerjee RR, Rangwala SM, Shapiro JS, et al. Regulation of fasted glucose by resistin. Science 2004;303:1195-8.
5. Migita K, Maeda Y, Miyashita T, et al. The serum levels of resis-tin in rheumatoid arthritis patients. Clin Exp Rheumatol 2006;24: 698-701.
6. Karmiris K, Koutroubakis IE, Xidakis C, Polychronaki M, Vo-udouri T, Kouroumalis EA. Circulating levels of leptin, adipo-nectin, resistin and ghrelin in inflammatory bowel disease. In-flamm Bowel Dis 2006;12:100-5.
7. Sunden-Cullberg J, Nystrom T, Lee ML, et al. Pronounced eleva-tion of resistin correlates with severity of disease in severe sepsis and septic shock. Crit Care Med 2007;35:1536-42.
8. Patel L, Buckels AC, Kinghorn IJ, et al. Resistin is expressed in human macrophages and directly regulated by PPAR gamma acti-vator. Biochem Biophys Res Commun 2003;300:472-6.
9. Bokarewa M, Nagaev I, Dahlberg L, Smith U, Tarkowsk A. Re-sistin, an adipokine with potent inflammatory properties. J Immu-nol 2005;174:5789-95.
10. Kaser S, Kaser A, Sandhofer A, Ebenbichler CF, Tilg H, Patsch JR. Resistin messanger-RNA expression is increased by prion-flammatory cytokines in vitro. Biochem Biophys Res Commun 2003;309:286-90.
11. Axelsson J, Bergsten A, Qureshi AR, et al. Elevated resistin lev-els in chronic kidney disease are associated with decreased glo-merular filtration rate and inflammation, but not with insulin re-sistance. Kidney Int 2006;69:596-604.
12. Malyszko J, Malyszko JS, Pawlak K, Mysliwiec M. Resistin, a new adipokine, is related to inflammation and renal function in kidney allograft recipients. Transpl Proc 2006;38:3434-6.
13. Díez JJ, Iglesias P, Fernández-Reyes MJ, et al. Serum concentra-tions of leptin, adiponectin and resistin and their relationship with cardiovascular disease in patients with end-stage renal disease. Clin Endocrinol 2005;62:242-9.
14. Malyszko J, Malyszko JS, Kozminski P, Pawlak K, Mysliwiec M. Elevated resistin is related to inflammation and residual renal function in hemodialysis patients. Nephrology 2007;12:246-53.
15. Cockcroft DW, Gault MH. Prediction of creatinine clearance from serum creatinine. Nephron 1976;16:31-41.
16. Matthews DR, Hosker JP, Rudenski AS, Naylor BA, Treacher DF, Turner RC. Homeostasis model assessment: insulin resis-tance and β-cell function from fasting plasma glucose and insulin concentrations in man. Diabetologia 1985;28:412-9.
17. Filippidis G, Liakopoulos V, Mertens PR, et al. Resistin serum levels are increased but not correlated with insulin resistance in chronic hemodialysis patients. Blood Purif 2005;23:421-8.
18. Buyan N, Bideci A, Ozkaya O, et al. Leptin and resistin levels and their relationships with glucose metabolism in children with chronic renal insufficiency and undergoing dialysis. Nephrology 2006;11:192-6.
19. Yaturu S, Reddy R, Rains J, Jain SK. Plasma and urine levels of resistin and adiponectin in chronic kidney disease. Cytokine 2007;37:1-5.
20. Kielstein JT, Becker B, Graf S, Brabant G, Haller H, Fliser D. In-creased resistin blood levels are not associated with insulin resis-tance in patients with renal disease. Am J Kidney Dis 2003;42: 62-6.
21. Haluzik M, Haluzikova D. The role of resistin in obesity induced insulin resistance. Curr Opin Investig Drugs 2006;7:306-11.
22. Koch A, Gressner OA, Sanson E, Tacke F, Trautein C. Serum re-sistin levels in critically ill patients are associated with inflamma-tion, organ dysfunction and metabolism and may predict survival in non-septic patients. Critical Care 2009;13:R95.
23. Pantsulaia I, Livshits G, Trofimov S, Kobyliansky E. Genetic and environmental determinants of circulating resistin level in a com-munity-based sample. Eur J Endocrinol 2007;156:129-35.
24. Risch L, Saely C, Hoefle G, et al. Relationship between glomeru-lar filtration rate and the adipokines adiponectin, resistin, and lep-tin in coronary patients with predominantly normal or mildly im-paired renal function. Clin Chim Acta 2007;376:108-13.
25. Almehed K, Forsblad d’Elia H, Bokarewa M, Carlsten H. Role of resistin as a marker of inflammation in systemic lupus erythema-tosus. Arthritis Res Ther 2008;10:R15.
26. Kastarinen H, Kesäniemi YA, Ukkola O. Leptin and lipid metab-olism in chronic kidney failure. Scand J Clin Lab Invest 2009;69: 401-8.
27. Atamer A, Alisir Ecder S, Akkus Z, et al. Relationship between leptin, insulin resistance, insuline-like growth factor-1 and insu-lin-like growth factor binding protein-3 in patients with chronic kidney disease. J Int Med Res 2008;36:522-8.
28. Nordfors L, Lönnqvist F, Heimbürger O, Danielsson A, Schalling M, Stenvinkel P. Low leptin gene expression and hyperleptinemia in chronic renal failure. Kidney Int 1998;54:1267-75.
Correspondence: Maria Dalamaga, MD, MPH, MS, PhD Assistant Professor in Clinical Biochemistry University of Athens Medical School Attikon General University Hospital 19, 28th October, 15341 Athens, Greece Tel./Fax: +302106082467 Email: [email protected]
Copyright © 2022 FDOKUMEN