Correlates of Depressive Conditions: A Cross-Country Comparison Based on the Study of Global Aging...
30
Correlates of Depressive Conditions: A Cross-Country Comparison Based on the Study of Global Aging and Adult Health (SAGE) Tristan Gorrindo, Georgetown University, Massachusetts General Hospital Somnath Chatterji, World Health Organization (WHO) Paul Kowal, World Health Organization (WHO) Zachary Epstein, Georgetown University Maxine Weinstein, Georgetown University (Corresponding author) ABSTRACT Depressive disorders are a leading cause of the burden of disease in middle- and high-income countries. Alleviating the personal suffering and reducing the economic costs and consequences of this group of disorders is a growing concern and focus for intervention. Data from the Study of Global Aging and Adult Health (SAGE) provide an important vehicle for identifying and assessing the characteristics of persons at highest risk. The SAGE data allow a diagnosis of depression that is more closely consistent with the Diagnostic and Statistical Manual of Mental Disorders (DSM-IV) than most surveys. We examine prevalence of depression based on self-reports categorized by age, sex, marital status, education, quintiles of income, and self-assessed health. Depression is: more common among women than men; increases with age; higher among the divorced, widowed, or separated than among persons who are currently married or cohabiting; associated with worse self-assessed health.
-
Upload
newcastle-au -
Category
Documents
-
view
0 -
download
0
Transcript of Correlates of Depressive Conditions: A Cross-Country Comparison Based on the Study of Global Aging...

Correlates of Depressive Conditions: A Cross-Country Comparison Based on the Study of
Global Aging and Adult Health (SAGE)
Tristan Gorrindo, Georgetown University, Massachusetts General Hospital
Somnath Chatterji, World Health Organization (WHO)
Paul Kowal, World Health Organization (WHO)
Zachary Epstein, Georgetown University
Maxine Weinstein, Georgetown University (Corresponding author)
ABSTRACT
Depressive disorders are a leading cause of the burden of disease in middle- and high-income
countries. Alleviating the personal suffering and reducing the economic costs and
consequences of this group of disorders is a growing concern and focus for intervention. Data
from the Study of Global Aging and Adult Health (SAGE) provide an important vehicle for
identifying and assessing the characteristics of persons at highest risk. The SAGE data allow a
diagnosis of depression that is more closely consistent with the Diagnostic and Statistical
Manual of Mental Disorders (DSM-IV) than most surveys. We examine prevalence of
depression based on self-reports categorized by age, sex, marital status, education, quintiles of
income, and self-assessed health. Depression is: more common among women than men;
increases with age; higher among the divorced, widowed, or separated than among persons
who are currently married or cohabiting; associated with worse self-assessed health.

INTRODUCTION
Depressive disorders are the leading cause of the burden of disease in both middle and high-
income countries (WHO, 2004). With the exception of the African region – where infectious and
diarrheal diseases continue to dominate – depressive disorders rank among the top ten causes
of disease burden in all WHO regions; globally, they are projected to be the single most
important cause in 2030. Alleviating the personal suffering and reducing the economic costs and
consequences of this group of disorders is a growing concern and focus for intervention.
Relative to physical conditions, psychiatric disorders have been shown to be more disabling and
less likely to be treated in some parts of the world (Suliman et al., 2010).
Using data from the WHO Study on global AGEing and adult health (SAGE), we evaluate the
extent and sociodemographic correlates of depressive conditions across five countries: India,
China, Ghana, Mexico, and South Africa. Our work focuses on a few correlates – income, sex,
age, education, and self-assessed health – that have already been identified as linked to the
condition; previous findings regarding these correlates are summarized below. The SAGE data
provide an important vehicle for identifying and assessing the characteristics of persons at
highest risk of a depressive episode. Unlike most demographic studies, which typically use a
form of the CES-D to characterize depressive symptoms, the SAGE data on affective disorders
allow a diagnosis of depression that is closely consistent with the Diagnostic and Statistical
Manual of Mental Disorders (DSM-IV; APA, 2000). The DSM diagnosis is important because it
allows for comparisons with the extant psychiatric literature. We use the DSM criteria to identify
persons who would have been diagnosed as depressed during the previous year and compare
that percentage with an estimate of persons who self-report that they were diagnosed, took
medication or had other treatment for depression, or had an in- or outpatient visit related to
anxiety or depression. We use these measures to estimate (in our five countries) the overall
prevalence of a depressive episode and the extent to which a depressive episode in the past

year went undiagnosed or untreated. Finally, we explore the extent to which the correlates
explain whether a respondent reported a depressive episode in the previous year.
Income
Generally, low socioeconomic status is associated with a higher probability of a depressive
disorder (Lorant et al., 2003; Kessler et al, 2003). More specifically, in many developing
countries, poverty and socioeconomic insecurity have been shown to be associated with higher
prevalence of mental health disorders (Patel et al., 2003). But the evidence regarding income is
not unmixed. Araya and colleagues, for example, found that that after controlling for other
socioeconomic factors, per capita household income was not associated with greater risk of
suffering from common mental disorders (Araya et al., 2003), although they did find a significant
association between poor living conditions and risk, even in the presence of controls. In India,
having a higher standard of living was associated with a lower of risk of suffering from a
“common mental disorder,” i.e. disorders – including depression – that are often encountered in
community and primary care settings. (Shidhaye et al., 2010; Goldberg et al., 1992), while
Income insecurity and shocks to family income appear to be associated with increased rates of
suicide among farmers (Sundar, 1999).
In Mexico, among a nationally representative sample, low-income respondents were not only
more likely to suffer from depressive symptoms but were also more likely to report severe
conditions (Medina-Mora et al., 2005). And – also in Mexico – among the elderly, economic
security – primarily food security – was associated with lower prevalence of depression (Guerra
et al., 2009).
Turning to Africa, a study of low-income South Africans from three cities – Capetown, Durban,
and Port Elizabeth – found that persons with high non-employment income (pensions, disability

grants, unemployment insurance, and child support) and persons with less total income over the
previous month were more likely to present with depressive symptoms (Hamad et al., 2008).
However, this relationship between income and depression was not consistent with findings
from a nationally representative sample of South Africans (Stein et al., 2008) or with a small
study of a rural South African village that found no relationship between socio-economic status
and general psychiatric morbidity (Rumble et al., 1996). We have identified only limited data
from Ghana, but a sample of outpatients from a Ghanaian psychiatric hospital was
characterized as predominantly “low economic” status (Majodina et al, 1983).
Sex
In most studies, being a woman is one of the more consistent indicators of an individual’s
lifetime risk of suffering from a mood disorder (Kessler et al., 2003; Medina-Mora et al., 2007;
Stein et al., 2008). The correlation between being female and risk of major depression is found
across a wide number of countries (Weissman et al., 1996); many studies using self-reported
measures or structured interviews find that women are twice as likely as men to suffer from
depression (Nolen-Hoeksema, 1987).
Lifetime prevalence of major depressive disorder was significantly higher for women than for
men in nationally representative samples of South Africans and Mexicans (Stein et al., 2008;
Medina-Mora et al., 2007). In a study of suicide risk in South Africa, women were twice as likely
to have attempted suicide (Joe et al., 2008). A significant difference in prevalence between
men and women was also found in a sample of adults in four Chinese provinces (Phillips et al,
2009) and in a sample of both the in- and outpatients of a Ghanian psychiatric hospital,
researchers found that two-thirds of the sample was female (Majodina et al., 1983). However,
sex is not always a significant indicator of general psychiatric morbidity (see for example,
Rumble et al, 1996, regarding rural South African villages).

The effects of poor mental health also vary by sex. For example, Suliman and colleagues found
that, among persons suffering from a physical or psychiatric condition in South Africa, women
reported significantly less impairment in their ability to function as home managers. (Suliman et
al., 2010). And women may also cope differently from men: in a comparison of college students
from the U.S. and Ghana, women were more likely to engage in ruminative coping when feeling
depressed (Eshun, 1998).
Education
Some studies show that higher education is associated with a lower risk of suffering from a
major depressive disorder. (Kessler et al., 2007; Ross et al., 2006), but the evidence is mixed.
Among studies of the elderly community, lower education level was not determined to be a risk
factor for depression (Cole et al., 2003). And Andrade et al. (2000) found no significant
correlation between education and 12-month comorbidity for mental disorders, (i.e., the
prevalence of anxiety, mood, and substance-abuse disorders, collectively).
In rural India, greater education among women was a significant predictor of reduced risk of
suffering from a common mental disorder (Shidhaye et al., 2010). Guerra and colleagues
(2009), in a study of the elderly Mexican population found that education attainment and
prevalence of a depressive episode are weakly inversely correlated; and in South Africa, the
lifetime prevalence of a psychiatric mood disorder and reported depressive symptoms among
low-income adults were both found to be significantly higher for individuals with relatively less
education (Stein et al., 2008; Hamad et al., 2007). However, among South Africans, persons
with more education, just as with income, report that depressive episodes have a wider impact
across more domains of their daily lives (Suliman, 2010).

Age
The relationship between age and depression is complex. Among a sample of English-
speaking U.S. respondents, Mirowsky and Ross (1992) found that depression follows a U-
shaped pattern with age as levels of depression initially decrease with age before reaching a
minimum around age 45 and increasing thereafter (Mirowsky and Ross, 1992)
In a sample of the Chinese adult population, Phillips and colleagues found that relative to
persons under age 40, mood and anxiety disorders were more prevalent among persons aged
40 years and older (Phillips et al., 2009). And Shidhaye and Patel (2010) found an association
between older age and higher rates of depression in their survey of rural Indian women. But not
all studies find higher rates among older persons: In Mexico, for example, Medina-Mora and
colleagues (2007) found that, relative to persons aged 55 years or older, the risk of depression
was higher among younger age groups, with the highest risk among the youngest group aged
18-29. Stein and colleagues’ (2008) evaluation of the South African population found
depression was significantly higher between ages of 35-49 than at ages 65 and over, (Stein et
al., 2008).
Self-Assessed Health
There is an extensive literature on the relationship between depression and self-assessed
health (we return to this issue in the discussion); the relationship between is unclear and
probably reciprocal. Some recent evidence indicates that self-reported overall health is a
significant predictor for subsequent depression, but being depressed does not have a significant
effect on self-assessed health (Kosloski et al., 2005); other evidence suggests that physical
illness increases subsequent depressive symptoms, and depression has a smaller, lagged
effect of increasing physical disorder (Aneshensel et al., 1984).
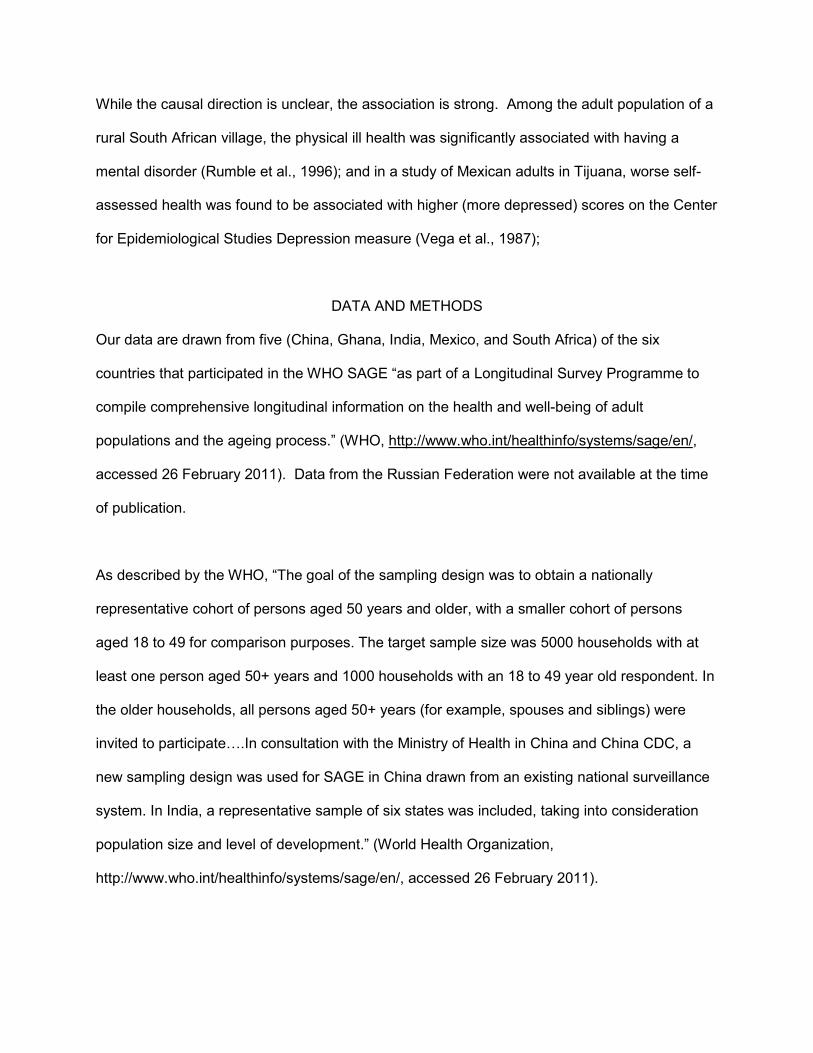
While the causal direction is unclear, the association is strong. Among the adult population of a
rural South African village, the physical ill health was significantly associated with having a
mental disorder (Rumble et al., 1996); and in a study of Mexican adults in Tijuana, worse self-
assessed health was found to be associated with higher (more depressed) scores on the Center
for Epidemiological Studies Depression measure (Vega et al., 1987);
DATA AND METHODS
Our data are drawn from five (China, Ghana, India, Mexico, and South Africa) of the six
countries that participated in the WHO SAGE “as part of a Longitudinal Survey Programme to
compile comprehensive longitudinal information on the health and well-being of adult
populations and the ageing process.” (WHO, http://www.who.int/healthinfo/systems/sage/en/,
accessed 26 February 2011). Data from the Russian Federation were not available at the time
of publication.
As described by the WHO, “The goal of the sampling design was to obtain a nationally
representative cohort of persons aged 50 years and older, with a smaller cohort of persons
aged 18 to 49 for comparison purposes. The target sample size was 5000 households with at
least one person aged 50+ years and 1000 households with an 18 to 49 year old respondent. In
the older households, all persons aged 50+ years (for example, spouses and siblings) were
invited to participate….In consultation with the Ministry of Health in China and China CDC, a
new sampling design was used for SAGE in China drawn from an existing national surveillance
system. In India, a representative sample of six states was included, taking into consideration
population size and level of development.” (World Health Organization,
http://www.who.int/healthinfo/systems/sage/en/, accessed 26 February 2011).

For each respondent, we created two measures that captured different dimensions of a possible
depressive diagnosis. The first, using DSM criteria, captures the essentials of a clinical
assessment; the second estimates treatment levels based on the respondent’s report of
diagnosis, medication or other treatment, or in- and outpatient visits for depression or anxiety.
More specifically, the first measure was based on DSM-IV-TR criteria for a major depressive
episode (American Psychiatric Association, 2000). Using these criteria, we classified
respondents as depressed if they endorsed a two week period within the past year of depressed
mood or anhedonia in addition to four or more concurrent symptoms from the following list: loss
of appetite, difficulty falling asleep or insomnia, fatigue or low energy, restlessness or slow
movement, negative feelings about oneself or loss of confidence, diminished concentration, or
thoughts of suicide.
The following questions were used to determine whether survey participants had four or more
concurrent symptoms. Respondents met the DSM criterion for sadness/depressed mood if they
answered "yes" to the following 3 items: "During the last 12 months, have you had a
period lasting several days when you felt sad, empty or depressed," "Was this period of
sadness for more than 2 weeks," and, "Was this period of sadness most of the day, nearly every
day?" Respondents met the DSM criterion for anhedonia if they answered "yes" to the following
survey items: "During the last 12 months, have you had a period lasting several days when you
lost interest in most things you usually enjoy such as personal relationships, work or
hobbies/recreation," "Was this period loss of interest for more than 2 weeks," and, "Was this
period loss of interest most of the day, nearly every day?"
Respondents met the DSM criterion for appetite disturbance if they answered "yes" to, "During
this period, did you lose your appetite?" They met the DSM criterion for sleep disturbance if
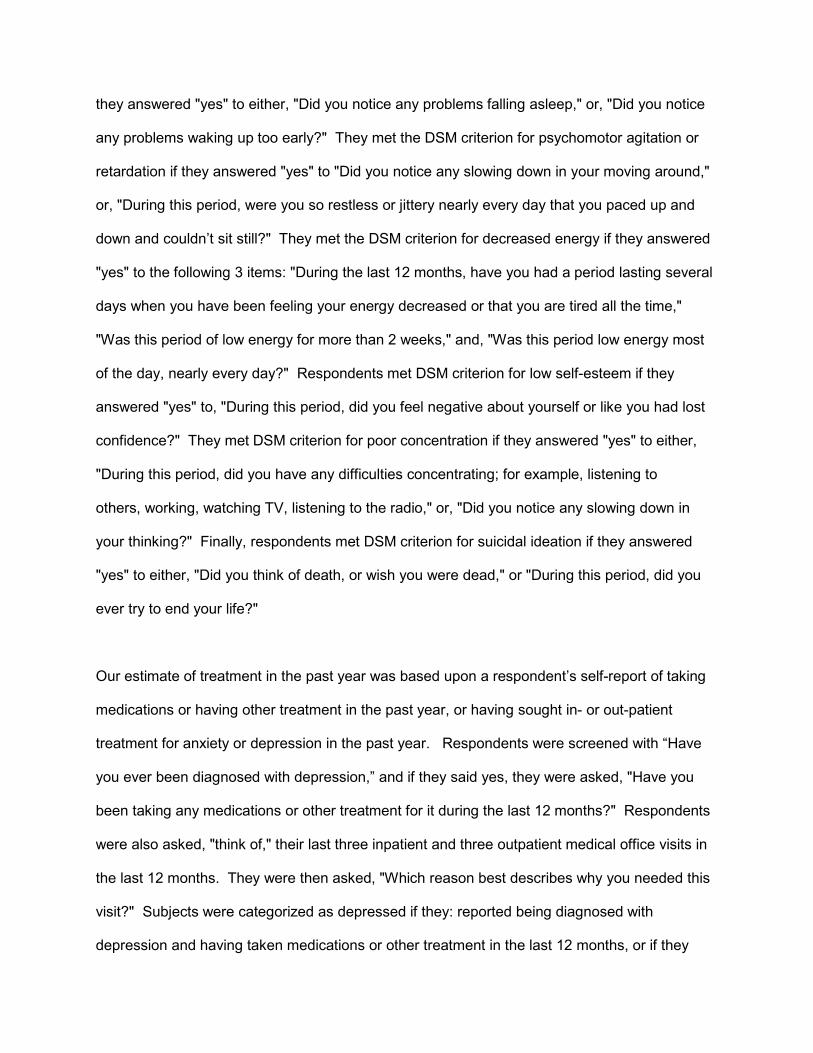
they answered "yes" to either, "Did you notice any problems falling asleep," or, "Did you notice
any problems waking up too early?" They met the DSM criterion for psychomotor agitation or
retardation if they answered "yes" to "Did you notice any slowing down in your moving around,"
or, "During this period, were you so restless or jittery nearly every day that you paced up and
down and couldn’t sit still?" They met the DSM criterion for decreased energy if they answered
"yes" to the following 3 items: "During the last 12 months, have you had a period lasting several
days when you have been feeling your energy decreased or that you are tired all the time,"
"Was this period of low energy for more than 2 weeks," and, "Was this period low energy most
of the day, nearly every day?" Respondents met DSM criterion for low self-esteem if they
answered "yes" to, "During this period, did you feel negative about yourself or like you had lost
confidence?" They met DSM criterion for poor concentration if they answered "yes" to either,
"During this period, did you have any difficulties concentrating; for example, listening to
others, working, watching TV, listening to the radio," or, "Did you notice any slowing down in
your thinking?" Finally, respondents met DSM criterion for suicidal ideation if they answered
"yes" to either, "Did you think of death, or wish you were dead," or "During this period, did you
ever try to end your life?"
Our estimate of treatment in the past year was based upon a respondent’s self-report of taking
medications or having other treatment in the past year, or having sought in- or out-patient
treatment for anxiety or depression in the past year. Respondents were screened with “Have
you ever been diagnosed with depression,” and if they said yes, they were asked, "Have you
been taking any medications or other treatment for it during the last 12 months?" Respondents
were also asked, "think of," their last three inpatient and three outpatient medical office visits in
the last 12 months. They were then asked, "Which reason best describes why you needed this
visit?" Subjects were categorized as depressed if they: reported being diagnosed with
depression and having taken medications or other treatment in the last 12 months, or if they

reported that "Depression or anxiety" was the primary reason for any of their inpatient or
outpatient visits in the last 12 months.
In order to control for the cultural influence of stigma towards mental illness, a dichotomous
variable was introduced into the regression analysis based on a question that asked
participants, "Do you think people who are sad will tell us they are sad?"
We used quintile of permanent income quintile as provided by the WHO; it is calculated based
on household assets and environmental risk factors (having or not improved water, sanitation,
cooking- and heating facilities). A random effects model (xtprobit, Stata 2007) was then used to
estimate income as a continuous measure; that estimate was used for the quintiles.
Survey participants were excluded from the analysis if they were missing data for demographic
or social characteristics, population weight, measures of depression or treatment, stigma, or if
interview data were collected from a proxy respondent.
RESULTS
Descriptive statistics are provided in Table 1. There is substantial variation by country in the
estimated percentages of depression. Respondents who experienced a DSM-based depressive
episode in the past year range from less than one percent in China to almost eight percent in
India. Reports of treatment for depression range from a low of below one percent in China to
over five percent in South Africa (where the report of treatment slightly exceeds the estimate of
prevalence). When combined, estimates of prevalence based on DSM criteria or treatment
range from just over one percent in China to nearly nine percent in Mexico. India and Ghana
have the highest levels of respondents who have less than primary education (about 44
percent); South Africa has the highest percentage with more than secondary education (37

percent) followed by China with 29 percent. The highest levels of good or very good self-
assessed health are in South Africa and Ghana (60 and 63 percent, respectively); the highest
levels of endorsement of the statement “Do you think that most people who are sad will tell us
they are sad,” occur in China where nearly three-quarters of the respondents said “yes,” and in
Ghana (nearly two-thirds said “yes”).
Tables 2 through 8 show percentages of survey respondents who were depressed in the past
year (according to DSM criteria) and who were treated or sought treatment in the last year by
country and by individual covariates. For age (Table 2), across all five countries, lowest levels
of depression are found below age 40; Ghana, India, and China show a similar pattern with
regard to DSM criteria: higher age is associated with higher levels of depression, while Mexico
and South Africa show a spike during the middle ages – 40 through 49 in South Africa and 40 –
59 in Mexico. In general, treatment patterns mirror estimates of depression, but it would appear
that a significant proportion of the 50 to 59 year olds in Mexico are not being treated, and
overall, the treatment gap increases with age in China.
Estimates by sex are shown in Table 3. Women report higher levels of depression than men in
all countries except China; they are more likely to have been treated in the last year in all
countries except Ghana. Respondents who are widowed, separated, or divorced (Table 4) have
the highest levels of depression; In India and South Africa, levels in this group are especially
pronounced (20 and 22 percent, respectively). Self-assessed health (Table 5) is strongly
related to depression (we return to the interpretation of this result in the discussion, see below):
levels of depression are lowest among persons who report good or very good health (ranging
from virtually zero percent in China to nearly four percent in India; mid-range among those who
say their health is moderate (from 1.32 percent in China to a high of 9.51 percent in India); and
highest among respondents who say they are in poor or very poor health (nearly three percent
in China and over 35 percent in Mexico).
Socioeconomic status as measured by permanent income (Table 6) or education (Table 7)
shows little consistency across countries in its relationship with depression; indeed, in only a
few instances does there appear to be a discernible association. In India, both income and
education are inversely related to depression, but no clear trend in either dimension emerges in
any other country.
Finally, we used the question about whether people would admit to being sad as a way of
getting at whether an admission of depression would be stigmatized (Table 8). In all countries
except India, people who did not endorse the statement were more likely to be depressed
(although in Ghana the difference was small as it was – necessarily – in China). In other words,
in aggregate, people who felt that there was some stigma attached to the admission of sadness
were more likely to be depressed by DSM criteria than people who did not think it would be
stigmatizing.
We examine an estimate of “unmet need” for treatment in Table 9. First of all, we looked at a
conservative measure of the proportion of the sample in each country who were not depressed
in the past year based on the two measures, i.e., who were not depressed according to DSM
criteria and who were not being treated or had not sought treatment. By this measure, over 90
percent of the respondents in all the countries were not depressed in the last 12 months, with
values ranging from nearly 99 percent in China to about 91 percent in both India and Mexico.
We then examine two ways of thinking about the need for treatment. First, we look at the
respondents who were diagnosed as depressed by DSM criteria but who did not report
treatment as a percentage of the depressed. These figures range from about 25 percent in

South Africa to just above 93 percent in India. Second, we examine untreated (but depressed)
respondents as a percentage of the study population; here the figures range from under one
percent in China to above seven percent in India.
Our final analyses – logit regressions of a DSM diagnosis of depression on the covariates – are
shown in Table 10 (excludes self-assessed health) and Table 11 (includes self-assessed
health). Looking at Table 10 shows that controlling simultaneously for the covariates does not
greatly change the overall picture: men are less likely than women to be depressed (India,
Mexico, South Africa); older age is associated with a higher likelihood of being depressed (India,
Mexico, Ghana); being widowed, divorced, or separated is associated with a higher likelihood of
depression everywhere (but statistically discernible in only India and South Africa) except in
Mexico where it is associated with a lower likelihood of depression. Once we control for the
other factors, income appears to emerge – possibly – as inversely associated; to the extent that
we observe statistically discernible results, they seem to show higher levels of depression at
lower quintiles of income and lower levels of depression at higher levels of income. Not so for
education: no clear pattern emerges even within a country. Nor does a person’s assessment of
stigmatization of sadness appear to have an effect (it is marginally discernible in Mexico, but
when self-assessed health is introduced, it loses significance on the one hand in Mexico, on the
other, it attains significance – in the opposite direction – in India). The overall picture does not
much change when self-assessed is introduced (Table 11), except that it is strongly associated
with the likelihood that the respondent is depressed: in all five countries, people who reported
moderate, bad, or very bad health are significantly more likely to be depressed than those in
good or very good health.

DISCUSSION
Our analyses show substantial variability across the five countries in the prevalence of a
depressive episode in the past year. China shows a remarkably low percentage – about one
percent overall – even in high-risk categories: older people (1.3 percent); divorced, separated,
or widowed (2.8 percent); and those with poor or very poor self-assessed health (3.0 percent).
Is this an function of the assessment using DSM criteria? Cultural norms? Our simple question
about whether a sad person would tell us s/he was sad was more widely endorsed in China –
nearly three-quarters of the respondents said “yes” – than in any other country. We cannot tell
at this point of our analyses whether the results are attributable to the instrument, cultural
factors that shape the expression of sadness, an error in our calculations that we have not
identified (sigh), or genuine resilience in the population. Our work in Taiwan suggests that the
last explanation may not be far-fetched. The prevalence of protective long (L) and extra long
(XL) variants of the 5HTTLPR gene appears to be much higher in that population than
elsewhere (Goldman et al., 2010) although identification of the XL variants is only recent and its
estimation in populations may be understated.
Some results – most notably the merry widows in Mexico – are likely to be a statistical artifact, a
result of using the traditional cut-off of a .05 level of significance (see for example, Taubes and
Mann, 1995; Ionnanidis, 2005). Ionnanidis goes as far as saying that “Most claimed research
findings are false” (Ionnanidis, 2005:696). In this regard, the importance of the comparative
space that the SAGE studies afford us cannot be overstated. The surveys allow us to replicate
analyses, if not across time, at least across geography.
The interpretation of Table 9 – our effort to get at unmet need – is complex for a number of
reasons. First, we should acknowledge the limitations of our measures. Although the
realization of the DSM criteria in the SAGE instruments is quite good, it cannot replace the face-

to-face interaction that a trained clinician would have with a patient. We are not assessing
demeanor, grooming, interpersonal cues, or other aspects of the subject’s mental status exam.
And, of course, we are dependent upon the respondent’s interpretation of the questions and the
willingness and ability of respondent to provide truthful answers. Of course, these constraints
affect all survey research: we can never be sure that the thought experiment that a participant
responds to is the same thought experiment we had in mind when we asked a question; and we
cannot adjust for self-awareness or truthful answers. Future work using other questions that
elicit information about depression may help us establish consistency, but even that effort will
have its limitations. Second, the comparison between the DSM diagnosis and our estimate of
treatment also has its limitations. In some instances, the estimates of the percentages being
treated exceed the estimates of persons who had a depressive episode in the past year. This
result could well be correct: a person who has been using medications or other therapy might
not have had a depressive episode in the past year. With these limitations in mind, however,
the results of Table 9 still pose a “half-full or half-empty” kind of question. On the one hand, we
see that large proportions of people that we identify as depressed are not being treated. The
smallest percentage is in South Africa – 25 percent are untreated – but even that percentage is
high in terms of suffering; elsewhere, the percentages are even higher, ranging from about 75 in
Mexico to 92 (Ghana) or 93 (India) percent. On the other hand, as a percentage of the overall
study populations, the percentages of untreated persons are low – ranging from under one
percent in China to just over 7 percent in India – and the percentages of respondents who were
neither depressed according to DSM criteria nor taking medications are high: above 91 percent
in all five countries.
We recognize the difficulties inherent in examining self-assessed health, or indeed any measure
of health, in our analyses: the causal direction is uncertain. As noted by Miller and his
colleagues (2009), depressive symptoms are associated with morbidity and mortality from heart
disease and depression implicated in the occurrence and disease progression of cardiovascular
disease. We cannot sort out the causal direction using an observational study, with one round
of data collection; we cannot even identify which came first, however it is a large and significant
effect, one that we cannot ignore from a clinical perspective. People who are physically ill are
also at risk of depression (or vice versa); it is an important finding that we should consider in
treating both. In reporting self-assessed health, respondents may be integrating multiple
dimensions: physical, psychological, and cognitive. A fruitful area for additional research may
be to explicate the relationship between depression and these various dimensions.
Galen, Aristotle, and the bible all describe instances of depression, but the definitive work,
originally published in 1621, is by Robert Burton – The Anatomy of Melancholy (Burton, 1924).
Replete with footnotes itself, we might reasonably borrow Alfred North Whitehead’s observation
about Plato, and say that all work on depression consists of a series of footnotes to Burton – at
least with regard to the Western tradition. Here we have confined our inquiry to just a few of the
correlates identified by Burton – e.g., poverty, education, age – but we recognize that much
remains to be explored.
There is a broad path laid out for future work. We have already mentioned the need to explicate
the link between the multiple dimensions of health and depression, other areas that we propose
to explore include the characteristics that determine treatment. For example, are there groups
that are at particularly high risk of under-treatment? Our work suggests that persons above age
70, continue to be under-treated, additional analyses may suggest other groups that require
attention. The sex differential in depression appears to be a fairly robust finding, possibly
excepting China and Ghana. Can we dissect the underlying causes? Is there a biological basis
or are there cultural and socioeconomic factors that make women more vulnerable – or more
likely to report and be treated for depression? Finally, we have not as yet exploited the vignette

data. This rich source of information may be an important tool in helping us identify differences
across the countries.
ACKNOWLEDGMENTS
WHO's Study on Global Ageing and Adult Health is supported by the US National Institute on
Aging through an Interagency Agreement with WHO and through the NIH grant 1 R01
AG034479-01A1.
Works Cited American Psychiatric Association. (2000). Diagnostic and statistical manual of mental
disorders (4th ed., text rev.). Washington, DC) Andrade L, Caraveo-Anduaga J, Berglund P, et al. Cross-national comparisons of the
prevalences and correlates of mental disorders. Bulletin of the World Health Organization. 2000; 78: 413-426.
Aneshensel C, Frerichs R, Huba G. Depression and Physical Illness: A multiwave, nonrecursive
causal model. Journal of Health and Social Behavior. 1984; 25: 350-371. Araya R, Lewis G, Rojas G, Fritsch R. Education and income: which is more important for
mental health?. Journal of Epidemiology and Community Health. 2003; 57: 501-505. Burton, R. The Anatomy of Melancholy. Originally published 1621, impression of 1924, New
York Empire State Book Co., Printed in Great Britain. Cole M, Dendukuri N. Risk Factors for Depression Among Elderly Community Subects: A
Systematic Review and Meta-Analysis. The American Journal of Psychiatry. 2003; 160: 1147-1156.
Goldberg D, Huxley P. Common Mental Disorders: A Biosocial Model. London:
Tavistock/Routledge. 1992. Goldman, N. D.A. Glei, Y.H. Lin, and M. Weinstein. 2010. The serotonin transporter
polymorphism (5-HTTLPR), allelic variation and links with depressive symptoms. Depression and Anxiety, 27:260-69.
Guerra M, Ferri C, Sosa A, Salas A, Gaona C, Gonzales V, Rojas de la Torre G, Prince M. Late-
life depression in Peru, Mexico and Venezuela: the 10/66 population-based study. The British Journal of Psychiatry. 2009; 195: 510-515.
Hamad R, Fernald L C H, Karlan D S, Zinman J. Social and economic correlates of depressive symptoms and perceived stress in South African adults. Journal of Epidemiology & Community Health. 2008; 62: 538-544.
Idler E, Benyamini Y. Self-Rated Health and Mortality: A Review of Twenty-Seven community
Studies. Journal of Health and Social Behavior. 1997; 38: 21-37. Ionnanidis, J.P.A.. Why most published research findings are false. PLOS Medicine, 2005:
2(8):696-701- Joe S, Stein D, Seedat S, Herman A, Williams D. Prevalence and correlates of non-fatal suicidal
behaviour among South Africans. The British Journal of Psychiatry. 2008; 192: 310-311. Kessler R, Berglund P, Demler O, Jin R, Koretz D, Merikangas K, Rush A, Walters E, Wang P.
The Epidemiology of Major Depressive Disorder: Results from the National Comorbidity Survey Replication. Journal of the American Medical Association. 2003; 289: 3095-3105.
Kosloski K, Stull D, Kercher K, Van Dussen D. Longitudinal Analysis of the Reciprocal Effects of
Self-Assessed Global health and Depressive Symptoms. Journal of Gerontology. 2005; 60B: 296-303.
Lorant V, Deliege D, Eaton W, Robert A, Philipott P, Ansseau M. Socioeconomic Inequalities in
Depression: A Meta-Analysis. American Journal of Epidemiology. 2003; 157: 98-112. Majodina M. Johnson F.Y. Standardized assessment of depressive disorders (SADD) in Ghana.
British Journal of Psychiatry. 1983; 143: 442-446. Medina-Mora M, Borges G, Benjet C, Lara C, Berglund P. Psychiatric disorders in Mexico:
lifetime prevalence in a nationally representative sample. The British Journal of Psychiatry. 2007; 190: 521-528.
Medina-Mora M, Borges G, Lara C, Benjet C, Blanco J, Fleiz C, Villatoro J, Rojas E, Zambrano
J. Prevalence, service use, and demographic correlates of 12-month DSM-IV psychiatric disorders in Mexico: results from the Mexican National Comorbidity Survey. Psychological Medicine. 2005; 35: 1773-1783.
Miller, G, Chen, E, and Cole SW. Health psychology: developing biologically plausible models
linking the social world and physical health. Annual Review of Psychology 2009:60:501-24.
Mirowski J, Ross C. Control or Defense? Depression and the Sense of Control Over Good and
Bad Outcomes. Journal of Health and Social Behavior. 1990; 31: 71-86. Nolen-Hoeksema S. Sex Differences in Unipolar Depression: Evidence and Theory.
Psychological Bulletin. 1987; 101: 259-282.
Patel V, Kleinman A. Poverty and common mental disorders in developing countries. Bulletin of the World Health Organization. 2003; 81: 609-615.

Phillips M, Zhang J, Shi Q, Song Z, Ding Z, Pang S, Li X, Zhang Y, Wang Z. Prevalence, treatment, and associated disability of mental disorders in four provinces in China during 2001-05: an epidemiological survey. The Lancet. 2009; 373: 2041-2053.
Ross C, Morowski J. Sex Differences in the Effect of Education on Depression: Resource
Multiplication or Resource Substitution?. Social Science and Medicine. 2006; 63: 1400-1413.
Rumble S, Swartz L, Parry C, Zwarenstein M. Prevalence of psychiatric morbidity in the adult
population of a rural South African village. Psychological Medicine. 1996; 26: 997-1007. Shidhaye R, Patel V. Association of socio-economic, gender, and health factors with common
mental disorders in women: a population-based study of 5703 married rural women in India. International Journal of Epidemiology. 2010; 39: 1510-1521.
Stein D, Seedat S, Herman A, Moomal H, Heeringa S, Kessler R, Williams D. Lifetime
prevalence of psychiatric disorders in South Africa. The British Journal of Psychiatry. 2008; 192: 112-117.
Suliman S, Stein D, Myer L, Williams D, Seedat S. Disability and Treatment of Psychiatric and
Physical Disorders in South Africa. The Journal of Nervous and Mental Disease. 2010 Jan; 198.
Sundar M. Suicide in farmers in India. The British Journal of Psychiatry. 1999; 175: 585-586. Taubes, G. and Mann, C.C. Epidemiology faces its limits. 1995;Science 269:164-169. Vega W, Kolody B, Hough R, Figueroa G. Depressive Symptomatology in Northern Mexico
adults. American Journal of Public Health. 1987; 77: 1215-1218. Weissman M, Bland R, Canino G, Faravelli C, Greenwald S, Hwu H, Joyce P, Karam E, Lee C,
Lellouch J, Lepine J, Newman S, Rubio-Stipec M, Wells E, Wickramaratne P, Witchen H, Yeh E. Cross-National Epidemiology of Major Depression and Bipolar Disorder. Journal of the American Medical Association. 1996; 276: 293-299.
World Health Organization, http://www.who.int/healthinfo/systems/sage/en/, accessed 26
February 2011 Williams P, Colder C, Richards M, Scalzo C. The role of self-assessed health in the relationship
between gender and depressive symptoms among adolescents. Journal of Pediatric Psychology. 2002; 27: 509-517.
Yu E, Kean Y, Slymen D, Liu W, Zhang M, Katzman R. Self-perceived health and 5-year
mortality risks among the elderly in Shanghai, China. American Journal of Epidemiology. 1998; 147: 880-890.
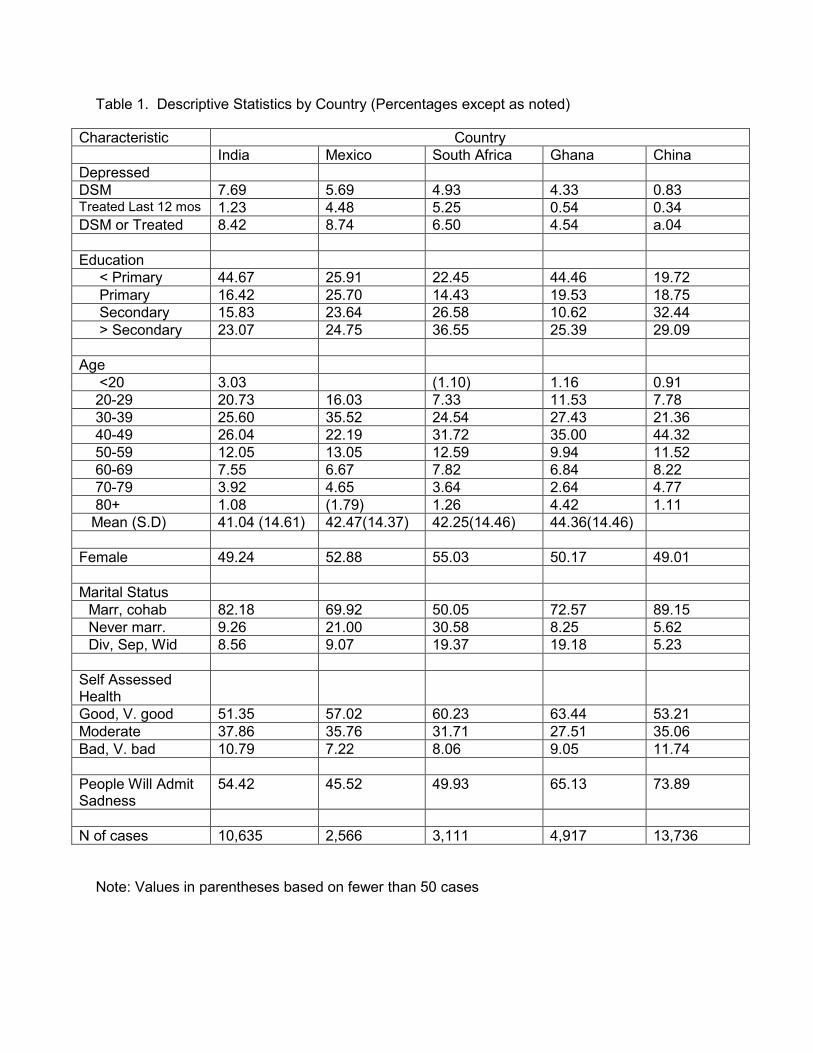
Table 1. Descriptive Statistics by Country (Percentages except as noted)
Note: Values in parentheses based on fewer than 50 cases
Characteristic Country India Mexico South Africa Ghana China Depressed DSM 7.69 5.69 4.93 4.33 0.83 Treated Last 12 mos 1.23 4.48 5.25 0.54 0.34 DSM or Treated 8.42 8.74 6.50 4.54 a.04 Education < Primary 44.67 25.91 22.45 44.46 19.72 Primary 16.42 25.70 14.43 19.53 18.75 Secondary 15.83 23.64 26.58 10.62 32.44 > Secondary 23.07 24.75 36.55 25.39 29.09 Age <20 3.03 (1.10) 1.16 0.91 20-29 20.73 16.03 7.33 11.53 7.78 30-39 25.60 35.52 24.54 27.43 21.36 40-49 26.04 22.19 31.72 35.00 44.32 50-59 12.05 13.05 12.59 9.94 11.52 60-69 7.55 6.67 7.82 6.84 8.22 70-79 3.92 4.65 3.64 2.64 4.77 80+ 1.08 (1.79) 1.26 4.42 1.11 Mean (S.D) 41.04 (14.61) 42.47(14.37) 42.25(14.46) 44.36(14.46) Female 49.24 52.88 55.03 50.17 49.01 Marital Status Marr, cohab 82.18 69.92 50.05 72.57 89.15 Never marr. 9.26 21.00 30.58 8.25 5.62 Div, Sep, Wid 8.56 9.07 19.37 19.18 5.23
Self Assessed Health
Good, V. good 51.35 57.02 60.23 63.44 53.21 Moderate 37.86 35.76 31.71 27.51 35.06 Bad, V. bad 10.79 7.22 8.06 9.05 11.74 People Will Admit Sadness
54.42 45.52 49.93 65.13 73.89
N of cases 10,635 2,566 3,111 4,917 13,736

Tab
le 2
. Per
cent
age
of R
espo
nden
ts D
epre
ssed
(D
SM
Crit
eria
) an
d Per
cent
age
Tre
ated
in L
ast 1
2 M
onth
s by
Age
and
Cou
ntry
C
ount
ry
Age
in C
ompl
eted
Yea
rs
<2
0 20
-29
30-3
9 40
-49
50-5
9 60
-69
70-7
9 80
+ Tot
al
Indi
a N
=10,
635
D
SM
1.
90
4.15
6.
12
7.98
11
.05
13.4
2 14
.43
20.4
3 7.
69
Tre
ated
0.
86
0.59
1.
09
1.48
1.
55
1.50
2.
38
2.02
1.
21
Mex
ico
N=2
,566
DS
M
1.
48
1.77
8.
89
15.0
5 7.
01
7.48
(4
.01)
5.
69
Tre
ated
1.44
0.
85
12.4
0 4.
69
4.73
3.
58
5.51
4.
48
Sou
th A
fric
a N
=3,1
11
D
SM
(7
.84)
0.
02
0.26
12
.59
4.04
2.
02
3.00
(0
.29)
4.
93
Tre
ated
(0
) 0.
0 0.
0 15
.03
2.42
2.
02
0.49
(0
.11)
5.
23
Gha
na N
=4,9
17
D
SM
0.
0 0.
0 3.
43
4.54
5.
01
6.88
9.
02
13.3
2 4.
33
Tre
ated
0.
0 0.
0 0.
43
0.55
0.
58
0.74
0.
71
3.33
0.
53
Chi
na N
=13,
736
D
SM
0.
0 0.
0 0.
64
0.96
0.
96
1.07
1.
08
1.31
0.
83
Tre
ated
0.
0 0.
0 0.
0 0.
63
0.23
0.
20
0.21
0.
15
0.34
N
ote:
Per
cent
ages
in p
aren
thes
es a
re b
ased
on
few
er th
an 5
0 ca
ses.
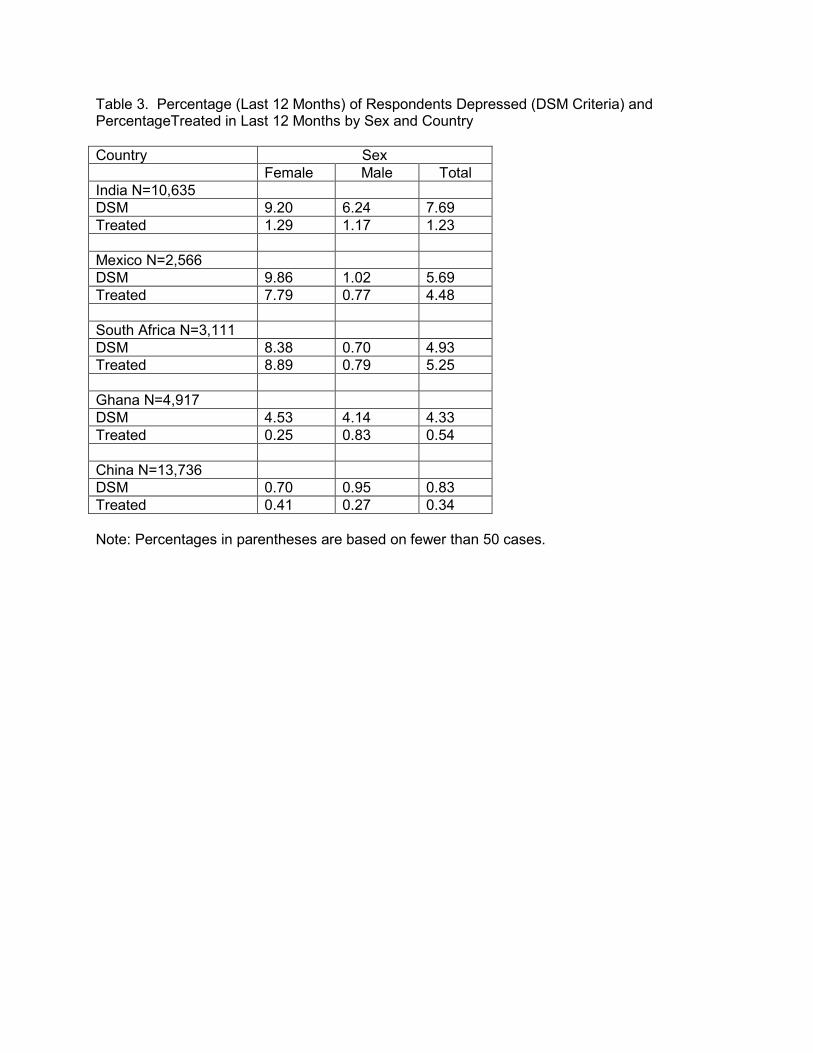
Table 3. Percentage (Last 12 Months) of Respondents Depressed (DSM Criteria) and PercentageTreated in Last 12 Months by Sex and Country Country Sex Female Male Total India N=10,635 DSM 9.20 6.24 7.69 Treated 1.29 1.17 1.23 Mexico N=2,566 DSM 9.86 1.02 5.69 Treated 7.79 0.77 4.48 South Africa N=3,111 DSM 8.38 0.70 4.93 Treated 8.89 0.79 5.25 Ghana N=4,917 DSM 4.53 4.14 4.33 Treated 0.25 0.83 0.54 China N=13,736 DSM 0.70 0.95 0.83 Treated 0.41 0.27 0.34 Note: Percentages in parentheses are based on fewer than 50 cases.

Table 4. Percentage (Last 12 Months) of Respondents Depressed (DSM Criteria) and Percentage Treated in Last 12 Months by Marital Status and Country Country Marital Status Currently
Married or Cohabiting
Never Married
Divorced, Separated, Widowed
Total
India N=10,635 DSM 6.83 4.28 19.65 7.69 Treated 1.15 1.26 1.96 1.23 Mexico N=2,566 DSM 6.29 3.14 7.00 5.69 Treated 4.10 2.89 11.14 4.48 South Africa N=3,111 DSM 0.69 0.94 22.15 4.93 Treated 3.10 0.20 18.77 5.25 Ghana N=4,917 DSM 3.63 2.39 7.83 4.33 Treated 0.59 0.0 0.59 0.54 China N=13,736 DSM 0.73 0.55 2.78 0.83 Treated 0.37 0.0 0.04 0.34 Note: Percentages in parentheses are based on fewer than 50 cases.
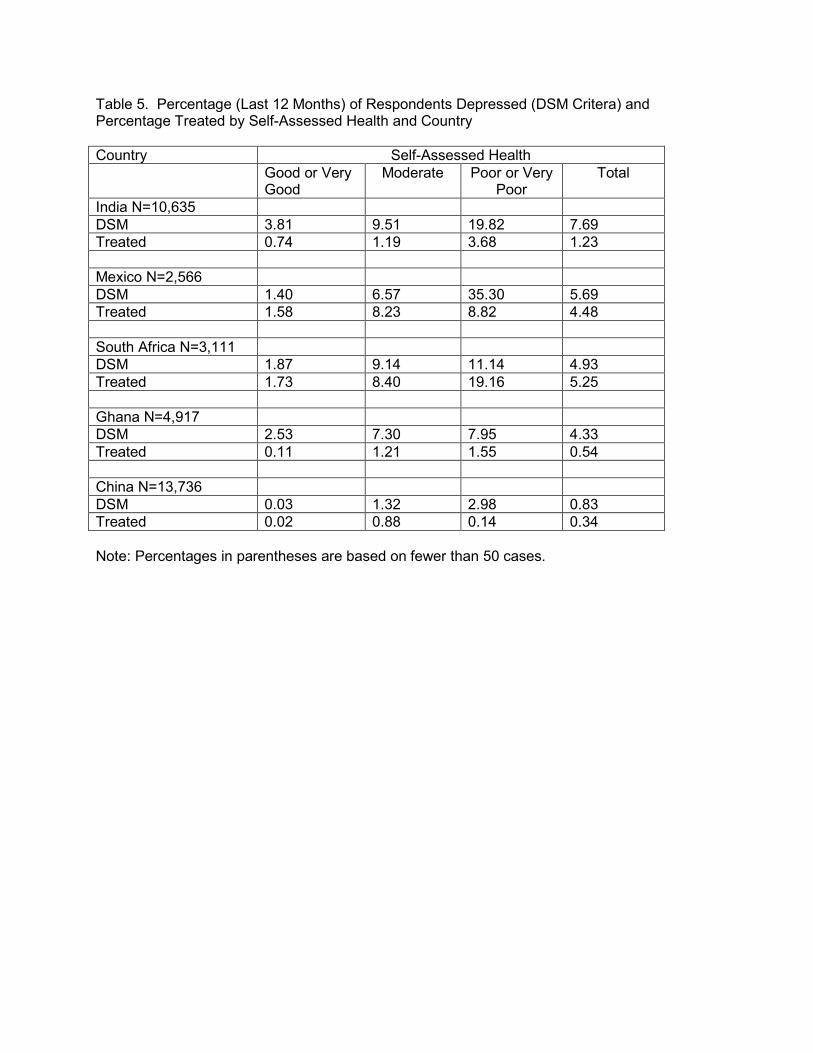
Table 5. Percentage (Last 12 Months) of Respondents Depressed (DSM Critera) and Percentage Treated by Self-Assessed Health and Country Country Self-Assessed Health Good or Very
Good Moderate Poor or Very
Poor Total
India N=10,635 DSM 3.81 9.51 19.82 7.69 Treated 0.74 1.19 3.68 1.23 Mexico N=2,566 DSM 1.40 6.57 35.30 5.69 Treated 1.58 8.23 8.82 4.48 South Africa N=3,111 DSM 1.87 9.14 11.14 4.93 Treated 1.73 8.40 19.16 5.25 Ghana N=4,917 DSM 2.53 7.30 7.95 4.33 Treated 0.11 1.21 1.55 0.54 China N=13,736 DSM 0.03 1.32 2.98 0.83 Treated 0.02 0.88 0.14 0.34 Note: Percentages in parentheses are based on fewer than 50 cases.
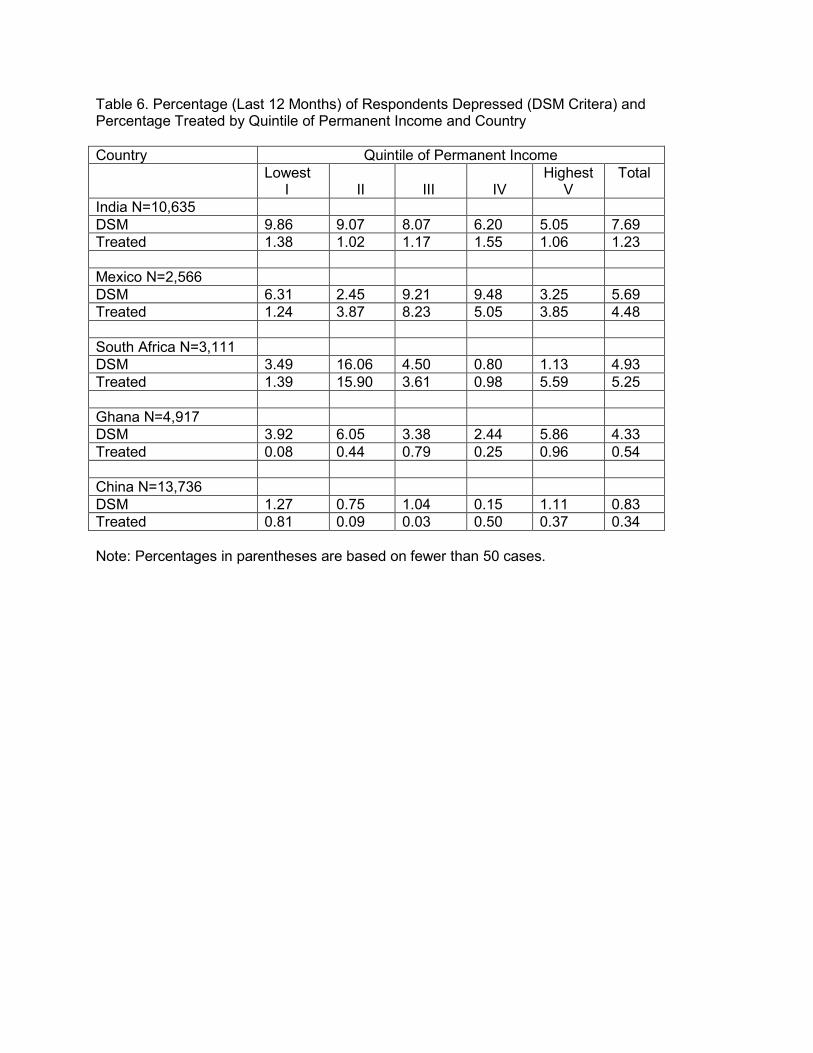
Table 6. Percentage (Last 12 Months) of Respondents Depressed (DSM Critera) and Percentage Treated by Quintile of Permanent Income and Country Country Quintile of Permanent Income Lowest
I II
III
IV
Highest V
Total
India N=10,635 DSM 9.86 9.07 8.07 6.20 5.05 7.69 Treated 1.38 1.02 1.17 1.55 1.06 1.23 Mexico N=2,566 DSM 6.31 2.45 9.21 9.48 3.25 5.69 Treated 1.24 3.87 8.23 5.05 3.85 4.48 South Africa N=3,111 DSM 3.49 16.06 4.50 0.80 1.13 4.93 Treated 1.39 15.90 3.61 0.98 5.59 5.25 Ghana N=4,917 DSM 3.92 6.05 3.38 2.44 5.86 4.33 Treated 0.08 0.44 0.79 0.25 0.96 0.54 China N=13,736 DSM 1.27 0.75 1.04 0.15 1.11 0.83 Treated 0.81 0.09 0.03 0.50 0.37 0.34 Note: Percentages in parentheses are based on fewer than 50 cases.

Table 7. Percentage (Last 12 Months) of Respondents Depressed (DSM Critera) and Percentage Treated by Education and Country Country Education Less than
Primary Primary Secondary More than
Secondary Total
India N=10,635 DSM 10.05 6.95 6.63 4.40 7.69 Treated 1.12 1.80 1.79 0.66 1.23 Mexico N=2,566 DSM 7.91 3.56 7.93 3.45 5.69 Treated 1.94 6.16 4.81 5.10 4.48 South Africa N=3,111 DSM 2.71 6.94 10.82 1.21 4.93 Treated 1.57 6.27 9.56 3.97 5.25 Ghana N=4,917 DSM 4.78 0.74 6.62 5.36 4.33 Treated 0.35 0.79 0.12 0.85 0.54 China N=13,736 DSM 0.98 0.22 1.23 0.67 0.83 Treated 0.92 0.05 0.36 0.10 0.34 Note: Percentages in parentheses are based on fewer than 50 cases.
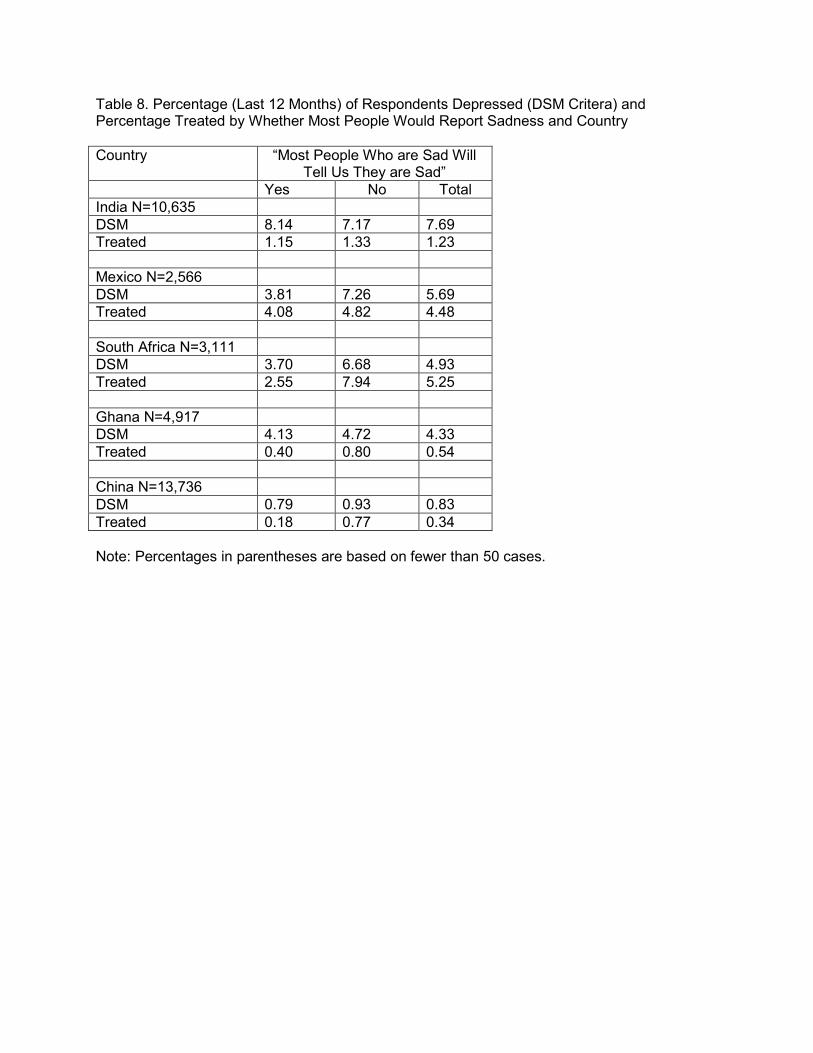
Table 8. Percentage (Last 12 Months) of Respondents Depressed (DSM Critera) and Percentage Treated by Whether Most People Would Report Sadness and Country Country “Most People Who are Sad Will
Tell Us They are Sad” Yes No Total India N=10,635 DSM 8.14 7.17 7.69 Treated 1.15 1.33 1.23 Mexico N=2,566 DSM 3.81 7.26 5.69 Treated 4.08 4.82 4.48 South Africa N=3,111 DSM 3.70 6.68 4.93 Treated 2.55 7.94 5.25 Ghana N=4,917 DSM 4.13 4.72 4.33 Treated 0.40 0.80 0.54 China N=13,736 DSM 0.79 0.93 0.83 Treated 0.18 0.77 0.34 Note: Percentages in parentheses are based on fewer than 50 cases.

Table 9. Percentage of Population Neither Depressed Nor Treated, Percentage of depressed (DSM Criteria) who have not treated, and Untreated depressed as percentage of sample population by Country
1. Persons identified as depressed according to DSM criteria who do not report being treated/Persons identified as depressed according to DSM criteria
2. Persons identified as depressed according to DSM criteria who do not report being treated/Total sample
Country Not Depressed and Not Treated
Percentage of Depressed who are Untreated1
Untreated Depressed as Percentage of Sample
Population2 India 91.59 93.46 7.19 Mexico 91.26 74.75 4.26 South Africa 93.52 25.40 1.25 Ghana 95.47 92.21 4.00 China 98.96 85.51 0.71

Table 10. Results (Coefficients) from Regression of DSM Diagnosis of Depression on Sociodemographic Characteristics by Country
Characteristic Country India Mexico South Africa Ghana China Male -0.35* -2.70*** -1.35* -0.01 0.45 Age (Completed Yrs) 0.02*** 0.05*** -0.02 0.03*** 0.09 Marital Status Currently Married (omitted) Single 0.55 -0.99 -0.55 -0.20 -0.15 Div, Sep, Widowed 0.69*** -1.25* 2.96*** 0.47 1.30 Quintile of Permanent Income Lowest I (omitted) II -0.06 -1.08 1.79** 0.51 -0.33 III -0.17 0.49 0.56 -0.22 -0.02 IV -0.48* 0.42 -0.87 -0.45 -1.95*** Highest V -0.68** -0.83 -0.93 0.32 0.15 Education Less than Primary (omitted) Primary -0.08 -0.37 1.45* -1.49** -1.25** Secondary 0.07 0.98 1.96** 0.85 0.52 More than Secondary -0.17 0.36 0.61 0.37 -0.15 People Would Not Say if Sad -0.19 0.82* 0.01 0.15 0.20 Constant -3.09*** -4.87*** -5.08*** -4.83*** -5.47*** N 10,635 2,566 3,111 4,917 13736 Pseudo-R2 .05 .23 .46 .08 .07 Notes: * p < .05 ** p < .01 *** p < .001

Table 11. Results (Coefficients) from Regression of DSM Diagnosis of Depression on Sociodemographic Characteristics and Self-Assessed Health by Country
Characteristic Country India Mexico South Africa Ghana China Male -0.26 -2.35*** -1.14* 0.06 0.60 Age (Completed Yrs) 0.01** 0.04*** -0.03 0.02** -0.12 Marital Status Currently Married (omitted) Single 0.06 -0.43 -0.55 -0.27 0.27 Div, Sep, Widowed 0.69*** -0.85* 3.21*** 0.41 1.28 Quintile of Permanent Income Lowest I (omitted) II -0.03 -0.97 2.32** 0.53 -0.03 III -0.14 0.30 1.10 -0.22 0.32 IV -.040 0.71 -0.16 -0.41 -1.47** Highest V -.054* -0.46 -0.64 0.38 0.91 Education Less than Primary (omitted) Primary -0.13 -0.28 1.65* -1.54** -1.39* Secondary 0.08 1.07 2.10** 0.75 0.54 More than Secondary -0.07 0.88 0.95 0.35 0.32 Self-Assessed Health Good or Very Good (omitted) Moderate 0.82*** 1.41** 0.51 0.82* 3.94*** Bad or Very Bad 1.50*** 3.19*** 2.07** 0.90 5.17*** People Would Not Say if Sad -0.27* 0.67 0.11 0.82 -0.06 Constant -3.27 -5.91 -5.52 -4.83 -8.53*** N 10,635 2,566 3,111 4,917 13,736 Pseudo R2 .08 .34 .49 .10 .20
Notes: * p < .05 ** p < .01 *** p < .001