Correction: Common Household Chemicals and the Allergy Risks in Pre-School Age Children
10
Common Household Chemicals and the Allergy Risks in Pre-School Age Children Hyunok Choi 1 , Norbert Schmidbauer 2 , Jan Sundell 3 , Mikael Hasselgren 4 , John Spengler 1 , Carl-Gustaf Bornehag 5,6 * 1 Department of Environmental Health, Harvard School of Public Health, Boston, Massachusetts, United States of America, 2 Norwegian Institute for Air Research, Kjeller, Norway, 3 Department of Building Science, School of Architecture, Tsinghua University, Beijing, China, 4 Primary Care Research Unit, County Council of Varmland, Karlstad, Sweden, 5 Public Health Sciences, Karlstad University, Karlstad, Sweden, 6 SP Technical Research Institute of Sweden, Boras, Sweden Abstract Background: The risk of indoor exposure to volatile organic compounds (VOCs) on allergic airway diseases in children remains unknown. Objective: We examined the residential concentrations of VOCs, emitted from building materials, paints, furniture, and other lifestyle practices and the risks of multiple allergic diseases as well as the IgE-sensitization in pre-school age children in Sweden. Methods: In a case-control investigation (198 case children with asthma and allergy and 202 healthy controls), air samples were collected in the room where the child slept. The air samples were analyzed for the levels of eight classes of VOCs. Results: A natural-log unit of summed propylene glycol and glycol ethers (PGEs) in bedroom air (equal to interquartile range, or 3.43 – 15.65 mg/m 3 ) was associated with 1.5-fold greater likelihood of being a case (95% CI, 1.1 – 2.1), 1.5-fold greater likelihood of asthma (95% CI, 1.0 – 2.3), 2.8-fold greater likelihood of rhinitis (95% CI, 1.6 – 4.7), and 1.6-fold greater likelihood of eczema (95% CI, 1.1 – 2.3), accounting for gender, secondhand smoke, allergies in both parents, wet cleaning with chemical agents, construction period of the building, limonene, cat and dog allergens, butyl benzyl phthalate (BBzP), and di(2-ethylhexyl)phthalate (DEHP). When the analysis was restricted to the cases, the same unit concentration was associated with 1.8-fold greater likelihood of IgE-sensitization (95% CI, 1.1 – 2.8) compared to the non-IgE sensitized cases. No similar associations were found for the other classes of VOCs. Conclusion: We propose a novel hypothesis that PGEs in indoor air exacerbate and/or induce the multiple allergic symptoms, asthma, rhinitis and eczema, as well as IgE sensitization respectively. Citation: Choi H, Schmidbauer N, Sundell J, Hasselgren M, Spengler J, et al. (2010) Common Household Chemicals and the Allergy Risks in Pre-School Age Children. PLoS ONE 5(10): e13423. doi:10.1371/journal.pone.0013423 Editor: Dominik Hartl, Ludwig-Maximilians-Universita ¨t Mu ¨ nchen, Germany Received June 19, 2010; Accepted September 14, 2010; Published October 18, 2010 Copyright: ß 2010 Choi et al. This is an open-access article distributed under the terms of the Creative Commons Attribution License, which permits unrestricted use, distribution, and reproduction in any medium, provided the original author and source are credited. Funding: The study has been supported by the Swedish Research Council for Environment, Agricultural Sciences and Spatial Planning (Formas), Swedish Asthma and Allergy Association’s Research Foundation, the Swedish Foundation for Health Care Sciences and Allergy Research, Norwegian Research Council, the U.S. National Research Service Award (T32 ES 07069), and County Council of Va ¨rmland, Sweden. The funders had no role in study design, data collection and analysis, decision to publish, or preparation of the manuscript. Competing Interests: The authors have declared that no competing interests exist. * E-mail: [email protected] Introduction Global trend in prevalence of allergic airway disease and other types of allergies in children and young adults appears to be stabilizing or even decreasing since the 1990s in ‘‘western’’ countries [1]. However, a substantial portion of the population, especially the children, suffers from these diseases which make it a public health concern. Causal factors underlying these diseases and other contributors of global trend in prevalence since the 1970s remain unknown [2]. This is further highlighted by a growing consensus that genetic predisposing factors do not adequately account for such rapid shift in global prevalence [2]. An emerging body of evidence suggests that environmental conditions during early life are important. In particular, early- life exposure to chemicals commonly found at home, and their possible roles in allergic airway disease, allergic asthma, and rhinitis are speculated [3,4,5,6]. Global secular trend in asthma and the allergy disease prevalence draw a parallel with vast shift in diet, lifestyle, and consumer product uses within the western societies since the World War II [7]. Enormous quantity and array of chemical compounds have been introduced in the societies which adopted western lifestyles [8]. Consumer products, such as computer, TV, and synthetic building materials, including artificial carpets, composite wood, polyvinyl chloride (PVC) flooring, foam cushions, and PVC pipes emit an array of volatile organic compounds (VOCs), semi-volatile organic compounds (sVOCs) and non- organic compounds [8]. VOCs, which predominantly exist in the vapor phase in the atmosphere, and sVOCs, which exist in both vapor and condensed phase, redistribute to indoor surfaces and PLoS ONE | www.plosone.org 1 October 2010 | Volume 5 | Issue 10 | e13423
Transcript of Correction: Common Household Chemicals and the Allergy Risks in Pre-School Age Children

Common Household Chemicals and the Allergy Risks inPre-School Age ChildrenHyunok Choi1, Norbert Schmidbauer2, Jan Sundell3, Mikael Hasselgren4, John Spengler1, Carl-Gustaf
Bornehag5,6*
1 Department of Environmental Health, Harvard School of Public Health, Boston, Massachusetts, United States of America, 2 Norwegian Institute for Air Research, Kjeller,
Norway, 3 Department of Building Science, School of Architecture, Tsinghua University, Beijing, China, 4 Primary Care Research Unit, County Council of Varmland, Karlstad,
Sweden, 5 Public Health Sciences, Karlstad University, Karlstad, Sweden, 6 SP Technical Research Institute of Sweden, Boras, Sweden
Abstract
Background: The risk of indoor exposure to volatile organic compounds (VOCs) on allergic airway diseases in childrenremains unknown.
Objective: We examined the residential concentrations of VOCs, emitted from building materials, paints, furniture, andother lifestyle practices and the risks of multiple allergic diseases as well as the IgE-sensitization in pre-school age children inSweden.
Methods: In a case-control investigation (198 case children with asthma and allergy and 202 healthy controls), air sampleswere collected in the room where the child slept. The air samples were analyzed for the levels of eight classes of VOCs.
Results: A natural-log unit of summed propylene glycol and glycol ethers (PGEs) in bedroom air (equal to interquartilerange, or 3.43 – 15.65 mg/m3) was associated with 1.5-fold greater likelihood of being a case (95% CI, 1.1 – 2.1), 1.5-foldgreater likelihood of asthma (95% CI, 1.0 – 2.3), 2.8-fold greater likelihood of rhinitis (95% CI, 1.6 – 4.7), and 1.6-fold greaterlikelihood of eczema (95% CI, 1.1 – 2.3), accounting for gender, secondhand smoke, allergies in both parents, wet cleaningwith chemical agents, construction period of the building, limonene, cat and dog allergens, butyl benzyl phthalate (BBzP),and di(2-ethylhexyl)phthalate (DEHP). When the analysis was restricted to the cases, the same unit concentration wasassociated with 1.8-fold greater likelihood of IgE-sensitization (95% CI, 1.1 – 2.8) compared to the non-IgE sensitized cases.No similar associations were found for the other classes of VOCs.
Conclusion: We propose a novel hypothesis that PGEs in indoor air exacerbate and/or induce the multiple allergicsymptoms, asthma, rhinitis and eczema, as well as IgE sensitization respectively.
Citation: Choi H, Schmidbauer N, Sundell J, Hasselgren M, Spengler J, et al. (2010) Common Household Chemicals and the Allergy Risks in Pre-School AgeChildren. PLoS ONE 5(10): e13423. doi:10.1371/journal.pone.0013423
Editor: Dominik Hartl, Ludwig-Maximilians-Universitat Munchen, Germany
Received June 19, 2010; Accepted September 14, 2010; Published October 18, 2010
Copyright: � 2010 Choi et al. This is an open-access article distributed under the terms of the Creative Commons Attribution License, which permits unrestricteduse, distribution, and reproduction in any medium, provided the original author and source are credited.
Funding: The study has been supported by the Swedish Research Council for Environment, Agricultural Sciences and Spatial Planning (Formas), Swedish Asthmaand Allergy Association’s Research Foundation, the Swedish Foundation for Health Care Sciences and Allergy Research, Norwegian Research Council, the U.S.National Research Service Award (T32 ES 07069), and County Council of Varmland, Sweden. The funders had no role in study design, data collection and analysis,decision to publish, or preparation of the manuscript.
Competing Interests: The authors have declared that no competing interests exist.
* E-mail: [email protected]
Introduction
Global trend in prevalence of allergic airway disease and other
types of allergies in children and young adults appears to be
stabilizing or even decreasing since the 1990s in ‘‘western’’
countries [1]. However, a substantial portion of the population,
especially the children, suffers from these diseases which make it a
public health concern. Causal factors underlying these diseases
and other contributors of global trend in prevalence since the
1970s remain unknown [2]. This is further highlighted by a
growing consensus that genetic predisposing factors do not
adequately account for such rapid shift in global prevalence [2].
An emerging body of evidence suggests that environmental
conditions during early life are important. In particular, early-
life exposure to chemicals commonly found at home, and their
possible roles in allergic airway disease, allergic asthma, and
rhinitis are speculated [3,4,5,6].
Global secular trend in asthma and the allergy disease
prevalence draw a parallel with vast shift in diet, lifestyle, and
consumer product uses within the western societies since the
World War II [7]. Enormous quantity and array of chemical
compounds have been introduced in the societies which adopted
western lifestyles [8]. Consumer products, such as computer, TV,
and synthetic building materials, including artificial carpets,
composite wood, polyvinyl chloride (PVC) flooring, foam cushions,
and PVC pipes emit an array of volatile organic compounds
(VOCs), semi-volatile organic compounds (sVOCs) and non-
organic compounds [8]. VOCs, which predominantly exist in the
vapor phase in the atmosphere, and sVOCs, which exist in both
vapor and condensed phase, redistribute to indoor surfaces and
PLoS ONE | www.plosone.org 1 October 2010 | Volume 5 | Issue 10 | e13423

may persist from several months to years [8]. Both adults and
children spend an estimated .90% of daily hours in indoor setting
[9]. In addition, energy conservation measures for buildings have
led to reduced air exchange rates and promotion of indoor
moisture buildup [7,9].
In infants and children, the role of indoor VOCs as allergens,
adjuvants, or mere correlates in development of allergic asthma,
and rhinitis remains an open question [6]. Two recent reviews of
the literature identified indoor residential chemicals, emitted from
particle board, plastic materials, recent painting, home cleaning
agents, air freshener, pesticide, and insecticide, consistently
increase the risks of multiple allergic symptoms and asthma-like
symptoms [10,11]. However, these studies were limited by small
sample sizes, measurement of the complex VOC mixture in terms
of the total concentration, and presumption of personal exposure
based on the identification of emission related-material or the
human activities [11]. Nevertheless, the authors concluded that
these epidemiologic studies overall point to a new class of little
recognized residential chemical risk factors [11].
In our on-going investigation of the indoor environment and
pediatric asthma and allergies, we speculated a priori that some
constituents of modern organic solvents, which are present, for
example, in paints, adhesives, coating agent and cleaning agents as
well as other household products/articles, contribute to the asthma
and/or allergy diseases. In order to examine complex VOC
mixture at low concentration range, we examined the risks of eight
classes of VOCs, defined in terms of their chemical properties.
Risk of exposure to eight respective VOC classes on multiple
allergy diseases and asthma diagnosis was investigated.
Methods
The present study is part of the on-going Dampness in Buildings
and Health (DBH) study which started 2000. At baseline, a
modified International Study of Asthma and Allergies in
Childhood (ISAAC) questionnaire was given to the parents of all
14,077 children, between the ages 1 – 5, in the county of
Varmland, Sweden, cross-sectionally. Responses for 10,851
children were received (response rate, 79%) [12].
One and a half year after the baseline, a follow up questionnaire
was sent to the families of 1,056 potential case children (9.7% of
the total population). Target population was the children reporting
at least two symptoms of wheezing, rhinitis and eczema in both
questionnaires. Also, we randomly identified 1,100 symptom free
children (representing 48.9% of the population) from local primary
care clinics. This resulted in 198 cases and 202 controls.
A medical examination of the 400 children (3–8 years of age)
was performed by a team of physicians and nurses during the
winter (November, 2001 – March, 2002), simultaneously with
home inspections and sample collection.
A case was defined as a child, whose parent reported at least two
symptoms of wheezing, rhinitis, or eczema without a cold, during
the preceding 12 months on both the baseline and the follow-up
questionnaire. Additional outcomes included asthma, rhinitis and
eczema. Respective disease status required physician diagnosis in
addition to parent-reported persistent symptoms. Diagnostic
criteria for current asthma included a combination of (a) three
episodes of wheezing prior to age 2; (b) first wheezing episode after
the age 2; (c) the first episode of wheezing in a child who also
suffers from other atopic diseases; (d) asthma medication use; and
(e) an earlier clinical diagnosis of asthma [13]. Lung function test
was not performed. Rhinitis case definition required: (a) ever
having allergic rhinitis symptoms; (b) symptoms presentation in the
nose and/or eyes following the contact with furred animals or
pollen; (c) present use of rhinitis medicine. Eczema case definition
required at least six months of remitting itching and redness over
typical body locations. All children with asthma also met the
definition of the case. Among the controls, two children were
diagnosed with rhinitis and eight were diagnosed with eczema.
Thirteen additional cases were found among the controls. In the
present analyses, the 23 misclassified children were excluded from
further analysis. The definition of the control status required
absence of symptoms without a cold within a year in both rounds
of questionnaires. Both cases and controls were excluded if their
homes were renovated due to the moisture problems or if they had
changed residence since the first questionnaire.
The IgE sensitisation status (yes vs. no) of the child was
determined by screening all available children’s blood sample
(n = 387) for 10 airborne allergens (PhadiatopH, Pharmacia &
Upjohn Diagnostics, Uppsala, Sweden); timothy, mugwort, birch,
cat, horse, dog, house dust mites (D. pteronyssinus and D. farinae), and
two moulds (Penicillium, Cladosporium). Cut-off value of 1.2 kUA/l
was used to define IgE-positive status.
Informed consent was obtained from all parents. The regional
ethics committee at the university hospital in Orebro approved the
study.
Exposure measurements in the homesSix professional building examiners collected air and dust
samples in the room where the child most often slept [14].
Inspectors were blind to the disease status (case vs. control) of the
children.
VOC sampling. Air samplers were placed 1 meter above the
floor in the room. A SKC pocket pump (SKC Pocket Pump 210-
1002, SKC Blandford, Dorset, UK) drew in air at 80 ml/min for
60 to 90 minutes (5 to 8 liters) through a Perkin Elmer adsorption
tubes (glass, 300 mg Tenax TA). The tubes were sealed with PTFE
stoppers, wrapped in alumina foil and kept at 220uC until they
were shipped to the Institute for Air Research, Norway for analysis
within two weeks of collection. Prior to use the Tenax tubes were
cleaned using thermo-desorption at 275uC for 15 minutes for three
consecutive cleaning cycles. Use of adsorbent, preparation of
adsorbent tubes, sampling equipment, sampling flow and safe-
sampling volumes, analytical methods and analytical equipment
followed international standards on ambient air quality DIN EN
14662-1 (DIN ISO 5725-2 and 3). There is no standard procedure
for VOC sampling and analysis for indoor air, but the chosen
method is widely accepted for its reliability [15].
Tenax TA for indoor air analysis is well established with inter-
laboratory differences reported to be ,10% for benzene analysis
(DIN EN 14662-1 annex H2). The temporal stability of
compounds trapped on Tenax TA and the formation of artifacts
from degradation of the adsorbent Tenax TA is widely discussed
in literature [16,17,18] – the main degradation products are
known as Benzaldehyde, Acetophenone and Benzoic acid and to a
minor extent Benzene, Toluene and Xylenes. Other artifacts
include aldehydes (Hexanal, Heptanal, Octanal, Nonanal, De-
canal), created due to the reactions of ozone from the sample air
and fatty acids. All those compounds are also common gases in
indoor air. The blank values of those compounds are small
compared to the amount of those gases in indoor air with a sample
size of more than 5 liter. Due to the chemical structure of Tenax
TA (2,6 – diphenylene based polymer), formation of glycol ethers
as artifact from Tenax TA is very unlikely and has never been
reported.
Laboratory Analysis. The VOC samples were analyzed
using an automated thermo desorption unit (Perkin Elmer ATD
400, PerkinElmer Inc., Waltham, MA, USA) followed by GC-MS
Glycol Ethers and Allergies
PLoS ONE | www.plosone.org 2 October 2010 | Volume 5 | Issue 10 | e13423

[16,17,18]. The samples were desorbed at 250uC - refocused on a
Tenax TA cold trap held at minus 30uC and transferred to the
GC-MS at 225uC. A Hewlett Packard G 1800 A GC-MS was used
as detector maintained at 250uC. The separation column (DB-
1701, 32 m length, 1 mm film, 0.32 mm id) was programmed from
40uC to 250uC. The mass range of the detector was from mass 33
to mass 350.
Detection and identification. From the Total Ion
Chromatogram, the 50 peaks with the largest area were used for
further identification routines [16,17,18]. An automated mass
spectra library check (Wiley) was giving the first preliminary
identification results. Each of the library suggestions for
component identification were then again cross checked against
Norwegian Institute for Airway Research (NILU) ’s database for
indoor air pollutants which contains about 1,000 components. The
database contains retention time indexes from compounds which
were identified in indoor air samples at NILU on exact the same
analytical system over the last 20 years. Most of the compounds
within this database have been verified by direct injection of pure
standard solutions or mixed standard solutions. The criteria for
identification were over 80% confidence match from the mass
spectra library and a match to the retention time database within 5
seconds of relative retention together with a manual check of the
retrieved mass spectrogram against the library mass spectrogram.
If a peak did not meet those criteria it was named as ‘‘unidentified
compound’’. In every sample the 50 compounds with the highest
concentrations were reported as Toluene-equivalents. In addition,
the number of all compounds within each sample with a
concentration above a baseline-threshold of 0.1 ppb (usually
between 180 and 250 compounds) and the concentration-sum of
all those compounds were reported [16,17,18].
Calibration. The calibration was based on toluene
equivalents [16,17,18]. Ten samples were run together with two
standard injections before and after each series. Internal standards
consisted of a solution containing 100 ng/ml of benzene, toluene,
ethylbenzene and xylenes in methanol [16,17,18]. Standard
Tenax tubes were prepared by syringe onto the adsorbent
followed by 5 minutes of dry nitrogen (20ml).
Statistical analysisDetected compounds were grouped into eight classes based on
their chemical properties. All eight classes of compounds were
natural log (ln) – transformed, considering their right skewed
distributions and varying standard deviations (all Komogorov-
Smirnov tests .0.05).
We considered whether the quantification of only the 50 most
abundant compounds in all homes could have misclassified
exposure to PGEs, and might have biased our estimates toward
the null. To explore this, we speculated that the variance of the
unquantified PGEs would be high, if the variance of the minimum
detected concentration of the 405 compounds were high among
the 381 samples. The range (0.33 – 11.24 mg/m3) and the variance
(2.31 mg/m3) of the minimum concentration of the 50th compound
were both very low. Overall, the prevalence of the 405 compounds
were positively correlated with their concentrations (linear
regression coefficient = 0.73, Figure S1). For example, the
variances of limonene (found in 99% of homes) and texanol A
(found in 9% of homes) were 211 mg/m3 and 46 mg/m3,
respectively. Similarly, eight most prevalent PGEs (detected in
165 to 16 homes) were also more likely to have the lowest
concentrations range for their minimum value (0.52 – 2.26 mg/
m3), compared to the range of the minimum values (1.42 –
8.29 mg/m3) for least prevalent PGEs (detected in 1 to 11 homes).
Greater likelihood of detecting and quantifying the compounds
with low concentration suggest that the unknown PGE concen-
trations would be very low or absent, supporting the attribution of
1.11 mg/m3 as a conservative estimate.
The geometric mean concentration of the specific PGEs were
compared among the control vs. four outcome groups using
Mann-Whitney’s U test (a = 0.05). In addition, dose-response in
effect sizes was examined per quartile increase in bedroom VOC
concentrations in air. To further rule out chance finding from
multiple comparisons, we examined the association with a
clinician diagnosis-free outcome, IgE-sensitization status. While
IgE-sensitized controls would have made an ideal reference group,
their limited size (n = 23, 11%) did not allow comparison with the
sensitized cases (n = 92, 46%). In the resulting case-only analysis,
non-sensitized cases were considered a reference group.
The initial model with all potential confounders was reduced
through hierarchical backward elimination strategy [19]. In the final
model, we controlled for the clinically relevant risk factors regardless
of their statistical association (i.e. gender, secondhand smoke exposure
at home, allergic disease in both parents), and those factors correlated
with both the bedroom concentration and the outcomes. In addition,
we adjusted for the phthalate concentration in the bedroom dust,
based on our earlier finding of a significant association [20].
Results
Demographic traits of the cases and controls are shown
(Table 1). Other residential characteristics of the children have
been described elsewhere [20,21]. Distribution patterns of the
eight classes of VOC are shown (Table 2). The geometric mean
and the median concentration of the least common VOCs (i.e.
texanols) were about 10-times lower than those for the most
prevalent compounds, aromatic hydrocarbons. However, the
geometric standard deviations of the most and the least common
compounds were very similar, indicating an overall low variability
of the concentrations. The number of the detected PGE
compounds in given home was highly correlated to the mean
concentration (Pearson’s coefficient = 0.58, p,0.001). Mean PGE
concentration in the homes with 1, 2, 4, and 6 detected
compounds were 6.6168.37, 12.6969.71, 20.0868.67, and
71.74614.41 mg/m3, respectively.
Relationship to asthma and allergyMean bedroom concentrations of PGEs, but no other classes of
VOC, was significantly higher among the cases (9.11 mg/m3, 95%
CI, 7.64 – 10.87 mg/m3) compared to the controls (5.91 mg/m3,
95% CI, 4.97 – 7.04 mg/m3) (P = 0.001) (Figure 1). In particular, the
geometric mean PGEs for the children with rhinitis (11.29 mg/m3,
95% CI, 9.09 – 14.02 mg/m3) were two-fold higher than that in the
controls Geometric mean of the individual PGE compounds and
Texanol B were consistently higher in the homes of the cases,
asthma-, rhinitis- and eczema-diagnosed children, respectively,
compared to those in the control homes (Table 3).
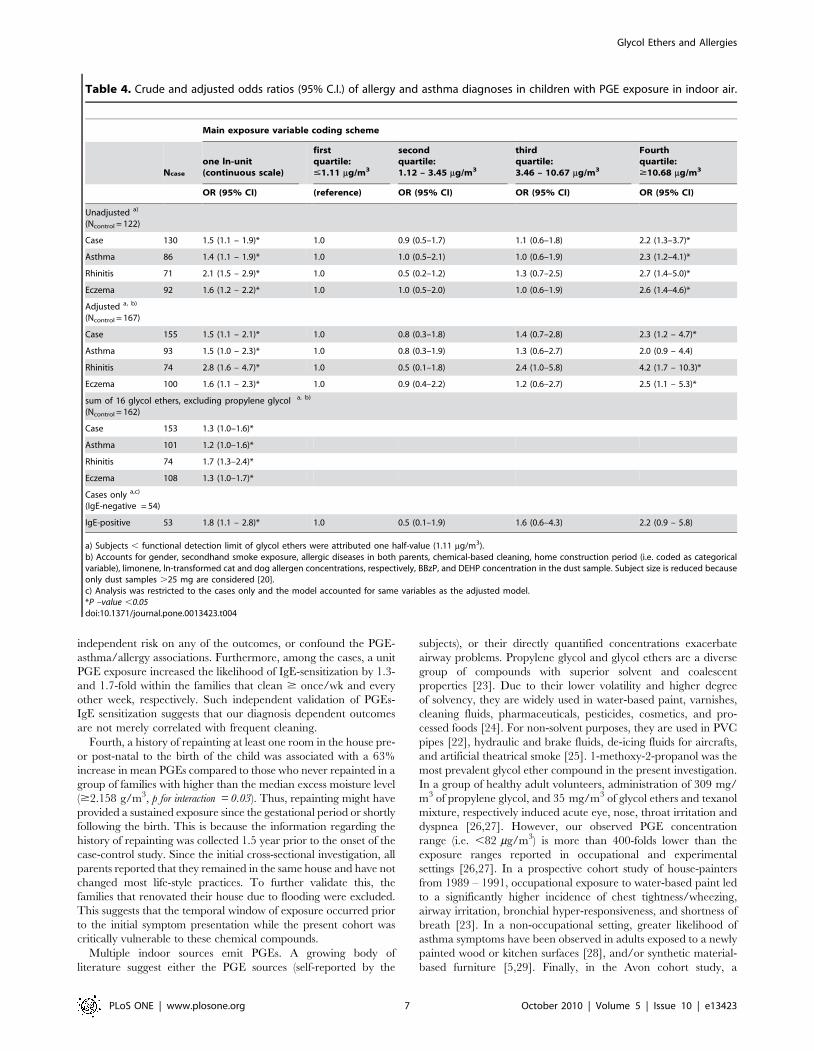
A ln-unit increase in PGE concentrations (approximately equal
to interquartile range, or 3.43 – 15.65 mg/m3) was associated with
a significantly greater likelihood of being a case as well as having
asthma, rhinitis and eczema diagnosis, respectively, controlling for
the gender, secondhand smoke exposure, allergic diseases in both
parents, chemical-based cleaning, home construction period (i.e.
coded as categorical variable), limonene, ln-transformed cat and
dog allergen concentrations, respectively, BBzP, and DEHP
concentration in the dust sample (Table 4). In particular, a ln-
unit PGEs in air was associated with a 3-times greater likelihood of
rhinitis diagnosis (95% CI, 1.6 – 4.7). When the exposure was
coded as quartile categories, mean risks of all four outcomes
Glycol Ethers and Allergies
PLoS ONE | www.plosone.org 3 October 2010 | Volume 5 | Issue 10 | e13423

increased dose-responsively, despite that significant risk was
observed only for the highest exposure category ($10.68 mg/m3)
(Table 4).
Geometric mean PGE concentration of the IgE-positive cases
was significantly higher than that for the IgE-negative cases
(P,0.001, Figure 2). Also, the prevalence of IgE-positive case
status increased in dose-responsive manner per quartile PGE
exposure unit (Figure 3) in the sample restricted to the cases only.
There was no relationship between IgE-sensitization and other
compound classes. In the model adjusting for the same set of
confounders as above, a ln-unit PGE concentration was associated
with a significant, two-fold increase in the likelihood of IgE-
sensitization whether the PGEs were coded in a continuous scale
(95% CI, 1.2 – 3.0), or comparing highest to the lowest quartile
categories (95% CI, 0.9 – 5.2) (see Table 4). In the analysis
restricted to the eczema-diagnosed children with similar level of
skin lotion use, geometric mean PGEs were significantly higher
among sensitized eczema-diagnosed children compared to non-
sensitized children (3.59 vs. 2.47 mg/m3, p = 0.020).
Finally, Texanol B level was significantly higher among the IgE-
sensitized cases (n = 24; GM 6 GSD, 5.6162.78 mg/m3) com-
pared to the non-sensitized cases (n = 24; 2.2362.78 mg/m3;
Table 1. Demographic traits of the cases and the controls.
Control (n = 202) Case (n = 198)
BMI [mean ± SD] 16 ± 2 17 ± 2
Age
2 1 0% 0 0%
3 41 20% 35 18%
4 32 16% 42 21%
5 44 22% 45 23%
6 36 18% 40 20%
7 45 22% 32 16%
8 3 1% 4 2%
Gender [female] 88 44% 85 43%
ETS exposure at home [yes] 30 15% 40 21%
History of allergic diseases in both parents [yes] 14 7% 50** 25%
Type of building
Single family house 172 85% 161 81%
Two-family house 11 5% 12 6%
Multifamily house 19 9% 25 13%
Construction period
Before1960 99 50% 77 41%
1961–1985 68 34% 93 50%
After 1985 31 16% 17 9%
Water leakage during last years [yes] 41 22% 52 29%
doi:10.1371/journal.pone.0013423.t001
Table 2. Distribution of the indoor air concentration of VOC classes (mg/m3) in 381 homesa.
N% , functionaldetection limit b
Geometricmean ± G.S.D. Minimum 25th pctile median 75th pctile Maximum
aromatic hydrocarbons 381 0 41.4762.53 2.25 21.76 42.76 78.12 458.70
alkanes 381 0 27.8962.23 3.21 15.33 27.50 48.18 225.70
organic acids 364 4 12.7861.87 1.23 8.84 13.78 19.92 57.63
aldehydes 330 13 4.7161.61 0.87 3.53 4.59 6.33 20.69
methyl-alkanes c 288 24 8.6863.10 0.48 4.22 8.78 17.38 115.85
propylene glycol & glycol ethersd 262 31 7.2562.78 0.46 3.39 7.63 15.60 81.93
dimethyl-alkanes c 124 67 6.1062.60 0.73 3.08 5.94 11.71 57.99
texanol A+B 95 75 4.3363.16 0.47 1.83 3.38 11.11 68.69
a) 381 homes due to 9 missing samples and 10 pairs of sibling.b) Functional detection limit is based on K value of the median (1.11 mg/m3) of 50th in peak area compound (See Methods).c) Two samples .5-fold S.D. are eliminated due to likely contamination during air sampling.d) Includes 1,2-propanediol (CAS # 57-55-6) and 16 glycol ethers shown in Table 3.doi:10.1371/journal.pone.0013423.t002
Glycol Ethers and Allergies
PLoS ONE | www.plosone.org 4 October 2010 | Volume 5 | Issue 10 | e13423

p = 0.001). But, Texanol A was not found in sufficient number of
homes to allow a meaningful comparison (n = 27).
Considering that propylene glycol was the most common PGEs,
we also examined whether the apparent risks were driven by this
compound. A ln-unit propylene glycol concentration was associ-
ated with a significantly elevated likelihood of the case status (aOR
= 1.5, 95% CI, 1.0–2.3), asthma (aOR = 2.1, 95% CI, 1.2–3.6),
rhinitis (aOR = 2.4, 95% CI, 1.2–4.6), but, not eczema (aOR
= 1.4, 95% CI, 0.8–2.3) compared to the control children,
controlling for the same set of confounders as before. When the
main exposure variable was alternatively defined as the sum of 16
glycol ethers, excluding propylene glycol, the likelihood of the four
respective outcomes were essentially very similar to those posed by
sum of 17 glycol ethers including propylene glycol (Table 4). When
restricted to the cases only, a ln-unit exposure of the summed 16
glycol ether compounds was associated with a 1.4-fold greater
likelihood of IgE-sensitization (95% CI, 1.0 – 1.90).
Potential confoundersSelf-reported cleaning $ once/week and history of allergic
diseases in both parents remained significant predictors of all
outcomes in the final multivariate model. As the mean PGE
concentration was higher for those who wet-clean frequently, and
has also been shown to pose an independent risk, wet-cleaning
could have confounded the apparent associations. To examine
this, same logistic regression analysis was conducted by stratifying
the data according to the wet cleaning frequency. The adjusted
likelihoods of all outcome were not different by .30% for the
frequent cleaners ($ once/week), compared to the reference group
(clean , once/month), or the overall aORs. Furthermore,
limonene, a marker compound of the chemical-based cleaning
agent, was neither an independent risk factor, nor a confounder in
the final model.
We have earlier reported that the concentration of di(2-
ethylhexyl)phthalate (DEHP) and n-butyl benzyl phthalate (BBzP),
respectively, in the indoor dust significantly increase the risks of
allergic symptoms in children from the same data set [20]. In the
present analyses, the phthalate concentration did not affect the
estimated PGE risks, suggesting that they are unlikely to have
confounded the associations. BBzP remained an independent risk
factor of the rhinitis (aOR = 1.8; 95% CI, 1.1 – 3.0) after
accounting for the effect of the PGEs. Also, in the adjusted model,
the risk of DEHP on asthma remained considerably high (aOR
= 1.7 for highest quartile category; 95% CI, 0.7 – 4.0).
Discussion
Goal of the present analysis was to investigate the independent
risks of each class of VOCs at home, controlling for the known and
potential demographic correlates of both the bedroom VOC
concentrations and the outcomes. In the present group of children,
only PGEs in indoor air significantly increased the risks of multiple
allergic symptoms/diseases (i.e. case status), asthma, rhinitis and
eczema, respectively. In addition, a ln-unit PGE concentrations
also increased the likelihood of IgE-sensitization among the cases
while similar associations were not found for the other VOC
classes. At the same time, roles of Texanol A and B require further
examination due to their moderate correlation with the PGE
levels, and demonstrated risks on asthma symptoms in prior
investigations [22].
Several lines of evidence support that our findings are not due to
a chance or a bias. First, concentration-dependent increases in the
Figure 1. Geometric mean (95% CI) (mg/m3) of each VOC classes and compounds for the cases and the controls. PGEs sum of propyleneglycol and glycol ethers. * p = 0.001 compared to the controls.doi:10.1371/journal.pone.0013423.g001
Glycol Ethers and Allergies
PLoS ONE | www.plosone.org 5 October 2010 | Volume 5 | Issue 10 | e13423

likelihood for all outcomes were observed per ln-unit concentra-
tion, or per quartile categories.
Second, apparently elevated likelihood of the present outcomes
was not driven by propylene glycol, most abundant PGE
compound. Rather, the estimated risks after excluding the
propylene glycol were almost identical as those based on the
original definition of the PGEs. Furthermore, mean risks of the
number of the PGE compounds in given home posed comparable
risks as those estimates using the PGE concentrations, shown in
Table 4. This suggests that multiple compounds, rather than a
single one, contribute to the observed risks.
Third, water-based cleaning does not confound the PGE-
outcome associations, and, thus, does not raise potential for a
reverse causality. This is supported by similarity in risks across the
families with varying cleaning frequencies. In addition, limonene
was neither an independent risk factor (aOR = 1.15; 95% CI, 0.86
– 1.53) of the case status, nor a confounder of PGE-asthma/allergy
associations. Similarly, the terpene hydrocarbons did not pose an
Table 3. Geometric mean indoor air concentration (mg/m3) of glycol, glycol ethers, and texanols in the children’s homes.
Control Case Asthma Rhinitis Eczema
Na
geometricmean(95% CI) Na
geometricmean(95% CI) Nb
geometricmean(95% CI) Nb
geometricmean(95% CI) Nb
geometricmean(95% CI)
Propylene glycol & glycol ethers
1,2-propanediol (propylene glycol)(CAS # 57-55-6)
72 4.55(0.96–21.58)
93 6.43*
(1.01–40.89)57 6.70*
(1.14–39.32)52 6.60*
(1.26–34.47)66 6.50*
(0.95–44.76)
1-methoxy-2-propanol(Propylene Glycol Monomethyl Ether)(CAS # 107-98-2)
42 3.49(0.95–12.75)
44 3.81(1.03–14.13)
25 3.29(0.85–12.73)
22 3.90(1.14–13.29)
28 3.59(0.88–14.64)
2-(2-butoxyethoxy)ethanol(CAS # 112-34-5)
31 3.05(0.48–19.25)
38 3.44(0.74–16.07)
26 3.35(0.91–12.33)
22 3.19(1.06–9.62)
27 3.12(0.78–12.44)
1-butoxy-2-propanol(CAS # 5131-66-8)
31 4.51(0.75–27.11)
34 4.38(0.64–30.15)
18 5.23(0.53–51.75)
21 4.92(0.50–48.56)
25 5.21(0.72–37.87)
2-(2-butoxyethoxy)ethanol acetate(CAS # 124-17-4)
13 1.85(0.62–5.50)
20 2.89(0.53–15.72)
12 2.83(0.46–17.37)
14 3.23(0.54–19.26)
11 2.70(0.53–13.81)
2-butoxy ethanol(CAS # 111-76-2)
9 3.00(0.30–29.61)
18 3.11(0.76–12.67)
13 2.81(0.67–11.72)
11 3.40(0.97–11.98)
8 2.68(0.85–8.40)
2-(2-(2-butoxyethoxy)ethoxy) ethanolCAS # 143-22-6)
11 1.55(0.60–3.99)
9 1.85(0.37–9.27)
5 2.60(0.53–12.76)
4 2.45(0.27–21.99)
7 2.45(0.62–9.63)
2-(2-ethoxyethoxy) ethanol(cas # 111-90-0)
7 7.10(1.31–38.47)
9 7.03(1.55–31.96)
7 6.51(1.89–22.45)
5 7.31(1.75–30.62)
5 6.58(1.91–22.67)
1-(2-methoxypropoxy)-2-propanol(CAS # 13429-07-7)
3 3.24(1.85–5.68)
8 5.44(0.80–37.19)
5 5.92(0.81–43.13)
3 15.23(13.02–17.82)
5 5.24(0.52–52.77)
Dipropylene glycol methyl ether(CAS # 34590-94-8)
1 2.55 6 4.19(1.42–12.3)
4 3.88(1.06–14.17)
4 3.55(1.30–9.65)
4 5.31(2.22–12.70)
2-(2-methoxyethoxy) ethanol(CAS # 111-77-3)
3 3.91(2.59–5.90)
3 7.41(2.03–27.04)
3 7.41(2.03–27.04)
2 7.85(1.28–47.95)
2 9.97(3.17–31.36)
2-(2-hydroxypropoxy)-1-propanol(CAS # 106-62-7)
1 0.62 3 1.61(0.76–3.42)
2 1.96(1.21–3.20)
2 1.34(0.76–2.37)
3 1.61(0.76–3.42)
1-(2-methoxy-1-methylethoxy)-2-propanol(CAS # 20324-32-7)
(1.00–1.00) 3 6.33(2.91–13.80)
2 6.13(2.06–18.23)
1 6.76 2 7.84(5.21–11.79)
1-propoxy-2-propanol(CAS # 1569-01-3)
1 1.55 1 8.91 1 8.91 1 8.91
2-(2-ethoxyethoxy) ethanol acetate(CAS # 112-15-2)
2 8.03(3.99–16.17)
2 8.03(3.99–16.17)
1 10.34 2 8.03(3.99–16.17)
2,2-oxybis ethanol (Diethylene glycol)(CAS # 111-46-6)
1 7.97 1 7.97 1 7.97 1 7.97
Ethanediol (Ethylene glycol)(CAS # 107-21-1)
1 1.92 18 7.28(1.17–45.42)
18 7.82(1.20–51.03)
15 8.11(1.90–34.54)
Texanols
A 15 8.85(3.74–20.93)
24 7.42(1.38–39.92)
18 7.28(4.71–11.26)
18 7.82(5.01–12.23)
15 8.11(5.55–11.83)
B 39 3.24(0.54–19.45)
49 3.50(0.50–4.56)
36 3.75(2.68–5.24)
27 5.24*(3.52–7.80)
37 3.40(2.50–4.64)
a) Households with compound . functional detection limit.b) Subset of the case households with compound . functional detection limit.c) CAS Registry number is unique a identifier for chemical substance (http://www.cas.org/expertise/cascontent/index.html).*P,0.05 based on Mann-Whitney’s U test for each outcome, compared to the control.doi:10.1371/journal.pone.0013423.t003
Glycol Ethers and Allergies
PLoS ONE | www.plosone.org 6 October 2010 | Volume 5 | Issue 10 | e13423
independent risk on any of the outcomes, or confound the PGE-
asthma/allergy associations. Furthermore, among the cases, a unit
PGE exposure increased the likelihood of IgE-sensitization by 1.3-
and 1.7-fold within the families that clean $ once/wk and every
other week, respectively. Such independent validation of PGEs-
IgE sensitization suggests that our diagnosis dependent outcomes
are not merely correlated with frequent cleaning.
Fourth, a history of repainting at least one room in the house pre-
or post-natal to the birth of the child was associated with a 63%
increase in mean PGEs compared to those who never repainted in a
group of families with higher than the median excess moisture level
($2.158 g/m3, p for interaction = 0.03). Thus, repainting might have
provided a sustained exposure since the gestational period or shortly
following the birth. This is because the information regarding the
history of repainting was collected 1.5 year prior to the onset of the
case-control study. Since the initial cross-sectional investigation, all
parents reported that they remained in the same house and have not
changed most life-style practices. To further validate this, the
families that renovated their house due to flooding were excluded.
This suggests that the temporal window of exposure occurred prior
to the initial symptom presentation while the present cohort was
critically vulnerable to these chemical compounds.
Multiple indoor sources emit PGEs. A growing body of
literature suggest either the PGE sources (self-reported by the
subjects), or their directly quantified concentrations exacerbate
airway problems. Propylene glycol and glycol ethers are a diverse
group of compounds with superior solvent and coalescent
properties [23]. Due to their lower volatility and higher degree
of solvency, they are widely used in water-based paint, varnishes,
cleaning fluids, pharmaceuticals, pesticides, cosmetics, and pro-
cessed foods [24]. For non-solvent purposes, they are used in PVC
pipes [22], hydraulic and brake fluids, de-icing fluids for aircrafts,
and artificial theatrical smoke [25]. 1-methoxy-2-propanol was the
most prevalent glycol ether compound in the present investigation.
In a group of healthy adult volunteers, administration of 309 mg/
m3 of propylene glycol, and 35 mg/m3 of glycol ethers and texanol
mixture, respectively induced acute eye, nose, throat irritation and
dyspnea [26,27]. However, our observed PGE concentration
range (i.e. ,82 mg/m3) is more than 400-folds lower than the
exposure ranges reported in occupational and experimental
settings [26,27]. In a prospective cohort study of house-painters
from 1989 – 1991, occupational exposure to water-based paint led
to a significantly higher incidence of chest tightness/wheezing,
airway irritation, bronchial hyper-responsiveness, and shortness of
breath [23]. In a non-occupational setting, greater likelihood of
asthma symptoms have been observed in adults exposed to a newly
painted wood or kitchen surfaces [28], and/or synthetic material-
based furniture [5,29]. Finally, in the Avon cohort study, a
Table 4. Crude and adjusted odds ratios (95% C.I.) of allergy and asthma diagnoses in children with PGE exposure in indoor air.
Main exposure variable coding scheme
Ncase
one ln-unit(continuous scale)
firstquartile:#1.11 mg/m3
secondquartile:1.12 – 3.45 mg/m3
thirdquartile:3.46 – 10.67 mg/m3
Fourthquartile:$10.68 mg/m3
OR (95% CI) (reference) OR (95% CI) OR (95% CI) OR (95% CI)
Unadjusted a)
(Ncontrol = 122)
Case 130 1.5 (1.1 – 1.9)* 1.0 0.9 (0.5–1.7) 1.1 (0.6–1.8) 2.2 (1.3–3.7)*
Asthma 86 1.4 (1.1 – 1.9)* 1.0 1.0 (0.5–2.1) 1.0 (0.6–1.9) 2.3 (1.2–4.1)*
Rhinitis 71 2.1 (1.5 – 2.9)* 1.0 0.5 (0.2–1.2) 1.3 (0.7–2.5) 2.7 (1.4–5.0)*
Eczema 92 1.6 (1.2 – 2.2)* 1.0 1.0 (0.5–2.0) 1.0 (0.6–1.9) 2.6 (1.4–4.6)*
Adjusted a, b)
(Ncontrol = 167)
Case 155 1.5 (1.1 – 2.1)* 1.0 0.8 (0.3–1.8) 1.4 (0.7–2.8) 2.3 (1.2 – 4.7)*
Asthma 93 1.5 (1.0 – 2.3)* 1.0 0.8 (0.3–1.9) 1.3 (0.6–2.7) 2.0 (0.9 – 4.4)
Rhinitis 74 2.8 (1.6 – 4.7)* 1.0 0.5 (0.1–1.8) 2.4 (1.0–5.8) 4.2 (1.7 – 10.3)*
Eczema 100 1.6 (1.1 – 2.3)* 1.0 0.9 (0.4–2.2) 1.2 (0.6–2.7) 2.5 (1.1 – 5.3)*
sum of 16 glycol ethers, excluding propylene glycol a, b)
(Ncontrol = 162)
Case 153 1.3 (1.0–1.6)*
Asthma 101 1.2 (1.0–1.6)*
Rhinitis 74 1.7 (1.3–2.4)*
Eczema 108 1.3 (1.0–1.7)*
Cases only a,c)
(IgE-negative = 54)
IgE-positive 53 1.8 (1.1 – 2.8)* 1.0 0.5 (0.1–1.9) 1.6 (0.6–4.3) 2.2 (0.9 – 5.8)
a) Subjects , functional detection limit of glycol ethers were attributed one half-value (1.11 mg/m3).b) Accounts for gender, secondhand smoke exposure, allergic diseases in both parents, chemical-based cleaning, home construction period (i.e. coded as categoricalvariable), limonene, ln-transformed cat and dog allergen concentrations, respectively, BBzP, and DEHP concentration in the dust sample. Subject size is reduced becauseonly dust samples .25 mg are considered [20].c) Analysis was restricted to the cases only and the model accounted for same variables as the adjusted model.*P –value ,0.05doi:10.1371/journal.pone.0013423.t004
Glycol Ethers and Allergies
PLoS ONE | www.plosone.org 7 October 2010 | Volume 5 | Issue 10 | e13423

household chemical exposure score was associated with late onset
wheezing as well as reduced lung function in children 8.5 years of
age [10].
While the mechanism through which glycols and glycol ethers
affect the allergic responses is not well understood, it has been
known for more than three decades that inhalation of vaporized
propylene glycol methyl ether (PGME) induce mucous membrane
irritation in nasal passage way of humans [30] and rats [31].
Administration of human nasal respiratory epithelial cell line from
healthy individuals with 1-methoxy-2-propanol in vitro acutely
induced the transcription of TNF-a, IL-1b, and IL-6, markers of
early inflammatory response, as well as Cyclooxygenase 2 (COX-
2) for the following 4-hours [32]. However, sustained response was
observed only for COX-2, a key enzyme in the prostaglandin
synthesis during inflammatory responses [32]. Overall, the
question of long-term airway injury from the glycol ethers and
other organic solvent exposure requires clarification [33].
Glycol ethers as endocrine disrupting chemicalsSeveral glycol ether compounds join a growing list of sVOCs
that are suggested to contribute to allergic diseases in humans [4].
While several PGEs are well-known endocrine disruptors, very
little is known whether and how they influence developing
immune system. For example, 1-methoxy-2-propanol, a beta-
isomer of PGME, was the most common glycol ethers in the
homes of our cohort. Administration of 1-methoxy-2-propanol,
Figure 2. Geometric mean (95% CI) (mg/m3) of propylene glycol & glycol ethers in the bedroom air. ** p,0.001 compared to nonsensitized cases tested based on T-test.doi:10.1371/journal.pone.0013423.g002
Figure 3. Prevalence of IgE-positive among the cases.doi:10.1371/journal.pone.0013423.g003
Glycol Ethers and Allergies
PLoS ONE | www.plosone.org 8 October 2010 | Volume 5 | Issue 10 | e13423

during gametogenesis phase of the parent rats could induce .50%
reduction of testicular and epididymal sperm counts [34].
Furthermore, 1-methoxy-2-propanol exposure in the parental
generation of rats significantly alter the sex ratio, the fetal loss, and
birthweight reduction in two subsequent generations [34]. In
addition to these effects, our results suggest the PGEs may pose
wider range of health effects than previously known. Considering
low range of exposure in the present observation, experimental
model should be developed not only to validate our results, but
also to clarify the mechanism of PGE effects in developing airways
and reproductive systems.
Limitations of the studyWe examined whether the limitations in sampling and
laboratory analysis misclassified the exposure scenarios for the
children, and resulted in a biased estimates of the risks.
First, the airborne VOC levels were measured on the prevalent
cases and the controls. VOC exposure characteristics during the
period of the child’s critical developmental window and temporal
stability of the exposure traits to the present study period (at age 3
– 8) remain unknown. While the temporal reliability of the VOC
concentrations could not be directly ascertained here, the parental
responses from the two rounds of questionnaires suggest that the
home indoor environment has not changed between the baseline
and the present investigation. We also excluded families that
renovated or moved their residence. In addition, while the
likelihood of the outcome diagnosis as well as the severity is often
positively correlated with the age of the child, we could not
examine whether the age modifies the PGE risks due to the limited
sample size.
Second, the possibility that the cases and the controls differ in
the likelihood or in the concentration range of the missing PGE
concentrations was examined. Under this scenario, the detected
PGE concentration range would systematically differ between the
cases and the controls, resulting in biased estimates of the risks
away from the null. Proportion of the cases and controls with
unknown PGE concentrations were comparable (28% vs. 37%).
The interquartile ranges of the minimum of the 405 compounds
were almost identical between the cases and the controls (Figure
S2). This suggests that our sampling methods and laboratory
analysis are unlikely to have artificially inflated the true
concentrations among the cases only. In a subset of children
whose sensitization status was determined independent of the
clinical diagnoses, the mean PGE levels were significantly higher
for the sensitized children, compared to either the non-sensitized
children. Similar association was absent for all other VOC classes.
As a result, systematic difference in concentration ranges of 50
compounds between the cases and the controls were ruled out.
Third, we did not measure the frequency and extensiveness of the
skin lotion use on the child as possible source for PGEs. This might
have also contributed to an exposure misclassification. Transdermal
exposure to PGEs has been suggested an important exposure route
[35,36]. In a group of 28 healthy male printing workers chronically
exposed to 2-(2-butoxyethoxy)ethanol, urinary level of its chief
metabolite, 2-(2-butoxyethoxy)ethanol butoxyethoxyacetic acid,
was elevated particularly among those with skin lesion [35].
Evidence of transdermal absorption was observed in all workers
with erythema and scaliness of skin [35]. While the children could
have been exposed to PGE through skin lotion application in this
study, this does not account for the present association.
Fourth, due to high mutual correlations of the PGE compounds,
and their overall low concentrations, we currently cannot
distinguish the risks of the individual compounds.
Internal Validity of VOC Sampling and the LaboratoryAnalysis
Our VOC sampling approach with adsorption/thermal desorp-
tion coupled with gas chromatography-mass spectrometry (GC/
MS) has been validated as sensitive, simple, and cost-effective
assessment method [15,37,38]. Also, our sampling duration (60–
90 min) was substantially longer than the standard protocol [39].
Compared to other methods, our present approach has an
advantage of higher sensitivity [39]. In a number of indoor VOC
investigations, which relied on Tenax TA as a general purpose
adsorbent, overall very low inherent artifacts were observed [16].
Known artifacts of Tenax TA do not include glycol ethers. Thus,
glycol ethers are unlikely to have been introduced in this
investigation as sampling artifacts [39]. At the same time, no study
as ever examined temporal stability of the 405 compounds in this
study over time. A time period of 5 to 6 weeks between sampling
and analysis could influence the artifact level and recovery rates.
While this is likely to have biased the aromatic hydrocarbon level
towards the null, there was no evidence that the PGEs were also
influenced by the transport duration. The method used is in
accordance to best laboratory practice and the recommendations
given by DIN EN 14662-1 and Helmig 1996 [16].
The prevalence and concentration the VOCs detected in the
present study are strikingly concordant with those detected from
other Scandinavian countries. We compared the concordance of
our detected VOCs with Finnish EXPOLIS study [40]. In the
EXPOLIS study, air samples (2–3 L) from 183 homes were
collected during the winter of 1996–1997 in Helsinki, Finland,
focusing on 30 VOCs as target compounds. Extensive quality
assurance and control standards were practiced. Of the 30 VOCs,
21 VOCs were also collected in our study. The prevalence (%
detected in participant homes) of the VOC compounds were
significantly correlated between the two studies (R2 = 0.57,
p,0.001) (Figure S3). Also, eight VOC compounds, which were
identified in $80% of the homes in both the studies (i.e., toluene,
limonene, hexanal, p/m-xylene, benzaldehyde, octanal, undecane,
and ethylbenzene), their concentrations were significantly corre-
lated (R2 = 0.612, p = 0.022) (Figure S4). This suggests that
compounds with low prevalence are also expected to have low
concentrations in both DBH and EXPOLIS. For example, 2-
methyl-1-propanol, observed in 5% of the homes of DBH study
was 1.96 mg/m3 and 3.37 mg/m3 in EXPOLIS. Striking similar-
ities in absolute concentration and correlation of the compounds
between the two studies support the validity of our sampling and
analytical procedures.
SummaryHere, the present investigation demonstrates for the first time
that the bedroom concentration of PGEs are significantly
associated with an elevated risks of multiple allergic symptoms,
rhinitis and eczema, respectively, as well as IgE-sensitization in
preschool age children. Apparent risks of PGEs at such low
concentrations at home raise concerns for the vulnerability of
infants and young children. Our present observations warrant
confirmation in a prospective cohort study. Clarification of the
underlying mechanism of the PGE effects on developing human
immune system is also necessary.
Supporting Information
Figure S1 Relationship between prevalence of each VOC
compound and concentration variance.
Found at: doi:10.1371/journal.pone.0013423.s001 (0.01 MB
PDF)
Glycol Ethers and Allergies
PLoS ONE | www.plosone.org 9 October 2010 | Volume 5 | Issue 10 | e13423

Figure S2 Distribution of the minimum detected concentration
in the cases and the controls (n = 381).
Found at: doi:10.1371/journal.pone.0013423.s002 (0.03 MB
PDF)
Figure S3 Comparison of the percentage of homes where VOCs
were detected in the DBH and the EXPOLIS study. (Pearson
correlation R2 = 0.568, p,0.001).
Found at: doi:10.1371/journal.pone.0013423.s003 (0.03 MB
PDF)
Figure S4 Comparison of indoor air geometric mean concen-
trations for VOCs found in at least 80% (see Figure 2) in the
homes in both the DBH and the EXPOLIS study. (Pearson
correlation R2 = 0.612, p = 0.022.)
Found at: doi:10.1371/journal.pone.0013423.s004 (0.03 MB
PDF)
Author Contributions
Conceived and designed the experiments: JS CGB. Performed the
experiments: NS JS MH. Analyzed the data: HC JS. Contributed
reagents/materials/analysis tools: NS MH JS. Wrote the paper: HC NS
MH CGB.
References
1. Patel SP, Jarvelin MR, Little MP (2008) Systematic review of worldwidevariations of the prevalence of wheezing symptoms in children. Environ Health
7: 57.2. Pearce N, Douwes J (2006) The global epidemiology of asthma in children.
Int J Tuberc Lung Dis 10: 125–132.
3. Bornehag CG, Nanberg E (2010) Phthalate exposure and asthma in children.Int J Androl 33: 333–345.
4. Chalubinski M, Kowalski ML (2006) Endocrine disrupters–potential modulatorsof the immune system and allergic response. Allergy 61: 1326–1335.
5. Jaakkola JJK, Parise H, Kislitsin V, Lebedeva NI, Spengler JD (2004) Asthma,
Wheezing, and Allergies in Russian Schoolchildren in Relation to New SurfaceMaterials in the Home. 94: 560–562.
6. Nielsen GD, Larsen ST, Olsen O, Lovik M, Poulsen LK, et al. (2007) Do indoorchemicals promote development of airway allergy? Indoor Air 17: 236–255.
7. Weschler CJ (2009) Changes in indoor pollutants since the 1950s. AtmosphericEnvironment 43: 153–169.
8. Weschler CJ, Nazaroff WW (2008) Semivolatile organic compounds in indoor
environments. Atmospheric Environment 42: 9018–9040.9. Bornehag CG, Sundell J, Hagerhed-Engman L, Sigsggard T, Janson S, et al.
(2005) ‘‘Dampness’’ at home and its association with airway, nose and skinsymptoms among 10 851 preschool children in Sweden: a cross sectional study.
Indoor Air 15: 48–55.
10. Henderson J, Sherriff A, Farrow A, Ayres JG (2008) Household chemicals,persistent wheezing and lung function: effect modification by atopy? Eur Respir J
31: 547–554.11. Mendell MJ (2007) Indoor residential chemical emissions as risk factors for
respiratory and allergic effects in children: a review. Indoor Air 17: 259–277.12. Bornehag CG, Sundell J, Sigsgaard T, Janson S (2006) Potential self-selection
bias in a nested case-control study on indoor environmental factors and their
association with asthma and allergic symptoms among pre-school children.Scand J Public Health 34: 534–543.
13. Hederos CA, Hasselgren M, Hedlin G, Bornehag CG (2007) Comparison ofclinically diagnosed asthma with parental assessment of children’s asthma in a
questionnaire. pp 135–141.
14. Engman L, Bornehag CG, Sundell J (2007) How valid are parents’ questionnaireresponses regarding building characteristics, mouldy odour, and signs of
moisture problems in Swedish homes? Scand J Public Health 35: 125–132.15. Wu CH, Feng CT, Lo YS, Lin TY, Lo JG (2004) Determination of volatile
organic compounds in workplace air by multisorbent adsorption/thermaldesorption-GC/MS. Chemosphere 56: 71–80.
16. Helmig D (1996) Artifact free preparation, storage and analysis of solid
adsorbent sampling cartridges used in the analysis of volatile Organiccompounds in air. Journal of Chromatography A 732: 414–417.
17. Klenø JG, Wolkoff P, Clausen PA, Wilkins CK, Petersen T (2002) Degradationof the adsorbent Tenax TA by nitrogen oxides, ozone, hydrogen peroxide, OH
radical and limonene oxidation products. Environmental Science and Technol-
ogy 36: 4121–4126.18. Uhde E (2009) Application of solid sorbents for the sampling of volatile organic
compounds in indoor air; In: Organic indoor air pollutants, Salthammer T,Uhde E, eds. Wiley-VCH, pp 3–18.
19. Kleinbaum DG, Klein M (2002) Logistic Regression-A Self-Learning Text,Second Edition: Springer-Verlag New York, Inc.
20. Bornehag CG, Sundell J, Weschler CJ, Sigsgaard T, Lundgren B, et al. (2004)
The association between asthma and allergic symptoms in children andphthalates in house dust: a nested case-control study. Environmental Health
Perspective 112: 1393–1397.21. Bornehag CG, Sundell J, Lundgren B, Weschler CJ, Sigsgaard T, et al. (2005)
Phthalates in indoor dust and their association with building characteristics.
Environ Health Perspect 113: 1399–1404.22. Rumchev K, Spickett J, Bulsara M, Phillips M, Stick S (2004) Association of
domestic exposure to volatile organic compounds with asthma in youngchildren. Thorax 59: 746–751.
23. Wieslander G, Norback D, Edling C (1997) Airway symptoms among house
painters in relation to exposure to volatile organic compounds (VOCS)–a
longitudinal study. Ann Occup Hyg 41: 155–166.
24. Wieslander G, Janson C, Norback D, Bjornsson E, Stalenheim G, et al. (1994)
Occupational exposure to water-based paints and self-reported asthma, lower
airway symptoms, bronchial hyperresponsiveness, and lung function. Int Arch
Occup Environ Health 66: 261–267.
25. Wieslander G, Norback D, Venge P (2007) Changes of symptoms, tear film
stability and eosinophilic cationic protein in nasal lavage fluid after re-exposure
to a damp office building with a history of flooding. Indoor Air 17: 19–27.
26. Ernstgard L, Lof A, Wieslander G, Norback D, Johanson G (2007) Acute effects
of some volatile organic compounds emitted from water-based paints. J Occup
Environ Med 49: 880–889.
27. Wieslander G, Norback D, Lindgren T (2001) Experimental exposure to
propylene glycol mist in aviation emergency training: acute ocular and
respiratory effects. Occup Environ Med 58: 649–655.
28. Wieslander G, Norback D, Bjornsson E, Janson C, Boman G (1997) Asthma and
the indoor environment: the significance of emission of formaldehyde and
volatile organic compounds from newly painted indoor surfaces. Int Arch Occup
Environ Health 69: 115–124.
29. Jaakkola JJ, Oie L, Nafstad P, Botten G, Samuelsen SO, et al. (1999) Interior
surface materials in the home and the development of bronchial obstruction in
young children in Oslo, Norway. Am J Public Health 89: 188–192.
30. Stewart RD, Baretta ED, Dodd HC, Torkelson TR (1970) Experimental human
exposure to vapor of propylene glycol monomethyl ether. Experimental human
exposure. Arch Environ Health 20: 218–223.
31. Miller RR, Hermann EA, Young JT, Calhoun LL, Kastl PE (1984) Propylene
glycol monomethyl ether acetate (PGMEA) metabolism, disposition, and short-
term vapor inhalation toxicity studies. Toxicology and Applied Pharmacology
75: 521–530.
32. Brieger J, Muttray A, Jung D, Letzel S, Mann WJ, et al. (2008) Early stress
response of human nasal respiratory epithelia after exposure to 1-methoxypro-
panol-2. Toxicol Lett 177: 138–143.
33. Schenker MB, Jacobs JA (1996) Respiratory effects of organic solvent exposure.
Tubercle and Lung Disease 77: 4–18.
34. Lemazurier E, Lecomte A, Robidel F, Bois FY (2005) Propylene glycol
monomethyl ether. A three-generation study of isomer b effects on reproductive
and developmental parameters in rats. Toxicology & Industrial Health 21:
33–40.
35. Korinth G, Goen T, Lakemeyer M, Broding HC, Drexler H (2003) Skin strain
and its influence on systemic exposure to a glycol ether in offset printing workers.
Contact Dermatitis 49: 248–254.
36. Korinth G, Jakasa I, Wellner T, Kezic S, Kruse J, et al. (2007) Percutaneous
absorption and metabolism of 2-butoxyethanol in human volunteers: a
microdialysis study. Toxicol Lett 170: 97–103.
37. Bayer CW, Black MS, Galloway LM (1988) Sampling and analysis techniques
for trace volatile organic emissions from consumer products. J Chromatogr Sci
26: 168–173.
38. Kuntasal OO, Karman D, Wang D, Tuncel SG, Tuncel G (2005)
Determination of volatile organic compounds in different microenvironments
by multibed adsorption and short-path thermal desorption followed by gas
chromatographic-mass spectrometric analysis. J Chromatogr A 1099: 43–54.
39. Wolkoff P, Schneider T, Kildesø J, Degerth R, Jaroszewski M, et al. (1998) Risk
in cleaning: chemical and physical exposure. The Science of The Total
Environment 215: 135–156.
40. Jurvelin J, Edwards R, Saarela K, Laine-Ylijoki J, De Bortoli M, et al. (2001)
Evaluation of VOC measurments in the EXPOLIS study. Air Pollution
Exposure Distributions within Adult Urban Urban Populations in Europe.
J Environ Monit 3: 159–165.
Glycol Ethers and Allergies
PLoS ONE | www.plosone.org 10 October 2010 | Volume 5 | Issue 10 | e13423