CORPORATE PRESENTATION - Endeavour Mining
161
CORPORATE PRESENTATION › April 2020
-
Upload
khangminh22 -
Category
Documents
-
view
0 -
download
0
Transcript of CORPORATE PRESENTATION - Endeavour Mining

CORPORATE PRESENTATION
› April 2020
DISCLAIMER & FORWARD LOOKING STATEMENTS
2
CORPORATE PRESENTATION
This presentation contains “forward-looking statements” including but not limited to, statements with respect to Endeavour’s plans and operating performance, the estimation of mineral reserves and resources, the timing and amount of estimated future production, costs of future production, future capital expenditures, and the success of exploration activities. Generally, these forward-looking statements can be identified by the use of forward-looking terminology such as “expects”, “expected”, “budgeted”, “forecasts” and “anticipates”. Forward-looking statements, while based on management’s best estimates and assumptions, are subject to risks and uncertainties that may cause actual results to be materially different from those expressed or implied by such forward-looking statements, including but not limited to: risks related to the successful I completion and integration of acquisitions; risks related to agreeing on the pricing of, and risks related to the successful completion of the investment commitment from La Mancha risks related to international operations; risks related to general economic conditions and credit availability; actual results of current exploration activities; unanticipated reclamation expenses; changes in project parameters as plans continue to be refined; fluctuations in prices of metals including gold; fluctuations in foreign currency exchange rates, increases in market prices of mining consumables; possible variations in ore reserves, grade or recovery rates; failure of plant, equipment or processes to operate as anticipated; accidents, labour disputes, title disputes, claims and limitations on insurance coverage and other risks of the mining industry; delays in the completion of development or construction activities; changes in national and local government regulation of mining operations; tax rules and regulations; risks relating to COVID 19 and political and economic developments in countries in which Endeavour operates. Although Endeavour has attempted to identify important factors that could cause actual results to differ materially from those contained in forward-looking statements, there may be other factors that cause results not to be as anticipated, estimated or intended. There can be no assurance that such statements will prove to be accurate, as actual results and future events could differ materially from those anticipated in such statements. Accordingly, readers should not place undue reliance on forward-looking statements. Please refer to Endeavour’s most recent Annual Information Form filed under its profile at www.sedar.com for further information respecting the risks affecting Endeavour and its business. Endeavour does not intend and does not assume any obligation to update this forward-looking information except as otherwise required by applicable law.
ENDEAVOUR QUALIFIED PERSON
The scientific and technical content of this news release has been reviewed, verified and compiled by Gérard de Hert, EurGeol, Senior VP Exploration for Endeavour Mining. Gérard de Hert has more than 20 years of mineral exploration and mining experience, and is a "Qualified Person" as defined by National Instrument 43-101 – Standards of Disclosure for Mineral Projects ("NI 43-101").
SEMAFO QUALIFIED PERSON
All production information and other scientific and technical information in this news release with respect to SEMAFO and its assets were prepared in accordance with the standards of the Canadian Institute of Mining, Metallurgy and Petroleum and NI 43-101 and were prepared, reviewed, verified and compiled by SEMAFO’s geological and mining staff under the supervision of Patrick Moryoussef, P. Eng., Vice-President, Mining Operations. The exploration programs across the company’s land holdings were prepared, reviewed, verified and compiled by Richard Roy, P. Geo., Vice-President, Exploration. All reserve and resource estimates for the SEMAFO properties have been audited and verified, and the technical disclosure has been approved by François Thibert, P. Geo., MScA, Manager, Reserves and Resources Estimation Group who is a Qualified Person under NI 43-101. Sample preparation, analytical techniques, laboratories and quality assurance-quality control protocols used during the exploration drilling programs are done consistent with industry standards and independent certified assay labs.
NON IFRS MEASURES
The information in this investor presentation includes non-IFRS financial measures including all-in sustaining costs per ounce of gold sold (“AISC)”, EBITDA, adjusted EBITDA and LTM adjusted EBITDA,. Endeavour believes that in addition to conventional measures prepared in accordance with GAAP, certain investors use the all-in sustaining margins and adjusted earnings before interest, tax, depreciation and amortization (“Adjusted EBITDA”) to evaluate Endeavour’s performance and ability to generate cash flows and service debt. These financial measures do not have any standardized meaning prescribed by IFRS and are therefore unlikely to be comparable to similar measures presented by other issuers, even as compared to other issuers who may also be applying the World Gold Council guidelines, which can be found at http://www.gold.org. However, AISC does have limitations as an analytical tool as it may be influenced by the point in the life cycle of a specific mine and the level of additional exploration or expenditures a company has to make to fully develop its properties. Accordingly, these non-IFRS measures should not be considered in isolation, or as a substitute for, analysis of the companies; results as reported under IFRS. A reconciliation of certain the non-IFRS measures presented in this investor presentation is contained in Endeavour’s most recently filed annual MD&A, which is available on SEDAR at www.sedar.com

TABLE OF CONTENTSCOMBINATION WITH SEMAFO: CREATION OF A LEADING WEST AFRICAN GOLD PRODUCER1
DETAILS BY MINE AND PROJECT
WEST AFRICA INSIGHTS
APPENDIX
2
3
4
ENDEAVOUR OVERVIEW
5

CREATION OF A LEADING WEST AFRICAN GOLD PRODUCER
4
1ENHANCED STRATEGIC
POSITIONING 32 ENHANCED CAPITAL MARKET
PROFILE
STRENGTHENED ASSET PORTFOLIO
Strong strategic rationale for regional consolidation
› Creates partner of choice for governments and key stakeholders
› Enhances ability to manage risks
› Offers significant synergies
› Consolidates the Houndé belt to create a world class mining district
› Creates a pool of extensive management experience
› 4 cornerstone mines producing above 800koz on a combined basis providing a solid base
› Strong cash flow capabilities
› Attractive growth project pipeline
› Potential to unlock exploration value with the opportunity to deploy a significant exploration budget
› Ability to pursue future organic growth with sustained cash flow profile and sound balance sheet
› Ability to meet investment hurdles of larger funds
› Increased free float and greater stock liquidity
› La Mancha strongly supports the transaction and commits to inject $100m in the combined entity
STRONG STRATEGIC RATIONALE

INSIGHTS
› Both companies completed construction phases and are now fully ramped-up
› Both companies are at the right juncture to combine operations, and be stronger together
› Strong alignment in upcoming strategic focus
END
EAV
OU
RSE
MA
FO
Both companies are transitioning to cash flow generation phase
5
Q3-19Q4-16Q1-16 Q2-17Q2-16 Q3-16 Q1-19Q3-17Q1-17 Q4-17 Q4-19Q1-18 Q2-20Q4-18Q2-18 Q3-18 Q2-19 Q1-20
CASH FLOW PHASE
Houndé construction
STRATEGIC FOCUS FOR BOTH COMPANIES
› De-risking the project builds and ramp-ups
› Portfolio optimization
› Exploration to extend mine lives and source new projects
› Cash flow generation and further asset optimization
› Return to shareholders
› Next growth phase
STRONG STRATEGIC ALIGNMENT
GOOD STRATEGIC TIMING DUE TO BUSINESS ALIGNMENT
Ity construction
Boungou construction
INVESTMENT PHASE
Mana underground development
STRONG STRATEGIC RATIONALE
-
1
2
3
4
5
6
Dec-18 Mar-19 Jun-19 Sep-19 Dec-19
CAD$ Billions
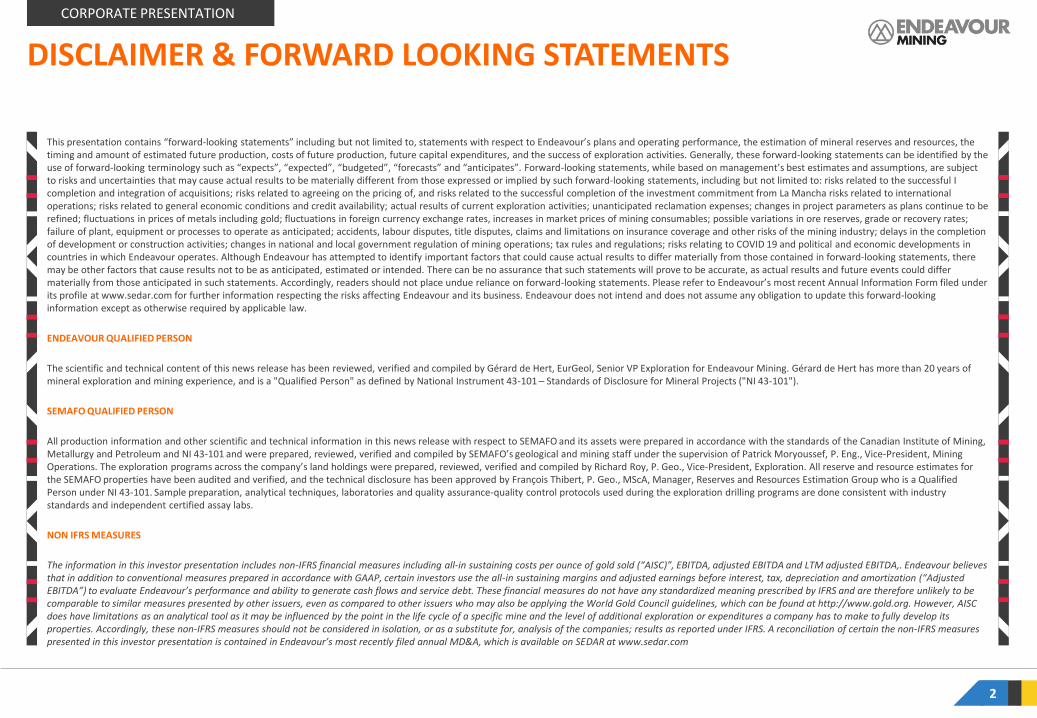
BACKGROUND› For the past several years, Endeavour and
SEMAFO have worked as industry partners to consider shared issues common to companies operating in West Africa.
› In early 2019, both companies engaged in a mutual dialogue in order to evaluate the merits of a business combination.
› The dialogue included extensive mutual due diligence as well as discussion of potential terms of a transaction, with a final proposal in May 2019.
› At that time, it was not possible to agree on terms which appropriately shared the risks and rewards of a combination.
› In early 2020, discussions between Endeavour and SEMAFO recommenced.
› Both companies completed on-site due diligence at SEMAFO’s operations in Burkina Faso during February 2020, including a comprehensive assessment of security, operations and exploration.
Both companies believe that the terms are attractive for both sets of shareholders
6
EXTENSIVE DIALOGUE AND DUE DILIGENCE
Market Capitalization since the beginning of 2019
Endeavour SEMAFO
Endeavour
SEMAFO
Spot parity EDV 70%SMF 30%
Spot parity EDV 60%SMF 40%
Agreed terms EDV 70%SMF 30%
STRONG STRATEGIC RATIONALE
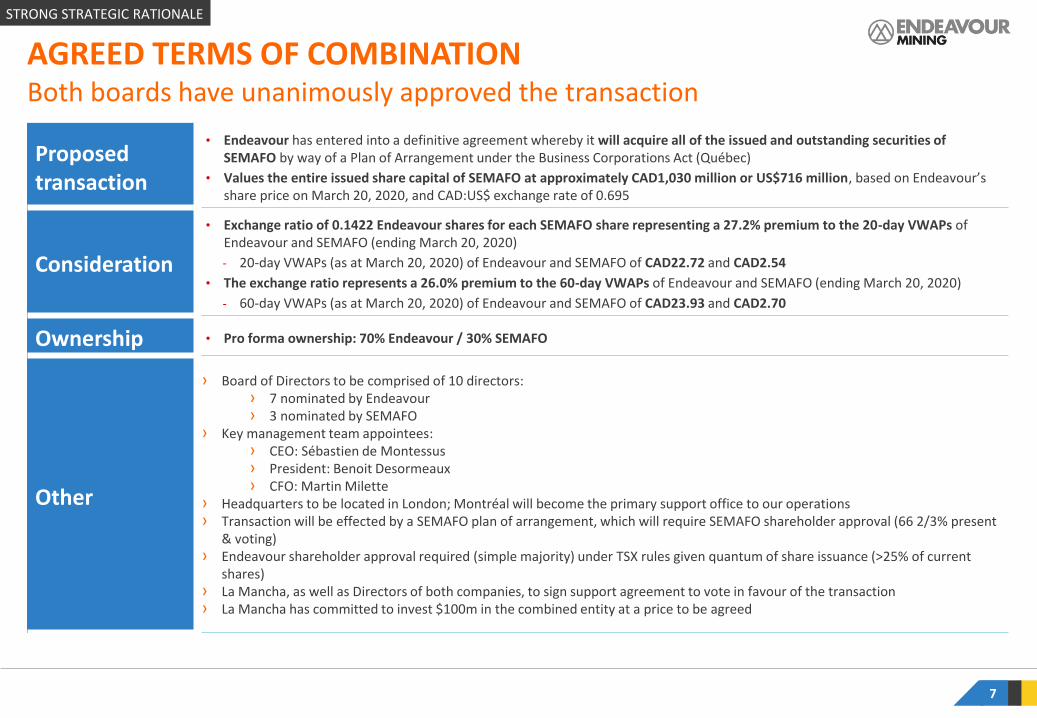
AGREED TERMS OF COMBINATION
7
Proposed transaction
• Endeavour has entered into a definitive agreement whereby it will acquire all of the issued and outstanding securities of SEMAFO by way of a Plan of Arrangement under the Business Corporations Act (Québec)
• Values the entire issued share capital of SEMAFO at approximately CAD1,030 million or US$716 million, based on Endeavour’s share price on March 20, 2020, and CAD:US$ exchange rate of 0.695
Consideration
• Exchange ratio of 0.1422 Endeavour shares for each SEMAFO share representing a 27.2% premium to the 20-day VWAPs of Endeavour and SEMAFO (ending March 20, 2020)
- 20-day VWAPs (as at March 20, 2020) of Endeavour and SEMAFO of CAD22.72 and CAD2.54
• The exchange ratio represents a 26.0% premium to the 60-day VWAPs of Endeavour and SEMAFO (ending March 20, 2020)
- 60-day VWAPs (as at March 20, 2020) of Endeavour and SEMAFO of CAD23.93 and CAD2.70
Ownership • Pro forma ownership: 70% Endeavour / 30% SEMAFO
Other
› Board of Directors to be comprised of 10 directors:› 7 nominated by Endeavour › 3 nominated by SEMAFO
› Key management team appointees: › CEO: Sébastien de Montessus› President: Benoit Desormeaux › CFO: Martin Milette
› Headquarters to be located in London; Montréal will become the primary support office to our operations› Transaction will be effected by a SEMAFO plan of arrangement, which will require SEMAFO shareholder approval (66 2/3% present
& voting)› Endeavour shareholder approval required (simple majority) under TSX rules given quantum of share issuance (>25% of current
shares)› La Mancha, as well as Directors of both companies, to sign support agreement to vote in favour of the transaction› La Mancha has committed to invest $100m in the combined entity at a price to be agreed
Both boards have unanimously approved the transaction
STRONG STRATEGIC RATIONALE
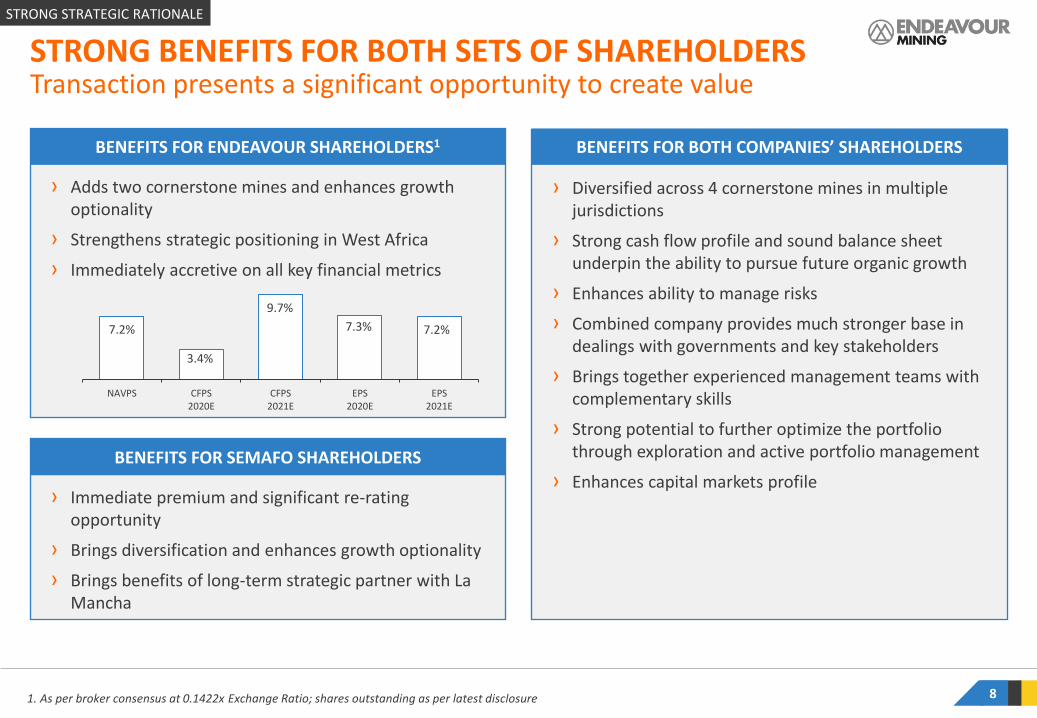
1. As per broker consensus at 0.1422x Exchange Ratio; shares outstanding as per latest disclosure 8
Transaction presents a significant opportunity to create valueSTRONG BENEFITS FOR BOTH SETS OF SHAREHOLDERS
7.2%
3.4%
9.7%
7.3% 7.2%
NAVPS CFPS2020E
CFPS2021E
EPS2020E
EPS2021E
BENEFITS FOR SEMAFO SHAREHOLDERS
› Adds two cornerstone mines and enhances growth optionality
› Strengthens strategic positioning in West Africa
› Immediately accretive on all key financial metrics
› Immediate premium and significant re-rating opportunity
› Brings diversification and enhances growth optionality
› Brings benefits of long-term strategic partner with La Mancha
› Diversified across 4 cornerstone mines in multiple jurisdictions
› Strong cash flow profile and sound balance sheet underpin the ability to pursue future organic growth
› Enhances ability to manage risks
› Combined company provides much stronger base in dealings with governments and key stakeholders
› Brings together experienced management teams with complementary skills
› Strong potential to further optimize the portfolio through exploration and active portfolio management
› Enhances capital markets profile
BENEFITS FOR ENDEAVOUR SHAREHOLDERS1 BENEFITS FOR BOTH COMPANIES’ SHAREHOLDERS
STRONG STRATEGIC RATIONALE
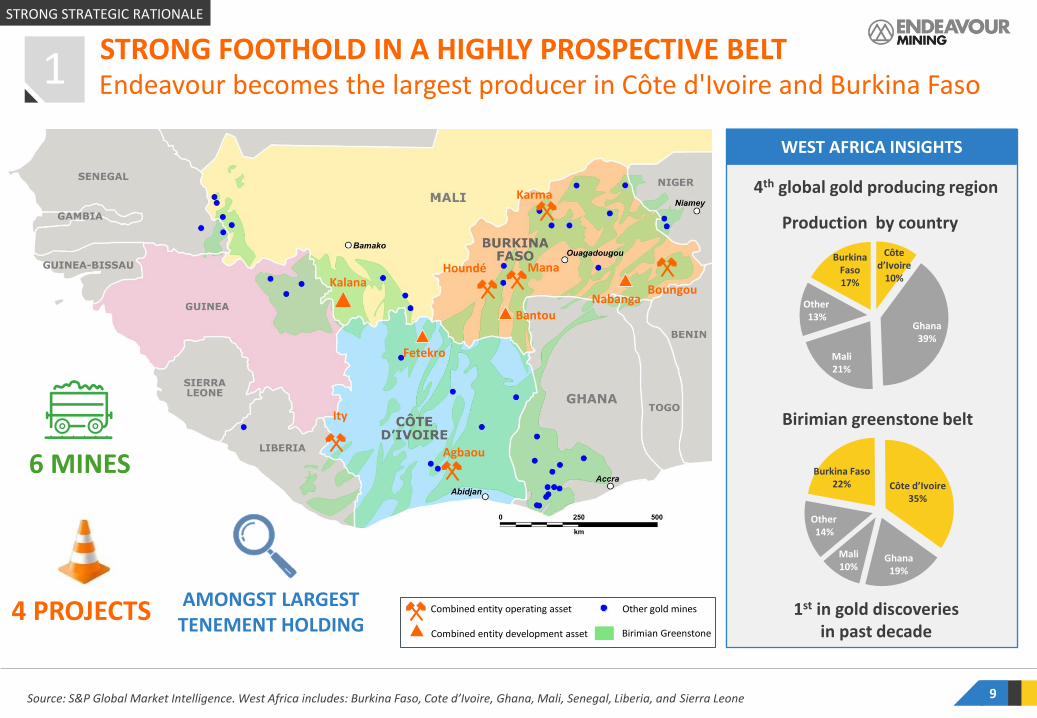
WEST AFRICA INSIGHTS
9
Other14%
Côte d’Ivoire35%
Ghana19%
Mali10%
Other13%
Ghana39%
Mali21%
Production by country
Source: S&P Global Market Intelligence. West Africa includes: Burkina Faso, Cote d’Ivoire, Ghana, Mali, Senegal, Liberia, and Sierra Leone
Birimian greenstone belt
Côted’Ivoire
10%Boungou
Mana
Nabanga
Ity
Agbaou
Kalana
Karma
Houndé
Fetekro
Bantou
Burkina Faso17%
Endeavour becomes the largest producer in Côte d'Ivoire and Burkina Faso STRONG FOOTHOLD IN A HIGHLY PROSPECTIVE BELT
1
4th global gold producing region
Burkina Faso22%
1st in gold discoveries in past decade
6 MINES
4 PROJECTS AMONGST LARGEST TENEMENT HOLDING
Combined entity operating asset
Combined entity development asset
Other gold mines
Birimian Greenstone
STRONG STRATEGIC RATIONALE

Annual West African Gold Production
10
+1MozFor the combined
entity
0
100
200
300
400
500
600
700
800
900
1,000
1,100
Co
mb
ined
En
tity
Ne
wm
on
t
Tera
nga
B2
Go
ld
+1Moz
End
eavo
ur
No
rdgo
ld
Bar
rick
IAM
Go
ld
An
glo
gold
Ash
anti
Kin
ross
Re
solu
te
SEM
AFO
Asa
nko
Go
ld
Go
lden
Sta
r
Go
ldfi
eld
s
1
(Koz)1,2
(3)
(3)
Ability to leverage its size to enhance risk managementCREATES THE LARGEST WEST AFRICAN GOLD PRODUCER
No.1Producer inWest Africa
1. 2020 mid-point guidance2. Based on 100% production and equity method for JV production3. 2019 Actuals
STRONG STRATEGIC RATIONALE

11
11
7
3 4
2
8
10
9
5
1
6
Mana
Hounde
Creates a world class mining district for Endeavour with two mines and a project
Hounde Belt, Burkina Faso Ity Belt, Côte d'Ivoire
Endeavour will have a strong foothold in two world-class beltsCONSOLIDATES THE HOUNDÉ GREENSTONE BELT1
Yaramoko mine (Roxgold)
Comidok (IAMGOLD)Central Hounde(Barrick, Thor)
Pinarello (Barrick)
Mana (SMF) Konkolikan (Barrick) Bondi (Sarama) S. Hounde (Sarama)
Hounde (EDV) Golden Hill (Teranga) Bantou (SMF)
1
5
6
7
8
9
2
3
4 10
11
Bantou
STRONG STRATEGIC RATIONALE
12
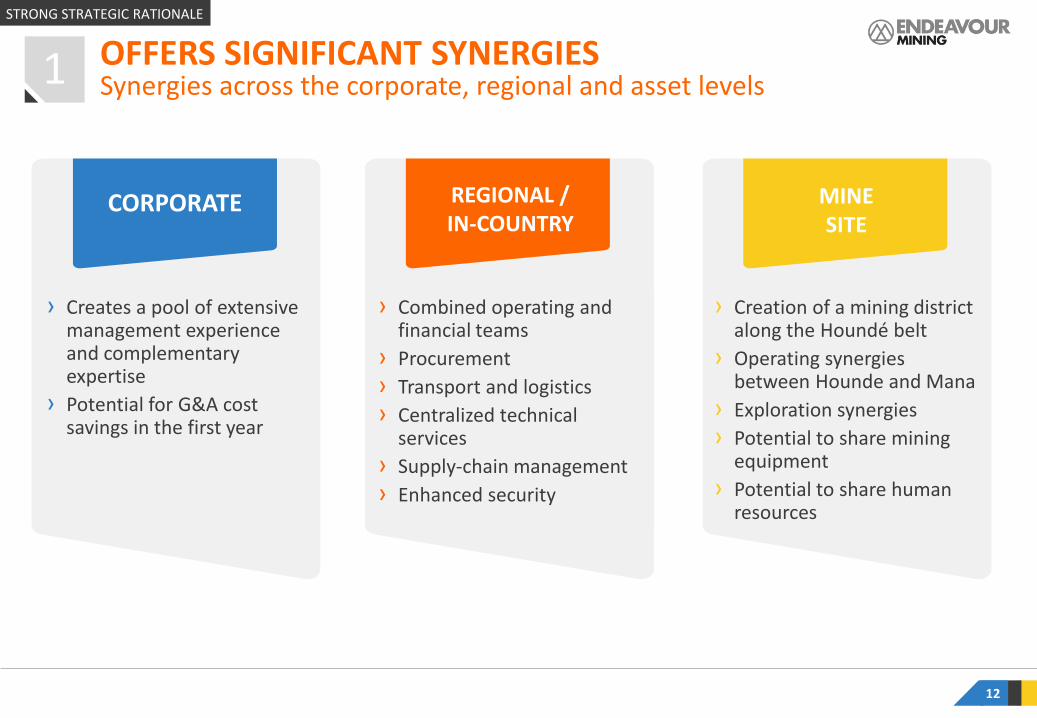
Synergies across the corporate, regional and asset levels OFFERS SIGNIFICANT SYNERGIES1
CORPORATE REGIONAL / IN-COUNTRY
MINESITE
› Creates a pool of extensive management experience and complementary expertise
› Potential for G&A cost savings in the first year
› Combined operating and financial teams
› Procurement
› Transport and logistics
› Centralized technical services
› Supply-chain management
› Enhanced security
› Creation of a mining district along the Houndé belt
› Operating synergies between Hounde and Mana
› Exploration synergies
› Potential to share mining equipment
› Potential to share human resources
STRONG STRATEGIC RATIONALE

LONG-TERM UPSIDE FROM GREENFIELD EXPLORATION
NEAR-TERM GROWTH FROM PROJECTS
IMMEDIATE CASH FLOW FROM PRODUCTION
13
Kalana(Mali)
FS in progress
Hounde
Randgold JV(Ivory Coast)
Kofi Trend(Mali)
Liguidi(Burkina Faso)
Daoukro Cluster(Ivory Coast)
Mt. Ba/Gueya(Ivory Coast – Ity trend)
Siguiri(Guinea)
Liptako(Niger)
Bondoukou Clust.(Ivory Coast)
Tiepleu(Ity trend)
Sia/Sianikoui(Hounde trend)
Fougadian(Mali)
Deep Agbaou(Ivory Coast)
Ity CIL
Fetekro(Ivory Coast)
PEA in progressMines
Projects
Greenfield target
4444 STRENGTHENED ASSET PORTFOLIO WITH OPTIONALITY
Boungou
Nabanga(Burkina Faso)
PEA completed 2019
Bantou(Burkina Faso )Approaching
PEA stage
2
Korhogo(Ivory Coast)
Potential to increase capital allocation efficiency with enhanced pipeline
STRONG STRATEGIC RATIONALE

14
Combined Entity Producing Portfolio1
4444 DIVERSIFIED PORTFOLIO WITH 4 CORNERSTONE MINES 2Potential to continue to pursue our active portfolio management strategy
1. AISC Based on 2020 mid-point guidance; Mine lives calculated as reserves divided by contained gold produced using 2019 stated recovery per mine
2. Sources: company disclosures
$450
$550
$650
$750
$850
$950
$1,050
$1,150
0 5 10 15 20
Ity
Boungou
Houndé
Agbaou
Karma Mana
Mine life, years
AISC, $/oz
› Boungou - Restart mining operations by Q4 2020
› Mana - Extend current mine-life through ambitious exploration program
› Ity - Continue exploration program and bring Le Plaque into production
› Hounde - Continue exploration program, bringing Kari Pump into 2020 production and bringing Kari West/Kari Centre into reserves
Key priorities at 4 cornerstone mines
STRONG STRATEGIC RATIONALE

Combined Entity Production and AISC
15
+1Moz
production
<$900/oz
AISC
STRONG CASH FLOW GENERATION POTENTIAL Ability to deliver long-term sustainable production at low cost2
$900/oz
2020E
$800/oz
2021E
$800/oz
2022E
+1Moz
+1.1Moz +1.1Moz
Production AISC
Sources: Company disclosures for 2020 and broker consensus for 2021 and 2022
STRONG STRATEGIC RATIONALE
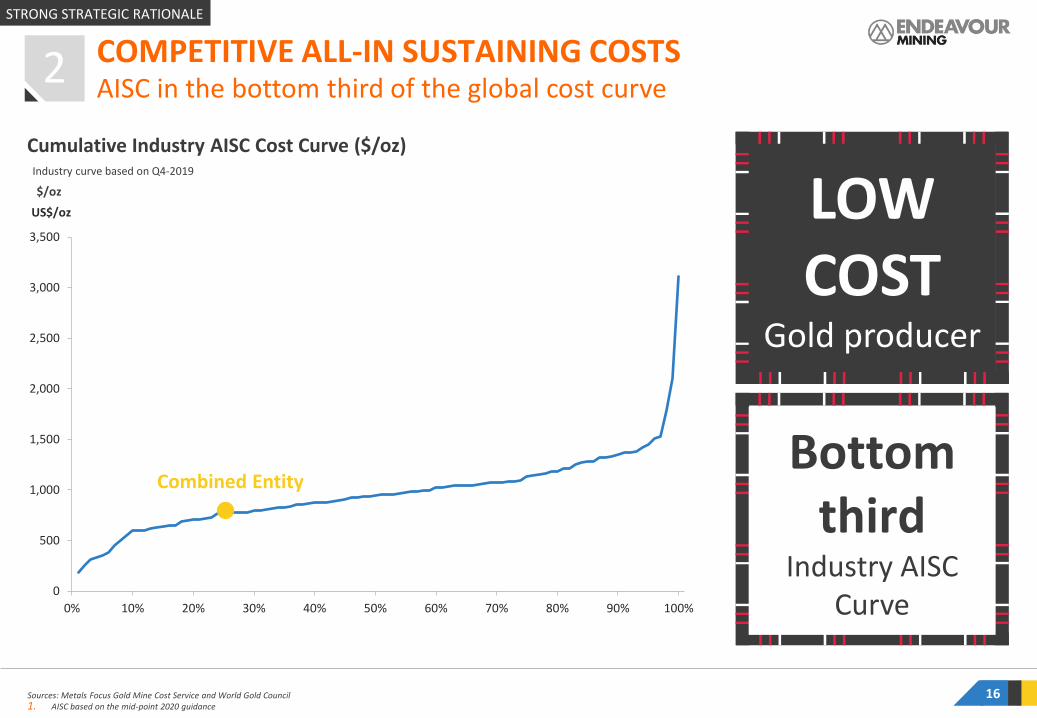
16
LOW COST
Gold producer
Bottom third
Industry AISC Curve
Cumulative Industry AISC Cost Curve ($/oz)
COMPETITIVE ALL-IN SUSTAINING COSTSAISC in the bottom third of the global cost curve
Sources: Metals Focus Gold Mine Cost Service and World Gold Council1. AISC based on the mid-point 2020 guidance
Combined Entity
Industry curve based on Q4-2019
$/oz
0
500
1,000
1,500
2,000
2,500
3,000
3,500
0% 10% 20% 30% 40% 50% 60% 70% 80% 90% 100%
US$/oz
2
STRONG STRATEGIC RATIONALE
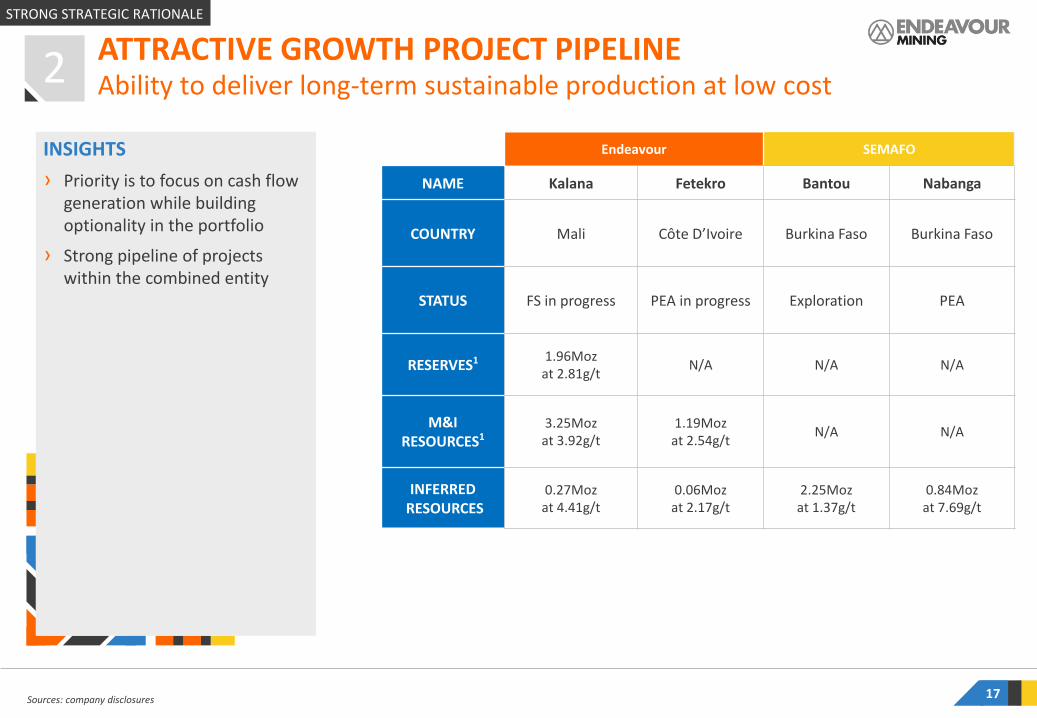
INSIGHTS
› Priority is to focus on cash flow generation while building optionality in the portfolio
› Strong pipeline of projects within the combined entity
Sources: company disclosures 17
V Endeavour SEMAFO
NAME Kalana Fetekro Bantou Nabanga
COUNTRY Mali Côte D’Ivoire Burkina Faso Burkina Faso
STATUS FS in progress PEA in progress Exploration PEA
RESERVES1 1.96Moz at 2.81g/t
N/A N/A N/A
M&I RESOURCES1
3.25Moz at 3.92g/t
1.19Moz at 2.54g/t
N/A N/A
INFERREDRESOURCES
0.27Moz at 4.41g/t
0.06Moz at 2.17g/t
2.25Moz at 1.37g/t
0.84Moz at 7.69g/t
ATTRACTIVE GROWTH PROJECT PIPELINE2 Ability to deliver long-term sustainable production at low cost
STRONG STRATEGIC RATIONALE

18
STRONG ABILITY TO FUND GROWTHSustained cash flow profile and sound balance sheet
Based on Current Reported Net Debt / LTM EBITDA1
Top Producers Leverage
(4.0x)
(3.0x)
(2.0x)
(1.0x)
0.0x
1.0x
2.0x
3.0x
4.0x
5.0x
Pre
tiu
m
An
glo
Go
ld
Reg
is R
eso
urc
es
End
eavo
ur
Co
mb
ined
En
tity
Agn
ico
Eag
le M
ines
Eld
ora
do
Po
lym
etal
Intl
Go
ld F
ield
s
Po
lyu
s
No
rth
ern
Sta
r
New
mo
nt
Go
ldco
rp
Yam
ana
Go
ld
Ala
mo
s
Oce
ana-
Go
ld
New
cres
t
Har
mo
ny
Go
ld
Cen
terr
a
Bar
rick
St B
arb
ara
B2
Go
ld
Tore
x
SEM
AFO
Evo
luti
on
Kir
klan
d
Cen
tam
in
Tera
nga
IAM
GO
LD
Res
olu
te
Kin
ross
Go
ld
2
Sources: Company disclosures, Capital IQ1. Based on the largest (by latest fiscal year gold production) publicly traded companies whose principal business is gold production. Excludes China and Hong Kong
2. Assuming all share merger. Nebt values from their 2019 full-year MD&A report and LTM EBITDA from their Q4 2019 quarterly statements; Includes $100m from La Mancha equity injection3. Calculated as the sum of the latest disclosed Endeavour and SEMAFO cash balances per their 2019 full-year reports plus Endeavour’s undrawn available liquidity from its revolving credit facility as referenced in its 2019 full-year MD&A report (US$120m);
Includes $100m from La Mancha equity injection
0.7xLeverage ratio2
Available sources of liquidity
$508m
As at December 31, 20193
$120mEDV
Undrawn RCF
$190mEDVCash
$100mLa Mancha
CashInjection
$98mSMFCash
STRONG STRATEGIC RATIONALE
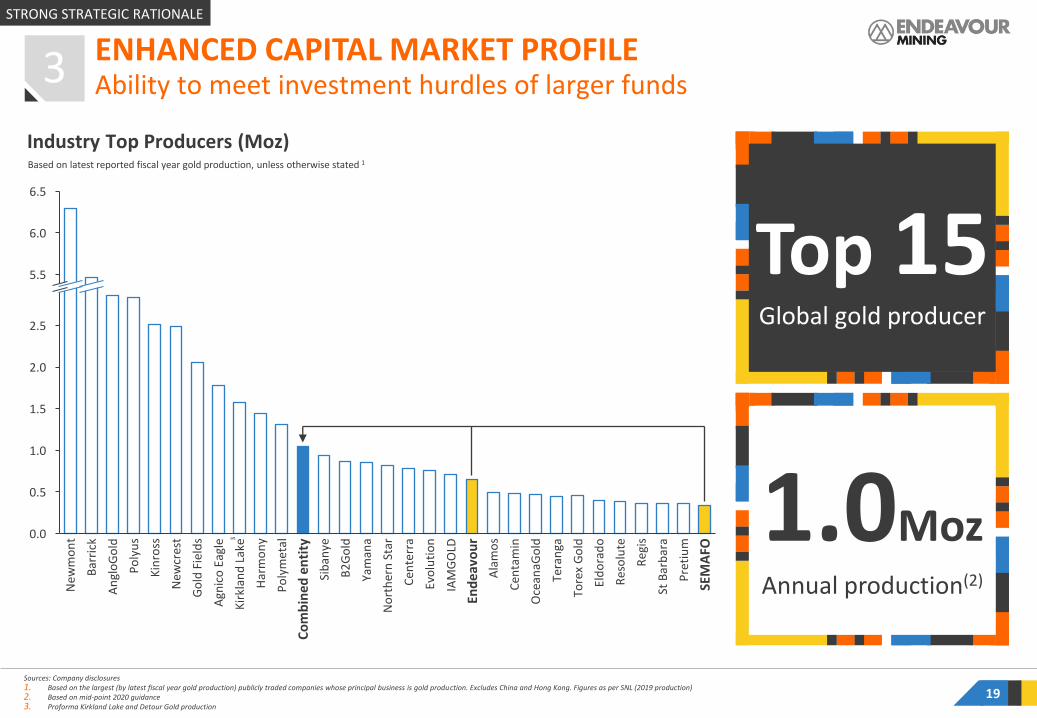
Industry Top Producers (Moz)
19
ENHANCED CAPITAL MARKET PROFILE
Based on latest reported fiscal year gold production, unless otherwise stated 1
Ability to meet investment hurdles of larger funds
Top 15Global gold producer
1.0MozAnnual production(2)
Sources: Company disclosures1. Based on the largest (by latest fiscal year gold production) publicly traded companies whose principal business is gold production. Excludes China and Hong Kong. Figures as per SNL (2019 production)2. Based on mid-point 2020 guidance3. Proforma Kirkland Lake and Detour Gold production
30.0
6.5
1.0
2.5
5.5
0.5
1.5
2.0
6.0
Bar
rick
An
glo
Go
ld
Po
lyu
s
New
cres
t
Res
olu
te
Co
mb
ined
en
tity
Go
ld F
ield
s
Cen
tam
in
Kir
klan
d L
ake
Har
mo
ny
Po
lym
etal
No
rth
ern
Sta
r
Cen
terr
a
IAM
GO
LD
Ala
mo
s
Tera
nga
Evo
luti
on
End
eav
ou
r
St B
arb
ara
Pre
tiu
m
SEM
AFO
New
mo
nt
Kin
ross
Agn
ico
Eag
le
Yam
ana
B2
Go
ld
Tore
x G
old
Sib
anye
Oce
anaG
old
Eld
ora
do
Reg
is
3
STRONG STRATEGIC RATIONALE
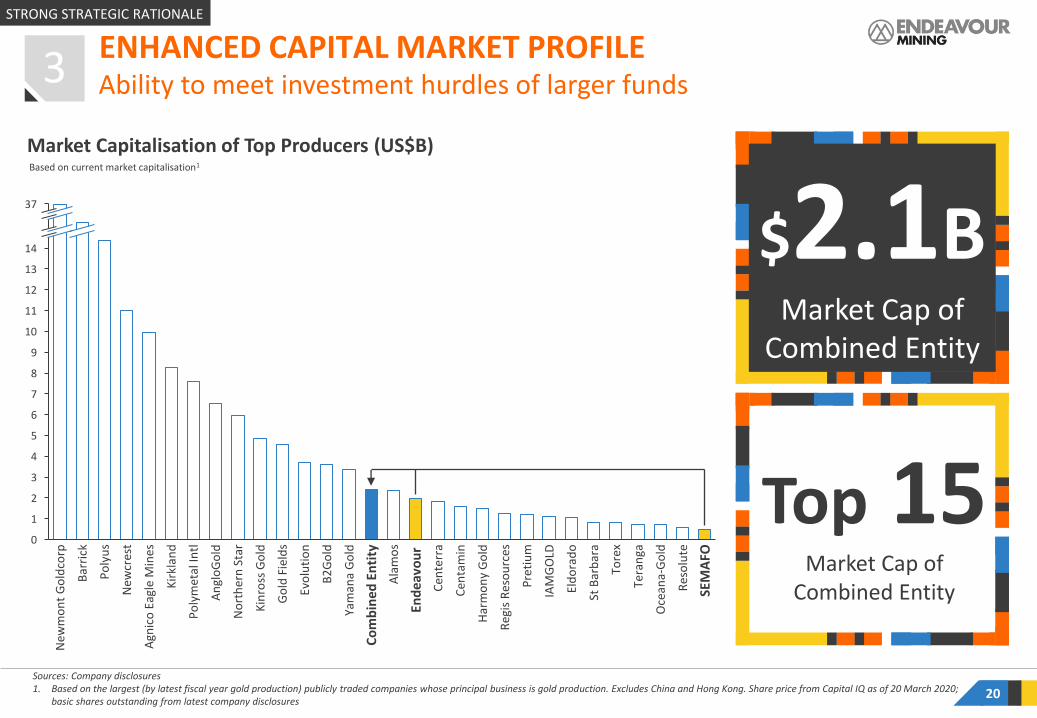
Market Capitalisation of Top Producers (US$B)
ENHANCED CAPITAL MARKET PROFILE
20
$2.1BMarket Cap of
Combined Entity
Ability to meet investment hurdles of larger funds
Based on current market capitalisation1
Sources: Company disclosures1. Based on the largest (by latest fiscal year gold production) publicly traded companies whose principal business is gold production. Excludes China and Hong Kong. Share price from Capital IQ as of 20 March 2020;
basic shares outstanding from latest company disclosures
10
5
12
11
37
9
13
14
0
3
2
4
6
8
7
1
Cen
tam
in
Har
mo
ny
Go
ld
Reg
is R
eso
urc
es
Pre
tiu
m
Eld
ora
do
St B
arb
ara
Tore
x
Tera
nga
IAM
GO
LD
Po
lym
etal
Intl
SEM
AFO
Bar
rick
Po
lyu
s
Oce
ana-
Go
ld
No
rth
ern
Sta
r
Go
ld F
ield
s
New
cres
t
An
glo
Go
ld
Ala
mo
s
Kin
ross
Go
ld
B2
Go
ld
Yam
ana
Go
ld
Agn
ico
Eag
le M
ines
Co
mb
ined
En
tity
New
mo
nt
Go
ldco
rp
Evo
luti
on
End
eavo
ur
Cen
terr
a
Kir
klan
d
Res
olu
te
3
Top 15Market Cap of
Combined Entity
STRONG STRATEGIC RATIONALE

ENDEAVOURSEMAFO
21
11%Combined 2019 ROCE
1% 1%
13%
2019A2017A 2018A
5%6%
10%
2017A 2018A 2019A
Return on Capital Employed (ROCE) (1)
Combined entity demonstrates attractive returns following investment phases
(1) EBIT (Adjusted EBITDA as in MD&A less depreciation and amortization) divided by average capital employed (total assets less current liabilities)
ENHANCED CAPITAL MARKET PROFILE 3
14%for H2-2019 annualized
with strong capital allocation discipline
+20% ROCE target
STRONG STRATEGIC RATIONALE
2 3 4
22
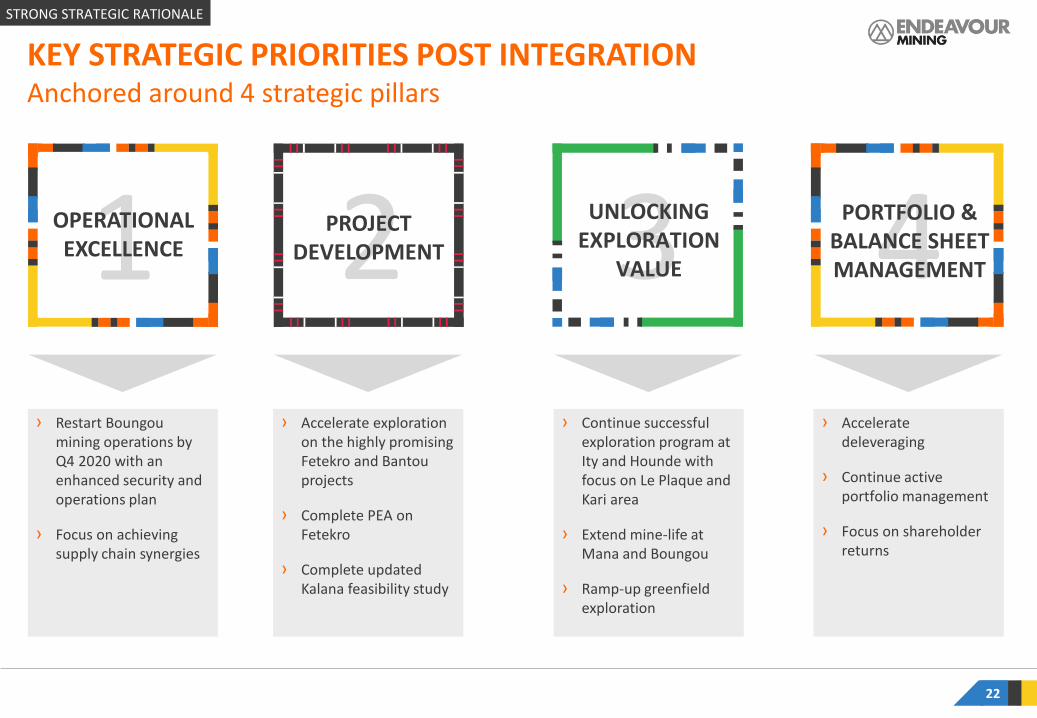
KEY STRATEGIC PRIORITIES POST INTEGRATIONAnchored around 4 strategic pillars
1OPERATIONAL EXCELLENCE
› Restart Boungoumining operations by Q4 2020 with an enhanced security and operations plan
› Focus on achieving supply chain synergies
PROJECT DEVELOPMENT
UNLOCKING EXPLORATION
VALUE
PORTFOLIO & BALANCE SHEET MANAGEMENT
› Accelerate exploration on the highly promising Fetekro and Bantouprojects
› Complete PEA on Fetekro
› Complete updated Kalana feasibility study
› Continue successful exploration program at Ity and Hounde with focus on Le Plaque and Kari area
› Extend mine-life at Mana and Boungou
› Ramp-up greenfield exploration
› Accelerate deleveraging
› Continue active portfolio management
› Focus on shareholder returns
STRONG STRATEGIC RATIONALE
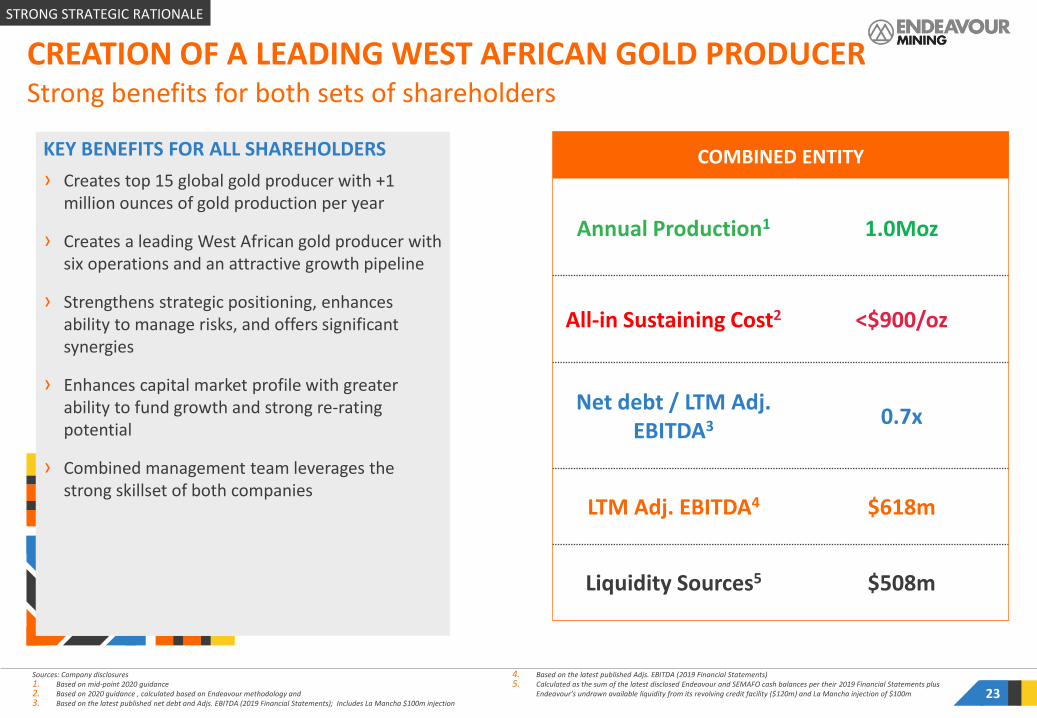
KEY BENEFITS FOR ALL SHAREHOLDERS
› Creates top 15 global gold producer with +1 million ounces of gold production per year
› Creates a leading West African gold producer with six operations and an attractive growth pipeline
› Strengthens strategic positioning, enhances ability to manage risks, and offers significant synergies
› Enhances capital market profile with greater ability to fund growth and strong re-rating potential
› Combined management team leverages the strong skillset of both companies
23
COMBINED ENTITY
Annual Production1 1.0Moz
All-in Sustaining Cost2 <$900/oz
Net debt / LTM Adj. EBITDA3 0.7x
LTM Adj. EBITDA4 $618m
Liquidity Sources5 $508m
Sources: Company disclosures1. Based on mid-point 2020 guidance 2. Based on 2020 guidance , calculated based on Endeavour methodology and 3. Based on the latest published net debt and Adjs. EBITDA (2019 Financial Statements); Includes La Mancha $100m injection
4. Based on the latest published Adjs. EBITDA (2019 Financial Statements)5. Calculated as the sum of the latest disclosed Endeavour and SEMAFO cash balances per their 2019 Financial Statements plus
Endeavour’s undrawn available liquidity from its revolving credit facility ($120m) and La Mancha injection of $100m
CREATION OF A LEADING WEST AFRICAN GOLD PRODUCERStrong benefits for both sets of shareholders
STRONG STRATEGIC RATIONALE

TABLE OF CONTENTSCOMBINATION WITH SEMAFO: CREATION OF A LEADING WEST AFRICAN GOLD PRODUCER1
DETAILS BY MINE AND PROJECT
WEST AFRICA INSIGHTS
APPENDIX
2
3
4
ENDEAVOUR OVERVIEW
5
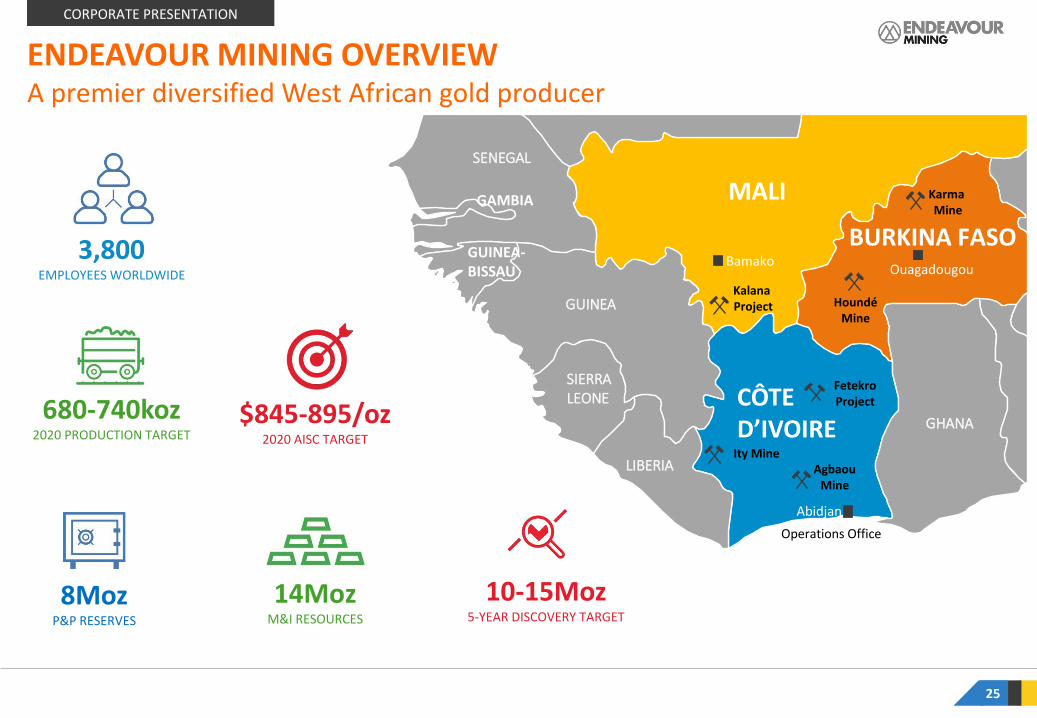
MALI
AgbaouMine
HoundéMine
CÔTE D’IVOIRE GHANA
Karma Mine
Ity Mine
Abidjan
BamakoOuagadougou
GUINEA
SIERRALEONE
SENEGAL
GAMBIA
LIBERIA
GUINEA-BISSAU
Operations Office
BURKINA FASO
KalanaProject
FetekroProject
25
$845-895/oz2020 AISC TARGET
680-740koz2020 PRODUCTION TARGET
3,800EMPLOYEES WORLDWIDE
8MozP&P RESERVES
14MozM&I RESOURCES
10-15Moz5-YEAR DISCOVERY TARGET
ENDEAVOUR MINING OVERVIEWA premier diversified West African gold producer
CORPORATE PRESENTATION

COMPANY PROFILE
26
Share Price Performance
Rank Institution Name % of S/O
1 La Mancha 29.9%
2 BlackRock Investment Management (UK) 14.3%
3 Van Eck Associates 9.7%
4 Elliott Management 2.6%
5 Ninety One UK 2.5%
6 RBC Global Asset Management. 2.4%
7 Federated Global Investment Management. 2.3%
8 The Vanguard Group 2.0%
9 Morgan Stanley Canada 1.8%
10 Franklin Advisers 1.4%
Top Shareholders
Ticker TSX:EDV
Shares Outstanding as at December 31 110m
Share price as at April 15 C$25.58
Market cap as at April 15 US$2.00B
Net Debt as at December 31 US$528m
Shareholder Distribution
MANAGEMENT
1%
LA MANCHA
30%
RETAIL
5%
INSTITUTIONAL
64%
Other
Europe
NorthAmerica
CORPORATE PRESENTATIONSh
are
pri
ce r
ebas
ed t
o 1
00
50
100
150
200
250
300
350
400
31-
Dec
-15
29-
Feb
-16
30-
Ap
r-16
30-
Jun
-16
31-
Au
g-16
31-
Oct
-16
31-
Dec
-16
28-
Feb
-17
30-
Ap
r-17
30-
Jun
-17
31-
Au
g-17
31-
Oct
-17
31-
Dec
-17
28-
Feb
-18
30-
Ap
r-18
30-
Jun
-18
31-
Au
g-18
31-
Oct
-18
31-
Dec
-18
28-
Feb
-19
30-
Ap
r-19
30-
Jun
-19
31-
Au
g-19
31-
Oct
-19
31-
Dec
-19
29-
Feb
-20
Volume Endeavour Mining S&P TSX Global Gold

27
STRATEGIC OBJECTIVES
All-in Sustaining Cost
Production visibilityfrom operating assets
Annual production
700koz to 1Moz
+10 YEARS
<$850/oz
CREATE A PREMIER DIVERSIFIED WEST AFRICAN GOLD PRODUCER
STRATEGIC PILLARS
CORPORATE PRESENTATION
Diversification across multiple
countries and mines
with strong capital allocation discipline
+20% ROCE

OUR HISTORY
28
Strategically repositioned Endeavour as a leading African Gold producer
2015 PROFILE 2020 PROFILE
517koz
4 years
$922/ozAll-in Sustaining
Cost
Production visibilityfrom operating assets
Annual production
680-740koz
10+ years
$845-895/oz
2016 - 2019 TURN-AROUND
$1billion invested
2 flagship mines built
6.3Moz
2 projects in the pipeline
3assets divested
2 assets acquired
CORPORATE PRESENTATION
discovered at $12/oz

29
Newly built Houndé and Ity flagship mines have low AISC and long mine lives
PRODUCTION AND AISC PROFILECORPORATE PRESENTATION
$922/oz $886/oz
20192015 2016 20182017 2020 2021 2022
>800koz
663koz
727koz
$843/oz
680-740koz
$845-895/oz$866/oz
593koz
516koz
Ity CILTabakoto Next potential project (Kalana / Fetekro)
Houndé Karma AgbaouIty HLNzema Youga
651koz
~$813/oz
2015
› Ity HL acquired through strategic partnership with La Mancha
2016
› Youga divested
› Karma acquired
2017
› Houndé build completed
› Kalana project acquired
› Nzema divested
2018
› Tabakoto divested
2019
› Ity CIL build completed
FOCUSED ON BUILDING HOUNDÉ AND ITY CASHFLOW PHASE

London Based
MALI
AgbaouMine
HoundéMine
CÔTE D’IVOIRE
GHANA
Karma Mine
Ity Mine
Abidjan
BamakoOuagadougou
GUINEA
SIERRALEONE
SENEGAL
GAMBIA
LIBERIA
GUINEA-BISSAU
Operations Office
BURKINA FASO
KalanaProject
35min
1h35
2h
2h40
2h
Hands-on management model with teams close to operations
OPERATIONAL EXCELLENCE
30
1
Sebastien de MontessusCEO & Director
Patrick BouissetEVP Exploration & Growth
Morgan Carroll EVP Corporate Finance & General Counsel
Henri de JouxEVP People, Culture & IT
Abidjan Based
Pascal BernasconiEVP Public Affairs, CSR & Security
200km
hours Flight time
CORPORATE PRESENTATION
Mark MorcombeCOO
Louis IrvineCFO

(1)Lost Time Injury Frequency Rate= (Number of LTIs in the Period X 1,000,000)/ (Total man hours worked for the period)(2)The selected peer group based on same reporting metrics, used the latest available data from Centamin (2019), B2Gold (2019), Eldorado Gold (2018), Nordgold (2018), Glencore (2019) and Asanko (2019) 31
Lost Time Injury Frequency Rate(1)
(on a rolling 12-months basis)
0.12LTM Lost Time Injury
Frequency Rate
2 LTIOver the 780 day period
ending Dec. 31, 2019Construction track recordOperating track record
0.66
0.40
0.29
0.160.12
ItyFY2019Peer Average(2)
0.00
HoundéFY2016 FY2017 FY2018 Agbaou
0.00 0.00
Our safety record remained below the industry average
OPERATIONAL EXCELLENCE
CORPORATE PRESENTATION
1
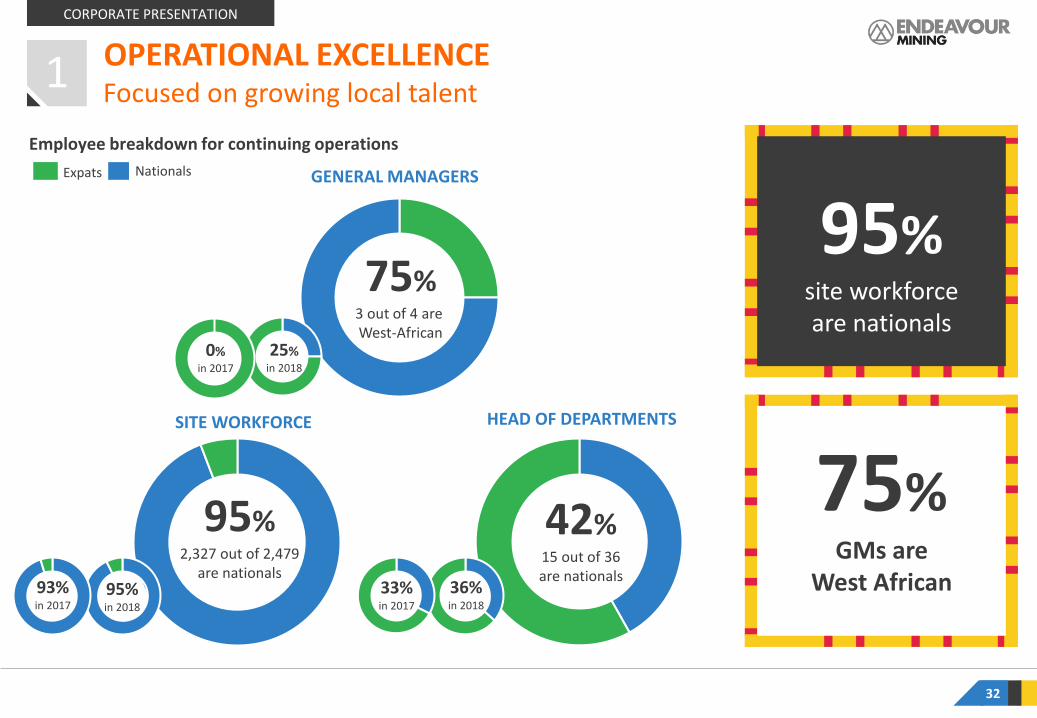
32
Expats
95%site workforce are nationals
75%GMs are
West African
GENERAL MANAGERS
Focused on growing local talent
Nationals
SITE WORKFORCE HEAD OF DEPARTMENTS
75%3 out of 4 are West-African
95%2,327 out of 2,479
are nationals
42%15 out of 36are nationals
Employee breakdown for continuing operations
95%in 2018
93%in 2017
25%in 2018
0%in 2017
36%in 2018
33%in 2017
CORPORATE PRESENTATION
1 OPERATIONAL EXCELLENCE

Adopted from the World Gold Council
› An over-arching framework that sets out clear expectations as to what constitutes responsible gold mining
› Designed to provide confidence to investors, supply chain participants and investors that gold has been produced responsibly
› Implementing companies will be required to publicly disclose conformance and obtain external assurance on this
› Reflects the commitment of the world’s leading gold mining companies to responsible mining
33
CORPORATE PRESENTATION
Adoption of World Gold Council’s Responsible Gold Mining Principles1 OPERATIONAL EXCELLENCE
Responsible gold mining principles
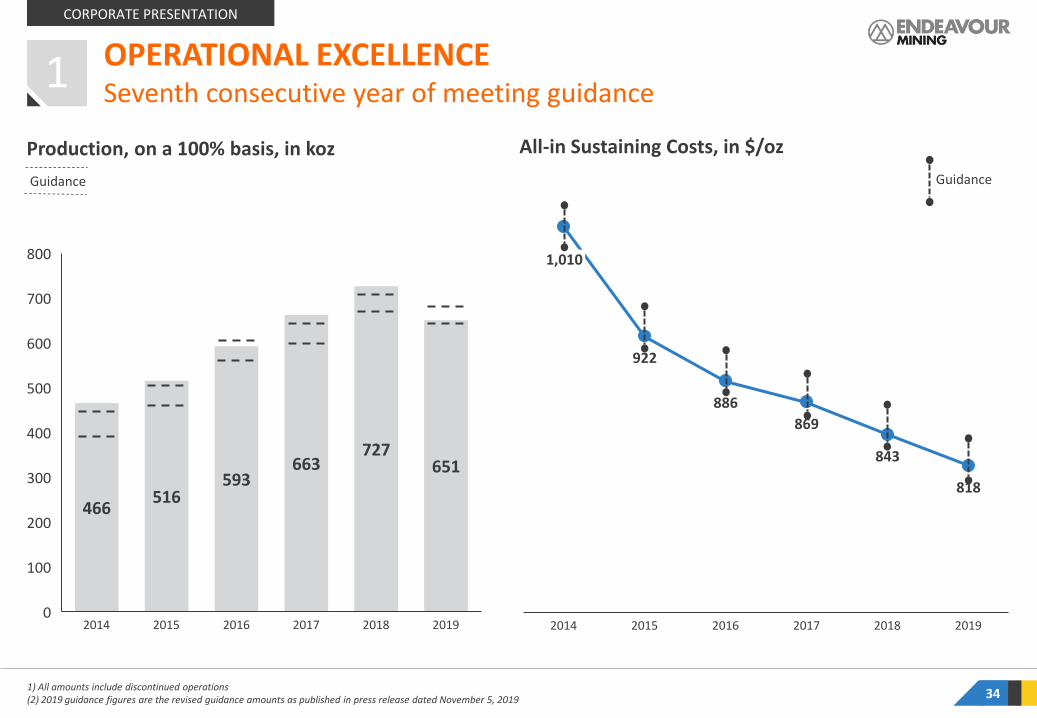
Production, on a 100% basis, in koz
34
Seventh consecutive year of meeting guidance
OPERATIONAL EXCELLENCE
466516
593663
727651
400
0
500
100
700
200
300
600
800
20172014 2015 2016 2018 2019
Guidance
1
All-in Sustaining Costs, in $/oz
922
886
869
843
818
2018
1,010
2014 20192015 20172016
CORPORATE PRESENTATION
1) All amounts include discontinued operations (2) 2019 guidance figures are the revised guidance amounts as published in press release dated November 5, 2019
Guidance
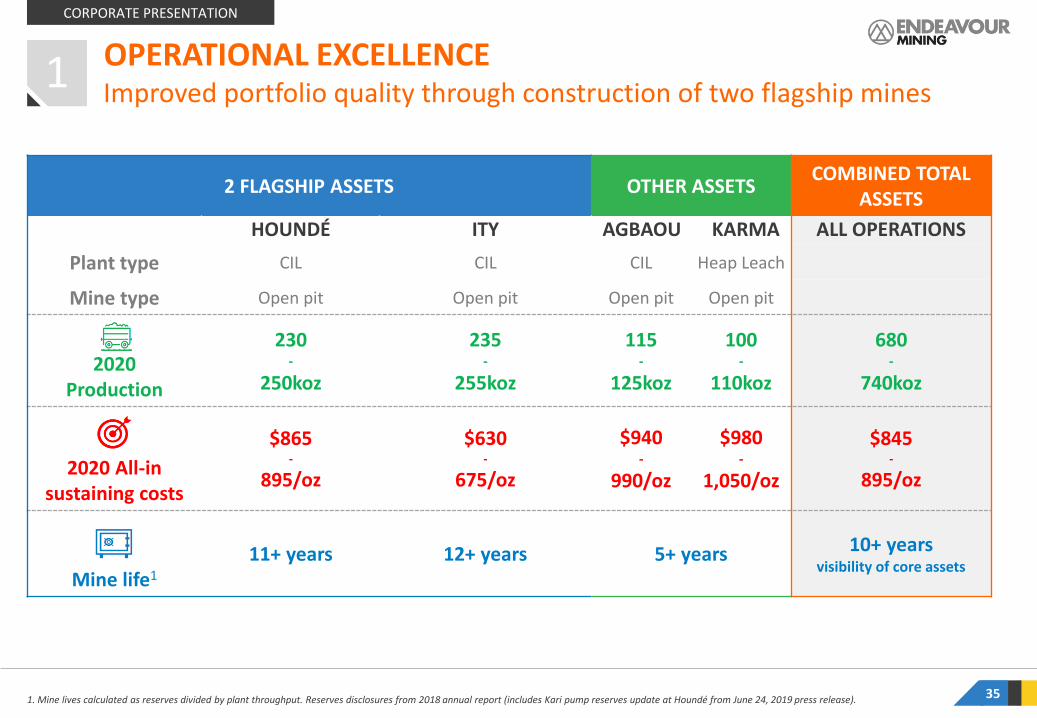
35
Improved portfolio quality through construction of two flagship mines
CORPORATE PRESENTATION
OPERATIONAL EXCELLENCE1
2 FLAGSHIP ASSETS OTHER ASSETSCOMBINED TOTAL
ASSETS
HOUNDÉ ITY AGBAOU KARMA ALL OPERATIONS
Plant type CIL CIL CIL Heap Leach
Mine type Open pit Open pit Open pit Open pit
2020Production
230-
250koz
235-
255koz
115-
125koz
100-
110koz
680-
740koz
2020 All-in sustaining costs
$865-
895/oz
$630-
675/oz
$940-
990/oz
$980-
1,050/oz
$845-
895/oz
Mine life1
11+ years 12+ years 5+ years 10+ yearsvisibility of core assets
1. Mine lives calculated as reserves divided by plant throughput. Reserves disclosures from 2018 annual report (includes Kari pump reserves update at Houndé from June 24, 2019 press release).

Strong construction track record
CEO INTRODUCTION
NZEMA, GHANA, BUILT IN 2010
36
AGBAOU, CÔTE D’IVOIRE, BUILT IN 2014
HOUNDÉ, BURKINA FASO, BUILT IN 2017
COMPLETIONMOST RECENT MINE BUILDS
0 LTIs
ON-BUDGET
ON-SCHEDULE
ITY CIL, CÔTE D’IVOIRE, BUILT IN 2019
CORPORATE PRESENTATION
PROJECT DEVELOPMENT2

› Examples of self-performed tasks:
‒ Civil works with own concrete plant
‒ Earthworks with own equipment
‒ Tailings storage facility earthworks
‒ Bolted tank construction vs traditional welded tank construction
‒ Electricals, overhead powerlines
‒ Resettlements
PROJECT DEVELOPMENT
37
Self-performing tasks driving cost savings
+25%
+60%
+94% +95%
Ity CILNzema Agbaou Houndé
% of self-performed tasks
CORPORATE PRESENTATION
2
Concrete plant and civils Bolted CIL tanks Tailings storage facility (TSF)
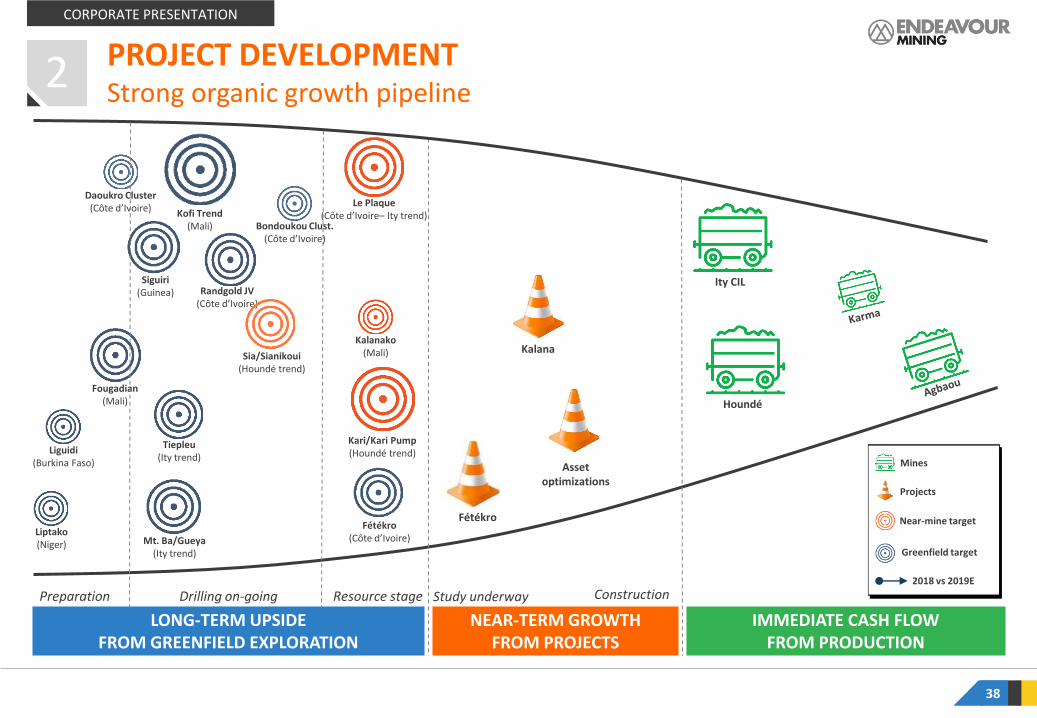
38
Strong organic growth pipeline
LONG-TERM UPSIDE FROM GREENFIELD EXPLORATION
NEAR-TERM GROWTH FROM PROJECTS
IMMEDIATE CASH FLOW FROM PRODUCTION
Kalana
Houndé
Randgold JV(Côte d’Ivoire)
Fétékro(Côte d’Ivoire)
Kofi Trend(Mali)
Liguidi(Burkina Faso)
Daoukro Cluster(Côte d’Ivoire)
Mt. Ba/Gueya(Ity trend)
Siguiri(Guinea)
Liptako(Niger)
Le Plaque(Côte d’Ivoire– Ity trend)
Bondoukou Clust.(Côte d’Ivoire)
Kari/Kari Pump(Houndé trend)
Tiepleu(Ity trend)
Sia/Sianikoui(Houndé trend)
Fougadian(Mali)
Resource stageDrilling on-goingPreparation
Kalanako(Mali)
Ity CIL
Fétékro
Mines
Projects
Near-mine target
Greenfield target
2018 vs 2019E
Assetoptimizations
PROJECT DEVELOPMENT
CORPORATE PRESENTATION
2
Study underway Construction

391) Kalana Reserves sourced from the 2018 annual report and resources sourced from press release dated Mar 5, 2019. Fetekro Resource sourced from Sept 3, 2019 press release.2) Sourced from Avnel DFS
Kalana Fetekro
Country
Mali Côte D’Ivoire
StatusUpdated Feasibility Study in
H2-2020PEA expected
in Q2-2020
Reserves1 (Moz) 1.96 n/a
Reserve Grade1 (g/t) 2.81 n/a
M&I Resources1 (Moz) 2.09 1.19
M&I Resource grade1 (Moz) 3.70 2.54
INSIGHTS
› While the main focus for 2020 will be on cash flow generation, Endeavour will also continue to build optionality within the portfolio by advancing studies and conducting more exploration on both its Fetekro and Kalana projects
› Studies are underway with the aim of publishing a PEA on Fetekro in Q2-2020 and a Feasibility Study on Kalanain H2-2020
› Based on the outcome of these studies and Endeavour’s capital allocation strategy, the Kalana and Fetekroproject investment cases will be reviewed against each other and other internal growth opportunities
Advancing optionality in portfolio - updated studies in 2020
PROJECT DEVELOPMENT
CORPORATE PRESENTATION
2
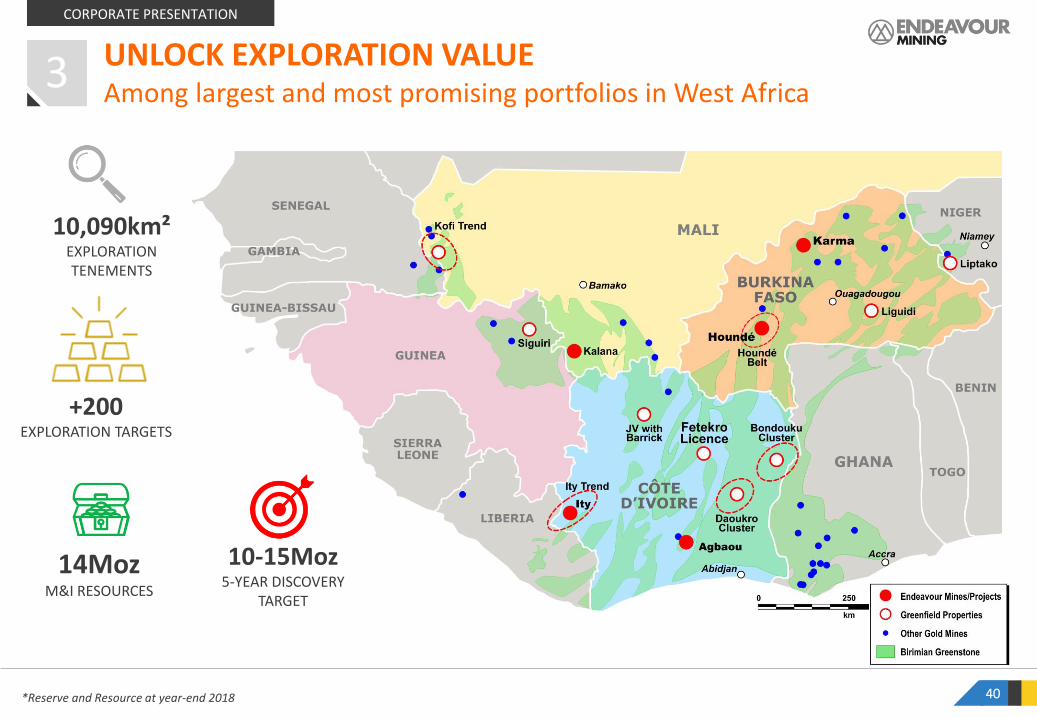
*Reserve and Resource at year-end 2018 40
UNLOCK EXPLORATION VALUEAmong largest and most promising portfolios in West Africa
14MozM&I RESOURCES
10,090km²EXPLORATION TENEMENTS
+200EXPLORATION TARGETS
3
10-15Moz5-YEAR DISCOVERY
TARGET
CORPORATE PRESENTATION
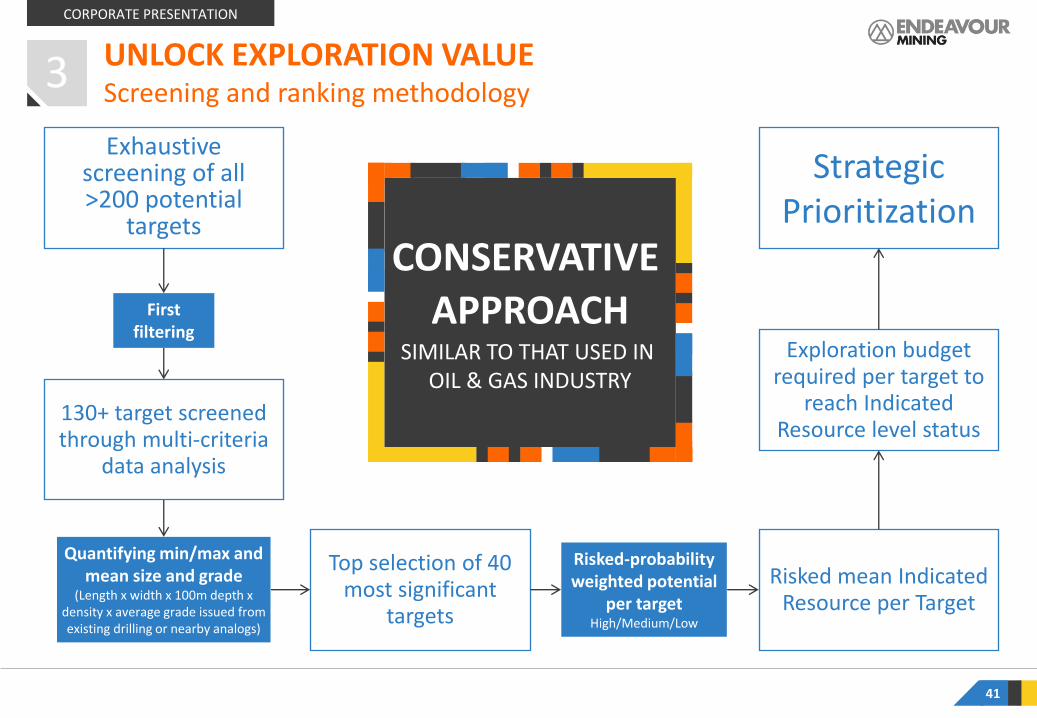
Screening and ranking methodology
41
Exhaustive screening of all >200 potential
targets
130+ target screened through multi-criteria
data analysis
First filtering
Quantifying min/max and mean size and grade
(Length x width x 100m depth x density x average grade issued from existing drilling or nearby analogs)
Top selection of 40 most significant
targets
Risked mean Indicated Resource per Target
Risked-probability weighted potential
per targetHigh/Medium/Low
Exploration budget required per target to
reach Indicated Resource level status
Strategic Prioritization
UNLOCK EXPLORATION VALUE3
CONSERVATIVE APPROACH
SIMILAR TO THAT USED IN OIL & GAS INDUSTRY
CORPORATE PRESENTATION

42
10-15Moz 5-year Indicated
Resource discovery target
Note: See Investor Day Presentation on EDV website for full details. Based on average gold grade of 2.0-3.5g/t for Greater Ity, 1.8-2.5g/t for Houndé, 2.0-4.0g/t for Tabakoto, 1.0-1.5g/t for Karma and 1.5-3.0g/t for Côte d’Ivoire regional. The potential quantity of ounces is conceptual in nature since there has been insufficient exploration to define a mineral resource and since it is uncertainif exploration will result in the targets being delineated as a mineral resource. .
Indicated discovery target by area as published in Nov. 2016
UNLOCK EXPLORATION VALUEStarting to deliver against our 5-year strategy
3
CORPORATE PRESENTATION
2.0Moz
0.5Moz
Agbaou
2.1MozDiscovered
Tabakoto(sold mine, retained
Kofi exploration)
Greater Ity Houndé
0.5Moz
Karma
1.2Moz
Côte d’Ivoire Regional
4.0-6.0Moz4.0-6.0Moz
2.5-3.5Moz
1.5-2.5Moz
0.5-1.5Moz 0.5-1.5Moz
0.5-1.0Moz target exceeded
43
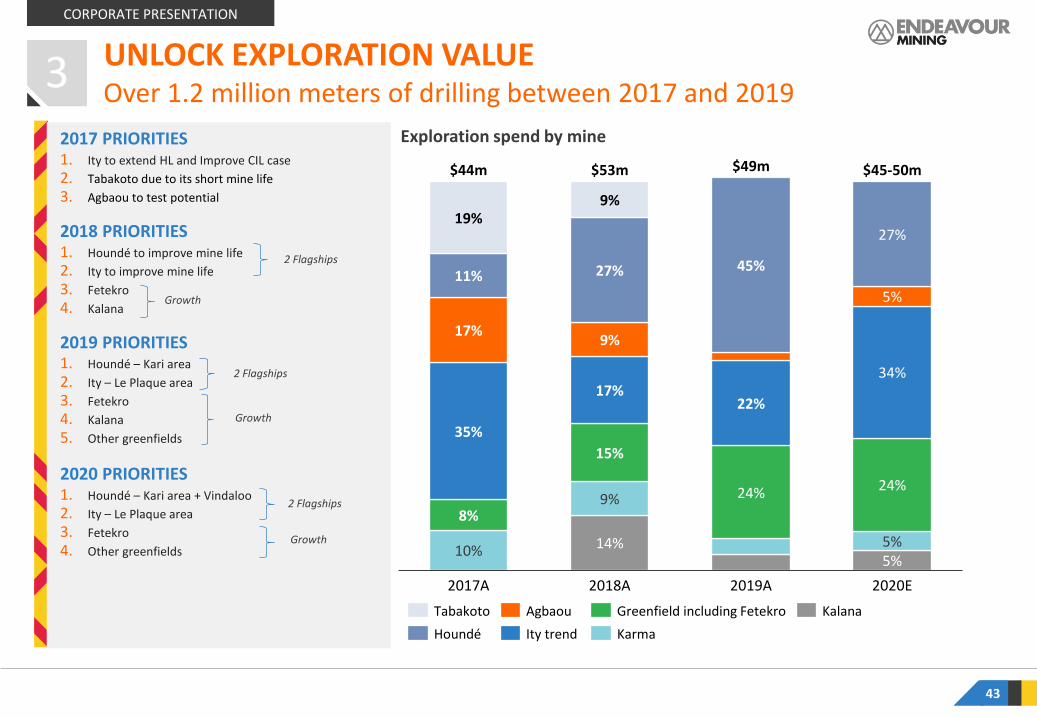
Over 1.2 million meters of drilling between 2017 and 2019
Exploration spend by mine
3 UNLOCK EXPLORATION VALUE
CORPORATE PRESENTATION
17%
$53m
2020E2017A
8%
19%
34%
11%
2018A
9%
35%
10%
27%
9%
17%
15%
9%
14%
45%
22%
24%
2019A
27%
5%
24%
5%5%
$44m $49m $45-50m
Tabakoto
Ity trend
Greenfield including Fetekro
Houndé
Agbaou
Karma
Kalana
2017 PRIORITIES1. Ity to extend HL and Improve CIL case
2. Tabakoto due to its short mine life
3. Agbaou to test potential
2018 PRIORITIES1. Houndé to improve mine life
2. Ity to improve mine life
3. Fetekro
4. Kalana
2019 PRIORITIES1. Houndé – Kari area
2. Ity – Le Plaque area
3. Fetekro
4. Kalana
5. Other greenfields
2020 PRIORITIES1. Houndé – Kari area + Vindaloo
2. Ity – Le Plaque area
3. Fetekro
4. Other greenfields
2 Flagships
Growth
2 Flagships
Growth
2 Flagships
Growth

Total Indicated discoveries and targets
44
6.3Mozdiscovered from mid-
2016 to YTD 2019
63%of 5-year target
achieved after 3 years
On track to meet 5-year exploration targets
1.3Moz
1.9Moz
2.1Moz
1.5-2.5Moz
2019AH2-2016A 2021E2017A 2018A 2020E Total
1.0Moz
1.5-2.5Moz 10-15Moz
10%
23%
42%
63%
80%
100%
Indicated resources discovered
Indicated resources targeted
Cumulative Indicated resources against 5-year discovery target%
3 UNLOCK EXPLORATION VALUE
CORPORATE PRESENTATION

45
BAKATOUO (ITY)
704Koz
LE PLAQUE (ITY)
<2 YEARS
476Koz
KARI PUMP( HOUNDÉ)
1Moz
KARI W+C (HOUNDÉ)
1Moz
FETEKRO
1.2MozM&I RESOURCES
P&P RESERVES
DISCOVERY COST
TIME FROM DISCOVERY TO PRODUCTION
532Koz 415Koz 710koz Expected in Q2-2020
n/a
~3 YEARS 3 YEARS n/a
RESERVE GRADE VS.
MINE GRADE +42% +50% +48% n/a n/a
$10/oz $15/oz $9/oz $15/oz $9/oz
n/a
at 2.40 g/t at 2.34 g/t at 3.01 g/t
at 2.54 g/t at 1.61 g/t
Quickly bringing high quality discoveries into production 3 UNLOCK EXPLORATION VALUE
CORPORATE PRESENTATION

UNLOCK EXPLORATION VALUE
46
>2 g/tgrade of 75% of
discovered ounces
34% oxide 66% fresh
No sulfides
High quality discoveries made
CORPORATE PRESENTATION
3
Discovery grades for Indicated resources by deposit
2.70g/t2.54g/t
2.20g/t 2.14g/t 2.14g/t 2.10g/t
1.71g/t
1.50g/t
1.27g/t 1.20g/t
Le Plaque(Ity)
Bakatouo(Ity)
Kari Pump
(Houndé)
Fetekro (CI
Regional)
Mt Ity (Ity)
Colline Sud(Ity)
Rambo (Karma)
Kari West (Houndé)
Daapleu(Ity)
Kao North
(Karma)
Kari Center
(Houndé)
3.20g/t
From mid-2016 to end of 2019 unless indicated otherwise
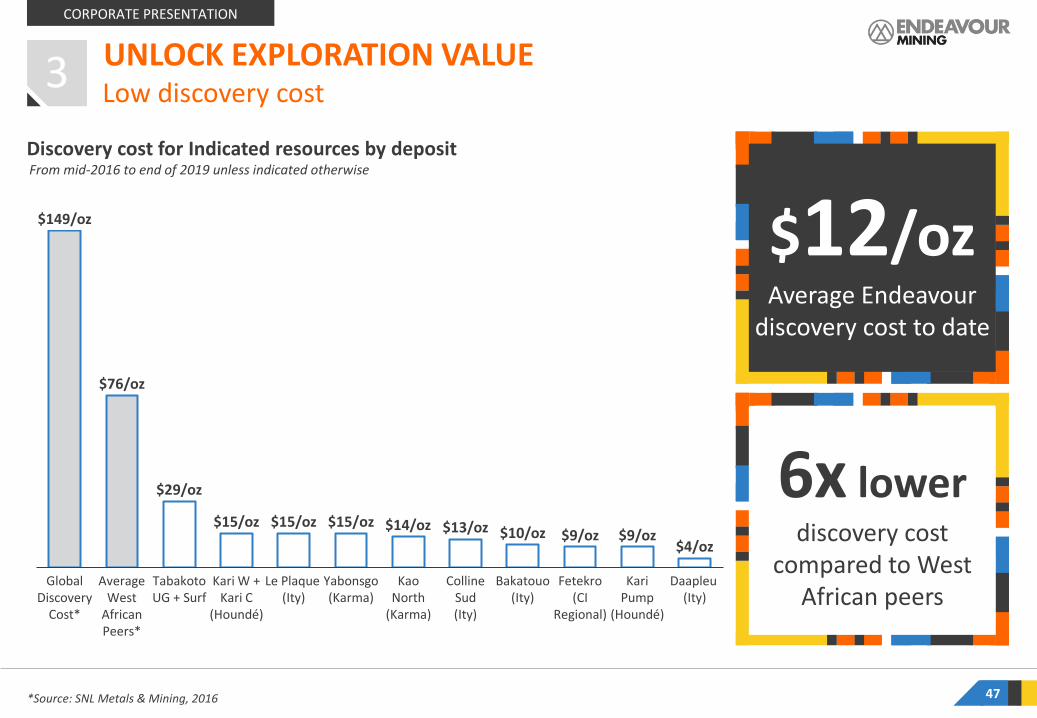
*Source: SNL Metals & Mining, 2016 47
$12/ozAverage Endeavour
discovery cost to date
6x lowerdiscovery cost
compared to West African peers
Low discovery cost
CORPORATE PRESENTATION
3 UNLOCK EXPLORATION VALUE
Discovery cost for Indicated resources by deposit
$149/oz
$76/oz
$29/oz
$15/oz $15/oz $15/oz $14/oz $13/oz $10/oz $9/oz $9/oz$4/oz
Yabonsgo(Karma)
Global Discovery
Cost*
Average West
African Peers*
Tabakoto UG + Surf
Le Plaque (Ity)
Colline Sud (Ity)
Kari W + Kari C
(Houndé)
Kao North
(Karma)
Bakatouo(Ity)
Fetekro (CI
Regional)
Kari Pump
(Houndé)
Daapleu (Ity)
From mid-2016 to end of 2019 unless indicated otherwise

Ity production plan(As per 2017 Optimized Study (3), based on 4Mtpa plant and excludes Le Plaque discovery)
(1) Mine reserve grade as at Dec. 31, 2018 as published in press release dated March 5, 2019. Le Plaque grade based on indicated resource as published on July 8, 2019 and Kari Pump grade based on reserves as published on Jun 24, 2019. (2) See page 51 of this presentation for the production cost breakdown. (3) Ity and Houndé based on Optimized study plans as published in April 2016 and September 2017 respectively.
Exploration demonstrates potential for +250koz for 10 years at flagship mines
213koz
Year 1
162koz
Year 3
201koz
Year 6
159koz
Year 9
250koz
Year 2
238koz250koz
Year 8Year 4 Year 7
190koz224koz
Year 5 Year 10
151koz
0.5Moz of total reserve additions required
Production as per study
Year 5 Year 12
123koz
Year 9Year 7Year 4
218koz 217koz
Year 1 Year 2 Year 8Year 3
175koz
223koz 222koz
107koz
Year 6 Year 11
124koz
Year 10
48
Actual As per study
DISCOVERIES MADE SINCE STUDIES WERE PUBLISHED
LE PLAQUE(ITY)
KARI AREA(HOUNDÉ)
Discovery cost, $/oz of indicated resource
$15/oz $12/oz
M&I Resource added
0.5Moz 2.0Moz
Reserves added
0.4Moz710koz(for Kari
Pump only)
Reserve additionsrequired to achieve 10 years of flat 250koz/year
+0.5Moz +1.1Moz
Reserves additions expected in H1-2020
Le Plaque extensions
Kari West and Kari Centre
Houndé production plan(As per 2016 Optimized Study, excludes Kari Pump discovery)
Le Plaque expected to fill the gap
(started Q2-’19)
(started Q4-’17)
Kari Pump, Kari West and Kari Centerexpected to fill the gap
1.1Moz of total reserve additions required
Production as per study
3 UNLOCK EXPLORATION VALUE
CORPORATE PRESENTATION
UPDATED TECHNICAL REPORTS AND MINE PLANS EXPECTED TO BE PUBLISHED IN Q2-2020
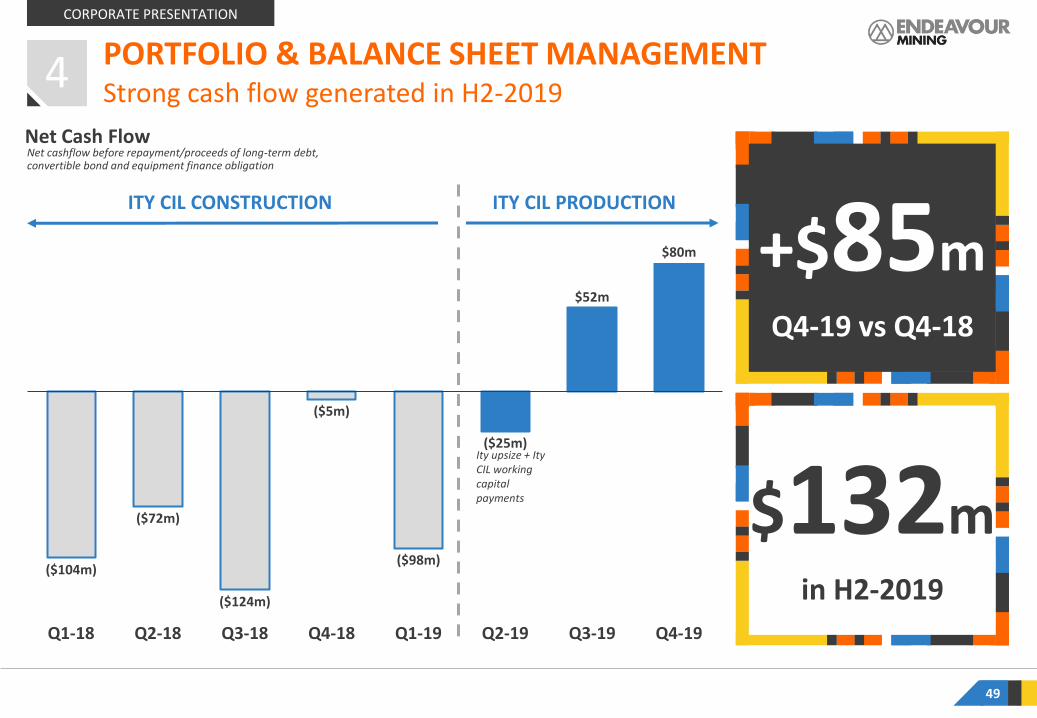
Net cashflow before repayment/proceeds of long-term debt, convertible bond and equipment finance obligation
49
+$85mQ4-19 vs Q4-18
$132min H2-2019
Net Cash Flow
ITY CIL CONSTRUCTION ITY CIL PRODUCTION
($104m)
($72m)
($124m)
($5m)
($98m)
($25m)
$52m
$80m
Q4-19Q1-19Q1-18 Q2-18 Q3-18 Q4-18 Q2-19 Q3-19
Ity upsize + ItyCIL working capital payments
Strong cash flow generated in H2-2019
CORPORATE PRESENTATION
PORTFOLIO & BALANCE SHEET MANAGEMENT4

50
$132mNet Debt reduced
H1-2019 vs. FY-2019
-20%Net Debt reduced
H1-2019 vs. FY-2019
Net Debt Reduction
DEBT REDUCTION PHASE
INVESTMENT PHASE
$536m $536m
$635m$660m
$608m
1.79x1.97x
2.96x2.75x
1.94x
1.48x
Q2-19 Q3-19Q3-18 Q1-19Q4-18 Q4-19
$528m
-$132m
Ity capex incurred the period
Ity capex remaining
Net Debt / Adj. EBITDA (LTM)
Net Debt
Leverage expected to decrease to below 1.0x Net Debt/EBITDA by year end
CORPORATE PRESENTATION
PORTFOLIO & BALANCE SHEET MANAGEMENT4

51
6% 6%
10%
2017 2018 2019 2020E
Group Return on Capital Employed
Focus on returns following investments – ROCE target of +20%
Return on Capital Employed (ROCE) by asset
Karma16%
Agbaou10%
Ity26%
Hounde30%
Kalana & Other
18%
25% 32%
2018A 2019A 2020E
6% 27%
2018A 2019A 2020E
-11% -10%
2020E2018A 2019A
28%14%
2020E2018A 2019A
Capital Employed
ITY ROCEExpected to increase based on higher 2020 production
HOUNDE ROCEExpected to increase based on higher 2020 production
AGBAOU ROCEExpected to decrease based on lower 2020 production
KARMA ROCEExpected to increase based on higher 2020 production
ROCE (Adjusted EBITDA as in MD&A less depreciation and amortization) divided by average capital employed (total assets less current liabilities)
CORPORATE PRESENTATION
PORTFOLIO & BALANCE SHEET MANAGEMENT4

52
Exposure to strong fundamentals and with upside potential
INVESTMENT PROPOSITION
STRONG FUNDAMENTALS
› High quality asset base generating strong free cash flow yield
› Capital allocation discipline with >20% ROCE target
› Strong organic growth potential
ATTRACTIVE VALUE PROPOSITION
› Rapid deleveraging expected to accelerate dividend strategy
› Short-term growth with minimal capex from high grade discoveries at Ity and Houndé
› Long-term growth with 2 projects and exposure to fastest growing gold region
PROVEN MANAGEMENT TEAM
› Met production guidance for the past 7 years
› Built 4 mines on time and on budget over past 10 years
› Discovered 6.3Moz at >$15/oz over past 3 years
UPCOMING CATALYSTS
TIMING CATALYST
Q2-2020 HoundéMaiden reserve for the Kari West and Kari Center
discoveries
Q2-2020 Houndé & ItyUpdated technical reports with mine plans including new
reserves
Q2-2020 Fetekro PEA and resource estimate update
Late-2020 Houndé Commence mining Kari Pump higher grade deposit
Long-Term Upside
from Exploration
Near-TermGrowth from Projects
Immediate Cashflow from Production
CORPORATE PRESENTATION
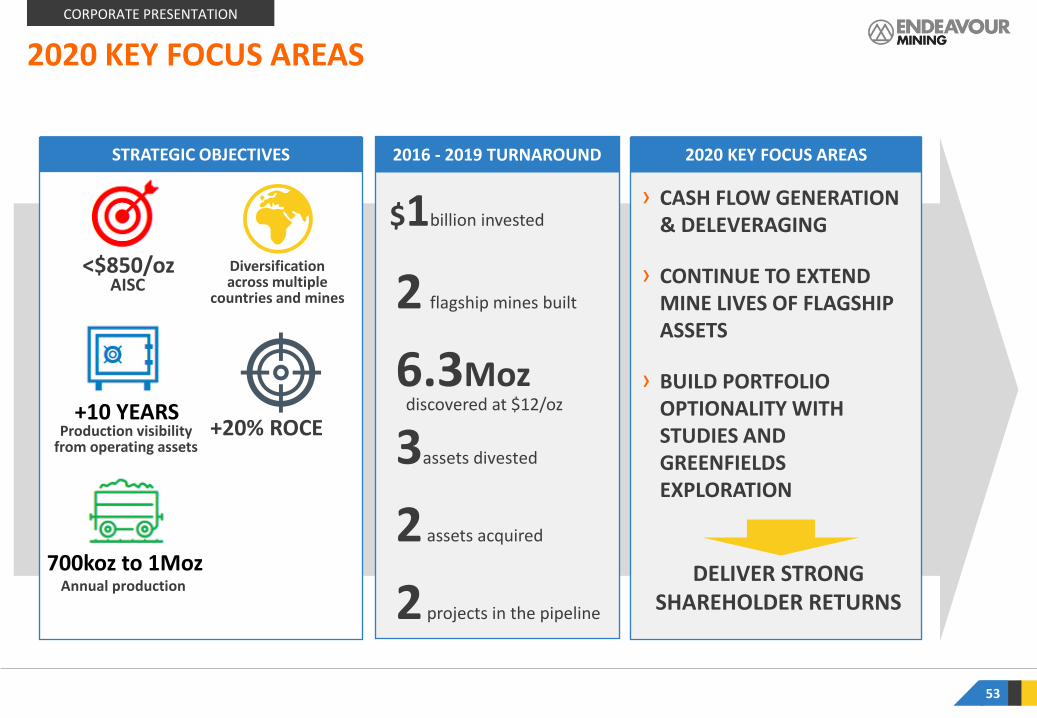
2020 KEY FOCUS AREAS
53
2016 - 2019 TURNAROUND
$1billion invested
2 flagship mines built
6.3Moz
2 projects in the pipeline
3assets divested
2 assets acquired
discovered at $12/oz
2020 KEY FOCUS AREAS
› CASH FLOW GENERATION & DELEVERAGING
› CONTINUE TO EXTEND MINE LIVES OF FLAGSHIP ASSETS
› BUILD PORTFOLIO OPTIONALITY WITH STUDIES AND GREENFIELDS EXPLORATION
STRATEGIC OBJECTIVES
AISC
Production visibilityfrom operating assets
Annual production
700koz to 1Moz
+10 YEARS
<$850/oz Diversification across multiple
countries and mines
+20% ROCE
DELIVER STRONG SHAREHOLDER RETURNS
CORPORATE PRESENTATION

INSIGHTS› Group production is expected to increase to 680-740koz
in 2020 at an AISC of $845-895/oz. Production is expected to be higher and AISC lower during the latter portion of the year, notably due to the expected commissioning of the higher-grade Kari Pump deposit at Houndé.
‒ Ity: Production is expected to increase as the mine has its first full year of production with costs slightly higher as a greater proportion of fresh ore is mined
‒ Houndé: Production is expected to increase and costs remain fairly flat. The top end of the production guidance and low end of AISC guidance incorporates the potential to start mining the higher-grade Kari Pump deposit in the latter portion of the year, for which the permitting process is underway
‒ Agbaou: Production is expected to slightly decrease and costs increase due to harder ore being mined
‒ Karma: Production and costs are expected to increase as mining continues at Kao North and sustaining capex increases
2020 GUIDANCE
54
Production Guidance
AISC Guidance
2019
ACTUALS
2020 FULL-YEAR
GUIDANCE(All amounts in koz, on a 100% basis)
Agbaou 138 115 - 125
Ity HL 3 n.a. - n.a.
Ity CIL 190 235 - 255
Karma 97 100 - 110
Houndé 223 230 - 250
GROUP PRODUCTION 651 680 - 740
2019 ACTUALS 2020 FULL-YEAR
GUIDANCE(All amounts in US$/oz)
Agbaou 796 940 - 990
Ity HL 1,086 n.a. - n.a.
Ity CIL 616 630 - 675
Karma 903 980 - 1,050
Houndé 862 865 - 895
Corporate G&A 39 30
Sustaining exploration - 5
GROUP AISC 818 845 - 895
CORPORATE PRESENTATION
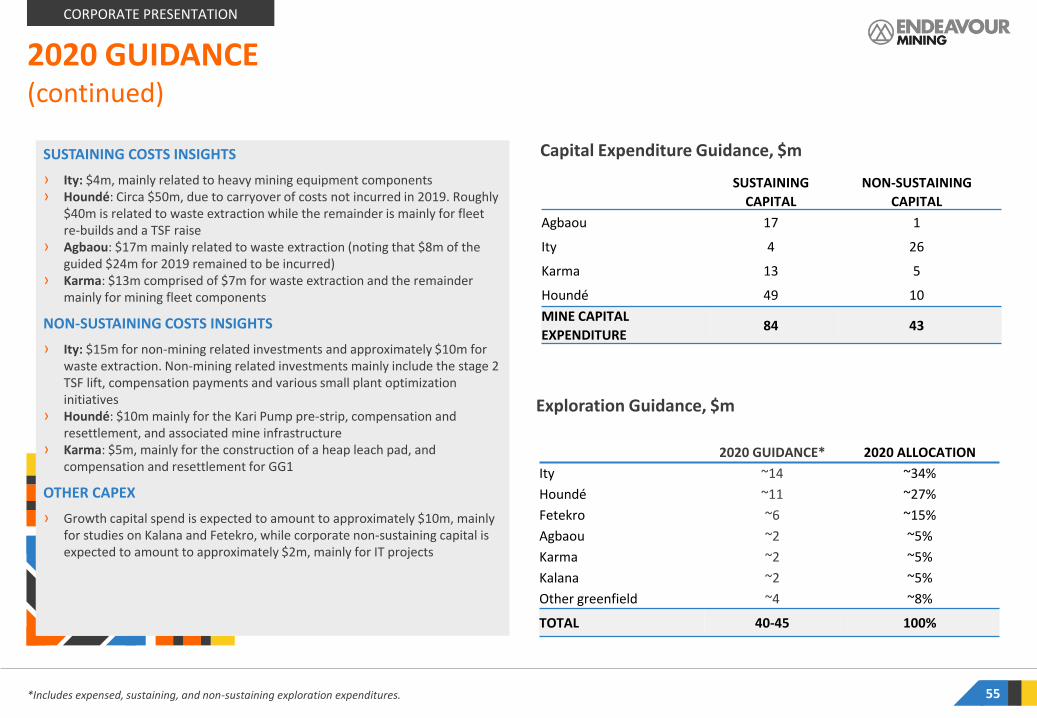
SUSTAINING COSTS INSIGHTS
› Ity: $4m, mainly related to heavy mining equipment components› Houndé: Circa $50m, due to carryover of costs not incurred in 2019. Roughly
$40m is related to waste extraction while the remainder is mainly for fleet re-builds and a TSF raise
› Agbaou: $17m mainly related to waste extraction (noting that $8m of the guided $24m for 2019 remained to be incurred)
› Karma: $13m comprised of $7m for waste extraction and the remainder mainly for mining fleet components
NON-SUSTAINING COSTS INSIGHTS
› Ity: $15m for non-mining related investments and approximately $10m for waste extraction. Non-mining related investments mainly include the stage 2 TSF lift, compensation payments and various small plant optimization initiatives
› Houndé: $10m mainly for the Kari Pump pre-strip, compensation and resettlement, and associated mine infrastructure
› Karma: $5m, mainly for the construction of a heap leach pad, and compensation and resettlement for GG1
OTHER CAPEX
› Growth capital spend is expected to amount to approximately $10m, mainly for studies on Kalana and Fetekro, while corporate non-sustaining capital is expected to amount to approximately $2m, mainly for IT projects
2020 GUIDANCE
55
(continued)
Capital Expenditure Guidance, $m
*Includes expensed, sustaining, and non-sustaining exploration expenditures.
Exploration Guidance, $m
SUSTAINING
CAPITAL
NON-SUSTAINING
CAPITAL
Agbaou 17 1
Ity 4 26
Karma 13 5
Houndé 49 10
MINE CAPITAL
EXPENDITURE84 43
2020 GUIDANCE* 2020 ALLOCATION
Ity ~14 ~34%
Houndé ~11 ~27%
Fetekro ~6 ~15%
Agbaou ~2 ~5%
Karma ~2 ~5%
Kalana ~2 ~5%
Other greenfield ~4 ~8%
TOTAL 40-45 100%
CORPORATE PRESENTATION
TABLE OF CONTENTSCOMBINATION WITH SEMAFO: CREATION OF A LEADING WEST AFRICAN GOLD PRODUCER1
DETAILS BY MINE AND PROJECT
WEST AFRICA INSIGHTS
APPENDIX
2
3
4
ENDEAVOUR OVERVIEW
5

NAME COUNTRYMINE
PRODUCTION1
(Koz)
AISC1
(US$/oz)RESERVES
(Moz)RESERVE GRADE2
(g/t)
GOLD M&I RESOURCES2
(Moz)
M&I RESOURCE GRADE2
(g/t)
End
eav
ou
r
Houndé Burkina Faso 240 880 2.16 2.10 3.89 2.00
Ity Côte D’Ivoire 245 653 3.14 1.60 3.85 1.50
Agbaou Côte D’Ivoire 120 965 0.32 1.58 0.52 2.14
Karma Burkina Faso 105 1,015 0.29 0.99 2.35 1.39
SEM
AFO
Boungou Burkina Faso 140 703 1.23 3.72 1.84 3.55
Mana Burkina Faso 195 1,085 1.41 2.91 4.11 2.17
1. 2020 guidance based on mid-points2. Endeavour numbers sourced from reserves and resources disclosures from 2019 Management Discussion and Analysis. Figures presented on a 100% basis; resources inclusive of reserves and exclusive of inferred resources. Mineral resources that are not mineral reserves do not have demonstrated economic viability
57
DIVERSIFIED PORTFOLIO6 producing mines
CORPORATE PRESENTATION

58
Houndé Mine
Ouagadougou
Karma Mine
QUICK FACTS (ON 100% BASIS)
Ownership 90% EDV, 10% Burkina Faso
Resources(incl. of Reserves)
M&I: 60.4Mt @ 2.01 g/t for 3.893MozInferred: 6.9Mt @ 2.07 g/t for 0.456Moz
Reserves 32.6Mt @ 2.06 g/t for 2.164Moz
CIL Plant Processing Rate Nameplate: 3.0Mtpa, 2019A: 4.1Mtpa
Open Pit Strip Ratio 8.4 (LOM), 2019A: 11.9
Gold Recovery 93% (LOM), 2019A: 93%
Mining Type Open pit / Owner Mining
Production
AISC (Mine-level)
2018A - $564/oz
2019A - $862/oz
2020E - $865-895/oz
Tax regime 17.5 - 27.5% Corporate tax
TIMELINE
2018A
230-250koz2020E
2017A
2019A
277koz
69koz
223koz
HOUNDÉ MINE, BURKINA FASOOverview
CORPORATE PRESENTATION

Production and AISCQ4-2019 vs Q3-2019 INSIGHTS
› Production remained flat as slightly higher throughput was offset by lower processed grades
‒ Mining focused mainly on the Vindaloo Main and Bouéré pits. Total tonnes of ore mined decreased as mining activities continued to prioritise waste extraction, in particular at the Vindaloo pit due to delays caused by the severe rainy season in Q3-2019.
‒ Tonnes milled increased slightly, continuing to perform nearly 30% above nameplate capacity while the ore blend continued to be mainly transitional/fresh ore.
‒ Processed grades decreased, despite a circa 20% increase in mined grades, as low-grade stockpiles supplemented the mill feed.
‒ Recovery rates remained flat.
› AISC decreased mainly due to lower sustaining capital and unit processing costs which was partially offset by higher unit mining costs.
59
HOUNDÉ MINE, BURKINA FASOQ4 benefited from higher throughput and lower strip ratio
55koz
Q2-2019Q4-2018 Q1-2019 Q3-2019
76koz
Q4-2019
58koz 55koz 55koz
Production, koz AISC, US$/oz
$781/oz$588/oz
$836/oz$954/oz
Key Performance Indicators
$878/oz
For The Quarter Ended Q4-2019 Q3-2019 Q4-2018 FY-2019 FY-2018
Tonnes ore mined, kt 622 661 1,736 2,969 5,822
Strip ratio (incl. waste cap) 13.94 14.67 5.87 11.87 6.13
Tonnes milled, kt 1,052 1,015 1,062 4,144 3,948
Grade, g/t 1.78 1.85 2.38 1.83 2.29
Recovery rate, % 92% 92% 93% 93% 94%
PRODUCTION, KOZ 55 55 76 223 277
Cash cost/oz 719 687 508 666 459
AISC/OZ 878 954 588 862 564
CORPORATE PRESENTATION

60
FY-2019 INSIGHTS
› As guided, production decreased and AISC increased due to low grade stockpiles supplementing the mill feed and a shift to processing a higher proportion of harder fresh ore compared to 2018 which benefited from high grade soft oxide ore and a lower strip ratio
2020 OUTLOOK› Houndé is expected to produce between 230-250koz in
2020 at an AISC of $865-895/oz
› Mining is expected to mainly be focused on the Vindalooand Bouéré pits. The top end of the production guidanceand low end of AISC guidance incorporates the potential tostart mining the higher-grade Kari Pump deposit in thelatter portion of the year, for which the permitting processis underway. The overall strip ratio is expected to remainhigh in H1-2020
› The plant is expected to continue to perform abovenameplate capacity with the overall ore blend expected tobe predominantly fresh ore
› Low grade stockpiles are expected to supplement the millfeed in H1-2020, while mining focuses on waste extraction,resulting in a higher processed grade in the second half
$862/oz
$335/oz
69koz
$865-895/oz
2017A
$565/oz
2018A 2019A 2020E
277koz
223koz
230-250koz
AISC ($/oz) Production (koz)
Production and AISC
HOUNDÉ MINE, BURKINA FASOPotential to start mining Kari Pump in the latter portion of the year
CORPORATE PRESENTATION

(1) Mine reserve grade as at Dec 31, 2018 as published in press release dated Mar 5, 2019. Kari Pump grade based on reserves as published on Jun 24, 2019. (2) Based on Optimized study plans as published on respectively April 2016.(3) Updated technical report will include the added reserves for Kari Pump and the added resources for Kari West and Kari Centre 61
Year 3
223koz
Year 7
124koz123koz
218koz
Year 8Year 4
217koz
Year 11
222koz
107koz
175koz
Year 9Year 6Year 1 Year 10Year 2 Year 12Year 5
Actual As per study
Houndé production plan(As per 2016 Optimized Study(2), excludes Kari Pump discovery)
(started Q4-’17)
Kari Pump, Kari West and Kari Centerexpected to fill the gap
Production as per study1.1Moz of total reserve additions required
DISCOVERIES MADE SINCE STUDIES WERE PUBLISHED
KARI PUMP(HOUNDÉ)
Discovery cost, $/oz of indicated resource
$9/oz
Reserve additions required to achieve 10 years of flat 250koz/year
+1.1Moz
Reserves added with Kari Pump(1)
710koz at 3.01g/t vs. 2.05g/t for
Houndé reserves
Remaining additionsrequired to achieve 10 years of flat 250koz/year
0.4Moz
M&I Resource additions for Kari West and Kari Center
1.0Moz at 1.61g/t
Reserve additions for Kari West and Kari Center
Expected Q2-2020
Extra 24kozalready produced
UPDATED TECHNICAL REPORT AND MINE PLAN EXPECTED TO BE PUBLISHED IN Q2-2020 (3)
Mine life to be extended with upcoming Kari West & Center reservesHOUNDÉ MINE, BURKINA FASO
CORPORATE PRESENTATION

Targeting to discover between 2.5 to 3.5 Moz with average grade between 1.8 and 2.5 g/t Au. The potential quantity of ounces is conceptual in nature since there has been insufficient exploration to define a mineral resource and since it is uncertain if exploration will result in the targets being delineated as a mineral resource. 62
Significant exploration potential highlightedHOUNDÉ MINE, BURKINA FASO
CORPORATE PRESENTATION
2.5-3.5Moz5-YEAR DISCOVERY
TARGET
<$15/ozAVERAGE 5-YEAR DISCOVERY COST
INSIGHTS
› Following a two year period of no exploration drilling, activities resumed in 2017
› In 2017, targets were drilled and ranked
› Work performed included advanced soil geochemistry, ground geophysics on selected targets, regolith and geological mapping
AREAS OF FOCUS:
1. Kari Area
2. Dohoun and Sia/Sianikoui
3. Vindaloo

63
CORPORATE PRESENTATION
Strong exploration focusHOUNDÉ MINE, BURKINA FASO
Houndé exploration targets over gold-in-soil anomaliesKari Mineralization Map at November, 2019

INSIGHTS
› Kari gold in soil anomaly covers a 6km-long by 3km-wide area.
› The Kari area has been the main exploration focusover the past two years with over 350,000m drilled,resulting in the delineation of 2.0Moz of Indicatedresources through the discoveries of Kari Pump, KariWest and Kari Center with the drilling activitysummarized as follows:
‒ The first 18 month exploration campaign comprised of 203,900 meters of drilling and was completed in November 2018. The holes comprised of the drilling focused on an area which represented only 35% of the large Kari gold in soil anomaly which resulted in in the delineation of the Kari Pump maiden Indicated resource
‒ A second exploration campaign was launched in late 2018 and was completed in Q3-2019, comprising of 166,280 meters drilled focused on extending the mineralization of Kari Pump and delineating a maiden resource for both the Kari West and Kari Center
› A 145,000m drilling program began in Q4-2019focused on extending the mineralization at the Karideposits and exploring additional targets locatedwithin 10km of the Houndé processing plant
Kari gold in soil anomaly covers a 6km-long by 3km-wide area
Kari target map
HOUNDÉ MINE, BURKINA FASO
CORPORATE PRESENTATION
64

Drill map and selected intercepts per area (true width/grade)INSIGHTS› High M&I resource to reserve conversion rate: 89% based
on a gold price of $1,250/oz
› Significantly higher grade: 53% higher than the Houndémine reserve grade of 1.97g/t Au
› Advantageous ore type: 53% oxide and transition ore compared to only 12% for the Houndé mine
› Located only 7km directly West of the processing plant and in proximity to an existing haul road
› Low discovery cost of $13.50/oz of reserve
› Production cost of ~$674/oz
› Environmental studies on Kari Pump are underway and an application for a mining license was submitted in Q4 2019, with the goal of initiating mining activities in late 2020
65
Maiden Reserve of 710koz for Kari Pump depositHOUNDÉ EXPLORATION, BURKINA FASO
TOTAL FOR
THE KARI PUMP DEPOSIT
Mining and haulage cost, incl. of pre-stripping ($2.18/t moved) $274m
Processing cost ($13.98/t of ore processed) $102m
G&A cost ($5.62/t of ore processed) $41m
Transport and refining cost ($6.40/oz sold) $4m
Total production costs $421m
Divided by gold recovered 625koz
Production Cost (inclusive of all waste extraction) $674/oz
CORPORATE PRESENTATION

66
~53% of the Kari Pump reserve is oxide/transition oreHOUNDÉ MINE, BURKINA FASO
Section B-B’
CORPORATE PRESENTATION

Kari Pump Extension Drilling and Selected Intercepts
67
INSIGHTS› Drilling campaigns in 2017 and 2018 successfully delineated
the Kari Pump maiden resource and related reserves
› The 2019 drilling campaign was focused on testing the extensions of the Kari Pump mineralization, as illustrated with Zones A, B, C, and D
› In 2019, drilling confirmed strong mineralization in Zones A and B, and to a lesser extent in Zone C, while drilling in Zone D indicated that mineralization is closed in the southeast direction
› Due to the positive results from the shallow holes drilled, a follow-up drilling program for Zones A, B and C started in late 2019
› Selected best outstanding intercepts include:Zone A: ‒ ACA-19-118: 2.0m at 6.09 g/t Au & 1.0m at 11.40 g/t Au‒ AC-19-197: 2.0m at 4.73 g/t Au & 1.0m at 6.34 g/t Au‒ ACA-19-116: 5.0m at 1.46 g/t Au‒ ACB-19-140: 2.0m at 3.30 g/t AuZone B:‒ AC-19-014: 11.0m at 2.55 g/t Au, 2.0m at 6.97 g/t Au, 2.0m
at 6.71 g/t Au, 4.0m at 0.90 g/t Au, 2.0m at 1.76 g/t Au, & 2.0m at 1.25 g/t Au
‒ ACA-19-077: 2.0m at 11.29 g/t Au & 1.0m at 18.65 g/t Au‒ ACB-19-016: 11.0m at 1.84 g/t Au & 1.0m at 4.16 g/t Au‒ AC-19-047: 6.0m at 1.64 g/t Au
Kari Pump has a highly continuous mineralisationHOUNDÉ MINE, BURKINA FASO
CORPORATE PRESENTATION
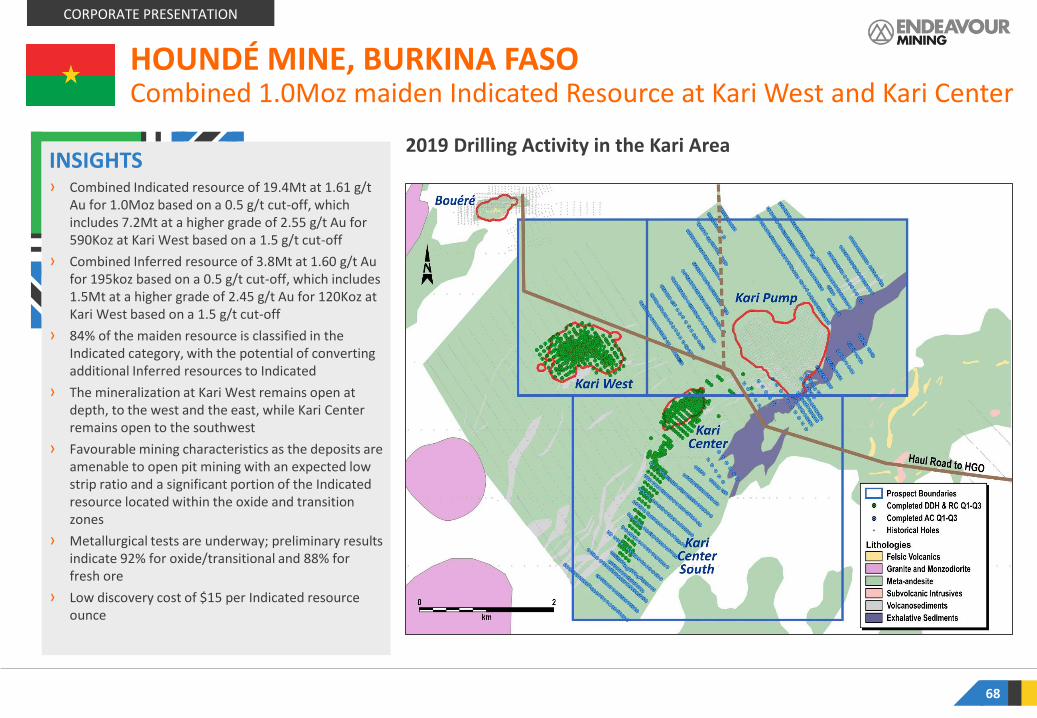
2019 Drilling Activity in the Kari Area
68
CORPORATE PRESENTATION
Combined 1.0Moz maiden Indicated Resource at Kari West and Kari CenterHOUNDÉ MINE, BURKINA FASO
INSIGHTS› Combined Indicated resource of 19.4Mt at 1.61 g/t
Au for 1.0Moz based on a 0.5 g/t cut-off, which includes 7.2Mt at a higher grade of 2.55 g/t Au for 590Koz at Kari West based on a 1.5 g/t cut-off
› Combined Inferred resource of 3.8Mt at 1.60 g/t Au for 195koz based on a 0.5 g/t cut-off, which includes 1.5Mt at a higher grade of 2.45 g/t Au for 120Koz at Kari West based on a 1.5 g/t cut-off
› 84% of the maiden resource is classified in the Indicated category, with the potential of converting additional Inferred resources to Indicated
› The mineralization at Kari West remains open at depth, to the west and the east, while Kari Centerremains open to the southwest
› Favourable mining characteristics as the deposits are amenable to open pit mining with an expected low strip ratio and a significant portion of the Indicated resource located within the oxide and transition zones
› Metallurgical tests are underway; preliminary results indicate 92% for oxide/transitional and 88% for fresh ore
› Low discovery cost of $15 per Indicated resource ounce

INSIGHTS› Discovered during the 2018 AC drilling campaign
› In 2019, follow-up RC drilling has successfully delineated and defined a mineralized area of at least 1,000m in strike length at a width of approximately 500m. The maiden resource is based on drill results from this area
› The mineralization of Kari West remains open down dip along the low angle structures and steeper and deeply rooted structures and open along the central extension of the deposit on the east (100 meters wide) and on the west/southwest
Kari West Cut-off Grade Analysis Constrained by a $1,500/oz Pit Shell
69
Kari West: 0.9Moz maiden resource delineated in Q4-2019HOUNDÉ MINE, BURKINA FASO
CORPORATE PRESENTATION
Kari West 2019 drill map with selected intercepts
INDICATED RESOURCE INFERRED RESOURCE
Cut-off Grade
(Au g/t)
Tonnage Grade Content Tonnage Grade Content
(Mt) (Au g/t) (Au koz) (Mt) (Au g/t) (Au koz)
0.5 15.7 1.71 861 3.4 1.65 179
0.9 12.4 1.97 787 2.6 1.92 163
1.5 7.2 2.55 590 1.5 2.45 120
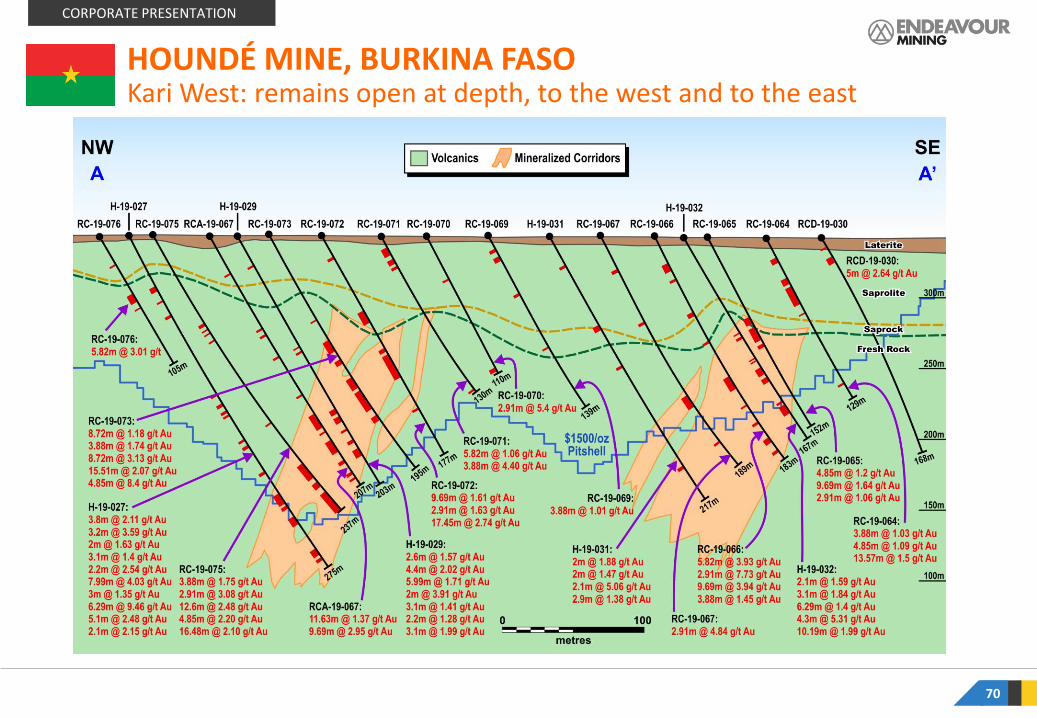
70
CORPORATE PRESENTATION
HOUNDÉ MINE, BURKINA FASOKari West: remains open at depth, to the west and to the east
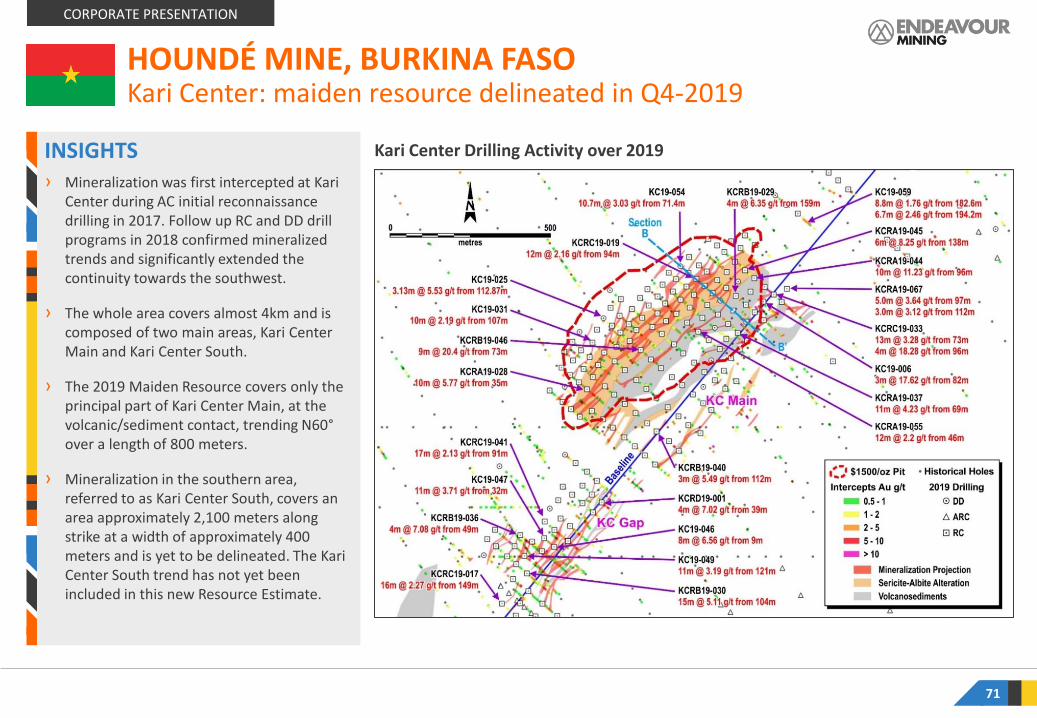
INSIGHTS› Mineralization was first intercepted at Kari
Center during AC initial reconnaissance drilling in 2017. Follow up RC and DD drill programs in 2018 confirmed mineralized trends and significantly extended the continuity towards the southwest.
› The whole area covers almost 4km and is composed of two main areas, Kari CenterMain and Kari Center South.
› The 2019 Maiden Resource covers only the principal part of Kari Center Main, at the volcanic/sediment contact, trending N60°over a length of 800 meters.
› Mineralization in the southern area, referred to as Kari Center South, covers an area approximately 2,100 meters along strike at a width of approximately 400 meters and is yet to be delineated. The Kari Center South trend has not yet been included in this new Resource Estimate.
71
Kari Center: maiden resource delineated in Q4-2019HOUNDÉ MINE, BURKINA FASO
CORPORATE PRESENTATION
Kari Center Drilling Activity over 2019

72
CORPORATE PRESENTATION
Kari Center: remains open to the southwestHOUNDÉ MINE, BURKINA FASO
73
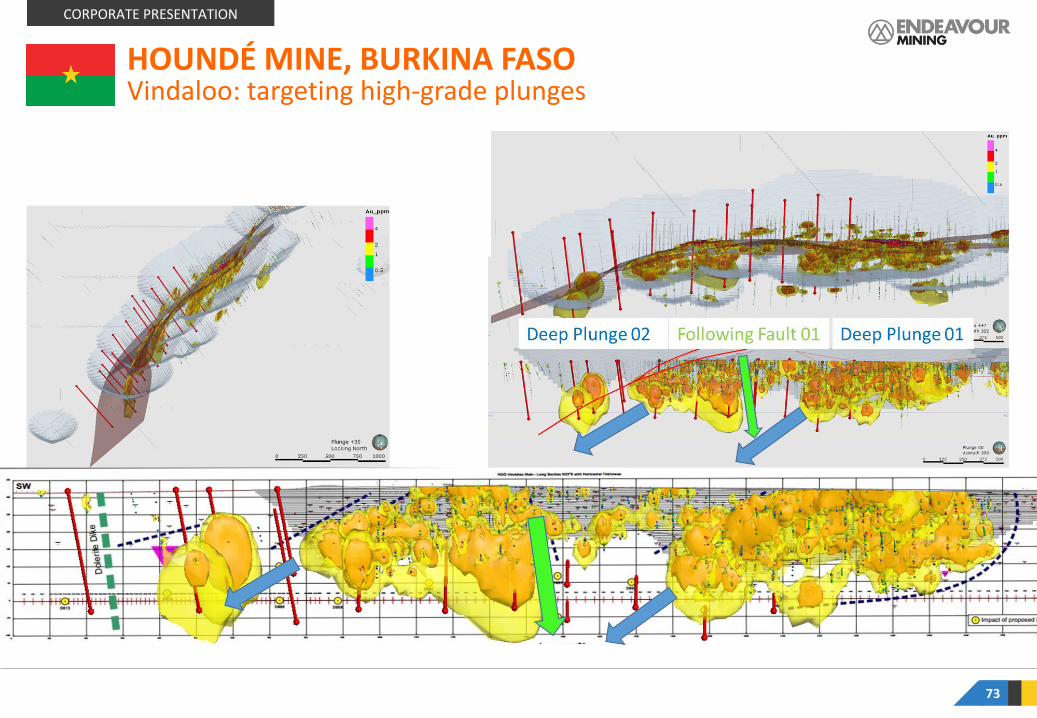
Vindaloo: targeting high-grade plungesHOUNDÉ MINE, BURKINA FASO
CORPORATE PRESENTATION

QUICK FACTS (ON 100% BASIS)
Ownership 85% EDV, 10% Côte d’Ivoire, 5% SODEMI
Resources (incl. of Reserves)(1)
M&I: 78.4Mt @ 1.53 g/t for 3.851MozInferred: 18.0Mt @ 1.35 g/t for 0.780Moz
Reserves 62.1Mt @ 1.57g/t for 3.144Moz
Open Pit Strip Ratio 2019A: 1.45
Processing Rate Upsize to 5Mtpa completed
Gold Recovery 2019A: 86%
Mining Type Open pit / Owner Mining
Production
AISC (mine-level)
2016A - $756/oz (HL)
2017A - $906/oz (HL)
2018A - $719/oz (HL)
2019A - $616/oz (CIL)
2020E - $630-675/oz (CIL)
Royalty 3% - 5% sliding scale
Corporate Tax 25%
2017A (HL)
2020E (CIL)
2018A (HL)
2016A (HL)
230-250koz2019A (CIL)
59koz76koz
85koz190koz
Côte d’Ivoire
TIMELINE
Côte d’Ivoire
ITY MINE, CÔTE D’IVOIRE Overview
CORPORATE PRESENTATION
2012 2014 2016 2017 2018 2019
La Mancha increased its stake to 55%
La Mancha purchased
by N. Sawiris
Feasibility study on CIL
project
Endeavour increased its stake to 80%
Published Optimized
Feasibility study and commenced CIL construction
Endeavour increased its stake to 85%
Commercial production achieved ahead of schedule
and below budget
74
AgbaouMine
Abidjan
Ity Mine

Production and AISCQ4-2019 vs Q3-2019 INSIGHTS
› Production decreased slightly as lower processed grades and recoveries were partially offset by increased plant throughput
‒ Mining activity increased following the end of the rainy season with 3.6Mt of material moved compared to 3.2Mt in the previous quarter. Tonnes of ore mined decreased slightly due to an increase in the strip ratio, with activity focused mainly on the Ity, Daapleu and Bakatouo pits, the latter of which was not mined during the rainy season.
‒ Plant throughput increased in line with the volumetric upgrade to 5Mtpa which was completed during the quarter
‒ The processed grade decreased as lower grade stockpiles were used to supplement mill feed, specifically in the first half of the quarter due to the prolonged rainy season
‒ Recovery rates decreased due to increased volumes of Daapleu fresh ore processed
› AISC increased due to a higher strip ratio, lower recovery rates, and higher unit mining costs which were partially offset by lower unit processing costs and lower sustaining capital
75
ITY MINE, CÔTE D’IVOIRELower grade stockpiles used to supplement mill feed
Q4-2018
9koz
Q4-2019Q1-2019
21koz
Q3-2019Q2-2019
58koz64koz 60koz
Production, koz AISC, US$/oz
CILHL
$622/oz $585/oz $575/oz
Key Performance Indicators
For The Quarter Ended Q4-2019 Q3-2019 Q4-2018 FY-2019 FY-2018
Tonnes ore mined, kt 1,571 1,639 - 5,733 -
Strip ratio (incl. waste cap) 1.30 0.97 - 1.45 -
Tonnes milled, kt 1,318 1,183 - 3,693 -
Grade, g/t 1.69 1.94 - 1.88 -
Recovery rate, % 80% 88% - 86% -
PRODUCTION, KOZ 60 64 - 190 -
Cash cost/oz 637 509 - 557 -
AISC/OZ 697 575 - 616 -
$697/oz
CORPORATE PRESENTATION

76
FY-2019 INSIGHTS
› Ity had its first gold pour in March 2019 with commercial production declared in early Q2-2019
› The comparative period production comprised the heap leach operation which ceased in Q4-2018
› Production totaled 190koz, achieving the upper end of original 2019 guidance of 160-200koz, mainly due to its quick ramp-up period
2020 OUTLOOK› Ity is expected to produce between 235-255koz in 2020
at an AISC of $630-675/oz
› Plant feed is expected to be sourced from the Ity,Bakatouo and Daapleu pits while continuing to besupplemented with lower grade historic dumps.
› As expected, a greater proportion of fresh ore is plannedto be processed in 2020 as mining elevations get deeperwhile processed grades are expected to remain stable.
› Recoveries are expected to be lower in H1-2020 due tothe processing of greater quantities of Daapleu fresh ore.
$756/oz
$906/oz
$616/oz
235-255koz
2019A2016A 2018A2017A 2020E
$719/oz $630 -675/oz
76koz
59koz
85koz
190koz
AISC ($/oz) Production (koz)
Production and AISC
A greater proportion of fresh ore is planned to be processed in 2020
ITY MINE, CÔTE D’IVOIRE
CORPORATE PRESENTATION

(1) Mine reserve grade as at Dec 31, 2018 as published in press release dated Mar 5, 2019. Le Plaque grade based on indicated resource as published on Jul 8, 2019. (2) Based on Optimized study plans as published on September 2017.(3) Updated technical report will include the added M&I resources and reserves for Le Plaque
77
Ity production plan(As per 2017 Optimized Study (2), based on 4Mtpa plant and excludes Le Plaque discovery)
201koz
Year 3Year 2
238koz
Year 7
250koz
Year 5Year 1
250koz
Year 8Year 6
151koz
224koz
162koz
Year 4
213koz
Year 9 Year 10
159koz
190koz
0.5Moz of total reserve additions required Production as per study
DISCOVERIES MADE SINCE STUDIES WERE PUBLISHED
LE PLAQUE(ITY)
Discovery cost, $/oz of indicated resource
$15/oz
M&I Resource added
0.5Moz at 3.20g/t
Reserves additions at Le Plaque(1)
0.4Moz at 2.34g/t vs. 1.54g/t for Ity
reserves
Reserve additionsrequired to achieve 10 years of flat 250koz/year
+0.5Moz
Le Plaque expected to fill the gap
(started Q2-’19)
UPDATED TECHNICAL REPORT AND MINE PLAN EXPECTED TO BE PUBLISHED IN Q2-2020 (3)
CORPORATE PRESENTATION
Ity expected to be extended with Le Plaque discovery
ITY MINE, CÔTE D’IVOIRE

Targeting to discover between 4 - 6 Moz with average grade between 2.0 - 3.5 g/t Au. The potential quantity of ounces is conceptual in nature since there has been insufficient exploration to define a mineral resource and since it is uncertain if exploration will result in the targets being delineated as a mineral resource. 78
ITY MINE, CÔTE D’IVOIRE
4-6Moz5-YEAR DISCOVERY
TARGET
<$15/ozAVERAGE 5-YEAR DISCOVERY COST
Endeavour controls the full Ity Birimian belt
CORPORATE PRESENTATION
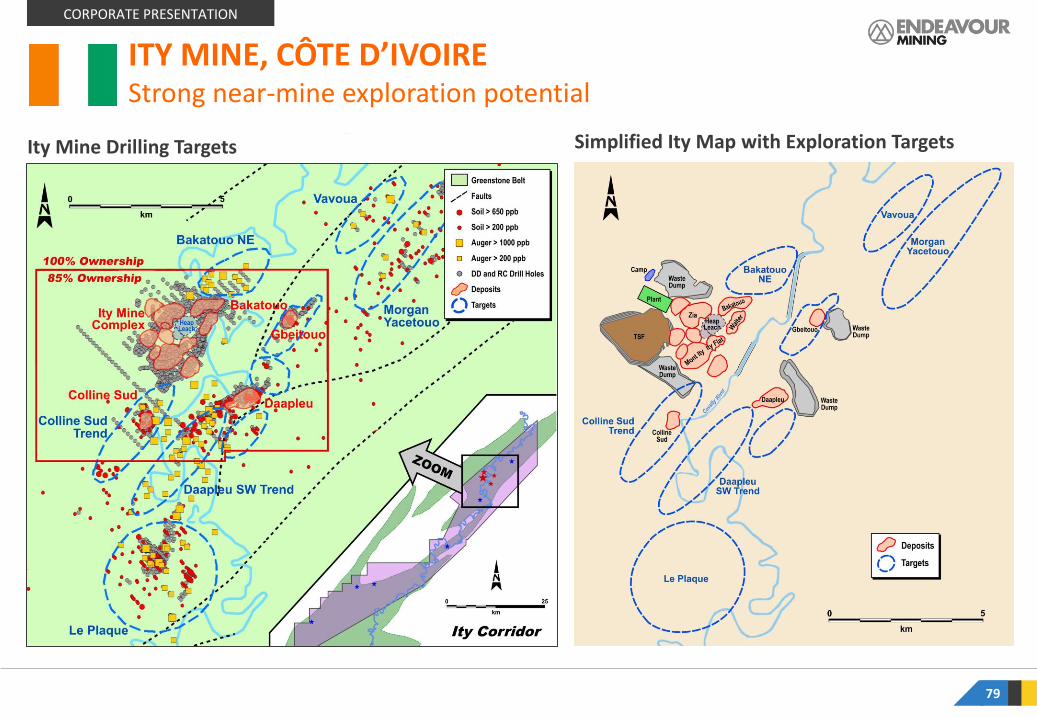
79
Ity Mine Drilling Targets Simplified Ity Map with Exploration Targets
ITY MINE, CÔTE D’IVOIREStrong near-mine exploration potential
CORPORATE PRESENTATION

LE PLAQUE INSIGHTS› Indicated resource has increased from 85koz to
476koz
› Continued low discovery cost of $15/oz
› Ity mine M&I resource up 11% with significantly higher grade ounces added as Le Plaque’s grade is 3.20 g/t Au compared to 1.54 g/t Au for the Ity mine
› The Le Plaque deposit is now composed of 3 zones (Le Plaque Main, Epsilon and Le Plaque South), all of which are open at depth and in multiple directions with mineralization confirmed by step-out drilling
› Drilling encountered numerous very high-grade intercepts of 10 g/t Au over 5 to 10m, including a company-wide record intercept of 11.7m at 106 g/t Au (true width, hole: FL18-709)
› Preliminary metallurgical tests indicate gold recovery rates of at least 90%
80
ITY EXPLORATION: LE PLAQUEMaiden resource added 0.4Moz of Indicated resources added at >3 g/t Au
Le Plaque targets
CORPORATE PRESENTATION

INSIGHTS› Exploration efforts in 2019 were mainly
focused on the Le Plaque target. Due to the success of the campaign, the initial budget of 71,000 meters was exceeded with a total of 83,436 meters of drilling completed, amounting to $13 million
› As announced on July 8, 2019, the Le Plaque Indicated resource increased from 85koz to 476koz at a grade of 3.20g/t Au
› A maiden reserve of 5.5Mt at a grade of 2.34 g/t Au containing 415koz was published on February 24, 2020
› The Le Plaque resource and reserve estimates are expected to further increase in Q2-2020 based on the additional 25,695 meters drilled in H2-2019 and the 41,000-meter drilling campaign planned for H1-2020
› 7 additional nearby targets have been identified following an extensive reconnaissance drilling campaign with further follow-up exploration planned
81
ITY MINE, CÔTE D’IVOIRE2019 exploration focus was on the Le Plaque discovery
CORPORATE PRESENTATION
Le Plaque Drill Map and Selected Intercepts (true width/grade) Per Area

Section A - Epsilon Area
82
ITY MINE, CÔTE D’IVOIRE
CORPORATE PRESENTATION

83
ITY MINE, CÔTE D’IVOIRESection B Through the Le Plaque Main and Le Plaque South Areas
CORPORATE PRESENTATION

84
Several other nearby targetsITY MINE, CÔTE D’IVOIRE
CORPORATE PRESENTATION

ITY TREND, CÔTE D’IVOIRE
85
Birimian meta sedimentsand green belt
GnamapleuGranite-Gneiss
No Geochemical data at allNo Exploration
Historical Sparse 400x100m Grid on PR462Except on few selected targets
PR558 Le Plaque Area Several Targets
GBAMPLEU
Mt BA AreaSeveral targets
GUEYA areaSeveral targets
PR609 East CavallySeveral Targets
CORPORATE PRESENTATION
Greater Ity regional gold in soil (> 100 ppb) anomalies

86
MANA, BURKINA FASOOverview
QUICK FACTS (ON 100% BASIS)
Ownership 90% (10% owned by Republic of Burkina Faso)
Resources(incl. of Reserves)1
M&I: 58.7Mt @ 2.17 g/t for 4.1MozInferred: 8.9Mt @ 2.66 g/t for 0.8Moz
P&P Reserves1 15.0t @ 2.91g/t for 1.4Moz
Processing rate 7,200tpd
Gold Recovery 90% (2019A)
Mine Life +8 years
Mining Type Open pit and Underground
Production2
AISC2
2017A - $942/oz
2018A - $1,056/oz
2019A - $1,095/oz
2020E - $1,085/oz
2020E 2019A
2017A
136koz2018A
206koz181koz
195koz
Sources: Company disclosures1. From Q4 2019 Management’s Discussion and Analysis 2. 2020E based on mid point of production guidance and AISC
Houndé Mine
OuagadougouMana
Karma Mine
Boungou
APPENDIX
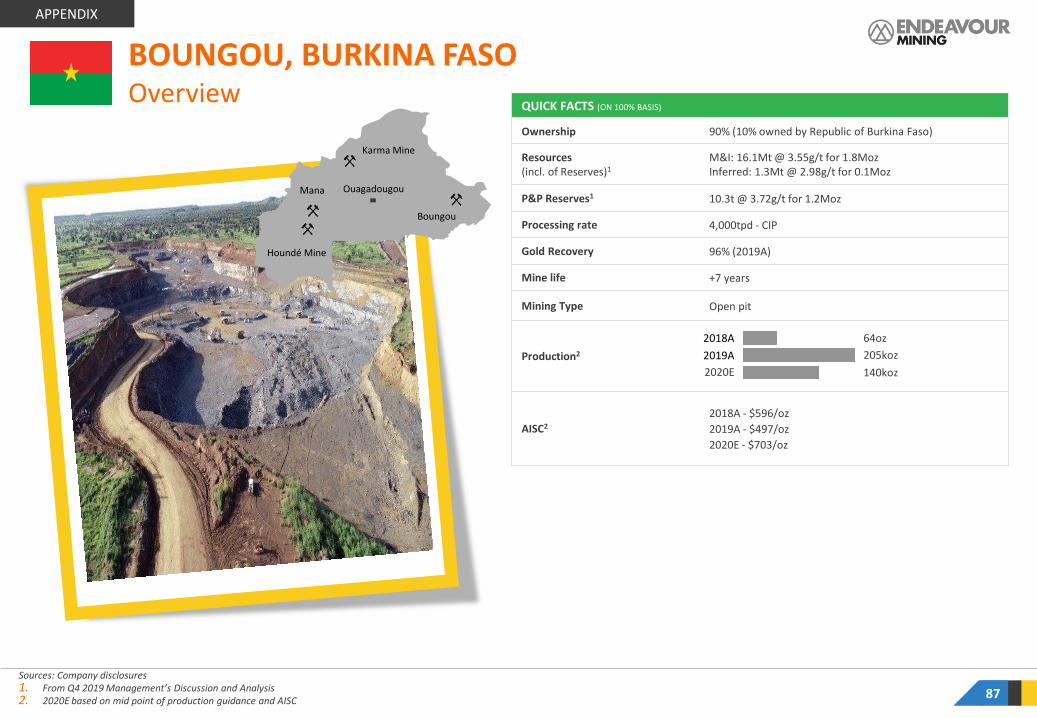
87
BOUNGOU, BURKINA FASOOverview
QUICK FACTS (ON 100% BASIS)
Ownership 90% (10% owned by Republic of Burkina Faso)
Resources(incl. of Reserves)1
M&I: 16.1Mt @ 3.55g/t for 1.8MozInferred: 1.3Mt @ 2.98g/t for 0.1Moz
P&P Reserves1 10.3t @ 3.72g/t for 1.2Moz
Processing rate 4,000tpd - CIP
Gold Recovery 96% (2019A)
Mine life +7 years
Mining Type Open pit
Production2
AISC2
2018A - $596/oz
2019A - $497/oz
2020E - $703/oz
2020E
2019A 205koz
2018A 64oz
140koz
Sources: Company disclosures1. From Q4 2019 Management’s Discussion and Analysis 2. 2020E based on mid point of production guidance and AISC
Houndé Mine
OuagadougouMana
Karma Mine
Boungou
APPENDIX

QUICK FACTS (ON 100% BASIS)
Ownership 85% EDV, 10% Côte d’Ivoire, 5% SODEMI
Resources(incl. of Reserves)
M&I: 7.6Mt @ 2.14 g/t for 519MozInferred: 0.7Mt @ 1.59 g/t for 0.037Moz
Reserves 6.3Mt @ 1.58g/t for 0.321Moz
Processing Rate Up to 2.6Mtpa Gravity/CIL plant - oxides; 1.6Mtpa fresh
Open Pit Strip Ratio 10.6 to 1 (2019A)
Gold Recovery 95% (2019A)
Mining Type Open Pit – Contractor Mining
Production
AISC (mine-level)
2015A – $576/oz
2016A – $534/oz
2017A - $647oz
2018A - $819/oz
2019A - $$796/oz
2020E - $940-990/oz
Royalty 3% - 5% sliding scale
Corporate Tax 25% (5 year corporate tax holiday ending mid-2019)
196koz
2019A
2015A2016A
181koz
2017A2018A
177koz141koz
2020E 115-125koz138koz
AgbaouMine
Abidjan
Ity Mine
Côte d’Ivoire
TIMELINE
AGBAOU MINE, CÔTE D’IVOIREOverview
CORPORATE PRESENTATION
88

Production and AISCQ4-2019 vs Q3-2019 INSIGHTS
› Production remained flat as a slightly higher recovery rate compensated for lower mill throughput and milled grades
‒ Ore tonnage mined remained steady with most of the ore being sourced from the West pit while waste extraction progressed at the South pit. The strip ratio remained flat.
‒ Processed grades decreased as low-grade stockpiles supplemented the feed.
‒ Mill throughput remained flat while recovery rates improved slightly.
› AISC increased mainly due to less ounces sold, higher G&A costs, and higher unit processing costs which were partially offset by lower unit mining costs and lower sustaining capital.
89
Q4-2018
44koz
36koz
Q1-2019 Q2-2019 Q3-2019
32koz
Q4-2019
35koz 35koz
Production, koz AISC, US$/oz
AGBAOU MINE, CÔTE D’IVOIREHigher recovery rate compensated for lower mill throughput and grades
$784/oz$776/oz $788/oz $767/oz
Key Performance Indicators
$846/oz
For The Quarter Ended Q4-2019 Q3-2019 Q4-2018 FY-2019 FY-2018
Tonnes ore mined, kt 580 589 481 2,183 2,399
Strip ratio (incl. waste cap) 9.94 9.59 13.65 10.60 11.40
Tonnes milled, kt 662 672 708 2,699 2,830
Grade, g/t 1.55 1.77 2.21 1.62 1.70
Recovery rate, % 96% 95% 95% 95% 94%
PRODUCTION, KOZ 35 36 44 138 141
Cash cost/oz 699 607 601 622 677
AISC/OZ 846 767 776 796 819
CORPORATE PRESENTATION

90
FULL YEAR 2019 INSIGHTS› As guided, production decreased marginally
due to lower mill throughput and gradeswhich were partially offset by a higherrecovery rate.
› AISC decreased slightly as a result of a lowerstrip ratio and lower mining unit costs whichwere partially offset by increased sustainingcosts and higher royalty costs.
2020 OUTLOOK
› Agbaou is expected to produce between115-125koz in 2020 at an AISC of $940-990/oz
› Mining is expected to focus in the North pitwith contributions from the West pit in H1-2020 and from the South Satellite pit in thesecond half. Harder fresh ore is expected tobe mined while the overall strip ratio isexpected to decrease slightly.
› Throughput and recovery rates are expectedto decrease marginally due to the expectedhigher percentage of harder fresh ore in theblend.
147koz
181koz
196koz
138koz
$621/oz$576/oz $535/oz
$796/oz
$647/oz
177koz
2015A2014A 2016A 2017A
$819/oz
2018A 2019A
$940 -990/oz
2020E
141koz
115-125koz
AISC ($/oz) Production (koz)
Production and AISC
AGBAOU MINE, CÔTE D’IVOIREHarder ore expected to be mined in 2020
CORPORATE PRESENTATION

91
AGBAOU MINE EXPLORATIONTarget of finding between 0.5 to 1.5Moz
Agbaou Site MapAREAS OF FOCUS:
› Main 2017-2018 priorities were to test area and to generate targets and prioritize for the upcoming campaigns
› Key Areas targeted were:
1. Agbaou North Pit Area At-depth
2. MPN Extension
3. Agbaou South
4. Beta Extension
5. Mbazo area
0.5-1.5Moz5-YEAR DISCOVERY
TARGET
<$25/ozAVERAGE 5-YEAR DISCOVERY COST
> 50 ppb
CORPORATE PRESENTATION
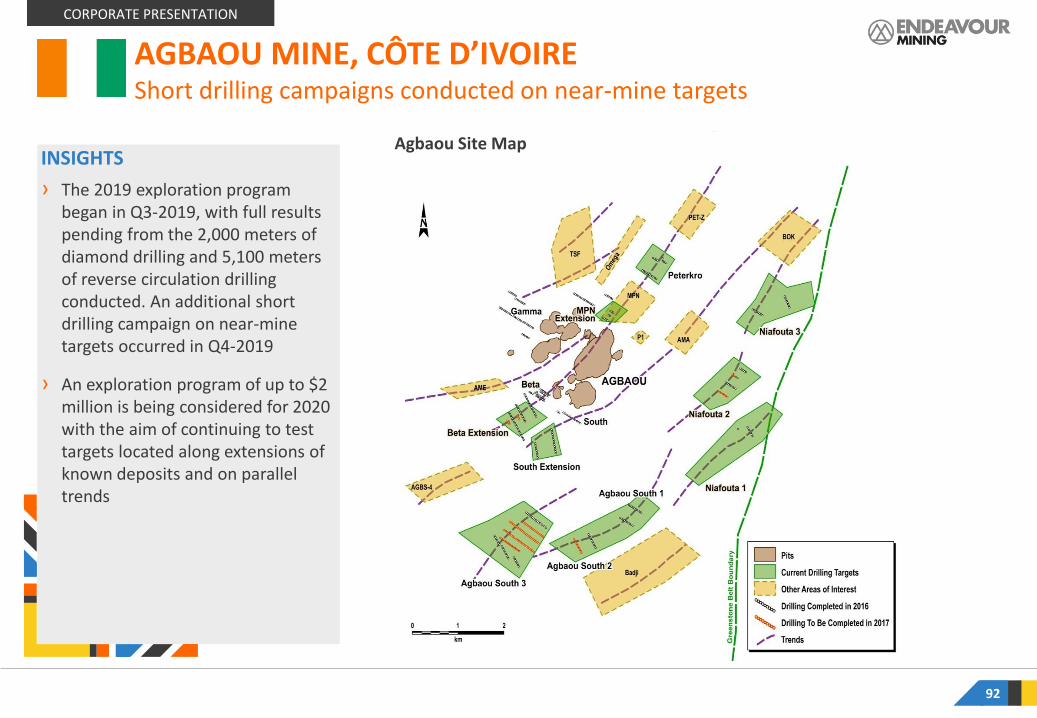
INSIGHTS
› The 2019 exploration program began in Q3-2019, with full results pending from the 2,000 meters of diamond drilling and 5,100 meters of reverse circulation drilling conducted. An additional short drilling campaign on near-mine targets occurred in Q4-2019
› An exploration program of up to $2 million is being considered for 2020 with the aim of continuing to test targets located along extensions of known deposits and on parallel trends
92
AGBAOU MINE, CÔTE D’IVOIREShort drilling campaigns conducted on near-mine targets
Agbaou Site Map
CORPORATE PRESENTATION

2m@5g/t Au
4m@17g/t Au (incl. [email protected]/t)
4m@3g/t Au (incl. 2m@4,70g/t)
[email protected]/t Au (incl. [email protected]/t)
[email protected]/t Au (incl. [email protected]/t)
[email protected]/t Au (incl. [email protected]/t)
[email protected]/t Au
2m@2g/t Au
4m@2g/t Au (incl. [email protected]/t)
Deep Potential
93
Section - AGBDD2141
Intercepted mineralization 150m under the North pitAGBAOU MINE EXPLORATION
CORPORATE PRESENTATION
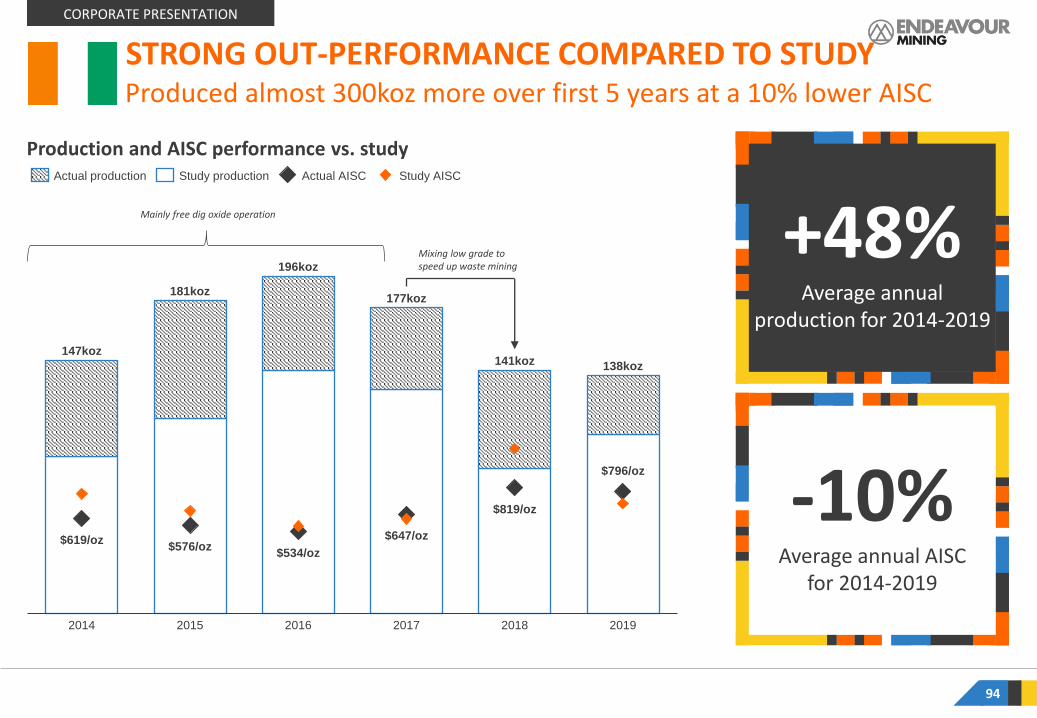
Production and AISC performance vs. study
STRONG OUT-PERFORMANCE COMPARED TO STUDY
94
+48%Average annual
production for 2014-2019
-10%Average annual AISC
for 2014-2019
Produced almost 300koz more over first 5 years at a 10% lower AISC
$619/oz$576/oz
$534/oz
$647/oz
$819/oz
$796/oz
20192014 20172015 2016
138koz
2018
147koz
181koz
196koz
177koz
141koz
Study productionActual production Study AISCActual AISC
Mixing low grade to speed up waste mining
Mainly free dig oxide operation
CORPORATE PRESENTATION

Plant performance vs. study
STRONG OUT-PERFORMANCE COMPARED TO STUDY
95
~30%Above nameplate
capacity based on oxide ore
+7MtExtra tonnes processed vs. study for 2014-2019
Plant running significantly above nameplate
20172015 20192014 2016 2018
2.7kt
2.2kt
2.8kt2.9kt
2.8kt2.7kt
Actual Study
Benefit of plant running 30% above nameplate and additions of oxide ore reserve
CORPORATE PRESENTATION

Reserves and depletion
STRONG PERFORMANCE COMPARED TO STUDY
96
1.3MozReserves endowment
+400kozAdded to reserves
Reserves endowment up 48% since construction with more oxide material
880koz 926koz1,027koz
853koz668koz
461koz321koz
151koz338koz
540koz728koz
879koz1,024koz
201720162013 2014 20192015 2018
Reserves at year-end Cummulative depletion
1.3Moz reserve endowment
CORPORATE PRESENTATION
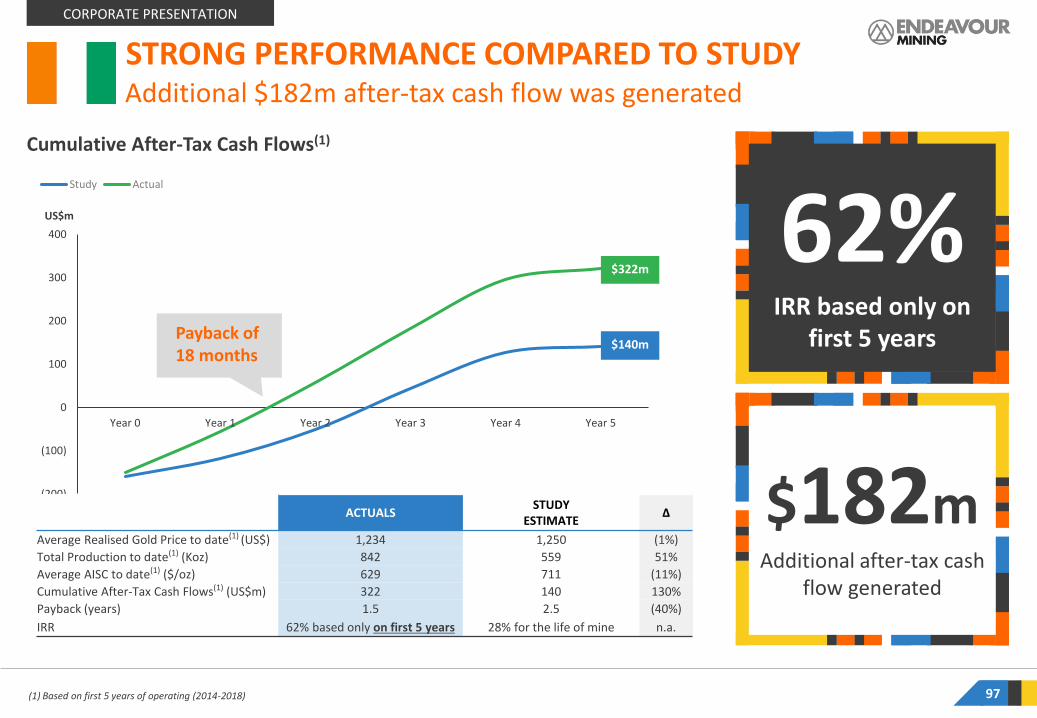
(200)
(100)
0
100
200
300
400
Year 0 Year 1 Year 2 Year 3 Year 4 Year 5
US$m
Study Actual
$322m
$140m
(1) Based on first 5 years of operating (2014-2018) 97
62%IRR based only on
first 5 years
$182mAdditional after-tax cash
flow generated
Additional $182m after-tax cash flow was generated
STRONG PERFORMANCE COMPARED TO STUDY
Cumulative After-Tax Cash Flows(1)
ACTUALS STUDY
ESTIMATEΔ
Average Realised Gold Price to date(1) (US$) 1,234 1,250 (1%)
Total Production to date(1) (Koz) 842 559 51%
Average AISC to date(1) ($/oz) 629 711 (11%)
Cumulative After-Tax Cash Flows(1) (US$m) 322 140 130%
Payback (years) 1.5 2.5 (40%)
IRR 62% based only on first 5 years 28% for the life of mine n.a.
Payback of 18 months
CORPORATE PRESENTATION

TIMELINE
98
QUICK FACTS (ON 100% BASIS)
Ownership 90% EDV, 10% Burkina Faso
Resources(incl. of Reserves)
M&I: 52.6Mt @ 1.21 g/t for 2.042MozInferred: 15.7Mt @ 1.35 g/t for 0.681Moz
Reserves 9.2Mt @ 0.99g/t for 0.293Moz
Processing Rate 4.0Mtpa Heap Leach
Open Pit Strip Ratio 4.2 to 1 (2019A)
Gold Recovery 82% (2019A)
Mining TypeShallow open pits with mostly free digging material with
minimal blasting required, low strip ratio
Production
AISC (Mine-level)
2016A - $738/oz
2017A - $834/oz
2018A - $813/oz
2019A - $903/oz
2020E - $980-1,050/oz
Tax regime 3% - 5% sliding scale royalty / 17.5% Corporate tax
2016A2017A
62koz
2018A 109koz2019A
98kozkoz
2020E 100-110koz97koz
Houndé Mine
Ouagadougou
Karma Mine
KARMA MINE, BURKINA FASOOverview
CORPORATE PRESENTATION
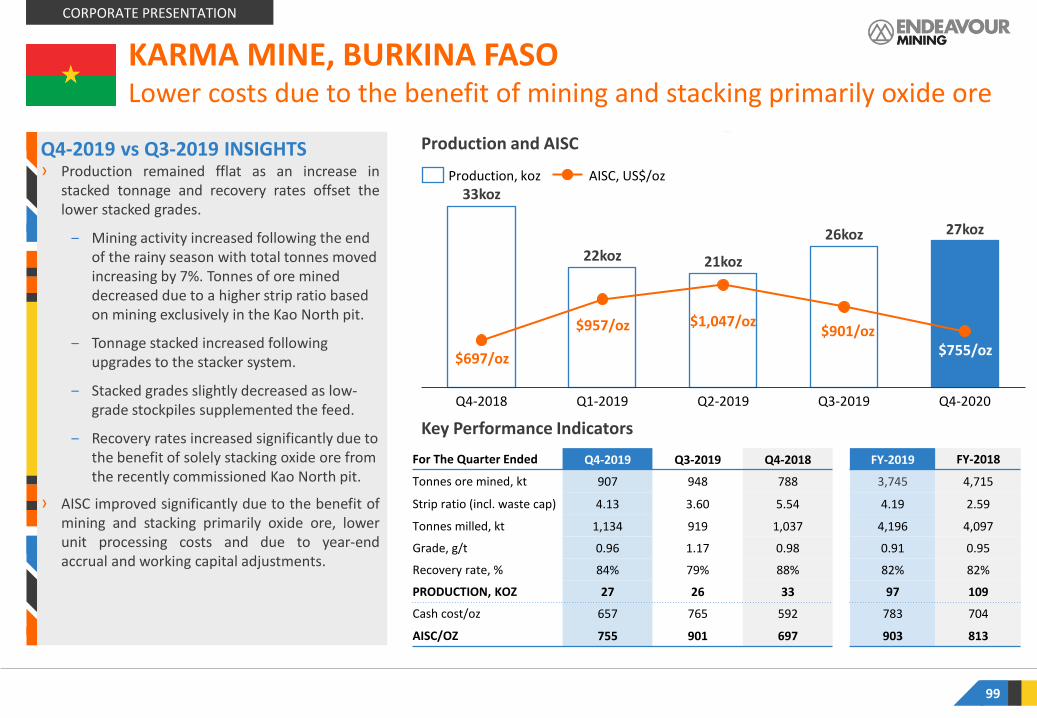
Production and AISCQ4-2019 vs Q3-2019 INSIGHTS› Production remained fflat as an increase in
stacked tonnage and recovery rates offset thelower stacked grades.
‒ Mining activity increased following the end of the rainy season with total tonnes moved increasing by 7%. Tonnes of ore mined decreased due to a higher strip ratio based on mining exclusively in the Kao North pit.
‒ Tonnage stacked increased following upgrades to the stacker system.
‒ Stacked grades slightly decreased as low-grade stockpiles supplemented the feed.
‒ Recovery rates increased significantly due to the benefit of solely stacking oxide ore from the recently commissioned Kao North pit.
› AISC improved significantly due to the benefit ofmining and stacking primarily oxide ore, lowerunit processing costs and due to year-endaccrual and working capital adjustments.
99
KARMA MINE, BURKINA FASOLower costs due to the benefit of mining and stacking primarily oxide ore
33koz
22koz 21koz
26koz 27koz
Q2-2019Q4-2018 Q1-2019 Q3-2019 Q4-2020
Production, koz AISC, US$/oz
$957/oz
$697/oz
$1,047/oz$901/oz
Key Performance Indicators
$755/oz
For The Quarter Ended Q4-2019 Q3-2019 Q4-2018 FY-2019 FY-2018
Tonnes ore mined, kt 907 948 788 3,745 4,715
Strip ratio (incl. waste cap) 4.13 3.60 5.54 4.19 2.59
Tonnes milled, kt 1,134 919 1,037 4,196 4,097
Grade, g/t 0.96 1.17 0.98 0.91 0.95
Recovery rate, % 84% 79% 88% 82% 82%
PRODUCTION, KOZ 27 26 33 97 109
Cash cost/oz 657 765 592 783 704
AISC/OZ 755 901 697 903 813
CORPORATE PRESENTATION

100
FULL YEAR 2019 INSIGHTS› As guided, production decreased due to lower
grades associated with supplemented orestacked from stockpiles.
› AISC slightly increased as a result of higherwaste capitalization and lower production.
2020 OUTLOOK› Karma is expected to produce between 100-
110koz in 2020 at an AISC of $980-$1,050/oz.
› Mining activity is expected to occur at the KaoNorth pit throughout the year, while the GG1deposit is expected to be commenced in lateQ1-2020. The overall strip ratio is expected toremain in line with the prior year.
› Ore tonnes stacked are expected to increaseslightly due to the completion of stackerupgrades in Q1 while grades and recoveries areexpected to remain constant.
62koz
98koz 97koz
$738/oz$834/oz
$903/oz
100-110koz
2016 2017A
$813/oz
2018A 2019A 2020E
109koz
AISC ($/oz) Production (koz)
Production and AISC
KARMA PRODUCTION PROFILE
$980 –1,050/oz
CORPORATE PRESENTATION
Mining activity is expected to occur at the Kao North and GG1 pits in 2020

INSIGHTS
› The 2019 exploration program began in late Q3-2019 with 27,000 meters drilled, focused mainly on testing the extensions of Kao deposits and infill drilling at GG1
› An exploration program of up to $2 million is being considered for 2020 with the aim of in-fill drilling and testing extensions of known deposits
101
KARMA MINE, BURKINA FASO2019 program focused on testing the extensions of Kao deposits and infill drilling
Karma Site Map
CORPORATE PRESENTATION

102
Bamako
Mali
KalanaProject
QUICK FACTS (ON 100% BASIS – Based on Avnel’s DFS)
Ownership 80% EDV; 20% Mali government
Status EDV updating the Avnel FS
M&I Resources (inclusive of reserves) 3.0Moz @ 4.14g/t (as per Avnel)
Reserves 1.96Moz @ 2.80g/t (as per Avnel)
Mining Type Open Pit
Processing Rate1.2Mtpa for fresh ore1.5Mtpa for soft saprolite ore
Strip ratio, w:o 9.9
Tonnes of ore processed, Mt 21.7
Grade processed, Au g/t 2.80
Gold content processed, Koz 1,964
Gold recovery 93%
Production 1,821Moz
Mine life, years 18
Average gold production, koz pa 101 koz
AISC, $/oz US$730/oz
Upfront capital cost, $m US$171m
Sustaining capital cost, $m US$122m
After-tax Project NPV 5%, $m US$321m
After-tax Project IRR, % 50%
Payback, years (undiscounted) 1.1
TIMELINE
KALANA PROJECT, MALI Overview
CORPORATE PRESENTATION
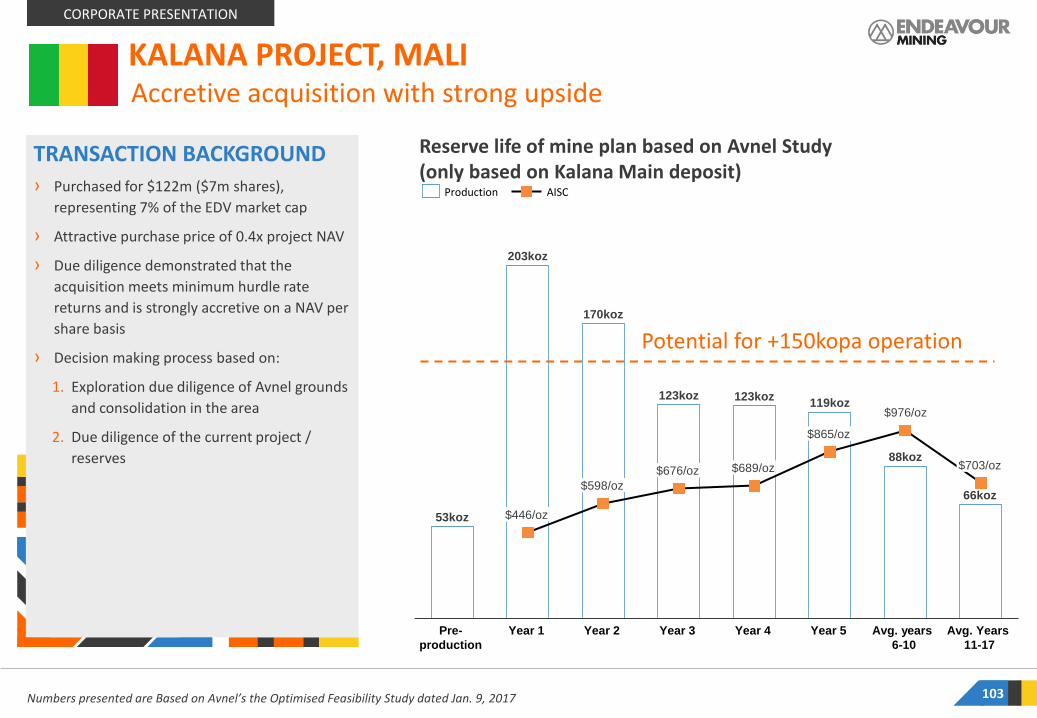
53koz
203koz
170koz
123koz 123koz119koz
88koz
66koz
$976/oz
Pre-
production
$598/oz
$446/oz
Year 1
$689/oz
Year 3Year 2
$676/oz
Year 4
$865/oz
Year 5 Avg. years
6-10
$703/oz
Avg. Years
11-17
Numbers presented are Based on Avnel’s the Optimised Feasibility Study dated Jan. 9, 2017 103
TRANSACTION BACKGROUND
› Purchased for $122m ($7m shares),
representing 7% of the EDV market cap
› Attractive purchase price of 0.4x project NAV
› Due diligence demonstrated that the
acquisition meets minimum hurdle rate
returns and is strongly accretive on a NAV per
share basis
› Decision making process based on:
1. Exploration due diligence of Avnel grounds
and consolidation in the area
2. Due diligence of the current project /
reserves
Accretive acquisition with strong upside
Reserve life of mine plan based on Avnel Study (only based on Kalana Main deposit)
Potential for +150kopa operation
Production AISC
KALANA PROJECT, MALI
CORPORATE PRESENTATION

INSIGHTS› An exploration program conducted in 2018 comprised of approximately
48,000m of drilling
› At the Kalana Main deposit, the in-fill drilling program improved the geological model and converted a portion of the previously classified Inferred Resource in the north-eastern part of the deposit to the Indicated category
› The 2016 Kalana Main Mineral Resource Estimate (MRE) as prepared by Avnel (the previous owner) was updated following a rebuild of the geological model using a more conservative approach to incorporate tighter geological controls for the high-grade nugget effect, stacked vein sets and dilution
› Endeavour considers the updated 2019 Kalana Main geological model to be a more robust and accurate model as:
‒ The geological model was updated with over 30,000m of in-fill drilling completed since the project was acquired in late 2017. In total, more than 2,200 holes and more than 221,000 assays (including over 103,000 LeachWELL assays) were used to refine the geological model
‒ A total of 135 veins within 61 vein packages were individually modelled as opposed to the previous approach of applying geostatistics to 56 grouped vein packages, and thereby provided an upgraded confidence in the vein packages/domain boundaries
‒ Mineralized intersections outside of the defined wireframes where continuity was not proven were excluded
‒ The cut-off grade was lowered from 0.9 g/t Au to 0.5 g/t Au
104
KALANA PROJECT, MALI
Kalana Main deposit M&I resource evolution
Significant increase in resource confidence based on tighter geological controls
4.14 g/t
3.70 g/t
2.69 g/t 2.80 g/t
UPDATED 2019 (0.5g/t cut-off)
UPDATED 2019 (0.9g/t cut-off)
PREVIOUS 2016 (0.9g/t cut-off)
2016 RESERVE GRADE
(on a 100% basis)
PREVIOUS 2016
M&I RESOURCE
UPDATED 2019
M&I RESOURCE
Cut-off grade (g/t Au)0.9
0.9 (For comparative purpose)
0.5 (As reported)
Tonnage (Mt) 23 18 27
Grade (g/t Au) 4.14 3.70 2.69
Content (Au Koz) 3,060 2,092 2,287
CORPORATE PRESENTATION

105
2018 Block Model Results
Blockmodel – Section S100
KALANA PROJECT, MALI
CORPORATE PRESENTATION

106
FOLLOWING THE AVNEL ACQUISITION:
› Integration of Avnel into
Endeavour
› Ceased underground small
scale operation
› Launched intensive
exploration program on
the Kalana and Kalanako
deposits
› Launched CSR activities
and resettlement action
plan
› Study optimization
process launched
Work undertaken at Kalana since acquisition
Plant Size ReservesProduction AISC
Mine lifeFirst 5 years First 10 years First 5 years First 10 years
Ity PFS (2015)
2.0Mtpa 1.4Moz105koz 87koz $742/oz $782/oz 14
Ity FS (2016)
3.0Mtpa 1.9Moz165koz 135koz $507/oz $559/oz 14
Ity OS (2017)
4.0Mtpa 2.9Moz235koz 173koz $494/oz $549/oz 14
Ity CIL Project Case Study
Kalana Project
Plant Size ReservesProduction AISC
Mine lifeFirst 5 years First 10 years First 5 years First 10 years
Avnel FS 1.2Mtpa 1.9Moz148koz 118koz $707/oz $740/oz 22
EDV FS
EDV OS
Increasing plant size, but based only on
Kalana deposit
Adding other deposits through exploration
KALANA PROJECT, MALI
CORPORATE PRESENTATION
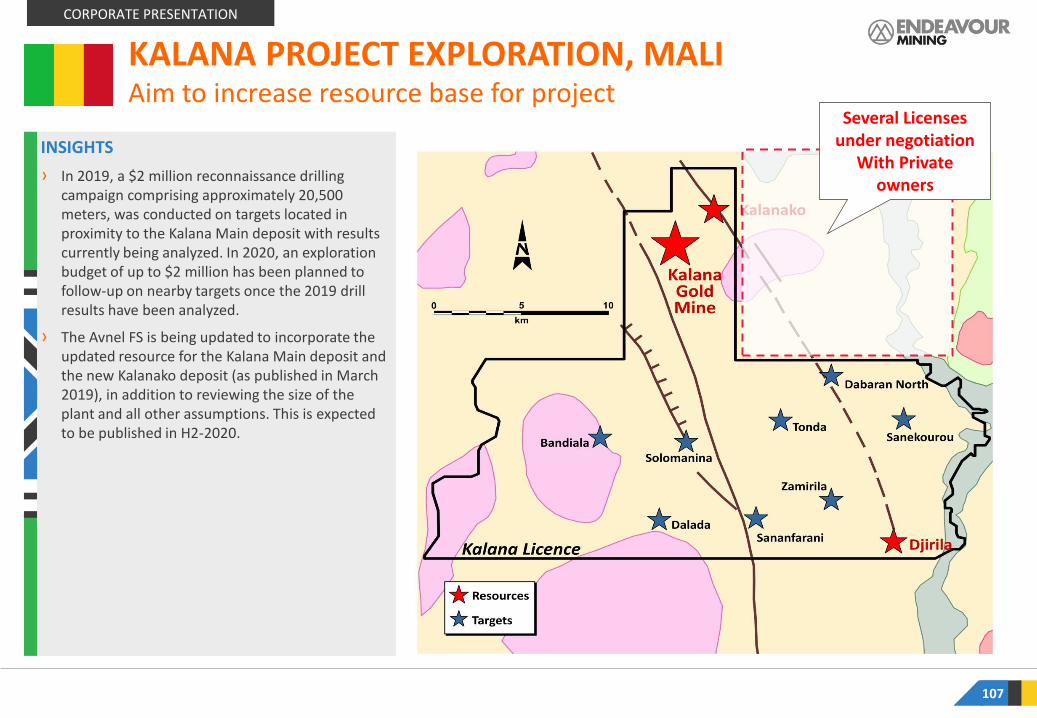
Several Licenses under negotiation
With Private owners
INSIGHTS
› In 2019, a $2 million reconnaissance drilling campaign comprising approximately 20,500 meters, was conducted on targets located in proximity to the Kalana Main deposit with results currently being analyzed. In 2020, an exploration budget of up to $2 million has been planned to follow-up on nearby targets once the 2019 drill results have been analyzed.
› The Avnel FS is being updated to incorporate the updated resource for the Kalana Main deposit and the new Kalanako deposit (as published in March 2019), in addition to reviewing the size of the plant and all other assumptions. This is expected to be published in H2-2020.
107
KALANA PROJECT EXPLORATION, MALIAim to increase resource base for project
CORPORATE PRESENTATION

2018 Results – Positive Kalana North Intercepts
1m @ 3.76 g/t1m @ 3.52 g/t1m @ 0.78 g/t4m @ 2.08 g/t
5m @ 13.49 g/t1m @ 7.08 g/t3m @ 1.24 g/t
2m @ 0.6 g/t
1m @ 1.08 g/t
2m @ 15.90 g/t
1m @ 0.6 g/t
Pending assays
Drillhole with VG
KALANA PROJECT, MALI
CORPORATE PRESENTATION
108
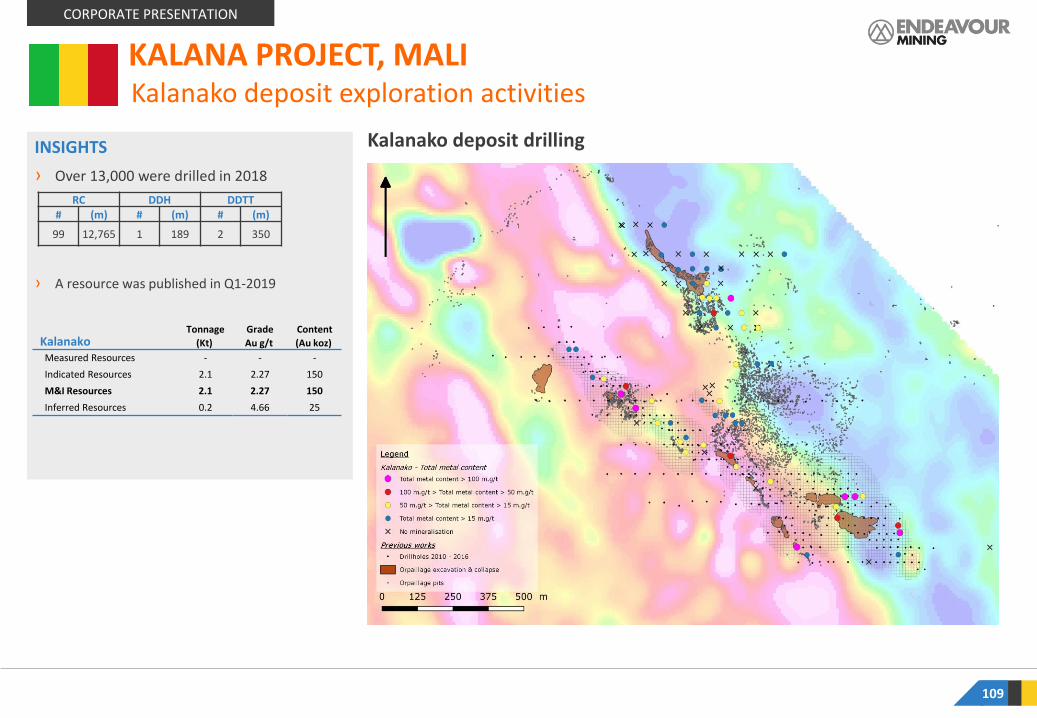
109
Kalanako deposit exploration activities
INSIGHTS
› Over 13,000 were drilled in 2018
› A resource was published in Q1-2019
Kalanako deposit drilling
RC DDH DDTT# (m) # (m) # (m)
99 12,765 1 189 2 350
KALANA PROJECT, MALI
CORPORATE PRESENTATION
KalanakoTonnage
(Kt)
Grade
Au g/t
Content
(Au koz)
Measured Resources - - -
Indicated Resources 2.1 2.27 150
M&I Resources 2.1 2.27 150
Inferred Resources 0.2 4.66 25

Regional Kalana Exploration Potential
110
Termite Mounts Au anomalies
INSIGHTS
› Fougadian application being processed
› Kalako East licenses under review and discussion with private owners
› Drilling started in 2019
KALANA PROJECT, MALI
CORPORATE PRESENTATION

INSIGHTS
› Fetekro is located in north-central Côte d’Ivoire, approximately 500km from Abidjan, within the northern-end of the Oumé-Fetekro greenstone belt
› Fetekro was ranked as a top greenfield target following our strategic exploration review completed in late 2016
› A maiden resource was published in October 2018 based on only 32,000m of drilling
› Since then, nearly 35,000m were drilled, growing the indicated resource by 141% to 1.2Moz
› Low discovery cost of $9 per Indicated resource ounce
111
Fetekro is our most advanced greenfield exploration property
CORPORATE PRESENTATION
GREENFIELD FETEKRO, CÔTE D’IVOIRE
Simplified Map of the Fetekro Property Showing Lafigué
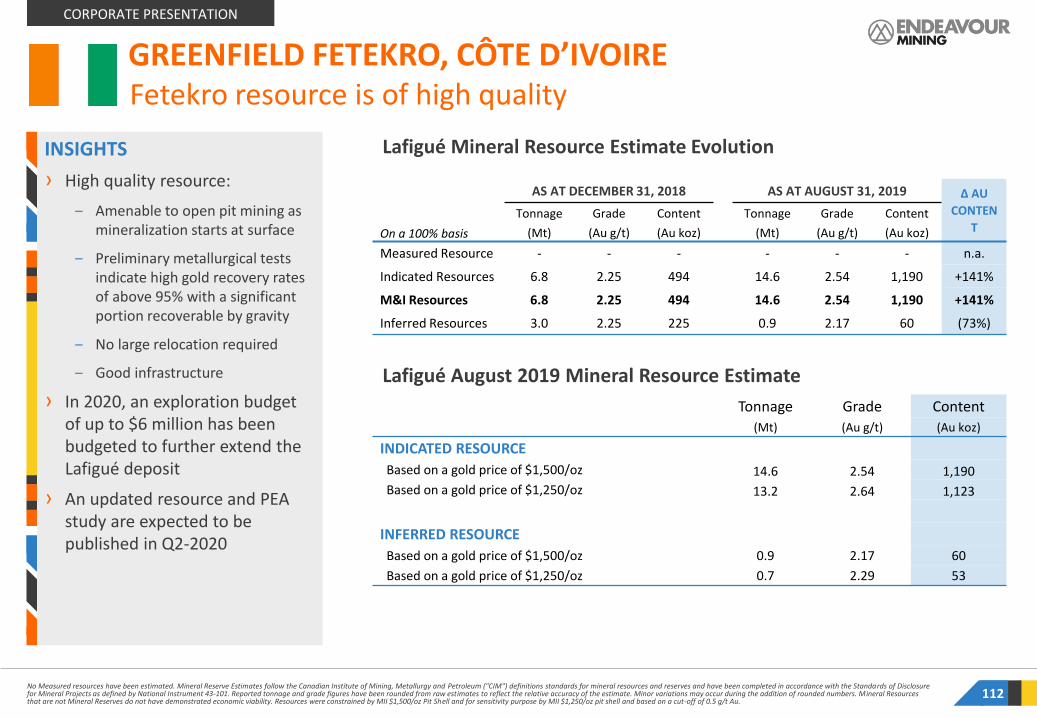
INSIGHTS
› High quality resource:
‒ Amenable to open pit mining as mineralization starts at surface
‒ Preliminary metallurgical tests indicate high gold recovery rates of above 95% with a significant portion recoverable by gravity
‒ No large relocation required
‒ Good infrastructure
› In 2020, an exploration budget of up to $6 million has been budgeted to further extend the Lafigué deposit
› An updated resource and PEA study are expected to be published in Q2-2020
No Measured resources have been estimated. Mineral Reserve Estimates follow the Canadian Institute of Mining, Metallurgy and Petroleum ("CIM") definitions standards for mineral resources and reserves and have been completed in accordance with the Standards of Disclosure for Mineral Projects as defined by National Instrument 43-101. Reported tonnage and grade figures have been rounded from raw estimates to reflect the relative accuracy of the estimate. Minor variations may occur during the addition of rounded numbers. Mineral Resources that are not Mineral Reserves do not have demonstrated economic viability. Resources were constrained by MII $1,500/oz Pit Shell and for sensitivity purpose by MII $1,250/oz pit shell and based on a cut-off of 0.5 g/t Au.
112
Lafigué Mineral Resource Estimate Evolution
AS AT DECEMBER 31, 2018 AS AT AUGUST 31, 2019 Δ AU
CONTEN
TOn a 100% basis
Tonnage Grade Content Tonnage Grade Content
(Mt) (Au g/t) (Au koz) (Mt) (Au g/t) (Au koz)
Measured Resource - - - - - - n.a.
Indicated Resources 6.8 2.25 494 14.6 2.54 1,190 +141%
M&I Resources 6.8 2.25 494 14.6 2.54 1,190 +141%
Inferred Resources 3.0 2.25 225 0.9 2.17 60 (73%)
CORPORATE PRESENTATION
Fetekro resource is of high quality
Tonnage Grade Content
(Mt) (Au g/t) (Au koz)
INDICATED RESOURCE
Based on a gold price of $1,500/oz 14.6 2.54 1,190
Based on a gold price of $1,250/oz 13.2 2.64 1,123
INFERRED RESOURCE
Based on a gold price of $1,500/oz 0.9 2.17 60
Based on a gold price of $1,250/oz 0.7 2.29 53
Lafigué August 2019 Mineral Resource Estimate
GREENFIELD FETEKRO, CÔTE D’IVOIRE
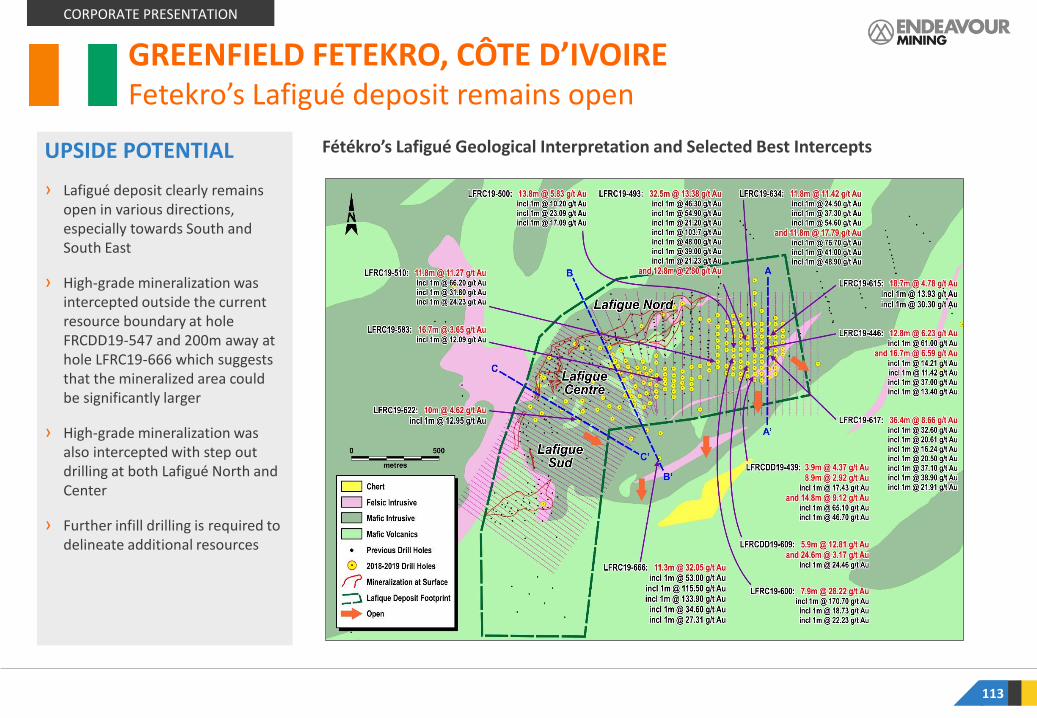
UPSIDE POTENTIAL
› Lafigué deposit clearly remains open in various directions, especially towards South and South East
› High-grade mineralization was intercepted outside the current resource boundary at hole FRCDD19-547 and 200m away at hole LFRC19-666 which suggests that the mineralized area could be significantly larger
› High-grade mineralization was also intercepted with step out drilling at both Lafigué North and Center
› Further infill drilling is required to delineate additional resources
113
CORPORATE PRESENTATION
Fetekro’s Lafigué deposit remains open
Fétékro’s Lafigué Geological Interpretation and Selected Best Intercepts
GREENFIELD FETEKRO, CÔTE D’IVOIRE

114
CORPORATE PRESENTATION
Fetekro’s Lafigué North Cross-Section (Eastern part) GREENFIELD FETEKRO, CÔTE D’IVOIRE

115
CORPORATE PRESENTATION
Fetekro’s Lafigué North Cross-Section (Western part) GREENFIELD FETEKRO, CÔTE D’IVOIRE

116
CORPORATE PRESENTATION
Fetekro’s Lafigué Centre Cross SectionGREENFIELD FETEKRO, CÔTE D’IVOIRE

117
CORPORATE PRESENTATION
Fetekro’s upside potential with nearby targets
INSIGHTS
› Approximately 35% of the 2019 reconnaissance drilling program was dedicated to the larger Western Anomalies (“WA”), WA 2 and 6 targets following the positive results obtained over WA1 and WA3 targets last year.
› A 20,000 meter drilling program was launched in early 2020 over the nearby Fetekro targets.
GREENFIELD FETEKRO, CÔTE D’IVOIRE

JV WITH BARRICK (EX-RANDGOLD)
› Drill results suggested the presence of an 800-metre mineralized structure at Sissedougou with best drill results of :
‒ 34.6 m @ 2.08 g/t Au at 74.6 m, including 1.0 m @ 31.52 g/t Au
‒ 18.8 m @ 2.30 g/t Au at 26.1 m
‒ 23.0 m @ 2.14 g/t Au at 112.6 m, including 2.0 m @ 10.70 g/t Au
› Barrick (Randgold) confirmed the exploration potential of the Mankono property as its trenching program intercepted a mineralised system over a 300m wide corridor and 1km strike
118
CORPORATE PRESENTATION
GREENFIELD EXPLORATION, CÔTE D’IVOIREJV With Barrick on Sissedougou / Mankono

119
CORPORATE PRESENTATION
GREENFIELD EXPLORATION, BURKINA FASOLiguidi Area
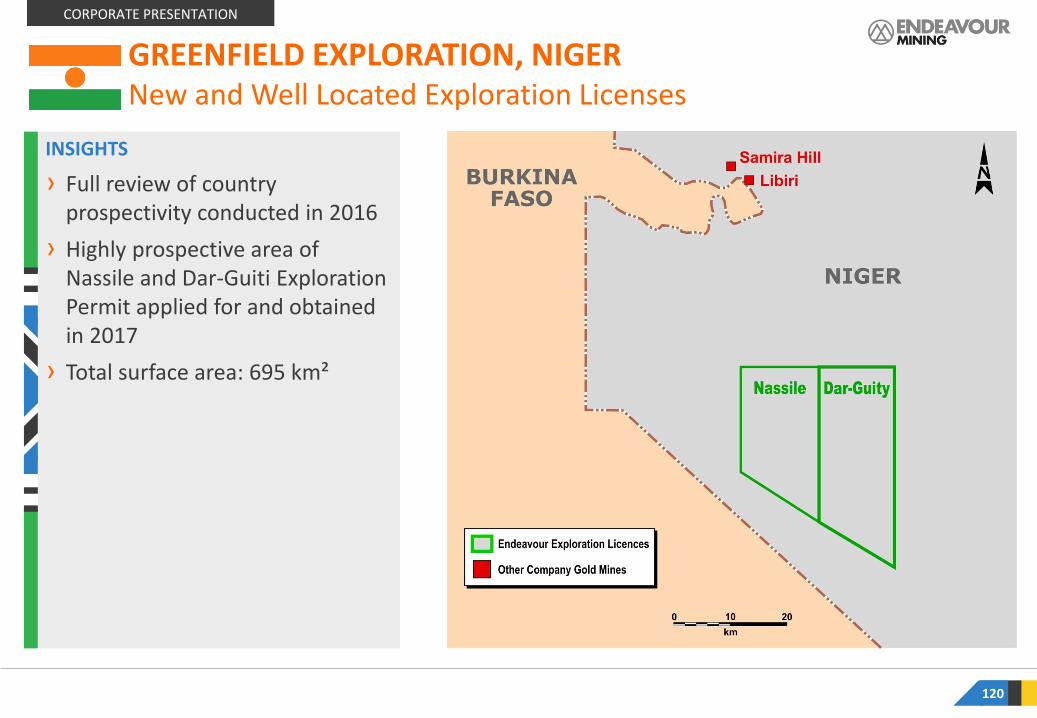
120
INSIGHTS
› Full review of country prospectivity conducted in 2016
› Highly prospective area of Nassile and Dar-Guiti Exploration Permit applied for and obtained in 2017
› Total surface area: 695 km²
CORPORATE PRESENTATION
GREENFIELD EXPLORATION, NIGERNew and Well Located Exploration Licenses
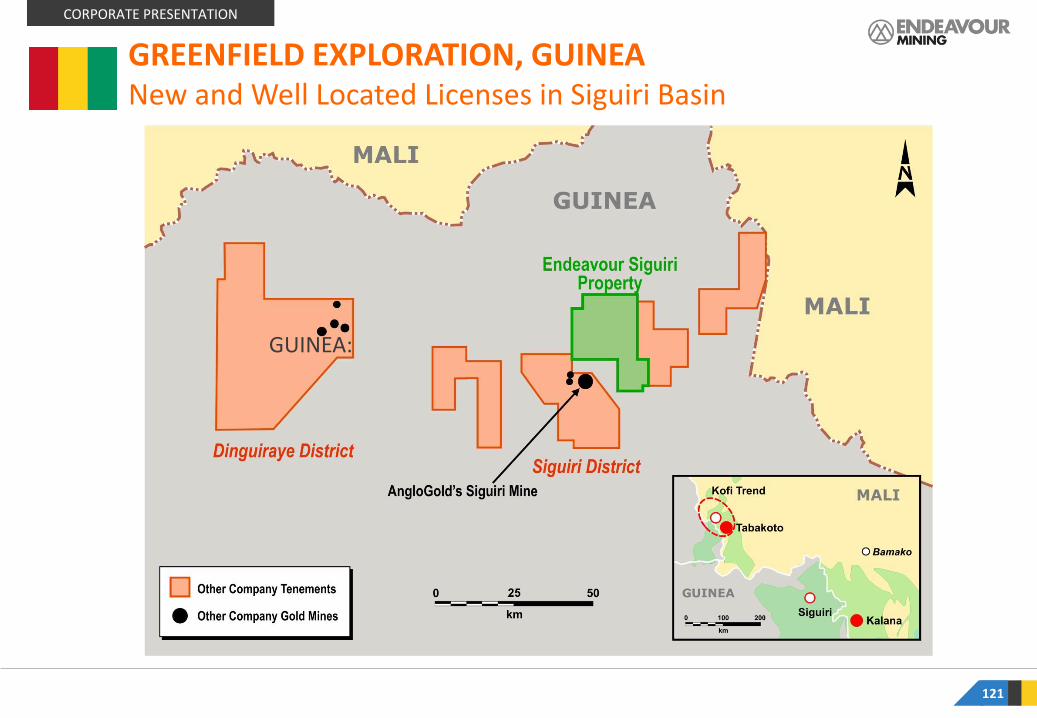
121
CORPORATE PRESENTATION
GREENFIELD EXPLORATION, GUINEA
GUINEA:
New and Well Located Licenses in Siguiri Basin

› Kofi on same trend as Randgold’sLoulo-Gounkoto in Mali
› Exploration license of Kofi not sold in Tabakoto sales process
› Aim is to attain additional license around Kofi North / Netekoto to consolidate exploration cluster
122
CORPORATE PRESENTATION
GREENFIELD EXPLORATION, MaliKofi area

TABLE OF CONTENTSCOMBINATION WITH SEMAFO: CREATION OF A LEADING WEST AFRICAN GOLD PRODUCER1
DETAILS BY MINE AND PROJECT
WEST AFRICA INSIGHTS
APPENDIX
2
3
4
ENDEAVOUR OVERVIEW
5

Equity raises for gold companies over past 10 years
EQUITY MARKETS STRONGLY SUPPORT WEST AFRICA
Source: SNL data 124
+$6 billion
raised for West Africa
2ndhighest globally
Amongst top ranking region for equity proceeds over past 10 years
$0.35B
$0.82B$1.16B
$1.69B
$3.66B
$5.89B
$6.35B
$9.82B
0
2
4
6
8
10
West AfricaAustraliaChinaChile Colombia Mexico USA Canada
US$
Bill
ion
s
For the period between 2006-2016
CORPORATE PRESENTATION

2017 exploration budget ($m)
SIGNIFICANT EXPLORATION EFFORTS IN WEST AFRICA
Source: S&P Global Market Intelligence. West Africa includes: Burkina Faso, Cote d’Ivoire, Ghana, Mali, and Senegal 125
+$5billion
spent in West Africa over last 10 years
10%of global budget is
spent in West Africa
Endeavour represents over 10% of total West African spend
677
634
385363
247
176 175 173
137123 113 110 100
77 75 74 7147
Ch
ile
Can
ada
Mex
ico
Au
stra
lia
Bra
zil
Ch
ina
We
st A
fric
a
USA
Per
u
Ru
ssia
Co
lom
bia
Bu
rkin
a Fa
so
Arg
enti
na
Co
te d
’Ivo
ire
Gh
ana
Mal
i
Tan
zan
ia
Sen
ega
l
CORPORATE PRESENTATION

Discoveries by area
SIGNIFICANT WEST-AFRICA EXPLORATION SUCCESS
Source: SNL West Africa includes: Burkina Faso, Cote d’Ivoire, Ghana, Mali, Senegal, Guinea, Liberia and Sierra Leone 126
+79MozDiscovered over past 10
years in West Africa
No.1 Discovery region
globally
Top ranking region for discoveries over past 10 years
79Moz
50Moz
42Moz
33Moz
27Moz 27Moz
23Moz 22Moz20Moz
18Moz 16Moz 16Moz 15Moz13Moz 13Moz
11Moz
Gh
ana
Ru
ssia
Wes
t A
fric
a
Au
stra
lia
Co
lom
bia
Ch
ile
Bu
rkin
a Fa
so
Can
ada
Ecu
ado
r
USA
Mo
ngo
lia
Mex
ico
Ch
ina
Mal
i
Co
te d
’Ivo
ire
Sou
th A
fric
a
For the period between 2006-2016
CORPORATE PRESENTATION

SIGNIFICANT EXPLORATION EFFORTS IN WEST AFRICA
127
More exploration expenditures in a region that is 5x smaller
Source: S&P Global Market Intelligence. West Africa includes: Burkina Faso, Cote d’Ivoire, Ghana, Mali, Senegal, Liberia and Sierra Leone
Land mass compared to exploration spend
0
100
200
300
400
500
600
700
800
900
0 1 2 3 4 5 6 7 8 9 10 11 12 13
Land mass million km²
Canada
20
17
exp
lora
tio
n b
ud
get
($m
)
Australia
WestAfrica USA
More spending, yet 5x smaller land mass
CORPORATE PRESENTATION

128
West African geology - Birimian greenstone belt
Other14%
Mali10%
Burkina Faso22%
Côte d’Ivoire35%
Ghana19%
Mali21%
Other13%
Ghana39%
Burkina Faso17%
% of Birimian greenstone belt
2016 production (Moz)
BURKINA FASO & COTE D’IVOIRE ARE UNDER-EXPLORED Host ~60% of belt yet represents ~25% of production
Source: S&P Global Market Intelligence. West Africa includes: Burkina Faso, Cote d’Ivoire, Ghana, Mali, Senegal, Liberia, and Sierra Leone
Côted’Ivoire
10%
CORPORATE PRESENTATION

BURKINA FASO & COTE D’IVOIRE ARE FAST GROWING
Source: S&P Global Market Intelligence. 129
~50%of West African exploration
expenditures
$190m 2017 exploration spend for
Burkina Faso and Côte d’Ivoire
Represent half of the region's exploration expenditures
Burkina Faso29%
Ghana20%
Côte d’Ivoire20%
Mali19%
Other Countries12%
West African exploration expenditures by country2017 exploration expenditures
CORPORATE PRESENTATION

2016 gold production by country
STRONG PRODUCTION GROWTH IN WEST AFRICA
Source: World Gold Council. West Africa includes: Burkina Faso, Cote d’Ivoire, Ghana, Mali, Senegal, and Liberia 130
+81% West African production
growth over past 15 years
4thlargest gold producing
region globally
Has quickly become a top producing gold region
15Moz
9Moz9Moz
8Moz7Moz
5Moz 5Moz 5Moz
4Moz3Moz
3Moz 3Moz
Ru
ssia
Per
u
Ch
ina
Can
ada
Au
stra
lia
We
st A
fric
a
Un
ited
Sta
tes
Mex
ico
Sou
th A
fric
a
Ind
on
esia
Bra
zil
Gh
ana
CORPORATE PRESENTATION
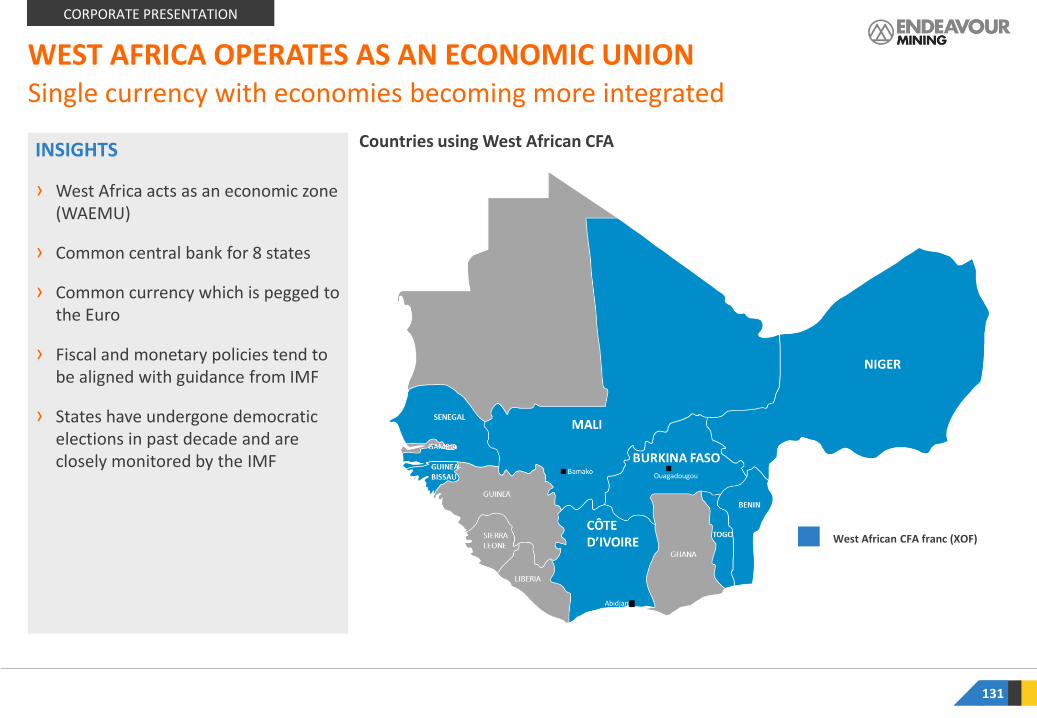
WEST AFRICA OPERATES AS AN ECONOMIC UNION
131
Single currency with economies becoming more integrated
Countries using West African CFA
West African CFA franc (XOF)
INSIGHTS
› West Africa acts as an economic zone (WAEMU)
› Common central bank for 8 states
› Common currency which is pegged to the Euro
› Fiscal and monetary policies tend to be aligned with guidance from IMF
› States have undergone democratic elections in past decade and are closely monitored by the IMF
CORPORATE PRESENTATION

Burkina Faso security heat map
SECURITY IN BURKINA FASO
132
CORPORATE PRESENTATION
Significant foreign aid and co-operation amongst West-African nations
(SMF)
(SMF)
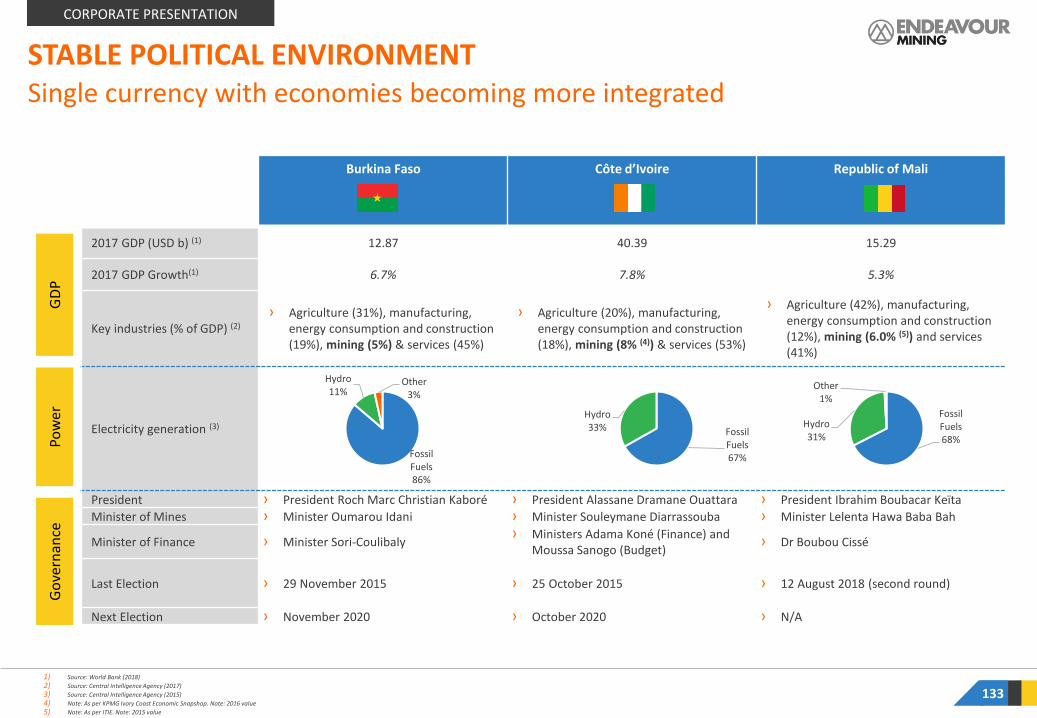
Burkina Faso Côte d’Ivoire Republic of Mali
2017 GDP (USD b) (1) 12.87 40.39 15.29
2017 GDP Growth(1) 6.7% 7.8% 5.3%
Key industries (% of GDP) (2)
› Agriculture (31%), manufacturing, energy consumption and construction (19%), mining (5%) & services (45%)
› Agriculture (20%), manufacturing, energy consumption and construction (18%), mining (8% (4)) & services (53%)
› Agriculture (42%), manufacturing, energy consumption and construction (12%), mining (6.0% (5)) and services (41%)
Electricity generation (3)
President › President Roch Marc Christian Kaboré › President Alassane Dramane Ouattara › President Ibrahim Boubacar Keïta
Minister of Mines › Minister Oumarou Idani › Minister Souleymane Diarrassouba › Minister Lelenta Hawa Baba Bah
Minister of Finance › Minister Sori-Coulibaly› Ministers Adama Koné (Finance) and
Moussa Sanogo (Budget)› Dr Boubou Cissé
Last Election › 29 November 2015 › 25 October 2015 › 12 August 2018 (second round)
Next Election › November 2020 › October 2020 › N/A
Fossil Fuels68%
Hydro31%
Other1%
1) Source: World Bank (2018)
2) Source: Central Intelligence Agency (2017)
3) Source: Central Intelligence Agency (2015)
4) Note: As per KPMG Ivory Coast Economic Snapshop. Note: 2016 value
5) Note: As per ITIE. Note: 2015 value
133
STABLE POLITICAL ENVIRONMENT G
DP
Pow
er
Fossil Fuels86%
Hydro11%
Other3%
Fossil Fuels67%
Hydro33%
Go
vern
ance
Single currency with economies becoming more integrated
CORPORATE PRESENTATION

Corporate Income Tax and RoyaltiesINSIGHTS
› Transfer pricing regulations recently established in the jurisdiction
› OECD principles associated to tax base erosion well governed with appropriate withholding tax and thin capitalisation legislation in place
› Standard tax principles and interpretation consistent in multiple countries within WAEMU zone
WEST AFRICA MINING CODES ARE WELL ALIGNED
Source: PWC 134
Country / Region Corporate Tax Mining Royalties
Burkina Faso Up to 27.5% Up to 5%
Côte d’Ivoire Up to 25.0% Up to 6%
Ghana Up to 35.0% Up to 5%
Guinea Up to 30.0% Up to 5%
Mali Up to 25.0% Up to 6%
Senegal Up to 30.0% Up to 3%
West Africa Up to 35.0% Up to 6%
Australia Up to 30.0% Up to 5%
USA Up to 47.0% Up to 5%
Canada Up to 31.0% Up to 3%
Very similar to developed countries
CORPORATE PRESENTATION
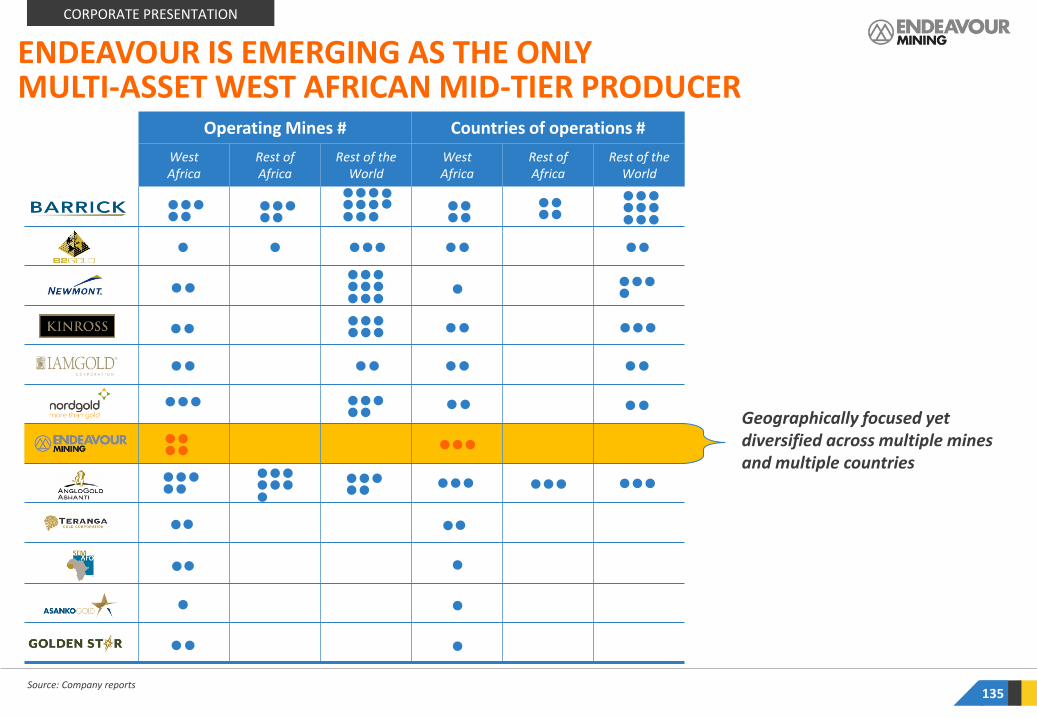
ENDEAVOUR IS EMERGING AS THE ONLY MULTI-ASSET WEST AFRICAN MID-TIER PRODUCER
135Source: Company reports
Operating Mines # Countries of operations #
West Africa
Rest of Africa
Rest of the World
West Africa
Rest of Africa
Rest of the World
Geographically focused yet diversified across multiple mines and multiple countries
CORPORATE PRESENTATION
TABLE OF CONTENTSCOMBINATION WITH SEMAFO: CREATION OF A LEADING WEST AFRICAN GOLD PRODUCER1
DETAILS BY MINE AND PROJECT
WEST AFRICA INSIGHTS
APPENDIX
2
3
4
ENDEAVOUR OVERVIEW
5
APPENDIX 1Board, Analyst Coverage

BOARD MEMBERS
138138
Michael BECKETTChairman,Non-executive Director
Olivier COLOM,Non-executive Director
Livia MAHLER,Non-executive Director
Wayne MCMANUS,Non-executive Director
Sébastien de MONTESSUS,CEO & President
Naguib SAWIRIS,Non-executive Director
Jim ASKEW,Non-executive Director
CORPORATE PRESENTATION
Sofia BIANCHI,Non-executive Director
Alison BAKER,Non-executive Director

ANALYST COVERAGE
139
Firm Analyst Phone Email
Berenberg Richard Hatch ✆ +44 20 3753 3070 ✉ [email protected]
Credit Suisse Fahad Tariq ✆ +1 416 352 4593 ✉ [email protected]
BMO Raj Ray ✆ +44 20 7246 5430 ✉ [email protected]
Clarus Securities Varun Arora ✆ +1 416 343 2779 ✉ [email protected]
Edison Charles Gibson ✆ +44 203 077 5724 ✉ [email protected]
Haywood Securities Geordie Mark ✆ +1 604 697 6112 ✉ [email protected]
National Bank Financial Don DeMarco ✆ +1 416 869 7572 ✉ [email protected]
Numis Securities Justin Chan ✆ +44 207 260 1430 ✉ [email protected]
PI Financial Chris Thompson ✆ +1 604 718 7549 ✉ [email protected]
RBC James Bell ✆ +44 207 653 4647 ✉ [email protected]
Scotia Bank Ovais Habib ✆ +1 416 863 7141 ✉ [email protected]
CORPORATE PRESENTATION

APPENDIX 2Financials

FINANCIAL OVERVIEW
141
+36% Adj. EPS
FY-2019 vs. FY-2018
+18% Operating cash flow
per shareFY-2019 vs. FY-2018
Benefited from the Ity CIL start-up and lower growth capex
For Continuing Operations(in US$ million unless otherwise stated)
QUARTER ENDED YEAR ENDED
Dec. 31, Sep. 30,Variance
Dec. 31, Dec. 31,Variance
2019 2019 2019 2018
PRODUCTION AND AISC HIGHLIGHTS
Gold Production, koz 178 181 (2%) 651 612 6%
All-in Sustaining Costs1, $/oz 819 803 2% 818 744 10%
FINANCIAL HIGHLIGHTS
Revenues 248 267 (7%) 886 752 18%
Adjusted EBITDA 98 123 (20%) 356 265 34%
Operating cash flow 120 96 25% 302 251 20%
Operating cash flow before non-cash WC 73 115 (36%) 294 261 13%
PER SHARE METRICS (US$/share)
Operating cash flow per share 1.10 0.88 25% 2.75 2.33 18%
Operating cash flow before non-cash WC per share 0.67 1.05 (36%) 2.68 2.43 10%
Adjusted earnings per share 0.34 0.30 11% 0.67 0.49 36%
CORPORATE PRESENTATION

YEAR ENDED
IN US$M IN $/OZ
From continuing operations unless otherwise specified
Dec. 31,2019
Dec. 31,2018
Dec. 31,2019
Dec. 31,2018
Variance
GOLD PRODUCED, koz 651 612
GOLD SOLD, koz 649 612
Realized Gold Price, US/oz 1,366 1,228
REVENUE 886 752 1,366 1,228 +138
Total cash costs (419) (355) (646) (579) (66)
Royalties (48) (41) (74) (67) (7)
Corporate costs (21) (27) (32) (43) +12
Sustaining capital spend - mining (43) (26) (66) (43) (23)
Sustaining capital spend - exploration 0 (7) 0 (12) +12
ALL-IN SUSTAINING MARGIN 356 296 549 484 +64
Less: Non-sustaining capital spend - mining (57) (44) (88) (72) (16)
Less: Non-sustaining capital spend - exploration (39) (42) (60) (68) +8
ALL-IN MARGIN 259 210 400 344 +56
142
Margin increased by $56/oz in 2019 compared to 2018
ALL-IN MARGIN BREAKDOWN
INSIGHTS1. Increased due to both higher production and
realized gold price.
2. Increased due to higher costs at Houndé(+$207/oz) and Karma (+$79/oz) which was slightly offset by a decrease at Agbaou(-$55/oz) and Ity CIL vs HL (-$89/oz).
3. Above a gold price of $1,300/oz, government royalty rates in Burkina Faso increase from 4.0% to 5.0%, and from 3.5% to 4.0% in Côte d'Ivoire.
4. Increased mainly due to increased stripping at Houndé and waste capitalization at Agbaou.
5. Increased mainly due to an increase at Houndé (Bouéré deposit) and Karma which was slightly offset by a decrease at Agbaou.
6. Mainly H1 weighted to complete drilling ahead of the rainy season.
Additional notes available in Endeavour’s MD&A filed on Sedar for the referenced periods.
1
3
5
4
6
2
CORPORATE PRESENTATION
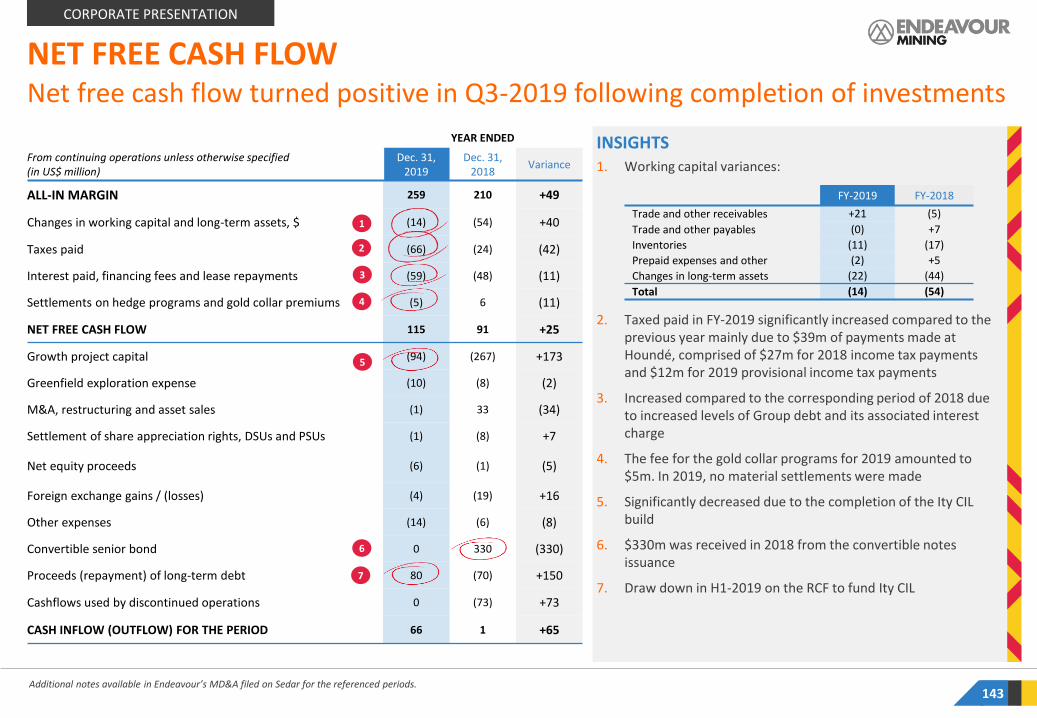
143
Net free cash flow turned positive in Q3-2019 following completion of investments
NET FREE CASH FLOW
INSIGHTS1. Working capital variances:
2. Taxed paid in FY-2019 significantly increased compared to the previous year mainly due to $39m of payments made at Houndé, comprised of $27m for 2018 income tax payments and $12m for 2019 provisional income tax payments
3. Increased compared to the corresponding period of 2018 due to increased levels of Group debt and its associated interest charge
4. The fee for the gold collar programs for 2019 amounted to $5m. In 2019, no material settlements were made
5. Significantly decreased due to the completion of the Ity CIL build
6. $330m was received in 2018 from the convertible notes issuance
7. Draw down in H1-2019 on the RCF to fund Ity CIL
Additional notes available in Endeavour’s MD&A filed on Sedar for the referenced periods.
FY-2019 FY-2018
Trade and other receivables +21 (5)
Trade and other payables (0) +7
Inventories (11) (17)
Prepaid expenses and other (2) +5
Changes in long-term assets (22) (44)
Total (14) (54)
YEAR ENDED
From continuing operations unless otherwise specified (in US$ million)
Dec. 31,2019
Dec. 31,2018
Variance
ALL-IN MARGIN 259 210 +49
Changes in working capital and long-term assets, $ (14) (54) +40
Taxes paid (66) (24) (42)
Interest paid, financing fees and lease repayments (59) (48) (11)
Settlements on hedge programs and gold collar premiums (5) 6 (11)
NET FREE CASH FLOW 115 91 +25
Growth project capital (94) (267) +173
Greenfield exploration expense (10) (8) (2)
M&A, restructuring and asset sales (1) 33 (34)
Settlement of share appreciation rights, DSUs and PSUs (1) (8) +7
Net equity proceeds (6) (1) (5)
Foreign exchange gains / (losses) (4) (19) +16
Other expenses (14) (6) (8)
Convertible senior bond 0 330 (330)
Proceeds (repayment) of long-term debt 80 (70) +150
Cashflows used by discontinued operations 0 (73) +73
CASH INFLOW (OUTFLOW) FOR THE PERIOD 66 1 +65
5
3
4
1
2
7
6
CORPORATE PRESENTATION
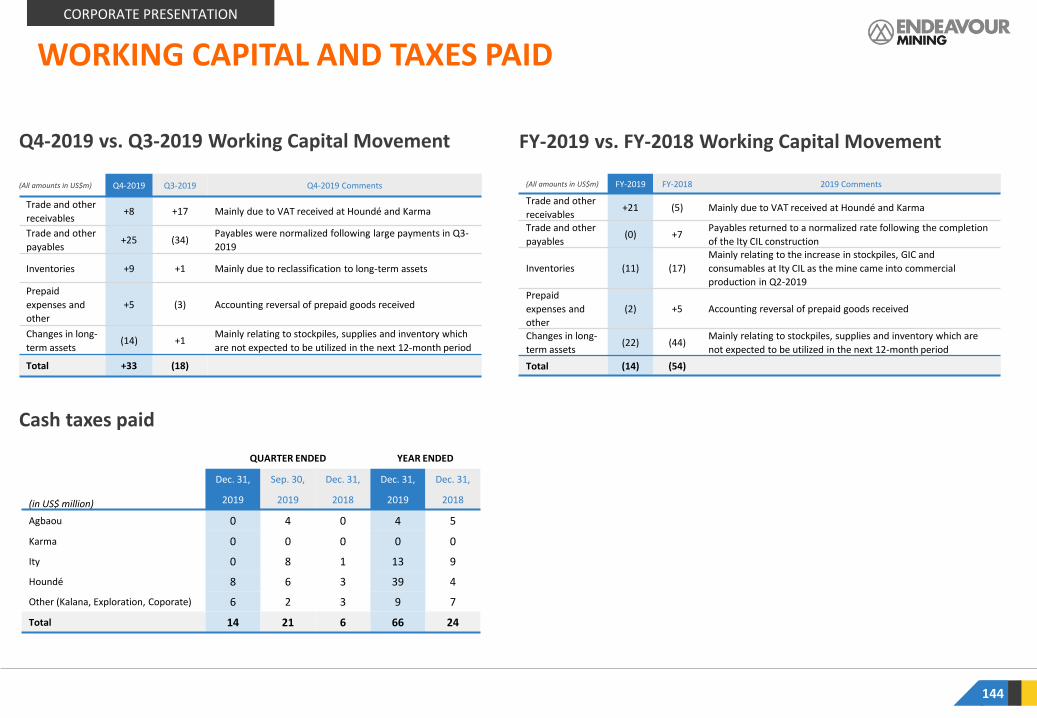
144
(All amounts in US$m) Q4-2019 Q3-2019 Q4-2019 Comments
Trade and other
receivables +8 +17 Mainly due to VAT received at Houndé and Karma
Trade and other
payables +25 (34)
Payables were normalized following large payments in Q3-
2019
Inventories +9 +1 Mainly due to reclassification to long-term assets
Prepaid
expenses and
other
+5 (3) Accounting reversal of prepaid goods received
Changes in long-
term assets(14) +1
Mainly relating to stockpiles, supplies and inventory which
are not expected to be utilized in the next 12-month period
Total +33 (18)
(All amounts in US$m) FY-2019 FY-2018 2019 Comments
Trade and other
receivables +21 (5) Mainly due to VAT received at Houndé and Karma
Trade and other
payables (0) +7
Payables returned to a normalized rate following the completion
of the Ity CIL construction
Inventories (11) (17)
Mainly relating to the increase in stockpiles, GIC and
consumables at Ity CIL as the mine came into commercial
production in Q2-2019Prepaid
expenses and
other
(2) +5 Accounting reversal of prepaid goods received
Changes in long-
term assets(22) (44)
Mainly relating to stockpiles, supplies and inventory which are
not expected to be utilized in the next 12-month period
Total (14) (54)
Q4-2019 vs. Q3-2019 Working Capital Movement FY-2019 vs. FY-2018 Working Capital Movement
QUARTER ENDED YEAR ENDED
Dec. 31, Sep. 30, Dec. 31, Dec. 31, Dec. 31,
(in US$ million) 2019 2019 2018 2019 2018
Agbaou 0 4 0 4 5
Karma 0 0 0 0 0
Ity 0 8 1 13 9
Houndé 8 6 3 39 4
Other (Kalana, Exploration, Coporate) 6 2 3 9 7
Total 14 21 6 66 24
Cash taxes paid
WORKING CAPITAL AND TAXES PAID
CORPORATE PRESENTATION

INSIGHTS› The total commitment capacity on the RCF was
increased in Q2-2019 by $80m to $430m to provide Endeavour with increased financial flexibility and ability to reimburse higher-cost debt within its capital structure.
› Net Debt amounted to $528m at year end 2019, a decrease of $8m compared to year end 2018. Net Debt decreased by $132m since reaching a peak Net Debt of $660m as at June 30, 2019, following the end of the ItyCIL construction.
145
Financial position significantly improved
NET DEBT AND LIQUIDITY ANALYSIS
Dec. 31, Dec. 31,
(in US$ million unless stated otherwise) 2019 2018
Cash 190 124
Equipment financing (78) (100)
Convertible senior bond (330) (330)
Drawn portion of RCF (310) (230)
NET DEBT POSITION 528 536
Net Debt / Adjusted EBITDA (LTM) ratio 1.48 1.97
Available sources of financing and liquidity
$120mUndrawn RCF
$190mCash
$310m
As at December 31, 2019
CORPORATE PRESENTATION
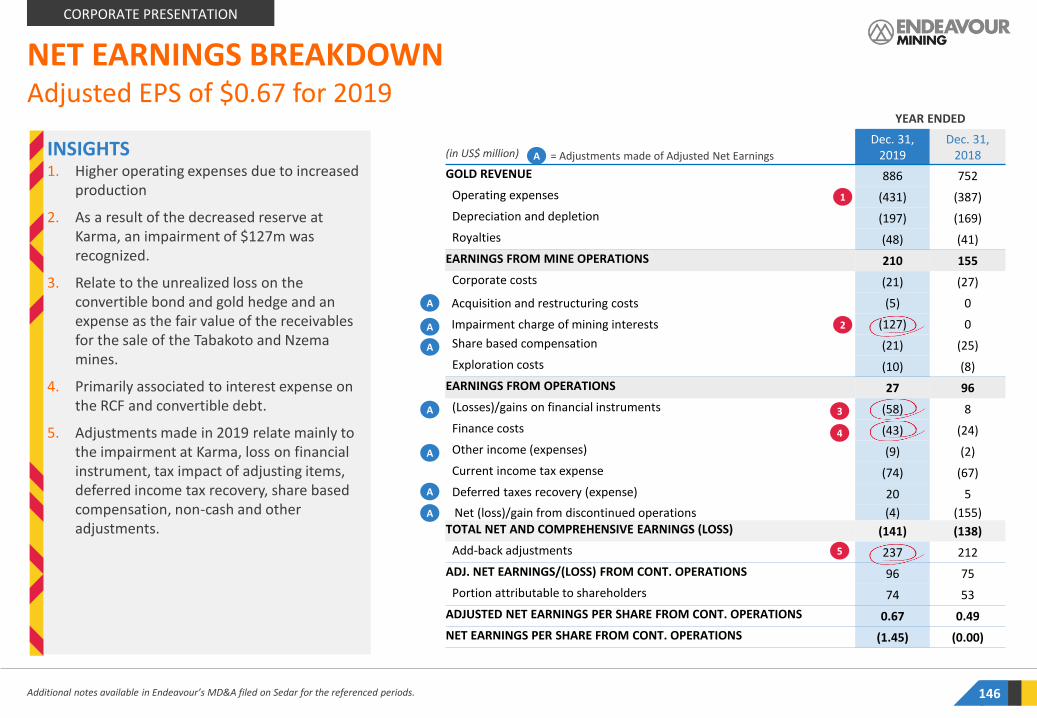
146
Adjusted EPS of $0.67 for 2019
NET EARNINGS BREAKDOWN
Additional notes available in Endeavour’s MD&A filed on Sedar for the referenced periods.
INSIGHTS1. Higher operating expenses due to increased
production
2. As a result of the decreased reserve at Karma, an impairment of $127m was recognized.
3. Relate to the unrealized loss on the convertible bond and gold hedge and an expense as the fair value of the receivables for the sale of the Tabakoto and Nzema mines.
4. Primarily associated to interest expense on the RCF and convertible debt.
5. Adjustments made in 2019 relate mainly to the impairment at Karma, loss on financial instrument, tax impact of adjusting items, deferred income tax recovery, share based compensation, non-cash and other adjustments.
YEAR ENDED
(in US$ million)Dec. 31,
2019Dec. 31,
2018
GOLD REVENUE 886 752
Operating expenses (431) (387)
Depreciation and depletion (197) (169)
Royalties (48) (41)
EARNINGS FROM MINE OPERATIONS 210 155
Corporate costs (21) (27)
Acquisition and restructuring costs (5) 0
Impairment charge of mining interests (127) 0
Share based compensation (21) (25)
Exploration costs (10) (8)
EARNINGS FROM OPERATIONS 27 96
(Losses)/gains on financial instruments (58) 8
Finance costs (43) (24)
Other income (expenses) (9) (2)
Current income tax expense (74) (67)
Deferred taxes recovery (expense) 20 5
Net (loss)/gain from discontinued operations (4) (155)TOTAL NET AND COMPREHENSIVE EARNINGS (LOSS) (141) (138)
Add-back adjustments 237 212
ADJ. NET EARNINGS/(LOSS) FROM CONT. OPERATIONS 96 75
Portion attributable to shareholders 74 53
ADJUSTED NET EARNINGS PER SHARE FROM CONT. OPERATIONS 0.67 0.49
NET EARNINGS PER SHARE FROM CONT. OPERATIONS (1.45) (0.00)
A = Adjustments made of Adjusted Net Earnings
A
A
A
A
3
4
5
1
2
A
A
A
CORPORATE PRESENTATION

Adjusted earnings per share (EPS)
ADJUSTED EARNINGS PER SHARE
147
+127% Q4-19 vs. Q4-18
+$0.19Q4-19 vs. Q4-18
($0.01/share)
$0.15/share
($0.04/share)
$0.08/share
$0.30/share
$0.34/share
Q3-19Q4-18Q3-18 Q1-19 Q2-19 Q4-19
Strong increase due to benefit of low cost Ity CIL and higher gold prices
Adjusted EPS from all operations, in $/share
CORPORATE PRESENTATION

0.50%
1.05%
1.60%
2.15%
2.70%
3.25%
0%
2%
4%
6%
8%
10%
12%
14%
1 6 11 16 21 26 31 36 41 46 51P
ote
nti
al d
iluti
on
148
Diversified debt sources with low interest cost and long maturity
Straight bond interest rate, % ~8%
Convertible bond, % 3%
Cost difference, % ~5%
Annual cost difference on $330m bond
$16m
1) REDUCES ITS OVERALL FINANCING COSTS AND DE-RISKS LIBOR EXPOSURE
$6m $7m
$11m$15m
$18m$21m
$25m
3.0% 5.0%1.5% 1.8%(at issuance)
4.0% 6.0% 7.0%
Annual saving based on $330m convertible compared to $330m drawn on RCF at various Libor rates
2) MORE ATTRACTIVE THAN A STRAIGHT BOND DUE TO LOWER INTEREST PAYMENTS
3) LIMITED DILUTION DUE TO OPTION TO SETTLE IN CASH
If principle is settled in cash and in the money option in shares
If all settled in shares
Share Price at maturity in C$
January 30 -Convertible issuance 1.77%
LIBOR curve
CORPORATE PRESENTATION
DIVERSIFIED DEBT SOURCES
DEBT SOURCES:
$430M RCF
› Interest rate of LIBOR plus 2.95% to 3.95% on drawn portion & 1.03% on undrawn portion
› Maturity of Sept. 2021, with bullet repayment
› Syndicate banks include Citi, Barclays, ING, Investec, SG, HSBC, BMO
$330M CONVERTIBLE NOTES
› 3% coupon on convertible note
› Ability to settle in cash or shares
› Conversion price of CAD29.47 (US$23.90) with maturity of February 2023
2.14%
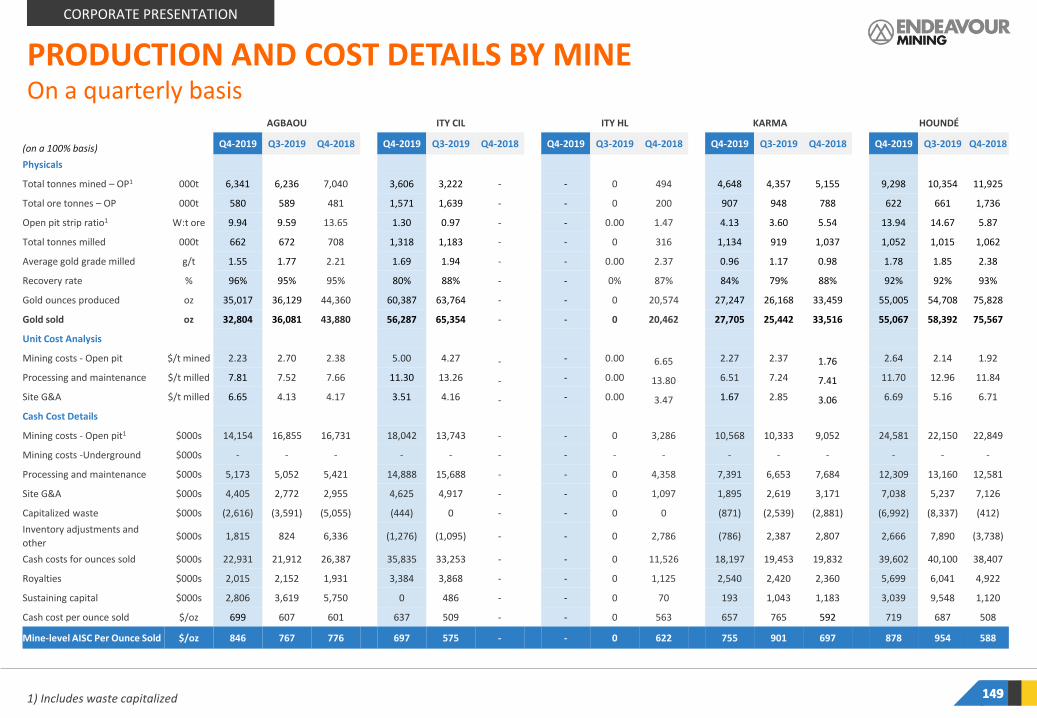
PRODUCTION AND COST DETAILS BY MINE
1) Includes waste capitalized 149149
On a quarterly basis
(on a 100% basis)
AGBAOU ITY CIL ITY HL KARMA HOUNDÉ
Unit Q4-2019 Q3-2019 Q4-2018 Q4-2019 Q3-2019 Q4-2018 Q4-2019 Q3-2019 Q4-2018 Q4-2019 Q3-2019 Q4-2018 Q4-2019 Q3-2019 Q4-2018
Physicals
Total tonnes mined – OP1 000t 6,341 6,236 7,040 3,606 3,222 - - 0 494 4,648 4,357 5,155 9,298 10,354 11,925
Total ore tonnes – OP 000t 580 589 481 1,571 1,639 - - 0 200 907 948 788 622 661 1,736
Open pit strip ratio1 W:t ore 9.94 9.59 13.65 1.30 0.97 - - 0.00 1.47 4.13 3.60 5.54 13.94 14.67 5.87
Total tonnes milled 000t 662 672 708 1,318 1,183 - - 0 316 1,134 919 1,037 1,052 1,015 1,062
Average gold grade milled g/t 1.55 1.77 2.21 1.69 1.94 - - 0.00 2.37 0.96 1.17 0.98 1.78 1.85 2.38
Recovery rate % 96% 95% 95% 80% 88% - - 0% 87% 84% 79% 88% 92% 92% 93%
Gold ounces produced oz 35,017 36,129 44,360 60,387 63,764 - - 0 20,574 27,247 26,168 33,459 55,005 54,708 75,828
Gold sold oz 32,804 36,081 43,880 56,287 65,354 - - 0 20,462 27,705 25,442 33,516 55,067 58,392 75,567
Unit Cost Analysis
Mining costs - Open pit $/t mined 2.23 2.70 2.38 5.00 4.27 - - 0.00 6.65 2.27 2.37 1.76 2.64 2.14 1.92
Processing and maintenance $/t milled 7.81 7.52 7.66 11.30 13.26 - - 0.00 13.80 6.51 7.24 7.41 11.70 12.96 11.84
Site G&A $/t milled 6.65 4.13 4.17 3.51 4.16 - - 0.00 3.47 1.67 2.85 3.06 6.69 5.16 6.71
Cash Cost Details
Mining costs - Open pit1 $000s 14,154 16,855 16,731 18,042 13,743 - - 0 3,286 10,568 10,333 9,052 24,581 22,150 22,849
Mining costs -Underground $000s - - - - - - - - - - - - - - -
Processing and maintenance $000s 5,173 5,052 5,421 14,888 15,688 - - 0 4,358 7,391 6,653 7,684 12,309 13,160 12,581
Site G&A $000s 4,405 2,772 2,955 4,625 4,917 - - 0 1,097 1,895 2,619 3,171 7,038 5,237 7,126
Capitalized waste $000s (2,616) (3,591) (5,055) (444) 0 - - 0 0 (871) (2,539) (2,881) (6,992) (8,337) (412)
Inventory adjustments and
other$000s 1,815 824 6,336 (1,276) (1,095) - - 0 2,786 (786) 2,387 2,807 2,666 7,890 (3,738)
Cash costs for ounces sold $000s 22,931 21,912 26,387 35,835 33,253 - - 0 11,526 18,197 19,453 19,832 39,602 40,100 38,407
Royalties $000s 2,015 2,152 1,931 3,384 3,868 - - 0 1,125 2,540 2,420 2,360 5,699 6,041 4,922
Sustaining capital $000s 2,806 3,619 5,750 0 486 - - 0 70 193 1,043 1,183 3,039 9,548 1,120
Cash cost per ounce sold $/oz 699 607 601 637 509 - - 0 563 657 765 592 719 687 508
Mine-level AISC Per Ounce Sold $/oz 846 767 776 697 575 - - 0 622 755 901 697 878 954 588
CORPORATE PRESENTATION

1) Includes waste capitalized 150150
On a yearly basis
PRODUCTION AND COST DETAILS BY MINE
(on a 100% basis)
AGBAOU ITY CIL ITY HL KARMA HOUNDÉ
Unit FY-2019 FY-2018 FY-2019 FY-2018 FY-2019 FY-2018 FY-2019 FY-2018 FY-2019 FY-2018
Physicals
Total tonnes mined – OP1 000t 25,349 29,735 14,053 - 0 4,028 19,435 16,932 38,194 41,489
Total ore tonnes – OP 000t 2,183 2,399 5,733 - 0 1,127 3,745 4,715 2,969 5,822
Open pit strip ratio1 W:t ore 10.60 11.40 1.45 - 0.00 2.58 4.19 2.59 11.87 6.13
Total tonnes milled 000t 2,699 2,830 3,693 - 0 1,307 4,196 4,097 4,144 3,948
Average gold grade milled g/t 1.62 1.70 1.88 - 0.00 2.49 0.91 0.95 1.83 2.29
Recovery rate % 95% 94% 86% --
81% 82% 82% 93% 94%
Gold ounces produced oz 137,537 141,335 190,438 - 2,702 84,832 96,534 108,733 223,304 277,218
Gold sold oz 137,006 142,559 183,630 - 4,214 85,191 96,615 108,308 227,290 276,046
Unit Cost Analysis
Mining costs - Open pit $/t mined 2.46 2.63 5.00 - 0.00 6.37 2.27 2.27 2.23 1.91
Processing and
maintenance$/t milled 7.66 7.69 11.30 - 0.00 14.97 7.04 8.42 12.48 11.74
Site G&A $/t milled 4.95 4.40 3.51 - 0.00 7.96 2.53 3.37 6.11 6.77
Cash Cost Details
Mining costs - Open pit1 $000s 62,464 78,128 45,781 - 0 25,665 44,140 38,508 85,269 79,049
Mining costs -
Underground$000s - - - - - - - - - -
Processing and
maintenance$000s 20,663 21,764 43,384 - 684 19,566 29,556 34,499 51,698 46,371
Site G&A $000s 13,353 12,451 14,694 - 26 10,402 10,621 13,797 25,335 26,736
Capitalized waste $000s (15,466) (20,016) (444) - 0 0 (13,074) (10,172) (24,528) (10,603)
Inventory adjustments and
other$000s 4,155 4,232 (1,062) - 3,664 (597) 4,420 (344) 13,622 (14,821)
Cash costs for ounces sold $000s 85,170 96,558 102,353 - 4,374 55,035 75,663 76,287 151,396 126,732
Royalties $000s 7,581 6,761 10,280 - 201 4,161 8,594 8,335 21,483 21,811
Sustaining capital $000s 16,241 13,438 486 - 0 2,076 2,994 3,385 23,081 7,152
Cash cost per ounce sold $/oz 622 677 557 - 1,038 646 783 704 666 459
Mine-level AISC Per Ounce
Sold$/oz 796 819 616 - 1,086 719 903 813 862 564
CORPORATE PRESENTATION

151151
CO
RP
OR
ATE P
RESEN
TATIO
N
CO
NSO
LIDA
TED STA
TEMEN
T OF FIN
AN
CIA
L P
OSITIO
N
10
21
51
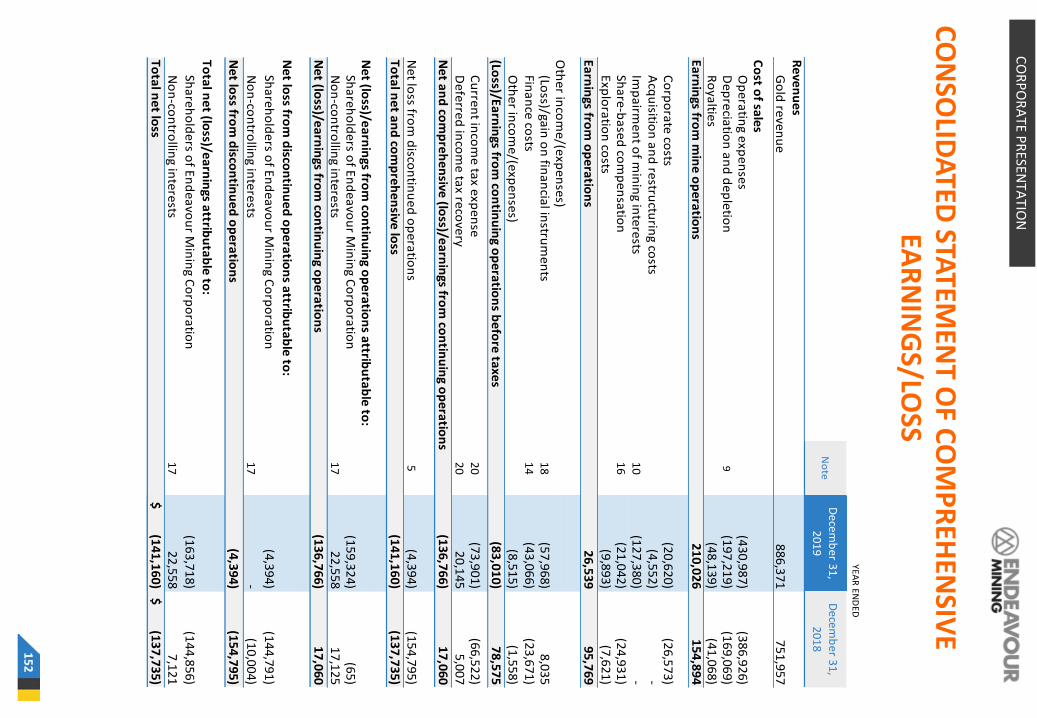
152152
CO
NSO
LIDA
TED STA
TEMEN
T OF C
OM
PR
EHEN
SIVE
EAR
NIN
GS/LO
SS
CO
RP
OR
ATE P
RESEN
TATIO
N
15
2
No
teD
ece
mb
er 3
1,
20
19
De
cem
be
r 31
,
20
18
Re
ven
ue
sG
old
reve
nu
e
88
6,3
71
75
1,9
57
Co
st of sa
les
Op
era
ting e
xpe
nse
s(4
30
,98
7)
(38
6,9
26
)D
ep
recia
tion
an
d d
ep
letio
n9
(19
7,2
19
)(1
69
,06
9)
Ro
yaltie
s(4
8,1
39
)(4
1,0
68
)E
arn
ings fro
m m
ine
op
era
tion
s 2
10
,02
61
54
,89
4
C
orp
ora
te co
sts(2
0,6
20
)(2
6,5
73
)A
cqu
isition
an
d re
structu
ring co
sts(4
,55
2)
-Im
pa
irme
nt o
f min
ing in
tere
sts1
0(1
27
,38
0)
-Sh
are
-ba
sed
com
pe
nsa
tion
1
6(2
1,0
42
)(2
4,9
31
)E
xplo
ratio
n co
sts(9
,89
3)
(7,6
21
)
Ea
rnin
gs from
op
era
tion
s 2
6,5
39
95
,76
9
Oth
er in
com
e/(e
xpe
nse
s)G
ain
/(loss) o
n fin
an
cial in
strum
en
ts(Lo
ss)/gain
on
fina
ncia
l instru
me
nts
18
(57
,96
8)
8,0
35
Fina
nce
costs
14
(43
,06
6)
(23
,67
1)
Oth
er in
com
e/(e
xpe
nse
s)(8
,51
5)
(1,5
58
)(Lo
ss)/Ea
rnin
gs from
con
tinu
ing o
pe
ratio
ns b
efo
re ta
xes
(83
,01
0)
78
,57
5
Cu
rren
t inco
me
tax re
cove
ry/(exp
en
se)
Cu
rren
t inco
me
tax e
xpe
nse
20
(73
,90
1)
(66
,52
2)
De
ferre
d in
com
e ta
x reco
very/(e
xpe
nse
)D
efe
rred
inco
me
tax re
cove
ry2
02
0,1
45
5,0
07
Ne
t an
d co
mp
reh
en
sive (lo
ss)/ea
rnin
gs from
con
tinu
ing o
pe
ratio
ns
(13
6,7
66
)1
7,0
60
5(4
,39
4)
(15
4,7
95
)T
ota
l ne
t an
d co
mp
reh
en
sive lo
ss(1
41
,16
0)
(13
7,7
35
)
Ne
t (loss)/e
arn
ings fro
m co
ntin
uin
g op
era
tion
s attrib
uta
ble
to:
Sha
reh
old
ers o
f En
de
avo
ur M
inin
g Co
rpo
ratio
n(1
59
,32
4)
(65
)N
on
-con
trollin
g inte
rests
17
22
,55
81
7,1
25
Ne
t (loss)/e
arn
ings fro
m co
ntin
uin
g op
era
tion
s(1
36
,76
6)
17
,06
0
Ne
t loss fro
m d
iscon
tinu
ed
op
era
tion
s attrib
uta
ble
to:
Sha
reh
old
ers o
f En
de
avo
ur M
inin
g Co
rpo
ratio
n(4
,39
4)
(14
4,7
91
)
No
n-co
ntro
lling in
tere
sts1
7-
(10
,00
4)
Ne
t loss fro
m d
iscon
tinu
ed
op
era
tion
s(4
,39
4)
(15
4,7
95
)
To
tal n
et (lo
ss)/ea
rnin
gs attrib
uta
ble
to:
Sha
reh
old
ers o
f En
de
avo
ur M
inin
g Co
rpo
ratio
n(1
63
,71
8)
(14
4,8
56
)
No
n-co
ntro
lling in
tere
sts1
72
2,5
58
7,1
21
To
tal n
et lo
ss (1
41
,16
0)
$
(13
7,7
35
)$
Ne
t loss fro
m d
iscon
tinu
ed
op
era
tion
s
YE
AR
EN
DE
D

153153
CA
SH FLO
W STA
TEMEN
T
CO
RP
OR
ATE P
RESEN
TATIO
N
15
3
No
teD
ece
mb
er 3
1,
20
19
De
cem
be
r 31
,
20
18
(Loss)/e
arn
ings fro
m co
ntin
uin
g op
era
tion
s be
fore
taxe
s (8
3,0
10
)
78
,57
5
Ad
justm
en
ts for:
De
pre
ciatio
n a
nd
de
ple
tion
D
ep
recia
tion
an
d d
ep
letio
n
91
97
,21
9
16
9,0
69
Fin
an
cing co
stsFin
an
ce co
sts1
44
3,0
66
2
3,6
71
Sh
are
ba
sed
com
pe
nsa
tion
Sha
re-b
ase
d co
mp
en
satio
n1
62
1,0
42
2
4,9
31
(Ga
in)/lo
ss on
fina
ncia
l instru
me
nts
Loss/(ga
in) o
n fin
an
cial in
strum
en
ts1
85
7,9
68
(8
,03
5)
Imp
airm
en
t of M
ine
sIm
pa
irme
nt o
f min
ing in
tere
sts1
01
27
,38
0
-
Ca
sh p
aid
on
settle
me
nt o
f sha
re a
pp
recia
tion
rights, D
SUs a
nd
PSU
s1
6(1
,12
5)
(8
,35
5)
Inco
me
taxe
s pa
id(6
5,9
97
)
(24
,01
8)
N
et ca
sh m
ove
me
nt fro
m go
ld co
llar se
ttlem
en
ts(5
,36
0)
5
,79
5
Ne
t no
n-ca
sh a
sset a
dju
stme
nts
6,7
90
1
8,4
13
Fo
reign
exch
an
ge ga
in/(lo
ss)Fo
reign
exch
an
ge lo
ss(3
,97
2)
(1
8,7
24
)
Op
era
ting ca
sh flo
ws b
efo
re ch
an
ges in
no
n-ca
sh w
orkin
g cap
ital
29
4,0
01
2
61
,32
2
Tra
de
an
d o
the
r rece
ivab
les
21
,39
3
(4,7
30
)
Inve
nto
ries
(10
,79
4)
(1
7,1
99
)
Pre
pa
id e
xpe
nse
s an
d o
the
r(2
,36
6)
5
,31
8
Tra
de
an
d o
the
r pa
yab
les
(34
9)
6
,52
4
Op
era
ting ca
sh flo
ws ge
ne
rate
d fro
m co
ntin
uin
g op
era
tion
s3
01
,88
5
25
1,2
35
Op
era
ting ca
sh flo
ws u
sed
by d
iscon
tinu
ed
op
era
tion
s5
-
(31
5)
C
ash
gen
era
ted
from
op
era
ting a
ctivities
30
1,8
85
$
25
0,9
20
$
Exp
en
ditu
res a
nd
pre
pa
yme
nts o
n m
inin
g inte
rests
Exp
en
ditu
res o
n m
inin
g inte
rests
9(2
33
,43
9)
(4
02
,20
3)
C
ash
pa
id fo
r ad
ditio
na
l inte
rest o
f Ity min
e1
7(4
53
)
-
Ch
an
ges in
lon
g-term
asse
ts1
1(2
1,5
09
)
(43
,57
0)
N
et p
roce
ed
s from
sale
of a
ssets
93
,87
5
33
,17
9
Inve
sting ca
sh flo
ws u
sed
by co
ntin
uin
g op
era
tion
s(2
51
,52
6)
(4
12
,59
4)
Inve
sting ca
shflo
ws u
sed
by d
iscon
tinu
ed
op
era
tion
s5
-
(40
,72
5)
Ca
sh u
sed
in in
vestin
g activitie
s (2
51
,52
6)
$
(45
3,3
19
)$
Pro
cee
ds re
ceive
d fro
m th
e issu
e o
f com
mo
n sh
are
s1
62
92
6
00
Divid
en
ds p
aid
to n
on
-con
trollin
g inte
rest
17
(6,1
54
)
(1,9
56
)
Re
ceip
t/(Pa
yme
nt) o
f fina
ncin
g fee
s an
d o
the
r P
aym
en
t of fin
an
cing fe
es a
nd
oth
er
(2,1
65
)
(2,3
00
)
Inte
rest p
aid
(33
,24
8)
(2
4,4
34
)
Pro
cee
ds o
f lon
g-term
de
bt
14
80
,00
0
21
0,0
00
R
ep
aym
en
t of lo
ng-te
rm d
eb
t1
4-
(2
80
,00
0)
P
roce
ed
s from
con
vertib
le se
nio
r bo
nd
14
-
33
0,0
00
R
ep
aym
en
t of fin
an
ce a
nd
lea
se o
bliga
tion
13
(23
,60
1)
(2
1,2
03
)
De
po
sit/(refu
nd
) pa
id o
n re
clam
atio
n lia
bility b
on
dD
ep
osit p
aid
on
recla
ma
tion
liab
ility bo
nd
-
(15
7)
Fin
an
cing ca
sh flo
ws ge
ne
rate
d fro
m co
ntin
uin
g op
era
tion
s1
5,1
24
2
10
,55
0
Fina
ncin
g cash
flow
s use
d b
y disco
ntin
ue
d o
pe
ratio
ns
5-
(6
,08
3)
Ca
sh ge
ne
rate
d fro
m fin
an
cing a
ctivities
15
,12
4$
2
04
,46
7$
Effe
ct of e
xcha
nge
rate
cha
nge
s on
cash
3
84
(7
48
)
Incre
ase
in ca
sh6
5,8
67
1
,32
0
Ca
sh, b
egin
nin
g of ye
ar
12
4,0
22
1
22
,70
2
Ca
sh, e
nd
of ye
ar
18
9,8
89
$
12
4,0
22
$
YE
AR
EN
DE
D
Op
era
ting
Activitie
s
Inve
sting
Activitie
s
Fina
ncin
g A
ctivities

APPENDIX 3Reserves and Resources

RESERVES AND RESOURCES
Full details and notes of reserves and resources can be found under the ‘Reserves and Resources’ section on the Company’s website at www.endeavourmining.com.155
On a 100% basisResources showninclusive of Reserves
Tonnage(Mt)
Grade(Au g/t)
Content(Au koz)
Proven Reserves 20.9 1.52 1,017
Probable Reserves 111.1 1.92 6,868
P&P Reserves 131.9 1.86 7,885
Measured Resource (incl reserves) 23.3 2.34 1,755
Indicated Resources (incl reserves) 215.9 1.87 12,985
M&I Resources (including Reserves) 239.3 1.92 14,750
Inferred Resources 44.1 1.61 2,280
Group Consolidated Total
Resources shown inclusive of Reserves. On a 100% basis
Tonnage(Mt)
Grade(Au g/t)
Content(Au koz)
Proven Reserves 9.4 1.1 318Probable Reserves 52.7 1.7 2,825P&P Reserves 62.1 1.6 3,144Measured Resource (incl reserves) 10.3 1.0 337Indicated Resources (incl reserves) 68.1 1.6 3,514M&I Resources (including Reserves) 78.4 1.5 3,851Inferred Resources 18.0 1.3 780
Ity Mine
Resources shown inclusive of Reserves. On a 100% basis
Tonnage(Mt)
Grade(Au g/t)
Content(Au koz)
Proven Reserves 5.1 3.00 492Probable Reserves 16.6 2.76 1,472P&P Reserves 21.7 2.81 1,964Measured Resource (incl reserves) 9.5 4.19 1,280Indicated Resources (incl reserves) 16.3 3.74 1,964M&I Resources (including Reserves) 25.8 3.92 3,254Inferred Resources 1.9 4.41 265
Kalana Project
Resources shown inclusive of Reserves. On a 100% basis
Tonnage(Mt)
Grade(Au g/t)
Content(Au koz)
Proven Reserves - 0.0 -Probable Reserves - 0.0 -P&P Reserves - 0.0 -Measured Resource (incl reserves) - 0.0 -Indicated Resources (incl reserves) 14.6 2.5 1,190M&I Resources (including Reserves) 14.6 2.5 1,190Inferred Resources 0.9 2.2 60
Fetekro Project
Resources shown inclusive of Reserves. On a 100% basis
Tonnage(Mt)
Grade(Au g/t)
Content(Au koz)
Proven Reserves 1.8 1.6 89Probable Reserves 30.9 2.1 2,075P&P Reserves 32.6 2.1 2,164Measured Resource (incl reserves) 1.7 1.7 96Indicated Resources (incl reserves) 58.6 2.0 3,797M&I Resources (including Reserves) 60.4 2.0 3,893Inferred Resources 6.9 2.1 456
Houndé Mine
Resources shown inclusive of Reserves. On a 100% basis
Tonnage(Mt)
Grade(Au g/t)
Content(Au koz)
Proven Reserves 1.5 0.71 34Probable Reserves 4.8 1.86 286P&P Reserves 6.3 1.58 321Measured Resource (incl reserves) 1.5 0.76 38Indicated Resources (incl reserves) 6.0 2.49 481M&I Resources (including Reserves) 7.6 2.14 519Inferred Resources 0.7 1.59 37
Agbaou MineResources shown inclusive of Reserves. On a 100% basis
Tonnage(Mt)
Grade(Au g/t)
Content(Au koz)
Proven Reserves 3.1 0.85 84Probable Reserves 6.1 1.06 209P&P Reserves 9.2 0.99 293Measured Resource (incl reserves) 0.3 0.38 4Indicated Resources (incl reserves) 52.3 1.21 2,038M&I Resources (including Reserves) 52.6 1.21 2,042Inferred Resources 15.7 1.35 681
Karma Mine
Notes :
As of December 31, 2019
Mine/Project1 Agbaou Kalana Ity Karma2 Houndé Fetekro
Reserves Au price 1,300 1,200 1,300 1,350 1,300 n.a.
Resources Au price 1,500 1,400 1,500 1,500 1,500 1,500
1Cut-off grades for all resources open pits are 0.5g/tAu, except at Kalana where the cut-off grade is at 0.9g/tAu and at Karma where the cut-off grade is defined by material type: Oxide=0.2, Transition=0.2 and Sulfide=0.5.Cut-off grades for reserves except for Kalana vary between 0.3-0.5g/t for Oxide ore, 0.3-0.8g/t for Transition ore, 0.3-0.7g/t for Sulfide ore.Cut-off grade for Kalana pits reserve is 0.9g/t.2 Kao, GG2, and Rambo have a gold price of $1,557/oz. Gold price for Kao Main and Rambo West reserves is $1,350/oz.
CORPORATE PRESENTATION

APPENDIX 4Convertible Bond, Revenue Protection Program, and ROCE

157
Evidence suggests that share prices are not capped by the strike price
(100%)
(75%)
(50%)
(25%)
0%
25%
50%
75%
100%
125%
Initial Stock Price Impact Pricing +1 day Pricing +3 days Pricing +7 days Pricing +14 days Pricing +30 days Pricing +90 days Pricing +180 days
INSIGHTS:
› The following graphshows stock priceperformance of 68convertibles issued by$1-5bn market capcompanies in the U.S.since 2015
› The graph shows thatover time, the stockprice performance ofconvertible issuersruns the gamut;closely analysing theunderlying data showsthat the stockperformance is relatedto businessperformance andmarket sentiments andnot to convertibleissuance
Share price performance of companies that issued convertible bonds
CORPORATE PRESENTATION
CONVERTIBLE BOND

› All targets referenced and classified according to :
‒ Current state of project knowledge (from grassroot to development)
‒ Quality of supporting data (drilling, available nearby analogs, structural trends, favorable geology, etc.)
‒ Distance to producing facilities:
‒ Mine Exploration then Near Mine exploration within a 5 km radius from facilities
‒ Brownfield Exploration between 5 and 15 km from facilities
‒ Greenfield Exploration for over 15/20 km from facilities (tentative stand alone future projects, or feeding the facilities if high grade)
› All targets characterized by a minimum-maximum and mean size of tentative deposit (length, width, depth), including estimated average grade when calibration is available
› Each selected target (~40 in 2016, ~50 in 2017) are risked and characterized by a Probability of Occurrence (POO), based on geological confidence/structural understanding/ type of expected mineralization/existing positive intercepts/trend extension, strong and coherent gold in soil and Auger anomalies
‒ POO 0.8 to 1: Very high confidence (some Mine and Near Mine Exploration or already Identified /tested targets)
‒ POO 0.6 : Probable deposit, with a size and grade distribution according to prognosis (Oz and average grade)
‒ POO 0.4: Less than average Probability of Occurrence, kept in the planning due to its possible size (High Risk- High Reward type) or due to its short distance to mine
› All selected exploration targets are set within a 5 year window, according to mine priorities, permit duration, requested exploration efforts, and budget and are characterized with:
‒ The required drilling amount/yearly budgets and the related timing of Indicated Resource definition
‒ Proposed yearly budgets include estimated manpower, drilling, analysis, support, geophysics, geochem, etc
‒ A 2017-2021 required risked exploration spending necessary to discover the targeted risked mean Indicated Oz per target
158
UNLOCK EXPLORATION VALUESelection, Ranking and Risk Evaluation of Exploration targets
CORPORATE PRESENTATION
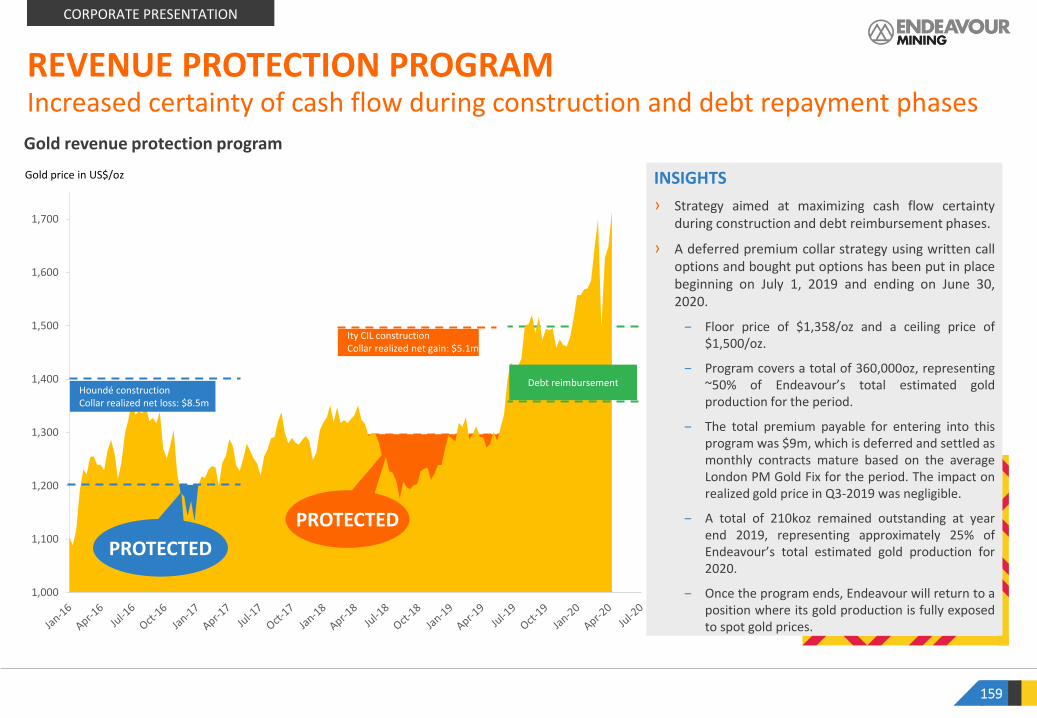
Gold revenue protection program
INSIGHTS
› Strategy aimed at maximizing cash flow certaintyduring construction and debt reimbursement phases.
› A deferred premium collar strategy using written calloptions and bought put options has been put in placebeginning on July 1, 2019 and ending on June 30,2020.
‒ Floor price of $1,358/oz and a ceiling price of$1,500/oz.
‒ Program covers a total of 360,000oz, representing~50% of Endeavour’s total estimated goldproduction for the period.
‒ The total premium payable for entering into thisprogram was $9m, which is deferred and settled asmonthly contracts mature based on the averageLondon PM Gold Fix for the period. The impact onrealized gold price in Q3-2019 was negligible.
‒ A total of 210koz remained outstanding at yearend 2019, representing approximately 25% ofEndeavour’s total estimated gold production for2020.
‒ Once the program ends, Endeavour will return to aposition where its gold production is fully exposedto spot gold prices.
159
Gold price in US$/oz
Increased certainty of cash flow during construction and debt repayment phasesREVENUE PROTECTION PROGRAM
Ity CIL constructionCollar realized net gain: $5.1m
CORPORATE PRESENTATION
1,000
1,100
1,200
1,300
1,400
1,500
1,600
1,700
Debt reimbursement
PROTECTED
PROTECTED
Houndé constructionCollar realized net loss: $8.5m
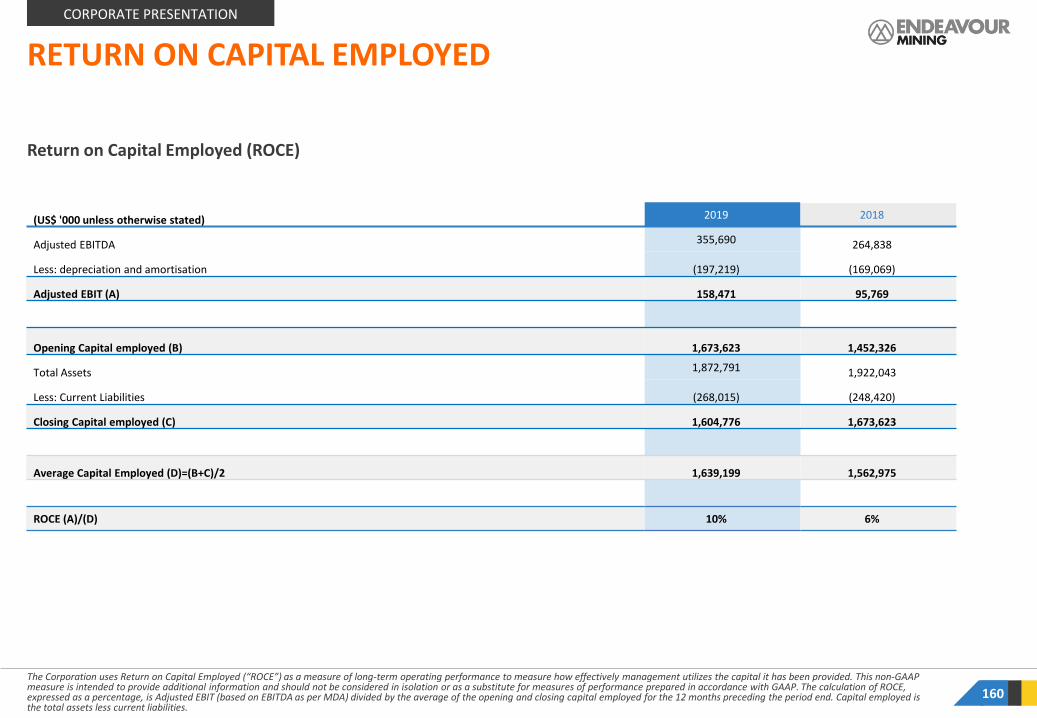
RETURN ON CAPITAL EMPLOYED
The Corporation uses Return on Capital Employed (“ROCE”) as a measure of long-term operating performance to measure how effectively management utilizes the capital it has been provided. This non-GAAP measure is intended to provide additional information and should not be considered in isolation or as a substitute for measures of performance prepared in accordance with GAAP. The calculation of ROCE, expressed as a percentage, is Adjusted EBIT (based on EBITDA as per MDA) divided by the average of the opening and closing capital employed for the 12 months preceding the period end. Capital employed is the total assets less current liabilities.
160
CORPORATE PRESENTATION
Return on Capital Employed (ROCE)
(US$ '000 unless otherwise stated) 2019 2018
Adjusted EBITDA 355,690 264,838
Less: depreciation and amortisation (197,219) (169,069)
Adjusted EBIT (A) 158,471 95,769
Opening Capital employed (B) 1,673,623 1,452,326
Total Assets 1,872,791 1,922,043
Less: Current Liabilities (268,015) (248,420)
Closing Capital employed (C) 1,604,776 1,673,623
Average Capital Employed (D)=(B+C)/2 1,639,199 1,562,975
ROCE (A)/(D) 10% 6%

Net debt & liquidity calculation
EDV SMFLa Mancha Injection
31/12/19
Pro-forma
US$'000
Cash & Eq. 189,889 98,297 100,000 388,186
RCF (330,000) -- -- (330,000)
Convertible Loan (310,000) -- -- (310,000)
Macquarie Facilities -- (60,000) -- (60,000)
Leases (78,081) (28,317) -- (106,398)
Net Cash/(Net Debt) (528,192) 9,980 100,000 (418,212)
Return On Capital Employed (ROCE)
EDV SEMAFO31/12/2019Pro-forma
US$'000
Adjusted EBITDA 355,690 262,753 618,443
Less: Depreciation and Amortisation (197,219) (139,824) (337,043)
Adjusted EBIT (A) 158,471 122,929 281,400
Opening Capital Employed (B) 1,673,623 896,007 2,569,630
Total Assets 1,872,791 1,110,113 2,982,904
Less: Current Liabilities (268,015) (146,279) (414,294)
Closing Capital Employed (C) 1,604,776 963,834 2,568,610
Average Capital Employed (D) = (B+C)/2 1,639,200 929,921 2,569,120
ROCE (A)/(D) 10% 13% 11%
Source: Companies disclosure (2019 FS) 161
PRO-FORMA NET DEBT, LIQUIDITY AND ROCE
Net debt
Liquidity
EDV SMFLa Mancha Injection
31/12/19
Pro-forma
US$'000
Cash & Eq. 189,889 98,297 100,000 388,186
Undrawn RCF 120,000 -- -- 120,000
Total liquidity 309,889 98,297 100,000 508,186
APPENDIX