Corporate governance in the Asian financial crisis
56
Corporate Governance in the Asian Financial Crisis By: Simon Johnson, Peter Boone, Alasdair Breach and Eric Friedman Working Paper Number 297 November 1999
-
Upload
independent -
Category
Documents
-
view
2 -
download
0
Transcript of Corporate governance in the Asian financial crisis
Corporate Governance in the Asian Financial Crisis
By: Simon Johnson, Peter Boone, Alasdair Breach and Eric Friedman
Working Paper Number 297November 1999

1
Revised: November 15, 1999
Please send any comments to [email protected]
Corporate Governance in the Asian Financial Crisis*
Simon JohnsonMIT
Peter BooneBrunswick Warburg
Alasdair BreachGoldman Sachs
Eric FriedmanRutgers
AbstractThe “Asian Crisis” of 1997-98 affected all the “emerging markets” open to capital flows.Measures of corporate governance, particularly the effectiveness of protection for minorityshareholders, explain the extent of depreciation and stock market decline better than do standardmacroeconomic measures. A possible explanation is that in countries with weak corporategovernance, worse economic prospects result in more expropriation by managers and thus alarger fall in asset prices.
* Helpful comments on earlier drafts were provided by Olivier Blanchard, Ricardo Caballero, StijnClaessens, Douglas Diamond, Stephanie Flanders, Mary Kwak, Rafael La Porta, Don Lessard, RichardLocke, Florencio Lopez-de-Silanes, Stewart Myers, Andrei Shleifer, Ed Steinfeld, Scott Stern, KseniaYudaeva, Luigi Zingales, three anonymous referees, and seminar participants at the NBER corporatefinance workshop, the Stockholm School of Economics, and the Federal Reserve Bank of Chicago.Florencio Lopez-de-Silanes kindly provided access to unpublished data. Konstantina Drakouli andMatthew Utterback were very helpful research assistants. Generous support was provided by the MITEntrepreneurship Center and the Russian-European Centre for Economic Policy (RECEP).

1
1. Introduction
What caused the large exchange rate depreciations and stock market declines in some
Asian countries during 1997-98? The three main explanations for the “Asian Crisis” emphasize
macroeconomic and banking issues. The standard Washington view attributes the Asian Crisis
to inappropriate macroeconomic policy during the 1990s, made worse by inept management of
the initial depreciation in 1997 (Greenspan 1998, Corsetti, Pesenti, and Roubini 1998). In
contrast, Radelet and Sachs (1998a and 1998b) and Wade and Veneroso (1998) argue that the
crisis began with a mild panic that had no real foundation and was made serious only by IMF
pressure to increase interest rates and to close down banks. Krugman (1998) presents a third
theory based on international bank behavior by arguing there was a “Pangloss equilibrium” that
caused a bubble in asset prices. In his view, the Asian panics had their origins in implicit (and
implausible) guarantees offered by governments and believed by investors.
These explanations agree that for some reason, perhaps unrelated to economic
fundamentals, there was a loss of confidence by domestic and foreign investors in all emerging
markets. This led to a fall in capital inflows and an increase in capital outflows that triggered, in
some cases, a very large nominal depreciation and a stock market crash. At the same time, these
explanations do not address exactly why this loss of confidence had such large effects on the
exchange rate and stock market in some emerging market countries but not others.
This paper presents evidence that the weakness of legal institutions for corporate
governance had an important effect on the extent of depreciations and stock market declines in
the Asian crisis. By “corporate governance” we mean the effectiveness of mechanisms that
minimize agency conflicts involving managers, with particular emphasis on the legal
mechanisms that prevent managers from expropriating minority shareholders (see Shleifer and

2
Vishny 1997a). The theoretical explanation is simple and quite complementary to the usual
macroeconomic arguments. If stealing by managers increases when the expected rate of return
on investment falls, then an adverse shock to investor confidence will lead to increased theft and
to lower capital inflow and greater attempted capital outflow for a country. These, in turn, will
translate into lower stock prices and a depreciated exchange rate. In the case of the Asian crisis,
we find that corporate governance provides at least as convincing an explanation for the extent of
exchange rate depreciation and stock market decline as any or all of the usual macroeconomic
arguments.
The Bangkok Bank of Commerce provides a well-documented case of expropriation by
managers that worsened as the bank’s financial troubles deepened.1 The experience of creditors
in Hong Kong who lent to firms doing business in mainland China is similar – Hong Kong-based
company liquidators are not able to recover assets of Chinese companies that default on loans
(Wall Street Journal, August 25, 1999, p.A14.) More generally, very few debt defaults from the
Asian crisis of 1997-98 have resulted in investors receiving any liquidation value.2 During the
crisis, Korean minority shareholders protested the transfer of resources out of large firms,
including Samsung Electronics and SK Telecom. Most collapses of banks and firms in Russia
after the devaluation of August 1998 were associated with complete expropriation; creditors and
minority shareholders got nothing (Troika Dialog 1999). Table 1 summarizes the details of
leading allegations of expropriation in countries affected by the Asian crisis. Note that in many
1 “As the losses mounted, Thai authorities say, more and more money was moved offshore, much of itthrough a now-defunct Russian bank run by one of Mr. Saxena’s business partners. Mr. Saxena’sactivities, says Mr. Aswin [who was brought in later to save the bank], “came to look like straightsiphoning” (The Wall Street Journal 1999, p.A6.)2 For example, The Economist reports “Despite the creation last year of a bankruptcy law in Indonesiawhere there had been none before, it is still virtually impossible to force a defaulted debtor intoliquidation (the few creditors that have tried are still tangled up in legal appeals)” (30 January 1999).

3
of these cases, controlling shareholders did not need to break any local laws in order to
expropriate investors.
In most of these instances, management was able to transfer cash and other assets out of a
company with outside investors. These assets may have been used to pay the management’s
personal debts, or they may have been used to shore up another company with different
shareholders, or they may have become straight capital flight into a foreign bank account. The
fact that management in most emerging markets is also the controlling shareholder makes these
transfers easier to achieve. The downturns in these countries have been associated with
significantly more expropriation of cash and tangible assets by managers.
Our results highlight the importance of the legal protection afforded creditors and
minority shareholders and are closely linked to the recent findings of La Porta, Lopez-de-Silanes,
Shleifer, and Vishny 1997, 1998, and 1999b (hereafter referred to as LLSV). These authors
show that the extent to which creditor and minority shareholder rights are protected explains a
great deal of the variation in how firms are funded and owned across countries. In particular,
LLSV (1997) provide evidence from a sample of 49 countries that weak shareholder rights and
poor enforcement leads to underdeveloped stock markets. Here we show that weak enforcement
of shareholder rights had first-order importance in determining the extent of exchange rate
depreciation and stock market collapse in 1997-98.
Related ideas have been expressed by Yellen (1998), Rajan and Zingales (1998), and
Caballero and Krishnamurthy (1998). Yellen (1998) argues that “a ‘relationships’ model of
capital allocation is extraordinarily susceptible to a deterioration in perceptions about the quality
of investment decisions.” Rajan and Zingales (1998) explain the problems that can occur when a
relationship-based financial system is opened up to capital inflows. Caballero and
4
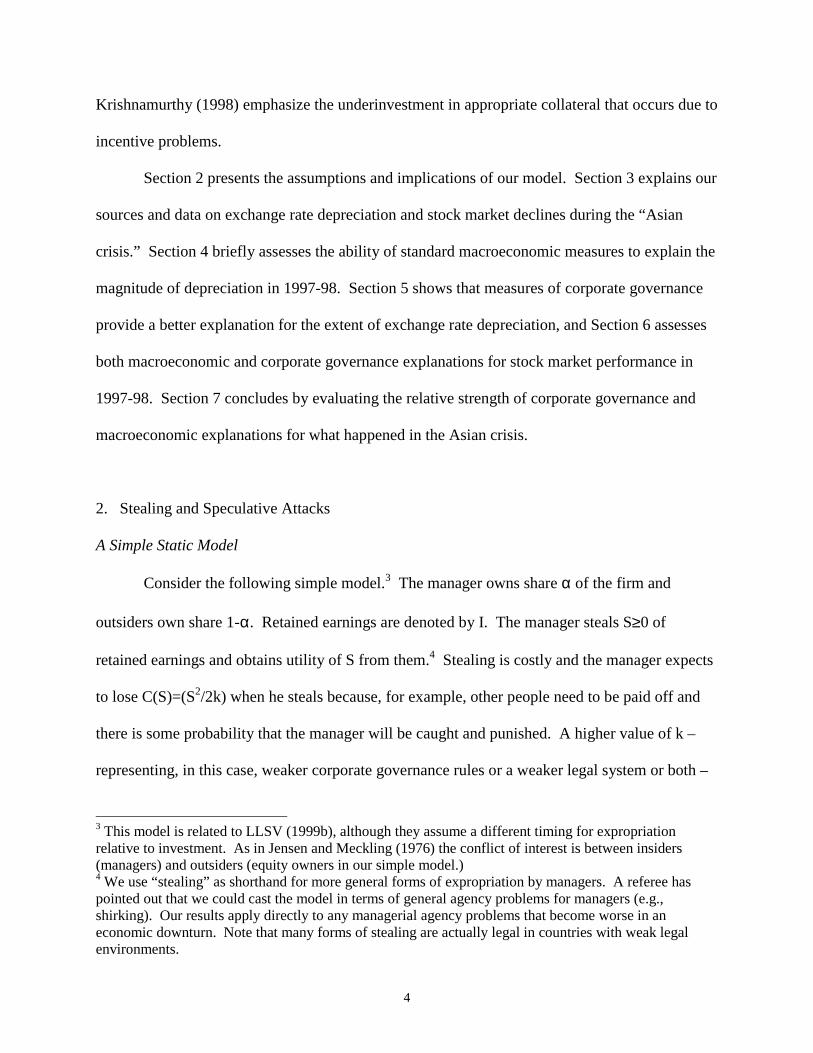
Krishnamurthy (1998) emphasize the underinvestment in appropriate collateral that occurs due to
incentive problems.
Section 2 presents the assumptions and implications of our model. Section 3 explains our
sources and data on exchange rate depreciation and stock market declines during the “Asian
crisis.” Section 4 briefly assesses the ability of standard macroeconomic measures to explain the
magnitude of depreciation in 1997-98. Section 5 shows that measures of corporate governance
provide a better explanation for the extent of exchange rate depreciation, and Section 6 assesses
both macroeconomic and corporate governance explanations for stock market performance in
1997-98. Section 7 concludes by evaluating the relative strength of corporate governance and
macroeconomic explanations for what happened in the Asian crisis.
2. Stealing and Speculative Attacks
A Simple Static Model
Consider the following simple model.3 The manager owns share α of the firm and
outsiders own share 1-α. Retained earnings are denoted by I. The manager steals S≥0 of
retained earnings and obtains utility of S from them.4 Stealing is costly and the manager expects
to lose C(S)=(S2/2k) when he steals because, for example, other people need to be paid off and
there is some probability that the manager will be caught and punished. A higher value of k –
representing, in this case, weaker corporate governance rules or a weaker legal system or both –
3 This model is related to LLSV (1999b), although they assume a different timing for expropriationrelative to investment. As in Jensen and Meckling (1976) the conflict of interest is between insiders(managers) and outsiders (equity owners in our simple model.)4 We use “stealing” as shorthand for more general forms of expropriation by managers. A referee haspointed out that we could cast the model in terms of general agency problems for managers (e.g.,shirking). Our results apply directly to any managerial agency problems that become worse in aneconomic downturn. Note that many forms of stealing are actually legal in countries with weak legalenvironments.
5
means that it is less costly to steal. Thus the value of stealing, S–C(S), is concave in S. The
marginal value of stealing falls as the amount stolen increases because it becomes harder to steal
as the absolute amount of theft increases. For example, the stealing becomes more obvious and
easier for a court to stop.
The manager invests what he does not steal in a project that earns a gross rate of return R,
which is greater than one, and from which he obtains the share α of profits. The manager’s
optimization problem is given by:
MaxSU(S;R,k,α) = Max [αR(I-S) + S – (S2/2k)],
and the optimal amount of theft, S*, is found by solving:
∂U/∂S = 1 – (S*/k) - αR = 0,
which yields,
S*(R,k,α) = k(1 - αR).
We assume that the parameter values are such that the manager will not attempt to steal more
than the total amount of retained earnings: S*(R,k,α)≤ I. This simplifies the analysis by
avoiding a corner solution, without changing the main insights.
The manager equates the marginal cost and marginal benefit of stealing. Because the
manager owns α of the firm, he has an incentive to invest at least some of the firm’s cash rather
than to steal it all. As α rises, the equilibrium amount of stealing falls. As k rises, the amount of
stealing in equilibrium rises. If α>1/R, the manager’s stealing is “negative,” meaning the
manager puts in some of his own money into the firm; for our purposes, we assume that α is low
enough that he chooses to steal.5
5 We could also assume that the manager is credit constrained. In this static model, assuming that themanager never steals less than zero does not substantially alter the analysis. In a dynamic model we canrelax this assumption to allow the manager to have “negative” stealing (putting his own money into the

6
Differentiating the optimal stealing equation with respect to R gives:
(∂S*/∂R) = - αk.
An increase in the rate of return on the invested resources reduces the amount of stealing,
because it raises the marginal opportunity cost of the stolen resources.
A larger α means ∂S*/∂R is more negative. If the manager owns more of the firm, then a
given increase in the return on investment convinces him to put more resources into the
investment project and, therefore, to steal less. Conversely, if the manager owns more but the
return on investment declines, then he steals more.
A larger value of k means that ∂S*/∂R is more negative. A lower cost of stealing (higher
k) both raises the equilibrium value of stealing and makes stealing more responsive to changes in
the rate of return on investment. This is because higher k both shifts up the stealing function and
makes it less concave (i.e., the returns to stealing do not decrease so strongly.)
The outside investor receives share (1-α) of the returns from the funds that are actually
invested in the firm. The expected value of the equity in the firm is therefore:
Π = R(I-k(1-αR)),
where Π is the equity value of the firm. This is the value of all the equity, held by both outsiders
and managers, which equals the total value of the firm minus the value of stealing.
Differentiating with respect to R gives the “absolute responsiveness,”
ρa = ∂Π/∂R = I – k + 2Rkα,
firm) this period in order to keep the firm alive and enjoy “positive” stealing in the future (Friedman andJohnson 1999.)

7
which is the sensitivity of firm value to changes in R. This is always positive because we have
assumed that the optimal level of stealing is less than I.6
There are two effects of a higher R. The first, direct effect is to raise the expected payoff
and thus increase the amount that the investor is willing to put into the firm. Holding the level of
stealing constant, the direct effect shows that the value of the firm rises. The second, indirect
effect works because higher returns from investment reduce the optimal level of stealing, so
∂S*/∂R<0. Lower stealing also raises the expected payoff for outside investors and increases the
value of the firm.7
What is the effect on ∂Π/∂R of changing the penalty for managerial theft, k? The effect
on the absolute responsiveness is
∂ρa/∂k = 2Rα - 1.
For low values of αR, such that Rα<½, a higher value of k (a lower penalty) implies a fall in
∂Π/∂R. For high values of αR, however, a higher value of k implies an increase in ∂Π/∂R. The
intuition for this result is that when αR is small the manager is already stealing a great deal, so Π
is already low in absolute terms and further changes in R do not induce much additional theft.8
6 The maximum value of stealing, given by the first order condition when αR is zero, is k. We alreadyassumed that there cannot be “negative” stealing, so k≤I, and this is sufficient to ensure that ρa>0.7 In order to make the main point, we have presented a simplified model that ignores general equilibriumeffects. Assuming α is exogenous, the expected return for an outside investor varies between countriesthat have a different value of k. In equilibrium this would not occur because outside investors wouldwant to invest more in the country with a higher return. A complete model would include these generalequilibrium effects.8 Differentiating absolute responsiveness with respect to k gives:
∂ρa/∂k = ∂2Π/∂R∂k = (-∂S/∂k) + [– R(∂2S/∂R∂k)].The first term is always negative: a higher value of k increases the absolute level of stealing. But thesecond term is positive – when k is higher, a given change in R induces a smaller change in the level ofstealing (due to the convex stealing costs). When the second term is relatively large in absolute terms,i.e., when R is high, then ∂2Π/∂R∂k will be positive.
8
However, we can obtain an unambiguous comparative static prediction for the relative
responsiveness,
ρr =(∂Π/∂R)/ Π = (I – k(1-αR) + Rkα)/R(I – k(1-αR)),
which is the sensitivity of firm value in percentage terms. The derivative of this change with
respect to k is:
∂ρr /∂k = Iα/(I-k+Rkα)2 > 0.
This effect is positive regardless of the value of α.9 A higher value of k (i.e., a weaker legal
environment) implies that (∂Π/∂R)/Π increases, so that the value of the firm, Π, becomes more
sensitive in percentage terms to a change in the rate of return, R.10 In the data, therefore, we will
look at percentage changes in firms’ values.
Implications for the Exchange Rate
Our model so far has dealt exclusively with the effect of a loss of confidence on the value
of a single firm. Aggregating similar firms to create an economy-wide collapse of firms’ values
is straightforward. We can also reasonably assume that foreign investors and many domestic
investors care about returns in dollars. We then have the result that a fall in R, which is now a
9Note that the relationship between absolute and relative responsiveness is:
∂(ρa)/∂k = ∂(Π ρr)/∂k = Π[∂ρr/∂k] + [∂Π/∂k](ρr).The first term is positive. The second term contains ∂Π/∂k, which is negative.10 This same result holds if we allow firms to borrow debt as well as issue equity. However, as weshowed in an earlier working paper, the presence of debt means, in general, that there exists a range ofvalues for R within which a lower value of R actually means less stealing. The intuition is that themanager steals less (or may even transfer funds into the firm if that is possible) in order to enable the firmto service its debt and therefore preserve the possibility of future stealing. If R falls sufficiently low,however, then the manager will choose to loot the firm and it will go out of existence.

9
loss of confidence about returns in dollars, can trigger a fall in firms’ values in dollars (i.e., the
value of the stock market in dollar terms).11
But will such a collapse of firms’ values occur alongside an exchange rate collapse?
Theoretically, a sharp fall in stock prices need not affect the exchange rate. Outside investors
may choose to bring more capital into the country if, for example, they are more patient than
domestic investors. The exchange rate only depreciates if the loss of confidence about R also
triggers a fall in capital inflows or larger capital outflows.12 In fact, if the foreign exchange
market is forward looking, the mere prospect of a reduction in net capital inflows should be
enough to cause an immediate depreciation. There are five reasons why a loss of confidence may
cause the net capital inflow to fall and why this fall may be larger when corporate governance is
weaker.
First, when the expected return to outside investors is lower, investing in a country is less
attractive. Outside investors receive less because the actual returns on investment projects are
lower and because managers steal more. For a given level of expected risk, lower expected
returns tend to reduce the net capital inflow to a particular country.13 Weaker corporate
governance means lower short-term expected returns or more risk or both.
11 Note that firms’ values could fall sharply, even if there is not much actual stealing. The value of firms’to outsiders is determined by expected expropriation, or simply how much investors think managers willlet them share in the returns on investment.12 Alan Greenspan (1998) explains the depreciation spiral and its spread across countries as follows: “Theloss of confidence can trigger rapid and disruptive changes in the pattern of finance, which, in turn feedsback on exchange rates and asset prices. Moreover, investor concerns that weaknesses revealed in oneeconomy may be present in others that are similarly structured means that the loss of confidence can bequickly spread to other countries.”13 In a full model, investors would trade off risk and expected returns. If they learn that the expectedreturn is lower, while risk is unchanged or has even increased, their preference for assets in this countrywill be reduced. This is one explanation for why many global investment funds cut their positions inemerging markets in 1997-98. See International Organization of Securities Commissions (1998) for amore detailed discussion.
10
Second, there are important agency problem-based reasons why traders who have just
lost a great deal of money cannot immediately invest more in a country, even if they believe the
expected returns are high. Shleifer and Vishny (1997b) develop a model in which traders cannot
persuade their financial backers that they should be allowed to invest more, because having lost
money may indicate that the trader has bad judgment.14 In reaction to a fall in asset prices,
financial backers may insist that the trader cut his or her position in a country even further.
Shleifer and Vishny (1997b) make this argument for hedge funds involved in arbitrage, but the
same argument can be applied to large international banks lending to countries. As these
investors pull their money out, the exchange rate depreciates.
Third, there may be particular institutional reasons why commercial banks refuse to roll
over their loans. This might be due to regulatory rules and procedures that limit a bank’s “value
at risk” (Cornelius 1999). When prices fall in a market, the value-at-risk models used by
international banks can generate the direct requirement that the bank reduce its exposure to that
country (Folkerts-Landau and Garber, 1998.) Unless the borrower defaults when the loans are
not rolled over, this constitutes a capital outflow. Even if the borrower defaults, there will still
be a reduction in new capital inflow. The details of value-at-risk models vary, but a bigger fall in
asset prices, due to worse corporate governance, can plausibly trigger a larger reduction in the
bank’s investment position in all the assets of that country.
Fourth, when managers choose to steal more of the corporate cash, they may take the
money outside the country. For this to happen, managers need to care about their returns in
foreign currency terms. This may be because they have personal expenses in dollars or because
14 “The seemingly perverse behavior of taking money away from an arbitrageur after noise tradersentiment deepens, i.e., precisely when his expected return is greatest, is a rational response to theproblem of trying to infer the arbitrageur’s (unobserved) ability and future opportunities jointly from pastreturns,” (Shleifer and Vishny 1997b, p.41.)

11
they feel local-currency denominated assets, such as bank deposits, are not the right place to
keep the proceeds of what they have stolen (e.g., because they want to avoid taxes.) Weaker
corporate governance means that more is stolen for a given reduction in expected R, leading to
more capital flight and deeper currency depreciation.
Finally, as an important complement to the previous four explanations, there may be no
safe haven for investors in local currency-denominated assets. Management of local commercial
banks may also engage in theft, raising the probability that these banks will default. The
government could guarantee bank deposits but in most emerging markets there is a significant
risk that the government may default. In fact, in some emerging market countries, such as
Indonesia and Thailand, there was no liquid market for government securities at the time of the
crisis. In the view of many investors during the Asian crisis, the probability of government
default went up as the value of firms and tax receipts went down. The only government that
actually defaulted on domestic currency debt during the crisis was Russia, but a number of other
governments appear to have come close. Thus when the value of firms began to fall in each
emerging market country, both domestic and foreign investors tried to withdraw their money
from all domestic-currency denominated assets, leading to greater capital outflows for countries
with weaker corporate governance. Note that there can be a net capital outflow even if foreign
investors remain confident. A loss of confidence in local currency-denominated assets by
domestic investors can be just as damaging.
These arguments suggest that the extent of exchange rate depreciation may be affected by
corporate governance institutions. As long as a larger fall in firms’ values means that investors
are less inclined to buy their securities, then capital can flow out of the country. The evidence in
fact shows a sharp reduction in capital inflows to emerging markets after July 1997, turning into
12
capital outflows by September (Brunswick Warburg 1999).15 Net capital inflows to emerging
economies peaked at $330bn in 1996 but fell to less than half that in the Asian crisis (Goldman
Sachs, 1999, p.3).
Corporate Governance and Volatility
In our model, there need not be any actual expropriation by managers while times are
good, for example when αR≥1. Typically, in most emerging markets α is above 0.3 (i.e., much
higher than is usual in the US), so a reasonably optimistic expectation for R may be enough to
remove the incentive for managerial theft.16
This suggests that the “institutions” that protect investors’ rights are not important as long
as growth lasts, because managers do not want to steal. It may even be possible to attract a great
deal of outside capital during a period when the economy expands. But when growth prospects
decline, the lack of good corporate governance becomes important. Without effective
shareholder protection, a mild shock can entail a large increase in stealing, which in turn causes a
large depreciation.17
15 The World Bank (pp.25-26, 1999) estimates that capital outflows from emerging markets increased by$80m between 1996 and 1997. This source points out that we do not have precise estimates of capitalflows, including capital flight, by country.16 Detailed examination of insider ownership in some emerging markets are in La Porta, Lopez-de-Silanes, and Shleifer (1999) and LLSV (1999b). They find, for example, that the median cash flow rights(in companies where insiders control more than 20% of the votes) are 41% in Argentina, 26% in Korea,28% in Hong Kong, 34% in Mexico, 20% in Israel, and 31% in Singapore.17 This explains, for example, how Malaysia could grow rapidly even if its institutions were flawed. Inthe following exchange, Prime Minister Mahathir argues that rapid growth implies that the institutions aregood (The Far Eastern Economic Review, July 2, 1998, p.15.)
Question: So in retrospect nothing in your own policies was wrong?Mahathir Mohamad (Prime Minister of Malaysia): We were growing at the rate of more than 8%a year for almost 10 years. You must give us credit for knowing how to run the country. And ifyou are so corrupt, nothing will be able to be done in this country.
This argument is incorrect because a corrupt economy can grow rapidly. Our model shows thatinstitutions matter most when the economy experiences a downturn.

13
According to this argument, a country can grow rapidly for an indefinite period even if it
has weak protection for shareholder rights. But weak institutions of this kind make a country
vulnerable, in the sense that a small negative shock to expected future earnings can have a large
effect on the economy. If this theory is correct, institutions matter for volatility, specifically the
size of the decline in asset values and exchange rate when there is an adverse shock to expected
future earnings.
Our argument suggests two empirical issues to investigate. First, across countries where
there was some initial loss of confidence, did the exchange rate depreciate more where corporate
governance was weaker? We deal with this in section 5. Our simple model is silent on whether
de facto or de jure shareholder and creditor rights matter more. We can test these alternatives by
examining which kinds of rights were more important in determining the extent of exchange rate
depreciation in 1997-98. Second, the model predicts that countries with poor corporate
governance should also have weaker ex post stock market performance if we include the 1997-98
crisis. We examine the evidence on this point in section 6.
3. Data
Measuring the Crisis
Our basic sample is 25 emerging markets: Argentina, Brazil, Chile, China, Colombia, the
Czech Republic, Greece, Hong Kong, Hungary, India, Indonesia, Israel, Korea, Malaysia,
Mexico, Philippines, Poland, Portugal, Russia, Singapore, Thailand, Turkey, Taiwan, South
Africa, and Venezuela. The list includes 6 countries from Latin America, 4 from Eastern
Europe, 10 from Asia, plus Greece and Portugal in Europe, Turkey, Israel in the Middle East,
and South Africa. There is no universally agreed definition of the “emerging markets” involved

14
in the Asian crisis, but our sample of 25 includes almost all the countries regarded as “emerging”
by the International Finance Corporation, The Economist, JP Morgan, Goldman Sachs, and
Flemings. This is the set of developing countries with relatively large financial markets and
relatively open capital accounts.18
We follow the literature on the Asian crisis by regarding the extent of the nominal
exchange rate depreciation as the key variable to be explained. Specifically, our most important
dependent variable is the change in the nominal exchange rate from the end of 1996 to January
1999. We take the end of 1996 as the starting point and measure the change in purchasing power
over the next two years of currencies relative to the US dollar.19 Table 2 shows the exchange
rates and change in purchasing power of exchange rates for alternative ending points for the 25
countries in our sample.
The crisis clearly began in summer 1997 with the initial devaluation of Thailand.
However, there is no agreement on when the crisis ended. There were basically four phases: fall
1997, when the major problems were in Asia and a few countries in Latin America; spring 1998,
when the crisis is perceived to have spread to Russia and Brazil; summer 1998, when Russia
devalued; and fall 1998, when Brazil struggled against devaluation. The crisis from Brazil’s
18 According to IFC (1997, p.334) at the end of 1996 there was completely free entry and exit of capital(with regard to listed stocks) in 12 of our countries: Argentina, Brazil, the Czech Republic, Greece,Hungary, Malaysia, Mexico, Poland, Portugal, Russia, South Africa, and Turkey. There was also“relatively free entry” and free exit in Chile, Korea, Thailand, and Venezuela. There was “relatively freeentry” and “some restrictions” on exit in Indonesia. Formally, there was free entry and exit only forspecial classes of shares in China and the Philippines, although the anecdotal evidence suggests thesecapital controls have only really been effective in China. Authorized investors only were allowed intoColombia and India, but free exit was allowed. The tightest market access, according to the IFCmeasure, was in Taiwan, where only authorized investors were allowed in and there were “somerestrictions” on the repatriation of income and capital. The IFC did not classify Hong Kong, Israel, andSingapore.19 If the exchange rate depreciates from 2500 to around 10000 to the dollar (as in Indonesia), it has lost ¾of its purchasing power – i.e. you need four times as many rupiah to buy one dollar. Alternatively, itspurchasing power now is ¼ of the level one year ago and this country would get 0.25 in our index ofchange in purchasing power.

15
point of view continued at least through the eventual devaluation in January 1999, although by
this time most of the Asian countries were starting to recover (and their exchange rates were
actually appreciating). All our regressions use mid-January 1999 as the ending point. None of
our results are affected by including or excluding Brazil’s January 1999 devaluation, and in an
earlier working paper we also presented similar regression results using March 1998, July 1998,
September 1998, November 1998 and April 1999 as alternative ending points. Table 2 presents
the raw exchange rate data for these alternative dates. We report these robustness checks in
more detail as we move through the analysis.
For stock markets, we use the International Finance Corporation’s Investable Index (IFC
1998 and 1999 and updated daily in the Financial Times) which measures stock market returns
for a selected set of companies in US dollars. This index includes the largest and most liquid
stocks in each market. Using the IFC’s Investable Index reduces the usual problem that posted
prices in illiquid markets may not be real transaction prices. Table 3 reports the value of this IFC
index at the end of each 1998 and at its lowest point in 1998, assuming that the value for each
country was equal to 100 at the end of 1996. The IFC does not report an index for Hong Kong or
Singapore, so we use the standard Hang Seng Stock Index and Straits Times Stock Index
respectively, converted into US dollars.
Some countries began to show definite signs of economic recovery in the second half of
1998, just as other countries were experiencing the full effects of the crisis. For example, the
Korean index we use reached a low point of 23.6 at the end of September, but had recovered to
53.1 by the end of the year. In our main regressions we therefore look at the lowest point in the
stock market during 1998 to measure how far the market fell as a result of the crisis. We have
also checked our results using the end of 1998 as an alternative end point.

16
In terms of the model, our empirical tests assume that R and α are constant across
countries. We test whether k, as measured by corporate governance variables, has an
independent impact. We feel this assumption is reasonable, to a first approximation because the
anecdotal evidence suggests there was a similar shock across all emerging markets.20 We do not
know if the size of this initial shock to confidence was exactly the same in all countries, but the
evidence indicates both that the initial loss of confidence was small and that, at least in fall 1997,
almost every emerging market was affected (International Monetary Fund 1997.)21
Measuring Economic Conditions
To measure prior economic conditions we use standard macroeconomic aggregates (the
raw data is in Table 3). We use the versions of this data published by two investment banks, JP
Morgan (1997) and Goldman Sachs (1997). Both of these organizations build their databases
using the available information from national statistical offices and international organizations,
most notably the IMF and World Bank, but they also put a great deal of effort into ensuring that
the data is comparable across countries. In addition, using these sources helps us examine
whether information actually available to the financial markets before the crisis was useful in
predicting the exchange rate. Following the suggestion of a referee, we fill gaps in this data
using numbers from the World Bank and the IMF (details are in Table 3).
20 For Asia see Biers (1998). For all emerging markets see Hunter et al (1999) – most of the essays in thisbook argue or assume there was a similar shock of some kind across all emerging markets.21 As a referee has pointed out, it is possible that the shock was larger in countries with weakerinstitutions, for reasons that are unrelated to institutions. However, there is no evidence of such a patternto the shock. The anecdotal evidence suggests there was a small loss of investor confidence, beginning inThailand, spreading to Asia and then suddenly including other emerging markets – marked by a surprisingsell-off in Hong Kong from October 1997. By November 1997 there had been some small loss ofconfidence or questioning of future prospects in almost all emerging markets.

17
Measuring Institutions
We use the measures for efficiency of the legal system, corruption, rule of law, and
strength of corporate governance reported in LLSV (1998). Efficiency of the legal system is the
assessment of an independent organization (Business International Corporation) of “the
efficiency and integrity of the legal environment as it affects business.” Corruption is an
assessment by another independent organization (International Country Risk Services) of the
extent of corruption in the government, particularly the extent to which businesses have to pay
bribes. The rule of law is also an assessment by International Country Risk Services and is their
opinion of the “law and order tradition” in the country (LLSV 1998, Table 1). Corporate
governance is LLSV’s (1998) assessment of the de jure rights of shareholders (particularly what
they call “anti-director” rights). LLSV (1998) also provide measures of creditor rights. The final
LLSV (1998) measure we use is their index of accounting standards. The raw data and precise
definitions for all these measures are reported in Table 3.
All of these measures were calculated well before the Asian crisis. Efficiency of the legal
system pertains to 1980-83. The measures of corruption and law and order cover 1982-95. The
measures of corporate governance were calculated primarily using data for the early and mid-
1990s.
Flemings Research (1998) developed an alternative measure of corporate governance
across emerging markets. They asked their country specialists to consider “the disclosure of
information, transparency of ownership structures, management and special interest groups,
adequacy of the legal system, whether the standards that are set are actually enforced, and if the
boards of companies are independent and the rights of minority shareholders are upheld” (p.19).
This index therefore tries to capture the extent of shareholder rights in practice. The index runs

18
from 1 to 5 with a higher score meaning more rights and “a score of 5 would be awarded to the
US – our model market.” One disadvantage of this measure is that it was published in spring
1998, and therefore may reflect in part reassessments of shareholder rights in the light of the
Asian crisis.
We test the importance of alternative measures of macroeconomic policy and institutional
structure using regressions with change in the value of the nominal exchange rate on the left-
hand side. We then test the leading contenders using additional control variables and in multiple
regressions. Our regressions also include a dummy variable for being in East Asia, in case there
was an Asian-specific element to the crisis (e.g., countries were affected just because they are
close to each other or because they faced a different shock because they are in Asia).22
Some of our regressions have less than 25 observations, because we usually lack
comparable data on a few countries. We have checked the robustness of our results by using
alternative samples, in particular so as to judge the macroeconomic and corporate governance
variables using the same set of countries. Because we do not have a full set of corporate
governance data for 5 transition economies, China, the Czech Republic, Hungary, Poland, and
Russia, we also report summary results for the macroeconomic regressions without these five 5
countries.
4. Macroeconomic Measures
Much of the debate over the Asian crisis has focussed on the relative importance on five
macroeconomic variables: the budget deficit, monetary policy, the current account, foreign
22 The East Asia dummy is equal to one for China, Hong Kong, Indonesia, Korea, Malaysia, Philippines,Singapore, Thailand, and Taiwan. We do not include India because it seems that financial marketsregarded India as part of South Asia, and distinct from East Asia. Nothing substantive changes if we
19
exchange reserves, and foreign debt. The raw data for these measures are presented in Table 3.
The dependent variable used in this section is the percent loss of purchasing power of exchange
rates in emerging markets in from the end of 1996 to January 1999.
Fiscal and Monetary Policy
Table 3 shows government fiscal balance as a percent of GDP in 1996 for 25 countries (a
minus sign indicates a budget deficit). It is striking that Indonesia had a balanced government
budget and none of the Asian countries that experienced a large depreciation had a serious fiscal
deficit. Not surprisingly, the first two columns of Table 4 show the government budget deficit is
not significant in the exchange rate regression, either by itself or with the inclusion of the East
Asia dummy. The R-squared is 0.09 before we include the East Asia dummy and rises to only
0.1 with that dummy.
In the standard theory of balance of payments crises (Krugman 1979), the budget deficit
should affect the exchange rate through affecting the money supply. Even if budget deficits have
no discernible direct effect, perhaps there is an impact via money growth? Table 3 shows the
growth rate of broad money in 1996 for 25 countries. It is just significant in the exchange rate
regressions at the 10% level with or without the East Asia dummy (columns three and four of
Table 4), when we drop Turkey, which is an extreme outlier with 120% money growth. With
Turkey in the sample, broad money growth is significant and negative at the 5% level.
This result should be treated with care because of the countries with large depreciations,
only Russia had significant budget deficit-induced money growth. Indonesia had high money
allow the Asian dummy to include India. This dummy can also partly capture the notion that there washerding in the idea that investors should “sell Asia.”
20
growth in 1996 and a large depreciation in 1996-98, but its budget was essentially balanced
before the crisis. If we drop Indonesia and Turkey, money growth in 1996 is not significant.
Current Account and Reserves
The current account as a percent of GDP in 1996 is shown in Table 3 with 25
observations. There are two outliers with a very high current account surplus: Singapore and
Venezuela. This measure of the current account is not significant in explaining the exchange rate
depreciation by itself (Table 4). Even if we drop Singapore and Venezuela, the two outliers,
there is no significant result using the current account as an explanatory variable.
If the exchange rate collapses involved a loss of confidence by investors, irrespective of
macroeconomic fundamentals, we would expect reserves of foreign exchange at the central bank
to be significant explanatory variables. Countries with more reserves should be able to
withstand an outflow of capital or speculation against their currency.
The simplest measure is just total reserves in dollar terms. We use total reserves in US
dollars for 25 countries at the end of 1996; see Table 3. Table 4 shows total reserves are not
quite significant at the 10% level in the basic regression but with the East Asia dummy included
they become significant at the 5% level. The adjusted R-squared is 0.1. The quantitative effect
of higher reserves is small: $10bn extra reserves implies four percent less depreciation in the
exchange rate from 1997 to 1998 (in addition to the effect of being in East Asia). This suggests
that only in countries with huge reserves, such as China, Taiwan, Singapore, and Hong Kong,
was there really a significant impact on the exchange rate from holding more reserves.
Table 3 shows the months of imports (“import coverage”) provided by reserves in 25
countries. There is a positive correlation in the regression, significant at the 5% level without the

21
East Asia dummy and at the 10% with this dummy, meaning that a higher degree of import
coverage is associated with less depreciation (Table 4). The adjusted R-Squared is 0.12. For a
country such as China, which held almost 10 months worth of reserves, there is a large positive
effect relative to Korea, which held under 2 months worth.
Foreign Debt
There is a general view among economists that Asian countries must, in some sense, have
over-borrowed. Yellen (1998) puts the point clearly, “Since short-term loans by definition
expire relatively quickly, massive short-term lending at low risk premia is precisely the
combination of factors most likely to lead to a sudden and massive capital flight.”
There are several reasonable ways to measure foreign indebtedness. We can look at total
debt directly or, alternatively, we can assess the “debt burden” of an economy by comparing debt
relative to the size of the economy or its ability to generate foreign exchange earnings through
exports. We can also consider the maturity structure of the debt, interest payments as a percent
of exports, and the ratio of debt to GDP. All the debt numbers here include both public and
private debt (to the extent it is known) denominated in foreign currency.
The simplest measure of external debt is the total dollar amount of indebtedness, both
public and private, of a country. According to the available numbers for 25 countries in our
sample, at the end of 1996 Brazil had a high level of indebtedness, with nearly $200bn, while
Russia and Indonesia both had around $120bn (Table 3). Total indebtedness is insignificant in
our exchange rate regressions both without and with the East Asia dummy (Table 4). This
variable is insignificant even if we drop Hong Kong, which had the highest level of gross

22
indebtedness.23 We look at four other reasonable foreign debt measures: as a percent of exports,
short-term debt plus amortization as a percent of reserves, interest payments as a percent of
exports, and the Debt-GDP ratio. None are significant in the regressions reported in Table 4.
Robustness Checks
We have not found any specification in which combinations of macroeconomic variables
have stronger effects than individual variables. Combining other macroeconomic variables with
measures of reserves, for example, usually reduces the significance of the reserves.
We constructed a composite variable measuring foreign debt net of foreign exchange
reserves. The result for this variable is weaker than that for reserves, presumably because while
total level of foreign exchange reserves has a strong effect, total debt has a weak effect, so by
putting them together we are constructing a weaker variable that is only marginally significant in
the exchange rate regression.
We have also controlled for the size of rescue packages offered to various countries
between July 1997 and October 1998. The total amount of funds pledged, in US dollars, was
$42.3 billion to Indonesia, $58.2 billion to Korea, $17.2 billion to Thailand, $22.6 billion to
Russia, and $41.0 billion to Brazil (The World Bank 1999, p.91, Table 3.2.). A bigger rescue
package (in terms of funds pledged) is actually correlated with more depreciation, but this may
be an endogenous outcome, in the sense that more money may have been given to those
countries more likely to fail. Including this variable does not affect the significance of any of the
macroeconomic variables.
23 Gross indebtedness numbers for Hong Kong and Singapore are not available from the World Bank butrather from investment banks’ research reports. We do not think that these numbers were calculated andpublished until after the crisis broke, so we have checked all our results without both Hong Kong andSingapore. Nothing substantive is changed.
23
The funds actually disbursed during 1997-98 in these rescue packages were substantially
less than the amounts pledged: $9.5 billion to Indonesia, $27.2 billion to Korea, $12.7 billion to
Thailand, $4.5 billion to Russia, and $8.6 billion to Brazil (The World Bank 1999, p.91, Table
3.2.) The amount of the rescue package actually disbursed is not significantly correlated with the
extent of exchange rate depreciation, presumably because only countries that perform relatively
well actually receive money. Again, including this variable does not affect the significance of
the other macroeconomic variables.
Note that both receiving a pledge of financial assistance and having loans actually
disburse are both endogenous outcomes rather than exogenous factors. The results using this
variable are driven primarily by the large depreciation of Russia and Indonesia.
Our sample period ends just before Brazil’s devaluation. However, even if we extend our
sample period through late January 1999 (to capture the initial sharp devaluation) or April 1999,
to include the first three months of a more freely floating exchange rate in Brazil, this does not
help any of the macroeconomic variables to become significant. The reason is that although
Brazil had current account and budget deficits in 1996, its final devaluation was not large
compared to some other emerging market countries. Brazil experienced a 37 percent devaluation
from the end of 1996 through April 1999, which is about the same as in Thailand and Malaysia
and much less than in Indonesia or Russia (Table 3). This is not enough to change the outcome
for any macro variable in the regression analysis. Interestingly, the lack of total collapse in
Brazil, despite the poor initial macroeconomic fundamentals, is very much in line with what
could have been predicted using the governance results from the next section.

24
5. Corporate Governance
Enforceability of Contracts
We evaluate four measures of how easy it is to enforce contracts between management
and the providers of firms’ finance. The first three measures are general assessments of the legal
environment: the efficiency of the judiciary, corruption (which includes bribing the judiciary and
other branches of the government), and the rule of law. The fourth measure is a general
assessment of corporate governance.
Judicial Efficiency measured on a scale of 0 to 10 is shown in Table 3, with 20
observations (not including any post-communist countries) from Business International
Corporation, as cited by LLSV (1998). Indonesia easily has the worst score (2.5), while Hong
Kong, Israel, and Singapore have the best (10). As Figure 1 shows there is a wide dispersion of
values both within Asia and across emerging markets in general. This variable is highly
significant in the exchange rate regression with and without the East Asia dummy (columns 1
and 2 of Table 5), and remains significant even if we drop Indonesia. Judicial Efficiency
becomes significant at the 5% level if we control for foreign exchange reserves (shown in Table
5) or import coverage (not shown in Table 5) and significant at the 6% level if we include both
macro variables. Neither of these macroeconomic control variables is significant either
separately or jointly in a regression with judicial efficiency.
The quantitative effect of Judicial Efficiency is large. A one-point increase in this index
(the difference between Malaysia and Singapore, or slightly larger than the difference between
Korea and Taiwan) implies a 5-6% less depreciation from the end of 1996 to the end of 1998.
The adjusted R-squared is 0.31 without the East Asia dummy, 0.29 with the East Asia dummy,
and 0.28 with foreign exchange reserves included in the regression.
25
Figure 2 shows corruption as measured by the International Country Risk Guide, and
reported by LLSV (1998), on a scale of 0 to 10, for 23 countries. This variable is highly
significant and remains so when we include the East Asia dummy. A one-point increase in this
index (meaning lower corruption, again approximately the difference between Malaysia and
Singapore) implies 5% less depreciation from the December 1996 to December 1998. The
adjusted R-squared is 0.21 with and 0.2 without the East Asia dummy. When we control for
foreign exchange reserves, the corruption variable remains significant at the 6% level and the
foreign exchange reserves variable is not significant. The adjusted R-squared rises only slightly
to 0.25. If we control for import coverage separately or jointly with reserves, the corruption
variable is significant at the 5% level and the macroeconomic control variables are not
significant.
The third index is the Rule of Law, again from the International Country Risk Guide as
reported in LLSV (1998) for 23 countries (see Figure 3). Table 5 shows that this variable is
significant with and without the dummy variable for East Asia. A one-point increase in this index
implies 4% less depreciation from the end of 1996 to the end of 1998. The adjusted R-squared is
0.15 without the East Asian dummy and 0.12 with that dummy. The R-squared is 0.27 once we
include the foreign exchange reserve variable, and in that case none of the variables is significant
(but they are jointly significant at the 5% level). The same is true if we use import coverage
instead of reserves (now they are jointly significant at the 10% level.) If we include both
reserves and import coverage, none of the right-hand side variables is significantly jointly or
separately.
The fourth index is Corporate Governance as measured by Flemings’ experts on
particular countries. Their results for 20 countries in our sample are shown in Figure 4. This

26
variable is significant at the 5% level with and without the East Asia dummy. It remains
significant at the 5% level when we also control for reserves (see the last column of Table 5). A
one-point increase in this index implies 13-14% less depreciation from the end of 1996 to the end
of 1998. The adjusted R-squared is 0.26 without the East Asian dummy, 0.22 with the East Asia
dummy, and 0.17 once we include the macroeconomic variables. If we control for import
coverage either separately or together with reserves, corporate governance remains significant at
the 10% level and neither of the macro variables is significant.
Shareholder Rights
LLSV (1998) also provide a number of more detailed indices for particular aspects of
corporate governance: shareholder rights, creditor rights, and accounting standards. Data on
shareholder or “anti-director” rights is available for all the countries in our sample, except the
five transition economies. Data on creditor rights are not available for the five transition
economies and Venezuela. Data on accounting standards are not available for the five transition
countries and Indonesia.
We look at each measure in turn and also evaluate the product of these rights and three
measures of contract enforceability. Rights on paper may be good, but we are particularly
interested in evaluating the implications of how these rights are enforced. We use a very simple
measure, the product of legal de jure rights and the enforceability of these rights. Because it is
hard to know exactly how rights are enforced we use the three indices of general legal
environment used in the previous section: judicial efficiency, corruption, and the rule of law.
This enables us to check for a robust pattern in the data.

27
Table 3 shows the LLSV (1998) aggregate index of minority shareholder rights, on a
scale of 0 to 6, which they call “anti-director” rights. Asian countries show a wide range of
values, with lower scores in countries that have experienced greater depreciation: Indonesia
scores a 2 on this index, while Malaysia scores a 4 and Hong Kong scores a 5. On the other
hand, Mexico and Venezuela, with much less depreciation, have even lower scores than
Indonesia.
Table 5 shows that this variable is significant at the 10% level with and without the East
Asia dummy. A one-point increase in this index implies a 6 percent smaller depreciation from
1997 to 1998. The R-squared is 0.13. When we include foreign exchange reserves, the index of
shareholder rights keeps its significance at the 10% level and reserves are not significant.
Including import coverage gives the same result: shareholder rights are significant at the 10%
and the macro control variable is not significant.
For the product of anti-director rights and judicial efficiency, we find the regression
coefficient is significant in all three of the usual specifications. The adjusted R-squared is
consistently 0.22-0.23. Using the product of anti-director rights and corruption or the product of
anti-director rights and the rule of law gives similar results. Using import coverage rather than
reserves does not make the governance variable insignificant in any specification, and in one
case (corruption x anti-director rights), the effect is to make the governance variable significant
at the 5% level.
The LLSV (1998) index of creditor rights shows that several countries with relatively
high creditor rights had a great deal of depreciation, for example Indonesia, Malaysia, Thailand,
and Korea (Table 3). Table 5 shows there is no significant relationship between creditor rights
and the exchange rate depreciation; the R-squared is only 0.003. The product of creditor rights

28
and the efficiency of the judiciary or the corruption index does not give a significant result.
There also does not appear to be any kind of relationship between the exchange rate depreciation
and accounting standards (Table 5).
Robustness Checks
We have checked our results using money growth in 1996 as an alternative
macroeconomic control variable. It we drop Turkey, then the legal environment (judiciary, rule
of law and corruption) variables remain significant at close to their original levels (the corruption
variable slips slightly) and money growth is not significant. The only variable to lose its
significance is the index of anti-director rights. If we include Turkey, all the corporate
governance variables, except anti-director rights, remain significant and money growth is
significant at the 5 percent level.
We also included a dummy variable for Latin America which is 1 for Argentina, Brazil,
Chile, Colombia, Mexico and Venezuela in our sample. This does not affect the significance of
any of the governance variables and is itself insignificant in all the exchange rate regressions.
The Latin America dummy is negative, with a coefficient of around –30 in the stock market
regressions, but the only effect on governance variables is to make corruption insignificant.
Total reserves become positive and significant in the stock market regression; the other results
for macroeconomic variables are not affected.
Our earlier working paper reported results using a shorter sample period, ending in March
1998 or August 1998 or September 1998. The same corporate governance results held also for
those periods. Controlling for the size of IMF packages, either pledged or actually disbursed,
does not affect the significance of the governance variables. Controlling for combinations of

29
macroeconomic variables also does not make any of our governance variables insignificant.
(These results were in our earlier working paper and are available from the authors.)
The percent depreciation of the exchange rate plus the nominal interest rate at a moment
in time is an alternative dependent variable (thanks to Ricardo Caballero for this suggestion).
This captures the possibility that a country faces strong pressure to devalue, but is able to hold
off the inevitable for a while through raising interest rates very high. Previous drafts of this
paper showed that all of our corporate governance measures are significant with the right sign
using this measure, calculated at moments of crisis such as September and November 1998, so
this actually strengthens our results. The only macroeconomic variable that is significant in this
regression is total foreign exchange reserves. When we combine these macro and governance
measures, the governance results remain strong while foreign exchange reserves become
insignificant. The robust result is that governance measures are correlated with the intensity of
the exchange rate depreciation.
A referee suggested that we should control for log GDP per capita in 1994, as a measure
of non-finance related institutional development. In this case, the efficiency of the judiciary
variable loses its significance. However, the corruption, rule of law variables, corporate
governance, are jointly significant with log GDP per capita (none of the variables are
individually significant.) The anti-director rights variable remains significant at the 10% level by
itself. The other governance variables lose their individual significance but are highly significant
jointly with log GDP per capita. There is a high level of correlation between log GDP per capita
and judicial efficiency (0.7) and rule of law and corruption, but low correlation with anti-director
rights (0.05 and not significant). These results suggest that while corporate governance variables

30
have some effects independent of the level of non-financial institutional development, there is
also substantial overlap.24
6. The Stock Market
Macroeconomic Measures
The dependent variable is the change in stock market value in dollar terms (as measured
by the International Finance Corporation’s IFC Investable Index) from the end of 1996 to the
lowest point of 1998 and to the end of 1998.25 Table 3 shows the values of this index that we
use.
Our regression analysis using macroeconomic variables shows very little correlation with
stock market performance (Table 6). We report results for four variables that represent the key
macroeconomic issues: the current account at the end of 1996, the level of reserves at the end of
1996, the debt-GDP ratio at the end of 1996, and the budget deficit in 1996. None of the first
three variables are significant in any specification. Import coverage and other measures of debt
are also not significant. Table 6 reports results using the lowest point of 1998 (see Table 3 for
the month in each case); none of the results is changed significantly if we use the end of 1998.
A larger initial budget deficit is correlated with less depreciation. This implies that
countries with a larger budget surplus (or smaller budget deficit) at the end of 1996 had worse
stock market performance in the crisis. For example, a one-percent “better” budget implies a 5
percent lower stock market from the end of 1996 to the lowest point in 1998.
24 For more on the correlation between corporate governance and other measures of institutionaldevelopment, see LLSV 1999a.25 A comparison in dollars is appealing because this is how most international investors and the IFCevaluate stock market performance. Obviously, the dollar value of markets is heavily influenced byexchange rate movements. However, the correlation is not one to one.
31
Corporate Governance
In contrast, the results using our legal variables are much stronger (see Table 7). The
Judicial Efficiency variable is not significant, but the other legal environment variables are
significant in most specifications.
Corruption, plotted against stock market performance in Figure 5, is significant both by
itself and with the East Asia dummy. The regression coefficient implies that a one-point
improvement in the corruption index is associated with 7.6% better cumulative stock market
performance. The adjusted R-squared is 0.09 without the East Asia dummy. Corruption
becomes more significant and has a larger coefficient when we control for reserves, but it is
insignificant when we include both reserves and the East Asia dummy.
The rule of law variable is significant in 3 out of 4 specifications. It is not significant by
itself but significant at the 5% level when we also control for reserves. This coefficient implies
that a one point better score on the rule of law index is associated with 10 percentage points
better stock market performance. The coefficient declines to just over 7 and the significance
level falls to 10% when we control for East Asia and when we include both the East Asia dummy
and reserves.
The corporate governance variable is significant until we bring in the East Asia dummy.
The coefficient is over 12 and the R-squared rises to 0.22 when we include reserves.
Interestingly, with the East Asia dummy included, reserves have the right sign: an extra 10
billion dollars of reserves implies a 4% better stock market performance. However, this is the
only significant stock market result for reserves.

32
Neither anti-director rights nor accounting standards are significant in the stock market
regressions, even if we multiply these measures with the indices representing legal institutions.
Creditor rights actually have a significant negative coefficient in the stock market regression for
1997-98, implying that countries with better protection for creditors experienced worse stock
market performance, although this coefficient loses its significance when we include the East
Asia dummy.
Robustness Checks
Using December 1998 as the ending point for our sample does not change the essence of
the results. The macroeconomic variables are still not significant, with the exception of the fiscal
policy variable, which consistently has the wrong sign. The same three legal variables remain
robustly significant.
Controlling for money growth in 1996 does not affect the results. Corruption and
corporate governance remain significant, as does the rule of law (if we also include reserves).
Money growth is not significant in any specification. The same results hold if we control for
money growth while dropping Turkey.
If we control for log GDP per capita and reserves in the corruption regression, the
independent variables are jointly significant, but none of the variables are individually
significance. In the same regression for rule of law, only the level of reserves is significant (but
with a negative sign.) Judicial efficiency, the Flemings corporate governance measure, and the
measure of anti-director rights are not significant. Log GDP per capita is significant in several
specifications and given that it is highly correlated with the general legal environment, it may be
picking up the strength of some institutions (although probably not anti-director rights).
33
The stock market results for measures of investor protection are more dependent on
outliers than is the case for our exchange rate results. In particular if we drop Indonesia, the rule
of law result is unchanged, but corruption and the corporate governance variable lose their
significance. However, it should be kept in mind that we are missing data on two countries in all
the stock market regressions. Russia, a country with very weak investor protection, had a large
fall in its stock market (of the order of Indonesia) but joined the IFC index only in November
1997, so we do not have the requisite stock market information.26 The Czech Republic has
struggled to establish investor protection, but by 1997 was beginning to institute a reasonable set
of safeguards (Johnson and Shleifer 1999). Its stock market (measured by the IFC’s Investable
Index) fell 22 percent in 1997 and only 7.3 percent in 1998. If Russia and the Czech Republic
were included, our results would be stronger and the dependence on Indonesia reduced.
Our results show that ex post returns including the crash of 1997-98 are lower where
institutions are weaker and where there is, as a result, more risk. This is not inconsistent with the
argument that ex ante expected returns in the stock market should be higher where governance is
weaker. We do not have evidence about expected returns before the crisis in these markets.
7. Conclusion
A simple model shows managerial agency problems can make countries with weak legal
systems vulnerable to the effects of a sudden loss of investor confidence. Countries with weakly
enforceable minority shareholder rights are particularly vulnerable. If such a country
experiences even a small loss of confidence, outside investors reassess the likely amount of
26 Russia’s IFC Investable Index fell 84.2 percent in 1998 (IFC 1999). The change in this index for 1997is not available.

34
expropriation by managers and adjust the amount of capital they are willing to provide. The
result can be a fall in asset values and a collapse of the exchange rate.
In cross-country regressions, corporate governance variables explain more of the
variation in exchange rates and stock market performance during the Asian crisis than do
macroeconomic variables. This result is not sensitive to changing the sample period, altering the
precise definition of variables, or dropping outliers.
This does not mean that macroeconomic explanations are not important in the Asian
crisis. While there is no agreement among economists about the relative importance of the
current account, reserves, foreign debt, monetary policy and fiscal policy for emerging markets
in 1997-98, there is widespread agreement that macro policies were important in particular
instances. However, as our results show, these variables did not have simple or direct effects in
determining the extent of crisis across emerging market countries in 1997-98.
Our evidence suggests that corporate governance in general, and the de facto protection
of minority shareholder rights in particular, mattered a great deal for the extent of exchange rate
depreciation and stock market decline in 1997-98. Although our results do not indicate which
countries are vulnerable to a loss of confidence, they do suggest that the extent of exchange rate
and stock market collapse in response to a loss of confidence is affected by investor protection.
Corporate governance can be of first order importance for determining the extent of
macroeconomic problems in crisis situations.

35
References
Biers, Dan editor 1998. Crash of ’97: How the Financial Crisis is Reshaping Asia. Review
Publishing Company Limited (Far Eastern Economic Review), Hong Kong.
Brunswick Warburg 1999. “Russia Value Monitor.” Moscow, June.
Caballero, Ricardo and Arvind Krishnamurthy 1998. “Emerging Markets Crises: An Asset
Markets Perspective.” Mimeo, November 21, MIT.
Cornelius, Peter 1999. “The value-at-risk of countries.” Mimeo, Harvard Institute for
International Development.
Corsetti, Giancarlo, Paolo Pesenti, and Nouriel Roubini 1998. “What caused the Asian currency
and financial crisis?” Mimeo, Revised March.
Flemings Research 1998, Global Emerging Markets, June.
Folkerts-Landau, David, and Peter Garber, 1998, “Capital Flows from
Emerging Markets in a Closing Environment” (London: Deutsche Bank
Research, Global Emerging Markets, October).
36
Friedman, Eric and Simon Johnson 1999, “Propping and Looting in a Weak Legal
Environment,” Manuscript, MIT, October.
Goldman Sachs 1997. Emerging Markets Biweekly, December 10.
Goldman Sachs 1998. The Weekly Analyst, January 27.
Goldman Sachs 1999. Emerging Markets Economics Quarterly. July 1999.
Greenspan, Alan 1998. Testimony of Chairman Alan Greenspan Before the Committee on
Banking and Financial Services, U.S. House of Representatives, January 30.
Hunter, William C., George G. Kaufman, and Thomas H. Krueger, editors 1999. The Asian
Financial Crisis: Origins, Implications, and Solutions. Kluwer Academic Publishers,
Boston/Dordrecht/London.
International Finance Corporation (IFC) 1998. Emerging Markets Factbook 1998. International
Finance Corporation: Washington DC.
International Finance Corporation (IFC) 1999. Emerging Markets Factbook 1999. International
Finance Corporation: Washington DC.
37
International Monetary Fund (IMF) 1997. World Economic Outlook. Interim Assessment.
International Monetary Fund, Washington DC, December.
International Organization of Securities Commissions 1998. “Causes, Effects and Regulatory
Implications of Financial and Economic Turbulence in Emerging Markets: Interim Report.”
Emerging Markets Committee, September.
Jensen, Michael C. and William H. Meckling 1976. “Theory of the Firm: Managerial Behavior,
Agency Costs and Ownership Structure,” Journal of Financial Economics, 3, 305-360.
Johnson, Simon and Andrei Shleifer 1999. “Coase v. The Coasians,” manuscript, Harvard and
MIT, October.
Krugman, Paul 1979. “A Model of Balance of Payments Crises,” Journal of Money, Credit, and
Banking, 11:311-325.
Krugman, Paul 1998. “What Happened to Asia?” Mimeo, MIT.
JP Morgan 1997. Emerging markets: economic indicators, December 5.
La Porta, Rafael, Florencio Lopez-de-Silanes, Andrei Shleifer 1999. “Corporate Ownership
Around the World,” Journal of Finance, 54, 471-517.
38
La Porta, Rafael, Florencio Lopez-de-Silanes, Andrei Shleifer, and Robert W. Vishny 1997,
“Legal Determinants of External Finance,” Journal of Finance, pp.1131-50.
La Porta, Rafael, Florencio Lopez-de-Silanes, Andrei Shleifer, and Robert W. Vishny 1998,
“Law and Finance,” Journal of Political Economy, December, volume 106, Number 6, pp.1113-
1155.
La Porta, Rafael, Florencio Lopez-de-Silanes, Andrei Shleifer, and Robert W. Vishny 1999a.
“The Quality of Government,” Journal of Law, Economics and Organization. 15, 222-279.
La Porta, Rafael, Florencio Lopez-de-Silanes, Andrei Shleifer, and Robert W. Vishny 1999b,
“Investor Protection and Corporate Valuation.” Manuscript, Harvard and Chicago, July.
Radelet, Steven and Jeffrey D. Sachs 1998a. “The Onset of the East Asian Financial Crisis.”
Mimeo, February.
Radelet, Steven and Jeffrey D. Sachs 1998b. “The East Asian Financial Crisis: Diagnosis,
Remedies, Prospects.” Brookings Papers on Economic Activity, 1998:1, pp.1-90.
Rajan, Raghuram G. and Luigi Zingales 1998. “Which Capitalism? Lessons from the East
Asian Crisis.” Journal of Applied Corporate Finance.

39
Shleifer, Andrei and Robert Vishny 1997a. “A Survey of Corporate Governance.” The Journal
of Finance, Vol. LII, No.2, June, pp.737-783.
Shleifer, Andrei and Robert Vishny 1997b. “The Limits of Arbitrage.” The Journal of Finance,
Vol. LII, No.1, March, pp.35-55.
Troika Dialog 1999. “Corporate Governance in Russia.” Moscow, May.
Wade, Robert and Frank Veneroso 1998. “The Asian Crisis: The High Debt Model vs. The Wall
Street-Treasury-IMF Complex.” New Left Review, March-April 1998.
World Bank 1999. Global Development Finance: Analysis and Summary Tables. Washington
D.C.
Yellen, Janet 1998. “Lessons from the Asian Crisis,” speech at Council on Foreign Relations,
New York, April 15.

40
List of abbreviations for countries used in figures
ARG Argentina BRA Brazil
CHL Chile CHN China COL Colombia CZE Czech GRC Greece HKG Hong Kong HUN Hungary DNI India IND Indonesia ISR Israel KOR Korea MEX Mexico MYS Malaysia PHL Philippines POL Poland PRT Portugal RUS Russia SGP Singapore THA Thailand TUR Turkey TWN Taiwan VEN Venezuela ZAF South Africa

Table 1. Alleged Incidents of Stealing in the Asian Financial Crisis
Company Country Date Alleged Incident
Bangkok Bank of Commerce Thailand 1996-97 Bank managers moved money to offshore companies under their control.
United Engineers (Malaysia) Bhd
Malaysia 1997-98 United Engineers bailed out its financially troubled parent, Renong Bhd, by acquiring a 33% stake at an artificially high price.
Malaysia Air System Bhd. Malaysia 1998 The chairman used company funds to retire personal debts.
PT Bank Bali Indonesia 1997-98 Managers diverted funds in order to finance a political party.
Sinar Mas Group Indonesia 1997-98 Group managers transferred foreign exchange losses from a manufacturing company to a group-controlled bank, effectively expropriating the bank's creditors and minority shareholders.
Guangdong International Trust & Investment Co
Hong Kong/China 1998-99 Assets that had been pledged as collateral disappeared from the company when it went bankrupt.
Siu-Fung Ceramics Co Hong Kong/China 1998-99 Assets that had been pledged as collateral disappeared from the company when it went
Tokobank Russia 1998-99 Creditors who may have been linked to bank managers took control of the bank and its remaining assets following default. Foreign creditors got nothing.
Menatep Russia 1998 Following Menatep's bankruptcy, managers transferred a large number of regional branches to another bank they controlled.
AO Yukos Russia 1998-99 Managers transferred Yukos's most valuable petroleum-producing properties to offshore companies they controlled.
Uneximbank Russia 1999 Following Uneximbank's bankruptcy, managers moved profitable credit-card processing and custodial operations to another bank.
Samsung Electronics Co. Korea 1997-98 Managers used cash from Samsung Electronics to support other members of the Samsung group (notably Samsung Motors) that were losing money.
Hyundai Korea 1998-99 Managers of a Hyundai-controlled investment fund channelled money from retail investors to loss-making firms in the Hyundai group.
Sources for Table 1Wall Street Journal, May 7, 1999, p.A1; April 17, 1998, p.A12; September 21, 1999, p.A1; August 25, 1999, p.A14; April 4, 1999, p.A1; April 8, 1999, p.A14.The Economist, March 27, 1999 and September 11, 1999.

Table 2 Extent of Exchange Rate Depreciation in Emerging Markets, 1997-99
Purchasing Power of currency Exchange RatesMarch 1998/ end 1996
July 1998/ end 1996
Sept 1998/ end 1996
Nov 1998/end 1996
Jan 1999/end 1996
Apr 1999/end 1996 end-1996 March-98 July-98 September-98 Nov. 1998 January-99 April-99
prexrate prnomr sept98ex nov98ex jan99ex apr99exArgentina 1.00 1.00 1.00 1.00 1.00 1.00 0.9998 1 1 1 1 1 1Brazil 0.92 0.90 0.88 0.87 0.66 0.63 1.04 1.13 1.16 1.18 1.19 1.58 1.66Chile 0.94 0.90 0.90 0.92 0.89 0.89 424.35 453 471 473 462 478 479China 1.00 1.00 1.00 1.00 1.00 1.00 8.30 8.28 8.28 8.28 8.28 8.28 8.28Colombia 0.74 0.74 0.67 0.64 0.63 0.63 1006.10 1354 1352 1498 1567 1595 1594Czech 0.80 0.83 0.89 0.93 0.88 0.78 27.23 34 32.9 30.5 29.4 31.1 35Greece 0.86 0.81 0.84 0.88 0.88 0.82 246.71 287 306 295 280 279 300Hong Kong 1.00 1.00 1.00 1.00 1.00 1.00 7.73 7.74 7.75 7.75 7.74 7.75 7.75Hungary 0.77 0.73 0.73 0.75 0.75 0.69 161.65 209 220 222 215 216 234India 0.91 0.85 0.84 0.85 0.84 0.84 35.83 39.5 42.2 42.6 42.3 42.5 42.8Indonesia 0.24 0.16 0.20 0.27 0.28 0.27 2362.50 9650 14500 11700 8850 8475 8625Israel 0.91 0.89 0.85 0.76 0.80 0.81 3.25 3.58 3.66 3.83 4.29 4.05 4.03Korea 0.54 0.62 0.62 0.64 0.72 0.70 845.50 1565 1371 1362 1312 1167 1214Mexico 0.92 0.88 0.76 0.79 0.77 0.83 7.87 8.58 8.93 10.38 9.94 10.17 9.51Malaysia 0.66 0.61 0.66 0.66 0.66 0.66 2.53 3.81 4.15 3.8 3.8 3.8 3.8Philippines 0.66 0.64 0.60 0.67 0.68 0.69 26.30 39.8 41.4 43.9 39.4 38.4 38.2Poland 0.82 0.82 0.79 0.83 0.81 0.72 2.86 3.48 3.49 3.62 3.43 3.53 3.98Portugal 0.83 0.83 0.88 . 0.90 0.82 155.25 186 186 177 173.4 173.43 189.2Russia 0.93 0.93 0.33 0.36 0.24 0.22 5.59 6 6 17 15.63 23.2 25.8Singapore 0.86 0.83 0.81 0.87 0.84 0.83 1.41 1.64 1.69 1.74 1.62 1.68 1.69Thailand 0.58 0.61 0.63 0.70 0.70 0.68 25.64 44.4 42.1 41 36.6 36.5 37.6Turkey 0.47 0.41 0.39 0.38 0.33 0.29 109095.00 232155 267530 276400 290120 329000 379280Taiwan 0.86 0.80 0.79 0.85 0.85 0.84 27.50 32 34.4 34.6 32.5 32.3 32.9Venezuela 0.92 0.86 0.81 0.84 0.83 0.81 476.26 519 555 587 567 571 589South Africa 0.95 0.78 0.75 0.84 0.78 0.77 4.68 4.93 6.01 6.24 5.57 6 6.08Sources1) The Economist for March 1998, July 1998, September 1998, November 1998, January 1999, and April 1999March exchange rates are March 4 of each year (from The Economist, March 7th, 1998)July exchange rates are July 1 (from The Economist, July 4th, 1998)September exchange rates are September 9th (from The Economist, September 12th, 1998)November exchange rates are November 4th (from The Economist, November 7th, 1998; this issue did not report a rate for Portugal);the November 1998 exchange rate for Portugal is from the International Finance Corporation's Emerging Markets Database (1999).January 1999 exchange rates are January 20th (from The Economist, January 23rd, 1999); Portugal is from the Wall Street Journal, January 28April 1999 exchange rates are April 21st (from The Economist, April 24th, 1999); Portugal is from the Financial Times April 232) IFC 1998, p.32 for end of 1996(The IFC does not report an exchange rate for Hong Kong and Singapore; these are from The Economist, January 2nd, 1999)
The first six columns show the change in purchasing power of the currency, taking the end of 1996 as equal to 1.Change in purchasing power is calculated as (exchange rate at the end of 1996)/(exchange rate in 1998 or 1999)The exchange rate at the end of 1996 is given in the seventh column.Exchange rates for 1998 and 1999 are in the 8th-13th columns.All exchange rates are local currency units per US dollar.
The sample is the 25 "emerging markets," as viewed by international investors. These are relatively large developing countries open to capital flows.We use the set of countries classified as emerging markets by The Economist (although Portugal was dropped from this group in 1998), JP Morgan, and Goldman Sachs.

Table 3Data Used in Regressions
Macroeconomic Variables
Government budget balance as a Percent of GDP, 1996
Broad Money Growth, % per annum, 1996
Current Account as a Percent of GDP, 1996
Total Reserves, billions of US dollars at the end of 1996
Import Coverage, months of imports, at the end of 1996
Total Foreign Debt millions of US dollars, at the end of 1996
Foreign Debt as a Percent of Exports, for 1996
Short-term Debt and Amortization as a Percent of Reserves, for 1996
Interest Payments as a Percent of Exports, for 1996
External Debt-GDP Ratio, end of 1996
jpgov gpmoney jpcurr jpreser jpcover jpextern jpdebt jpamort jpinter debtgdp Argentina -2.0 19.8 -1.3 18.1 5.8 105,388 311 111 18.6 0.35Brazil -3.9 28.9 -3.3 60.1 5.7 194,046 296 148 20.6 0.26Chile 2.2 23.6 -3.3 14.8 8.7 24,449 114 32 6.5 0.34China -0.9 25.3 0.9 107.0 8.8 150,541 70 39 2.6 0.18Colombia -1.1 21.0 -5.4 9.6 6.3 26,898 160 62 13.7 0.31Czech -0.1 9.2 -8.0 12.4 3.4 20,412 60 62 6.0 0.39Greece -7.4 13.3 -3.7 17.5 5.8 55,336 219 168 3.7 0.37Hong Kong 1.3 18.3 1.9 63.8 3.9 491,100 144 n.a. n.a. 2.2Hungary -3.3 20.9 -3.2 9.8 3.5 27,646 99 63 10.7 0.64India -5.0 16.5 -1.1 20.2 5.2 95,797 172 93 10.1 0.27Indonesia 0.0 29.6 -3.4 18.3 4.6 121,374 198 152 11.7 0.53Israel -4.3 25.0 -7.0 11.4 3.1 47,600 231 n.a. 19 0.504Korea -1.8 16.2 -4.7 33.2 1.5 106,922 67 377 3.6 0.22Mexico 0.4 30.5 -0.6 19.4 2.1 169,675 122 242 11.7 0.51Malaysia -0.5 20.6 -6.3 27.0 2.6 38,553 38 74 2.4 0.39Philippines -0.2 15.8 -4.5 10.0 2.1 56,616 117 194 6.6 0.68Poland -2.5 29.0 -1.0 17.8 5.3 41,628 103 14 4.2 0.31Portugal -2.3 5.6 -1.4 21.9 5.7 65,010 255 n.a. 16.3 0.607Russia -7.8 33.7 2.1 11.3 3.1 123,117 129 122 7.3 0.27Singapore 7.0 9.8 15.2 76.8 6.0 288,500 188 n.a. n.a. 3.00Thailand 1.5 16.6 -4.3 37.7 4.4 98,368 124 134 3.5 0.65Turkey -8.2 120.5 -2.4 16.5 3.5 79,747 152 197 8.7 0.43Taiwan -8.7 7.8 4.0 88.0 6.9 42,797 30 37 1.4 0.15Venezuela 1.4 48.3 13.1 11.8 8.8 34,037 120 64 8.3 0.39South Africa -5.6 13.6 -1.6 0.9 1.5 32,927 89 188 6.7 0.26
Source JP Morgan Goldman Sachs JP Morgan JP Morgan JP Morgan JP Morgan JP Morgan JP Morgan JP Morgan JP Morgan
and see below and see below and see below and see below and see below and see below and see below and see below and see below
Countries Missing IsraelPortugalHong Kong Hong KongSingapore Singapore
Sample Size 22 25 25 25 25 25 21 21 23 25

Table 3 (continued)Corporate Governance Variables
Judicial Efficiency Corruption Rule of Law
Enforceable Minority Sharedholder Rights
Anti-Directors Rights Creditor Rights Accounting Standards, 1990
shl5jud flcorr flrol frover shl2anti shl3cred shl5acctArgentina 6.0 6.0 5.4 3.0 4 1 45Brazil 5.8 6.3 6.3 3.0 3 1 54Chile 7.3 5.3 7.0 3.5 5 2 52China n.a. 6.5 6.0 n.a. n.a. n.a. n.a.Colombia 7.3 5.0 2.1 n.a. 3 0 50Czech n.a. n.a. n.a. 2.0 n.a. n.a. n.a.Greece 7.0 7.3 6.2 n.a. 2 1 55Hong Kong 10.0 8.5 8.2 3.0 5 4 69Hungary n.a. 7.5 8.5 3.0 n.a. n.a. n.a.India 8.0 4.6 4.2 2.0 5 4 57Indonesia 2.5 2.1 4.0 1.0 2 4 n.a.Israel 10.0 8.3 4.8 3.0 3 4 64Korea 6.0 5.3 5.4 1.0 2 3 62Mexico 6.0 4.8 5.4 3.0 1 0 60Malaysia 9.0 7.4 6.8 2.0 4 4 76Philippines 4.8 2.9 2.7 3.0 3 0 65Poland n.a. 7.4 7.7 4.0 n.a. n.a. n.a.Portugal 5.5 7.4 8.7 n.a. 3 1 36Russia n.a. n.a. n.a. 2.0 n.a. n.a. n.a.Singapore 10.0 8.2 8.6 4.0 4 4 78Thailand 3.3 5.2 6.3 2.0 2 3 64Turkey 4.0 5.2 5.2 2.0 2 2 51Taiwan 6.8 6.9 8.5 3.0 3 2 65Venezuela 6.5 4.7 6.4 n.a. 1 n.a. 40South Africa 6.0 8.9 4.4 2.5 5 3 70
Source LLSV 1998 LLSV 1998 LLSV 1998 Flemings LLSV 1998 LLSV 1998 LLSV 1998
Countries Missing China Czech Czech Republic China China China ChinaCzech Russia Russia Colombia Czech Republic Czech Republic Czech RepublicHungary Greece Hungary Hungary HungaryPoland Portugal Poland Poland PolandRussia Venezuela Russia Russia Russia
Venezuela Indonesia
Sample Size 20 23 23 20 20 19 19
LLSV 1998 is La Porta, Lopez-de-Silanes, Shleifer, and Vishny 1998.

Table 3 (continued)IFC Investable Index in at lowest point in 1998 (with end of 1996=100)
IFC Investable Index at end of 1998 (with end of 1996=100)
Month in which IFC Investable Index reached lowest point in 1998
Argentina 68.9 83.9 AugustBrazil 69.4 69.4 SeptemberChile 62.4 72.8 AugustChina 29.0 35.5 AugustColombia 51.6 69.4 OctoberCzech 59.4 72.3 AugustIndia 75.0 81.5 NovemberGreece 124.9 255.5 JanuaryHong Kong 41.1 47.8 SeptemberHungary 103.9 142.6 SeptemberIndonesia 8.5 19.0 SeptemberIsrael 94.7 102.2 OctoberKorea 30.6 68.7 SeptemberMexico 73.7 90.5 AugustMalaysia 12.8 26.3 AugustPhilippines 22.7 41.9 AugustPoland 63.3 71.5 AugustPortugal 158.8 199.8 SeptemberRussia n.a. n.a. SeptemberSingapore 40.8 61.2 SeptemberThailand 14.3 28.5 AugustTurkey 90.7 98.4 OctoberTaiwan 66.3 75.6 AugustVenezuela 37.5 62.3 AugustSouth Africa 49.7 60.0 August
Source IFC 1999 IFC 1999 IFC 1999
Countries Missing Russia Russia
Sample Size 24 24
IFC 1999 is International Finance Corporation (1999)
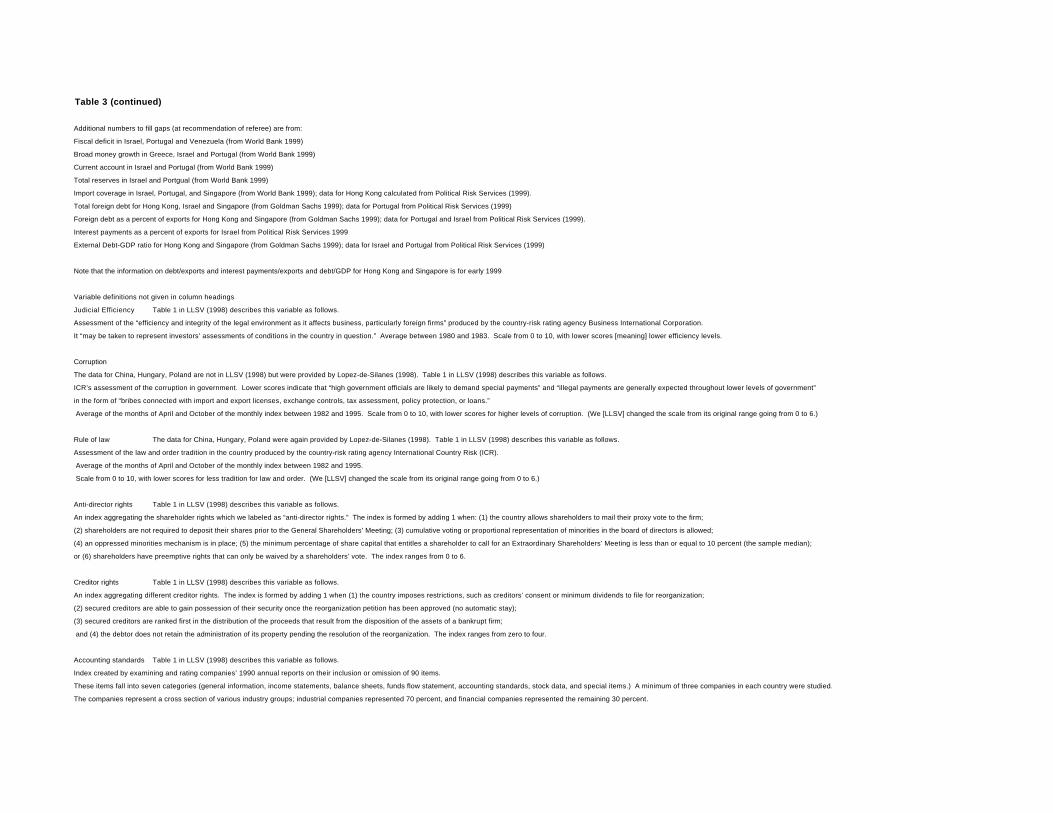
Table 3 (continued)
Additional numbers to fill gaps (at recommendation of referee) are from:
Fiscal deficit in Israel, Portugal and Venezuela (from World Bank 1999)
Broad money growth in Greece, Israel and Portugal (from World Bank 1999)
Current account in Israel and Portugal (from World Bank 1999)
Total reserves in Israel and Portgual (from World Bank 1999)
Import coverage in Israel, Portugal, and Singapore (from World Bank 1999); data for Hong Kong calculated from Political Risk Services (1999).
Total foreign debt for Hong Kong, Israel and Singapore (from Goldman Sachs 1999); data for Portugal from Political Risk Services (1999)
Foreign debt as a percent of exports for Hong Kong and Singapore (from Goldman Sachs 1999); data for Portugal and Israel from Political Risk Services (1999).
Interest payments as a percent of exports for Israel from Political Risk Services 1999
External Debt-GDP ratio for Hong Kong and Singapore (from Goldman Sachs 1999); data for Israel and Portugal from Political Risk Services (1999)
Note that the information on debt/exports and interest payments/exports and debt/GDP for Hong Kong and Singapore is for early 1999
Variable definitions not given in column headings
Judicial Efficiency Table 1 in LLSV (1998) describes this variable as follows.
Assessment of the “efficiency and integrity of the legal environment as it affects business, particularly foreign firms” produced by the country-risk rating agency Business International Corporation.
It “may be taken to represent investors’ assessments of conditions in the country in question.” Average between 1980 and 1983. Scale from 0 to 10, with lower scores [meaning] lower efficiency levels.
Corruption
The data for China, Hungary, Poland are not in LLSV (1998) but were provided by Lopez-de-Silanes (1998). Table 1 in LLSV (1998) describes this variable as follows.
ICR’s assessment of the corruption in government. Lower scores indicate that “high government officials are likely to demand special payments” and “illegal payments are generally expected throughout lower levels of government”
in the form of “bribes connected with import and export licenses, exchange controls, tax assessment, policy protection, or loans.”
Average of the months of April and October of the monthly index between 1982 and 1995. Scale from 0 to 10, with lower scores for higher levels of corruption. (We [LLSV] changed the scale from its original range going from 0 to 6.)
Rule of law The data for China, Hungary, Poland were again provided by Lopez-de-Silanes (1998). Table 1 in LLSV (1998) describes this variable as follows.
Assessment of the law and order tradition in the country produced by the country-risk rating agency International Country Risk (ICR).
Average of the months of April and October of the monthly index between 1982 and 1995.
Scale from 0 to 10, with lower scores for less tradition for law and order. (We [LLSV] changed the scale from its original range going from 0 to 6.)
Anti-director rights Table 1 in LLSV (1998) describes this variable as follows.
An index aggregating the shareholder rights which we labeled as “anti-director rights.” The index is formed by adding 1 when: (1) the country allows shareholders to mail their proxy vote to the firm;
(2) shareholders are not required to deposit their shares prior to the General Shareholders’ Meeting; (3) cumulative voting or proportional representation of minorities in the board of directors is allowed;
(4) an oppressed minorities mechanism is in place; (5) the minimum percentage of share capital that entitles a shareholder to call for an Extraordinary Shareholders’ Meeting is less than or equal to 10 percent (the sample median);
or (6) shareholders have preemptive rights that can only be waived by a shareholders’ vote. The index ranges from 0 to 6.
Creditor rights Table 1 in LLSV (1998) describes this variable as follows.
An index aggregating different creditor rights. The index is formed by adding 1 when (1) the country imposes restrictions, such as creditors’ consent or minimum dividends to file for reorganization;
(2) secured creditors are able to gain possession of their security once the reorganization petition has been approved (no automatic stay);
(3) secured creditors are ranked first in the distribution of the proceeds that result from the disposition of the assets of a bankrupt firm;
and (4) the debtor does not retain the administration of its property pending the resolution of the reorganization. The index ranges from zero to four.
Accounting standards Table 1 in LLSV (1998) describes this variable as follows.
Index created by examining and rating companies’ 1990 annual reports on their inclusion or omission of 90 items.
These items fall into seven categories (general information, income statements, balance sheets, funds flow statement, accounting standards, stock data, and special items.) A minimum of three companies in each country were studied.
The companies represent a cross section of various industry groups; industrial companies represented 70 percent, and financial companies represented the remaining 30 percent.
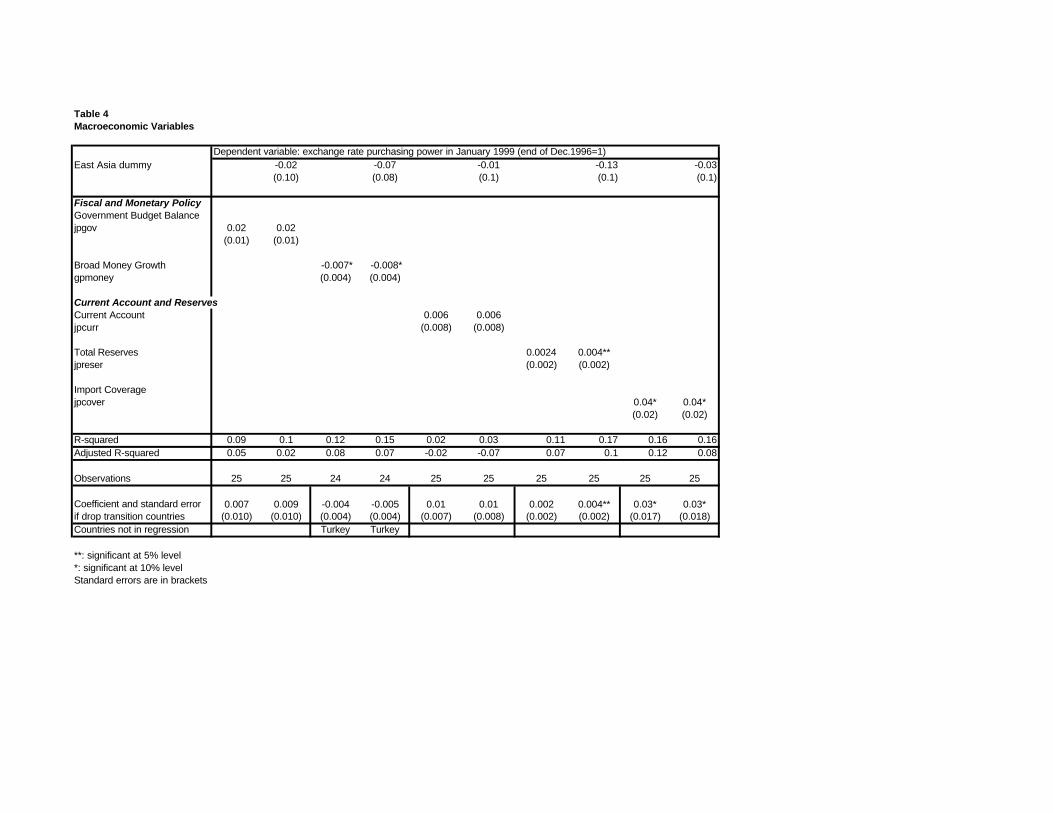
Table 4Macroeconomic Variables
Dependent variable: exchange rate purchasing power in January 1999 (end of Dec.1996=1)East Asia dummy -0.02 -0.07 -0.01 -0.13 -0.03
(0.10) (0.08) (0.1) (0.1) (0.1)
Fiscal and Monetary PolicyGovernment Budget Balancejpgov 0.02 0.02
(0.01) (0.01)
Broad Money Growth -0.007* -0.008*gpmoney (0.004) (0.004)
Current Account and ReservesCurrent Account 0.006 0.006jpcurr (0.008) (0.008)
Total Reserves 0.0024 0.004**jpreser (0.002) (0.002)
Import Coveragejpcover 0.04* 0.04*
(0.02) (0.02)
R-squared 0.09 0.1 0.12 0.15 0.02 0.03 0.11 0.17 0.16 0.16Adjusted R-squared 0.05 0.02 0.08 0.07 -0.02 -0.07 0.07 0.1 0.12 0.08
Observations 25 25 24 24 25 25 25 25 25 25
Coefficient and standard error 0.007 0.009 -0.004 -0.005 0.01 0.01 0.002 0.004** 0.03* 0.03*if drop transition countries (0.010) (0.010) (0.004) (0.004) (0.007) (0.008) (0.002) (0.002) (0.017) (0.018)Countries not in regression Turkey Turkey
**: significant at 5% level*: significant at 10% levelStandard errors are in brackets

Table 4 (continued)Dependent variable: exchange rate purchasing power in January 1999 (end of Dec.1996=1)
East Asia dummy -0.03 -0.06 -0.01 -0.09 -0.01(0.10) (0.11) (0.10) (0.12) (0.10)
External Debt Total Foreign Debt 0.0003 -0.0004jpextbil (0.004) (0.0005)
Foreign Debt/Exports -0.0002 -0.0004jpdebt (0.0006) (0.0007)
Short-term Debt and Amortization as Percent of Reserves -0.0007 -0.0007jpamort (0.0005) (0.0006)
Interest Payments as Percent of Exports -0.005 -0.009jpinter (0.01) (0.01)
Debt-GDP ratio -0.33 -0.33debtgdp (0.32) (0.33)
R-squared 0.03 0.03 0.01 0.02 0.08 0.08 0.05 0.05 0.06 0.06Adjusted R-squared -0.02 -0.07 -0.05 -0.09 0.04 0.08 -0.03 -0.06 0.005 -0.05
Observations 25 25 25 25 21 21 23 23 25 25
Coefficient and standard error -0.0004 -0.0005 -0.0001 -0.0005 -0.0007 -0.0007 -0.005 -0.01 -0.56** -0.55if drop transition countries (0.000) (0.004) (0.0006) (0.0008) (0.0005) (0.0006) (0.01) (0.01) (0.31) (0.33)Countries not in regression Israel Israel Hong Kong Hong Kong
Portugal Portugal Singapore SingaporeHong Kong Hong KongSingapore Singapore
**: significant at 5% level*: significant at 10% levelStandard errors are in brackets

Table 4 (continued)Notes
All results are for OLS regressions with exchange purchasing power as the dependent variable.Exchange rate purchasing power is lower in January 1999 relative to the end of 1996 if there has been more depreciation.Therefore a positive coefficient on a variable means it is associated with less depreciation.
All regressions use the full sample for which data is available, butTurkey is dropped from the money growth regression.
Definition of variables used in regressionsGovernment budget balance is the central government's budget deficit (if negative) or surplus (if positive) as a percent of GDP in 1996.Broad money growth is the growth of a broad money aggregate in 1996.Current account is the country's current account deficit (if negative) or surplus (if positive) as a percent of GDP in 1996.Total reserves are central bank reserves in billions of dollars at the end of 1996.Import coverage is the ratio of imports to reserves, measured in months of imports, in 1996.Total foreign debt is the stock of private and public debt in foreign currency outstanding at the end of 1996, in US dollars.Short-term debt and amortization as a percent of reserves measures payments on foreign debt in 1996.Interest payments as a percent of exports were in 1996.Debt-GDP ratio is the ratio of foreign debt outstanding at the end of 1996 to GDP in 1996.
The transition countries are China, Czech Republic, Hungary, Poland, and Russia.
The East Asia dummy is equal to one for China, Hong Kong, Indonesia, Korea, Malaysia, Philippines, Singapore, Thailand, and Taiwan.
The dependent variable is the purchasing power of the currency vis-à-vis the US dollar in January 1999, taking the end of 1996 as equal to 100.The values used are in Table 1.

Table 5Enforceability of Contracts
Dependent variable: exchange rate purchasing power in January 1999 (end-Dec.1996=100)East Asia Dummy -0.06 -0.1 -0.005 -0.09 -0.05 -0.13 0.04 0.01
(0.07) (0.09) (0.07) (0.09) (0.07) (0.09) (0.09) 0.12Enforceability of ContractsJudicial Efficiency 0.05** 0.05** 0.05**shl5jud (0.02) (0.02) (0.02)
Corruptionflcorr 0.05** 0.05** 0.04*
(0.02) (0.02) (0.02)Rule of Law 0.04** 0.04** 0.03flrol (0.02) (0.02) (0.02)
Enforceable Shareholder RightsCorporate Governance 0.14** 0.14** 0.13**frover (0.05) (0.05) (0.06)
Macroeconomic Control VariableReserves 0.002 0.002 0.003 0.001jpreser (0.002) (0.002) (0.002) (0.002)
R-squared 0.34 0.37 0.39 0.28 0.28 0.36 0.19 0.2 0.27 0.3 0.31 0.31Adjusted R-Squared 0.31 0.29 0.28 0.2 0.21 0.25 0.15 0.12 0.14 0.26 0.22 0.18Observations 20 20 20 23 23 23 23 23 23 20 20 20Missing Countries China China China Russia Russia Russia Russia Russia Russia China China China
Hungary Hungary Hungary Czech R. Czech R. Czech R. Czech R. Czech R. Czech R. Colombia Colombia ColombiaPoland Poland Poland Greece Greece GreeceRussia Russia Russia Portugal Portugal Portugal Czech R. Czech R. Czech R. Venezuela Venezuela Venezuela
**: significant at 5% level*: significant at 10% levelStandard errors are in brackets
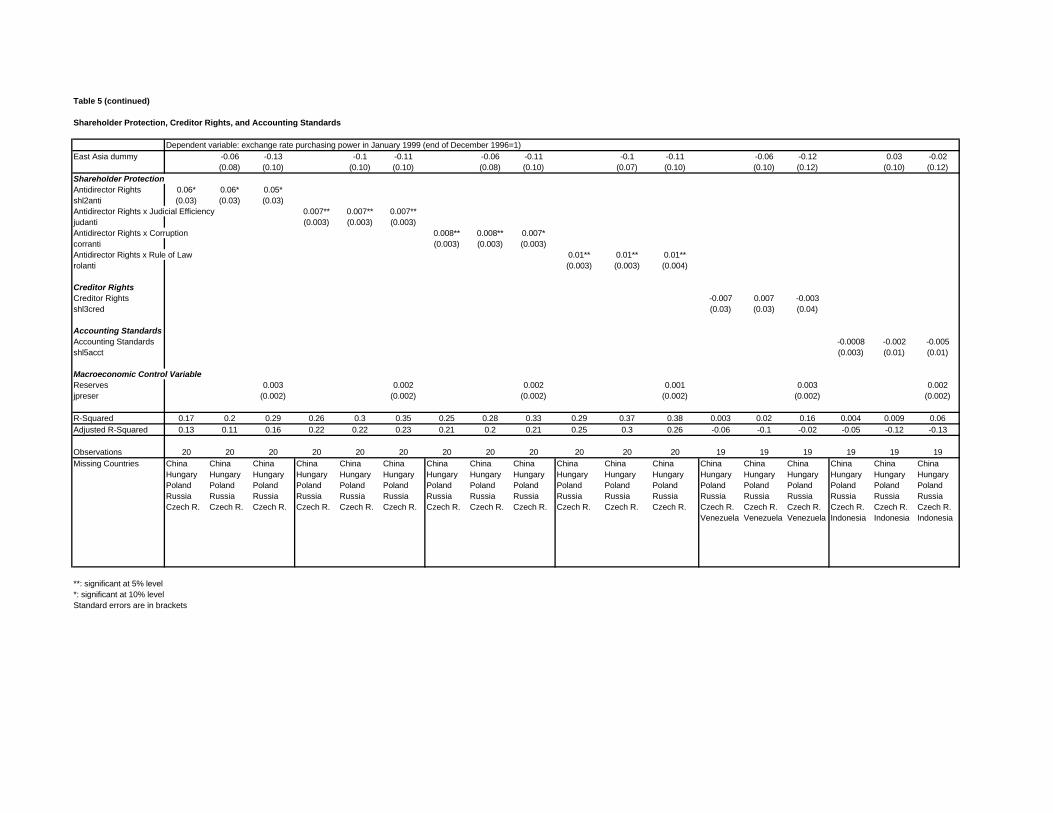
Table 5 (continued)
Shareholder Protection, Creditor Rights, and Accounting Standards
Dependent variable: exchange rate purchasing power in January 1999 (end of December 1996=1)East Asia dummy -0.06 -0.13 -0.1 -0.11 -0.06 -0.11 -0.1 -0.11 -0.06 -0.12 0.03 -0.02
(0.08) (0.10) (0.10) (0.10) (0.08) (0.10) (0.07) (0.10) (0.10) (0.12) (0.10) (0.12)Shareholder ProtectionAntidirector Rights 0.06* 0.06* 0.05*shl2anti (0.03) (0.03) (0.03)Antidirector Rights x Judicial Efficiency 0.007** 0.007** 0.007**judanti (0.003) (0.003) (0.003)Antidirector Rights x Corruption 0.008** 0.008** 0.007*corranti (0.003) (0.003) (0.003)Antidirector Rights x Rule of Law 0.01** 0.01** 0.01**rolanti (0.003) (0.003) (0.004)
Creditor RightsCreditor Rights -0.007 0.007 -0.003shl3cred (0.03) (0.03) (0.04)
Accounting StandardsAccounting Standards -0.0008 -0.002 -0.005shl5acct (0.003) (0.01) (0.01)
Macroeconomic Control VariableReserves 0.003 0.002 0.002 0.001 0.003 0.002jpreser (0.002) (0.002) (0.002) (0.002) (0.002) (0.002)
R-Squared 0.17 0.2 0.29 0.26 0.3 0.35 0.25 0.28 0.33 0.29 0.37 0.38 0.003 0.02 0.16 0.004 0.009 0.06Adjusted R-Squared 0.13 0.11 0.16 0.22 0.22 0.23 0.21 0.2 0.21 0.25 0.3 0.26 -0.06 -0.1 -0.02 -0.05 -0.12 -0.13
Observations 20 20 20 20 20 20 20 20 20 20 20 20 19 19 19 19 19 19Missing Countries China China China China China China China China China China China China China China China China China China
Hungary Hungary Hungary Hungary Hungary Hungary Hungary Hungary Hungary Hungary Hungary Hungary Hungary Hungary Hungary Hungary Hungary HungaryPoland Poland Poland Poland Poland Poland Poland Poland Poland Poland Poland Poland Poland Poland Poland Poland Poland PolandRussia Russia Russia Russia Russia Russia Russia Russia Russia Russia Russia Russia Russia Russia Russia Russia Russia RussiaCzech R. Czech R. Czech R. Czech R. Czech R. Czech R. Czech R. Czech R. Czech R. Czech R. Czech R. Czech R. Czech R. Czech R. Czech R. Czech R. Czech R. Czech R.
Venezuela Venezuela Venezuela Indonesia Indonesia Indonesia
**: significant at 5% level*: significant at 10% levelStandard errors are in brackets
Table 5 (continued)Notes
Definition of variables used in regressionJudicial Efficiency is an index from 0 to 10, for the period 1980-83, with a higher score meaning a more efficient legal system from the perspective of foreign business people.Corruption is an index from O to 10, for the period 1982-95, with a higher score meaning that there is less bribery among government officials.Rule of law is an index from 0 to 10, for the period 1982-95, with a higher score meaning a stronger tradition of law and order.Corporate Governance is an index from 1 to 5, for early 1998, with a higher score indicating better treatment for minority shareholders.Antidirector Rights is an index from 0 to 6, for 1996-97, with a higher score indicating better protection for minority shareholders.Creditor Rights is an index from 0 to 4, for 1996-97, with a higher score indicating better protection for creditors.Accounting standards is an index from 0 to 90, for 1990, with a higher score indicating more disclosure in company annual reports.Total reserves are central bank reserves in billions of dollars at the end of 1996.
Four measures are constructed through multiplying indices together.Antidirector Rights x Judicial Efficiency is the product of Antidirector Rights and Judicial Efficiency.Antidirector Rights x Corruption is the product of Antidirector Rights and Corruption.Antidirector Rights x Rule of law is the product of Antidirector Rights and Rule of law.
The East Asia dummy is equal to one for China, Hong Kong, Indonesia, Korea, Malaysia, Philippines, Singapore, Thailand, and Taiwan.
The dependent variable is the purchasing power of the currency vis-à-vis the US dollar in January 1999, taking the end of 1996 as equal to 100.The values used are in Table 1.

Table 6Change in Stock Market Value and Macroeconomic Policies.
Stock Market Value at lowest point in 1998 with end 1996=100 ifc9698lEast Asia dummy -49.5** -61.2** -53.3** -41.7**
(12.0) (14.1) (12.6) (11.7)
Current Account -0.7 0.05jpcurr (1.4) (1.1)
Total Reserves -0.3 0.35jpreser (0.3) (0.25)
Debt-GDP Ratio -7.2 8debtgdp (11.8) (9.6)
Government Budget Balance -5.0** -3.0**jpgov (1.9) (1.6)Observations 25 25 25 25 25 25 25 25R-Squared 0.01 0.45 0.05 0.5 0.02 0.47 0.25 0.53Adjusted R-Squared -0.03 0.4 0.01 0.45 -0.03 0.42 0.21 0.49
**: significant at 10% level*: significant at 5% level
Standard errors are in parentheses
Notes to Table 6
Government budget balance is the central government's budget deficit (if negative) or surplus (if positive) as a percent of GDP in 1996.Current account is the country's current account deficit (if negative) or surplus (if positive) as a percent of GDP in 1996.Total reserves are central bank reserves in billions of dollars at the end of 1996.Debt-GDP ratio is the ratio of foreign debt outstanding at the end of 1996 to GDP in 1996.
The East Asia dummy is equal to one for China, Hong Kong, Indonesia, Korea, Malaysia, Philippines, Singapore, Thailand, and Taiwan.
The dependent variable is the value of the IFC Investable Index, measured in US dollars, at its lowest point in 1998, taking the value of this index at the end of 1996to equal 100. The values used are in Table 2.
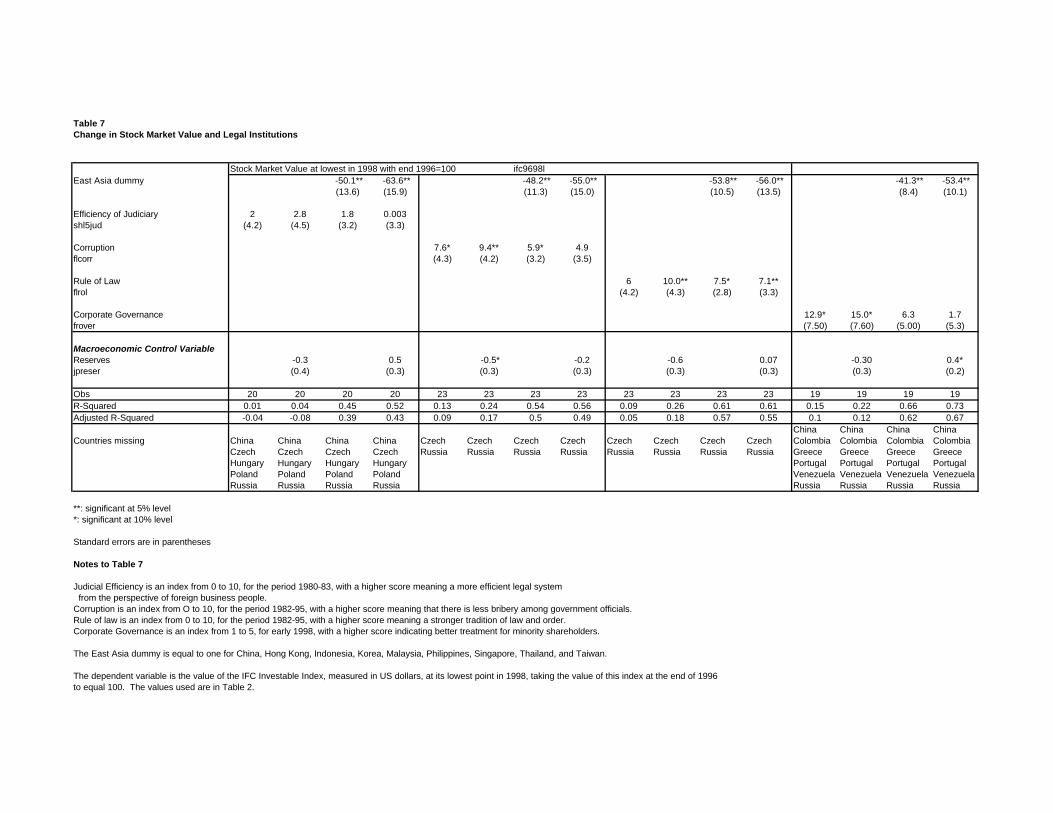
Table 7Change in Stock Market Value and Legal Institutions
Stock Market Value at lowest in 1998 with end 1996=100 ifc9698lEast Asia dummy -50.1** -63.6** -48.2** -55.0** -53.8** -56.0** -41.3** -53.4**
(13.6) (15.9) (11.3) (15.0) (10.5) (13.5) (8.4) (10.1)
Efficiency of Judiciary 2 2.8 1.8 0.003shl5jud (4.2) (4.5) (3.2) (3.3)
Corruption 7.6* 9.4** 5.9* 4.9flcorr (4.3) (4.2) (3.2) (3.5)
Rule of Law 6 10.0** 7.5* 7.1**flrol (4.2) (4.3) (2.8) (3.3)
Corporate Governance 12.9* 15.0* 6.3 1.7frover (7.50) (7.60) (5.00) (5.3)
Macroeconomic Control VariableReserves -0.3 0.5 -0.5* -0.2 -0.6 0.07 -0.30 0.4*jpreser (0.4) (0.3) (0.3) (0.3) (0.3) (0.3) (0.3) (0.2)
Obs 20 20 20 20 23 23 23 23 23 23 23 23 19 19 19 19R-Squared 0.01 0.04 0.45 0.52 0.13 0.24 0.54 0.56 0.09 0.26 0.61 0.61 0.15 0.22 0.66 0.73Adjusted R-Squared -0.04 -0.08 0.39 0.43 0.09 0.17 0.5 0.49 0.05 0.18 0.57 0.55 0.1 0.12 0.62 0.67
China China China ChinaCountries missing China China China China Czech Czech Czech Czech Czech Czech Czech Czech Colombia Colombia Colombia Colombia
Czech Czech Czech Czech Russia Russia Russia Russia Russia Russia Russia Russia Greece Greece Greece GreeceHungary Hungary Hungary Hungary Portugal Portugal Portugal PortugalPoland Poland Poland Poland Venezuela Venezuela Venezuela VenezuelaRussia Russia Russia Russia Russia Russia Russia Russia
**: significant at 5% level*: significant at 10% level
Standard errors are in parentheses
Notes to Table 7
Judicial Efficiency is an index from 0 to 10, for the period 1980-83, with a higher score meaning a more efficient legal system from the perspective of foreign business people.Corruption is an index from O to 10, for the period 1982-95, with a higher score meaning that there is less bribery among government officials.Rule of law is an index from 0 to 10, for the period 1982-95, with a higher score meaning a stronger tradition of law and order.Corporate Governance is an index from 1 to 5, for early 1998, with a higher score indicating better treatment for minority shareholders.
The East Asia dummy is equal to one for China, Hong Kong, Indonesia, Korea, Malaysia, Philippines, Singapore, Thailand, and Taiwan.
The dependent variable is the value of the IFC Investable Index, measured in US dollars, at its lowest point in 1998, taking the value of this index at the end of 1996to equal 100. The values used are in Table 2.