America's Financial Crisis: The End of an Era - Asian ...
30
ADBI Working Paper Series America’s Financial Crisis: The End of an Era Barry Bosworth and Aaron Flaaen No. 142 July 2009 Asian Development Bank Institute
-
Upload
khangminh22 -
Category
Documents
-
view
0 -
download
0
Transcript of America's Financial Crisis: The End of an Era - Asian ...
ADBI Working Paper Series
America’s Financial Crisis: The End of an Era
Barry Bosworth and
Aaron Flaaen
No. 142
July 2009
Asian Development Bank Institute
Barry Bosworth is a fellow in economics and Aaron Flaaen is a senior research assistant at the Brookings Institution in Washington, DC. The authors are indebted to the Tokyo Club Foundation for Global Studies for its financial support.
The views expressed in this paper are the views of the authors and do not necessarily reflect the views or policies of ADBI, the Asian Development Bank (ADB), its Board of Directors, or the governments they represent. ADBI does not guarantee the accuracy of the data included in this paper and accepts no responsibility for any consequences of their use. Terminology used may not necessarily be consistent with ADB official terms.
The Working Paper series is a continuation of the formerly named Discussion Paper series; the numbering of the papers continued without interruption or change. ADBI’s working papers reflect initial ideas on a topic and are posted online for discussion. ADBI encourages readers to post their comments on the main page for each working paper (given in the citation below). Some working papers may develop into other forms of publication.
Suggested citation:
Bosworth, B., and A. Flaaen. 2009. America’s Financial Crisis: The End of an Era. ADBI Working Paper 142. Tokyo: Asian Development Bank Institute. Available: http://www.adbi.org/working-paper/2009/07/21/3229.america.financial.crisis.end.era/
Asian Development Bank Institute
Kasumigaseki Building 8F 3-2-5 Kasumigaseki, Chiyoda-ku Tokyo 100-6008, Japan Tel: +81-3-3593-5500 Fax: +81-3-3593-5571 URL: www.adbi.org E-mail: [email protected] © 2009 Asian Development Bank Institute
ADBI Working Paper 142 Bosworth and Flaaen
Abstract
This paper reviews research on the origins of the financial crisis of 2008–2009, highlights the key events that triggered a financial panic in September 2008, and summarizes the extraordinary policy actions the United States (US) has taken to ameliorate the crisis. We discuss the proximate causes of the crisis, including the characteristics and growth of the subprime mortgage market, and the distorted incentives and flawed regulatory structure surrounding the secondary market for mortgage-backed securities. We also assess the role of more fundamental macroeconomic determinants of the bubble in US asset prices, most notably low global interest rates attributed to either loose monetary policy or excess global saving. We find that while low global interest rates may have contributed to the boom in housing markets and speculative excesses, the poorly understood innovations and microeconomic distortions of the financial system played a more fundamental role. Finally, the otherwise extraordinary policy response of the US government has been limited by the lack of an effective restructuring of the financial system, and a recovery marked by higher private saving, weak domestic investment, and a large public deficit appears to be unsustainable. Ultimately, the US economy will need to shift about 3% of GDP from domestic consumption to the export sector. This will pose some serious challenges to countries that have come to rely on exports to the US market.
JEL Classification: G01, E65, E66, E69, F40
ADBI Working Paper 142 Bosworth and Flaaen
Contents
1. Introduction .................................................................................................................. 1
2. Origins ......................................................................................................................... 1
3. The Financial Panic of 2008 ...................................................................................... 12
4. Real Sector Implications ............................................................................................ 15
5. The Policy Response ................................................................................................ 16
6. Global Implications .................................................................................................... 21
7. Conclusions ............................................................................................................... 23
References ............................................................................................................................ 24
ADBI Working Paper 142 Bosworth and Flaaen
1. INTRODUCTION Over the past quarter century, American economists and policymakers have been very active in providing policy advice to other countries about how to avoid and/or manage financial crises. In many cases the essence of the advice was “you should be more like us.” Suddenly, the United States (US) has been hit by its own financial crisis—one that is extraordinary in both its breadth and severity. While prior financial panics in individual countries or regions have involved output declines of equal or greater magnitude, the global dimensions of the current crisis are unprecedented. The crisis began in the US, but has now spread to of the rest of the world economy. The transmission channel with Europe has been largely through a linkage of financial markets and institutions on both sides of the Atlantic that shared some of the same flaws and excesses. But for Asia and much of the developing world, the transmission has been largely through an extraordinary collapse of global trade.
This paper summarizes some research on the origins of the crisis, traces the evolution of the credit panic that hit in late 2008, its impact on the real economy, and the extraordinary policy actions that have been taken to mitigate the economic losses. As with past financial crises, the current downturn will end and the economy will recover. However, as we argue below, the crisis will likely come to represent a major regime change, greatly altering the future shape of the US and global economies. The era of self-regulation of financial institutions is over, and the role of monetary policy has been greatly altered. The binge of consumer spending also seems to have come to an end, as households focus on rebuilding their balance sheets. If the US is to restore full employment, it must not only rebuild its financial industries but also rejuvenate its export industries and achieve a more balanced external position. This raises two challenges for the rest of the global economy. First, they must develop new drivers of demand growth; countries will not be able to rely on growing exports into the US market, and they will need to emphasize the development of domestic and regional markets. Second, frustration with the effort to develop export markets in a time of slow global growth may push politicians toward a more protectionist policy stance.
2. ORIGINS The precise causes of the financial crisis remain surprisingly controversial. Much of the recent analysis has emphasized the role of developments within the US housing and financial markets. Home prices began to rise rapidly in the late 1990s and, by the year 2000, had far exceeded the growth in either incomes or rent values (Figure 1). At their peak in 2006, home prices were nearly 50% above a norm defined by their historical relationship to household income. Most analysts point to the excesses of the subprime mortgage market in the US and the subsequent transformation of those assets into exotic secondary market instruments as key factors that led to the housing price bubble. The bursting of this bubble and the subsequent collapse of the market for subprime mortgages initiated a chain-like collapse of markets for securitized assets and a crisis of confidence among financial institutions.
ADBI Working Paper 142 Bosworth and Flaaen
Figure 1: Household Income, Home Prices, and Rental Index (2000Q1=100), (1975Q1–2008Q4)
Note: The Spliced Home Price index extends the Case-Shiller index backwards for 1975–1986 using the OFHEO home price index. Quarterly mean HH income is linearly interpolated from Census annual data and then adjusted so that the average over four quarters equals annual income exactly. The income and rental indices were adjusted so that their average over the period through 2001 equals that of the home price index. Fourth quarter 2008 income values were extrapolated.
0
20
40
60
80
100
120
140
160
180
200
1975 1980 1985 1990 1995 2000 2005
2000
Q1=
100
Spliced Home Price Index Mean Household Income Rental Index
Source: Standard and Poor’s (2009), Census (2007), and Bureau of Economic Analysis (2009).
Some economists argue, however, that the excesses in the housing and mortgage-backed securities markets were merely proximate causes and point to what they regard as more fundamental determinants that created an environment in which the speculative excesses of the real estate and securitized asset markets could flourish. They emphasize either (i) a US monetary policy that remained stimulative for too long after the 2002 recession (Taylor 2009) or (ii) excess saving outside the US that drove down global interest rates to levels that fueled the speculation. While both of these hypotheses could serve to explain the consequent bubble in US asset prices, they do not provide an immediate explanation as to why defaults in a relatively small portion of the credit markets (subprime mortgages) had such catastrophic, system-wide consequences.
The Subprime Market. Subprime mortgages were originally perceived as a beneficial development whereby a greater proportion of low-income, minorities, and higher-risk households could be granted access to financial markets and the opportunity to become homeowners. The marketing of the subprime, alt-A, and home equity loans relied on independent mortgage originators who were part of a financial network that developed in parallel to the issuance and securitization of conventional mortgages by the government-sponsored enterprises (GSEs). 1 The system of securitization operated by the GSEs established strict standards for conforming mortgages, requiring full documentation of the borrower’s financial condition and the valuation of the property. In contrast, the subprime market operated with fewer constraints. The originators wrote the mortgage loans, provided a short-term guarantee (usually 90 days), and sold the loans to private arrangers who subsequently pooled the mortgages and issued securities that were backed by the mortgage 1 Alt-A is a designation for mortgages that are deemed riskier than prime mortgages but not as risky as subprime
mortgages. Typically, alt-A mortgage borrowers are characterized as people without full documentation, higher than average loan-to-value ratios, or lower credit scores.
2
ADBI Working Paper 142 Bosworth and Flaaen
pool. As a substitute for the GSE guarantees, mortgage-backed securities were rolled over into collateralized debt obligations (CDOs), which were sold in a series of tranches where the junior tranches absorbed the initial defaults and senior tranches were viewed as very secure and were often assigned a AAA rating.
The network of subprime operations was essentially unregulated and the originators in particular operated with less concern about reputational issues or loan quality. With minimal capital requirements, the costs of entry and exit from the industry were low. Subprime mortgages often incorporated low down payment requirements and a significant prepayment penalty.2 Underwriting standards declined as loan originators focused on collecting fees on loans that they quickly resold. Due to the complexity and lack of transparency in these markets, purchasers of the mortgage-backed securities in the secondary market also failed to accurately evaluate the quality of the underlying assets and to understand the risks involved. Because regulators were largely absent, the major source of information on the risks of the mortgage-backed securities were the credit rating agencies—principally consisting of Standard & Poor’s, Fitch, and Moody’s. Yet these agencies also failed to provide an accurate assessment of risk. The credit rating agencies received payment for their ratings directly from the issuers of the financial products being rated, thereby creating a clear conflict of interest and a subsequent tendency for issuers to “shop around” for the agency willing to give them the highest rating. The result was a broad underestimate of the degree of risk associated with these new securities, and the sheer complexity of their design prevented many from taking a closer look.
The non-prime mortgages described above expanded from 15% of new originations in 2001 to 50% in 2006. The proportion of these mortgages that were securitized also rose sharply over the same period to reach 90% in 2007. By 2005, subprime mortgages represented about US$2.5 trillion out of a total residential mortgage stock of about US$11 trillion. The greater risk of the subprime mortgages is evident in the 12% of outstanding loans that are in foreclosure, compared to less than 2% for conforming mortgages. Many housing analysts assert that without the prominent role of subprime mortgages, the increase in home prices would have been choked off at a much earlier stage: potential buyers would not have been able to obtain a conforming mortgage at such elevated levels relative to their incomes.
The growth of the subprime mortgage market was accompanied by a number of other financial innovations that camouflaged risk. When subprime mortgages began to default in large numbers it became difficult to accurately trace through the implications for the valuations of the CDOs, which did not trade on organized markets. That rapid growth of these securities within off-balance sheet entities called structured investment vehicles (SIVs) also led to large increases in the size of the issuing institutions without a matching increase in capital. The lower capital requirements associated with such SIVs allowed these financial institutions (often investment banking firms) to dramatically increase their effective leverage ratios.
Further problems arose in the means by which financial institutions financed their off-balance sheet activities. The long-term assets such as mortgage-backed securities and CDOs were financed by issuing short-term liabilities such as asset-backed commercial paper (ABCP) and overnight repurchase agreements. According to Baily, Litan, and Johnson. (2008), of the enormous growth in the issuance of ABCP from around US$30 billion in February 2005 to over US$80 billion in early 2008, nearly all had a maturity of between one and four days. Because these liabilities were cheaper than long-term borrowing, they allowed financial institutions to fund their high-value mortgage-backed assets at a substantial margin. While asset prices continued to rise, rolling over these short-term commitments did not pose a serious problem. It was not until credit markets dried up and risk premiums increased 2 There are a number of papers that review the operations of the subprime market and its role in initiating the
financial crisis. We found the following to be particularly useful: Gramlich (2007); Baily, Litan, and Johnson (2008); Gorton (2008); Ashcraft and Schuerman (2008), and Hatzius (2008).
3
ADBI Working Paper 142 Bosworth and Flaaen
sharply in 2008 that financial institutions found themselves not only with falling asset prices but also exposed to a severe maturity mismatch. As banks were forced to move the SIVs onto their balance sheet or were unable to roll-over their short-term liabilities, their leverage ratios increased further.
The emphasis on subprime mortgage defaults and the consequent insolvency of major financial firms as the primary cause of the recession highlights concern about the risks of financial innovation. Past innovations were perceived as major contributors to growth and the efficiency of the US financial system and a rationale for sharply limiting regulation. Yet, the costs of this crisis will outweigh the benefits of financial market innovations for decades to come.
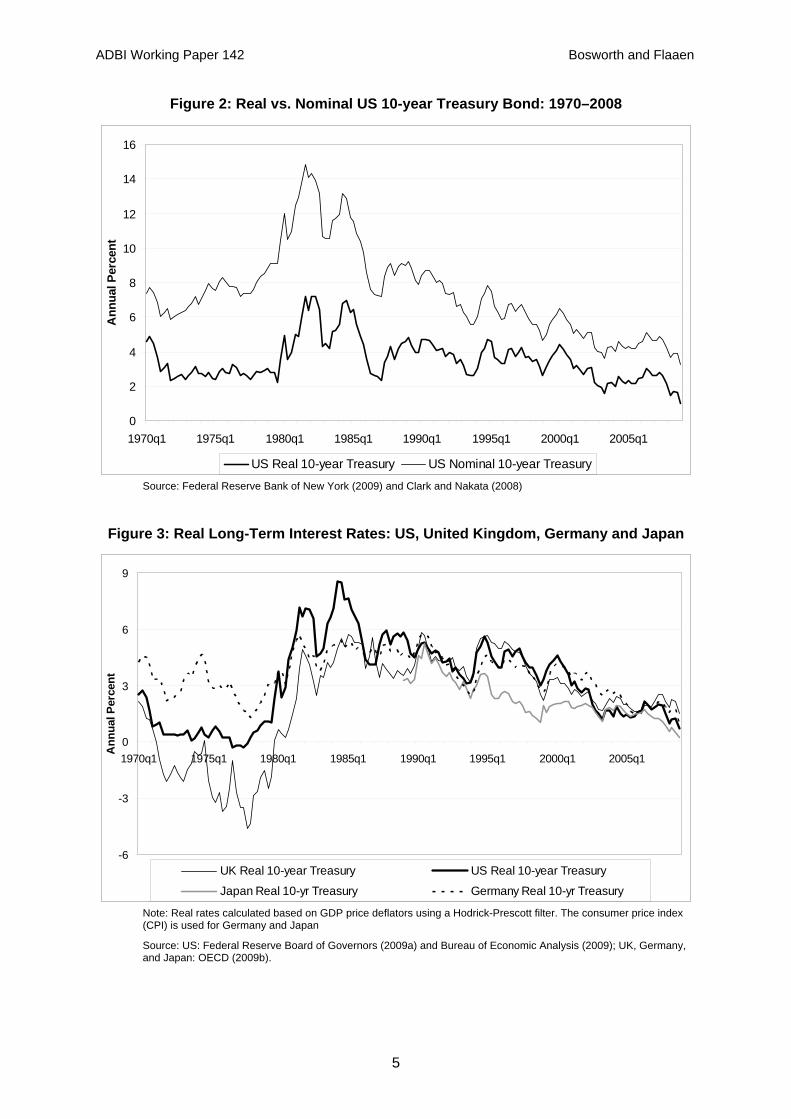
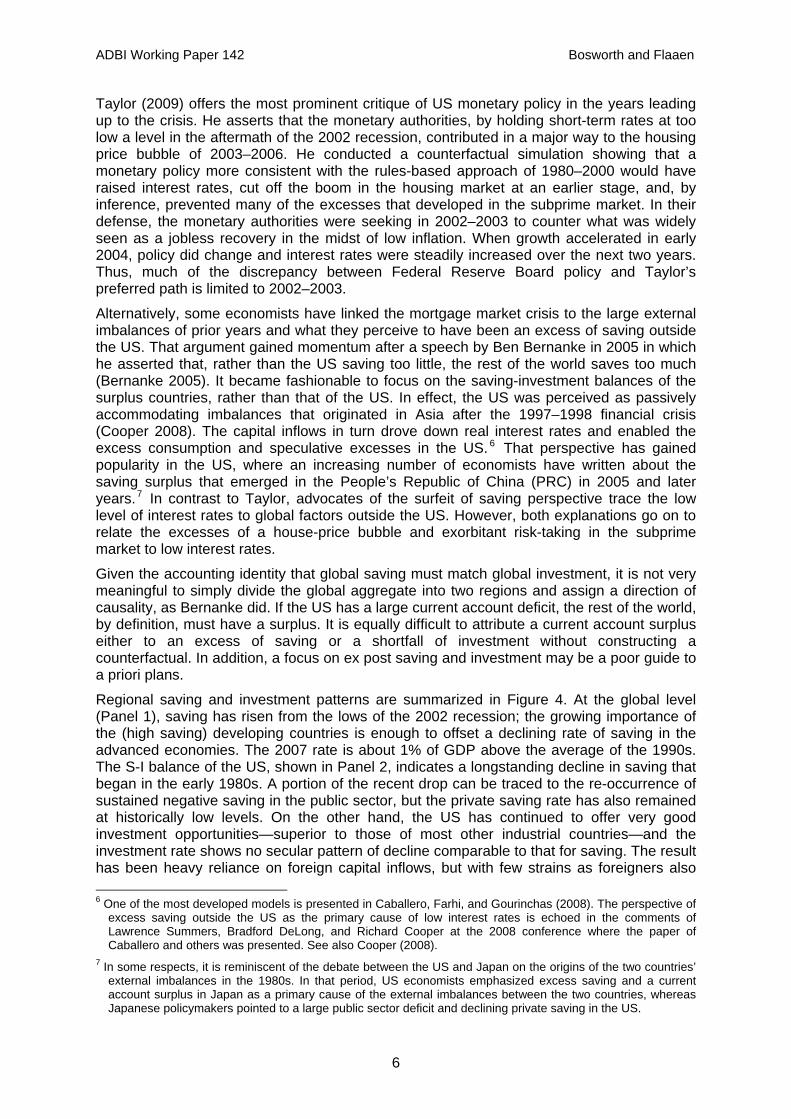
Fundamental Factors. Asset market bubbles like that of the US housing market have been common throughout history, and the rapid price rise was not limited to the US alone. From 1997 to 2007, housing prices were rising even more rapidly in several European countries, including Spain, Ireland, and the United Kingdom. Some researchers suggest that the repetitive nature of asset price bubbles and the cross-national pattern of the housing price increases point to more fundamental underlying causal factors than innovations in US mortgage markets alone. The most obvious candidate is a low level of nominal and real interest rates in the US and in the global economy. The nominal and real rates of interest for US 10-year government bonds are reported in Figure 2. The inflation adjustment is based on a survey of inflation expectations. 3 The estimated real rate displays a fairly consistent downward trend from 1980 to the present. Lacking a measure of inflation expectations for other countries, we constructed an alternative estimate of the real bond rate using a Hodrick-Prescott filter to smooth the actual inflation rate. Those results are shown in Figure 3 for Germany, Japan, UK, and US.4 The two measures of the real interest rate for the US are quite similar, suggesting that a simple average of actual rates of inflation may be adequate for many purposes. Both nominal and real interest rates have fallen to levels not seen since the 1970s; but, the decline in real rates extends over the past quarter century, and they do not seem abnormally low by the standards of earlier decades.5 Thus, it is not evident that the extent of the decline or the absolute level of real interest rates in the current decade is unprecedented. The current low level of interest rates, however, is at the center of explanations that place the blame for the financial crisis on either mistakes in US monetary policy or an excess of global saving.
3 The measure of the real interest rate is constructed using survey data on 10-year expected inflation from the
Survey of Professional Forecasters (1990–2007), and a survey of financial market participants for 1981–1989. Expected inflation for years before 1981 was constructed by the staff of the Federal Reserve. The data was obtained from Clark and Nakata (2008).
4 Quarterly data on nominal interest rates and GDP price deflators was taken from the data files of the OECD. 5 The behavior of nominal and real rates over the past 150 years in the US was examined in Summers (1983).
4
ADBI Working Paper 142 Bosworth and Flaaen
Figure 2: Real vs. Nominal US 10-year Treasury Bond: 1970–2008
0
2
4
6
8
10
12
14
16
1970q1 1975q1 1980q1 1985q1 1990q1 1995q1 2000q1 2005q1
Ann
ual P
erce
nt
US Real 10-year Treasury US Nominal 10-year Treasury
Source: Federal Reserve Bank of New York (2009) and Clark and Nakata (2008)
Figure 3: Real Long-Term Interest Rates: US, United Kingdom, Germany and Japan
-6
-3
0
3
6
1970q1 1975q1 1980q1 1985q1 1990q1 1995q1 2000q1 2005q1
Ann
ual P
erce
nt
9
UK Real 10-year Treasury US Real 10-year Treasury
Japan Real 10-yr Treasury Germany Real 10-yr Treasury
Note: Real rates calculated based on GDP price deflators using a Hodrick-Prescott filter. The consumer price index (CPI) is used for Germany and Japan
Source: US: Federal Reserve Board of Governors (2009a) and Bureau of Economic Analysis (2009); UK, Germany, and Japan: OECD (2009b).
5
ADBI Working Paper 142 Bosworth and Flaaen
Taylor (2009) offers the most prominent critique of US monetary policy in the years leading up to the crisis. He asserts that the monetary authorities, by holding short-term rates at too low a level in the aftermath of the 2002 recession, contributed in a major way to the housing price bubble of 2003–2006. He conducted a counterfactual simulation showing that a monetary policy more consistent with the rules-based approach of 1980–2000 would have raised interest rates, cut off the boom in the housing market at an earlier stage, and, by inference, prevented many of the excesses that developed in the subprime market. In their defense, the monetary authorities were seeking in 2002–2003 to counter what was widely seen as a jobless recovery in the midst of low inflation. When growth accelerated in early 2004, policy did change and interest rates were steadily increased over the next two years. Thus, much of the discrepancy between Federal Reserve Board policy and Taylor’s preferred path is limited to 2002–2003.
Alternatively, some economists have linked the mortgage market crisis to the large external imbalances of prior years and what they perceive to have been an excess of saving outside the US. That argument gained momentum after a speech by Ben Bernanke in 2005 in which he asserted that, rather than the US saving too little, the rest of the world saves too much (Bernanke 2005). It became fashionable to focus on the saving-investment balances of the surplus countries, rather than that of the US. In effect, the US was perceived as passively accommodating imbalances that originated in Asia after the 1997–1998 financial crisis (Cooper 2008). The capital inflows in turn drove down real interest rates and enabled the excess consumption and speculative excesses in the US. 6 That perspective has gained popularity in the US, where an increasing number of economists have written about the saving surplus that emerged in the People’s Republic of China (PRC) in 2005 and later years.7 In contrast to Taylor, advocates of the surfeit of saving perspective trace the low level of interest rates to global factors outside the US. However, both explanations go on to relate the excesses of a house-price bubble and exorbitant risk-taking in the subprime market to low interest rates.
Given the accounting identity that global saving must match global investment, it is not very meaningful to simply divide the global aggregate into two regions and assign a direction of causality, as Bernanke did. If the US has a large current account deficit, the rest of the world, by definition, must have a surplus. It is equally difficult to attribute a current account surplus either to an excess of saving or a shortfall of investment without constructing a counterfactual. In addition, a focus on ex post saving and investment may be a poor guide to a priori plans.
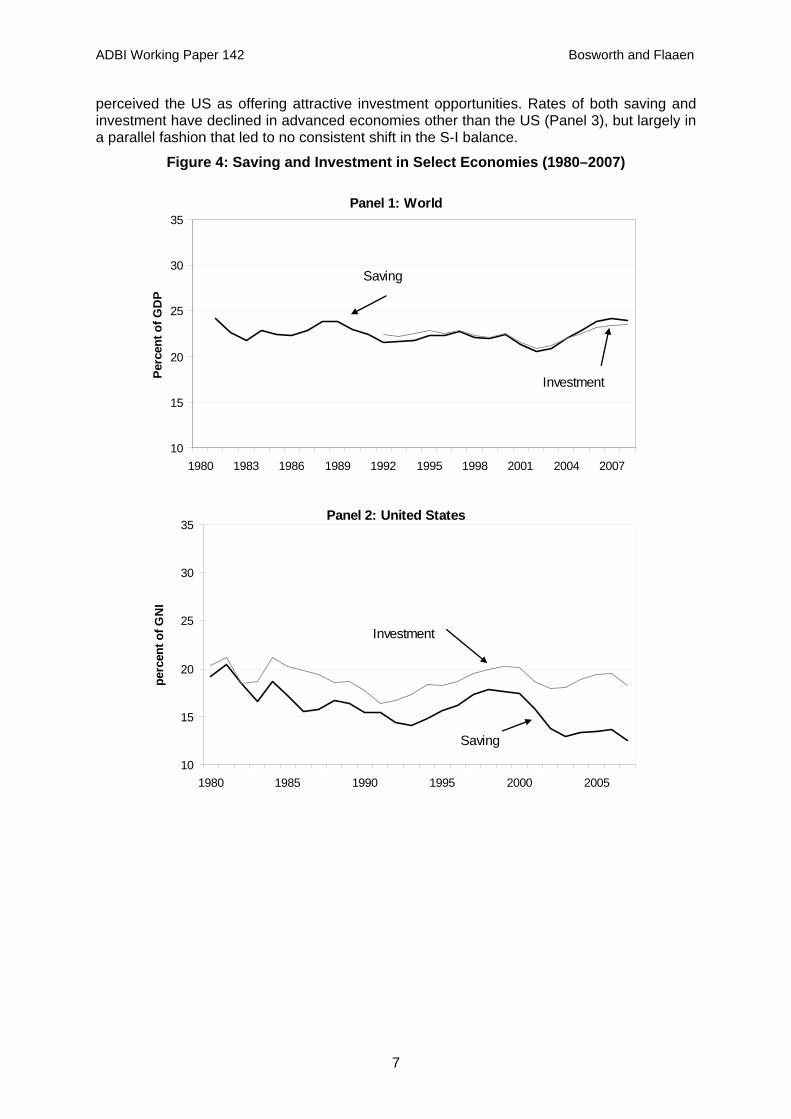
Regional saving and investment patterns are summarized in Figure 4. At the global level (Panel 1), saving has risen from the lows of the 2002 recession; the growing importance of the (high saving) developing countries is enough to offset a declining rate of saving in the advanced economies. The 2007 rate is about 1% of GDP above the average of the 1990s. The S-I balance of the US, shown in Panel 2, indicates a longstanding decline in saving that began in the early 1980s. A portion of the recent drop can be traced to the re-occurrence of sustained negative saving in the public sector, but the private saving rate has also remained at historically low levels. On the other hand, the US has continued to offer very good investment opportunities—superior to those of most other industrial countries—and the investment rate shows no secular pattern of decline comparable to that for saving. The result has been heavy reliance on foreign capital inflows, but with few strains as foreigners also 6 One of the most developed models is presented in Caballero, Farhi, and Gourinchas (2008). The perspective of
excess saving outside the US as the primary cause of low interest rates is echoed in the comments of Lawrence Summers, Bradford DeLong, and Richard Cooper at the 2008 conference where the paper of Caballero and others was presented. See also Cooper (2008).
7 In some respects, it is reminiscent of the debate between the US and Japan on the origins of the two countries’ external imbalances in the 1980s. In that period, US economists emphasized excess saving and a current account surplus in Japan as a primary cause of the external imbalances between the two countries, whereas Japanese policymakers pointed to a large public sector deficit and declining private saving in the US.
6
ADBI Working Paper 142 Bosworth and Flaaen
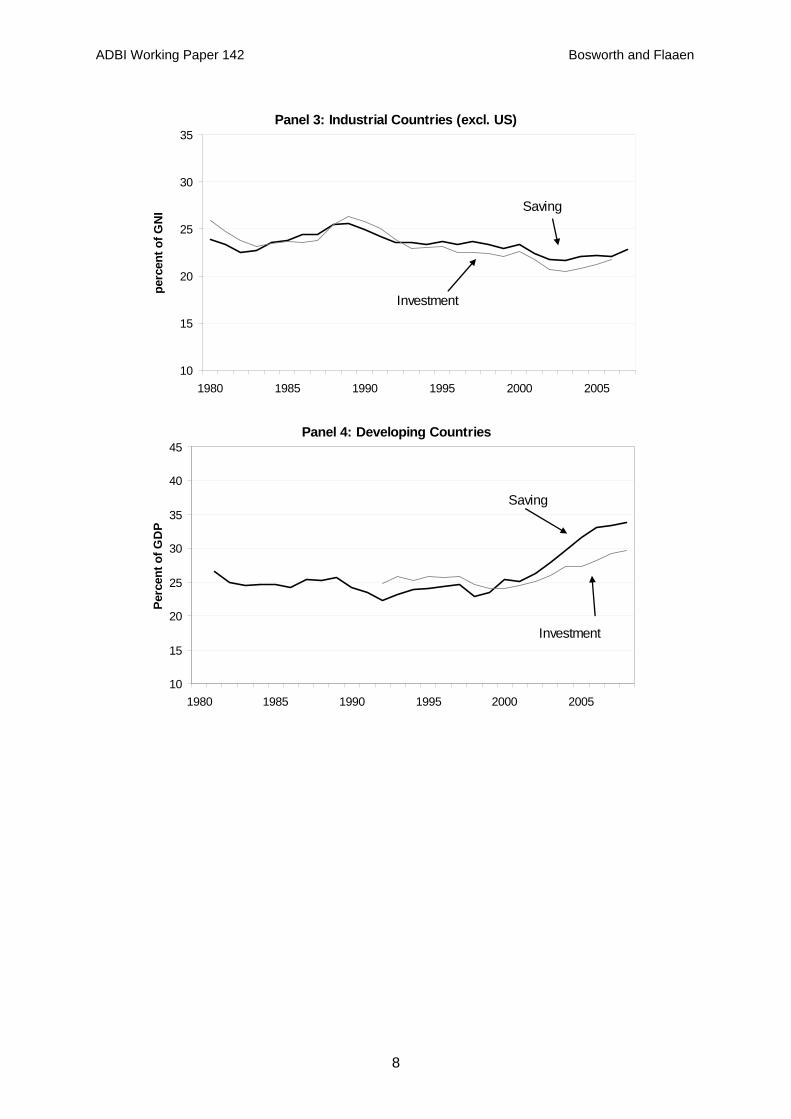
perceived the US as offering attractive investment opportunities. Rates of both saving and investment have declined in advanced economies other than the US (Panel 3), but largely in a parallel fashion that led to no consistent shift in the S-I balance.
Figure 4: Saving and Investment in Select Economies (1980–2007)
Panel 1: World
10
15
20
25
30
35
1980 1983 1986 1989 1992 1995 1998 2001 2004 2007
Perc
ent o
f GD
P
Investment
Saving
Panel 2: United States
10
15
20
25
30
35
1980 1985 1990 1995 2000 2005
perc
ent o
f GN
I
Saving
Investment
7
ADBI Working Paper 142 Bosworth and Flaaen
Panel 3: Industrial Countries (excl. US)
10
15
20
25
30
35
1980 1985 1990 1995 2000 2005
perc
ent o
f GN
I Saving
Investment
Panel 4: Developing Countries
10
15
20
25
30
35
40
45
1980 1985 1990 1995 2000 2005
Perc
ent o
f GD
P
Saving
Investment
8
ADBI Working Paper 142 Bosworth and Flaaen
Panel 5: Emerging Asia
10
15
20
25
30
35
40
45
1980 1985 1990 1995 2000 2005
perc
ent o
f GN
ISaving
Investment
Panel 6: Middle East
10
15
20
25
30
35
40
45
1980 1985 1990 1995 2000 2005
perc
ent o
f GD
P
Saving
Investment
Source: OECD (2009a), OECD (2009c), World Bank (2009), and various country statistical agencies.
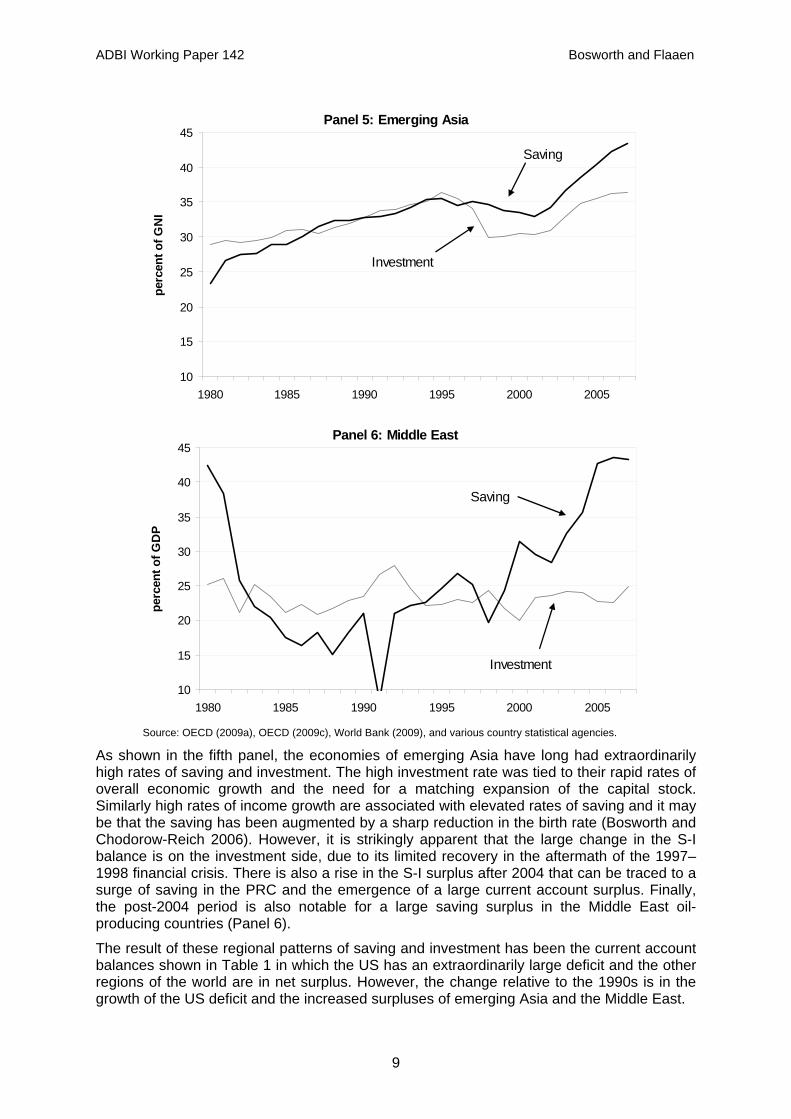
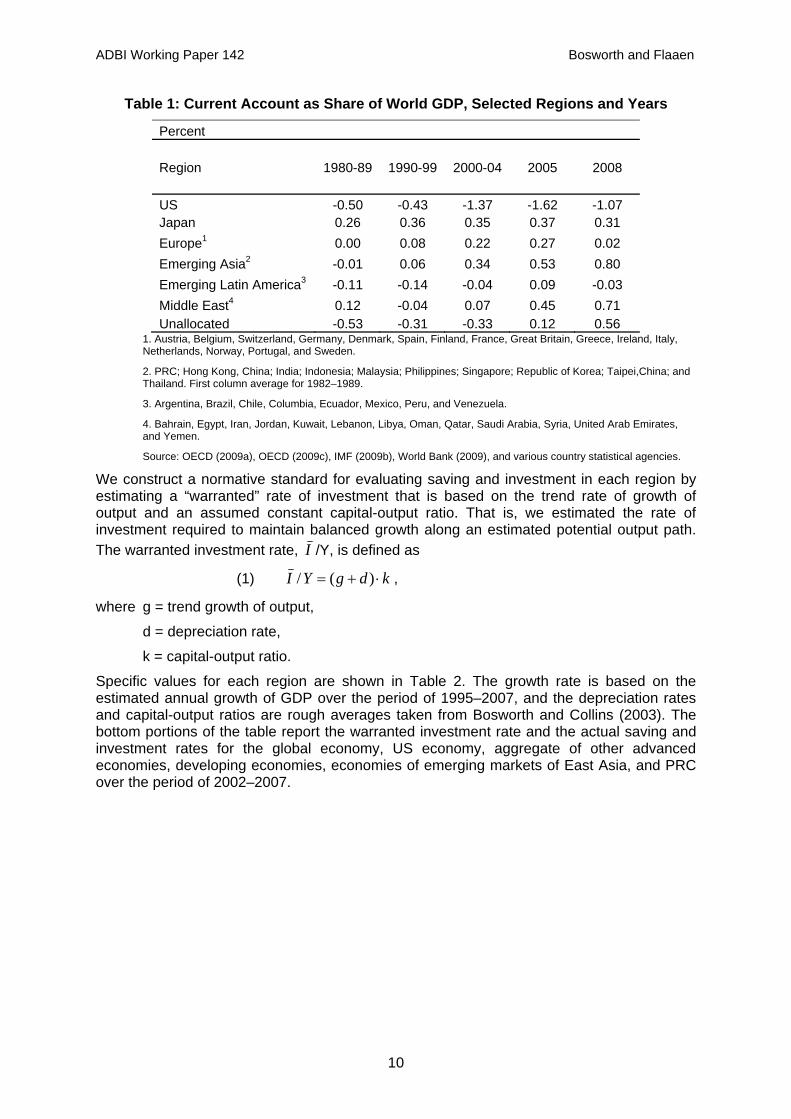
As shown in the fifth panel, the economies of emerging Asia have long had extraordinarily high rates of saving and investment. The high investment rate was tied to their rapid rates of overall economic growth and the need for a matching expansion of the capital stock. Similarly high rates of income growth are associated with elevated rates of saving and it may be that the saving has been augmented by a sharp reduction in the birth rate (Bosworth and Chodorow-Reich 2006). However, it is strikingly apparent that the large change in the S-I balance is on the investment side, due to its limited recovery in the aftermath of the 1997–1998 financial crisis. There is also a rise in the S-I surplus after 2004 that can be traced to a surge of saving in the PRC and the emergence of a large current account surplus. Finally, the post-2004 period is also notable for a large saving surplus in the Middle East oil-producing countries (Panel 6).
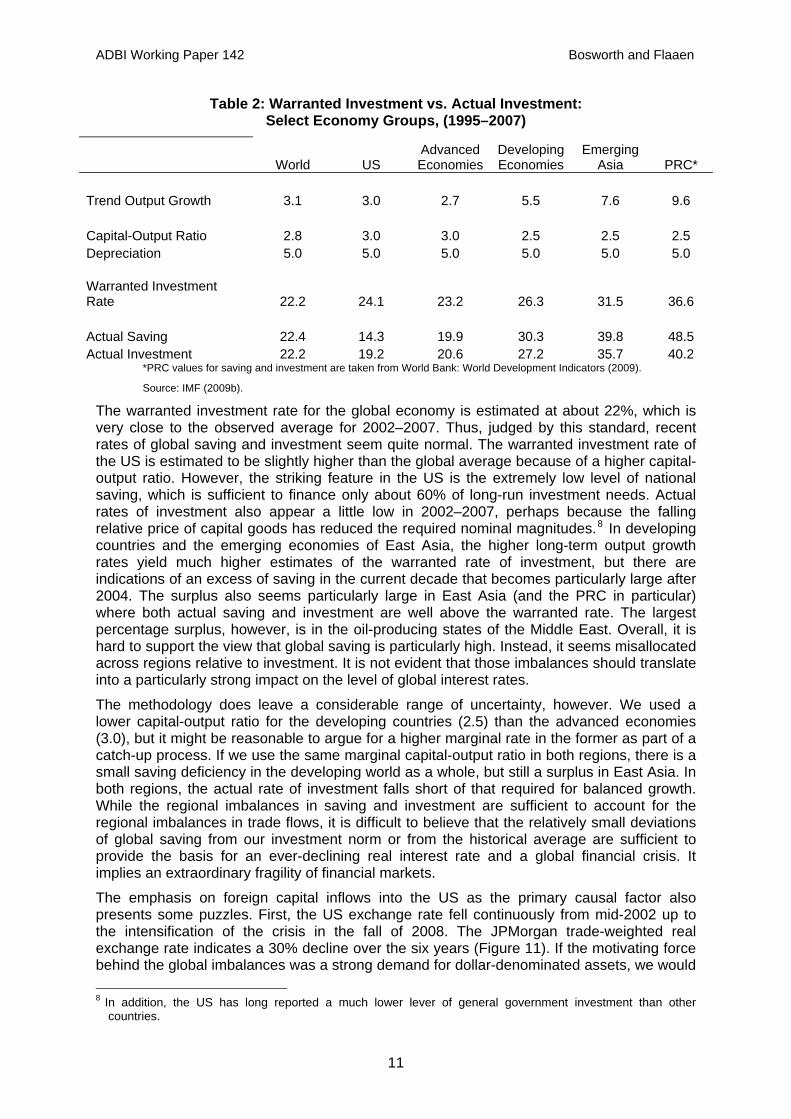
The result of these regional patterns of saving and investment has been the current account balances shown in Table 1 in which the US has an extraordinarily large deficit and the other regions of the world are in net surplus. However, the change relative to the 1990s is in the growth of the US deficit and the increased surpluses of emerging Asia and the Middle East.
9
ADBI Working Paper 142 Bosworth and Flaaen
Table 1: Current Account as Share of World GDP, Selected Regions and Years
Percent Region 1980-89 1990-99 2000-04 2005 2008 US -0.50 -0.43 -1.37 -1.62 -1.07 Japan 0.26 0.36 0.35 0.37 0.31 Europe1 0.00 0.08 0.22 0.27 0.02 Emerging Asia2 -0.01 0.06 0.34 0.53 0.80 Emerging Latin America3 -0.11 -0.14 -0.04 0.09 -0.03 Middle East4 0.12 -0.04 0.07 0.45 0.71 Unallocated -0.53 -0.31 -0.33 0.12 0.56
1. Austria, Belgium, Switzerland, Germany, Denmark, Spain, Finland, France, Great Britain, Greece, Ireland, Italy, Netherlands, Norway, Portugal, and Sweden.
2. PRC; Hong Kong, China; India; Indonesia; Malaysia; Philippines; Singapore; Republic of Korea; Taipei,China; and Thailand. First column average for 1982–1989.
3. Argentina, Brazil, Chile, Columbia, Ecuador, Mexico, Peru, and Venezuela.
4. Bahrain, Egypt, Iran, Jordan, Kuwait, Lebanon, Libya, Oman, Qatar, Saudi Arabia, Syria, United Arab Emirates, and Yemen.
Source: OECD (2009a), OECD (2009c), IMF (2009b), World Bank (2009), and various country statistical agencies.
We construct a normative standard for evaluating saving and investment in each region by estimating a “warranted” rate of investment that is based on the trend rate of growth of output and an assumed constant capital-output ratio. That is, we estimated the rate of investment required to maintain balanced growth along an estimated potential output path. The warranted investment rate, I /Y, is defined as
(1) kdgY ⋅+= )(/I ,
where g = trend growth of output,
d = depreciation rate,
k = capital-output ratio.
Specific values for each region are shown in Table 2. The growth rate is based on the estimated annual growth of GDP over the period of 1995–2007, and the depreciation rates and capital-output ratios are rough averages taken from Bosworth and Collins (2003). The bottom portions of the table report the warranted investment rate and the actual saving and investment rates for the global economy, US economy, aggregate of other advanced economies, developing economies, economies of emerging markets of East Asia, and PRC over the period of 2002–2007.
10
ADBI Working Paper 142 Bosworth and Flaaen
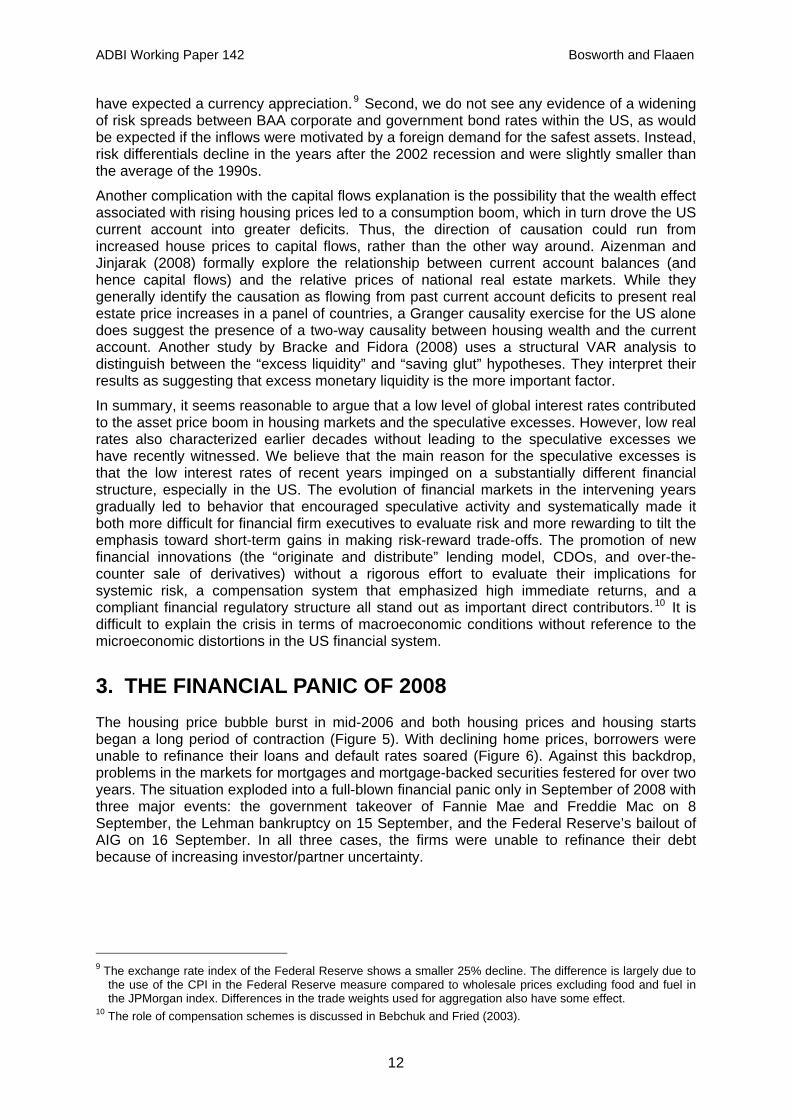
Table 2: Warranted Investment vs. Actual Investment: Select Economy Groups, (1995–2007)
World US Advanced Economies
Developing Economies
Emerging Asia PRC*
Trend Output Growth 3.1 3.0 2.7 5.5 7.6 9.6 Capital-Output Ratio 2.8 3.0 3.0 2.5 2.5 2.5 Depreciation 5.0 5.0 5.0 5.0 5.0 5.0 Warranted Investment Rate 22.2 24.1 23.2 26.3 31.5 36.6 Actual Saving 22.4 14.3 19.9 30.3 39.8 48.5 Actual Investment 22.2 19.2 20.6 27.2 35.7 40.2
*PRC values for saving and investment are taken from World Bank: World Development Indicators (2009).
Source: IMF (2009b).
The warranted investment rate for the global economy is estimated at about 22%, which is very close to the observed average for 2002–2007. Thus, judged by this standard, recent rates of global saving and investment seem quite normal. The warranted investment rate of the US is estimated to be slightly higher than the global average because of a higher capital-output ratio. However, the striking feature in the US is the extremely low level of national saving, which is sufficient to finance only about 60% of long-run investment needs. Actual rates of investment also appear a little low in 2002–2007, perhaps because the falling relative price of capital goods has reduced the required nominal magnitudes.8 In developing countries and the emerging economies of East Asia, the higher long-term output growth rates yield much higher estimates of the warranted rate of investment, but there are indications of an excess of saving in the current decade that becomes particularly large after 2004. The surplus also seems particularly large in East Asia (and the PRC in particular) where both actual saving and investment are well above the warranted rate. The largest percentage surplus, however, is in the oil-producing states of the Middle East. Overall, it is hard to support the view that global saving is particularly high. Instead, it seems misallocated across regions relative to investment. It is not evident that those imbalances should translate into a particularly strong impact on the level of global interest rates.
The methodology does leave a considerable range of uncertainty, however. We used a lower capital-output ratio for the developing countries (2.5) than the advanced economies (3.0), but it might be reasonable to argue for a higher marginal rate in the former as part of a catch-up process. If we use the same marginal capital-output ratio in both regions, there is a small saving deficiency in the developing world as a whole, but still a surplus in East Asia. In both regions, the actual rate of investment falls short of that required for balanced growth. While the regional imbalances in saving and investment are sufficient to account for the regional imbalances in trade flows, it is difficult to believe that the relatively small deviations of global saving from our investment norm or from the historical average are sufficient to provide the basis for an ever-declining real interest rate and a global financial crisis. It implies an extraordinary fragility of financial markets.
The emphasis on foreign capital inflows into the US as the primary causal factor also presents some puzzles. First, the US exchange rate fell continuously from mid-2002 up to the intensification of the crisis in the fall of 2008. The JPMorgan trade-weighted real exchange rate indicates a 30% decline over the six years (Figure 11). If the motivating force behind the global imbalances was a strong demand for dollar-denominated assets, we would 8 In addition, the US has long reported a much lower lever of general government investment than other
countries.
11
ADBI Working Paper 142 Bosworth and Flaaen
have expected a currency appreciation.9 Second, we do not see any evidence of a widening of risk spreads between BAA corporate and government bond rates within the US, as would be expected if the inflows were motivated by a foreign demand for the safest assets. Instead, risk differentials decline in the years after the 2002 recession and were slightly smaller than the average of the 1990s.
Another complication with the capital flows explanation is the possibility that the wealth effect associated with rising housing prices led to a consumption boom, which in turn drove the US current account into greater deficits. Thus, the direction of causation could run from increased house prices to capital flows, rather than the other way around. Aizenman and Jinjarak (2008) formally explore the relationship between current account balances (and hence capital flows) and the relative prices of national real estate markets. While they generally identify the causation as flowing from past current account deficits to present real estate price increases in a panel of countries, a Granger causality exercise for the US alone does suggest the presence of a two-way causality between housing wealth and the current account. Another study by Bracke and Fidora (2008) uses a structural VAR analysis to distinguish between the “excess liquidity” and “saving glut” hypotheses. They interpret their results as suggesting that excess monetary liquidity is the more important factor.
In summary, it seems reasonable to argue that a low level of global interest rates contributed to the asset price boom in housing markets and the speculative excesses. However, low real rates also characterized earlier decades without leading to the speculative excesses we have recently witnessed. We believe that the main reason for the speculative excesses is that the low interest rates of recent years impinged on a substantially different financial structure, especially in the US. The evolution of financial markets in the intervening years gradually led to behavior that encouraged speculative activity and systematically made it both more difficult for financial firm executives to evaluate risk and more rewarding to tilt the emphasis toward short-term gains in making risk-reward trade-offs. The promotion of new financial innovations (the “originate and distribute” lending model, CDOs, and over-the-counter sale of derivatives) without a rigorous effort to evaluate their implications for systemic risk, a compensation system that emphasized high immediate returns, and a compliant financial regulatory structure all stand out as important direct contributors.10 It is difficult to explain the crisis in terms of macroeconomic conditions without reference to the microeconomic distortions in the US financial system.
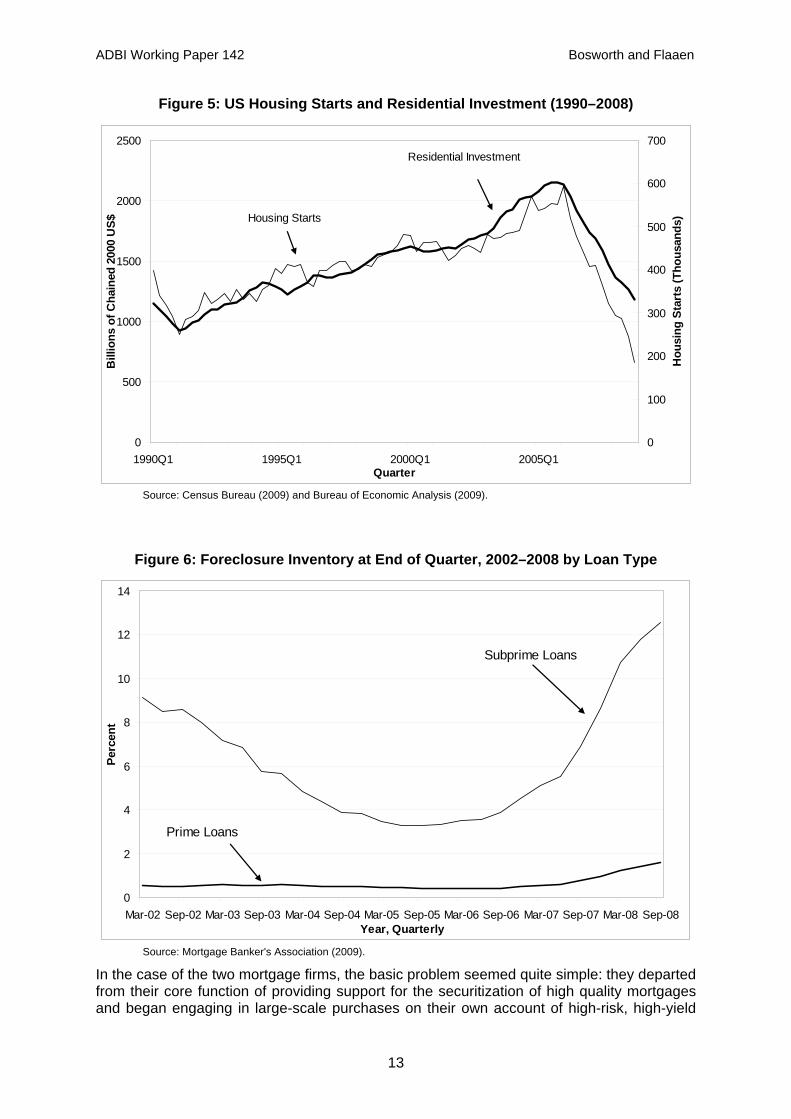
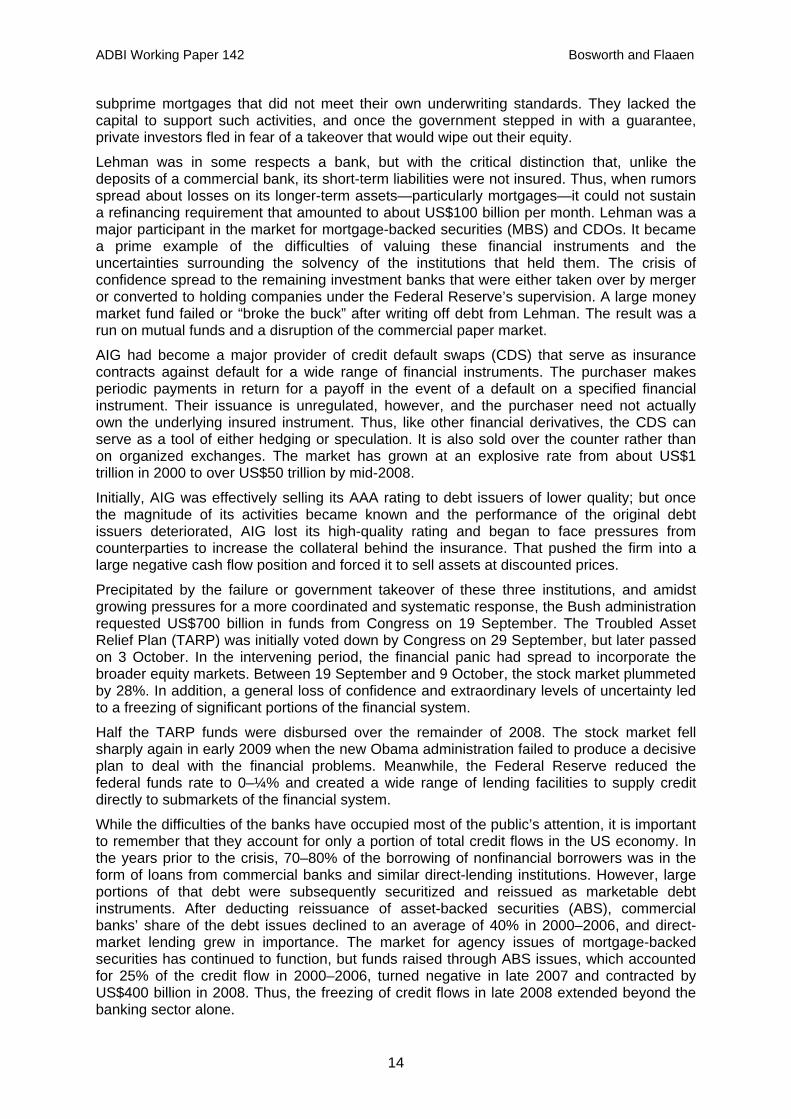
3. THE FINANCIAL PANIC OF 2008 The housing price bubble burst in mid-2006 and both housing prices and housing starts began a long period of contraction (Figure 5). With declining home prices, borrowers were unable to refinance their loans and default rates soared (Figure 6). Against this backdrop, problems in the markets for mortgages and mortgage-backed securities festered for over two years. The situation exploded into a full-blown financial panic only in September of 2008 with three major events: the government takeover of Fannie Mae and Freddie Mac on 8 September, the Lehman bankruptcy on 15 September, and the Federal Reserve’s bailout of AIG on 16 September. In all three cases, the firms were unable to refinance their debt because of increasing investor/partner uncertainty.
9 The exchange rate index of the Federal Reserve shows a smaller 25% decline. The difference is largely due to
the use of the CPI in the Federal Reserve measure compared to wholesale prices excluding food and fuel in the JPMorgan index. Differences in the trade weights used for aggregation also have some effect.
10 The role of compensation schemes is discussed in Bebchuk and Fried (2003).
12
ADBI Working Paper 142 Bosworth and Flaaen
Figure 5: US Housing Starts and Residential Investment (1990–2008)
0
500
1000
1500
2000
2500
1990Q1 1995Q1 2000Q1 2005Q1 Quarter
Bill
ions
of C
hain
ed 2
000
US$
0
100
200
300
400
500
600
700
Hou
sing
Sta
rts
(Tho
usan
ds)Housing Starts
Residential Investment
Source: Census Bureau (2009) and Bureau of Economic Analysis (2009).
Figure 6: Foreclosure Inventory at End of Quarter, 2002–2008 by Loan Type
0
2
4
6
8
10
12
Mar-02 Sep-02 Mar-03 Sep-03 Mar-04 Sep-04 Mar-05 Sep-05 Mar-06 Sep-06 Mar-07 Sep-07 Mar-08 Sep-08Year, Quarterly
Perc
ent
14
Subprime Loans
Prime Loans
Source: Mortgage Banker's Association (2009).
In the case of the two mortgage firms, the basic problem seemed quite simple: they departed from their core function of providing support for the securitization of high quality mortgages and began engaging in large-scale purchases on their own account of high-risk, high-yield
13
ADBI Working Paper 142 Bosworth and Flaaen
subprime mortgages that did not meet their own underwriting standards. They lacked the capital to support such activities, and once the government stepped in with a guarantee, private investors fled in fear of a takeover that would wipe out their equity.
Lehman was in some respects a bank, but with the critical distinction that, unlike the deposits of a commercial bank, its short-term liabilities were not insured. Thus, when rumors spread about losses on its longer-term assets—particularly mortgages—it could not sustain a refinancing requirement that amounted to about US$100 billion per month. Lehman was a major participant in the market for mortgage-backed securities (MBS) and CDOs. It became a prime example of the difficulties of valuing these financial instruments and the uncertainties surrounding the solvency of the institutions that held them. The crisis of confidence spread to the remaining investment banks that were either taken over by merger or converted to holding companies under the Federal Reserve’s supervision. A large money market fund failed or “broke the buck” after writing off debt from Lehman. The result was a run on mutual funds and a disruption of the commercial paper market.
AIG had become a major provider of credit default swaps (CDS) that serve as insurance contracts against default for a wide range of financial instruments. The purchaser makes periodic payments in return for a payoff in the event of a default on a specified financial instrument. Their issuance is unregulated, however, and the purchaser need not actually own the underlying insured instrument. Thus, like other financial derivatives, the CDS can serve as a tool of either hedging or speculation. It is also sold over the counter rather than on organized exchanges. The market has grown at an explosive rate from about US$1 trillion in 2000 to over US$50 trillion by mid-2008.
Initially, AIG was effectively selling its AAA rating to debt issuers of lower quality; but once the magnitude of its activities became known and the performance of the original debt issuers deteriorated, AIG lost its high-quality rating and began to face pressures from counterparties to increase the collateral behind the insurance. That pushed the firm into a large negative cash flow position and forced it to sell assets at discounted prices.
Precipitated by the failure or government takeover of these three institutions, and amidst growing pressures for a more coordinated and systematic response, the Bush administration requested US$700 billion in funds from Congress on 19 September. The Troubled Asset Relief Plan (TARP) was initially voted down by Congress on 29 September, but later passed on 3 October. In the intervening period, the financial panic had spread to incorporate the broader equity markets. Between 19 September and 9 October, the stock market plummeted by 28%. In addition, a general loss of confidence and extraordinary levels of uncertainty led to a freezing of significant portions of the financial system.
Half the TARP funds were disbursed over the remainder of 2008. The stock market fell sharply again in early 2009 when the new Obama administration failed to produce a decisive plan to deal with the financial problems. Meanwhile, the Federal Reserve reduced the federal funds rate to 0–¼% and created a wide range of lending facilities to supply credit directly to submarkets of the financial system.
While the difficulties of the banks have occupied most of the public’s attention, it is important to remember that they account for only a portion of total credit flows in the US economy. In the years prior to the crisis, 70–80% of the borrowing of nonfinancial borrowers was in the form of loans from commercial banks and similar direct-lending institutions. However, large portions of that debt were subsequently securitized and reissued as marketable debt instruments. After deducting reissuance of asset-backed securities (ABS), commercial banks’ share of the debt issues declined to an average of 40% in 2000–2006, and direct-market lending grew in importance. The market for agency issues of mortgage-backed securities has continued to function, but funds raised through ABS issues, which accounted for 25% of the credit flow in 2000–2006, turned negative in late 2007 and contracted by US$400 billion in 2008. Thus, the freezing of credit flows in late 2008 extended beyond the banking sector alone.
14
ADBI Working Paper 142 Bosworth and Flaaen
4. REAL SECTOR IMPLICATIONS Up to September 2008, few forecasters anticipated a serious economic decline. The general expectation was that the fall in housing construction would be offset by an expansion of exports, as a declining dollar would strengthen the country’s competitive position. For example, the Congressional Budget Office (CBO) published a budget update in early September that reflected its survey of a wide range of private economic forecasts. GDP growth was estimated to be slightly above 1% annually in 2008 and 2009, and a recovery with a 3.6% growth rate was projected for 2010. In the aftermath of the September financial turmoil, GDP declined at an annual rate of 6% and is now expected to continue to fall throughout most of 2009. In its January 2009 assessment, the CBO reduced its projected level of GDP by 4% for 2009 and 6% for 2010 and 2011. Similar large revisions are evident in the IMF projections for the global economy. Clearly the events of September had a very large impact on expectations of the future course of the economy.
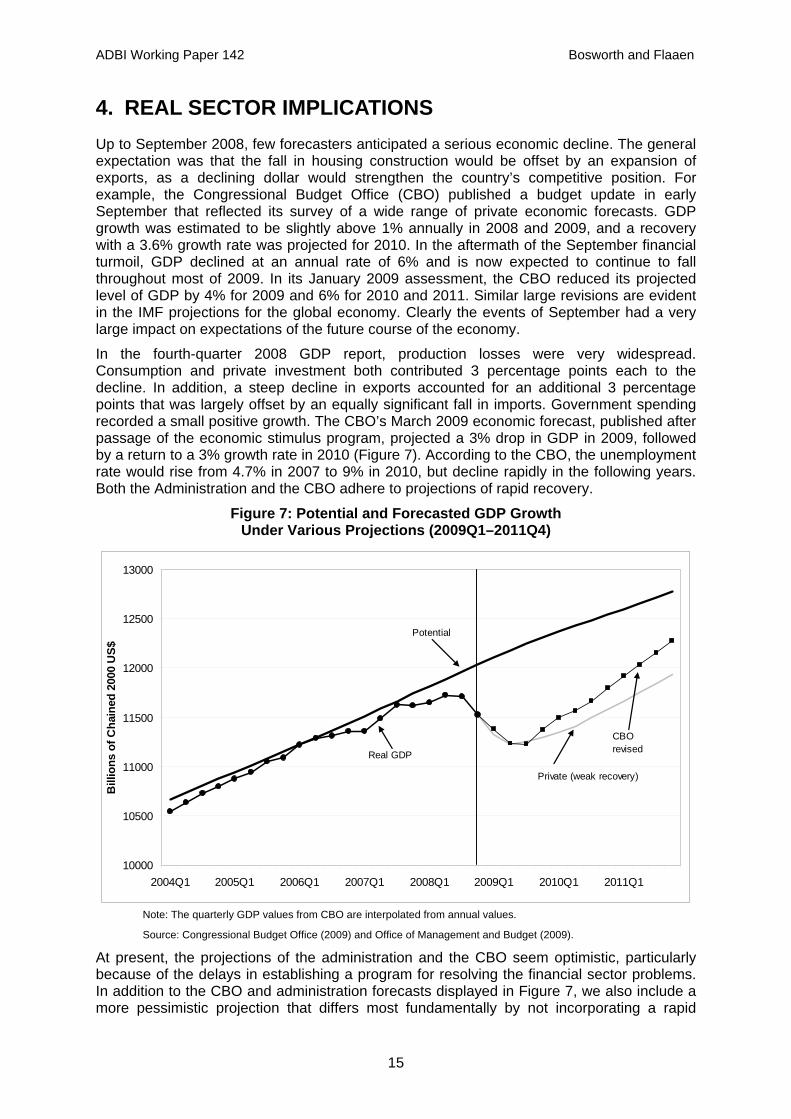
In the fourth-quarter 2008 GDP report, production losses were very widespread. Consumption and private investment both contributed 3 percentage points each to the decline. In addition, a steep decline in exports accounted for an additional 3 percentage points that was largely offset by an equally significant fall in imports. Government spending recorded a small positive growth. The CBO’s March 2009 economic forecast, published after passage of the economic stimulus program, projected a 3% drop in GDP in 2009, followed by a return to a 3% growth rate in 2010 (Figure 7). According to the CBO, the unemployment rate would rise from 4.7% in 2007 to 9% in 2010, but decline rapidly in the following years. Both the Administration and the CBO adhere to projections of rapid recovery.
Figure 7: Potential and Forecasted GDP Growth Under Various Projections (2009Q1–2011Q4)
10000
10500
11000
11500
12000
2004Q1 2005Q1 2006Q1 2007Q1 2008Q1 2009Q1 2010Q1 2011Q1
Bill
ions
of C
hain
ed 2
000
US$
12500
13000
Real GDP
CBO revised
Private (weak recovery)
Potential
Note: The quarterly GDP values from CBO are interpolated from annual values.
Source: Congressional Budget Office (2009) and Office of Management and Budget (2009).
At present, the projections of the administration and the CBO seem optimistic, particularly because of the delays in establishing a program for resolving the financial sector problems. In addition to the CBO and administration forecasts displayed in Figure 7, we also include a more pessimistic projection that differs most fundamentally by not incorporating a rapid
15
ADBI Working Paper 142 Bosworth and Flaaen
recovery phase. While past recessions have tended to be V-shaped, with a sharp contraction of economic activity followed by an equally sharp expansion, recoveries from financial crises seem more gradual and are normally stretched out over several years (Reinhart and Rogoff 2008).
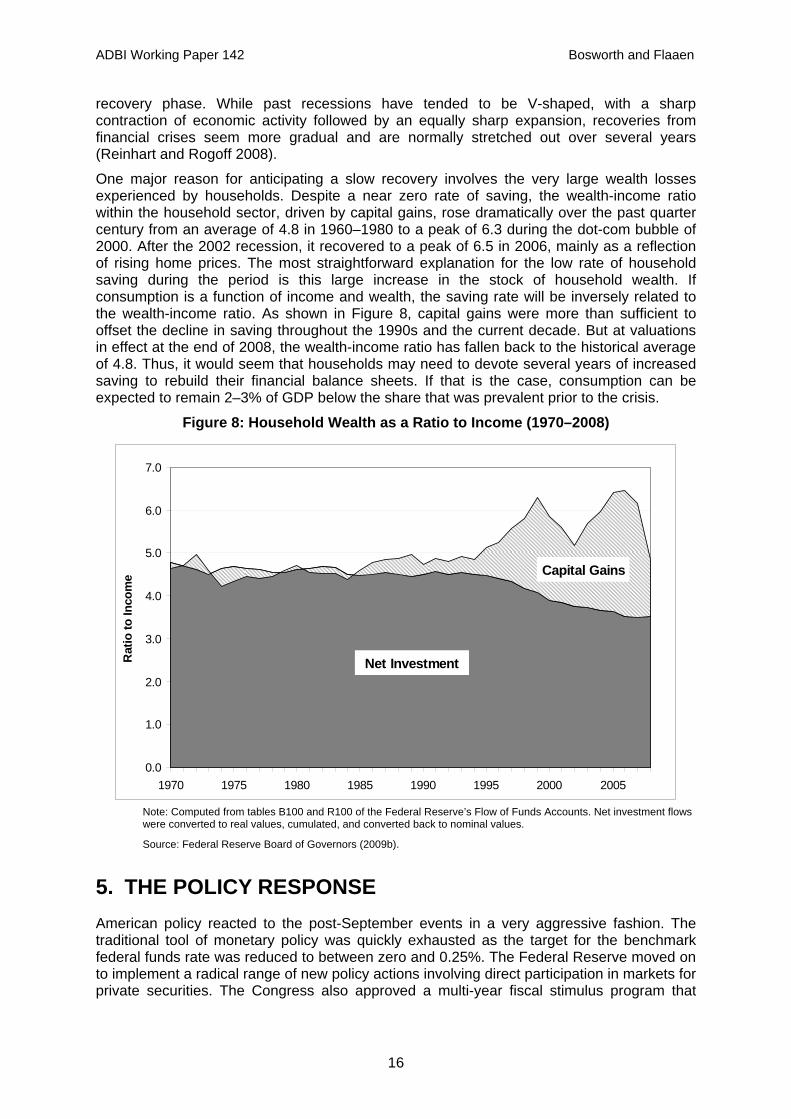
One major reason for anticipating a slow recovery involves the very large wealth losses experienced by households. Despite a near zero rate of saving, the wealth-income ratio within the household sector, driven by capital gains, rose dramatically over the past quarter century from an average of 4.8 in 1960–1980 to a peak of 6.3 during the dot-com bubble of 2000. After the 2002 recession, it recovered to a peak of 6.5 in 2006, mainly as a reflection of rising home prices. The most straightforward explanation for the low rate of household saving during the period is this large increase in the stock of household wealth. If consumption is a function of income and wealth, the saving rate will be inversely related to the wealth-income ratio. As shown in Figure 8, capital gains were more than sufficient to offset the decline in saving throughout the 1990s and the current decade. But at valuations in effect at the end of 2008, the wealth-income ratio has fallen back to the historical average of 4.8. Thus, it would seem that households may need to devote several years of increased saving to rebuild their financial balance sheets. If that is the case, consumption can be expected to remain 2–3% of GDP below the share that was prevalent prior to the crisis.
Figure 8: Household Wealth as a Ratio to Income (1970–2008)
0.0
1.0
2.0
3.0
4.0
5.0
6.0
7.0
1970 1975 1980 1985 1990 1995 2000 2005
Rat
io to
Inco
me
Net Investment
Capital Gains
Note: Computed from tables B100 and R100 of the Federal Reserve’s Flow of Funds Accounts. Net investment flows were converted to real values, cumulated, and converted back to nominal values.
Source: Federal Reserve Board of Governors (2009b).
5. THE POLICY RESPONSE American policy reacted to the post-September events in a very aggressive fashion. The traditional tool of monetary policy was quickly exhausted as the target for the benchmark federal funds rate was reduced to between zero and 0.25%. The Federal Reserve moved on to implement a radical range of new policy actions involving direct participation in markets for private securities. The Congress also approved a multi-year fiscal stimulus program that
16
ADBI Working Paper 142 Bosworth and Flaaen
amounts to about 2% of GDP in 2009 and 2010 before tailing off in later years. However, the government has stumbled in its efforts to clean up and restore the financial system.
Monetary Policy. The Federal Reserve began to ease interest rates in September 2007, and by the end of 2008, the federal funds rate had been effectively reduced to zero. However, even before the Bear-Stearns bankruptcy in March 2008, the Federal Reserve began to expand its operations into non-traditional areas that came to involve the direct supply of credit to a wide range of financial markets. Most notable are: (i) a Commercial Paper Funding Facility (CPFF), which finances the purchase of commercial paper directly from eligible issuers; (ii) the Term Auction Facility (TAF), which allows banks and other financial institutions to pledge collateral in exchange for a loan; and (iii) the direct purchase of mortgage-backed securities issued by the three government-sponsored enterprises. In addition, the Federal Reserve has recently become active in restoring the operation of securitization markets through the Term Asset-Backed Securities Loan Facility (TALF).
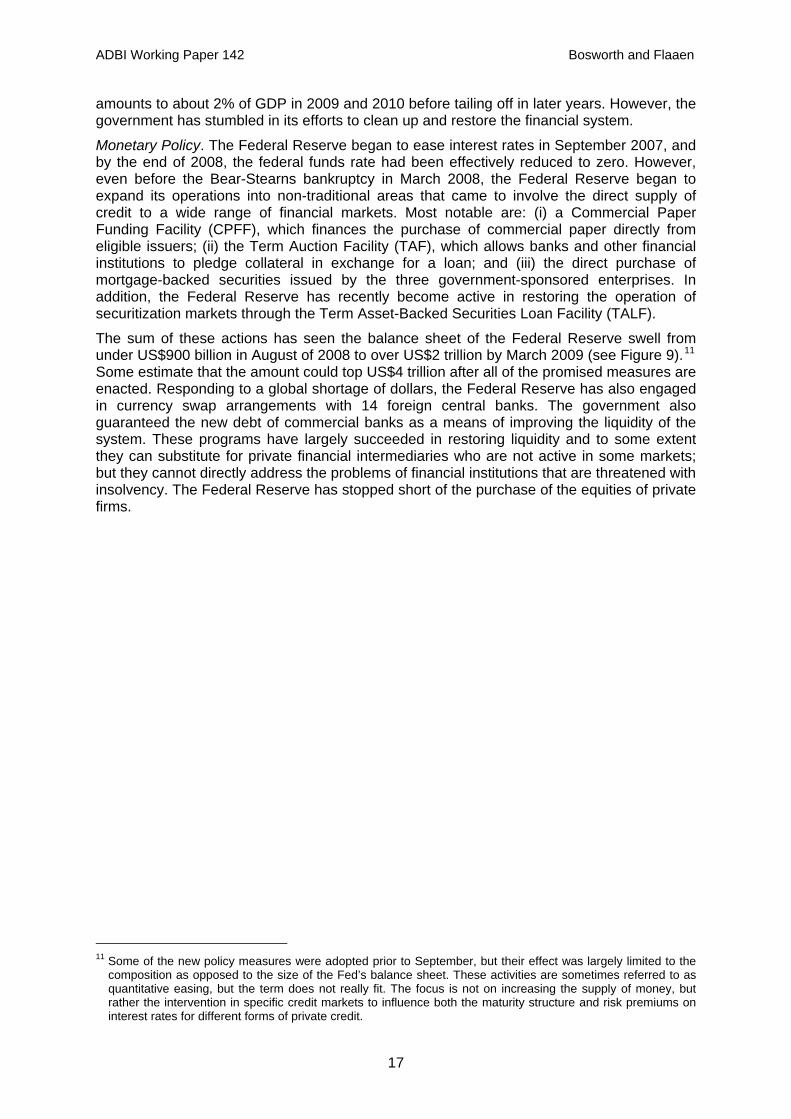
The sum of these actions has seen the balance sheet of the Federal Reserve swell from under US$900 billion in August of 2008 to over US$2 trillion by March 2009 (see Figure 9).11 Some estimate that the amount could top US$4 trillion after all of the promised measures are enacted. Responding to a global shortage of dollars, the Federal Reserve has also engaged in currency swap arrangements with 14 foreign central banks. The government also guaranteed the new debt of commercial banks as a means of improving the liquidity of the system. These programs have largely succeeded in restoring liquidity and to some extent they can substitute for private financial intermediaries who are not active in some markets; but they cannot directly address the problems of financial institutions that are threatened with insolvency. The Federal Reserve has stopped short of the purchase of the equities of private firms.
11 Some of the new policy measures were adopted prior to September, but their effect was largely limited to the
composition as opposed to the size of the Fed’s balance sheet. These activities are sometimes referred to as quantitative easing, but the term does not really fit. The focus is not on increasing the supply of money, but rather the intervention in specific credit markets to influence both the maturity structure and risk premiums on interest rates for different forms of private credit.
17
ADBI Working Paper 142 Bosworth and Flaaen
Figure 9: Balance Sheet of the Federal Reserve (July 2007–March 2009)
0
500
1000
1500
2000
2500
25 Jul 2007 12 Dec 2007 30 Apr 2008 17 Sep 2008 04 Feb 2009
Bill
ions
of U
S$
Other*
Central BankSwaps
Commercial Paper
TAF
Mortgage-BackedSecurities
Treasury andAgency Securities
*Other is composed of "other assets", "float" plus the discount window, primary dealer and other broker-dealer credit, asset-backed commercial paper money market mutual fund liquidity facility, credit extended to AIG, the Term Asset-Backed Securities Loan Facility, and equity holdings for AIG and Bear-Stearns.
Treasury securities include repurchase agreements.
Source: Federal Reserve Board of Governors (2009a)
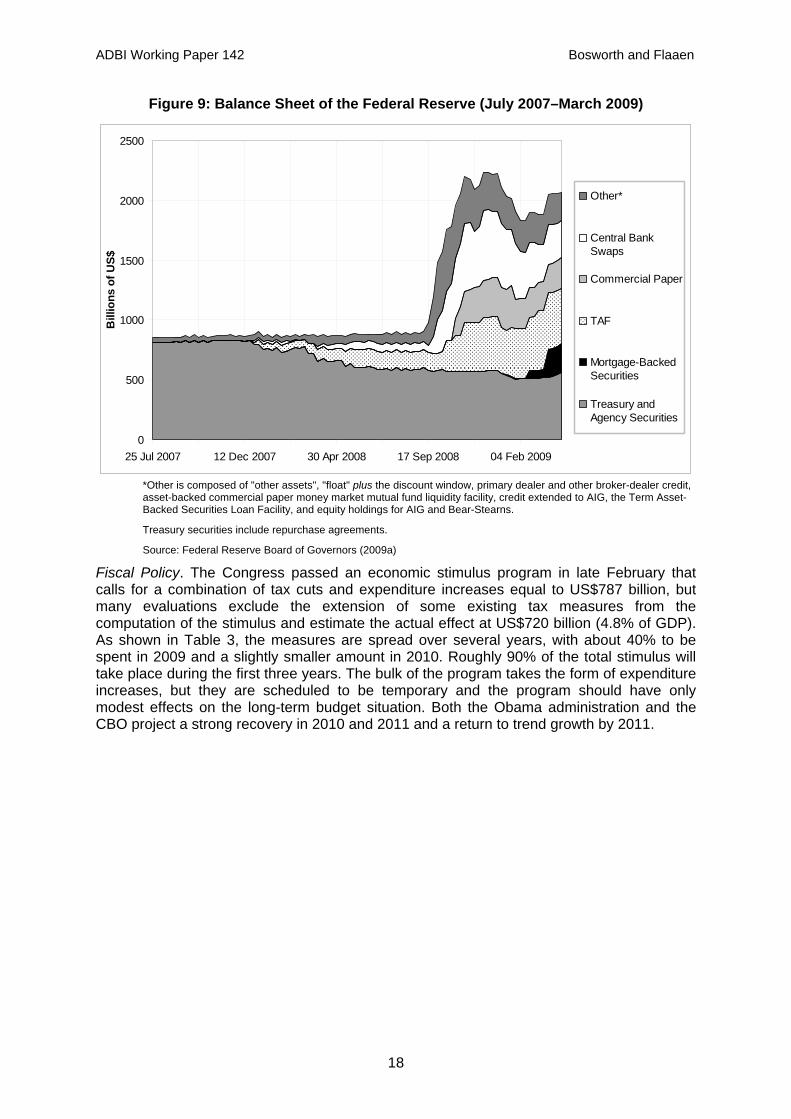
Fiscal Policy. The Congress passed an economic stimulus program in late February that calls for a combination of tax cuts and expenditure increases equal to US$787 billion, but many evaluations exclude the extension of some existing tax measures from the computation of the stimulus and estimate the actual effect at US$720 billion (4.8% of GDP). As shown in Table 3, the measures are spread over several years, with about 40% to be spent in 2009 and a slightly smaller amount in 2010. Roughly 90% of the total stimulus will take place during the first three years. The bulk of the program takes the form of expenditure increases, but they are scheduled to be temporary and the program should have only modest effects on the long-term budget situation. Both the Obama administration and the CBO project a strong recovery in 2010 and 2011 and a return to trend growth by 2011.
18
ADBI Working Paper 142 Bosworth and Flaaen
Table 3: Schedule and Composition of 2009 US Fiscal Stimulus
2009 2010 2011 2012 and beyond Totala
Total 283 259 121 56 719 (as percent of GDP) 2.0 1.8 0.8 0.4 5.0 Revenue measures 99 116 37 -33 219
Individual income 37 80 32 Corporate income 57 32 -2 Other 5 4 7
Expenditure measures 184 143 84 89 500
Infrastructure and other 32 47 47 78 204 Safety nets 77 14 5 7 103 State aid and education 75 82 32 3 192
a Total reported amount excludes the temporary "patch" of approximately US$68 billion providing taxpayer relief with respect to the Alternative Minimum Tax. This amount is included in the baseline stimulus of US$787 billion reported by the CBO.
Source: IMF (2009a) and CBO (2009).
Much of the debate over the fiscal stimulus has centered on its relative composition of tax reductions, transfer payments, and infrastructure projects. Infrastructure spending is believed to have the largest multiplier effects, but historically the projects are subject to long lags. Tax cuts can be enacted in a short time period, but some economists argue that the stimulus effects of temporary tax measures are particularly small. 12 This issue was taken up again in two important studies that tracked the effects of the 2002 tax stimulus (Johnson, Parker, and Souleles 2006; Agarwal, Liu, and Souleles 2007). Using micro data, both of these studies concluded that the spending of low-income and credit-constrained households responded strongly to the tax rebates. Because the US downturn is expected to last for several years, the lag in expenditure programs was a less effective argument than in the past, and the stimulus measure that emerged from the Congress included a very diversified set of programs, some with short lags and others stretching several years into the future.
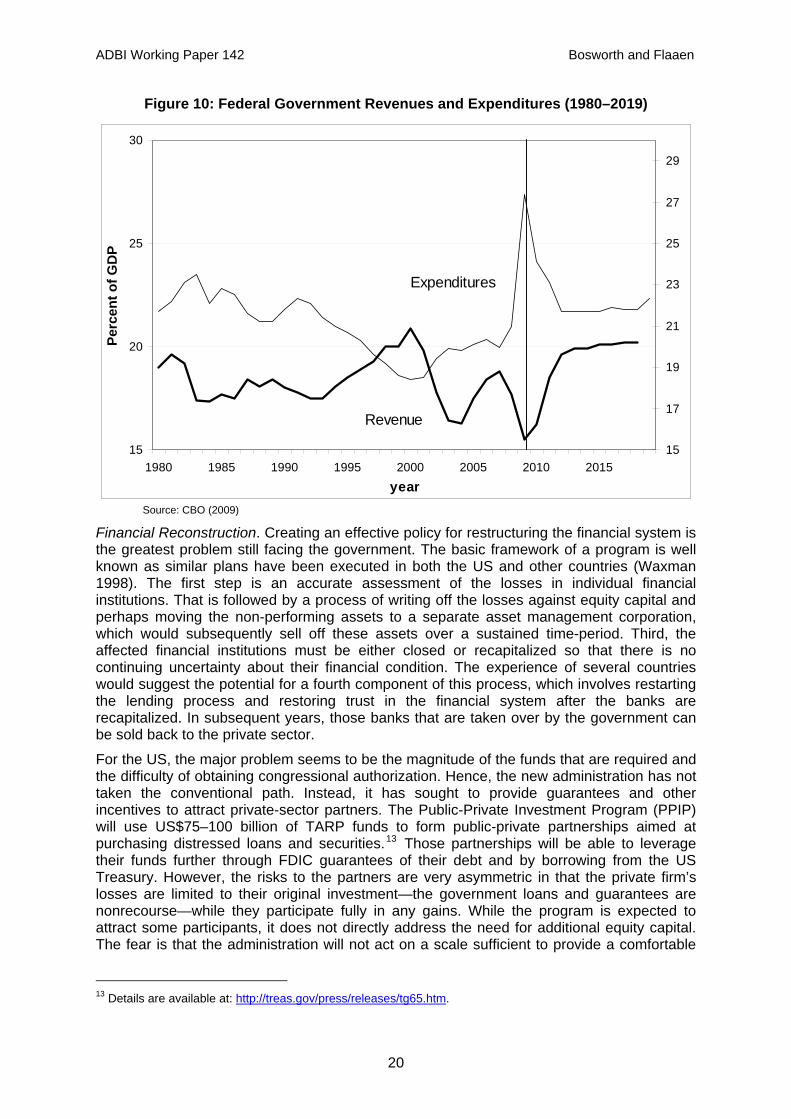
The federal government entered the recession with a substantial budge imbalance, and the additional fiscal measures, including the financial bailout (TARP), yield a fiscal deficit near US$2 trillion for FY2009 and US$1.5 trillion in FY2010. Absent further actions, the deficit would decline back below US$0.5 trillion in later years. However, the Obama administration also has an ambitious domestic agenda of its own, which is projected to push the long-term deficit up to about US$1 trillion per year (4–5% of GDP). The trends in federal outlays and revenues as shares of GDP are displayed in Figure 10. These ratios have been quite stable throughout the last half-century, in the range of 20% (except for a modest downward movement of the expenditure share in the 1990s due to the end of the cold war, and a coincident rise in the revenue share during the high-tech boom in equity markets). Expenditures are now projected to rise up to about 24% of GDP, with revenues staying in the range of 18–19%.
12 A more general discussion of the role of fiscal policy for counter-cyclical stabilization is provided by Auerbach
(2005).
19
ADBI Working Paper 142 Bosworth and Flaaen
Figure 10: Federal Government Revenues and Expenditures (1980–2019)
15
20
25
30
1980 1985 1990 1995 2000 2005 2010 2015year
Perc
ent o
f GD
P
15
17
19
21
23
25
27
29
Expenditures
Revenue
Source: CBO (2009)
Financial Reconstruction. Creating an effective policy for restructuring the financial system is the greatest problem still facing the government. The basic framework of a program is well known as similar plans have been executed in both the US and other countries (Waxman 1998). The first step is an accurate assessment of the losses in individual financial institutions. That is followed by a process of writing off the losses against equity capital and perhaps moving the non-performing assets to a separate asset management corporation, which would subsequently sell off these assets over a sustained time-period. Third, the affected financial institutions must be either closed or recapitalized so that there is no continuing uncertainty about their financial condition. The experience of several countries would suggest the potential for a fourth component of this process, which involves restarting the lending process and restoring trust in the financial system after the banks are recapitalized. In subsequent years, those banks that are taken over by the government can be sold back to the private sector.
For the US, the major problem seems to be the magnitude of the funds that are required and the difficulty of obtaining congressional authorization. Hence, the new administration has not taken the conventional path. Instead, it has sought to provide guarantees and other incentives to attract private-sector partners. The Public-Private Investment Program (PPIP) will use US$75–100 billion of TARP funds to form public-private partnerships aimed at purchasing distressed loans and securities.13 Those partnerships will be able to leverage their funds further through FDIC guarantees of their debt and by borrowing from the US Treasury. However, the risks to the partners are very asymmetric in that the private firm’s losses are limited to their original investment—the government loans and guarantees are nonrecourse—while they participate fully in any gains. While the program is expected to attract some participants, it does not directly address the need for additional equity capital. The fear is that the administration will not act on a scale sufficient to provide a comfortable
13 Details are available at: http://treas.gov/press/releases/tg65.htm.
20
ADBI Working Paper 142 Bosworth and Flaaen
level of capital in the financial system, and the de-leveraging and other financial uncertainties will be allowed to fester for years, as was the case in Japan.
The debate over the financial recovery program continues to be driven by a basic disagreement over the condition of financial institutions—particularly the banks. Critics of the Administration’s policies believe that large portions of the financial system are fundamentally insolvent, and thus some version of the procedure outlined above for removing bad assets and recapitalizing the system is a prerequisite for a sustained recovery. Such a program would require far more resources that those left in the TARP program. Others believe that the declines in asset values have overshot as the result of the panic, and that the passage of time will resolve many of the solvency problems. The second perspective seems to motivate the Administration’s relatively modest proposals for reconstructing the banks combined with its wait-and-see approach.
Even if the current crisis can be resolved, the US is faced with the need to rebuild large portions of the financial system on a new institutional structure. Having intervened to bail out large numbers of financial firms, rampant moral hazards make a return to the old system impossible. Yet it is difficult to outline a new structure without knowing what portions of the old system will survive. The Federal Reserve in particular will have the formidable challenge of reversing its current course and returning to its former arms-length interaction with the financial system. Clearly, the new system will involve more regulatory oversight, but an effective formula for anticipating systemic risks has yet to be developed.
Many see increased regulation as a solution to the prior problems, but the history of regulation in the US is that the regulated ultimately capture the regulator and convert the process to restrict competition. This is particularly true in the financial area, where Wall Street firms and the tremendous rents they could dispense came to have a dominating influence on US government policy. Instead, greater attention should be given to reversing the concentration of economic power in the hands of large financial institutions and a return to a more competitive system with a fundamental focus on simple transparency and standardized transactions in open markets.
The future structure of monetary policy is also very problematic. The earlier emphasis on narrow policy rules, such as inflation targeting, appears to have left policymakers blind to a wider range of concerns such as asset market bubbles and excessive risk taking. Yet the broadening of the agenda necessarily implies a more powerful and discretionary role for monetary authorities, which will heighten concerns about accountability.
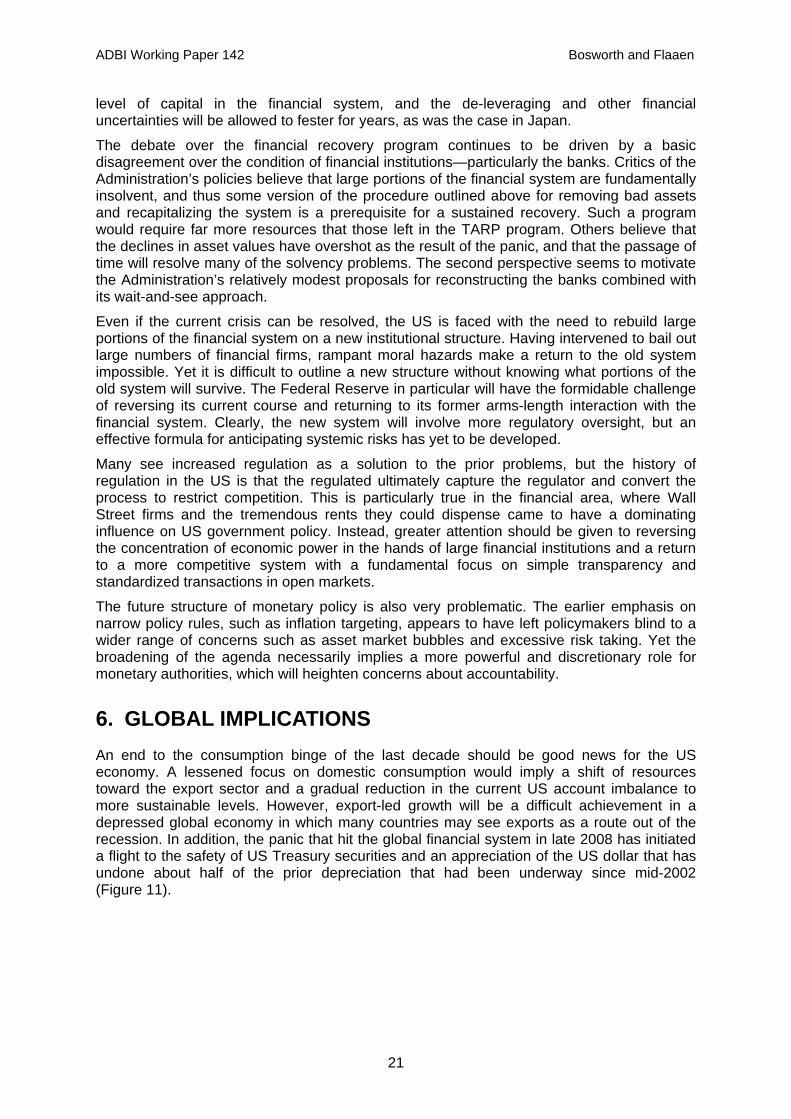
6. GLOBAL IMPLICATIONS An end to the consumption binge of the last decade should be good news for the US economy. A lessened focus on domestic consumption would imply a shift of resources toward the export sector and a gradual reduction in the current US account imbalance to more sustainable levels. However, export-led growth will be a difficult achievement in a depressed global economy in which many countries may see exports as a route out of the recession. In addition, the panic that hit the global financial system in late 2008 has initiated a flight to the safety of US Treasury securities and an appreciation of the US dollar that has undone about half of the prior depreciation that had been underway since mid-2002 (Figure 11).
21
ADBI Working Paper 142 Bosworth and Flaaen
Figure 11: Trade-weighted Exchange Rate (1990–2008)
60
70
80
90
100
110
120
130
1990:1 1995:1 2000:1 2005:1Year/Quarter
Inde
x
PRC
United States
Source: JP Morgan (2009).
A reasonable future scenario would assume that a large dose of fiscal stimulus would ultimately lift the US economy out of recession; but the recovery is likely to be marked by a higher private saving rate, weak domestic investment, and a very large government budget deficit. That is not a sustainable domestic situation, and the economy will ultimately have to be restructured with a much greater focus on exports. Using 2000–2005 as a benchmark, the US needs to shift a minimum of 3% of GDP from domestic consumption to the export sector. The shift of expenditures into the export market will require a substantial depreciation of the dollar exchange rate on a trade-weighted basis. Past research suggests that the price elasticities of exports and imports are both about unity. Thus, the required long-run depreciation of the dollar is about 30%.
Surprisingly, that process was actually underway prior to the crisis: the real exchange rate was down about 30% from its 2002 peak, and the trade imbalance had already fallen by about 1% of GDP from its 2005 level. At current levels of the dollar, however, it is not at all clear that the process of expenditure switching will continue. It seems more likely that pressures to engineer a quick recovery will lead to a heavy reliance on fiscal stimulus and a higher public sector deficit as an offset to increased private saving. Perhaps continued fiscal deficits will intensify foreign concerns about increased investment in dollar-denominated assets, and place downward pressure on the dollar. Such a process would promote the desired shift of resources into the tradables sector.
22
ADBI Working Paper 142 Bosworth and Flaaen
7. CONCLUSIONS This review has summarized some of the research on the proximate and fundamental determinants of the current financial crisis. The enormous growth of the subprime mortgage market, and the lack of regulation and prudent lending procedures that characterized this market, appear to be the most decisive factors. The complexity of the subsequent mortgage-backed securities led to the general failure of both regulators and purchasers to adequately assess the risks associated with these assets. It is reasonable to suggest that a low level of global interest rates helped create an environment conducive to the bubble in housing markets. However, we believe this was a contributing rather than fundamental factor. If the US asset price bubble was a consequence of large global imbalances brought on by strong demand for dollar-denominated assets, we would have seen an appreciation of the US dollar in the years preceding the crisis. Moreover, global interest rates were low, but not at unprecedented levels, and other economies experienced similar patterns of housing prices without comparable damage to their financial institutions. The distorted incentives and flawed regulatory structures surrounding US financial institutions were a distinctly American feature that precipitated the current global financial crisis.
Looking ahead, a sustained economic recovery seems unlikely until the uncertainty surrounding the solvency of major financial institutions has been resolved. There are substantial doubts about the potential success of the government’s bailout plan. The fundamental problem continues to be the political constraints on the government’s ability to obtain sufficient budget funds to recapitalize the financial system, leaving it with second-best options. Finally, the crisis and the large wealth losses may trigger a long-sought rebalancing of the nation’s saving and investment and a necessary reduction in the current account balance. That will create substantial challenges for other countries that have become overly dependent on exports to the US market.
23
ADBI Working Paper 142 Bosworth and Flaaen
REFERENCES Agarwal, Sumit, Chunlin Liu, and Nicholas S. Souleles. 2007. The Reaction of Consumer
Spending and Debt to Tax Rebates: Evidence from Consumer Credit Data. NBER Working Paper No. 13694 (December). Available: http://www.nber.org/papers/w13694.
Aizenman, Joshua, and Yothin Jinjarak. 2008. Current Account Patterns and National Real Estate Markets. NBER Working Paper No. 13921 (April). Available: http://www.nber.org/papers/w13921.
Ashcraft, Adam B., and Til Schuerman. 2008. Understanding the Securitization of Subprime Mortgage Credit. Staff Report No. 318, Federal Reserve Bank of New York (March).
Auerbach, Alan. 2005. The Effectiveness of Fiscal Policy as Stabilization Policy. Paper presented at the Bank of Korea International Conference on the Effectiveness of Stabilization Policies: Seoul. May.
Bebchuk, Lucian, and Jesse Fried. 2003. Executive Compensation as an Agency Problem. Journal of Economic Perspectives, vol 17(3): 71–92.
Baily, Martin, Robert Litan, and Matthew Johnson. 2008. The Origins of the Financial Crisis. Fixing Finance Series #3, Initiative on Business and Public Policy at Brookings (November). Washington, DC: Brookings Institution.
Bernanke, Ben. 2005. The Global Savings Glut and the US Current Account Deficit. Paper presented at the Homer Jones Lecture, St. Louis, Missouri, 14 April.
Bosworth, Barry, and Gabriel Chodorow-Reich. 2006. Saving and Demographic Change: the Global Dimension. The Brookings Institution Available: http://www.brookings.edu/papers/2006/1101useconomics_bosworth.aspx.
Bosworth, Barry, and Susan Collins. 2003. The Empirics of Growth: An Update. Brookings Papers on Economic Activity 2003(2).
Bracke, Thierry, and Michael Fidora. 2008. Global Liquidity Glut Or Global Savings Glut? Working paper 911, European Central Bank.
Bureau of Economic Analysis. 2009. National Income and Product Accounts. Washington, DC. Available at http://www.bea.gov/national/nipaweb/SelectTable.asp?Selected=N.
Caballero, Ricardo, Emmanuel Farhi, and Pierre Gourinchas. 2008. Financial Crash, Commodity Prices and Global Imbalances. Brookings Papers on Economic Activity: Fall 2008: 1–55.
Census Bureau. 2007. Income, Poverty, and Health Insurance Coverage in the United States: 2007. Current Population Reports: Consumer Income. Washington, DC. Available at http://www.census.gov/prod/2008pubs/p60-235.pdf.
Census Bureau. 2009. Manufacturing and Construction Division: New Privately Owned Housing Units Started. Washington, DC. Available at: http://www.census.gov/const/startssa.pdf.
Clark, Todd, and Taisuke Nakata. 2008. Has the Behavior of Inflation and Long-Term Inflation Expectations Changed? Federal Reserve Bank of Kansas City Economic Review, first quarter of 2008: 17–50.
Congressional Budget Office. 2009. A Preliminary Analysis of the President's Budget and an Update of CBO's Budget and Economic Outlook. (March). Washington, DC. Available at: http://www.cbo.gov/doc.cfm?index=10014.
24
ADBI Working Paper 142 Bosworth and Flaaen
Cooper, Richard, 2008. Global Imbalances: Globalization, Demography, and Sustainability. Journal of Economic Perspectives Vol. 22(3): 93–112.
Federal Reserve Bank of New York. 2009. Statistical Release H.15: Selected Interest Rates. New York. Available at http://www.federalreserve.gov/releases/h15/data.htm.
Federal Reserve Board of Governors. 2009a. Factors Affecting Reserve Balances, H.4.1 statistical release. (April 8). Washington, DC. Available at http://www.federalreserve.gov/releases/h41/.
Federal Reserve Board of Governors. 2009b. Flow of Funds Accounts, Flows and Outstandings. Z.1 statistical release. (March). Washington, DC. Available at http://www.federalreserve.gov/RELEASES/z1/Current/data.htm.
Gramlich, Edward. 2007. Booms and Busts: The Case of Subprime Mortgages. Paper presented at the Federal Reserve Bank of Kansas City Symposium, Jackson Hole, Wyoming, 31 August 31–1 September.
Gorton, Gary B. 2008. The Subprime Panic. NBER Working Paper No. 14398 (October). Available: http://www.nber.org/papers/w14398.
Hatzius, Jan. 2008. Beyond Leveraged Losses: The Balance Sheet Effects of the Home Price Downturn. Brookings Papers on Economic Activity 2008(2): 195–227.
International Monetary Fund. 2009a. The Size of the Fiscal Expansion: An Analysis for the Largest Countries. Fiscal Affairs Department. (February). Washington, DC. Available at: http://www.imf.org/external/np/pp/eng/2009/020109.pdf.
International Monetary Fund. 2009b. World Economic Outlook Database. (April) Washington DC. Available at: http://www.imf.org/external/pubs/ft/weo/2009/01/weodata/index.aspx.
JP Morgan. 2009. Estimates of Trade-Weighted Exchange Rates (Private Correspondence).
Johnson, David, Jonathan Parker, and Nicholas S. Souleles. 2006. Household Expenditure and the Income Tax Rebates of 2001. American Economic Review 96, (no. 5): 1589–1610.
Mortgage Bankers Association. 2009. National Delinquency Survey. Available at: http://www.mortgagebankers.org/ResearchandForecasts/ProductsandSurveys/NationalDelinquencySurvey.htm.
Office of Management and Budget. 2009. Fiscal Year 2019 Budget Overview: A New Era of Responsibility. (February). Washington, DC. Available at: http://www.whitehouse.gov/omb/budget/Overview/.
Organization for Economic Cooperation and Development (OECD). 2009a. Economic Outlook. Accessed April 18, 2009. Paris: OECD. Available at: http://stats.oecd.org/index.aspx?r=445591.
———. 2009b. Monthly Economic Indicators. Accessed 18 April 18 2009. Paris: OECD. Available at: http://stats.oecd.org/index.aspx?r=445591.
———. 2009c. National Accounts Volume II. Accessed 18 April 2009. Paris: OECD. Available at: http://stats.oecd.org/index.aspx?r=445591.
Reinhart, Carmen, and Kenneth Rogoff. 2008. Is the 2007 US Sub-Prime Financial Crisis So Different? An International Historical Comparison. Mimeo. Cambridge, MA: Harvard University.
Standard and Poor’s. 2009. S&P/Case-Shiller Home Price Index. Available at http://www2.standardandpoors.com/portal/site/sp/en/us/page.topic/indices_csmahp/0,0,0,0,0,0,0,0,0,1,3,0,0,0,0,0.html.
25
ADBI Working Paper 142 Bosworth and Flaaen
26
Summers, Lawrence. 1983. The Non-adjustment of Nominal Interest Rates: A Study of the Fisher Effect. In Symposium In Honor Of Arthur Okun, edited by J. Tobin. Washington, DC: Brookings Institution.
Taylor, John. 2009. Getting Off Track: How Government Actions and Interventions Caused, Prolonged and Worsened the Financial Crisis. Stanford: Hoover Institution Press.
Waxman, Margery. 1998. A Legal Framework for Systemic Bank Restructuring. The World Bank (September).
World Bank. 2009. World Development Indicators. Accessed 18 April 2009. Available at http://ddp-ext.worldbank.org/ext/DDPQQ/.