Corporate Fraud and Litigation Risk in Financial Distress
43
Corporate Fraud and Litigation Risk in Financial Distress: An Empirical Study on SEC’s Enforcements against Public Traded Companies after the Financial Crisis of 2007-08 Paulo Levi Norberto dos Santos, nº152416028 Dissertation written under the supervision of: Professor Ricardo Ferreira Reis Dissertation submitted in partial fulfilment of requirements for the MSc in Finance, at the Universidade Católica Portuguesa January 2018
-
Upload
khangminh22 -
Category
Documents
-
view
0 -
download
0
Transcript of Corporate Fraud and Litigation Risk in Financial Distress

Corporate Fraud and Litigation Risk
in Financial Distress: An Empirical
Study on SEC’s Enforcements against
Public Traded Companies after the
Financial Crisis of 2007-08
Paulo Levi Norberto dos Santos, nº152416028
Dissertation written under the supervision of:
Professor Ricardo Ferreira Reis
Dissertation submitted in partial fulfilment of requirements for the MSc in
Finance, at the Universidade Católica Portuguesa
January 2018

i
Abstract
The financial crisis of 2007-08 puts in question the capability of market regulators to
act on behalf of investors to guarantee that the information available is accurate and reliable. In
this study, we research 45 firms that have been enforced by the SEC between 2010-2013 for
alleged corporate misconduct. We find that fraud firms experience non-significant negative
abnormal returns prior to SEC’s announcement, however after the event day, the abnormal
returns are positive. We also find significant increases in the mean residuals bid-ask spreads,
meaning that after the event, fraud firms became riskier, leading investors to demand higher
returns which increases eventual financial distress costs. Finally, we study the governance
characteristics for 32 fraud firms and 32 control firms (non-enforced) one year prior to SEC’s
enforcement and the following four years (2009-2016) finding that fraud firms have slightly
poorer governance. Outside directors dominate the board of directors for both groups, fraud
firms have larger boards and more board meetings. Moreover, the majority of CEOs are also
Chairman of the board for both groups, blockownership increases and institutional ownership
decreases for both the groups and director’s compensation is affected by regulators activity, as
it can affect future returns.
Our results show that fraud firms are identical to non-fraud firms, financial crime has
become more complexed and regulators are slow to identify and judge corporate misconduct.
On the other hand, fraud firms are quicker to make the proper adjustments in their structures,
becoming more identical to non-fraud firms.
Resumo
A crise financeira de 2007-08 questiona a capacidade das entidades reguladoras de
actuar em prol dos investidores de forma a garantir informação credível e confiável.
Investigámos 45 empresas processadas pela SEC entre 2010 e 2013 por gestão danosa.
Descobrimos que as empresas fraudulentas registam retornos anormais negativos antes da
divulgação da SEC, no entanto depois do dia do anúncio, as empresas registam retornos
anormais positivos. Também descobrimos mudanças significativas nas médias dos residuals
bid-ask spreads, significando que o risco empresarial aumenta, levando os investidores a
requerer taxas de retorno maiores para os seus investimentos, criando possiveis dificuldades
financeiras no futuro. Finalmente, estudámos as características de governo para 32 empresas
fraudulentas e 32 empresas de controle (sem processos judiciais) um ano antes da divulgação
da SEC e quatro anos aseguir (2009 a 2016) descobrindo que as empresas fraudulentas possuem
pior governo. Directores independentes dominam o conselho administrativo para ambos os
grupos, empresas fraudulentas têm conselhos maiores e mais reuniões. Além disso, a maioria
dos CEOs são também presidentes do conselho, grandes acionistas aumentam e acionistas
institucionais diminuem a sua participação para ambos os grupos e a compensação dos
directores é afectada pelas acções judiciais dos reguladores, pois afectam retornos futuros.
Os nossos resultados evidênciam que as empresas fraudulentas e não fraudulentas são
idênticas, pois os crimes financeiros estão mais complexos e os reguladores são lentos a actuar.
Por outro lado, as empresas fraudulentas fazem ajustes rapidamente à sua estrutura de forma a
ficarem mais parecidas com as empresas não fraudulentas.
Keywords: SEC, Regulatory Enforcements, Governance, Abnormal Returns, Bid-ask spreads

ii
Acknowledgments
Before starting, it is imperative to give thanks to all the people that made this study
possible.
Firstly, I would like to thank my thesis supervisor, Prof. Ricardo Reis for his
encouragement and support in the past three months, through the all process of the thesis.
His assistance in seeing eventual setbacks as “good problems” and his precious and relevant
input were essential to move forward.
Secondly, I thank my family who have personally joined me in this process, being
always supportive and encouraging through all my academic path. A special gratitude to
my parents who have always inspired me that with hard work and consistency, eventually
results will appear: “hard training, easy combat”.
Last but not least, I thank God who has blessed my life with more than I could ever
dream of. He was always there to comfort, correct and motivate me that I was capable to
write a master thesis. He has always been by my side when I was feeling down or great. His
love, grace and presence were essential to finish this stage in my life. Furthermore, a special
thanks to Hillsong Portugal Church, who has blessed my life with purpose and meaningful
friendships. This study was not possible without your unconditional support.

iii
Table of Contents
1. Introduction ....................................................................................................................... 1
2. Literature Review ............................................................................................................. 3
2.1 Agency Problems ................................................................................................................ 3
2.1.1 Ownership ............................................................................................................ 4
2.1.2 Liquidity ............................................................................................................... 6
2.1.3 Information Asymmetry ....................................................................................... 7
2.2 Financial Fraud ................................................................................................................... 8
2.2.1 Overview .............................................................................................................. 8
2.2.2 Corporate Governance .......................................................................................... 9
2.2.3 Regulation & Causes .......................................................................................... 10
2.2.4 Consequences ..................................................................................................... 12
3. Methodology .................................................................................................................... 14
3.1 Fraud Sample .................................................................................................................... 14
3.2 Control Sample.................................................................................................................. 17
3.3 Variables ............................................................................................................................. 17
3.3.1 Abnormal Returns .............................................................................................. 17
3.3.2 Changes in Risk .................................................................................................. 19
3.3.3 Governance Changes .......................................................................................... 20
4. Results & Discussion ....................................................................................................... 21
4.1 Event Study Results ......................................................................................................... 21
4.2 Residual bid-ask spread – Changes in Firm’s Risk .................................................. 24
4.3 Governance Changes ....................................................................................................... 27
5. Conclusion ....................................................................................................................... 30
6. References ........................................................................................................................ 32
7. Appendix .......................................................................................................................... 37

iv
List of Tables
TABLE 1 Fraud Sample Selection, Fraud Firm Characteristics, and Control Group .............. 15
TABLE 2 Matching Statistics for Fraud and Control Group ................................................... 17
TABLE 3 Summary Statistics: Fraud and Control Firms CARs ............................................. 24
TABLE 4 Summary Statistics: Residual bid-ask spreads for fraud and control firms ............ 26
TABLE 5 Univariate Comparisons of Board of Directors and Other Governance Variables..28
List of Figures
FIGURE 1 Cumulative Abnormal Returns .............................................................................. 23
FIGURE 2 Residual bid-ask spreads – Fraud firms ................................................................. 25
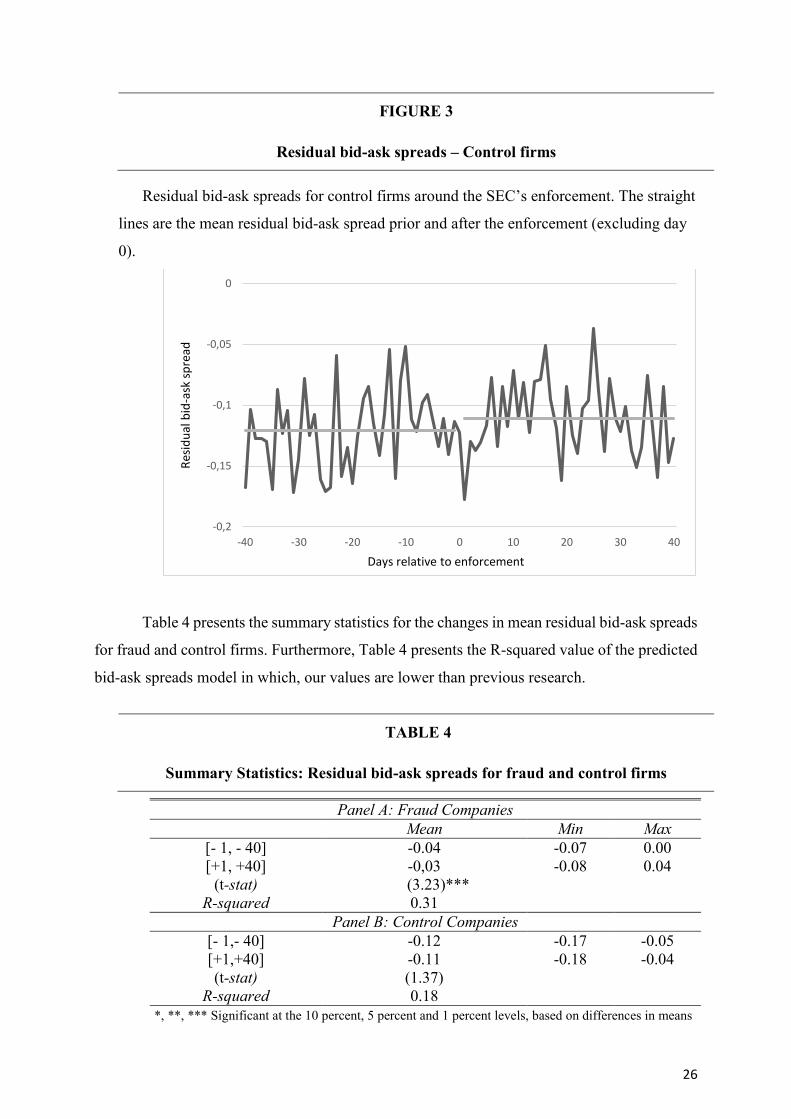
FIGURE 3 Residual bid-ask spreads – Control firms .............................................................. 26
List of Appendix
TABLE 6 Fraud Sample ........................................................................................................... 37

1
1. Introduction
Market regulators, like the Securities and Exchange Commission (SEC), have the role
to regulate stocks, bonds and other securities with the purpose to provide accurate and
meaningful information to investors and maintain investor’s hope in the financial markets.
However, 1929-30 crisis and more recently the financial crisis of 2007-08 put people
wondering the efficiency of these entities as regulators. Both financial crises have similar
causes and patterns that we can look at, to predict future crises. Eingner and Umlauft (2015)
state that the 1920’s period is characterized by economic prosperity and fraud likewise in
the period before the Financial Crisis of 2007-08.
The period before The Great Financial Crisis of 2007-2008 and Great Depression (1929-
1933) is marked by a rising in the housing market, financial innovation, deregulation and
private debt, mostly in mortgage debt, which contributed for the subprime bubble (Eingner
and Umlauft 2015). On the other hand, it is also marked by fraud. Charles Ponzi, through
his fraudulent business scheme in the 1920s, embezzled his investors in twenty million
dollars, just like Bernie Madoff decades after. The aftermath of both financial crises is
somehow identical: Strong failure of the banking system due to repayment or refinancing
problems and decline in housing prices which led to an increase in default rates, and a
decline in consuming spending which led businesses to slow down and employment
increase (Eingner and Umlauft 2015).
The costs of corporate fraud and fraudulent bankruptcy are a real problem of the modern
business. Every two years, the Association of Certified Fraud Examiners (ACFE) publishes
a report on Occupational Fraud and Abuse. In 2016, it analysed 2127 cases which resulted
in a total loss of 6.3 billion dollars, with an average loss of 2.7 million dollars per case.
Asset misappropriation is the most common form of occupational fraud (83% of the cases),
however with the smallest median loss of $125.000. On the other hand, financial statement
fraud is the least form of occupational fraud (< 10% of the case) but with a median loss of
$975.000. Hence, it is imperative to study the costs associated with litigation risk on
companies in financial distress and illegal activities.

2
This paper aims to examine the theoretical and empirical relationship between
management fraudulent activities and the impact of SEC’s enforcements in public traded
fraudulent firms after the Financial Crisis of 2007-08. Our main research objectives are: 1)
to examine either or not investors see fraud firms as riskier for their investments 2) if firm’s
returns are negatively affected by regulatory penalties and finally 3) if governance
mechanisms are weaker for fraud firms than for non-fraud firms.
Our results suggest that fraud firm’s returns are not significantly affected by regulatory
enforcements although they become riskier, leading investors to demand higher returns
which increases eventual financial distress costs and that fraud firm’s governance are
identical to non-fraud firms, making it harder and harder for regulators to foresee criminal
financial practises.

____________________
1Maxwell, J. C. (2007). The 21 irrefutable laws of leadership: Follow them and people will follow you
3
2. Literature Review
“Everything rises and falls on leadership”1. The recent financial crisis and its aftermath
has shown, above all, the results of poor management decisions leading to fraudulent
bankruptcies, illegal activities and the cost of legal proceedings. Research in corporate
governance and financial regulation has been gaining awareness in the last decades, as they
play an extreme role in order to reduce fraudulent activities by monitoring and controlling,
therefore helping reduce costs for companies in distress.
Jensen and Meckling (1976) in their theory of the firm defend that firms are simply legal
fictions which create relationships through contracts. This includes external contracts with
firms, non-profit institutions (hospitals, universities, foundations), financial institutions
(banks and insurance companies) and governmental bodies (cities, states, federal
government, government enterprises and so on). On the other hand, internal contracts, are
made between managers, employees, equity holders and debtholders. Firms enter in
financial distress when they have trouble meeting its debt obligations, therefore violating
contracts previously made, increasing in this way the likelihood of bankruptcy.
2.1 Agency Problems
Agency relationship can be defined as a contract between one or more persons where
the principal engages another person (the agent) to perform some service in their behalf
despite agent’s own interests (Jensen and Meckling, 1976). The relationship between
managers and shareholders fits in this definition. Assuming that both parties are utility
maximizers, this is, that both individuals tend to maximize their own general well being,
there is good reasons for management not to always act in the best interest of the
stockholders, which economists call: an agency problem. Agency problems arise when
managers face the ethical dilemma of acting according to their own interest or shareholders’
interests. To mitigate the cost of these problems (agency costs) shareholders give incentives
to managers to motivate them to behave according to their interests and incur in monitoring
costs to observe and sometimes restrict managers’ actions

4
2.1.1 Ownership
Jensen and Meckling (1976) study the agency costs arising from the of separation of
ownership and control in a firm between managers, stockholders and debtholders. They
argue that equity holders (manager-owner) are residual claimants and as their ownership
falls, the probability to use firm’s resources into their own benefit rises, in form of
perquisites (jets, cars, etc…). Agency costs between managers and debtholders rises when
firms want to take advantage of investment opportunities without losing ownership. They
do not find high leveraged firms, as over borrowing stimulates managers to do risky
investments. Debtholders include covenants to limit management’s actions and protect
themselves from incentive effects. Covenants can impose constrains on dividends, firm’s
operations, minimum economic and financial ratios therefore reducing firm’s profitability
by limiting investments in some projects. Finally, high leveraged firms face the possibility
of missing debt obligations, leading to bankruptcy and reorganization costs. Jensen and
Meckling (1976) conclude that firm structure should be an equilibrium between outside
debt and equity thereby reducing agency costs.
Board of directors is the highest internal control mechanism in a firm, which role is to
“run board meetings and oversee the process of hiring, firing, evaluating, and compensating
the CEO” (Jensen, 1993), enhancing corporate governance. Gilson (1990) classifies the
directors as: outsiders (no relationship with the firm other than their role as directors),
insiders (member of the management team) and quasi-insiders (weak relationship, but not
managers – retired managers, relatives to current managers and lawyers). As a firm grows,
its demands for specialized board services might also grow. Jensen (1993) and Yermack
(1996) argue that larger boards experience stronger deficiency of internal control
mechanisms in restructuring or redirecting their businesses than smaller boards.
Furthermore, Coles et al. (2008) propose that complex firms (large size, high leveraged or
well diversified across industries) perform better with very large or very small boards.
Morck et al. (1988) and McConnell and Servaes (1990) study the relationship between
inside ownership and performance for American firms. They show that the majority of
board members do not own a large percentage of the firm and performance increases as
management ownership increases in a range between 0% and 25%. These results suggest

5
that an increase in inside ownership reflect a convergence of managers’ and shareholders’
interests.
Managers are concerned about their performance and its reward mechanism (Fama,
1980). Warner et al. (1988) find that the probability of changes in top management is
inversely related to stock performance arguing that managers are hold accountable for stock
performance. Furthermore, if the rewarding system is not attractive, best managers are the
first ones to leave the firm. In order to mitigate this, the board of directors gives incentives
to managers, such as performance bonuses, salary revisions and stock options. Jensen and
Murphy (1990) show that pay-to-performance incentives to CEOs are relatively low and
the majority comes from owning firm’s stocks, however such are small and declining, being
consistent with Morck et al. results (1988). Core et al. (1999) find a negative relation
between CEO’s ownership and CEO’s compensation and find no evidence that outside
directors are more effective in monitoring than inside directors.
The hypothesis that outside directors promote shareholders’ interests is debatable.
Several studies in the outside directors (Brickley, Coles, and Terry, 1994; Byrd and
Hickman, 1992) show the importance in the outcome of takeover bids and stock
performance as the firm applies anti-takeover devices, such as, poison pills. They conclude
that firms that have significant outside directors on their boards experience, on average,
positive abnormal returns suggesting that outside directors serve shareholders’ interests in
control contest events. However, Byrd and Hickman (1992) argue that outside directors
should not own a great fraction of the company (> 60%) as it shows a negative effect in
shareholder wealth. Overall, a board that is dominated by outside directors could impose
ineffective limitations to management and shareholders’ benefits when managers own a
small fraction of firm’s stocks.
Financial distressed firms experience lower performance than its competitors (Opler and
Titman, 1994) which leads to management restructures and board turnovers. Gilson (1990)
shows that, on average, only 43% of CEOs remain within their firms until the conclusion
of the bankruptcy or debt restructure. The majority of the board directors also tend to leave
when the CEO resigns (51%), shifting control to creditors and blockholders (owns at least
5% of the shares). Gilson and Vetsuypens (1993) conclude that nearly one-third of the CEOs
are replaced after one year around the default and experience a cut in their bonuses and
compensations.

6
2.1.2 Liquidity
Jensen (1986) in his free cash flow hypothesis studies the level of excess cash that
management should be allowed to use to fund all good projects (positive NPV) and to use
it to reduce agency costs. Excess cash flows can be used to increase dividends or engage in
share repurchases, reducing management likelihood to invest in low-return projects or use
resources for their own interests. Why would managers invest in projects that damage firm
value? Malmendier and Tate (2005) show that CEOs are overconfident in their past
investments and struggle to change their investment policies to new opportunities. Other
reason is that managers prefer to run large firms than small firms, growing its size beyond
optimal, making it larger but not more profitable (Jensen, 1986). Hardford, Mansi, and
Maxwell (2008) find that weaker governance firms hold lower cash reserves, invest less in
R&D and engage more in share repurchase, being a more flexible mechanism of increasing
shareholder value. On the other hand, stronger governance firms choose to increase
dividends, signalling financial health and a long-term commitment since capital markets
punish dividends cuts (Jensen, 1986; Kothari et al., 2009).
DeAngelo et al. (2002) study in the bankruptcy process of L.A. Gear shows the
importance of liquid assets (capability of turning assets into money) in managerial
decisions. High liquid assets provided the firm with the internal funds to compensate six
years of ongoing losses, meet debt payments and buying time and giving incentives for
managers to finance losing operations, without the need for external funding. Therefore,
highly liquid firms give incentives to managers to postpone imperative changes when the
company is underperforming. Weiss and Wruck (1998) study the bankruptcy process of
Eastern Airlines which resulted in a loss of two billion dollars, representing a devaluation
of 50% of its market value at the filing for Chapter 11. They state that managers of distressed
firms with liquid assets such as cash or planes, occur in a serious temptation to prolong
firm’s survival, even though it can result in value destruction, even more if difficult
decisions such as downsizing or closing the business are required.

7
2.1.3 Information Asymmetry
Managers, stockholders and creditors may not always have the same information.
Therefore, corporate disclosure plays a critical role in reducing information asymmetry,
agency conflicts between managers and investors and contributes for the efficient market
hypothesis (EMH) which states that stock prices incorporates all information, being
impossible to outperform the market. Firms disclose information through regulatory laws
(financial reports and other regulatory fillings) and by voluntary communications
(management forecasts, analysts’ reports, conference calls and press releases). Eng and Mak
(2003) show that larger firms have greater voluntary disclosure and it increases in firms
where managers have low ownership. On the other hand, low leveraged firms disclose less
information (Eng and Mak., 2003; Ali et al., 2014), as debt is seen as a controlling
mechanism of the free cash flow problem (Jensen, 1986). More recently, Bertomeu and
Magee (2015) find that firms that issue securities to the general public, which are obliged
to mandatory disclosure, disclose meaningless information and it encourages managers’
interests not to disclosure bad information as a means to maximize current market prices.
Financial analysts are valuable intermediaries in the capital markets by providing
forecast about future prospects, recommendations to investors to buy, sell or hold the stock
(Lang and Lundholm, 1996; Healy, Palepu, 2001). Lang and Lundholm (1996) results show
that companies with forthcoming disclosures have greater analysts following which leads
to having a large pooled funds that might be linked to a reduction in the cost of capital.
Amiram et al. (2016) show that earnings announcements and management forecasts
increase information asymmetry, at the announcement, between unsophisticated and
sophisticated investors, as it includes information that is new for both type of investors. On
the other hand, they conclude that analyst forecasts reduces information asymmetry at
announcement as it contains valuable information only to unsophisticated investors.
However, this gap between unsophisticated and sophisticated investors endures for a short
period of time, fading away ten days after the announcement.
In their review, Healy and Palepu (2001) state that financial reporting and disclosure
contribute for the mitigation of agency costs. However, there are certain downfalls on
disclosing information. Research in disclosing information shows that firms have incentives
not to disclose information as their competitors also receive the information, reducing their
competitive position therefore making financing costlier (Healy and Palepu ,2001). Kothari

8
et al. (2009) show that managers tend, on average, to delay the release of bad news to
investors and leak good news early due to positive stock movements. This is consistent in
their findings where the market reaction to good news is weaker than the reaction to bad
news. Moreover, managers of distressed firms tend to delay the release of bad news because
of career concerns. Hence, managers are successful in withholding bad news from investors,
until it becomes inevitable from coming out (Kothari et al., 2009). Lehman Brothers
bankruptcy and others bankruptcies in the recent financial crisis are internally connected by
the ability of managers in withholding bad news from the general public.
2.2 Financial Fraud
2.2.1 Overview
The general understanding about crime is “misleading and incorrect” (Sutherland,
1940). His view is that the most serious crimes are not committed by the poor or delinquent
but by the respected and well-known business leaders. In his speech on December 27, 1939
in the fifty-second annual meeting of the American Sociological Society, he unveiled a new
class of crime: “white collar crime”. Sutherland (1940) defines that white collar crime is
expressed most frequently in the form of “Misrepresentation in financial statements of
corporations manipulation in the stock exchange, commercial bribery, bribery of public
officials directly or indirectly in order to secure favourable contracts and legislation,
misrepresentation in advertising and salesmanship, embezzlement and misapplication of
funds, short weights and measures and misgrading of commodities, tax frauds,
misapplication of funds in receiverships and bankruptcies.” Yu (2013) defines fraud as
“firm’s or its manager’s misconduct behaviour, which causes material value loss to
shareholders or stakeholders (e.g., creditors, customers, and suppliers) and which may
trigger regulatory and/or legal enforcements”.
The Great Depression (1929-1933), Dot.com bubble in 2001 and the most recent
Financial Crisis of 2007-2009 have grabbed researchers’ attention to study the causes and
aftermaths of financial crises. The period before the three financial crisis are somehow
identical: plentiful liquidity in capital markets, an increase in financial innovation and a
rising complexity of the financial products which weakened regulation and encouraged
firms to increase their leverage (Carmassi, Gros and Micossi, 2009; Pauly, 2009; Eingner

9
and Umlauft 2015). Eingner and Umlauft, 2015 show that the prices in the housing market
increased exponentially, creating a market-bubble, before the crisis of 1929 and 2007. They
also suggest that when the housing prices starts to decline, it can be seen as a pre-event of
a financial crisis. While the period before the financial crisis is a period of growth is also a
period of fraud (Eingner and Umlauft, 2015). Charles Ponzi in 1920’s was able to embezzle
his investors in nearly 20 million dollars through his complexed businesses schemes. Enron
in 2001 filed for bankruptcy under the Chapter 11, losing its total value, from $90 a share
in mid-2000 to under a $1 in 2001, due to unreported losses (Benston and Hartgraves, 2002).
Why would managers engage in fraudulent activities if it turns out to be damaging for
the firm? Albrecht et al. (2006) show three elements that are present in any kind of
fraudulent act: (1) perceived pressure, (2) perceived opportunity and (3) some way to
rationalize fraud as acceptable. Perceived pressure is mostly related to the financial need to
report better results than the real ones. Perceived opportunity is when managers find an
opportunity to engage in fraudulent activities with low probability of getting caught (weak
board of directors or poor internal control mechanisms). Finally, management can come up
with some rationalization on why to enter into fraudulent activities: “we needed to keep the
price of stocks high”;” all companies use aggressive accounting practises”; “is for the good
of the firm”).
Every two years, the Association of Certified Fraud Examiners (ACFE) publishes a
report on Occupational Fraud and Abuse. In 2016, it analysed 2127 cases which resulted in
a total loss of 6.3 billion dollars, with an average loss of 2.7 million dollars per case. Asset
misappropriation is the most common form of occupational fraud (83% of the cases),
however with the smallest median loss of $125,000. On the other hand, financial statement
fraud is the least form of occupational fraud (< 10% of the case) but with a median loss of
$975,000.
2.2.2 Corporate Governance
Managers will not always act in the best interests of the shareholders (Jensen and
Meckling, 1976). Managers tend to be overconfident in their investments (Malmendier and
Tate 2005), make the company larger but not more profitable (Jensen, 1986) and disclose
good news earlier and hold bad news (Kothari et al., 2009). In order to motivate managers
to act in shareholders’ interests, improving corporate governance and resolve agency

10
problems, the board can give incentives in the form of bonuses, performance rewards and
shares of the company. If all of these mechanisms were created to control the management,
how can it enrol in fraudulent activities?
Fraud and non-fraud firms possess different patterns. Several studies find that the fraud
firms have very deficient governance mechanisms (Beasley, 1996; Beasley et al., 1999;
Aharony et al., 2015; C. Liu et al., 2016). The Board of directors in fraud firms is equally
represented by outside and inside directors as in non-fraud firms it is dominated by outside
directors, adding one outside member to the board reduces the likelihood of fraud and small
boards are more efficient in monitoring management decisions than large boards (Beasley,
1996), being consistent with Jensen (1993). Beasley et al. (1999) study fraud firms in three
industries (technology, healthcare and financial services), finding that fraud firms have less
independent audit committee and meetings with the auditing team, leading to an ineffective
and misinformed board.
There is a negative correlation between fraudulent activities and institutional ownership
(Roychowdhury, 2006). Aharony et al. (2015) finds that corporate lawsuits result in an
increase of CEO turnover, decrease in CEO wages and trigger early departure of inside and
outside directors, confirming Gilson (1990) hypothesis that outside directors’ main
motivation to serve in the board derives from the reputation they build as expert monitors
and that lawsuit can damage their reputation. Moreover, Brochet and Srinivasan (2014)
argues that only 11% of independent directors are account as defendants in the lawsuits of
the companies they used to serve. Finally, C. Liu et al. (2016) find that after the lawsuits
CEOs struggle to find job and if they stay in the sued company, they assist to an increase in
the number of outside directors. These findings are consistent with the idea that managers
will hold bad news (in this case, fraudulent activities) due to their self-interests, mostly
career prospects (Kothari et al., 2009).
2.2.3 Regulation & Causes
The Securities and Exchange Commission (SEC) was formed in 1934 as a result of the
financial crisis of 1929 to regulate stocks, bonds and other securities with the hope to

_____________________
2See: https://www.sec.gov/Article/whatwedo.html 11
restore investor confidence in the capital markets. It has the purpose to provide accurate
and meaningful information to investors, through the Act’s disclose requirements
(operating history, profits in recent periods, financial position and so forth) in order to
influence investment decisions, as stated: "to provide full and fair disclosure of the character
of securities sold in interstate commerce and foreign commerce and through the mails, and
to prevent fraud in the sale thereof, and for other purposes.”2 It also regulates the security
transactions on the secondary market. SEC’s main goal is to ensure financial transparency
and accuracy, reducing fraud and manipulation and therefore contribute for the efficient
market hypothesis.
In the aftermath of the Dot.com bubble with the crashes and frauds of Enron, WorldCom
and other companies, the Sarbanes-Oxley Act (SOX) of 2002 was created with the goal to
restore investor’s confidence in the securities markets. Ribstein (2002) states that this is the
most important Act since the acts that formed the SEC, concerning fraud and corporate
governance mechanisms. However, creating laws that rely in increasing penalties and
monitoring power by independent directors and auditors, who have low-level of access to
private information, has been seen as an inefficient way to deal with corporate fraud through
the seventy years of SEC’s existence. Cohen et al. (2008) finds that accrual- based earnings
management decreased and real earnings management increased after the SOX passage,
implying not a decrease in fraud but a shift on the methods used by firms that are harder to
detect confirming that “white collar crime” can be committed through several different
ways (Sutherland, 1940).
Managers often feel pressured to meet analysts’ earnings forecasts and investor’s
recommendations, because they are concerned about their performance and they are hold
accountable for stock performance (Fama, 1980; Warner et al., 1988). Ribstein (2002) in its
review of regulation defends that large public companies’ managers need more monitoring
in areas such as “insider transactions, compensation and selection and supervision of
auditors.” He, X. Tian (2013) conclude that analysts exert pressure on managers to meet
short-term goals (e.g. earning targets) sacrificing long-term firm value by not investing in
innovative, riskier projects (destruction of firm innovation). McVay et al. (2006) evidence
that managerial incentives are a key driver for managers to intentionally meet analyst
earnings forecast in order to maintain stock prices steady and sell their shares. Skinner and

12
Sloan (2002) finds that missing analysts’ forecasts, even by little, leads to significant drops
in stock price, especially in companies with growth opportunities.
Adjusting firm’s financial reports to mislead shareholders about the real performance to
influence contractual outcomes that otherwise were impossible and get low cost financing,
is called earnings management (Dechow et al., 1996; Healy and Wahlen, 1999). Managers
can use real activities manipulation and accrual-based earnings in order to manipulate
earnings. Accrual-based earnings management is achieved by changing accounting
methods, like depreciation methods and shift gains or losses to provisions and accruals
accounts. DuCharme et al. (2004) evidence positive increases in abnormal working capital
accruals, on average, around stock offers, declining thereafter. Zang (2012) opines that there
is a trade-off between the use of real activities manipulation and accrual-based earnings,
based on their relative cost. Less competitive and unhealthy firms will engage more in
accrual-based earnings management as they experience a higher level of scrutiny. Real
activities manipulation is done in three different ways to alter reported earnings therefore
avoiding losses: (1) Sales manipulations, by accelerating the timing of sales through
aggressive discounts (2) Reduction of variable costs (R&D, advertising and maintenance)
and (3) Overproduction to report lower cost of goods sold (COGS) (Roychowdhury, 2006).
He shows that when debt, inventories, receivables and growth opportunities are present, the
likelihood for manipulation activities increases.
2.2.4 Consequences
The consequences of illegal and fraudulent practises when are made public can be
catastrophic. Skinner (1994) argues that managers who fail to meet earnings forecasts, will
increase the likelihood of being sued by stockholders, as stock prices’ dives, and face costly
reputational losses. Skinner (1997) shows some evidence that early disclose of bad news
can reduce litigation costs (smaller litigation settlements). Field et.al (2005) imply that large
firms have higher securities litigation risk, confirming the “deep pockets” idea that fraud’s
benefits outrank its costs. Karpoff, Lee and Martin (2008) estimates that firms lose, on
average, 38% of their market value when misconduct news are reported.
Stockholders’ lawsuits are typically brought under SEC’s regulation, which states that
providing misleading information (e.g. earnings management) is an illicit act. SEC
penalizes fraud firms through its accounting-based enforcement actions in the Accounting

13
and Auditing Enforcement Releases (AAERs). Dechow et al. (1996) finds that fraud
companies experience, on the day of earnings announcement: on average, a decline of 9%
in their stock prices, increase in risk (bid-ask spreads) which results in investors demanding
higher returns and higher cost of debt, and significant loss of analysts following. Farber
(2005) states that fraud firms experience negative abnormal returns and negative raw returns
in three years following fraud detection, compared to non-fraud companies. In short-
window studies, Feroz, Park and Pastena (1991) analyse 224 AAER, finding an average
loss of 7.5%, one-day prior to SEC’s disclosure. Palmore et al. (2004) find that firms obliged
to restate their reports, suffer an average decrease of 9.2%, over a 2-day window. Karpoff,
Lee and Martin (2008) examine 231 firms which were subject to class-action lawsuits, who
conclude that that legal penalties and its consequences (investor’s adjustment to faulty
information) explain 1/3 of firms’ market loss. Therefore, a significant loss (2/3) is due to
reputational losses.
Reputational Losses arise when “customers, suppliers, providers of financial capital,
and other related parties revise their terms of trade once a firm’s willingness to act
opportunistically is revealed” which leads to loss of sales, lower negotiation power with
suppliers, loss of business opportunities, and an increase in risk and return rates demanded
by investors (Murphy et al., 2009). Karpoff and Lott (1993) states that legal penalties only
represent 6.5% of firm’s loss, indicating that 93.5% is due to reputational costs. Karpoff,
Lee and Martin (2008) study 585 SEC’s enforcement (1978-2002), reporting on average,
abnormal returns of -8.85% for filling announcements and -4.04% for settlement
announcements. They conclude that reputation costs represent a significant fraction (2/3) of
the firm’s total losses.
Litigation and reputational costs and their aftermath can be destructive for firms and
managers. Leuz et al. (2006) finds evidence between litigation risk and “going dark” or
going private. Firms with weak financial health, low probability to survive in the future and
in financial distress go dark, getting delisted or trade in the Over-The-Counter market
(OTC), expecting less disclosure requirements and lower cost of capital. Going private leads
to a restructure in ownership, more concentrated in managers and private investors (e.g.
Private Equities) and usually leads to an increase of the level of debt (e.g. LBO).
Furthermore, Leuz et al. (2006) finds that companies with weak governance, high levels of
excess cash are more likely to go dark. Finally, Fich and Shivdasani (2009) conclude that

14
strong corporate governance will more likely fire sued directors which markets view as
good news (positive returns when sued directors leave the firm) and the probability of
director resigning is positively depending on SEC’s settlement amounts.
3. Methodology
3.1 Fraud Sample
The observations are drawn from the Securities Enforcement Empirical Database
(SEED). SEED is a data base created by the cooperation between NYU Pollack Center for
Law & Business and Cornerstone Research, that tracks SEC’s enforcement actions against
public traded companies and its subsidiaries in Accounting and Auditing Enforcement
Releases (AAERs), beginning of the fiscal year of 2010.
The procedures used to obtain the fraud firms sample are summarized in Panel A of
Table 1. I retrieved a total of 608 AAERs. I began to eliminate 396 AAERs that were not
enforced in the period of 2010-2013 with the purpose to study the causes and changes in
the fraud companies in terms of corporate governance variables, risk and performance, 3
years prior and 3 years after SEC’s enforcement (Dechow et al., 1996). I eliminate 86
AAERs taken against subsidiaries and 58 AAERs against companies which were delisted,
not trading in NASDAQ or NYSE and taken private (Merged, Acquired or Liquidated) until
31-12-2016. I exclude companies in which the legal enforcement amount is zero (15),
companies which are enforced more than one time, choosing the most recent (3) and firms
that do not have complete fiscal information in The Center for Research in Security Prices
(CRSP) between three years prior and three years after the enforcement date (5). This results
in a final sample of 45 companies.
Panel B of Table 1 shows that fraud firms are widely dispersed among industries,
without any clusters of firms in any industry in specific. Panel C of Table 1 indicates that
69 percent of the frauds involve Foreign Corrupt Practices Act (i.e., includes mainly
fraudulent acts related to accounting manipulation strategies with the goal to increase sales,
to hide actual losses and provide better financial and economical ratios). Panel D
demonstrates that the number of cases analysed per year are nearly identical and that SEC’s
enforcement median was the highest in the first year of analysis (twelve million dollars),
decreasing to five and a half million dollars in the last year of analysis (2013).

15
TABLE 1
Fraud Sample Selection, Fraud Firm Characteristics, and Control Group
Panel A: Sample Selection of 45 firms subject to enforcement actions by
the SEC between 2010 and 2013
Accounting and Auditing Enforcement Releases in the Securities Enforcement
Empirical Database (SEED)
608
less AAERs outside the scope of analysis period (before 2010 and after 2013)
396
less AAERs against subsidiaries firms not listed in NASDAQ or NYSE and
firms that got delisted, bankrupt or taken private in the period (2007-2016)
144
less AAERs which enforcements amount is zero, duplicated
18
less firms lacking fiscal information in CRSP for the period (2007-2016)
5
Final Sample
45

16
Panel B: Distribution of Fraud Firms by SIC Code
Two-Digit SIC
Code
Industry Description Nº of
Firms
13 Oil and Gas Extraction 5
20 Food and kindred Products 3
23 Apparel 1
28 Chemicals 4
29 Petroleum Refining 2
33 Primary Metal Industries 1
34 Fabricating Metals 2
35 Machinery and Computer Equipment 1
36 Electrical 2
37 Transportation Equipment 2
38 Measurement Instruments 5
44 Water Transportation 1
49 Electric, Gas, Sanitary Services 1
51 Wholesale Goods 1
59 Miscellaneous Retail 1
60 Depository Institutions 2
61 Nondepository Credit Institution 2
63 Insurance 1
64 Insurance Agents, Brokers and Services 1
73 Business Services 3
80 Health Services 1
87 Engineering, Accounting, Research, Management Services 1
99 Miscellaneous 2
Panel C: Fraud-Specific Statistics
Allegation Type Number of firms Percentage Total
Foreign Corrupt Practices Act 31 69
Issuer Reporting and Disclosure 14 31
Panel D: Fraud Size
2010 2011 2012 2013
Number of cases 13 12 8 12
Median fraud amount (in millions $) 12 3.88 5.50 5.51

17
3.2 Control Sample
To study the effects of SEC’s enforcements in fraudulent firms, it is also imperative to
study how non-fraud firms (firms not enforced by SEC between 2007-2016) react to SEC’s
investigation disclosure. Therefore, we choose companies that have similar size (measured
by Total Assets), Sales (Net Sales), Market Value and that are within the same industry (2-
SIC code) and stock exchange (NYSE and NASDAQ). Table 2 demonstrates that there are
no significant differences in the means and medians of our fraud and control group. The
variables were taken from Wharton Research Data Services (WRDS).
TABLE 2
Matching Statistics for Fraud and Control Group
Variable
Fraud Firm
mean
(in millions)
Control Firm
mean
(in million) t stat
Fraud Firm
median
(in millions)
Control Firm
median
(in million) p-value
Total Assets 144,451 117,840 0.99 14,994 15,340 0.16
Net Sales 31,207 27,372 1.15 8,566 11,101 0.29
Market Value 40,244 45,918 -1.02 8,516 12,056
_____________________
Fraud firms are matched with control firm on the basis of year, net sales, size (Total Assets), Market Value,
and SIC code. The t-statistic is for the difference between means of the matched pairs. The p-value is for
the Wilcoxon matched-pairs signed-rank test.
3.3 Variables
3.3.1 Abnormal Returns
In order to study the impacts of certain episode in financial markets, one should conduct
an event study to analytically understand its effects and realize if it derives from the efficient
market hypothesis (EMH). Considering a Semi-Strong Market Efficiency hypothesis –
stock prices incorporate all market and public information available – there should be no
presence of abnormal returns (AR) which is a EMH anomaly.
Taking this into account, if one is able to prove the presence of unpredictable returns in
a given stock or index by a significant event or changes in regulatory activity, such as SEC’s

18
enforcements, then one could determine the power of the event, only if the ARs are
statistically significant. Ultimately, an event study aims to study the impacts of a certain
event on firm’s market value. Initially, one should start by describing the event in question,
the time-period subject to analysis (number of days surrounding the event day – event
window) and the estimation period, used to estimate the parameters.
The events under analysis respects to SEC’s enforcements dates against US public
traded companies between 2010 and 2013. The event windows used to retrieve the abnormal
returns are 21 days around the event dates [-10,10] (period from T1 to T2), 7 days [-3,3]
(period from T2 to T3) and 1 day prior to the event [-1,0] (period from T3 to T4), following
Murphy et al. (2009) methodology. The estimation window respects to 250 daily returns
before the beginning of the event window (period from T0 to T1), thus we have an acceptable
basis to calculate the relevant parameters in order to guarantee that “estimators for the
parameters of the normal return model are not influenced by the returns around the event”
(MacKinlay, 1997).
The formula for the Abnormal Returns is the following:
𝐴𝑅𝑖𝑡 = 𝑅𝑖𝑡 − 𝐸(𝑅𝑖𝑡|𝑋𝑡) (1)
Where 𝐴𝑅𝑖𝑡, 𝑅𝑖𝑡 and 𝐸(𝑅𝑖𝑡|𝑋𝑡) are the abnormal, actual and normal returns over period
t. 𝑋𝑡 is the known information to calculate the normal return model. The actual return relates
to the rate return on stock i over day t whereas the expected normal return is statistically
calculated with the available data. In order to calculate the normal returns, we need to
choose a statistical model in which returns follows a set of statistical assumptions. We are
going to use the market model since it assumes a linear relation between market’s return
and firm’s returns as well as resolving the sensitivity of results based on CAPM restrictions.
Thus, to measure the Normal Returns Model the following formula was applied for the
estimation window:
𝑅𝑖𝑡 = 𝛼 + 𝛽𝑅𝑚𝑡 + 𝜀𝑖𝑡 (2)
Since the abnormal returns computations are not included in the estimation window, the
parameters �̂� and �̂� are not residuals in the OLS. Therefore, abnormal returns can be
calculated as followed:

19
𝐴𝑅𝑖𝑡 = 𝑅𝑖𝑡 − �̂� − �̂�𝑅𝑚𝑡 (3)
To get a broader understanding of the results, we use an index portfolio method, value-
weighted returns (market returns as S&P 500 composite index) in computing the cumulative
abnormal returns (CAR):
𝐴𝑅𝑡 =1
𝑁∑ 𝐴𝑅𝑖𝑡
𝑁𝑖=1 (4)
𝐶𝐴𝑅[𝑇1, 𝑇2] = ∑ 𝐴𝑅𝑡𝑇2𝑇1
(5)
The statistical significance of all the variables are calculated using a cross-sectional
standard error, t-statistics for the mean abnormal returns.
3.3.2 Changes in Risk
SEC’s investigation disclosure and the following enforcements on firms due to alleged
illegal activities can, not only affect share returns but also the cost of acquiring new funds
– cost of capital. Bid-ask spreads movements can be used as a proxy to investigate whether
investors of enforced firms demand higher returns ex post (Dechow et al., 1996) as firm’s
risk increases due to eventual litigation risk which can result in significant distress costs,
mainly related to reputation losses and business deterioration (loss of key employees, clients
and good investing opportunities).
Following Dechow et al. (1996) approach we obtain the daily bid-ask spread data for
the 90 firms (45 fraudulent and 45 in the control group) from CRSP. We also retrieve
directly from CRSP both daily price and volume as they are important variables in
explaining bid-ask spreads’ behaviour. Although the number of market makers is an
important variable, it was not possible to collect the data. Our event period respects to forty
days before SEC’s enforcement announcement and forty days after the announcement, [-
40,40]. Our estimation window respects to 200 trading days before the beginning of the
event in order to calculate the parameters α and β for each company through the following
formula:
𝐵𝑖𝑑_𝑎𝑠𝑘 𝑠𝑝𝑟𝑒𝑎𝑑𝑖 = 𝛼0 + 𝛽1𝑉𝑜𝑙𝑢𝑚𝑒𝑖 + 𝛽2𝑃𝑟𝑖𝑐𝑒𝑖 (6)

20
Where for firm i:
Volumei = log of bid−ask
(bid+ask)/2
Pricei = log of bid price
From each regression we get the predicted values of α0, β1 and β2 which are going to be
used in the following equation to calculate the predicted bid-ask spreads for each firm i on
day t relative to SEC’s enforcement day:
𝑃𝑟𝑒𝑑𝑖𝑐𝑡𝑒𝑑𝐵𝑖𝑑_𝑎𝑠𝑘 𝑠𝑝𝑟𝑒𝑎𝑑𝑖𝑡 = 𝛼0 + �̂�1𝑉𝑜𝑙𝑢𝑚𝑒𝑖𝑡 + �̂�2𝑃𝑟𝑖𝑐𝑒𝑖𝑡 (7)
The difference between the actual bid-ask spread for firm i on day t and the predicted
bid-ask spread for firm i on day t is calculated to determine the residual bid-ask spreads.
3.3.3 Governance Changes
Event studies are used to study market episodes such as changes in regulation. Studying
the magnitude of stock returns and changes in risk (bid-ask spreads) related to SEC’s
enforcements against fraudulent firms is important, however short-windowed. Thus, it is
imperative to study the characteristics of the enforced and control group firms with the goal
to understand and spot the main differences in key corporate governance mechanisms in
these two groups of firms which could valuably contribute in discovering certain patterns
of illegal conduct within businesses and improve SEC’s timing in detecting white-collar
crime activity.
In prior research (Beasley et al., 1999 and Farber, 2005) fraud firms show, in general, a
weaker corporate governance structure than non-fraud firms, in several key areas before
SEC’s announcement. However, research also shows that fraud firms tend to improve their
governance ex post, becoming more similar to the control firms (non-fraud). To analyse the
changes in corporate governance, we retrieve for each firm its Environmental, Social and
Governance report (ESG) from Thompson Reuters Eikon.
We were able to retrieve governance information between one-year prior (Initial) to the
event and four years after the Initial (Final) for 32 fraud firms matching the number of firms
for our control group. This gives us a sample of 64 companies between the years 2009-
2016. Following Farber (2005) methodology we collect the following governance variables

21
from Thompson Reuters Eikon: Size of the board of directors (#BoardSize), number of
board meetings per year (#BoardMet), proportion of outside directors in the board
(OutsideDir%), number of outside directors (#OutsideDir) calculated as OutsideDir% times
#BoardSize, percentage of firms where the CEO also occupies the position as chairman of
the board (CEO=CHAIRMAN%) and the total compensation per director (Compensation).
CEO=CHAIRMAN% is a dummy variable where if the CEO is also chairman of the board
turns the value of 1 otherwise 0. From Thomson Reuters Institutional (13f) Holdings we
collect the following variables: percentage of outstanding shares held by blockholders
(Block%) and the percentage of institutional ownership (InstOwn%).
4. Results & Discussion
All things considered, one would expect that regulatory sanctions by SEC would
evidently affect negatively stocks’ returns, positively firms’ risk and empower mainly, fraud
firms to implement essential changes in their corporate governance mechanisms. Therefore,
we predict that fraud firms experience negative CARs around the event, become riskier for
investors (positive changes in residuals bid-ask spreads) and has poorer governance
mechanism than non-fraud firms. On the other side, one would expect that the control group,
which operates in the same industry, would beneficiate from this event, seeing its share
price soar (positive CARs), as its competitors incur in several costs (e.g. amount of the legal
penalty and reputational losses). Moreover, one could expect smaller changes in the control
group risk as it experiences some spillover effect from the event. Finally, one could expect
that non-fraud firms have stronger corporate governance than fraud firms in order to prevent
illegal practises by their management.
4.1 Event Study Results
The study concentrates on the 21-day event window [-10,10] to better capture the
magnitude of share price movement in a wider time period before and after fraud
announcement than a 3-day window. Cumulative abnormal returns are shown, followed by
a summarizing section for the other event windows (3-day window and 1-day window),
both for fraud firms and control group computed using value-weighted index.

22
Figure 1 presents a plot of the cumulative abnormal returns. The plot indicates that
before the event [-10, -1] fraud firms experience, on average, CAR of -0.39%, recording a
maximum loss on day -4 (-0.69%). On the day of the event, fraud firms record, on average,
a negative CAR of -0.18%. These results imply that there is a leakage of information prior
to the official fraud announcement. Nevertheless, from [+1, +10] fraud firms experience,
on average, a positive CAR of 0.36%, with the maximum on day +7 (0.78%). These results
suggest that after SEC’s enforcement and knowing the value of the settlement amount,
investors start believing again in the company. Moreover, since our sample is based on
AAERs for big public traded companies for a period after the financial crisis of 2007-08,
we can conclude that regulators act late and ineffectively in the use of their powers and that
legal penalties does not affect significantly firm’s returns. Furthermore, at this time, big
companies already did the necessary adjustments in their businesses to prevent being caught
and have switch to more advanced and innovative ways of committing financial fraud.
Overall, fraud firms in the 21-day window, the only day with significant losses, is at the
first day of the event window (-10) with an average loss of -0.36% at a level of significance
of 5% (t = -2.14).
For the control group, we discover a medium negative correlation of -0.47 between the
two groups for the 21-day event window. Moreover, the control group evidences, on
average, positive CAR of 0.17% before the event [-10, -1], recording a maximum gain on
day -3 (0.62%). This evidences that investors in non-fraud firms benefit, in the short-run,
with their competitors being sued. On the day of the event, control firms record, on average,
a positive CAR of 0.30%. However, after the event day [+1, +10] control firms record, on
average, negative CAR of -0.08%, recording a minimum of -0.41% in the last day of the
event window. These results imply that big corporations being legally enforced, not only
affects them but also other players in the same industry – spillover effect. Overall, control
firms in the 21-day window, the only day with significant losses, is at the first day of the
event window (-10) with an average loss of -0.34% at a level of significance of 10% (t = -
1.93).

23
FIGURE 1
Cumulative Abnormal Return
Cumulative abnormal return (CAR) of fraud and control group over 21-day event
window
Table 3 presents the summary statistics for the other two event windows: 7-day and 2-
day window. For both event windows, we conclude that CARs are not statistically
significant and that mean CARs signals changes for both groups. As the event window
becomes narrower around the event day, fraud firms experience positive CARs as control
firms experience, on average negative CARs. However, fraud firms tend to have wider
range of CARs for all event windows. These results are consistent with previous research
that legal enforcements are not significant for firm’s loss.
-1,0%
-0,5%
0,0%
0,5%
1,0%
-10 -8 -6 -4 -2 0 2 4 6 8 10
Control
Fraud

24
TABLE 3
Summary Statistics: Fraud and Control firms CARs
Panel A: Fraud Companies
Mean Min Max t-stat
CAR (-1;0) 0.15% -5.57% 6.71% 0.52
CAR (-3;+3) 0.49% -13.34% 11.43% -1.00
CAR (-10;+10) -0.02% -19.48% 19.74% -0.31
Panel B: Control Companies
CAR (-1;0) -0.13% -5.90% 4.57% -0.67
CAR (-3;+3) -0.01% -8.74% 10.94% 0.1
CAR (-10;+10) 0.06% -17.36% 17.83% 0.02
4.2 Residual bid-ask spread – Changes in Firm’s Risk
The study concentrates in the changes in the means of the residuals bid-ask spreads forty
days before SEC’s announcement [-40, -1] and forty days after [+1, +40]. Figure 2 and
Figure 3 presents two plots of the changes in the residuals bid-ask spread for fraud and
control firms, respectively and the average for the both. Furthermore, Table 4 presents the
summary statistics for the mean changes of the residuals bid-ask spread.
Figure 2 presents a plot of the residual bid-ask spreads for the fraud sample. The plot
indicates that prior to SEC’s enforcement date and thereafter [-40, +40], the average residual
bid-ask spread is negative (-0.03). Cross-sectional analysis, indicates that we have thirty-
four days where fraud firms experience statistically significant changes in risk. Three days
at a level of significance of 10%, sixteen days at a level of significance of 5% and fifteen
days at a level of significance of 1%. Prior to announcement [-40, -1], the average residual
bid-ask spread is negative (-0.04). However, after the announcement [+1, +40] the average
residual bid-ask spread is negative but bigger (-0.027). Moreover, this changes in the means
residual bid-ask spread are statistically significant at a level of 1% (t = 3.23). These results
are consistent with previous research, implying that investors after regulatory enforcements,
see fraud firms as riskier, demanding higher returns on their investment therefore exercising
more pressure on management to provide better results in the future.

25
FIGURE 2
Residual bid-ask spreads – Fraud firms
Residual bid-ask spreads for fraud firms around the SEC’s enforcement. The straight
lines are the mean residual bid-ask spread prior and after the enforcement (excluding day
0).
Figure 3 presents a plot of the residual bid-ask spreads for the control sample. The plot
indicates that prior to SEC’s enforcement date and thereafter [-40, +40], the average residual
bid-ask spread is negative (-0.11). Cross-sectional analysis, indicates that we only have one
day (-31) where control firms experience statistically significant changes in risk at a level
of significance of 10%. Prior to announcement [-40, -1], the average residual bid-ask spread
is negative (-0.12). However, after the announcement [+1, +40] the average residual bid-
ask spread is negative but bigger (-0.11). Moreover, this changes in the means residual bid-
ask spread are not statistically significant (t = 1.37). These results are consistent with
previous research, implying that non-fraud firms are seen as less risky by investors. On the
other hand, control firms became non-significantly riskier as they are affected by the
significant positive changes in risk of the fraud companies, proving that there is some
spillover effect between firms that operate in the same industry.
-0,1
-0,05
0
0,05
-40 -30 -20 -10 0 10 20 30 40
Res
idu
al b
id-a
sk s
pre
ad
Days relative to enforcement
26
FIGURE 3
Residual bid-ask spreads – Control firms
Residual bid-ask spreads for control firms around the SEC’s enforcement. The straight
lines are the mean residual bid-ask spread prior and after the enforcement (excluding day
0).
Table 4 presents the summary statistics for the changes in mean residual bid-ask spreads
for fraud and control firms. Furthermore, Table 4 presents the R-squared value of the predicted
bid-ask spreads model in which, our values are lower than previous research.
TABLE 4
Summary Statistics: Residual bid-ask spreads for fraud and control firms
Panel A: Fraud Companies
Mean Min Max
[- 1, - 40] -0.04 -0.07 0.00
[+1, +40] -0,03 -0.08 0.04
(t-stat) (3.23)***
R-squared 0.31
Panel B: Control Companies
[- 1,- 40] -0.12 -0.17 -0.05
[+1,+40] -0.11 -0.18 -0.04
(t-stat) (1.37)
R-squared 0.18
*, **, *** Significant at the 10 percent, 5 percent and 1 percent levels, based on differences in means
-0,2
-0,15
-0,1
-0,05
0
-40 -30 -20 -10 0 10 20 30 40
Res
idu
al b
id-a
sk s
pre
ad
Days relative to enforcement

27
4.3 Governance Changes
The study concentrates on analysing the mean changes in key corporate governance
variables, one year prior to SEC’s enforcement (Initial Year) and the following four years
being the four year the last year of the period analysis (Final Year) with the goal to
understand either or not governance is important in controlling corporate criminal acts.
Table 5 provides tests of significance in governance changes variables for 32 matching pairs
of fraud and control firms. The mean changes for the governance variables are measured
with the Initial Year as basis.
Table 5, Panel A, provides evidence that the board of directors’ characteristics are, in
general, identical for fraud and control firms. Fraud and control firms’ boards are highly
controlled by outside directors, however control firms have higher percentage of outside
directors (OutsideDir%) in their boards, have smaller board size (#BoardSize) and have less
board meetings (#BoardMet) than fraud firms for all the period analysis. These results are
consistent with previous research which states that firms’ management decisions with
smaller boards are easier to be monitored. The mean changes in governance variables during
the analysis are not statistically significant for any of the variables. However, at the last year
of the analysis period, both fraud and control firms have increased the percentage of outside
directors and fraud firms have increased the average number of board meetings, from 8.69
to 9.4. Overall, we find that, contrary to previous research, independent directors were not
better monitors than inside directors in the Financial Crisis of 2007-08 and afterwards. One
possible explanation for the incapacity of outside directors to monitor criminal management
decisions tends with the innovative and more complexed mechanisms of financial
misconduct, unveiled during and after the recent Financial Crisis which were normally large
and complexed schemes with a multitude of different players.
Table 5, Panel B, provides evidence that in the year prior to SEC’s enforcement, on
average, 56.23 percent of CEOs of fraud firms are also the board’s chairman
(CEO=CHAIRMAN%). Interestingly we find that the percentage of CEOs of control firms
who also are board’s chairman is higher (78.13) and the mean difference between fraud and
control firms is statistically significant at a 10% level confidence (t = -1.89). During the
analysis period, we see significant changes in CEO=CHAIRMAN%, except for year 1. In
the final year, there is no significant differences between fraud and control firms regarding

28
CEO=CHAIRMAN%. This gives us enlightenment that it is not because managers also
possess the position of chairman that they can manipulate or influence the board to act on
behalf on their own interests, refuting previous research.
TABLE 5
Univariate Comparisons of Board of Director and Other Governance Variables
Panel A: Board of Directors Characteristics
Year
Variables Firm Initial 1 2 3 4 Final
OutsideDir% Fraud 81.43 1.50 2.21 2.22 1.73 83.16
Control 83.15 -0.06 1.01 0.49 1.76 84.91
(t-stat) (-0.61) (1.16) (0.86) (0.99) (-0.02) (-0.64)
#OutsideDir Fraud 9.38 -0.13 -0.16 -0.09 -0.09 9.28
Control 9.31 -0.03 0.03 0.25 0.13 9.44
(t-stat) (0.1) (-0.28) (-0.46) (-0.71) (-0.50) (-0.28)
#BoardSize Fraud 11.53 -0.09 -0.31 -0.25 -0.19 11.34
Control 11.22 0.03 -0.03 0.25 0.00 11.22
(t-stat) (0.52) (-0.48) (-0.71) (-1.14) (-0,44) (0.23)
#BoardMet Fraud 8.69 0.66 -0.09 0.15 1.05 9.4
Control 8.25 0.19 -0.50 0.06 -0.16 8.09
(t-stat) (0.55) (0.64) (0.51) (0.04) (1.00) (1.53)
Panel B: Other Governance Variables
CEO=CHAIRMAN% Fraud 56.25 -3.13 9.38 12.50 9.38 65.63
Control 78.13 -3.13 -6.25 -6.25 -9.38 68.75
(t-stat) (-1.89)* (0.00) (1.91)* (2.17)** (2.17)** (-0.26)
Block% Fraud 12.02 0.76 4.34 5.99 10.17 22.20
Control 13.24 3.17 5.08 7.86 9.14 22.38
(t-stat) (-0.39) (-1.04) (-0.22) (-0.61) (0.29) (-0.05)
InstOwn% Fraud 0.61 -0.01 -0.02 -0.04 -0.05 0.56
Control 0.76 -0.01 -0.03 -0.05 -0.09 0.68
(t-stat) (-3.06)*** (0.27) (0.30) (0.36) (1.86)* (-2.48)**
Compensation Fraud 2,600,041 -5,365 34,731 89,359 474,677 3,074,719
Control 2,308,468 384,415 542,605 734,982 726,780 3,035,248
(t-stat) (0.95) (-1.46) (-1.81)* (-2.45)** (-0.98) (0.12)
*, **, *** Significant at the 10 percent, 5 percent and 1 percent levels, based on differences in means for the 32
matched pairs

29
Panel B of Table 5 also indicates that for control and fraud firms, the percentage of
blockowners, who holds more than 5% of shares outstanding (Block%), is identical and
increases for all the years in the analysis period. We also find that the percentage of
institutional ownership (InstOwn%) is significant lower, at a confidence level of 1%, in
fraud firms one year prior to the regulatory enforcement (t = -3.06). The mean changes in
InstOwn% are negative for all the period analysis, however only significant at a confidence
level of 10% in the year 4 (t = 1.86). However, the mean changes in InstOwn% between
fraud and control firms have decreased, still being significant at a confidence level of 5% (t
= -2.48) at the Final Year. Finally, we discover that one year prior to legal enforcement, the
mean directors’ compensation (Compensation) is not statistically significant, being higher
in fraud firms. However, in year 1 the mean changes in Compensation are negative for the
fraud firms, confirming that criminal conduct affects directors’ compensation, however not
significantly. Year 2 and 3 in our period analysis records a significant positive changes in
directors’ compensation at a confidence level of 10% (t = -1.81) and 5% (t = -2.45),
respectively. In the Final year of our analysis period, we conclude that there are no
significant differences in Compensation between fraud and control firms, however there is
some evidence that directors’ compensation is affected by corporate misconduct.
In sum, we find that one year prior to SEC’s enforcement, fraud firms and control firms
were somehow identical, however fraud firms present slightly poorer corporate governance.
The mean percentage of outside directors in fraud firm’s board is lesser than in control
firms, the mean board size is larger for fraud firms, mean institutional ownership is
significantly lower in fraud firms and mean director’s compensation is negatively affected
only in the year of SEC’s investigation disclosure and following enforcement, being quickly
fixed for the following years. Furthermore, we find evidence that in the following years,
fraud firms make necessary changes in their governance mechanisms in order to restore
their reputation thereby restoring investors’ confidence therefore while becoming more
similar to non-fraud firms which have stronger corporate governance.

30
5. Conclusion
This study gives enlightenment on the relationship between corporate fraud and
regulatory sanctions, and how it affects firm’s returns, firm’s risk in the short-run.
Moreover, for the long-run, it studies the mean changes in governance variables applied by
the enforced firms in order to prevent same actions in the future. It uses a sample of 45 firms
enforced by the SEC from 2010 to 2013, to study the changes in stock returns and changes
in risk. For the mean changes in governance variables, our sample is 32 matched-paired
firms (fraud and control groups), and it studies from one year prior to SEC’s enforcement
year and the four years after, which gives us a sample between 2009 to 2016.
This study reveals that legal penalties do not affect significantly firm’s returns, which
is consistent with Murphy et al. (2009) results. Some plausible reasons for it can be related
with the sample retrieved where most of the firms are big size firms, consistent with Field
et.al (2005) “deep pockets” idea that large firms have higher litigation risk because fraud’s
benefits outrank its costs. Also the period in analysis, period after the recent financial crisis,
companies may have already implemented imperative changes in their business, and market
regulators’ inefficiency in finding out criminal financial activity. This study also finds that
firm’s risk (residual bid-ask spreads) significantly increases (t = 3.23) for fraud firms after
regulatory enforcements as investors perceive enforced firms as riskier than non-fraud
firms, demanding higher returns on its investments, which is consistent with previous
research (Dechow et al., 1996; Murphy et al., 2009).
Finally, this study shows that fraud and non-fraud firms are somehow identical in terms
of their corporate governance mechanisms. Board of directors’ variables are very similar
between fraud and non-fraud firms which is contrary to previous research, that outside
directors are better monitors of management decisions. Plausible reasons for these results
can be that the financial crisis of 2007-08 was characterized by very complexed schemes,
with complexed financial instruments involved that nobody fully understood the real
consequences of those decision. Furthermore, the integration of external important players,
like rating agencies, banks and even the government could have helped in rationalizing
fraudulent management decisions, “if everybody does it” (Albrecht et al. 2006). Moreover,
the study shows that director’s compensation is affected by legal penalties and that fraud
firms in the following years after SEC’s enforcement tend to improve their governance
variables, by becoming more similar to their non-fraud firms.

31
This study contributes to the accounting literature. It adds knowledge of the link
between financial fraud, litigation risk and their impact on firm’s financial distress costs. It
also sheds light on the inefficiency of market regulators (SEC), during and after the recent
financial crisis, in investigating and prosecuting financial misconduct, and that financial
fraud did not decrease but have become more complexed and harder to be detected (Cohen
et al., 2008).

32
6. References
ACFE. (2016). Report to the Nations. Available at: http://www.acfe.com/rttn2016.aspx
Aharony, J., Liu, C., & Yawson, A. (2015). Corporate litigation and executive
turnover. Journal of Corporate Finance, 34, 268-292.
Albrecht, W. S., Albrecht, C., & Albrecht, C. C. (2008). Current trends in fraud and its
detection. Information Security Journal: A Global Perspective, 17(1), 2-12.
Ali, A., Klasa, S., & Yeung, E. (2014). Industry concentration and corporate disclosure
policy. Journal of Accounting and Economics, 58(2), 240-264.
Amiram, D., Owens, E., & Rozenbaum, O. (2016). Do information releases increase or
decrease information asymmetry? New evidence from analyst forecast
announcements. Journal of Accounting and Economics, 62(1), 121-138.
Beasley, M. S. (1996). An empirical analysis of the relation between the board of director
composition and financial statement fraud. Accounting review, 443-465.
Beasley, M. S., Carcello, J. V., Hermanson, D. R., & Lapides, P. D. (2000). Fraudulent
financial reporting: Consideration of industry traits and corporate governance
mechanisms. Accounting Horizons, 14(4), 441-454.
Bebchuk, L., Cohen, A., & Ferrell, A. (2008). What matters in corporate governance?. The
Review of financial studies, 22(2), 783-827.
Benston, G. J., & Hartgraves, A. L. (2002). Enron: what happened and what we can learn
from it. Journal of Accounting and Public Policy, 21(2), 105-127.
Bertomeu, J., & Magee, R. P. (2015). Mandatory disclosure and asymmetry in financial
reporting. Journal of Accounting and Economics, 59(2), 284-299.
Brickley, J. A., Coles, J. L., & Terry, R. L. (1994). Outside directors and the adoption of
poison pills. Journal of financial Economics, 35(3), 371-390.
Brochet, F., & Srinivasan, S. (2014). Accountability of independent directors: Evidence from
firms subject to securities litigation. Journal of Financial Economics, 111(2), 430-449.
Byrd, J. W., & Hickman, K. A. (1992). Do outside directors monitor managers?: Evidence
from tender offer bids. Journal of financial economics, 32(2), 195-221.

33
Carmassi, J., Gros, D., & Micossi, S. (2009). The global financial crisis: Causes and
cures. JCMS: Journal of Common Market Studies, 47(5), 977-996.
Coles, J. L., Daniel, N. D., & Naveen, L. (2008). Boards: Does one size fit all? Journal of
financial economics, 87(2), 329-356.
Core, J. E., Holthausen, R. W., & Larcker, D. F. (1999). Corporate governance, chief
executive officer compensation, and firm performance. Journal of financial economics, 51(3),
371-406.
DeAngelo, H., DeAngelo, L., & Wruck, K. H. (2002). Asset liquidity, debt covenants, and
managerial discretion in financial distress:: the collapse of LA Gear. Journal of financial
economics, 64(1), 3-34.
Dechow, P. M., Sloan, R. G., & Sweeney, A. P. (1996). Causes and consequences of earnings
manipulation: An analysis of firms subject to enforcement actions by the SEC. Contemporary
accounting research, 13(1), 1-36.
DuCharme, L. L., Malatesta, P. H., & Sefcik, S. E. (2004). Earnings management, stock
issues, and shareholder lawsuits. Journal of financial economics, 71(1), 27-49.
Eigner, P., & Umlauft, T. S. (2015). The great depression (s) of 1929-1933 and 2007-2009?
Parallels, differences and policy lessons.
Eng, L. L., & Mak, Y. T. (2003). Corporate governance and voluntary disclosure. Journal of
accounting and public policy, 22(4), 325-345.
Fama, E. F. (1980). Agency Problems and the Theory of the Firm. Journal of political
economy, 88(2), 288-307.
Farber, D. B. (2005). Restoring trust after fraud: Does corporate governance matter?. The
Accounting Review, 80(2), 539-561.
Feroz, E. H., Park, K., & Pastena, V. S. (1991). The financial and market effects of the SEC's
accounting and auditing enforcement releases. Journal of Accounting Research, 107-142.
Fich, E. M., & Shivdasani, A. (2007). Financial fraud, director reputation, and shareholder
wealth. Journal of Financial Economics, 86(2), 306-336.
Field, L., Lowry, M., & Shu, S. (2005). Does disclosure deter or trigger litigation?. Journal of
Accounting and Economics, 39(3), 487-507.

34
Gilson, S. C. (1990). Bankruptcy, boards, banks, and blockholders: Evidence on changes in
corporate ownership and control when firms default. Journal of Financial Economics, 27(2),
355-387.
Gilson, S. C., & Vetsuypens, M. R. (1993). CEO compensation in financially distressed firms:
An empirical analysis. The Journal of Finance, 48(2), 425-458.
Harford, J., Mansi, S. A., & Maxwell, W. F. (2012). Corporate governance and firm cash
holdings in the US. In Corporate governance (pp. 107-138). Springer Berlin Heidelberg.
He, J. J., & Tian, X. (2013). The dark side of analyst coverage: The case of
innovation. Journal of Financial Economics, 109(3), 856-878
Healy, P. M., & Palepu, K. G. (2001). Information asymmetry, corporate disclosure, and the
capital markets: A review of the empirical disclosure literature. Journal of accounting and
economics, 31(1), 405-440.
Healy, P. M., & Wahlen, J. M. (1999). A review of the earnings management literature and its
implications for standard setting. Accounting horizons, 13(4), 365-383.
Jensen, M. C., & Meckling, W. H. (1976). Theory of the firm: Managerial behavior, agency
costs and ownership structure. Journal of financial economics, 3(4), 305-360.
Jensen, M. C. (1986). Agency costs of free cash flow, corporate finance, and takeovers. The
American economic review, 76(2), 323-329.
Jensen, M. C. (1993). The modern industrial revolution, exit, and the failure of internal
control systems. the Journal of Finance, 48(3), 831-880.
Jensen, M. C., & Murphy, K. J. (1990). Performance pay and top-management
incentives. Journal of political economy, 98(2), 225-264.
Karpoff, J. M., Lee, D. S., & Martin, G. S. (2008). The cost to firms of cooking the
books. Journal of Financial and Quantitative Analysis, 43(3), 581-611.
Karpoff, J. M., & Lott Jr, J. R. (1993). The reputational penalty firms bear from committing
criminal fraud. The Journal of Law and Economics, 36(2), 757-802.
Kothari, S. P., Shu, S., & Wysocki, P. D. (2009). Do managers withhold bad news? Journal of
Accounting Research, 47(1), 241-276.

35
Lang, M. H., & Lundholm, R. J. (1996). Corporate disclosure policy and analyst
behavior. Accounting review, 467-492.
Leuz, C., Triantis, A., & Wang, T. Y. (2008). Why do firms go dark? Causes and economic
consequences of voluntary SEC deregistrations. Journal of Accounting and Economics, 45(2),
181-208.
Liu, C., Aharony, J., Richardson, G., & Yawson, A. (2016). Corporate litigation and changes
in CEO reputation: Guidance from US Federal Court lawsuits. Journal of Contemporary
Accounting & Economics, 12(1), 15-34.
MacKinlay, A. C. (1997). Event studies in economics and finance. Journal of economic
literature, 35(1), 13-39.
Malmendier, U., & Tate, G. (2005). CEO overconfidence and corporate investment. The
journal of finance, 60(6), 2661-2700.
Maxwell, J. C. (2007). The 21 irrefutable laws of leadership: Follow them and people will
follow you. Thomas Nelson Inc.
McConnell, J. J., & Servaes, H. (1990). Additional evidence on equity ownership and
corporate value. Journal of Financial economics, 27(2), 595-612.
McVay, S., Nagar, V., & Tang, V. W. (2006). Trading incentives to meet the analyst
forecast. Review of Accounting Studies, 11(4), 575-598.
Morck, R., Shleifer, A., & Vishny, R. W. (1988). Management ownership and market
valuation: An empirical analysis. Journal of financial economics, 20, 293-315.
Murphy, D. L., Shrieves, R. E., & Tibbs, S. L. (2009). Understanding the penalties associated
with corporate misconduct: An empirical examination of earnings and risk. Journal of
Financial and Quantitative Analysis, 44(1), 55-83.
Opler, T. C., & Titman, S. (1994). Financial distress and corporate performance. The Journal
of Finance, 49(3), 1015-1040.
Palmrose, Z. V., Richardson, V. J., & Scholz, S. (2004). Determinants of market reactions to
restatement announcements. Journal of accounting and economics, 37(1), 59-89.
Pauly, L. W. (2009). The old and the new politics of international financial stability. JCMS:
Journal of Common Market Studies, 47(5), 955-975.

36
Ribstein, L. E. (2002). Market vs. regulatory responses to corporate fraud: A critique of the
Sarbanes-Oxley Act of 2002. J. Corp. L., 28, 1.
Roychowdhury, S. (2006). Earnings management through real activities
manipulation. Journal of accounting and economics, 42(3), 335-370.
Skinner, D. J., & Sloan, R. G. (2002). Earnings surprises, growth expectations, and stock
returns or don't let an earnings torpedo sink your portfolio. Review of accounting studies, 7(2),
289-312.
Skinner, D. J. (1994). Why firms voluntarily disclose bad news. Journal of accounting
research, 32(1), 38-60.
Skinner, D. J. (1997). Earnings disclosures and stockholder lawsuits. Journal of Accounting
and Economics, 23(3), 249-282.
Soltes, E. (2016). Why They Do It: inside the mind of the white-collar criminal.
PublicAffairs.
Sutherland, E. H. (1940). White-collar criminality. American sociological review, 5(1), 1-12.
Warner, J. B., Watts, R. L., & Wruck, K. H. (1988). Stock prices and top management
changes. Journal of financial Economics, 20, 461-492.
Weiss, L. A., & Wruck, K. H. (1998). Information problems, conflicts of interest, and asset
stripping:: Chapter 11's failure in the case of Eastern Airlines1We would like to thank Sherry
Roper and Kathleen Ryan for research assistance, Todd Pulvino for providing us with data on
aircraft pricing, and Ed Altman for providing us with bond price data. We received useful
feedback from colleagues at Harvard University, INSEAD and Tulane University, and in
seminars at Rutgers, NBER, and Jonkoping. We are also grateful to John Ayer, George Baker
.... Journal of Financial Economics, 48(1), 55-97.
Yermack, D. (1996). Higher market valuation of companies with a small board of
directors. Journal of financial economics, 40(2), 185-211.
Yu, X. (2013). Securities fraud and corporate finance: Recent developments. Managerial and
Decision Economics, 34(7-8), 439-450.
Zang, A. Y. (2011). Evidence on the trade-off between real activities manipulation and
accrual-based earnings management. The Accounting Review, 87(2), 675-703.

37
7. Appendix
TABLE 6
Defendant Name Date Allegation Type Payment Volume ($)
Archer-Daniels-Midland Company 20-Dec-2013 Foreign Corrupt Practices Act 36 467 366
Assurant, Inc. 21-Jan-2010 Issuer Reporting and Disclosure 3 500 000
Alliance One International, Inc. 06-Aug-2010 Foreign Corrupt Practices Act 10 000 000
Aon Corporation 20-Dec-2011 Foreign Corrupt Practices Act 14 545 020
Ball Corporation 24-Mar-2011 Foreign Corrupt Practices Act 300 000
BP p.l.c. 15-Nov-2012 Issuer Reporting and Disclosure 525 000 000
Citigroup Inc. 29-Jul-2010 Issuer Reporting and Disclosure 75 000 001
Capital One Financial Corporation 24-Apr-2013 Issuer Reporting and Disclosure 3 500 000
Diebold, Inc. 22-Oct-2013 Foreign Corrupt Practices Act 22 972 942
Deutsche Telekom, AG 29-Dec-2011 Foreign Corrupt Practices Act 4 000 000
ENI, S.p.A. 07-Jul-2010 Foreign Corrupt Practices Act 125 000 000
NIC Inc. 12-Jan-2011 Issuer Reporting and Disclosure 500 000
Fifth Third Bancorp 04-Dec-2013 Issuer Reporting and Disclosure 6 500 000
Technip 28-Jun-2010 Foreign Corrupt Practices Act 98 000 000
General Electric Company 27-Jul-2010 Foreign Corrupt Practices Act 23 478 614
Healthsouth Corp. 26-Jul-2010 Issuer Reporting and Disclosure 100 000 000
Huron Consulting Group Inc. 19-Jul-2012 Issuer Reporting and Disclosure 1 066 335
International Business Machines 18-Mar-2011 Foreign Corrupt Practices Act 10 000 000
Innospec, Inc. 18-Mar-2010 Foreign Corrupt Practices Act 60 071 613
Johnson & Johnson 08-Apr-2011 Foreign Corrupt Practices Act 48 666 316
JPMorgan Chase & Co. 19-Sep-2013 Issuer Reporting and Disclosure 200 000 000
Eli Lilly and Company 20-Dec-2012 Foreign Corrupt Practices Act 29 398 734
Medifast, Inc. 18-Sep-2013 Issuer Reporting and Disclosure 200 000
Maxwell Technologies Inc. 31-Jan-2011 Foreign Corrupt Practices Act 6 350 890
Noble Corporation 04-Nov-2010 Foreign Corrupt Practices Act 5 576 998
Office Depot, Inc. 21-Oct-2010 Issuer Reporting and Disclosure 1 000 000
Orthofix International N.V. 10-Jul-2012 Foreign Corrupt Practices Act 5 225 701
Oracle Corporation 16-Aug-2012 Foreign Corrupt Practices Act 2 000 000
PACCAR Inc 03-Jun-2013 Issuer Reporting and Disclosure 225 000
Pfizer Inc. 07-Aug-2012 Foreign Corrupt Practices Act 26 339 945
Koninklijke Philips Electronics 05-Apr-2013 Foreign Corrupt Practices Act 4 515 178
Parker Drilling Company 16-Apr-2013 Foreign Corrupt Practices Act 4 090 818
Transocean Inc. 04-Nov-2010 Foreign Corrupt Practices Act 7 265 080
Ralph Lauren Corp. 22-Apr-2013 Foreign Corrupt Practices Act 734 846
Rockwell Automation, Inc. 03-May-2011 Foreign Corrupt Practices Act 2 761 091
Raytheon Corporation 25-Jun-2010 Issuer Reporting and Disclosure 12 000 000
Smith & Nephew PLC 06-Feb-2012 Foreign Corrupt Practices Act 5 426 799
Stryker Corporation 24-Oct-2013 Foreign Corrupt Practices Act 13 283 523

38
Tidewater Inc. 04-Nov-2010 Foreign Corrupt Practices Act 11 321 362
Thor Industries, Inc. 13-May-2011 Issuer Reporting and Disclosure 1 000 000
Tenaris S.A. 17-May-2011 Foreign Corrupt Practices Act 5 428 338
Tyson Foods, Inc. 10-Feb-2011 Foreign Corrupt Practices Act 1 214 477
Weatherford International plc 26-Nov-2013 Foreign Corrupt Practices Act 65 612 360
Watts Water Technologies, Inc. 13-Oct-2011 Foreign Corrupt Practices Act 3 776 606
Biomet Inc. 26-Mar-2012 Foreign Corrupt Practices Act 5 575 731