Adaptive OFDM Radar for Target Detection in Multipath Scenarios
Upload
independentCategory
view
6download
0
P1: KCU
Data Mining and Knowledge Discovery KL503-04-Fawcett September 29, 1997 9:38
Data Mining and Knowledge Discovery 1, 291–316 (1997)c© 1997 Kluwer Academic Publishers. Manufactured in The Netherlands.
Adaptive Fraud Detection
TOM FAWCETT [email protected] PROVOST [email protected] Science and Technology, 400 Westchester Avenue, White Plains, New York 10604
Editor: Usama Fayyad
Received April 2, 1997; Revised July 10, 1997; Accepted July 11, 1997
Abstract. One method for detecting fraud is to check for suspicious changes in user behavior. This paperdescribes the automatic design of user profiling methods for the purpose of fraud detection, using a series of datamining techniques. Specifically, we use a rule-learning program to uncover indicators of fraudulent behavior froma large database of customer transactions. Then the indicators are used to create a set of monitors, which profilelegitimate customer behavior and indicate anomalies. Finally, the outputs of the monitors are used as features ina system that learns to combine evidence to generate high-confidence alarms. The system has been applied to theproblem of detecting cellular cloning fraud based on a database of call records. Experiments indicate that thisautomatic approach performs better than hand-crafted methods for detecting fraud. Furthermore, this approachcan adapt to the changing conditions typical of fraud detection environments.
Keywords: fraud detection, rule learning, profiling, constructive induction, intrusion detection, applications
1. Introduction
In the United States, cellular fraud costs the telecommunications industry hundreds of mil-lions of dollars per year (Walters and Wilkinson, 1994; Steward, 1997). One kind of cellularfraud calledcloning is particularly expensive and epidemic in major cities throughout theUnited States. Cloning fraud causes great inconvenience to customers and great expense tocellular service providers. Existing methods for detecting cloning fraud aread hocand theirevaluation is virtually nonexistent. We have embarked on a program of systematic analy-sis of cellular call data for the purpose of designing and evaluating methods for detectingfraudulent behavior.
Cloning fraud is one instance ofsuperimposition fraud, in which fraudulent usage issuperimposed upon (added to) the legitimate usage of an account. Other examples are creditcard fraud, calling card fraud and some forms of computer intrusion. Superimposition fraudtypically occurs when a non-legitimate user gains illicit access to the account or serviceof a legitimate user. Superimposition fraud is detectable if the legitimate users have fairlyregular behavior that is generally distinguishable from the fraudulent behavior.
This paper presents a framework, and a corresponding system, for automatically gen-erating detectors for superimposition fraud. We have applied the system in the domainof cellular cloning fraud. Under the framework, massive amounts of cellular call data areanalyzed in order to determine general patterns of fraud. These patterns are then used
P1: KCU
Data Mining and Knowledge Discovery KL503-04-Fawcett September 29, 1997 9:38
292 FAWCETT AND PROVOST
to generate a set of monitors, each of which watches customers’ behavior with respect toone discovered pattern. A monitor profiles each customer’s typical behavior and, in use,measures the extent to which current behavior is abnormal with respect to the monitor’sparticular pattern. Each monitor’s output is provided to a neural network, which weightsthe values and issues an alarm when the combined evidence for fraud is strong enough.
This article is organized as follows. We first describe the problem of cellular cloning fraudand some existing strategies for detecting it. We then describe the framework in detail usingexamples from the implemented system. We present experimental results comparing thesystem against other known methods for detecting fraud. Finally, we discuss the evaluationand describe issues in the future of automatic fraud detection.
2. Cellular communications and cloning fraud
Whenever a cellular phone is on, it periodically transmits two unique identification numbers:itsMobile Identification Number(MIN) and itsElectronic Serial Number(ESN). These twonumbers together specify the customer’s account. These numbers are broadcast unencryptedover the airwaves, and they can can be received, decoded and stored using special equipmentthat is relatively inexpensive.
2.1. Cloning fraud
Cloning occurs when a customer’s MIN and ESN are programmed into a cellular telephonenot belonging to the customer. When this second telephone is used, the network sees thecustomer’s MIN and ESN and subsequently bills the usage to the customer. With the stolenMIN and ESN, a cloned phone user (whom we shall call abandit) can make virtually unlim-ited calls, whose charges are billed to the customer. The attraction of free and untraceablecommunication makes cloned phones very popular in major metropolitan areas.
If the fraudulent usage goes undetected, the customer’s next bill will include the cor-responding charges. Typically, the customer then calls the cellular service provider (thecarrier) and denies the usage. The carrier and customer then determine which calls weremade by the “bandit” and which were legitimate calls. The fraudulent charges are creditedto the customer’s account, and measures are taken to prohibit further fraudulent charges. Incertain cases, the fraudulent call records will be referred to a law enforcement agency forprosecution.
There are two primary motivations for cloning fraud. Obviously, cloning fraud allowslow-costcommunications. A bandit is not charged for calls, which are usually worth farmore (in retail dollars) than the cost of the cloned phone. Less obviously, cloning fraudallows untraceablecommunications because the bandit’s identity cannot be tied to thecloned account. This second aspect is very important to criminals (DeMaria and Gidari,1996).
Cloning fraud is detrimental in many ways. First, fraudulent usage congests cell sites,causing service to be denied to legitimate customers. Second, most cellular calls are tonon-cellular destinations, so fraud incurs land-line usage charges. Third, cellular carriersmust pay costs to other carriers for usage outside the home territory. Because these are
P1: KCU
Data Mining and Knowledge Discovery KL503-04-Fawcett September 29, 1997 9:38
ADAPTIVE FRAUD DETECTION 293
retail costs, they constitute a considerable financial burden to the customer’s carrier. Fourth,the crediting process is costly to the carrier and inconvenient to the customer; the customeris more likely to switch to another carrier (“customer churn”) if the other is perceived tobe less susceptible to fraud. For these reasons, cellular carriers have a strong interest inreducing cloning fraud.
2.2. Strategies for dealing with cloning fraud
There are two classes of methods for dealing with cloning fraud.Pre-call methods try toidentify and block fraudulent calls as they are made.Post-callmethods try to identify fraudthat has already occurred on an account so that further fraudulent usage can be blocked.
2.2.1. Pre-call methods. Pre-call detection methods involve validating the phone or itsuser when a call is placed. A common method is requiring that a Personal IdentificationNumber (PIN) be entered before every call. A PIN serves as a password that is validatedby the switch prior to allowing the call into the network. PINs are in use throughout manymetropolitan areas in the United States. Unfortunately, like MIN-ESN pairs, PINs arebroadcast over the airwaves unencrypted. For technical reasons, PINs are more difficultto receive and decode, but with more sophisticated equipment PIN cracking is possible(Herzog, 1995). Although PINs make cloning fraud more difficult, they do not prevent it.
Other methods of prevention include RF Fingerprinting and Authentication (Redden,1996). RF Fingerprinting is a method of identifying cellular phones by their transmissioncharacteristics. Authentication is a reliable and secure private-key encryption method thatimposes no inconvenience on the customer. It has been predicted that authentication willeliminate cloning fraud eventually. However, authentication requires changes in hardware:both phones and switches must be capable of processing authentication requests. Currentlyabout thirty million non-authenticatable cell phones are in use in the United States alone,and their replacement will not be immediate (Steward, 1997). In the meantime, cloningfraud will continue to be a problem and the industry will rely onpost-callfraud detectionmethods.
2.2.2. Post-call methods.Post-call methods periodically analyze call data on each accountto determine whether cloning fraud has occurred. One such method,collision detection,involves analyzing call data for temporally overlapping calls. Since a MIN-ESN pair islicensed to only one legitimate user, any simultaneous usage is probably fraudulent. Aclosely related method,velocity checking(Davis and Goyal, 1993), involves analyzing thelocations and times of consecutive calls to determine whether a single user could haveplaced them while traveling at reasonable speeds. For example, if a call is made in LosAngeles 20 minutes after a call is made on the same account in New York, two differentpeople are likely using the account.
Collisions and velocity checks are both believed to be accurate, but they share the dis-advantage that their usefulness depends upon a moderate level of legitimate activity. Low-usage subscribers (for example, people who only use cellular phones in emergencies) willrarely cause collisions or velocity alarms with bandits.
P1: KCU
Data Mining and Knowledge Discovery KL503-04-Fawcett September 29, 1997 9:38
294 FAWCETT AND PROVOST
Another post-call method,dialed digit analysis, mines call data to build up a database oftelephone numbers called by bandits during periods of fraudulent activity. For detection,this database is matched against the numbers called by customers, and alarms are producedwhen the number of hits is above a threshold (“dialed digit hits”).
2.2.3. User profiling. User profiling methods constitute a special class of post-call meth-ods. They involve analyzing calling behavior in order to detect usage anomalies suggestiveof fraud. Profiling often works well with low-usage subscribers because unusual behavioris very prominent. For this reason, profiling is a good complement to collision and velocitychecking because it covers cases the others might miss.
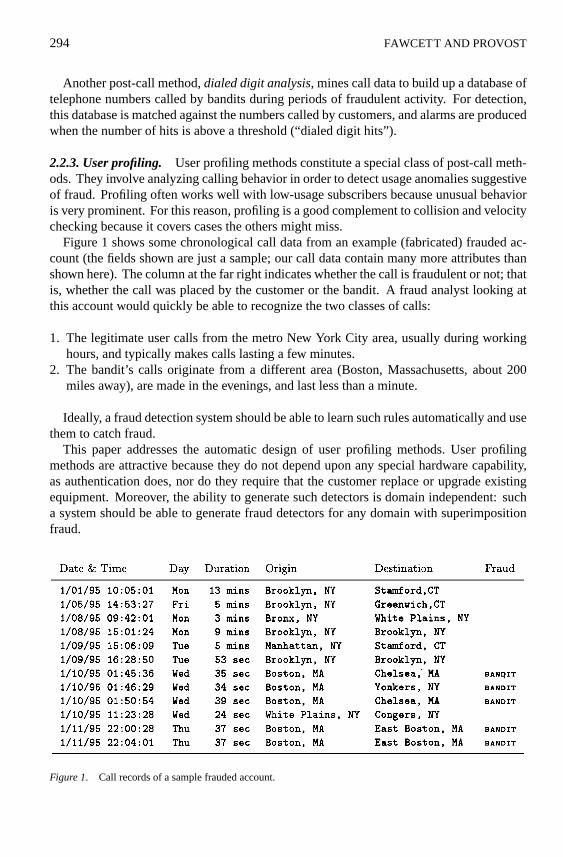
Figure 1 shows some chronological call data from an example (fabricated) frauded ac-count (the fields shown are just a sample; our call data contain many more attributes thanshown here). The column at the far right indicates whether the call is fraudulent or not; thatis, whether the call was placed by the customer or the bandit. A fraud analyst looking atthis account would quickly be able to recognize the two classes of calls:
1. The legitimate user calls from the metro New York City area, usually during workinghours, and typically makes calls lasting a few minutes.
2. The bandit’s calls originate from a different area (Boston, Massachusetts, about 200miles away), are made in the evenings, and last less than a minute.
Ideally, a fraud detection system should be able to learn such rules automatically and usethem to catch fraud.
This paper addresses the automatic design of user profiling methods. User profilingmethods are attractive because they do not depend upon any special hardware capability,as authentication does, nor do they require that the customer replace or upgrade existingequipment. Moreover, the ability to generate such detectors is domain independent: sucha system should be able to generate fraud detectors for any domain with superimpositionfraud.
Figure 1. Call records of a sample frauded account.
P1: KCU
Data Mining and Knowledge Discovery KL503-04-Fawcett September 29, 1997 9:38
ADAPTIVE FRAUD DETECTION 295
2.3. The need to be adaptive
There are a number of commercially available expert systems for fraud detection thatinclude user profiling. Fraud analysts or system administrators can tune the techniques byadjusting parameters, or by entering specific patterns that will trigger alarms. Unfortunately,determining which potential patterns will be useful is a time-consuming process of trial-and-error. Moreover, the patterns of fraud are dynamic. Bandits constantly change theirstrategies in response to new detection techniques or new cellular hardware capabilities. Bythe time a system is manually tuned, the fraudulent behavior may have changed significantly.
The environment is dynamic in other ways as well. The level of fraud changes dramat-ically month-to-month because of modifications to work practices (both the carrier’s andthe bandits’). Also, the costs of missing fraud or of dealing with false alarms change withintercarrier contracts, and because of fraud analyst workforce issues.
For all these reasons, it is important that a fraud detection system adapt easily to newconditions. It should be able to notice new patterns of fraud. It should also be able to modifyits alarm generation behavior, for example, as the level of fraud or the cost of dealing witha false alarm changes. Such adaptability can be achieved by generating fraud detectionsystems automatically from data, using data mining techniques.
3. Automatic construction of profiling fraud detectors
One approach to building a fraud detection system is to classify individual transactions, callsin our case, as being fraudulent or legitimate. Classification has been well explored, e.g.,in machine learning and statistics, so this would seem to be a straightforward applicationof existing techniques.
We have not had success using standard machine learning techniques to construct sucha classifier. Some specific results are discussed in Section 6.3. In general, there are twoproblems that make simple classification approaches infeasible.
• Context: A call that would be unusual for one customer would be typical for another.For example, a call placed from Brooklyn is not unusual for a subscriber who lives there,but might be very strange for a Boston subscriber. Thus, it is necessary (i) to discoverindicators corresponding tochangesin behavior that are indicative of fraud, rather thanabsolute indicators of fraud, and (ii) toprofile the behavior of individual customers tocharacterize their normal behavior.If there were available substantial information about an account’s context, we couldpossibly ameliorate this problem. Context information would comprise behavior infor-mation such as what the phone is used for, what areas it is used in, what areas/numbersit normally calls, what times of day, and so on. Context information is not available1, soour solution is to derive it from historical data specific to each account. The discovery ofcontext-sensitive fraud indicators and the profiling of individual accounts comprise twoof the three major elements of the learning problem.• Granularity: At the level of the individual call, the variation in calling behavior is large,
even for a particular user. Legitimate subscribers occasionally make calls that look
P1: KCU
Data Mining and Knowledge Discovery KL503-04-Fawcett September 29, 1997 9:38
296 FAWCETT AND PROVOST
suspicious. As far as we have been able to determine, it is not possible to achieve simul-taneously the high degree of accuracy and high level of coverage necessary to classifyindividual calls effectively. Any classifier that fires on a significant number of defraudedaccounts produces an unacceptably large number of false alarms. Therefore, decisionsto take corrective action cannot be made with confidence on the basis of individual calls.Instead, it is necessary to aggregate customer behavior, smoothing out the variation, andwatch for coarser-grained changes that have better predictive power. This is the third ma-jor element of the learning problem; in the experiments we describe later, we aggregatecustomer behavior intoaccount-days.
In sum, the learning problem comprises three questions, each of which corresponds to acomponent of our framework.
1. Which call features are important? Which features or combinations of features areuseful for distinguishing legitimate behavior from fraudulent behavior?
2. How should profiles be created? Given an important feature, how should we charac-terize/profile the behavior of a subscriber with respect to the feature, in order to noticeimportant changes?
3. When should alarms be issued? Given the results of profiling behavior based on multiplecriteria, how should they be combined to be effective in determining when fraud hasoccurred?
Each of these issues corresponds to a component of our framework.
4. The Detector Constructor framework
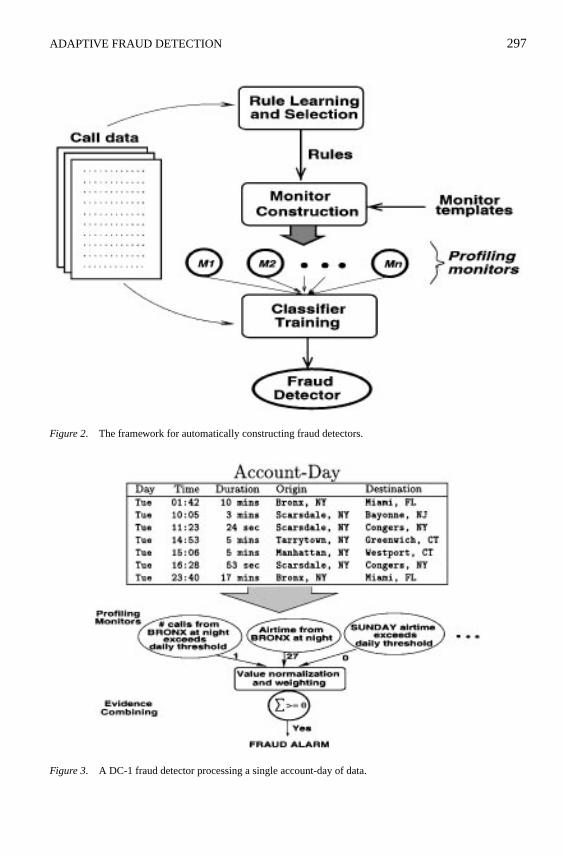
Our Detector Constructorframework is illustrated in figure 2. Under the framework, asystem first learns rules that serve as indicators of fraudulent behavior. It then uses theserules, along with a set of templates, to create profiling monitors (M1 throughMn). Thesemonitors profile the typical behavior of each account with respect to a rule and, in use,describe how far each account is from its typical behavior. Finally, the system learnsto weight the monitor outputs so as to maximize the effectiveness of the resulting frauddetector.
Figure 3 shows how such a detector will be used. The monitors are provided with asingle day’s calls from a given account, and each monitor generates a number indicatinghow unusual that account-day looks for the account. The numeric outputs from the monitorsare treated as evidence and are combined by the detector. When the detector has enoughevidence of fraudulent activity on an account, based on the indications of the monitors, itgenerates an alarm.
We now discuss each step of the framework in detail, illustrated by the particular choicesmade in our first implemented system, as applied to the problem of cloning fraud detection.The first Detector Constructor system is called DC-1. The call data used for detectingcloning fraud are chronological records of calls made by each subscriber, organized by
P1: KCU
Data Mining and Knowledge Discovery KL503-04-Fawcett September 29, 1997 9:38
ADAPTIVE FRAUD DETECTION 297
Figure 2. The framework for automatically constructing fraud detectors.
Figure 3. A DC-1 fraud detector processing a single account-day of data.
P1: KCU
Data Mining and Knowledge Discovery KL503-04-Fawcett September 29, 1997 9:38
298 FAWCETT AND PROVOST
account. These data describe individual calls using attributes such as DATE, FROM-STATE,DURATION and CELL-SITE.
4.1. Learning fraud rules
The first stage of detector construction,rule learning, involves searching the call data forindicators of fraud. In the DC-1 system, the indicators are conjunctive rules discovered bya standard rule-learning program.
As discussed above, an obvious way of mining fraud indicators is to create an exampleset consisting of all frauded calls and all legitimate calls, and apply to a rule learningalgorithm to the example set. However, this approach loses context information about thenormal behavior of the account in which the fraud occurred. To illustrate the importanceof context, consider a situation in which half the subscribers live in New York and half inLos Angeles. When cloned, the New York accounts are used in Los Angeles and the LosAngeles accounts are used in New York. Applying rule learning to the combined set ofcall records would uncover no fraud rules based on call origin; in other words, knowingthat a call originated in New York says nothing about how likely it is to be fraud. In fact,this conclusion would be wrong: in this scenario a New York account with Los Angelescalls is much more likely to have been cloned than if it had only New York calls. This factis missed when using a combined example set, because in combining examples all accountcontext information is lost.
In light of the need to maintain context information, rule learning is performed in twosteps. Rules are first generated locally based on differences between fraudulent and normalbehavior for each account, then they are combined in a rule selection step.
4.1.1. Rule generation. DC-1 uses the RL program (Clearwater and Provost, 1990;Provost and Aronis, 1996) to generate indicators of fraud in the form of classification rules.Similar to other MetaDENDRAL-style rule learners (Buchanan and Mitchell, 1978; Segaland Etzioni, 1994; Webb, 1995), RL performs a general-to-specific search of the space ofconjunctive rules. This type of rule-space search is described in detail by Webb (1995). InDC-1, RL uses a beam search for rules with certainty factors above a user-defined threshold.The certainty factor we used for these runs was a simple frequency-based probability esti-mate, corrected for small samples (Quinlan, 1987). In order to deal with the very large num-bers of values for some of the attributes used to describe calls (more than 10,000 values intotal), RL also used breadth-first marker propagation techniques, so that the algorithm’s timecomplexity does not depend on the number of attribute values (Aronis and Provost, 1997).(RL’s time complexity is linear in the number of attributes and the number of examples.)
The call data are organized by account, with each call record labeled as fraudulent orlegitimate. When RL is applied to an account’s calls it produces a set of rules that serveto distinguish, within that account, the fraudulent calls from the legitimate calls. As anexample, the following rule would be a relatively good indicator of fraud:
(TIME-OF-DAY = NIGHT) AND (LOCATION = BRONX) ==> FRAUDCertainty factor = 0.89
P1: KCU
Data Mining and Knowledge Discovery KL503-04-Fawcett September 29, 1997 9:38
ADAPTIVE FRAUD DETECTION 299
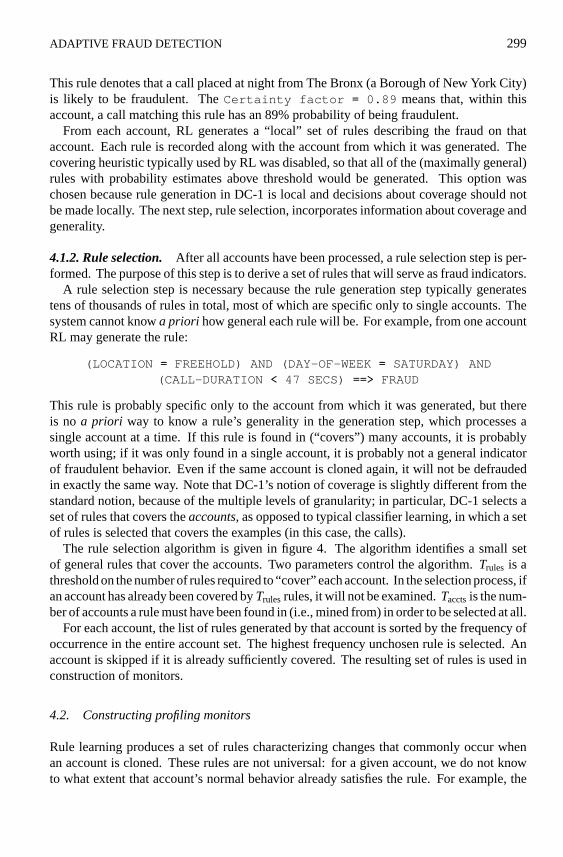
This rule denotes that a call placed at night from The Bronx (a Borough of New York City)is likely to be fraudulent. TheCertainty factor = 0.89 means that, within thisaccount, a call matching this rule has an 89% probability of being fraudulent.
From each account, RL generates a “local” set of rules describing the fraud on thataccount. Each rule is recorded along with the account from which it was generated. Thecovering heuristic typically used by RL was disabled, so that all of the (maximally general)rules with probability estimates above threshold would be generated. This option waschosen because rule generation in DC-1 is local and decisions about coverage should notbe made locally. The next step, rule selection, incorporates information about coverage andgenerality.
4.1.2. Rule selection. After all accounts have been processed, a rule selection step is per-formed. The purpose of this step is to derive a set of rules that will serve as fraud indicators.
A rule selection step is necessary because the rule generation step typically generatestens of thousands of rules in total, most of which are specific only to single accounts. Thesystem cannot knowa priori how general each rule will be. For example, from one accountRL may generate the rule:
(LOCATION = FREEHOLD) AND (DAY-OF-WEEK= SATURDAY) AND(CALL-DURATION < 47 SECS) ==> FRAUD
This rule is probably specific only to the account from which it was generated, but thereis no a priori way to know a rule’s generality in the generation step, which processes asingle account at a time. If this rule is found in (“covers”) many accounts, it is probablyworth using; if it was only found in a single account, it is probably not a general indicatorof fraudulent behavior. Even if the same account is cloned again, it will not be defraudedin exactly the same way. Note that DC-1’s notion of coverage is slightly different from thestandard notion, because of the multiple levels of granularity; in particular, DC-1 selects aset of rules that covers theaccounts, as opposed to typical classifier learning, in which a setof rules is selected that covers the examples (in this case, the calls).
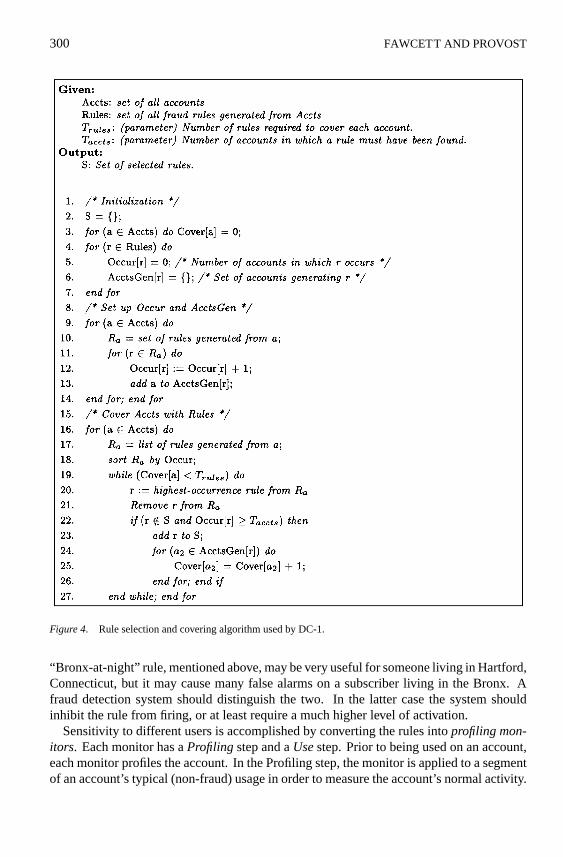
The rule selection algorithm is given in figure 4. The algorithm identifies a small setof general rules that cover the accounts. Two parameters control the algorithm.Trules is athreshold on the number of rules required to “cover” each account. In the selection process, ifan account has already been covered byTrulesrules, it will not be examined.Tacctsis the num-ber of accounts a rule must have been found in (i.e., mined from) in order to be selected at all.
For each account, the list of rules generated by that account is sorted by the frequency ofoccurrence in the entire account set. The highest frequency unchosen rule is selected. Anaccount is skipped if it is already sufficiently covered. The resulting set of rules is used inconstruction of monitors.
4.2. Constructing profiling monitors
Rule learning produces a set of rules characterizing changes that commonly occur whenan account is cloned. These rules are not universal: for a given account, we do not knowto what extent that account’s normal behavior already satisfies the rule. For example, the
P1: KCU
Data Mining and Knowledge Discovery KL503-04-Fawcett September 29, 1997 9:38
300 FAWCETT AND PROVOST
Figure 4. Rule selection and covering algorithm used by DC-1.
“Bronx-at-night” rule, mentioned above, may be very useful for someone living in Hartford,Connecticut, but it may cause many false alarms on a subscriber living in the Bronx. Afraud detection system should distinguish the two. In the latter case the system shouldinhibit the rule from firing, or at least require a much higher level of activation.
Sensitivity to different users is accomplished by converting the rules intoprofiling mon-itors. Each monitor has aProfiling step and aUsestep. Prior to being used on an account,each monitor profiles the account. In the Profiling step, the monitor is applied to a segmentof an account’s typical (non-fraud) usage in order to measure the account’s normal activity.
P1: KCU
Data Mining and Knowledge Discovery KL503-04-Fawcett September 29, 1997 9:38
ADAPTIVE FRAUD DETECTION 301
Statistics from this profiling period are saved with the account. In the monitor’s Use phase,the monitor processes a single account-day at a time. The monitor references the normalcymeasures calculated in Profiling, and generates a numeric value describing how abnormal2
the current account-day is.Profiling monitors are created by the monitor constructor, which employs a set of tem-
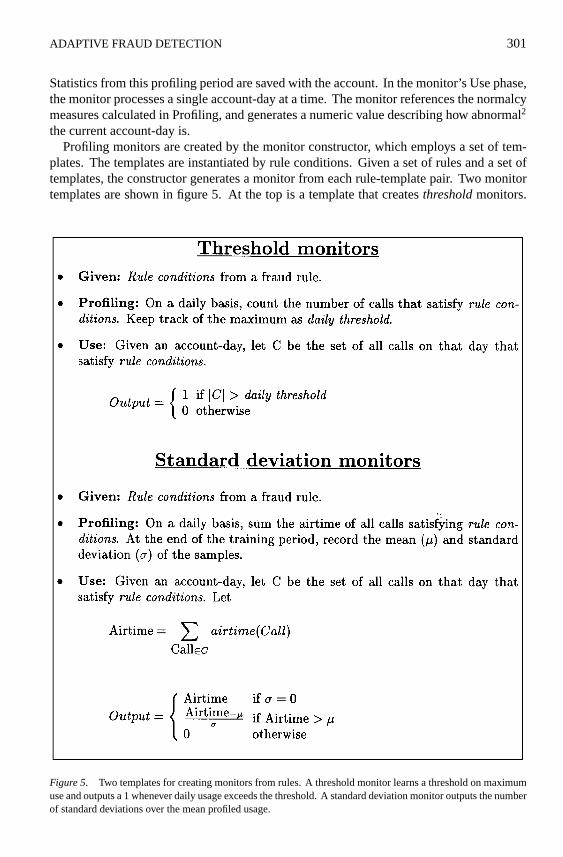
plates. The templates are instantiated by rule conditions. Given a set of rules and a set oftemplates, the constructor generates a monitor from each rule-template pair. Two monitortemplates are shown in figure 5. At the top is a template that createsthresholdmonitors.
Figure 5. Two templates for creating monitors from rules. A threshold monitor learns a threshold on maximumuse and outputs a 1 whenever daily usage exceeds the threshold. A standard deviation monitor outputs the numberof standard deviations over the mean profiled usage.
P1: KCU
Data Mining and Knowledge Discovery KL503-04-Fawcett September 29, 1997 9:38
302 FAWCETT AND PROVOST
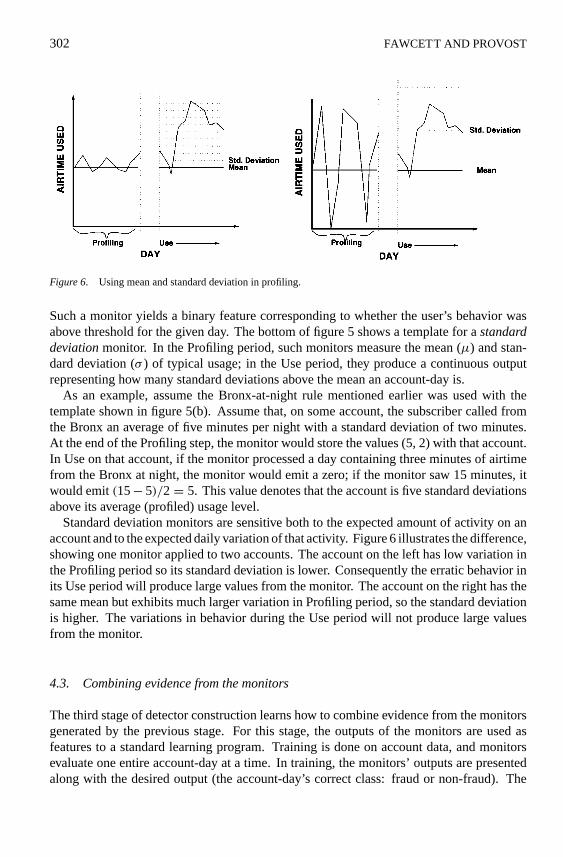
Figure 6. Using mean and standard deviation in profiling.
Such a monitor yields a binary feature corresponding to whether the user’s behavior wasabove threshold for the given day. The bottom of figure 5 shows a template for astandarddeviationmonitor. In the Profiling period, such monitors measure the mean (µ) and stan-dard deviation (σ ) of typical usage; in the Use period, they produce a continuous outputrepresenting how many standard deviations above the mean an account-day is.
As an example, assume the Bronx-at-night rule mentioned earlier was used with thetemplate shown in figure 5(b). Assume that, on some account, the subscriber called fromthe Bronx an average of five minutes per night with a standard deviation of two minutes.At the end of the Profiling step, the monitor would store the values (5, 2) with that account.In Use on that account, if the monitor processed a day containing three minutes of airtimefrom the Bronx at night, the monitor would emit a zero; if the monitor saw 15 minutes, itwould emit(15− 5)/2= 5. This value denotes that the account is five standard deviationsabove its average (profiled) usage level.
Standard deviation monitors are sensitive both to the expected amount of activity on anaccount and to the expected daily variation of that activity. Figure 6 illustrates the difference,showing one monitor applied to two accounts. The account on the left has low variation inthe Profiling period so its standard deviation is lower. Consequently the erratic behavior inits Use period will produce large values from the monitor. The account on the right has thesame mean but exhibits much larger variation in Profiling period, so the standard deviationis higher. The variations in behavior during the Use period will not produce large valuesfrom the monitor.
4.3. Combining evidence from the monitors
The third stage of detector construction learns how to combine evidence from the monitorsgenerated by the previous stage. For this stage, the outputs of the monitors are used asfeatures to a standard learning program. Training is done on account data, and monitorsevaluate one entire account-day at a time. In training, the monitors’ outputs are presentedalong with the desired output (the account-day’s correct class: fraud or non-fraud). The
P1: KCU
Data Mining and Knowledge Discovery KL503-04-Fawcett September 29, 1997 9:38
ADAPTIVE FRAUD DETECTION 303
evidence combination weights the monitor outputs and learns a threshold on the sum sothat alarms may be issued with high confidence.
Many training methods for evidence combining are possible. We chose a simple LinearThreshold Unit (LTU) (Nilsson, 1965; Young, 1984) for the experiments reported be-low. An LTU is simple and fast, and enables a good first-order judgment of the features’worth.
A feature selection process is used to reduce the number of monitors in the final detector.Some of the rules do not perform well when used in monitors, and some monitors overlap intheir fraud detection coverage. We therefore employ a sequential forward selection process(Kittler, 1986) which chooses a small set of useful monitors. Empirically, this simplifiesthe final detector and increases its accuracy.
The final output of DC-1 is a detector that profiles each user’s behavior based on severalindicators, and produces an alarm if there is sufficient evidence of fraudulent activity.Figure 3 shows an example of a simple detector evaluating an account-day.
Before being used on an account, the monitors each profile the account. They areapplied to a profiling segment (thirty days in our experiments) during which they measureunfrauded usage. In our study, these initial thirty account-days were guaranteed free offraud, but were not otherwise guaranteed to be typical. From this initial profiling period,each monitor measures a characteristic level of activity.
4.4. Summary of the detector construction process
In sum, DC-1 begins by examining the call records of defrauded accounts. The callrecords are expressed in terms of a set of base-level attributes with thousands of possi-ble values. From these data, the system generates rules characterizing fraudulent callswithin accounts, then selects a smaller set of general rules as indicators of fraudulentbehavior.
These rules are used as the basis from which to build a set of profiling monitors, eachof which examines behavior based on one learned rule. A monitor learns the typical be-havior of an account by scanning an initial sequence of the account’s calls (its “profilingperiod”) and saving some statistics. Subsequently, the monitor examines chunks of calls(in our experiments, account-days). The monitor subsequently examines each chunk (day)of each account’s behavior and outputs a number indicating how far away from normal thebehavior is.
In order to construct a high-confidence detector, DC-1 must then learn to combine theoutputs of the monitors effectively. To do this, it trains a classifier on a sample of account-days. Each account-day is a training instance expressed as a vector of monitor outputs forthat day, and labelled as either containing fraud or not. After training, the system has aclassifier that is able to combine the monitors effectively.
The final output of the system is a set of monitors and a trained classifier for combiningtheir outputs. In order to be applied to a new account, the monitors must see a profilingperiod of days from that account.
The next sections describe our cellular call data and the experiments we have performedon the system.
P1: KCU
Data Mining and Knowledge Discovery KL503-04-Fawcett September 29, 1997 9:38
304 FAWCETT AND PROVOST
5. The data
The call data used for this study are records of cellular calls placed over four months byusers in the New York City area—an area with high levels of fraud. Each call is describedby thirty-one attributes, such as the phone number of the caller, the duration of the call, thegeographical origin and destination of the call, and any long-distance carrier used. Becauseof security considerations, we are unable to disclose all the features used in the system.
To these thirty-one attributes are added several derived attributes that incorporate knowl-edge we judged to be potentially useful. One such attribute is a categoricalTIME-OF-DAYvariable representing the time segment of the day in which a call is placed. Its valuesare MORNING, AFTERNOON, TWILIGHT, EVENING and NIGHT. Another derivedattribute isTO-PAYPHONE, a binary flag indicating whether the call terminated at a pay-phone. Note that any number of additional features could be added to encode relevantdomain knowledge.
Each call is also give a class label of legitimate or fraudulent. This is done by crossreferencing a database of all calls that were credited as being fraudulent for the same timeperiod.
5.1. Data cleaning
Like all real-world data, our cellular call data contain errors and noise from various sources.For example, calls are marked as fraudulent based on a process calledblock crediting. Inthis process, the customer and the carrier representative together establish the range of datesduring which the fraud occurred, and the calls within the range are credited. The customer isusually not asked about each individual call. The block crediting process uses heuristics todiscard obvious non-fraudulent calls from the credited block, but these heuristics are fallible.Also, if there is a disagreement about the fraud span, the customer service representativeusually concedes, in the customer’s favor, to a wider date span. Any erroneously creditedcalls constitute noise in our data.
Because of these noise sources, we cleaned the data in several ways.
• Each account’s calls were scanned automatically to eliminate credited calls to numbersthat had been called outside of the credited block. In other words, the program lookedfor credited calls made to a phone number that also had been called by the legitimatesubscriber; in this case, the crediting may have been a mistake, so the call is discardedcompletely.• An account-day was classified as fraudulent only if five or more minutes of fraudulent
usage occurred. Days including one to four minutes of fraudulent usage were discarded.This policy eliminated a small number of “gray area” account-days probably mislabelleddue to small amounts of noise. For example, the database of credits due to fraud occa-sionally included credits for other reasons, such as wrong numbers.• Within any time period there will be fraud that has not yet been detected. We assumed
that some genuinely fraudulent calls would not be marked as such because of this timelag. We attempted to minimize this noise by delaying the data retrieval by two weeks.
P1: KCU
Data Mining and Knowledge Discovery KL503-04-Fawcett September 29, 1997 9:38
ADAPTIVE FRAUD DETECTION 305
• In preliminary experiments, rule learning uncovered some unusual attribute values (e.g.,CELLSITE = 0) that seemed to be very strong indicators of fraud. Discussions with thedatabase providers led us to conclude that these suspicious values were artifacts of thecrediting process: in some circumstances, crediting would erase or replace certain fields.Because the values appeared primarily in credited records, data mining had extractedthem as high-confidence fraud rules. We found five or six such misleading values andeliminated from the database all records containing them.
In addition, the start times of calls had been recorded in local time with respect to theswitch of origin. The calls were normalized to Greenwich Mean Time for chronologicalsorting.
5.2. Data selection
The call data were separated carefully into several partitions for rule learning, accountprofiling, and detector training and testing. Once the monitors are created and the accountsprofiled, the system transforms raw call data into a series of account-days using the outputsof the monitors as features.
Rule learning and selection used 879 accounts comprising over 500,000 calls. About3600 accounts were selected for profiling, training, and testing. The only condition usedto select these 3600 accounts was that they be guaranteed to have at least thirty fraud-freedays of usage before any fraudulent usage. The initial thirty days of each account were usedfor profiling. The remaining days of usage were used to generate approximately 96,000account-days. Using randomly selected accounts, we generated sets of 10,000 account-days for training and 5000 account-days for testing. Training and testing accounts weredistinct, so their account-days were not mixed between training and testing3. Each set ofaccount-days was chosen to comprise 20% fraud and 80% non-fraud days.
6. Experiments and evaluation
Rule learning generated 3630 rules, each of which applied to two or more accounts. Therule selection process, in which rules are chosen in order of maximum account coverage,yielded a smaller set of 99 rules sufficient to cover the accounts. Each of the 99 rules wasused to instantiate two monitor templates, yielding 198 monitors. The final feature selectionstep reduced this to eleven monitors, with which the experiments were performed.
6.1. The importance of error cost
In this domain, different types of errors have different costs. A realistic evaluation shouldtake misclassification costs into account. Classification accuracy, a standard metric withinmachine learning and data mining, is not sufficient.
A false positive error (a false alarm) corresponds to wrongly deciding that a customerhas been cloned. Based on the cost of a fraud analyst’s time, we estimate the cost of a false
P1: KCU
Data Mining and Knowledge Discovery KL503-04-Fawcett September 29, 1997 9:38
306 FAWCETT AND PROVOST
positive error to be about $5. A false negative error corresponds to letting a frauded account-day go undetected. Rather than using a uniform cost for all false negatives, we estimated afalse negative to cost $.40 per minute of fraudulent airtime used on that account-day. Thisfigure is based on the proportion of usage in local and non-local (“roaming”) markets, andtheir corresponding costs.
Because LTU training methods try to minimize errors but not error costs, we employeda second step in training. After training, the LTU’s threshold is adjusted to yield minimumerror cost on the training set. This adjustment is done by moving the decision thresholdfrom −1 to +1 in increments of .01 and computing the resulting error cost. After theminimum cost on training data is found, the threshold is clamped and the testing data areevaluated.
6.2. DC-1 compared with alternative detection strategies
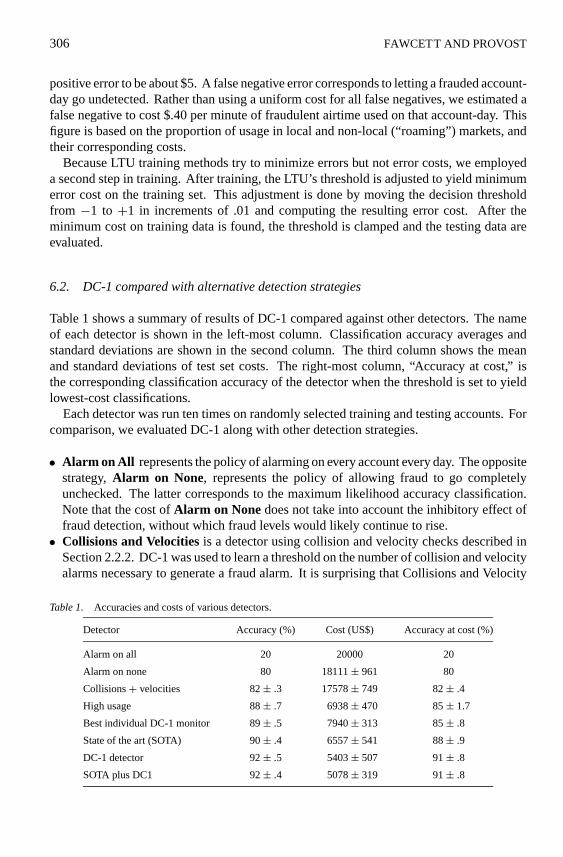
Table 1 shows a summary of results of DC-1 compared against other detectors. The nameof each detector is shown in the left-most column. Classification accuracy averages andstandard deviations are shown in the second column. The third column shows the meanand standard deviations of test set costs. The right-most column, “Accuracy at cost,” isthe corresponding classification accuracy of the detector when the threshold is set to yieldlowest-cost classifications.
Each detector was run ten times on randomly selected training and testing accounts. Forcomparison, we evaluated DC-1 along with other detection strategies.
• Alarm on All represents the policy of alarming on every account every day. The oppositestrategy,Alarm on None, represents the policy of allowing fraud to go completelyunchecked. The latter corresponds to the maximum likelihood accuracy classification.Note that the cost ofAlarm on None does not take into account the inhibitory effect offraud detection, without which fraud levels would likely continue to rise.• Collisions and Velocitiesis a detector using collision and velocity checks described in
Section 2.2.2. DC-1 was used to learn a threshold on the number of collision and velocityalarms necessary to generate a fraud alarm. It is surprising that Collisions and Velocity
Table 1. Accuracies and costs of various detectors.
Detector Accuracy (%) Cost (US$) Accuracy at cost (%)
Alarm on all 20 20000 20
Alarm on none 80 18111± 961 80
Collisions+ velocities 82± .3 17578± 749 82± .4
High usage 88± .7 6938± 470 85± 1.7
Best individual DC-1 monitor 89± .5 7940± 313 85± .8
State of the art (SOTA) 90± .4 6557± 541 88± .9
DC-1 detector 92± .5 5403± 507 91± .8
SOTA plus DC1 92± .4 5078± 319 91± .8
P1: KCU
Data Mining and Knowledge Discovery KL503-04-Fawcett September 29, 1997 9:38
ADAPTIVE FRAUD DETECTION 307
Checks, commonly thought to be reliable indicators of cloning, performed poorly in ourexperiments.The performance of collisions and velocity checks was originally worse than reported herebecause of false alarms. Manual inspection of false alarms revealed a few synchronizationproblems; for example, some apparent collisions were caused when a call was droppedthen quickly re-established in a neighboring cell whose clock did not agree with thefirst cell’s. Some such conditions could be caught easily, so we patched the detectionalgorithms to check for them. The results in this paper are for the improved detectors.Investigation of confusion matrices revealed that the collision and velocity check de-tectors’ errors were due almost entirely to false negatives. In other words, when thedetectors fired they were accurate, but many fraud days never exhibited a collision orvelocity check.• Some fraud analysts believe that cloning fraud is usually accompanied by large jumps in
account usage, and sophisticated mining of fraud indicators is probably unnecessary sincemost fraud could be caught by looking for sudden increases in usage. We created theHigh Usagedetector to test this hypothesis. It generates alarms based only on amount ofusage. It is essentially a standard deviation monitor (see figure 5) whose rule conditionsare always satisfied. The threshold of this detector was found empirically from trainingdata.Note that the evaluation of cost for the high usage detector may be overly optimistic,due to inadequacies in our cost model. In particular, a trained high usage detector learnsto optimally “skim the cream,” without regard to the fact that the errors it makes willinvolve annoying the best customers. In these cases, the cost of a false alarm may bemuch higher than the fixed cost we assigned.• TheBest Individual DC-1 Monitor was used as an isolated detector. This experiment
was done to determine the additional benefit of combining monitors. The best individualmonitor was generated from the rule:
(TIME-OF-DAY = EVENING) ==> FRAUD
Rule learning had discovered (in 119 accounts) that the sudden appearance of eveningcalls, in accounts that did not normally make them, was coincident with cloning fraud.The relatively high accuracy of this one monitor reveals that this is a valuable fraudindicator.Our TIME-OF-DAY attribute has five possible values: MORNING, AFTERNOON,TWILIGHT, EVENING and NIGHT. Although EVENING is by far the most frequentvalue implicated in fraud, rule learning generated fraud rules involving each of thesevalues. This suggests that any time-of-day change in a subscriber’s normal behavior maybe indicative of fraud, though the other shifts may not be predictive enough to use in afraud monitor.• TheDC-1 detector incorporates all the monitors chosen by feature selection. We used
the weight learning method described earlier to determine the weights for evidence com-bining.• The SOTA (“State Of The Art”) detector incorporates thirteen hand-crafted profiling
methods that were the best individual detectors identified in a previous study. Eachmethod profiles an account in a different way and produces a separate alarm. Weights
P1: KCU
Data Mining and Knowledge Discovery KL503-04-Fawcett September 29, 1997 9:38
308 FAWCETT AND PROVOST
for combining SOTA’s alarms were determined by our weight-tuning algorithm. Detailson the detectors comprising SOTA are given in the appendix.
The results in Table 1 demonstrate that DC-1 performs quite well. In fact, DC-1 out-performs SOTA in terms of both accuracy and cost4. In our experiments, lowest cost clas-sification occurred at an accuracy somewhat lower than optimal. In other words, someclassification accuracy can be sacrificed to decrease cost. More sophisticated methodscould be used to produce cost sensitive classifiers, which would probably produce betterresults.
Finally, the monitors of SOTA and DC-1 were combined into a hybrid detector. Theresulting detector (SOTA plus DC-1) exhibits no increase in classification accuracy, butdoes show a slight improvement in fraud detection cost.
In this work we have dealt with differing costs of false positive and false negative errors.However, we have still glossed over some complexity. For a given account, the only falsenegative fraud days that incur cost to the company are those prior to thefirst true positivealarm. After the fraud is detected, it is terminated. Thus, our analysis overestimates thecosts slightly; a more thorough analysis would eliminate such days from the computation.
6.3. Fraudulent call classifiers
Section 4.1 asserted that account context is important in the rule learning step: a globalexample set taken from all accounts would lose information about each account’s normalbehavior. In order to test this hypothesis, two such call classifiers were created from globalexample sets.
Applying standard classification algorithms to the call data was difficult for severalreasons. First, the description language is very detailed because many thousands of attributevalues appear in the data. Because of this, the volume of data necessary was relatively largefor desktop platforms; the use of fewer than 100,000 examples led to erratic classificationbehavior. Furthermore, in order to achieve high coverage of calls, massively disjunctiveconcept descriptions had to be learned—there were no simple classifiers that performedwell.
After trying many approaches, we chose two classifiers learned in the following manner.A set of 100,000 training examples was sampled from the accounts set aside for rule learning.The sample was random, but stratified to achieve a 50/50 class distribution. RL was appliedto these data, with parameters set so that it learned massively disjunctive rule sets. The twoclassifiers, CC 1054 and CC 1861, comprise 1054 and 1861 rules, respectively5. Each ofthese rule sets covered around 60% of the calls in a 92212 example test set, with an accuracyof about 75% on the calls it covered. We observed a clear and graceful tradeoff betweenaccuracy and coverage: as the coverage increased, the accuracy decreased.
In order to achieve a competitive comparison, the call classifiers were then given theadvantage of profiling and monitoring. A standard deviation airtime monitor was createdfrom each. Specifically, instead of instantiating the monitor template with a single rule,the template was instantiated with the entire classifier. The resulting monitor profiledeach account’s normal behavior with respect to the classifier’s output. The call classifier
P1: KCU
Data Mining and Knowledge Discovery KL503-04-Fawcett September 29, 1997 9:38
ADAPTIVE FRAUD DETECTION 309
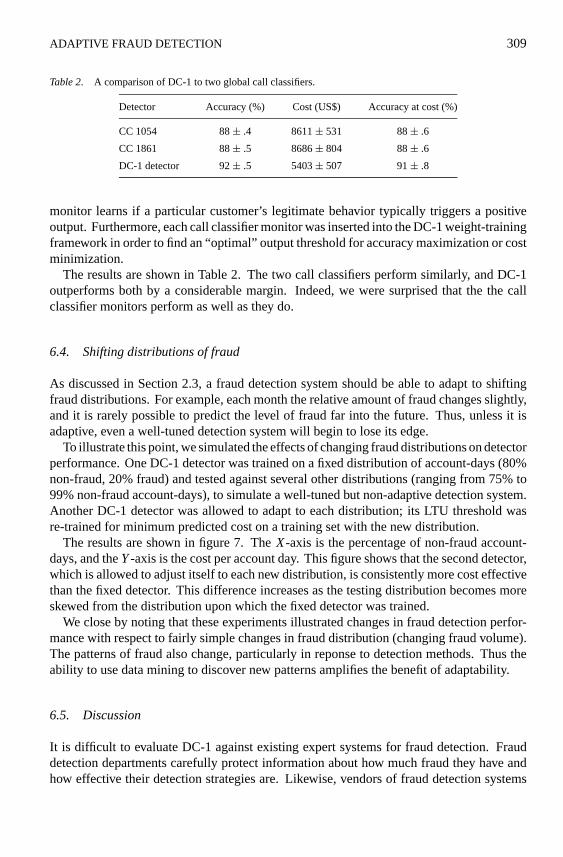
Table 2. A comparison of DC-1 to two global call classifiers.
Detector Accuracy (%) Cost (US$) Accuracy at cost (%)
CC 1054 88± .4 8611± 531 88± .6
CC 1861 88± .5 8686± 804 88± .6
DC-1 detector 92± .5 5403± 507 91± .8
monitor learns if a particular customer’s legitimate behavior typically triggers a positiveoutput. Furthermore, each call classifier monitor was inserted into the DC-1 weight-trainingframework in order to find an “optimal” output threshold for accuracy maximization or costminimization.
The results are shown in Table 2. The two call classifiers perform similarly, and DC-1outperforms both by a considerable margin. Indeed, we were surprised that the the callclassifier monitors perform as well as they do.
6.4. Shifting distributions of fraud
As discussed in Section 2.3, a fraud detection system should be able to adapt to shiftingfraud distributions. For example, each month the relative amount of fraud changes slightly,and it is rarely possible to predict the level of fraud far into the future. Thus, unless it isadaptive, even a well-tuned detection system will begin to lose its edge.
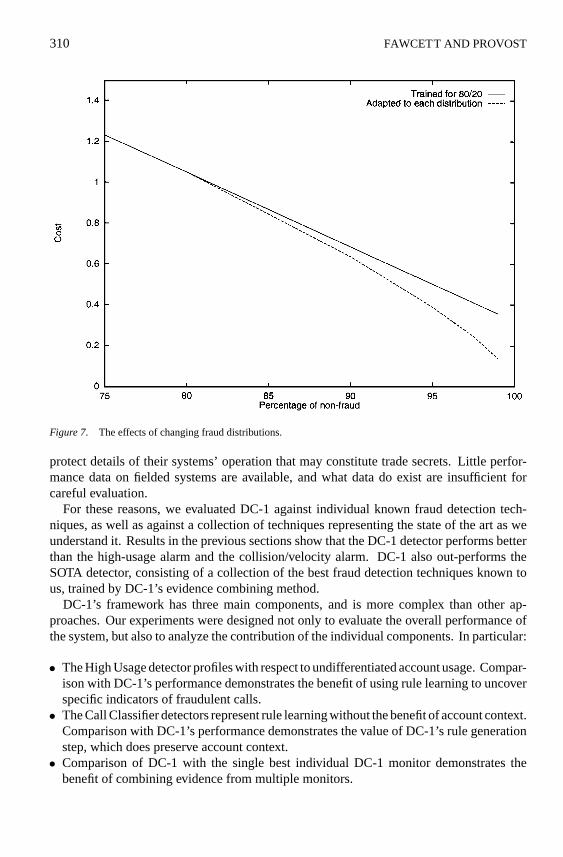
To illustrate this point, we simulated the effects of changing fraud distributions on detectorperformance. One DC-1 detector was trained on a fixed distribution of account-days (80%non-fraud, 20% fraud) and tested against several other distributions (ranging from 75% to99% non-fraud account-days), to simulate a well-tuned but non-adaptive detection system.Another DC-1 detector was allowed to adapt to each distribution; its LTU threshold wasre-trained for minimum predicted cost on a training set with the new distribution.
The results are shown in figure 7. TheX-axis is the percentage of non-fraud account-days, and theY-axis is the cost per account day. This figure shows that the second detector,which is allowed to adjust itself to each new distribution, is consistently more cost effectivethan the fixed detector. This difference increases as the testing distribution becomes moreskewed from the distribution upon which the fixed detector was trained.
We close by noting that these experiments illustrated changes in fraud detection perfor-mance with respect to fairly simple changes in fraud distribution (changing fraud volume).The patterns of fraud also change, particularly in reponse to detection methods. Thus theability to use data mining to discover new patterns amplifies the benefit of adaptability.
6.5. Discussion
It is difficult to evaluate DC-1 against existing expert systems for fraud detection. Frauddetection departments carefully protect information about how much fraud they have andhow effective their detection strategies are. Likewise, vendors of fraud detection systems
P1: KCU
Data Mining and Knowledge Discovery KL503-04-Fawcett September 29, 1997 9:38
310 FAWCETT AND PROVOST
Figure 7. The effects of changing fraud distributions.
protect details of their systems’ operation that may constitute trade secrets. Little perfor-mance data on fielded systems are available, and what data do exist are insufficient forcareful evaluation.
For these reasons, we evaluated DC-1 against individual known fraud detection tech-niques, as well as against a collection of techniques representing the state of the art as weunderstand it. Results in the previous sections show that the DC-1 detector performs betterthan the high-usage alarm and the collision/velocity alarm. DC-1 also out-performs theSOTA detector, consisting of a collection of the best fraud detection techniques known tous, trained by DC-1’s evidence combining method.
DC-1’s framework has three main components, and is more complex than other ap-proaches. Our experiments were designed not only to evaluate the overall performance ofthe system, but also to analyze the contribution of the individual components. In particular:
• The High Usage detector profiles with respect to undifferentiated account usage. Compar-ison with DC-1’s performance demonstrates the benefit of using rule learning to uncoverspecific indicators of fraudulent calls.• The Call Classifier detectors represent rule learning without the benefit of account context.
Comparison with DC-1’s performance demonstrates the value of DC-1’s rule generationstep, which does preserve account context.• Comparison of DC-1 with the single best individual DC-1 monitor demonstrates the
benefit of combining evidence from multiple monitors.
P1: KCU
Data Mining and Knowledge Discovery KL503-04-Fawcett September 29, 1997 9:38
ADAPTIVE FRAUD DETECTION 311
• Experiments with shifting fraud distributions indicate the benefit of making evidencecombination sensitive to fraud distributions.
In each of these cases, the composite DC-1 system out-performed the detector in whicha significant piece was missing. These results suggest that each component contributescritically to the performance of the entire detector.
Our system uses a Linear Threshold Unit to combine evidence from the monitors. Othermethods of evidence combination are possible. We performed some experiments withmulti-layer neural networks, but found that adding units to a hidden layer did not improveperformance. These networks produced higher training accuracies, but lower accuracies onthe test sets; such behavior is symptomatic of data overfitting. Additional experimentationmight yield better-performing networks, but we have not pursued this. It is possible that,because the neural network is applied far along in the fraud detection process as a meansof combining evidence, non-linear combinations of the evidence contribute little to frauddetection performance.
By increasing the expressiveness of the language used for inductive learning, it may bepossible to learn more general patterns of fraudulent behavior, reducing the need for highlydisjunctive class descriptions. The caveats mentioned earlier about the inability to procurebackground knowledge for context notwithstanding, it may be possible to provide addi-tional context by linking call and account data to geographic and demographic databases.Furthermore, it may be possible to learn context in one stage, and then apply relationallearning approaches in a later stage.
One such possibility is to make use of inductive learners that learn concept descriptionsin first-order logic, such as FOIL (Quinlan, 1990) or ILP methods (Dˇzeroski, 1996). Giventhe appropriate context information, it is possible that more expressive methods could learngeneral relational rules such as the following, which indicates fraud when a user calls froman abnormal location.
CALL_ORIGIN(X,ORIG) &NORMAL_CALL_LOCS(USER,LOCS) &
ORIG /∈ LOCS ==> FRAUD
Another possibility is to use a learner that forms propositional rules, but can take ad-vantage of relational background knowledge in the process (Aronis et al., 1996). We havenot explored the use of relational learning to any great extent. We have linked the datato knowledge about the geographic locations of telephone numbers ((Aronis and Provost,1997), which does produce useful generalizations of the areas to which calls are placed.
Finally, it is important to point out additional limitations to the evaluation of learnedclassifiers on real-world problems. For the work described in this paper, we made use oftechniques to deal with skewed class distributions, viz., stratified sampling, and to deal withnonuniform misclassification costs, viz., empirical threshold adjustment. We also ensuredthat our evaluation include cost effectiveness in addition to accuracy. However, becauseof the complexity and dynamics of real-world domains, determiningpreciselythe targetcost and class distributions is often impossible. As noted above, levels of fraud and costschange monthly. It is important to be able to compare competing classification methods
P1: KCU
Data Mining and Knowledge Discovery KL503-04-Fawcett September 29, 1997 9:38
312 FAWCETT AND PROVOST
under imprecision in these distributions. The investigation and design of such techniquesis an important area for future research (Provost and Fawcett, 1997).
7. Related work
Fraud detection is related tointrusion detection, a field of computer security concerned withdetecting attacks on computers and computer networks (Frank, 1994; Sundaram, 1996;Kumar, 1995). Many forms of intrusion are instances of superimposition fraud, and thuscandidates for systems built with our framework. Within the intrusion detection community,anomaly detectionsystems try to characterize behavior of individual users in order to detectintrusions on that user’s account via anomalies in behavior. Existing anomaly detectionsystems typically examine audit trails of user activities, which fill the same roll as cellularcall records in DC-1. DC-1 would be considered a statistical anomaly detection system.Sundaram (1996) writes:
An open issue with statistical approaches in particular, and anomaly detection systemsin general, is the selection of measures to monitor and the choice of metrics. It is notknown exactly what the subset of all possible measures that accurately predicts intrusiveactivities is.
DC-1’s framework directly addresses this problem. Its rule learning step examines largenumbers of fraud episodes in order to generate features (measures) that distinguish fraudu-lent from legitimate behavior. To the best of our knowledge, no published anomaly detectionsystem does this.
Calling card fraud and credit card fraud are other forms of superimposition fraud. Asystem built by Yuhas (1993, 1995) examines a set of records representing calling-cardvalidation queries to identify queries corresponding to fraudulent card usage. Yuhas trans-formed the problem into a two-class discrimination task and trained several machine learningmodels on the data. All three models had comparable performance on the test sets. Hissystem must be provided with appropriate features; it neither mines the data for fraud indi-cators nor measures typical customer usage. Stolfo et al. (1997) address credit card frauddetection. They also transform the problem into a two-class discrimination task, and do notuse customer-specific information in detection. Specifically, they predict whether individ-ual transactions are fraudulent. In our domain, we found that DC-1 significantly improvesdetection performance over systems that use transaction classification alone. It would beinteresting to determine whether a system like DC-1 could improve performance on theseother superimposition fraud tasks.
Ezawa and Norton (1995, 1996) have addressed the problem of uncollectible debt intelecommunications services. They use a goal-directed Bayesian network for classification,which distinguishes customers who are likely to default from those who are not. As with ourwork, Ezawa and Norton’s work faces problems with unequal error costs and skewed classdistributions. However, it does not face the problem of determining the typical behaviorof individual customers so as to recognize superimposed fraudulent behavior. Mining thedata to derive profiling features is not necessary.
P1: KCU
Data Mining and Knowledge Discovery KL503-04-Fawcett September 29, 1997 9:38
ADAPTIVE FRAUD DETECTION 313
Because fraud happens over time, methods that deal with time series are relevant to thiswork. However, traditional time series analysis (Chatfield, 1984; Farnum and Stanton,1989) in statistics strives either to characterize an entire time series or to forecast futureevents in the series. Neither ability is directly useful to fraud detection.
Hidden Markov Models (Rabiner and Juang, 1986; Smyth, 1994) are concerned withdistinguishing recurring sequences of states and the transitions between them. However,fraud detection usually only deals with two states (the “frauded” and “un-frauded” states)with a single transition between them. Yuhas (1995) mentions the possibility of recognizing“at home” and “travel” states in order to distinguish frauded states more effectively. Thisdifferentiation could be useful for reducing false alarms. We are aware of no work pursuingthis idea.
8. Conclusion
The detection of cellular cloning fraud is a relatively young field. Fraud behavior changesfrequently as bandits adapt to detection techniques, and fraud detection systems should beadaptive as well. However, in order to build usage monitors we must know which aspects ofcustomers’ behavior to profile. Historically, determining such aspects has involved a gooddeal of manual work, hypothesizing useful features, building monitors and testing them.Determining how to combine them involves much trial-and-error as well.
We have presented and demonstrated a framework that automates the process of generat-ing fraud detectors. This framework is not specific to cloning fraud, but may be applied tosuperimposition fraud problems in any domain. Prime candidates are toll fraud, computerintrusion and credit-card fraud. For example, in credit-card fraud, data mining may identifylocations that arise as new hot-beds of fraud. The constructor would then incorporate mon-itors that notice if customers begin to charge more than they usually do from these specificlocations.
Even with relatively simple components, DC-1 is able to exploit mined data to producea detector whose performance exceeds that of the state-of-the-art. The SOTA system tookseveral person-months to build; the DC-1 detector took several CPU-hours. Furthermore,DC-1 can be retrained at any time as necessitated by the changing environment.
Such adaptability is beneficial in many ways. It can save effort in time-consuming manualfeature identification and detector tuning. It can save on monetary losses that would occurduring the manual identification and tuning process. It can save on less quantifiable damagedone due to higher fraud, such as lower customer opinion (or even customer churn). Finally,it can act topreventfraud; a system that quickly adapts to new patterns will be avoided bybandits in favor of easier prey.
Appendix
State of the art (SOTA) detector
The SOTA (“State Of The Art”) detector incorporates thirteen profiling methods. Eachmethod profiles an account in a different way and produces a separate alarm. Some of
P1: KCU
Data Mining and Knowledge Discovery KL503-04-Fawcett September 29, 1997 9:38
314 FAWCETT AND PROVOST
the monitors were designed by hand, but those that employ weights used DC-1’s weighttuning methods. Specifically, SOTA contains the following monitors:
• Two collision detectors, which scan for call collisions of greater than 30 seconds and 60seconds, respectively.• Two velocity detectors, using velocity thresholds of 400 and 600 miles per hour, respec-
tively.• Three “dialed digits” monitors. We created a dialed digit database as follows. We
scanned through accounts reserved for rule learning and recorded how many distinctaccounts called a given number both legitimately and in a fraud period. A phone numberwas discarded if any legitimate subscriber called it; otherwise, a count was saved of thenumber of times it was called from a cloned phone.Because we did not know an ideal threshold on the number of “hits” required, we createdthree monitors each with a different threshold.• Two daily standard deviation usage monitors. One counted the number of calls on that
account-day, one measured total airtime on that account-day.• Four “bad cellsite” indicators. It is commonly believed that certain cellsites are the locus
for higher than average amounts of fraud, so calls originating from those cellsites mightbe suspicious. To test this strategy, we tallied the frauded accounts calling each of thecellsites in our region, then computed the percentage of frauded accounts using eachcellsite. The twenty worst cellsites were extracted from this list. Using this cellsite list,we created four detectors that counted hits to these “bad cellsites” each in a different way.
Acknowledgments
This work was sponsored by NYNEX Science and Technology. The views and conclusionsin this paper are those of the authors and do not represent official NYNEX policy.
We thank Nicholas Arcuri and the Fraud Control Department at Bell Atlantic NYNEXMobile for many useful discussions about cellular fraud and its detection. We also thankUsama Fayyad, Andrea Danyluk and our anonymous referees for comments on drafts.
In developing DC-1 we made extensive use of many freely-available software packages.We wish to thank the generous authors, developers and maintainers of the following soft-ware: The Perl programming language and many of its user-contributed modules, DonaldTveter’s Backprop program, numerous GNU packages including Emacs and GCC, the GMTgeographic information system, Gnuplot and the LATEX text processing system.
Notes
1. In fact, because many cellular phones belong to large corporate accounts, often even basic user informationsuch as home town and work location is unavailable.
2. Technically, the numeric value only describes how much above normal the account is. Behavior levels belownormal are not considered.
3. If account-days from a single account appear in both training and testing sets, the performance evaluation canbe deceptively optimistic. Fraudulent behavior within a specific cloning episode is more similar than fraudulent
P1: KCU
Data Mining and Knowledge Discovery KL503-04-Fawcett September 29, 1997 9:38
ADAPTIVE FRAUD DETECTION 315
behavior between episodes. When deployed, the monitors will be used to search for previously unseen cloningepisodes.
4. Earlier work (Fawcett and Provost, 1996) reported a higher accuracy for SOTA than is shown here. Furtherdevelopment of SOTA revealed that some of its component methods, developed in a prior study, had been builtfrom account data that overlapped data used to test the methods. When a strict separation was enforced, SOTAperformance declined slightly to the figures shown here.
5. To learn CC 1861 (1054) RL tried to cover the example set with rules each of which covered at least 50 (100)examples and had a Laplace estimate greater than or equal to 0.95, using a beam width of 5000.
References
Aronis, J. and Provost, F. 1997. Increasing the efficiency of data mining algorithms with breadth-first markerpropagation. In Proceedings of the Third International Conference on Knowledge Discovery and Data Mining(KDD-97), AAAI Press, pp. 119–122.
Aronis, J., Provost, F., and Buchanan, B. 1996. Exploiting background knowledge in automated discovery. InProceedings of the Second International Conference on Knowledge Discovery and Data Mining (KDD-96),AAAI Press, pp. 355–358.
Buchanan, B.G. and Mitchell, T.M. 1978. Model-directed learning of production rules. In Pattern-Directed Infer-ence Systems, F. Hayes-Roth (Ed.), New York: Academic Press, pp. 297–312.
Chatfield, C. 1984. The Analysis of Time Series: An Introduction (third edition). New York: Chapman and Hall.Clearwater, S. and Provost, F. 1990. RL4: A tool for knowledge-based induction. In Proceedings of the Second
International IEEE Conference on Tools for Artificial Intelligence, IEEE CS Press, pp. 24–30.Davis, A. and Goyal, S. 1993. Management of cellular fraud: Knowledge-based detection, classification and pre-
vention. In Thirteenth International Conference on Artificial Intelligence, Expert Systems and Natural Language,Avignon, France, vol. 2, pp. 155–164.
DeMaria, R. and Gidari, A. 1996. Uncovering unsavory customers. Cellular Business, 24–30.Dzeroski, S. 1996. Inductive logic programming and knowledge discovery in databases. Advances in Knowledge
Discovery and Data Mining, Menlo Park, CA: AAAI Press, 117–152.Ezawa, K. and Norton, S. 1995. Knowledge discovery in telecommunication services data using bayesian network
models. In Proceedings of First International Conference on Knowledge Discovery and Data Mining, U. Fayyadand R. Uthurusamy (Eds.), Menlo Park, CA: AAAI Press, pp. 100–105.
Ezawa, K. and Norton, S. 1996. Constructing Bayesian networks to predict uncollectible telecommunicationsaccounts. IEEE Expert, 45–51.
Farnum, N. and Stanton, L. 1989. Quantitative Forecasting Methods. Boston, MA: PWS-Kent Publishing Company.Fawcett, T. and Provost, F. 1996. Combining data mining and machine learning for effective user profiling. In
Proceedings of the Second International Conference on Knowledge Discovery and Data Mining (KDD-96),E. Simoudis, J. Han, and U. Fayyad (Eds.), Menlo Park, CA: AAAI Press, pp. 8–13.
Frank, J. 1994. Machine learning and intrustion detection: Current and future directions. In National Com-puter Security Conference, vol. 1, pp. 22–33. Available viahttp://seclab.cs.ucdavis.edu/papers/
ncsc.94.ps .Herzog, J. 1995. Beware of hurricane clone. Newaves. Available fromhttp://www.pcia.com/1195l.htm .Kittler, J. 1986. Feature selection and extraction. In Handbook of Pattern Recognition and Image Processing, K.S.
Fu (Ed.), New York: Academic Press, pp. 59–83.Kumar, S. 1995. A Pattern Matching Approach to Misuse Intrusion Detection. Ph.D. thesis, Purdue University,
Department of Computer Sciences. Available viaftp://coast.cs.purdue.edu/pub/COAST/kumar-
phd-intdet.ps.gz .Nilsson, N.J. 1965. Learning Machines. New York: McGraw-Hill.Provost, F. and Aronis, J. 1996. Scaling up inductive learning with massive parallelism. Machine Learning,
23:33–46.Provost, F. and Fawcett, T. 1997. Analysis and visualization of classifier performance: Comparison under impre-
cise class and cost distributions. In Proceedings of the Third International Conference on Knowledge Discoveryand Data Mining (KDD-97), AAAI Press, pp. 43–48.
P1: KCU
Data Mining and Knowledge Discovery KL503-04-Fawcett September 29, 1997 9:38
316 FAWCETT AND PROVOST
Quinlan, J. 1990. Learning logical definitions from relations. Machine Learning, 5:239–266.Quinlan, J.R. 1987. Generating production rules from decision trees. In Proceedings of the Tenth International
Joint Conference on Artificial Intelligence, Morgan Kaufmann, pp. 304–307.Rabiner, L.R. and Juang, B.H. 1986. An introduction to hidden Markov models. IEEE ASSP Magazine, 3(1):4–16.Redden, M. 1996. A technical search for solutions. Cellular Business, 84–87.Segal, R. and Etzioni, O. 1994. Learning decision lists using homogeneous rules. In Proceedings of the Twelfth
National Conference on Artificial Intelligence, Menlo Park, CA: AAAI Press, pp. 619–625.Smyth, P. 1994. Hidden Markov models for fault detection in dynamic systems. Pattern Recognition, 27(1):149–
164.Steward, S. 1997. Lighting the way in ’97. Cellular Business, 23.Stolfo, S., Prodromidis, A., Tselepsis, S., Lee, W., Fan, D., and Chan, P. 1997. JAM: Java agents for meta-learning
over distributed databases. In Proceedings of the Third International Conference on Knowledge Discovery andData Mining (KDD-97), AAAI Press, pp. 74–81.
Sundaram, A. 1996. An introduction to intrusion detection. ACM Crossroads—Special Issue on Computer Secu-rity, 2(4). Available fromhttp://www.acm.org/crossroads/xrds2-4/intrus.html .
Walters, D. and Wilkinson, W. 1994. Wireless fraud, now and in the future: A view of the problem and somesolutions. Mobile Phone News, 4–7.
Webb, G. 1995. OPUS: An efficient admissible algorithm for unordered search. Journal of Artificial IntelligenceResearch, 3:383–417.
Young, P. 1984. Recursive Estimation and Time-Series Analysis. New York: Springer-Verlag.Yuhas, B.P. 1993. Toll-fraud detection. In Proceedings of the International Workshop on Applications of Neural
Networks to Telecommunications, J. Alspector, R. Goodman, and T. Brown (Eds.), Hillsdale, NJ: LawrenceErlbaum Associates, pp. 239–244.
Yuhas, B.P. 1995. Learning the structure of telecommunications fraud. Technical report, Bellcore.
Tom Fawcett has been a researcher in machine learning and data mining at NYNEX Science and Technologysince 1993. He received his B.S. in Computer Science from Worcester Polytech Institute, his Masters from RutgersUniversity and his Ph.D. from the University of Massachusetts at Amherst. His interests include the effect ofrepresentation on induction, time series problems and applications of machine learning to real-world problems.
Foster Provosthas been a researcher in machine learning and data mining at NYNEX Science and Technologysince 1994. Previously he worked on automated knowledge discovery for scientific domains at the Universityof Pittsburgh. He received his B.S. in Physics and Mathematics from Duquesne University in 1986, and hisPh.D. in Computer Science from the University of Pittsburgh in 1992. Recently, his research has concentratedon weakening the simplifying assumptions that prevent inductive algorithms from being applied successfully toreal-world problems.
Copyright © 2022 FDOKUMEN